
Q12024 LOMBARD
ESTATEGUIDE
LOCALREAL
LOMBARD OVERALL
“Seller’s Market” Continues into the Spring with Very Low Home Inventory
Strong Sale Prices


Higher relative prices that are near or setting recordsafter continued increases
2 Short Market Times List to Contract Days (Q1) Homes going under contract quicklyin around 10 days or lessfor many cases Limited Price Discounts Sale Price Discounts (Q1)
often sold
to
asking price; Central area was above list price
Homes
at or close
full
Sale Price / Price Per Sq. Ft. (Q1) Home Inventory (March) 22% “Seller’s market” with 15+ year low of available homesthis time of year
Homes Higher Condo and Townhouse Activity New Home Listings (Q1) Contracted Homes (Q1) 9% 20% Closed Homes (Q1) 2%
Fewer Available
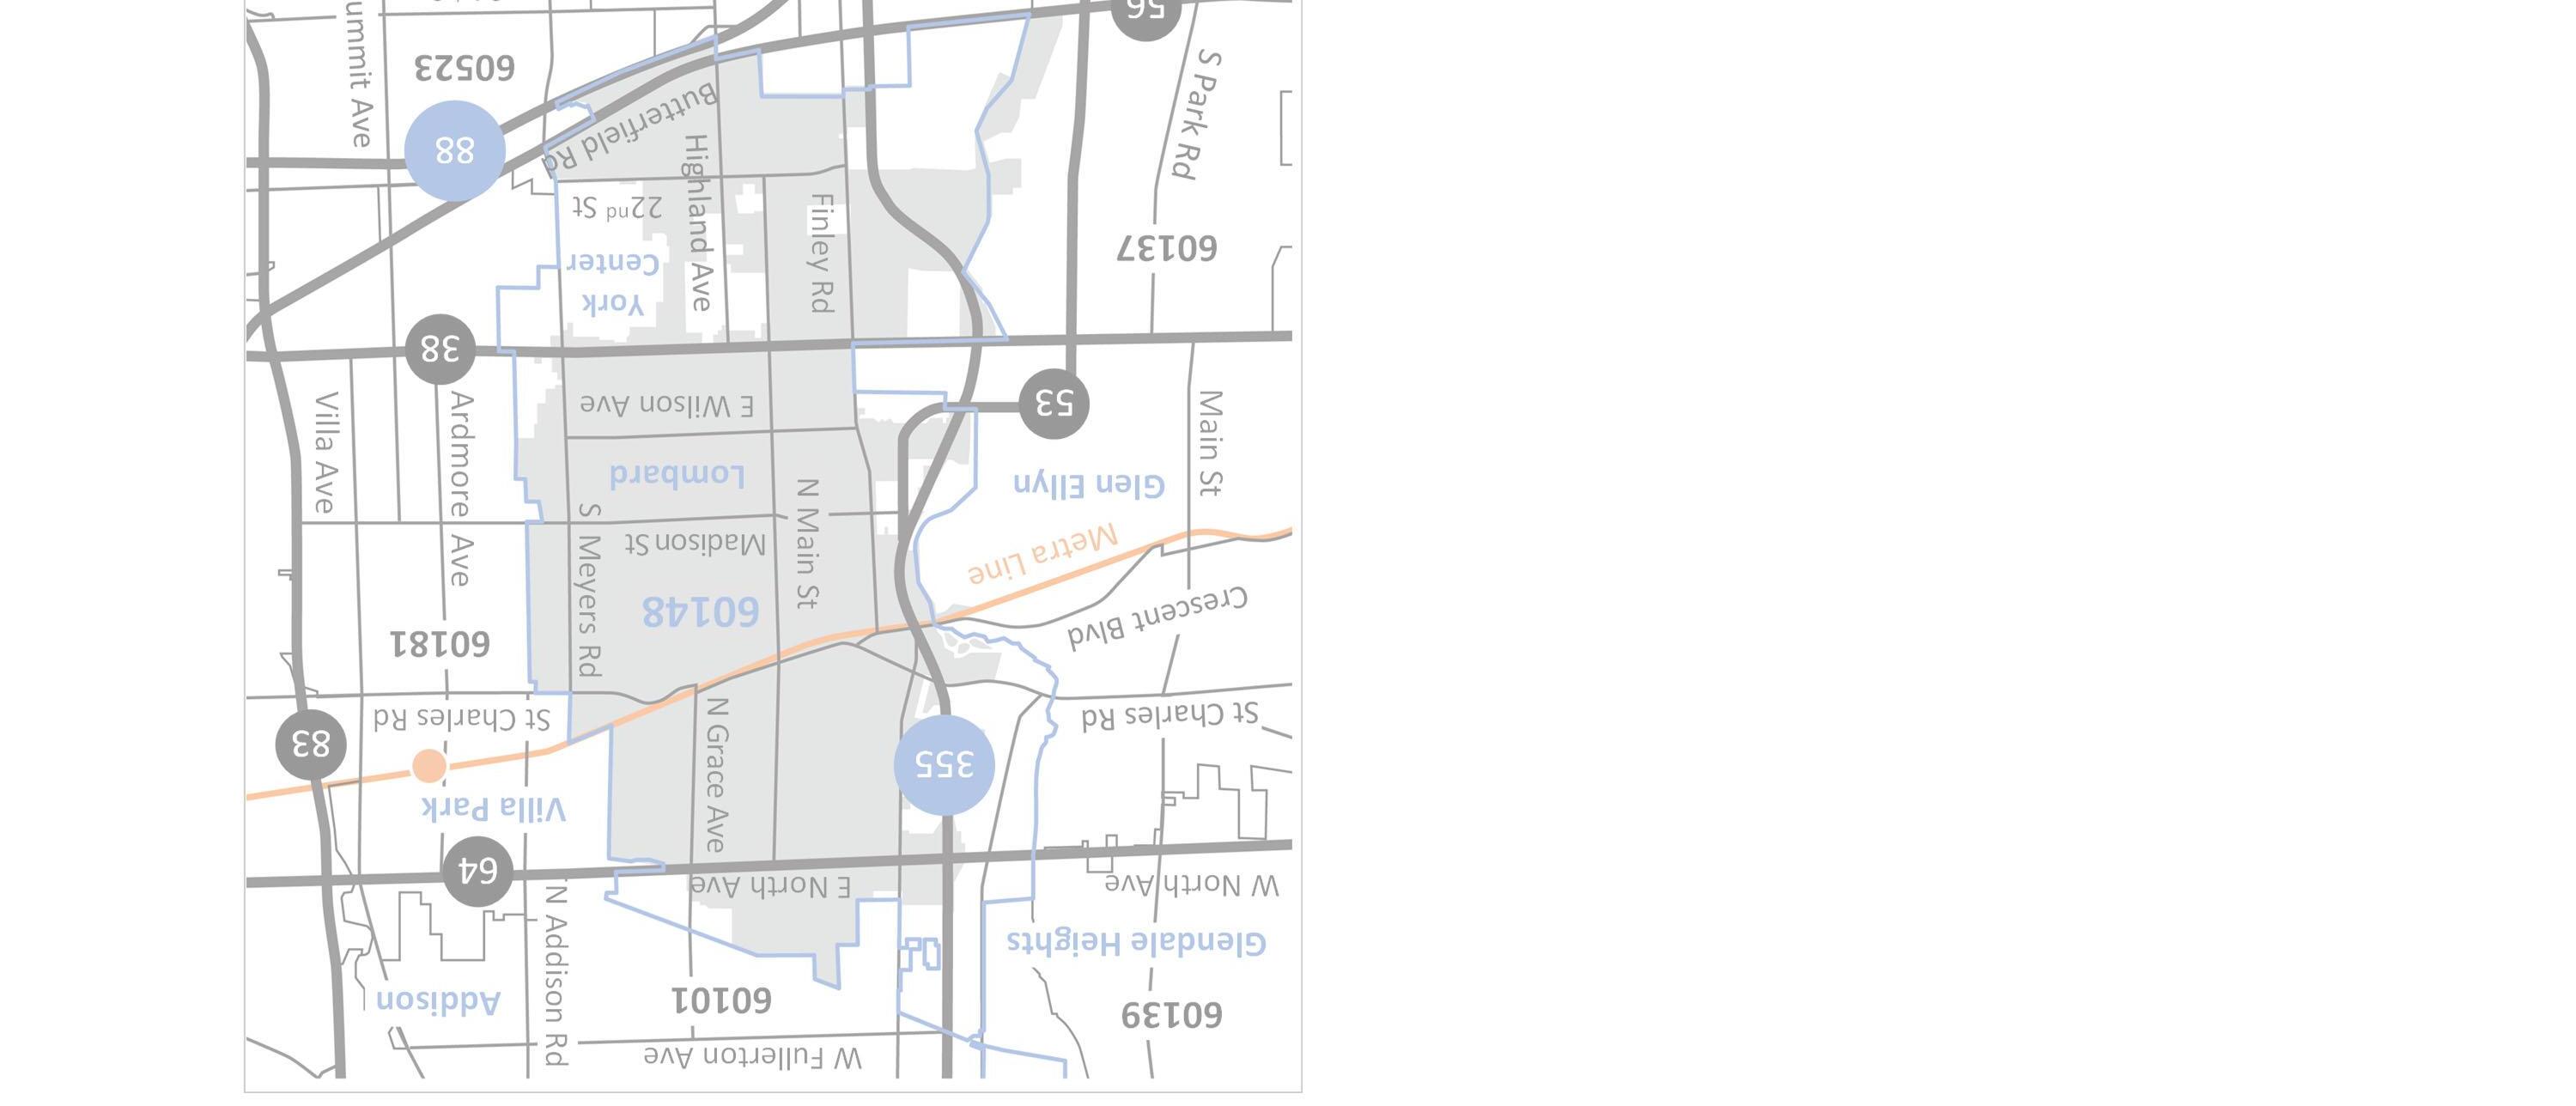
LOMBARD SUBMARKETS
Defining the Lombard Submarkets

1. North NorthAve.toSt.CharlesRd. 1andRte.53toGraceAve.
2.
St.CharlesRd.toRooseveltRd.2andHwy.355toMainSt.
St.CharlesRd.toRooseveltRd. andMainSt.toGraceAve./ FairviewAve
Submarketfiguresbasedontheapproximateareasidentifiedonmapaboveanddonotincludeeveryhomewithinvillagelimits.
Note:3
West
Central
3 East
4
NorthAve.toRooseveltRd. andGraceAve./FairviewAve. toVillaPark
1 24 3 5
5. South SouthofRooseveltRd.to5ButterfieldRd.
NORTH LOMBARD


North Lombard saw an increase in listings and declining contracts with closings flat, which caused home inventory to increase. Relative prices moved up slightly as homes sold near asking price.
9
4 Submarket Overall –Q1 2024 29 New Listings 12% Prior Year $340K Sale Price 25% Prior Year Under Contract 24 14% Prior Year $217 Price / Sq. Ft. 2% Prior Year Closed Homes 0% Prior Year % List Price 0% Prior Year Available Homes 29% Prior Year Days to Contract 15% Prior Year 1
11 98%


Submarket Home Types –Q1 2024 5 2027 1527 9-$350K$163K$150K $243$234$178 .97%109%100% 13days2days5days SingleFamilyTownHousesCondos 1918 New Listings Under Contract Closed Homes Available Homes Sale Price Price / Sq. Ft. % List Price Days to Contract Home Type Single Family Townhouse Condo 5% 75% 35% 0% 80% 13% 9% 0% 5% 75% 14% 2% 27% 6% 74%
100% 100% 0% 40% 9% 9% 71%
Note:HometypesmaynotsumormatchNorthLombardoverallduetoprioryearactivityforagivenhometype(eventhoughtheremaybenoactivityin2024).
WEST LOMBARD


West Lombard saw contract and closing growth outpace new listings, which limited inventory to a few homes. Relative prices increased significantly as homes sold at full price in just over a week.
6 Submarket Overall –Q1 2024 2 3 17 New Listings 21% Prior Year $308K Sale Price 1% Prior Year Under Contract 13 30% Prior Year $246 Price / Sq. Ft. 27% Prior Year Closed Homes 25% Prior Year % List Price Prior Year Available Homes 57% Prior Year Days to Contract 55% Prior Year
9 100% 3%


Note:HometypesmaynotsumormatchWestLombardoverallduetoprioryearactivityforagivenhometype(eventhoughtheremaybenoactivityin2024).
Submarket Home Types –Q1 2024 7 14-3 10-3 3-$323K-$155K $269-$189 .100%-102% 9days-13days SingleFamilyTownHousesCondos 12-3 New Listings Under Contract Closed Homes Available Homes Sale Price Price / Sq. Ft. % List Price Days to Contract Home Type Single Family Townhouse Condo 20% 0% 55% 57% 3% 26% 3% 0% 50% 10% 27% 5% 52% N/M N/M
CENTRAL LOMBARD


Central Lombard experienced a meaningful increase in listings and contracts while closings fell, which caused more home inventory. Prices increased substantially as homes above list price.
Submarket Overall –Q1 2024 3 8 8 30 New Listings 30% Prior Year $364K Sale Price 17% Prior Year Under Contract 22 38% Prior Year $252 Price / Sq. Ft. 18% Prior Year Closed Homes 42% Prior Year % List Price Prior Year Available Homes 14% Prior Year Days to Contract 33% Prior Year
6 101% 1%


Note:HometypesmaynotsumormatchCentralLombardoverallduetoprioryearactivityforagivenhometype(eventhoughtheremaybenoactivityin2024).
Analyzing Home Types –Q1 2024 9 1218111126$364K-$252-.101%-6days-SingleFamilyTownHousesCondos 7-New Listings Under Contract Closed Homes Available Homes Sale Price Price / Sq. Ft. % List Price Days to Contract Home Type Single Family Townhouse Condo 36% 27% 33% 71% 16% 17% 46%
1% N/M N/M N/M
EAST LOMBARD


East Lombard experienced broad declines in activity that drove down home inventory. Prices increased substantially as homes sold for full asking price in around two weeks.
10 Submarket Overall –Q1 2024 4 4 19 New Listings 35% Prior Year $325K Sale Price 16% Prior Year Under Contract 18 31% Prior Year $247 Price / Sq. Ft. 17% Prior Year Closed Homes 19% Prior Year % List Price 3% Prior Year Available Homes 56% Prior Year Days to Contract 7% Prior Year
14 100%


Note:HometypesmaynotsumormatchEastLombardoverallduetoprioryearactivityforagivenhometype(eventhoughtheremaybenoactivityin2024).
Submarket Home Types –Q1 2024 11 1621 1332 31$344K$203K$310K $262$153$229 .101%90%103% 11days75days7days SingleFamilyTownHousesCondos 1633 New Listings Under Contract Closed Homes Available Homes Sale Price Price / Sq. Ft. % List Price Days to Contract Home Type Single Family Townhouse Condo 11% 27% 50% 38% 35% 57% 7% 18% 2% 36% 200% 0% 50% 19% N/M 6% 0% 50% 50% 44% 23% 6% 65%
SOUTH LOMBARD


South Lombard experienced a large increase in activity, but the offsetting impact held inventory flat. Relative prices moved much higher as homes sold for nearly full price in just over a week.
Submarket Overall –Q1 2024 5 12 10 61 New Listings 74% Prior Year $223K Sale Price 14% Prior Year Under Contract 49 36% Prior Year $185 Price / Sq. Ft. 19% Prior Year Closed Homes 37% Prior Year % List Price 99% 2% Prior Year Available Homes 0% Prior Year Days to Contract 47% Prior Year
8


Note:HometypesmaynotsumormatchSouthLombardoverallduetoprioryearactivityforagivenhometype(eventhoughtheremaybenoactivityin2024).
Submarket Home Types –Q1 2024 13 15739 10534 631 $375K$285K$179K $224$262$169 .99%98%99% 12days9days6days SingleFamilyTownHousesCondos 11525 New Listings Under Contract Closed Homes Available Homes Sale Price Price / Sq. Ft. % List Price Days to Contract Home Type Single Family Townhouse Condo 21% 37% 225% 50% 61% 14% 10% 41% 25% 67% 150% 200% 6% 59% 0% 133% 162% 50% 1% 15% 1% 14% 2% 79%

www.kellystetlerrealestate.com
Compass is a licensed real estate broker and abides by federa l, state and local equal housing opportunity laws. All materialpr esented herein is intended for informational purposes only, is compiled fr om sources deemed reliable but is subject to errors, omissions, and changes without notice. Sources include Midwest Real Estate Data LLC. This is not intended to solicit property already li sted. Closed Volume based on MLS market share, includi ng off-market sales, from 4/1/23-3/31/24. #1 Compass Team in DuPage based on MLS Market Sh are, including off-market sales, all property types, from 4/1/2 3-3/31/24.


