Q1 2023 LOMBARD
LOCAL REAL ESTATE GUIDE


OPENING NOTE
Lombard started 2023 much like last year, except with even fewer homes available and higher interest rates. Mostly undeterred, buyers are doing what they can to compete in conditions that continue to favor sellers. The result is a Lombard real estate market with less transaction activity, but generally higher prices.
We recently announced an exciting team update. To support our continued Lombard growth and local organization / event sponsorships, an incredible teammate Christina Corso joined us in March. Christina is a top area agent with nearly $25 million in closed transactions in the past few years and she has spent her entire life in the suburbs, including living in Naperville, Lombard and Elmhurst. Further, she is an amazing mom and an enthusiastic supporter of our community. This is going to be a lot of fun!
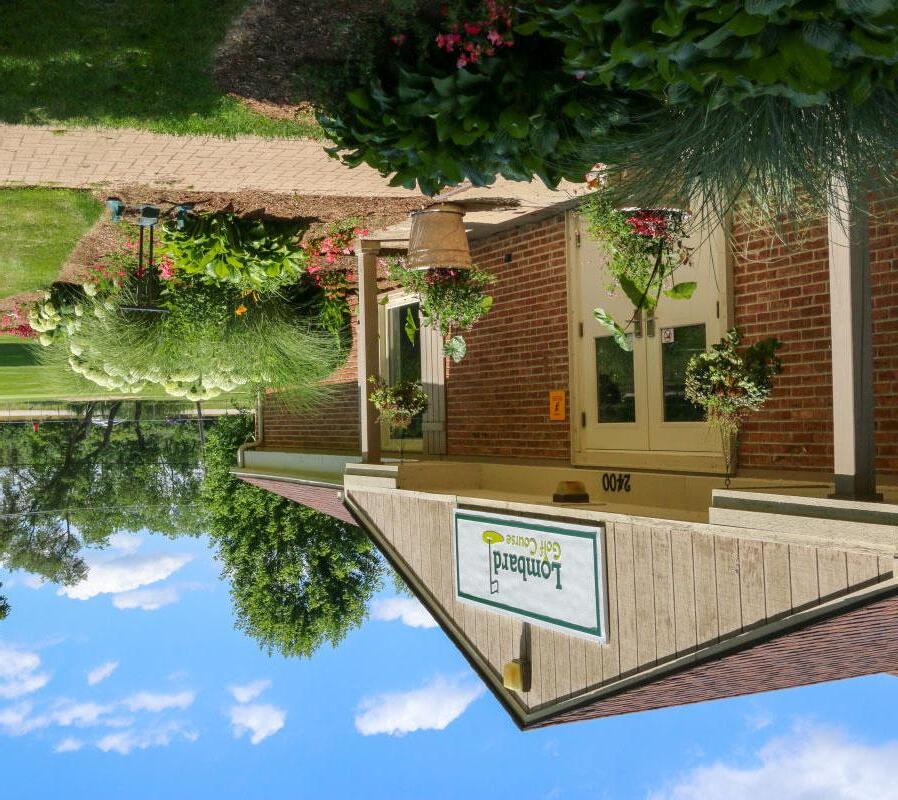
For the cover we chose the Lombard Golf Course. We are the premier facility sponsor this year with the Park District.
All my best,
630.750.9551
kelly.stetler@compass.com


www.kellystetlerrealestate.com

2
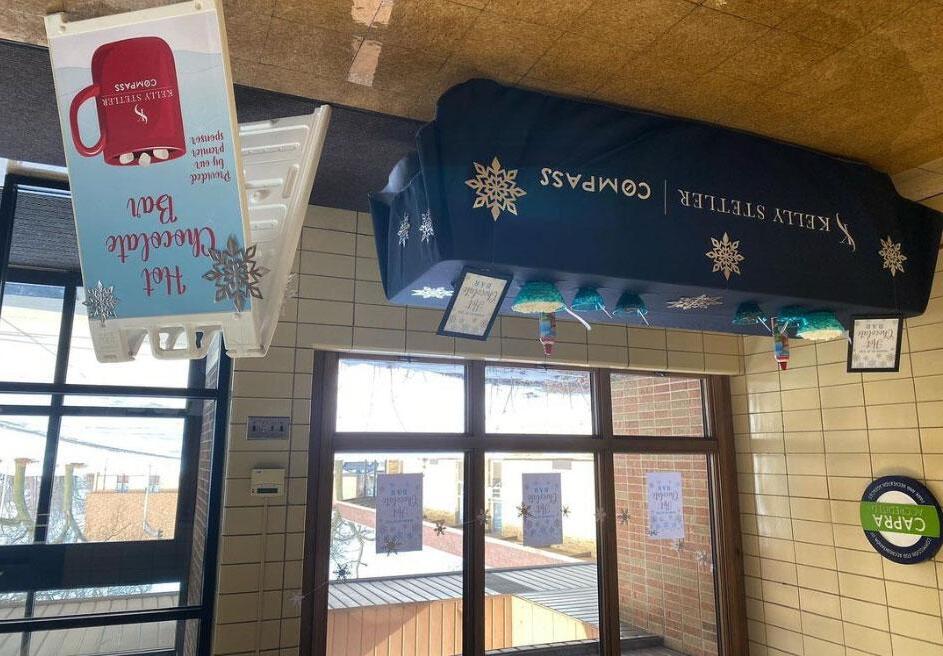
TOP LOMBARD SUPPORTER
Our Recent Lombard Sponsorships


3
LOMBARD OVERALL
“Seller’s Market” Remains this Spring with Parallels to Last Year


4 Increasing Market Times List to Contract Days (Q1) Homes taking a little longer to go under contract, but still 2 –3 weeks or less Narrow Price Discounts Sale Price Discounts (Q1) Limited discounts to asking price; homes mostly selling at 2% –3% discount or less Higher prices overall, but some areas and price ranges experiencing small declines Mixed Sale Prices Sale Price / Price Per Sq. Ft. (Q1) Home Inventory (March) 28% “Seller’s market” with 15+ year low of available homesthis time of year Fewer Available Homes Lower Activity New Home Listings (Q1) Contracted Homes (Q1) 29% 32% Closed Homes (Q1) 13%
LOMBARD SUBMARKETS
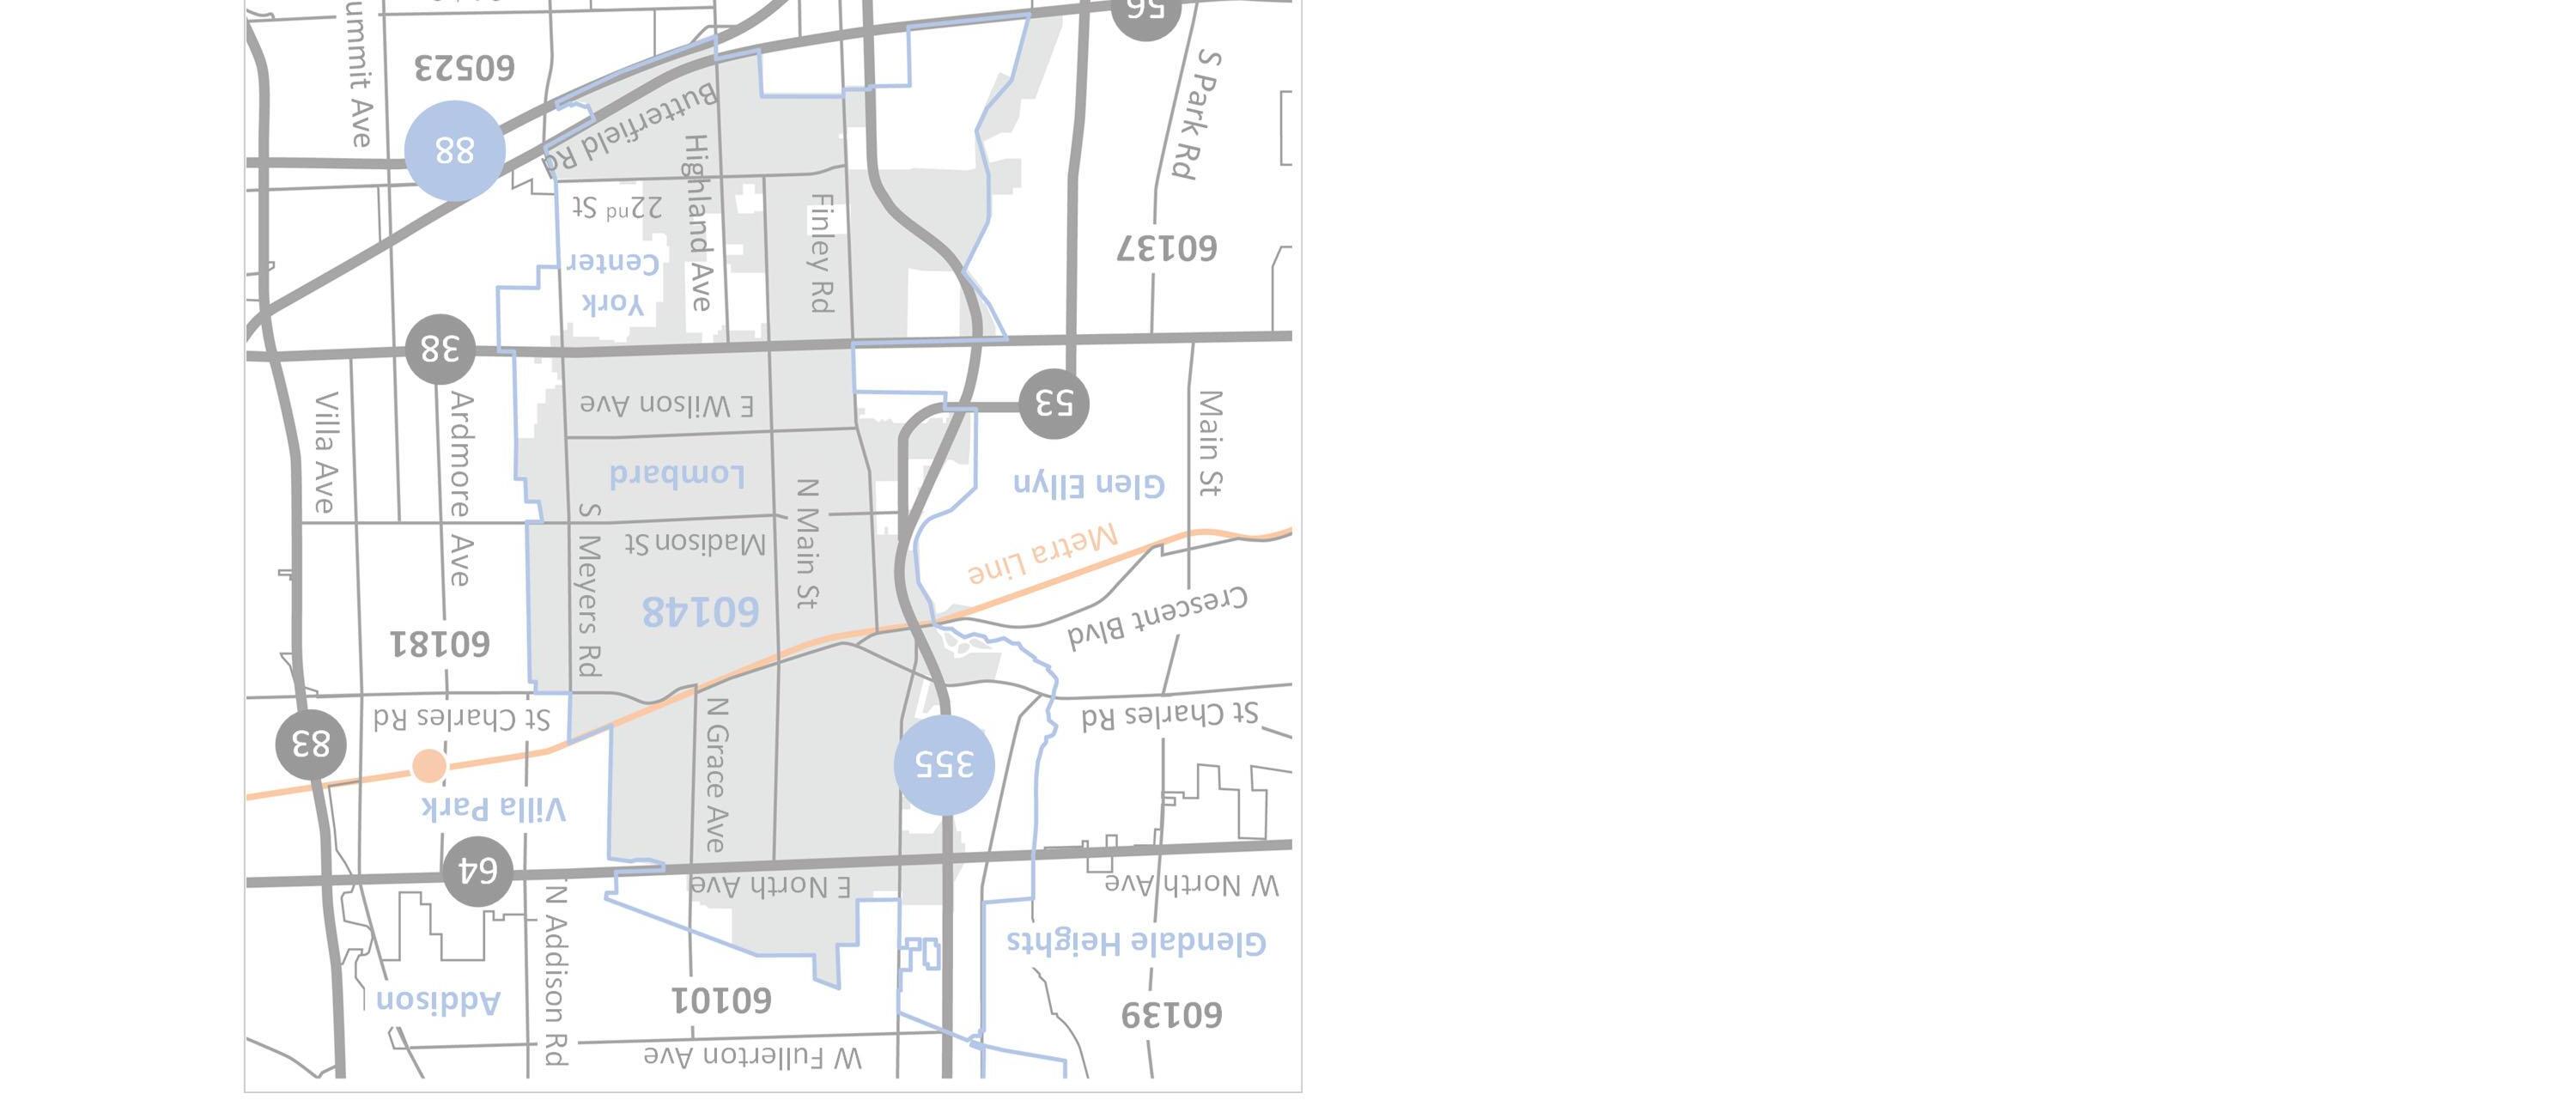
Defining the Lombard Submarkets
Note: Submarket figures based on the approximate areas identified on map above and do not include every home within village limits.
5
1
2 Central St.
Rd.
St.
Ave.
Ave 3 East North
4
1 2 4 3 5
1. North North Ave. to St. Charles Rd. and Rte. 53 to Grace Ave.
2. West St. Charles Rd. to Roosevelt Rd. and Hwy. 355 to Main St.
Charles
to Roosevelt Rd. and Main
to Grace
/ Fairview
Ave. to Roosevelt Rd. and Grace Ave. / Fairview Ave. to Villa Park
5. South South of Roosevelt Rd. to Butterfield Rd.
5
NORTH LOMBARD


North Lombard experienced lower activity generally with home inventory dropping to only a half dozen homes. Relative prices moved decisively higher compared to a softer Q1 last year.


6
6 Submarket Overall –Q1 2023 26 New Listings 40% Prior Year $273K Sale Price 3% Prior Year Under Contract 29 31% Prior Year $213 Price / Sq. Ft. 13% Prior Year Closed Homes 18% Prior Year % List Price 1% Prior Year Available Homes 54% Prior Year Days to Contract 13% Prior Year 1
13
98%


Submarket Home Types –Q1 2023 7 2114 2414 4-2 $310K$270K$148K $223$258$140 . 98%100%95% 13 days7 days19 days Single FamilyTown HousesCondos 2017 New Listings Under Contract Closed Homes Available Homes Sale Price Price / Sq. Ft. % List Price Days to Contract Home Type Single Family Town House Condo 5% 67% 17% 66% 64% 21% 6% 1% 28% 64% 42% 29% 21% 4% 217% 50% 50% 0% 35% 25% 0% 40% 0%
WEST LOMBARD
West Lombard saw a slow quarter with broad declines in activity and home inventory. While overall prices increased due to mix of homes sold, relative prices were flat / down slightly.
8 Submarket Overall –Q1 2023 2 6 14 New Listings 33% Prior Year $305K Sale Price 15% Prior Year Under Contract 11 50% Prior Year $194 Price / Sq. Ft. 2% Prior Year Closed Homes 37% Prior Year % List Price Prior Year Available Homes 25% Prior Year Days to Contract 5% Prior Year
20 97% 0%


Submarket Home Types –Q1 2023 9 14-11-6-$313K-$141K $213-$149 . 97%-97% 20 days-27 days Single FamilyTown HousesCondos 10-2 New Listings Under Contract Closed Homes Available Homes Sale Price Price / Sq. Ft. % List Price Days to Contract Home Type Single Family Town House Condo 9% 15% 25% 14% 11% 11% 0% 7% 75% 4% 8% 1% 13%
CENTRAL LOMBARD
Central Lombard was the only submarket to see an uptick in new listings, which allowed home inventory to be flat (albeit at very low levels). Prices declined some from a strong Q1 last year.
Submarket Overall –Q1 2023 3 10 5 23 New Listings 28% Prior Year $312K Sale Price 11% Prior Year Under Contract 18 29% Prior Year $213 Price / Sq. Ft. 5% Prior Year Closed Homes 8% Prior Year % List Price Prior Year Available Homes 0% Prior Year Days to Contract 50% Prior Year
9
0%
100%


Analyzing Home Types –Q1 2023 11 22-1 17-1 5-$315K$222K$215$191. 100%97%9 days30 daysSingle FamilyTown HousesCondos 111New Listings Under Contract Closed Homes Available Homes Sale Price Price / Sq. Ft. % List Price Days to Contract Home Type Single Family Town House Condo 15% N/A 21% 50% 0% 10% 4% 0% 22% N/A N/A N/A N/A N/A N/A
EAST LOMBARD
East Lombard experienced asmallinventory increase at theendofMarchwith both listings and contracts falling in Q1. Prices flattened as discounts widened with days to contract increasing.
12 Submarket Overall –Q1 2023 4 10 29 New Listings 51% Prior Year $280K Sale Price 0% Prior Year Under Contract 25 42% Prior Year $211 Price / Sq. Ft. 0% Prior Year Closed Homes 13% Prior Year % List Price 3% Prior Year Available Homes 11% Prior Year Days to Contract 150% Prior Year
15
97%
Submarket Home Types –Q1 2023 13 2522 1924 91$321K$250K$216K $223$210$187 . 99%96%97% 17 days15 days20 days Single FamilyTown HousesCondos 1836 New Listings Under Contract Closed Homes Available Homes Sale Price Price / Sq. Ft. % List Price Days to Contract Home Type Single Family Town House Condo 13% 24% 78% 37% 183% 29% 1% 0% 2% 41% 71% 25% 0% 9% 200% 5% 75% 33% 50% 11% 3% 3% 300%
SOUTH LOMBARD
South Lombard saw lower activity generally leading to less home inventory. While overall sale prices increased, relative pricing slipped driven by declines in single family homes.
Submarket Overall –Q1 2023 5 14 10 33 New Listings 48% Prior Year $258K Sale Price 17% Prior Year Under Contract 34 45% Prior Year $156 Price / Sq. Ft. 3% Prior Year Closed Homes 39% Prior Year % List Price 97% 2% Prior Year Available Homes 44% Prior Year Days to Contract 50% Prior Year
15
Submarket Home Types –Q1 2023 15 19311 19312 712 $343K$305K$177K $159$192$147 . 97%98%98% 31 days22 days7 days Single FamilyTown HousesCondos 14214 New Listings Under Contract Closed Homes Available Homes Sale Price Price / Sq. Ft. % List Price Days to Contract Home Type Single Family Town House Condo 7% 8% 69% 19% 35% 17% 1% 22% 2% 0% 70% 71% 0% 15% 267% 2% 67% 67% 48% 82% 19% 7% 1% 30%


Compass is a licensed real estate broker and abides by federa l, state and local equal housing opportunity laws. All materialpr esented herein is intended for informational purposes only, is compiled from sources deemed reliable but is subject to errors, omissions, and changes with out notice. Sources include Midwest Real Estate Data LLC. This is not intended to solicit property already listed. www.kellystetlerrealestate.com Kelly Stetler 630.750.9551 kelly.stetler@compass.com Teresa Parry 810.569.0078 teresa.parry@compass.com Christina Corso 815.922.0459 christinacorso@compass.com
