Q22023 LOMBARD
LOCALREAL ESTATEGUIDE


LOMBARD OVERALL
“Seller’s Market” Continues in Late Spring / Early Summer


2 Short Market Times List to Contract Days (Q2) Homes going under contract very quicklyin one week or less Limited Price Discounts Sale Price Discounts (Q2) Homes consistently selling at or above full asking priceacross submarkets Higher prices overall, but Central Lombard declined some on the fewest area closings Record Prices Sale Price / Price Per Sq. Ft. (Q2) Home Inventory (June) 49%
market” with 15+ year low of available homesthis time of year
Available Homes Lower Activity New Home Listings (Q2) Contracted Homes (Q2) 15% 30% Closed Homes (Q2) 24%
“Seller’s
Fewer
LOMBARD SUBMARKETS
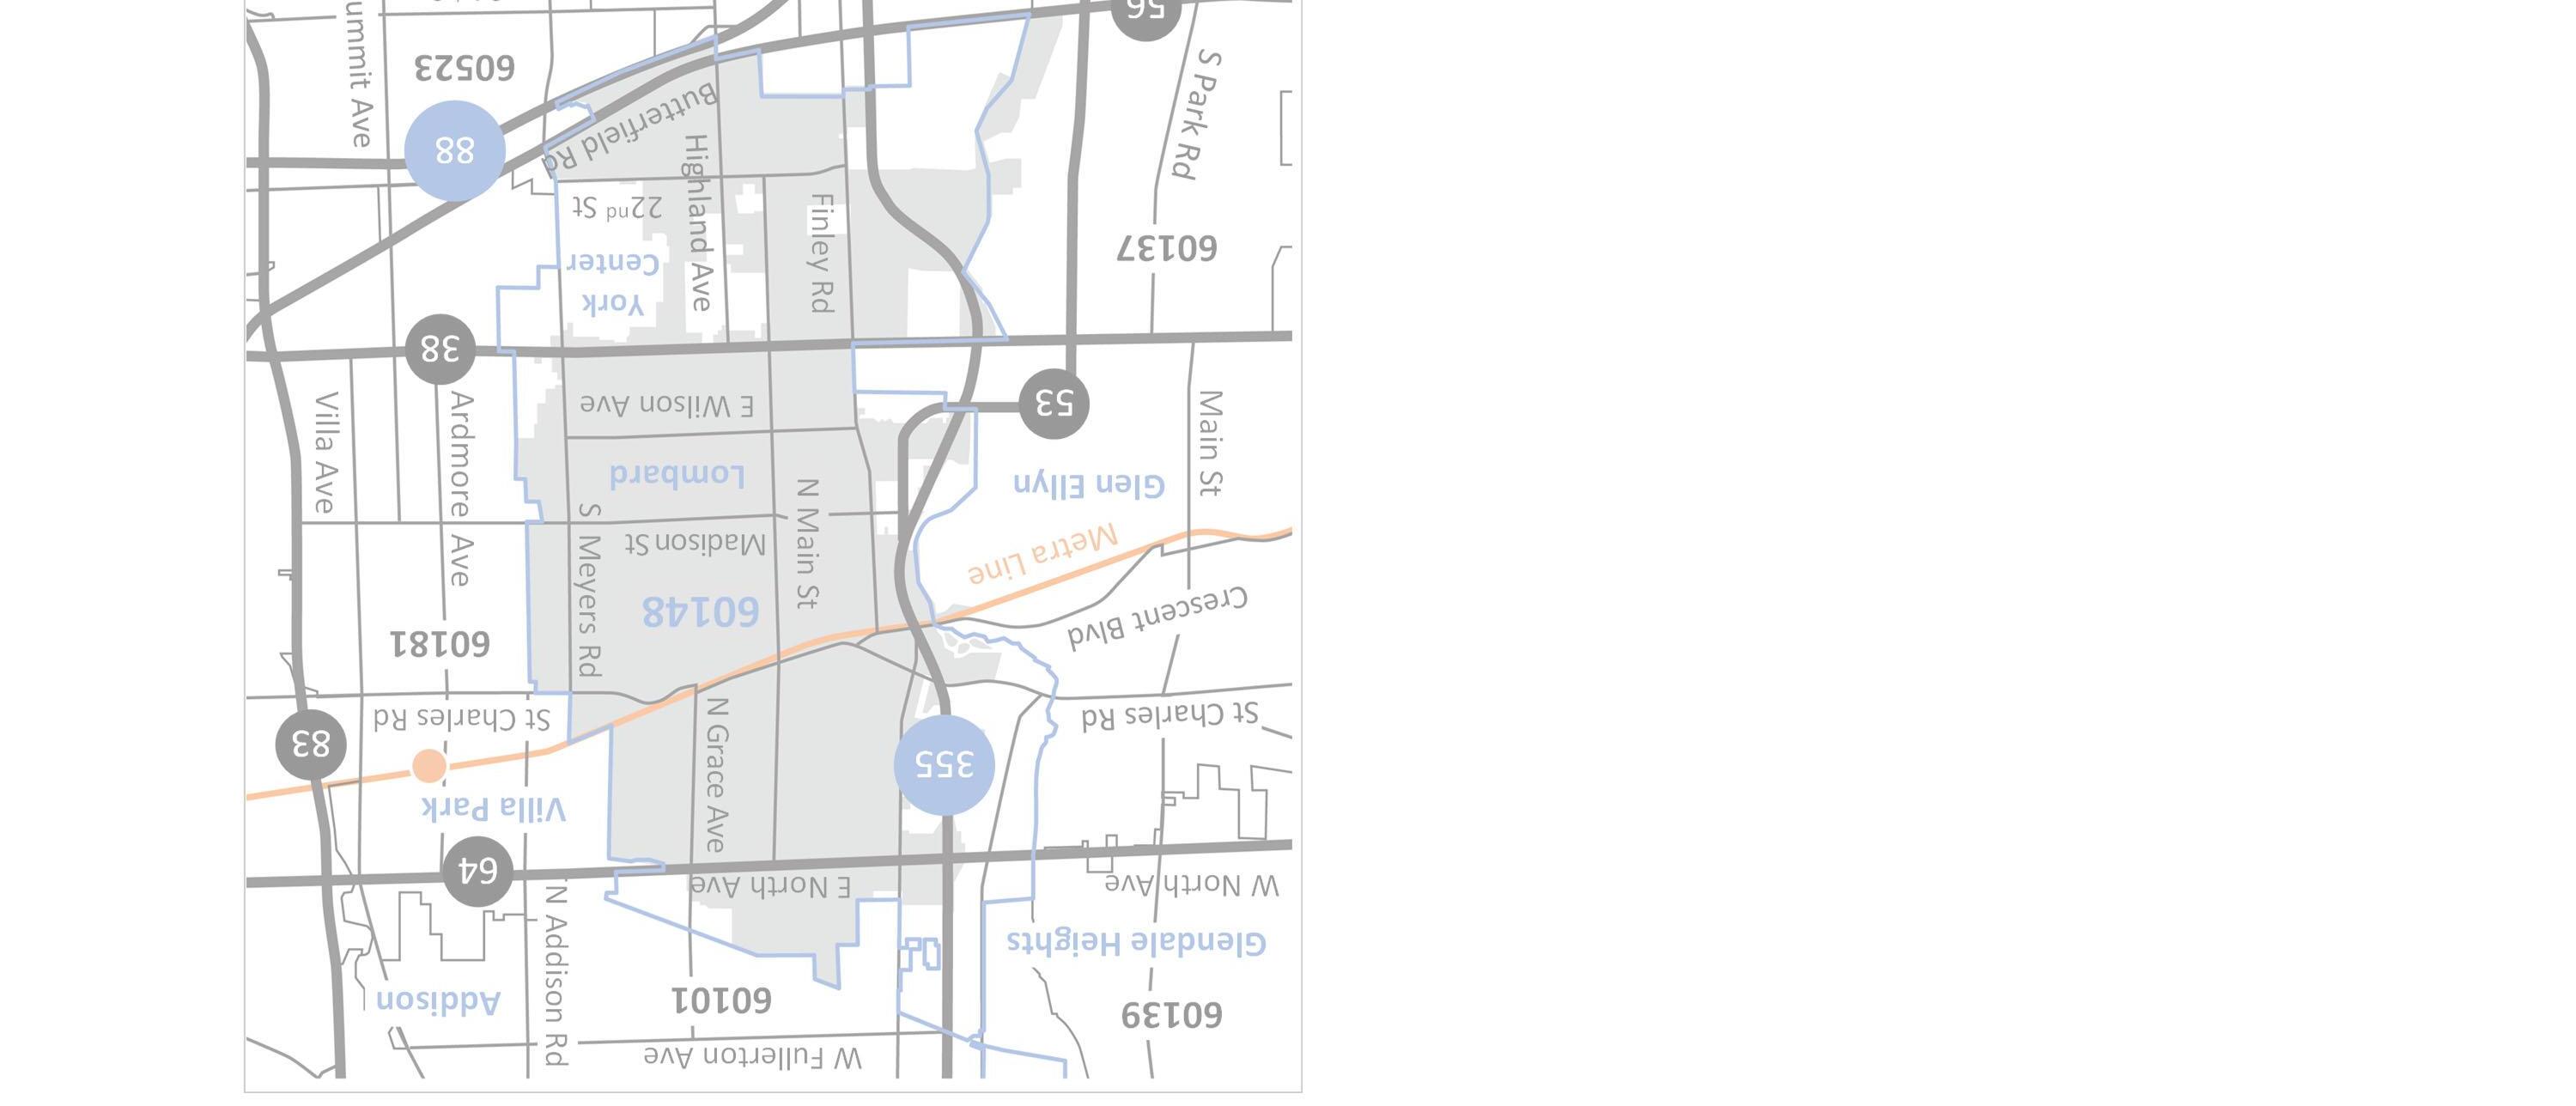
Defining the Lombard Submarkets
Note:3 Submarketfiguresbasedontheapproximateareasidentifiedonmapaboveanddonotincludeeveryhomewithinvillagelimits.
 1. North NorthAve.toSt.CharlesRd. 1andRte.53toGraceAve.
Central
3 East
4
2. West St.CharlesRd.toRooseveltRd.2andHwy.355toMainSt.
St.CharlesRd.toRooseveltRd. andMainSt.toGraceAve./ FairviewAve
NorthAve.toRooseveltRd. andGraceAve./FairviewAve. toVillaPark
1 24 3 5
5. South SouthofRooseveltRd.to5ButterfieldRd.
NORTH LOMBARD
103%


North Lombard experienced lower activity generally with home inventory continuing to decline. Overall and relative prices moved higher with homes selling over asking.


12
4 Submarket Overall –Q2 2023 44 New Listings 20% Prior Year $338K Sale Price 7% Prior Year Under Contract 38 7% Prior Year $221 Price / Sq. Ft. 2% Prior Year Closed Homes 27% Prior Year % List Price 1% Prior Year Available Homes 29% Prior Year Days to Contract 0% Prior Year 1
4


Submarket Home Types –Q2 2023 5 37-7 30-8 11-1 $370K-$155K $223-$154 .103%-100% 4days-8days SingleFamilyTownHousesCondos 30-3 New Listings Under Contract Closed Homes Available Homes Sale Price Price / Sq. Ft. % List Price Days to Contract Home Type Single Family Town House Condo 14% 22% 9% 33% 21% 10% 5% 1% 16% 33% 63% 30% 19% 1% 100% 67%
WEST LOMBARD


West Lombard saw a slow quarter with broad declines in activity and home inventory. While overall prices declined due to mix of homes sold, relative prices were up dramatically.


6 Submarket Overall –Q2 2023 2 6 29 New Listings 53% Prior Year $310K Sale Price 6% Prior Year Under Contract 22 41% Prior Year $252 Price / Sq. Ft. 16% Prior Year Closed Homes 32% Prior Year % List Price Prior Year Available Homes 70% Prior Year Days to Contract 20% Prior Year
6
103% 3%


Submarket Home Types –Q2 2023 7 2315 1714 5-1 $320K$205K$165K $269-$189 .103%103%100% 3days3days12days SingleFamilyTownHousesCondos 1713 New Listings Under Contract Closed Homes Available Homes Sale Price Price / Sq. Ft. % List Price Days to Contract Home Type Single Family Town House Condo 32% 45% 40% 72% 6% 13% 3% 57% 40% 19% 23% 1% 300% 0% 0% 0% 10% 6% 0% 29% 20% 50%
CENTRAL LOMBARD


Central Lombard saw an uptick in contracts following more listings in Q1. However, this submarket was the only area to show relative price declines (also experienced lower prices last quarter).


Submarket Overall –Q2 2023 3 8 6 20 New Listings 33% Prior Year $354K Sale Price 7% Prior Year Under Contract 18 29% Prior Year $214 Price / Sq. Ft. 5% Prior Year Closed Homes 7% Prior Year % List Price Prior Year Available Homes 54% Prior Year Days to Contract 0% Prior Year
4
102% 2%


Analyzing Home Types –Q2 2023 9 20-18-6-$365K-$130K $221-$153 .102%-93% 3days-30days SingleFamilyTownHousesCondos 13-1 New Listings Under Contract Closed Homes Available Homes Sale Price Price / Sq. Ft. % List Price Days to Contract Home Type Single Family Town House Condo 13% 29% 25% 54% 4% 2% 1% 33% N/A N/A N/A N/A N/A
EAST LOMBARD


East Lombard experienced more listings, but the significant increase in contracts pushed down home inventory. Overall and relative prices increased with homes selling for over asking price.


10 Submarket Overall –Q2 2023 4 7 54 New Listings 8% Prior Year $340K Sale Price 5% Prior Year Under Contract 52 41% Prior Year $243 Price / Sq. Ft. 11% Prior Year Closed Homes 4% Prior Year % List Price 1% Prior Year Available Homes 53% Prior Year Days to Contract 20% Prior Year
4
102%


Submarket Home Types –Q2 2023 11 4284 4174 52$355K$283K$193K $250$247$193 .102%101%99% 4days4days5days SingleFamilyTownHousesCondos 3763 New Listings Under Contract Closed Homes Available Homes Sale Price Price / Sq. Ft. % List Price Days to Contract Home Type Single Family Town House Condo 6% 20% 0% 58% 20% 55% 0% 8% 0% 14% 17% 25% 50% 7% 33% 3% 11% 20% 40% 22% 4% 1% 44%
SOUTH LOMBARD


South Lombard saw lower activity generally and less home inventory. Overall and relative prices increased with homes selling for over asking price.


Submarket Overall –Q2 2023 5 12 18 62 New Listings 37% Prior Year $318K Sale Price 44% Prior Year Under Contract 50 37% Prior Year $196 Price / Sq. Ft. 19% Prior Year Closed Homes 42% Prior Year % List Price 102% 2% Prior Year Available Homes 25% Prior Year Days to Contract 20% Prior Year
4


Submarket Home Types –Q2 2023 13 202022 191417 477 $421K$315K$188K $209$206$174 .101%104%103% 6days4days4days SingleFamilyTownHousesCondos 22816 New Listings Under Contract Closed Homes Available Homes Sale Price Price / Sq. Ft. % List Price Days to Contract Home Type Single Family Town House Condo 22% 1% 50% 14% 20% 77% 5% 2% 0% 46% 18% 53% 600% 7% 33% 1% 18% 58% 64% 17% 22% 22% 3% 50%


Compass is a licensed real estate broker and abides by federa l, state and local equal housing opportunity laws. All materialpr esented herein is intended for informational purposes only, is compiled from sources deemed reliable but is subject to errors, omissions, and changes with out notice. Sources include Midwest Real Estate Data LLC. This is not intended to solicit property already listed. www.kellystetlerrealestate.com KellyStetler 630.750.9551 kelly.stetler@compass.com TeresaParry 810.569.0078 teresa.parry@compass.com ChristinaCorso 815.922.0459 christinacorso@compass.com


 1. North NorthAve.toSt.CharlesRd. 1andRte.53toGraceAve.


