LOCAL REAL ESTATE GUIDE


Q3 2022 LOMBARD
OPENING NOTE


Scan Here

As the leaves change and weather cools the real estate market typically moderates some post-Labor Day. This seasonal shift is exaggerated this year by the overheated market during the second quarter. Currently, Lombard real estate is in an interesting spot with lower transaction activity, limited home inventory and interest rates that have increased quickly. Absent a life event creating a move, neither buyer nor seller seems too motivated to transact during the rest of 2022.
With that said, we will be reporting another great year (more to come!) and are very excited about the weeks ahead. Following Fall Fest, we are sponsoring Holiday Lights in Lilacia Park. Charming holiday displays illuminate the park from 6 –8pm each night December 4th –18th with magical light shows, tree decorations, a gingerbread house and so much more!
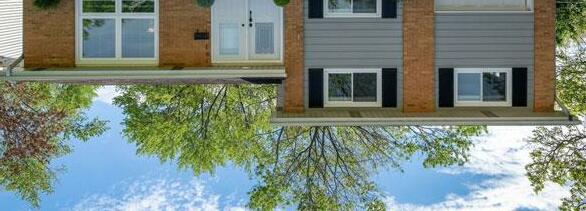
For the cover we chose the Victorian Cottage owned by the Lombard Historical Society. Happy 50 years open to the public! Please consider a donation to help preserve our heritage. All my best, 630.750.9551 kelly.stetler@compass.com www.kellystetlerrealestate.com

2
Learn
More
METHODOLOGY
Overview of Terms and Lombard Submarkets
CLOSED:closed transaction reflecting the final sales price (does not include any seller credits)
CONTRACTED:contingent or pending transaction reflecting the latest asking price
CONTRACT TIME:number of days between the first list date and the contracted date (does not include time from contract to close)
HOME INVENTORY:number of homes currently available for sale
MEDIAN:middle value of a given dataset (all report values are medians, which are less impacted by outliers than averages)
PRICE DISCOUNTS:percentage difference between the initial list and recorded sale price
PRICE PER SQ. FT:ratio of the price to the square footage of a closed transaction as a relative price measure (factors in home size)
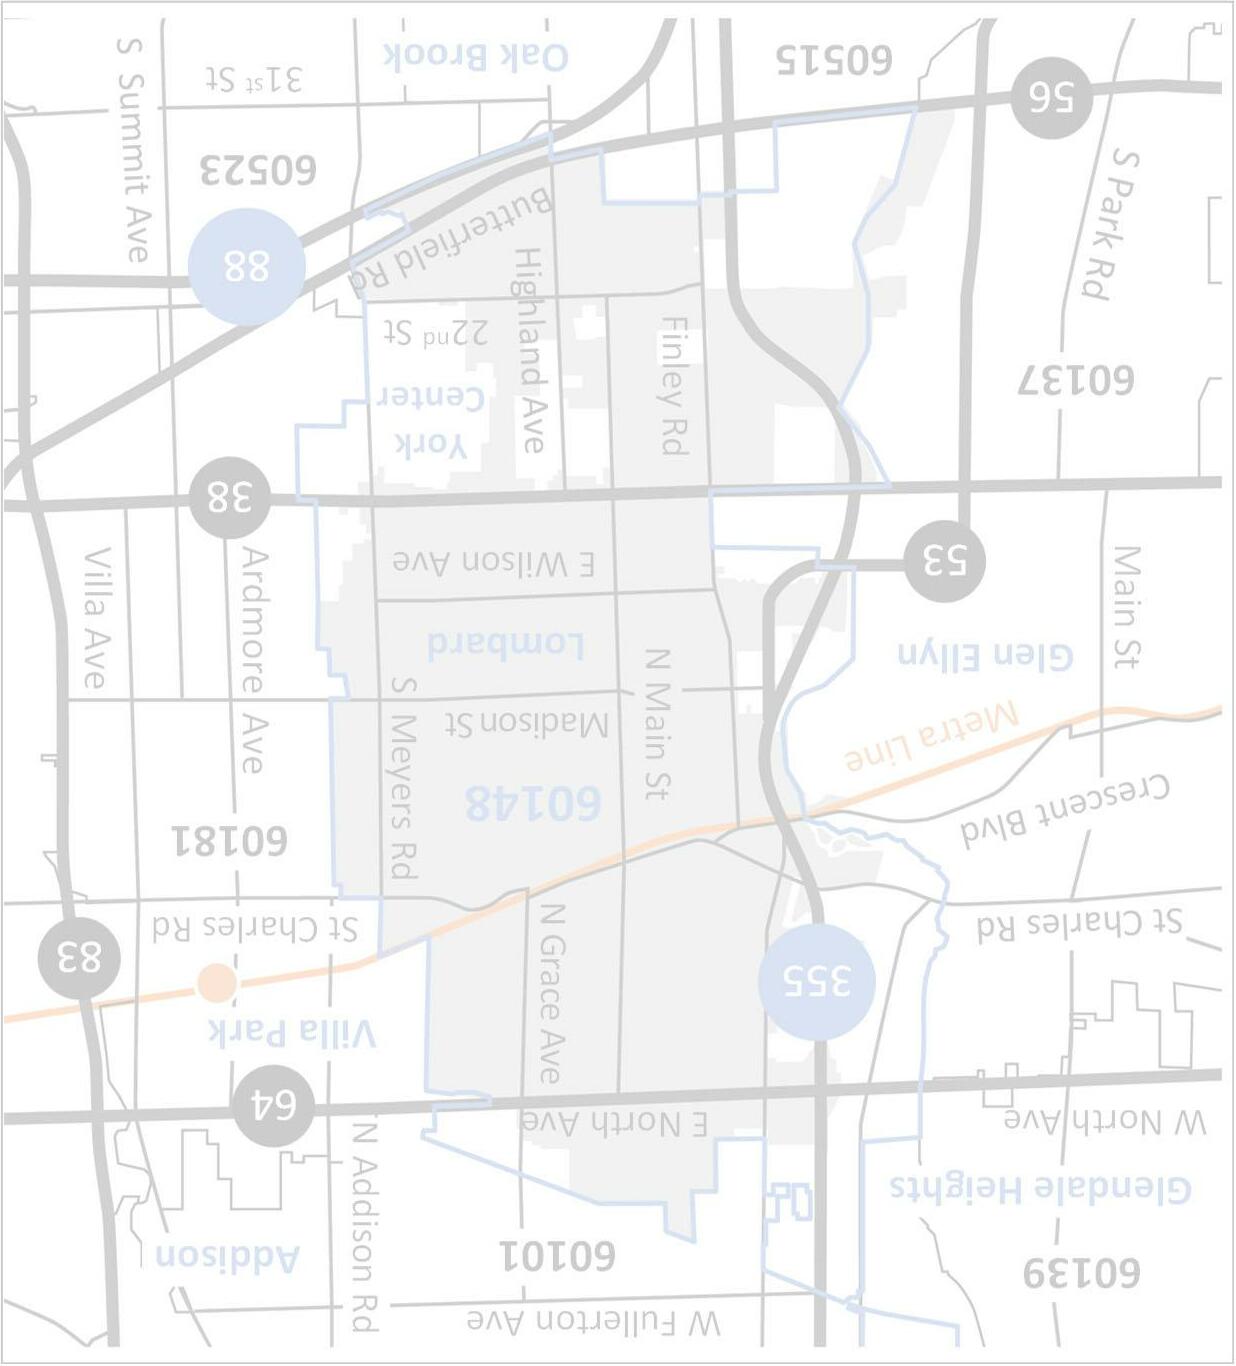
WEST
(St. Charles Rd. to Roosevelt Rd. and Hwy. 355 to Main St.)
CENTRAL
(St. Charles Rd. to Roosevelt Rd. and Main St. to Grace Ave. / Fairview Ave.
NORTH
(North Ave. to St. Charles Rd. and Rte. 53 to Grace Ave.)
EAST
(North Ave. to Roosevelt Rd. and Grace Ave. / Fairview Ave. to Villa Park)
SOUTH (South of Roosevelt Rd. to Butterfield Rd.)
Note: All figures represent detached single-family homes unless otherwise specified. Price range data based on the village of Lombard. Submarket figures based on the approximate areas identified on map above.
3
MARKET SUMMARY
Market” Remains Going into 2022 Year End


Inventory
of available
time of year
Short Market Times List to Contract Days (Q3)
going under contract quicklywith most taking
days or less
Limited Price Discounts
Price Discounts (Q3)
discounts to asking price; houses mostly selling around full price
Sale Prices
Price / Price Per Sq. Ft. (Q3)
prices overall, but some areas and price ranges experiencing small declines
“Seller’s
4
Homes
7 –10
Sale
Limited
Higher
Mixed
Sale
Home
(September) 10% “Seller’s market” with 15+ year low
homesthis
Fewer Available Homes Lower Activity New Home Listings (Q3) Contracted Homes (Q3) 21%14% Closed Homes (Q3) 22%
TOP LOMBARD SUPPORTER

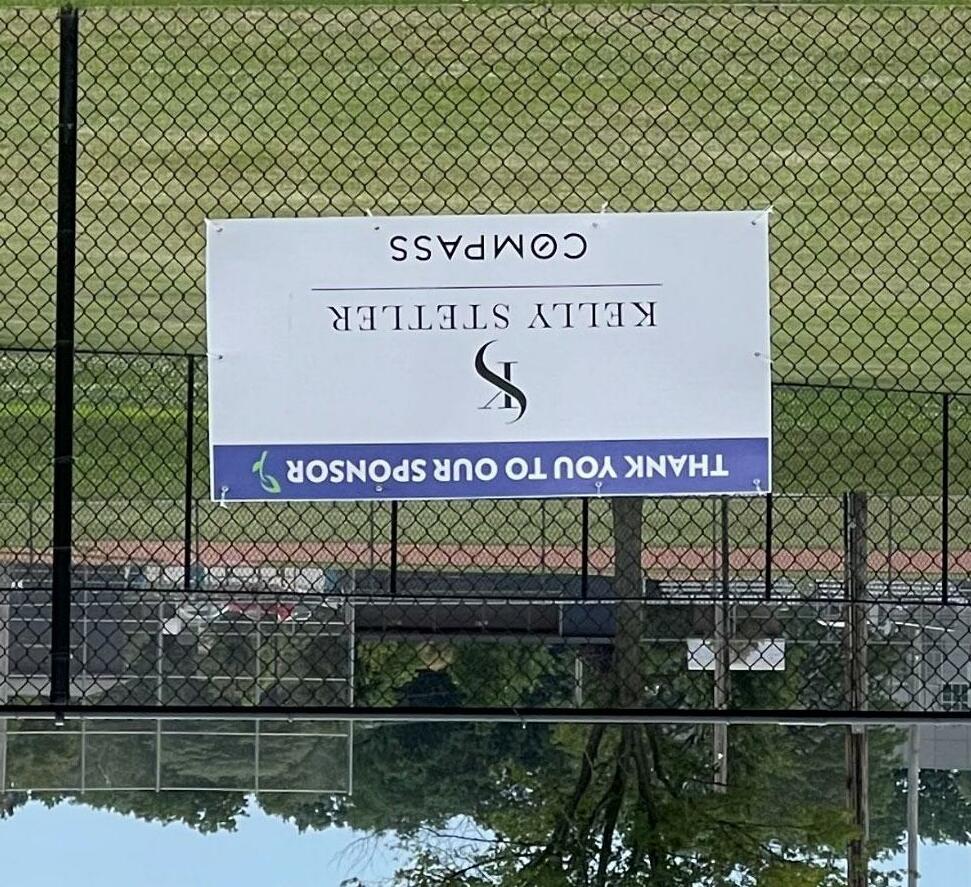

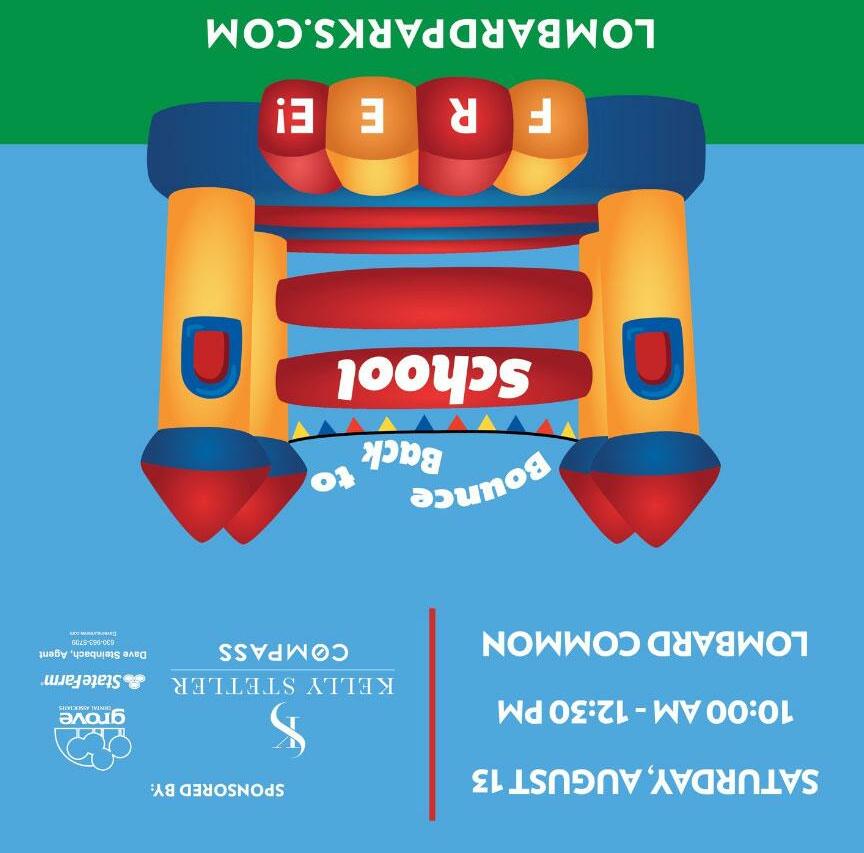


Seen Around Lombard in Q3

5
LISTINGS

By Price Range
New listings were down YoY for the quarter across price ranges, except $400K –$500K
While each month declined, August was better than July and September
Listings less than $300K continue to decrease significantly from 2015 / 2016
Lower listing activity with most price ranges continuing downward trend Jul. –Sept. (YoY%)
Rolling Last 12 Months (YoY%)
–$399K $400K –$499K $500K+
Range'22'21%
182 317 116 98 0 100 200 300 400 500 600 700 '08 '09 '10 '11 '12 '13 '14 '15 '16 '17 '18 '19 '20 '21 '22 <$300K $300K
(-17%) (-38%) (+4%) (-4%) NEW
6
Price
<$300K 5578-29% $300K - $399K 96104-8% $400K - $499K 33330% $500K+ 2629-10%
Submarket
Q3 continued to show lower listing activity across most submarkets, except Central and South
West Lombard experienced a significant decline of 40%+ whereas the South was up 30%+ for the quarter
Slower quarter kept all submarkets down over the last 12 months
–Sept. (YoY%)
Rolling Last 12 Months (YoY%)
Jul.
7 By
130 124 129 155 109 0 100 200 300 '08 '09 '10 '11 '12 '13 '14 '15 '16 '17 '18 '19 '20 '21 '22 North West Central East South (-27%) (-15%) (-19%) (-6%) (-19%)Submarket'22'21% North 3446-26% West 3356-41% Central 484117% East 4250-16% South 332532%
HOMES
Price Range
homes were down 20%+
mostly by
priced below
end of the market ($500K+
experienced a strong quarter, but this price range is much lower
market with

Last 12 Months (YoY%)
CONTRACTED
Contracted
YoY driven
homes
$400K Higher
homes)
volume Split
lower price ranges down and higher price ranges having more contracts Jul. –Sept. (YoY%) 137 225 77 59 0 75 150 225 300 375 450 '08 '09 '10 '11 '12 '13 '14 '15 '16 '17 '18 '19 '20 '21 '22 <$300K $300K –$399K $400K –$499K $500K+ (-24%) (-45%) (+4%) (+16%) 8 By
Rolling
Price Range'22'21% <$300K 3765-43% $300K - $399K 6172-15% $400K - $499K 1617-6% $500K+ 161145%
Submarket
Contracted activity was lower across most submarkets in Q3, except Central and South (consistent with higher listings)
North and East submarkets experienced the largest declines for the quarter
Lombard submarkets have shown a meaningful decline in contracted homes over the last 12 months
Rolling Last 12 Months (YoY%)
West Central East South
94 90 86 101 72 0 50 100 150 200 '08 '09 '10 '11 '12 '13 '14 '15 '16 '17 '18 '19 '20 '21 '22 North
All
9 By
Jul. –Sept. (YoY%) (-22%) (-19%) (-36%) (-30%) (-23%)Submarket'22'21% North 1531-52% West 2633-21% Central 302143% East 2142-50% South 221916%
CLOSED HOME SALES
By Price Range

Closed homes were down 20%+ YoY driven mostly by homes priced below $300K
Closing activity remains up for homes priced $400K+ over the last 12 months
Closed homes priced under $300K are approx. 1/3 of what they were 5 –6 years ago
homes likely to continue declines with lower listings and fewer
Rolling Last 12 Months (YoY%)
Closed
contracts Jul. –Sept. (YoY%) 151 238 85 56 0 100 200 300 400 500 '08 '09 '10 '11 '12 '13 '14 '15 '16 '17 '18 '19 '20 '21 '22 <$300K $300K –$399K $400K –$499K $500K+ (-19%) (-43%) (+15%) (+12%) 10
Price Range'22'21% <$300K 3460-43% $300K - $399K 7582-9% $400K - $499K 2230-27% $500K+ 14140%
Submarket
Closed activity was mostly lower across submarkets in Q3 (Central and South flat)
East submarket was down the most for the quarter (extremely low home closings) and the last 12 months
home sales trending back toward pre-pandemic levels
Rolling Last 12 Months (YoY%)
West Central East South
104 98 89 108 73 0 50 100 150 200 '08 '09 '10 '11 '12 '13 '14 '15 '16 '17 '18 '19 '20 '21 '22 North
Closed
11 By
Jul. –Sept. (YoY%) (-16%) (-10%) (-34%) (-32%) (-20%)Submarket'22'21% North 2233-33% West 3335-6% Central 27270% East 1948-60% South 24240%
Price Range
for
the

of
compared
below
Trends (Relative%)
Sept. Quarter End (YoY%)
HOME INVENTORY 40% 41% 37% 14% 21% 27% 34% 29% 33% 38% 13% 8% 10% 21% 16% 20% 17% 24% 32% 25% 0% 25% 50% 75% 100% '18'19'20'21'22 <$300K $300K –$399K $400K –$499K $500K+ Sept.
Available homes declined ~10% overall and remain at 15+ year lows Inventory
<$300K homes is less than half
mix
available homes
to 2019 Homes priced
$400K increased YoY Inventory declines moderating as “seller’s market” conditions persist 12 By
15 28 12 18 0 50 100 150 200 '08 '09 '10 '11 '12 '13 '14 '15 '16 '17 '18 '19 '20 '21 '22 <$300K $300K –$399K $400K –$499K $500K+ (+4%) (+36%) (-29%) (-31%)
25% 24% 19% 31% 24% 15% 18% 17% 21% 12% 19% 15% 27% 26% 20% 26% 26% 19% 15% 24% 15% 17% 18% 7% 20% 0% 25% 50% 75% 100% '18'19'20'21'22 North West Central East South 16 8 13 16 13 0 25 50 75 '08 '09 '10 '11 '12 '13 '14 '15 '16 '17 '18 '19 '20 '21 '22 North West Central East South (-43%) (-24%) (-28%) (+160%) Home inventory is meaningfully lower over the last several years East and South submarkets have increased meaningfully on a relative basis YoY Overall mix of home inventory has moved closer to pre-pandemic proportions (+60%) By Submarket Sept. Quarter End (YoY%) Sept. Trends (Relative%) 13
By Price Range
Days between listing date and contract signing have been less than two weeks for several quarters

went under contract in 10 days or less for the quarter
contract times to lengthen over time despite limited available inventory
Rolling Last 12 Months (YoY%)
CONTRACT TIME
Homes
Expect
Jul. –Sept. (YoY%) 10 8 7 60 75 150 225 '08 '09 '10 '11 '12 '13 '14 '15 '16 '17 '18 '19 '20 '21 '22 <$300K $300K –$399K $400K –$499K $500K+ (+60%) (0%) (0%) (-40%) 14
Price Range'22'21% <$300K 511-55% $300K - $399K 105100% $400K - $499K 10743% $500K+ 58-38%
By Submarket
Contract time in Q3 remained fast; large percentage increases from a very small bases (one day driving a large change)
are reviewing new listings quickly
on the market for two weeks or longer are likely overpriced or have other factors impacting time / interest
Rolling Last 12 Months (YoY%)
West Central East South
8 9 7 6 9 0 25 50 75 100 '08 '09 '10 '11 '12 '13 '14 '15 '16 '17 '18 '19 '20 '21 '22 North
(-10%) (+33%) (0%) (+13%) (0%)
Buyers
Homes
Jul. –Sept. (YoY%) 15 Submarket'22'21% North 79-22% West 713-46% Central 69-33% East 8633% South 9650%
PRICE DISCOUNTS
By Price Range
Sales closed around full asking price during the third quarter
Multiple offers becoming more situationspecific than the expectation

Price discounts have been limited / nonexistent and expected to remain tight
Rolling Last 12 Months (YoY%)
Jul. –Sept. (YoY%)
Range'22'21%
98% 100% 100% 100% 75% 80% 85% 90% 95% 100% '08 '09 '10 '11 '12 '13 '14 '15 '16 '17 '18 '19 '20 '21 '22 <$300K $300K –$399K $400K –$499K $500K+ (0%) (0%) (+2%) (+2%)
16
Price
<$300K 99%98%2% $300K - $399K 100%100%0% $400K - $499K 101%98%2% $500K+ 100%100%0%
By Submarket
Price discounts have been mostly consistent across submarkets; limited differences reflect appeal of Lombard overall
Very narrow, if any, discounts across submarkets in Q3
Buyers and sellers mostly meeting around original asking price
Rolling Last 12 Months (YoY%)
–Sept. (YoY%)
North West Central East South (0%)
100% 100% 100%
100% 99%
(0%) (+2%) (+1%) (0%)
85% 90% 95% 100% '08 '09 '10 '11 '12 '13 '14 '15 '16 '17 '18 '19 '20 '21 '22
17
Jul.
Submarket'22'21% North 100%100%0% West 100%97%3% Central 100%98%2% East 99%100%-1% South 100%100%0%
PRICE PER SQ. FT.

By Price Range
Price per sq. ft. trend was mixed for the quarter; lower priced and higher priced homes each showed slight declines
price ranges remain meaningfully higher over the last 12 months
have held due to low home inventory, but are coming off near-term highs
Rolling Last 12 Months (YoY%)
–Sept. (YoY%)
All
Prices
$207 $216 $205 $210 $100 $150 $200 $250 '08 '09 '10 '11 '12 '13 '14 '15 '16 '17 '18 '19 '20 '21 '22 <$300K $300K –$399K $400K –$499K $500K+ (+9%) (+7%) (+11%) (+11%) 18
Jul.
Price Range'22'21% <$300K $204$213-4% $300K - $399K $219$2076% $400K - $499K $227$18423% $500K+ $199$201-1%
By Submarket
Lombard submarket price per sq. ft. trends varied by the area
All submarkets remain higher over the last 12 months, but North and Central flattening; South is up significantly since the pandemic
East Lombard is now the highest price per sq. ft. for the quarter (tied with West) and last 12 months (first time in a couple years)
–Sept. (YoY%)
Rolling Last 12 Months (YoY%)
North West Central East South
(+13%)
$212 $213 $213 $219 $205 $100 $150 $200 $250 '08 '09 '10 '11 '12 '13 '14 '15 '16 '17 '18 '19 '20 '21 '22
(+9%) (+3%) (+2%)
(+12%)
19
Jul.
Submarket'22'21% North $213$2140% West $223$20210% Central $193$212-9% East $223$2059% South $196$1960%
CLOSED
Submarket

prices were mostly higher during Q3 (these values are influenced by relative prices and the size of the homes sold)
and East lower for the quarter, but remain up over the last 12 months
homes available and many remodeled homes driving higher prices
PRICES
–Sept. (YoY%)
K K K K K K
Rolling Last 12 Months (YoY%)
$338 $330 $350 $325 $369 $100 $150 $200 $250 $300 $350 $400 '08 '09 '10 '11 '12 '13 '14 '15 '16 '17 '18 '19 '20 '21 '22 North West Central East South K (+4%) K (+9%) K (+9%)
SALE
K (+6%) Sale
Central
Limited
K
20 By
Jul.
K (+6%) Submarket'22'21% North $345K$319K8% West $325K$309K5% Central $343K$365K-6% East $320K$323K-1% South $370K$350K6%


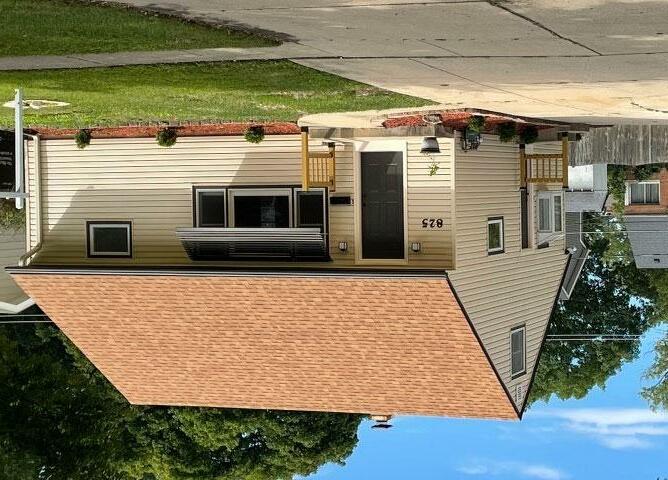
COMPASS LISTINGS 21 592 Highway 53 $700K LIST PRICE 6 / 3 BEDS / BATHS ~4,000 SQ. FT. 3 CAR GARAGE Selected Compass Lombard Listings 825 South Grace St. $365K LIST PRICE 3 / 2 BEDS / BATHS ~1,115 SQ. FT. N/A CAR GARAGE 2260 South Grace St. (Unit 406) $275K LIST PRICE 3 / 2 BEDS / BATHS ~1,600 SQ. FT. 1 GARAGE SPACE 763 Lilac Way Private LIST PRICE 3 / 2 BEDS / BATHS ~1,275 SQ. FT. 1 CAR GARAGE Coming SoonContingent


COMPARING HOME TYPES Analyzing Lombard Home Types New Listings2102071 Contracted Homes1301739 Home Inventory73724 Contract Time7 days5 days6 days Price Discounts100.0%101.6%100.0% Price per. Sq. Ft. $215$209$174 Closed Sale Price$350K$300K$180K Home TypeSingle FamilyTown HousesCondos 22 Closed Homes1452548
COMPARING SUBURBS 23 Analyzing Western Suburb Markets SuburbMedian PriceQ3 YoY%Price / Sq. Ft.Q3 YoY%Contract TimeQ3 YoY% Addison$335K2%$2014%90% Bensenville$315K0%$2000%8-11% Bloomingdale$414K8%$20715%7-13% Downers Grove$458K6%$24011%6-33% Elmhurst$615K14%$29414%1110% Glen Ellyn$475K-7%$25610%7-22% Glendale Heights$295K5%$19411%5-17% Lombard$350K4%$2155%70% Lisle$438K15%$20410%10100% Wheaton$470K9%$2339%8-11% Villa Park$295K4%$2136%6-25%


630.750.9551 kelly.stetler@compass.com www.kellystetlerrealestate.com Compass is a licensed real estate broker and abides by federa l, state and local equal housing opportunity laws. All materialpr esented herein is intended for informational purposes only, is compiled from sources deemed reliable but is subject to errors, omissions, and changes with out notice. Sources include Midwest Real Estate Data LLC. This is not intended to solicit property already listed. www.compass.com
