OPENING NOTE


Brieflyreflectingon2022,theyearwasataleoftwohalves. Thefirsthalfwasincredibleandclearlyunsustainable.The secondhalf,particularlythefourthquarter,experienceda meaningfulslowdownintransactionactivityasinterestrates spiked.Themarketispickingupagainwithseasonaltrends, butLombardandotherwesternsuburbshavethesame dilemma;thereareveryfewhousesavailable,whichis holdingprices. Thispastyearweadvisedonover40completedtransactions andgrewouroverallclosedtransactionvolumeby40%+to morethan$30million.Wewillalsobesponsoring15+ Lombardcommunityeventsin2023andhopetoseeyou aroundtown!Compasscontinuestobethefastestgrowing topbrokerageinLombard.#letsgolombard


2
ForthecoverwechosetheMadisonMeadowAthleticCenter. TheMMACisagreatspottoworkonthoseNewYear’s fitnessresolutions! Allmybest, 630.750.9551 kelly.stetler@compass.com www.kellystetlerrealestate.com Learn More Scan Here
TOP LOMBARD SUPPORTER


Our Recent and Upcoming Lombard Sponsorships


3


LOMBARD OVERALL “Seller’s Market” Remains Going into 2023 Seasonal Uptick 4 Short Market Times List to Contract Days (Q4) Homes going under contract quicklywith most taking two weeks or less Slight Price Discounts Sale Price Discounts (Q4) Limited discounts to asking price; homes mostly selling at 2% –3% discount or less Higher prices overall, but some areas and price ranges experiencing small declines Mixed Sale Prices Sale Price / Price Per Sq. Ft. (Q4) Home Inventory (December) 24% “Seller’s market” with 15+ year low of available homesthis time of year Fewer Available Homes Lower Activity New Home Listings (Q4) Contracted Homes (Q4) 30% 24% Closed Homes (Q4) 38%
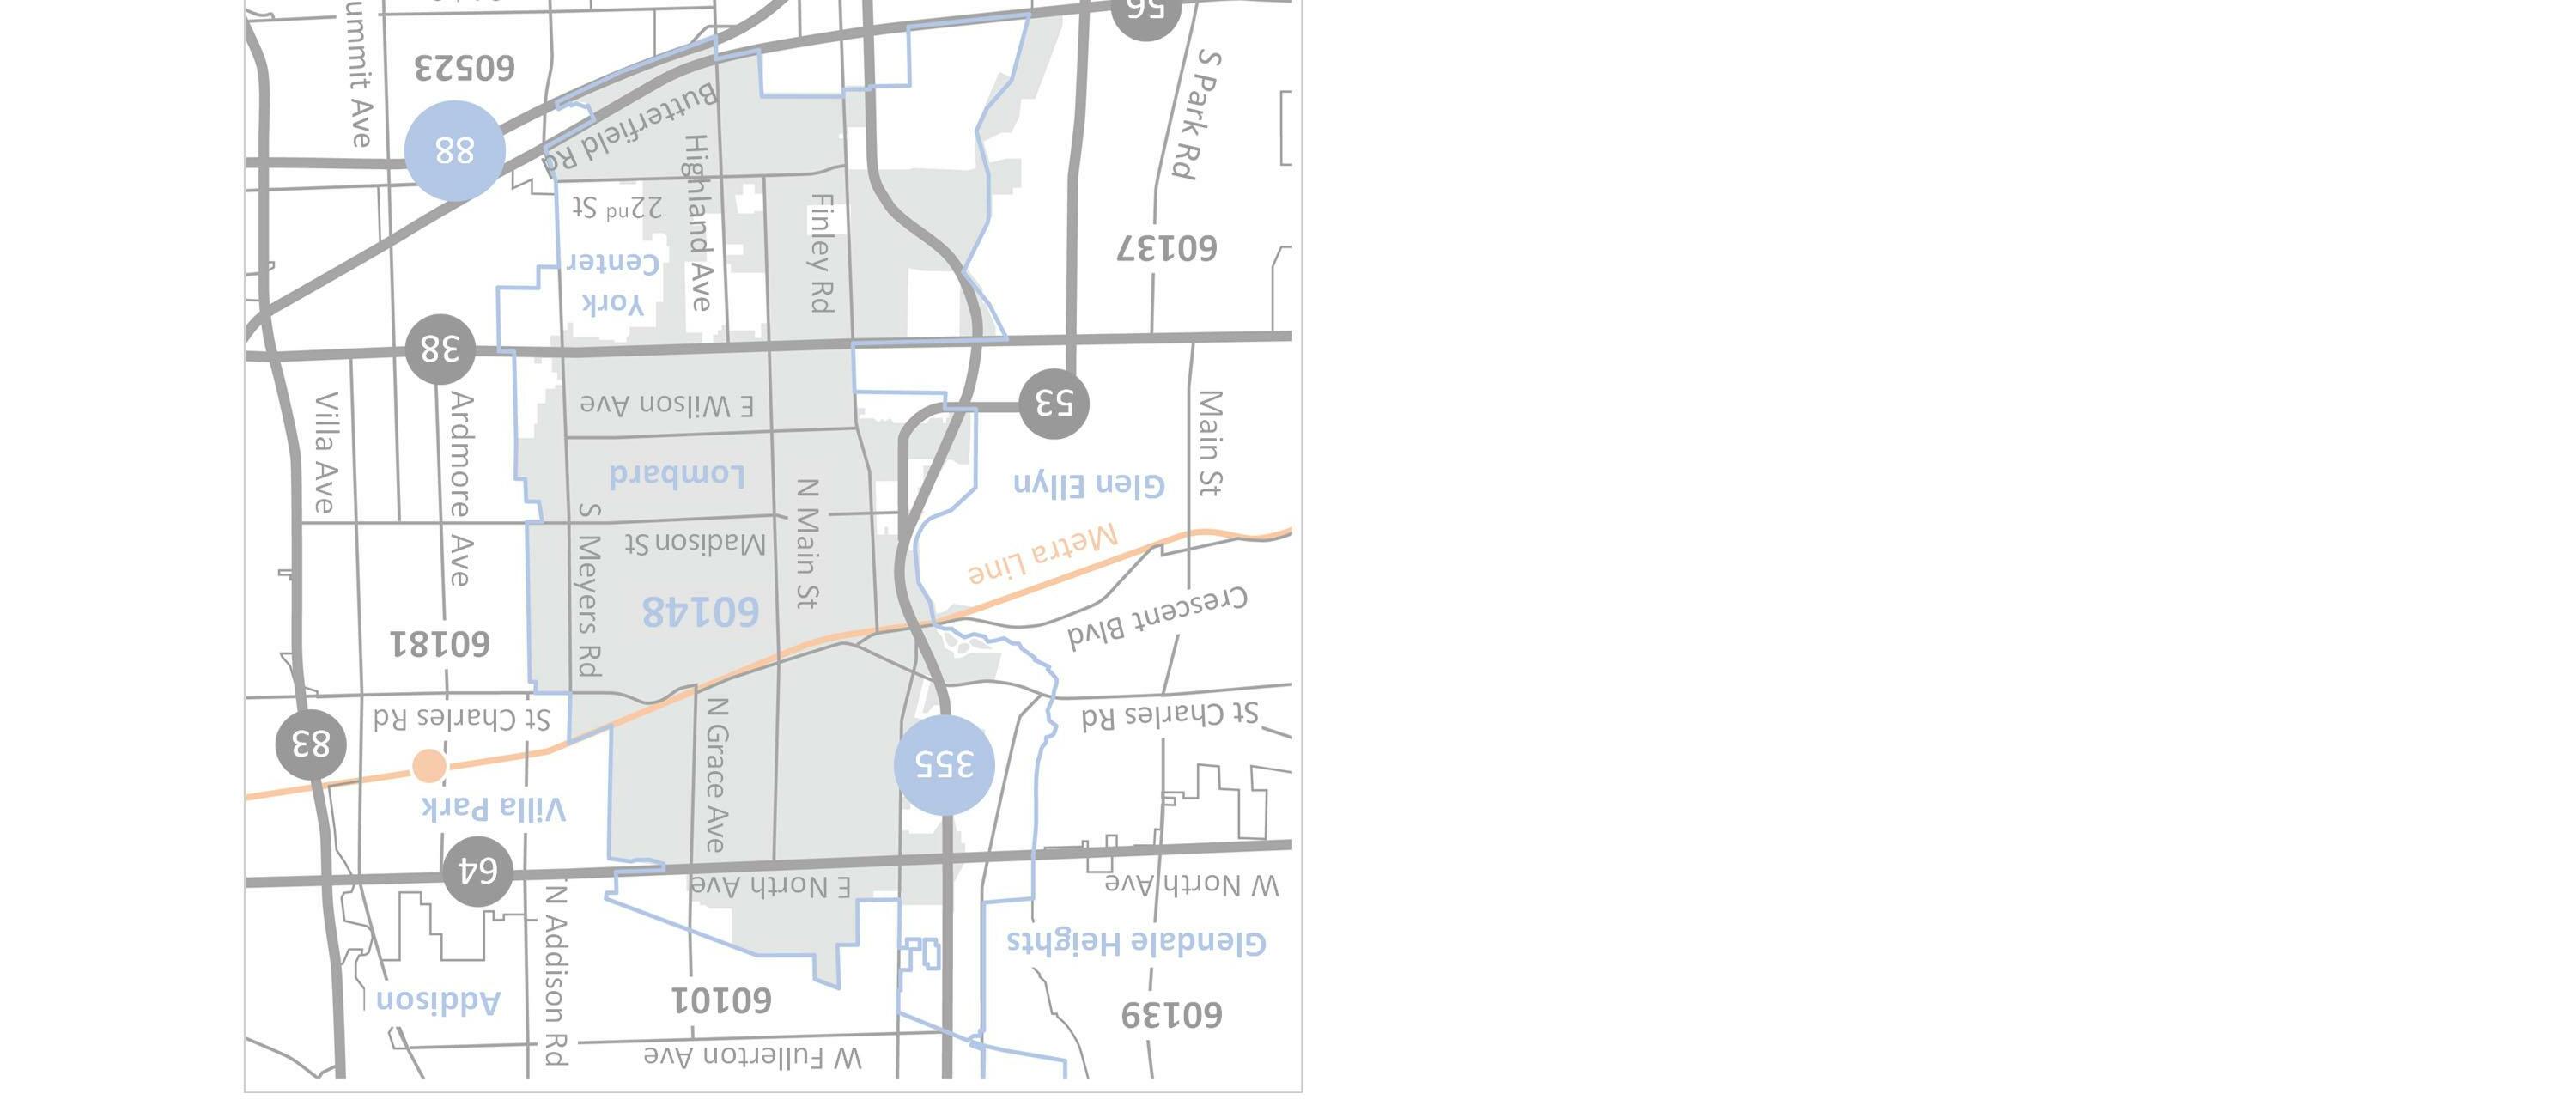
LOMBARD SUBMARKETS Note:5 Submarketsbasedontheapproximateareasidentifiedonmap. Defining the Lombard Submarkets 1. North NorthAve.toSt.CharlesRd. 1andRte.53toGraceAve. 2. West St.CharlesRd.toRooseveltRd.2andHwy.355toMainSt. Central St.CharlesRd.toRoosevelt Rd.andMainSt.toGrace Ave./FairviewAve 3 East NorthAve.toRooseveltRd. andGraceAve./FairviewAve. toVillaPark 4 5. South SouthofRooseveltRd.to5ButterfieldRd. 1 24 3 5


11 NORTH LOMBARD 6 Submarket Overall –Q4 2022 30 New Listings 9% Prior Year $300K Sale Price 15% Prior Year Under Contract 25 17% Prior Year $214 Price / Sq. Ft. 18% Prior Year Closed Homes 43% Prior Year % List Price 3% Prior Year Available Homes 45% Prior Year Days to Contract 7% Prior Year 1 North Lombard experienced lower activity generally with home inventory dropping to under a dozen homes. Prices moved decisively higher compared to a softer Q4 last year. 13 98%


Submarket Home Types –Q4 2022 7 23-7 19-6 9-2 $320K-$133K $226-$138 .98%-100% 15days-6days SingleFamilyTownHousesCondos 16-5 New Listings Under Contract Closed Homes Available Homes Sale Price Price / Sq. Ft. % List Price Days to Contract Home Type Single Family Town House Condo 38% 13% 12% 25% 53% 7% 22% 2% 0% 40% 38% 100% 22% 16% 5% 80%
WEST LOMBARD 8 Submarket Overall –Q4 2022 2 7 18 New Listings 40% Prior Year $266K Sale Price 10% Prior Year Under Contract 14 53% Prior Year $177 Price / Sq. Ft. 2% Prior Year Closed Homes 62% Prior Year % List Price 1% Prior Year Available Homes 53% Prior Year Days to Contract 47% Prior Year West Lombard saw a slow quarter with broad declines in activity and home inventory more than cut in half from last year. Days to contract was the fastest of any Lombard submarket. 9 98%


Submarket Home Types –Q4 2022 9 15-3 11-3 7-0 $275K-$152K $170-$185 .98%-98% 8days-9days SingleFamilyTownHousesCondos 13-1 New Listings Under Contract Closed Homes Available Homes Sale Price Price / Sq. Ft. % List Price Days to Contract Home Type Single Family Town House Condo 55% 63% 45% 53% 36% 14% 6% 0% 32% 70% 88% 100% 8% 25% 3% 53%
CENTRAL LOMBARD Submarket Overall –Q4 2022 3 10 11 23 New Listings 5% Prior Year $330K Sale Price 4% Prior Year Under Contract 12 43% Prior Year $205 Price / Sq. Ft. 0% Prior Year Closed Homes 17% Prior Year % List Price 1% Prior Year Available Homes 10% Prior Year Days to Contract 0% Prior Year Central Lombard was the only submarket to see an uptick in new listings and resulting increase in home inventory. Prices were mixed as with small discounts to ask and flat days to contract. 13 99%


Analyzing Home Types –Q4 2022 11 2211011 11-$340K$234K$80K $210$201$98 .99%100%94% 19days4days8days SingleFamilyTownHousesCondos 1811 New Listings Under Contract Closed Homes Available Homes Sale Price Price / Sq. Ft. % List Price Days to Contract Home Type Single Family Town House Condo 25% N/A 52% 46% 10% 1% 2% 1% 0% N/A N/A N/A N/A N/A N/A N/A N/A N/A N/A N/A N/A
EAST LOMBARD 12 Submarket Overall –Q4 2022 4 13 31 New Listings 21% Prior Year $314K Sale Price 20% Prior Year Under Contract 28 0% Prior Year $204 Price / Sq. Ft. 5% Prior Year Closed Homes 35% Prior Year % List Price 2% Prior Year Available Homes 117% Prior Year Days to Contract 75% Prior Year East Lombard experienced an increase in home inventory as contracts flattened and closed homes fell more than new listings. Prices increased even a discounts widened with more market time. 14 97%
Submarket Home Types –Q4 2022 13 1786 1882 913 $340K$272K$296K $204$192$190 .96%99%95% 13days17days23days SingleFamilyTownHousesCondos 2262 New Listings Under Contract Closed Homes Available Homes Sale Price Price / Sq. Ft. % List Price Days to Contract Home Type Single Family Town House Condo 42% 5% 500% 25% 117% 50% 22% 4% 3% 50% 100% 0% N/A 23% 70% 1% 100% N/A 0% N/A 76% 16% 1% 23%
SOUTH LOMBARD Submarket Overall –Q4 2022 5 14 17 46 New Listings 40% Prior Year $185K Sale Price 2% Prior Year Under Contract 32 38% Prior Year $149 Price / Sq. Ft. 7% Prior Year Closed Homes 37% Prior Year % List Price 98% 0% Prior Year Available Homes 41% Prior Year Days to Contract 23% Prior Year South Lombard saw lower activity generally leading to less home inventory. While overall sale prices increased slightly, relative pricing slipped as the mix of sales included more condos. 10
Submarket Home Types –Q4 2022 15 18325 8222 818 $340K$305K$155K $197$205$144 .98%100%98% 25days6days10days SingleFamilyTownHousesCondos 11525 New Listings Under Contract Closed Homes Available Homes Sale Price Price / Sq. Ft. % List Price Days to Contract Home Type Single Family Town House Condo 31% 15% 46% 33% 67% 0% 5% 6% 1% 10% 71% 58% 75% 6% 45% 1% 73% 33% 32% 53% 10% 9% 1% 17%


630.750.9551 kelly.stetler@compass.com www.kellystetlerrealestate.com Compass is a licensed real estate broker and abides by federa l, state and local equal housing opportunity laws. All materialpr esented herein is intended for informational purposes only, is compiled from sources deemed reliable but is subject to errors, omissions, and changes with out notice. Sources include Midwest Real Estate Data LLC. This is not intended to solicit property already listed. www.compass.com