Salt Lake County's office market landscape is undergoing a significant transformation in the face of changing tenant preferences and economic conditions At the end of the third quarter, absorption reached a negative 187,976 square feet and overall vacancy hit 18 36 percent Class B properties reached 25 84 percent vacancy thanks to a "flight to quality" tenants migrating to high-end Class A spaces with enhanced amenities to entice employees to come back to the office. As such, Class A vacancy rates decreased while average asking lease rates increased for these desirable properties The recent 50 basis point cut in interest rates also created a more favorable pricing environment for both tenants and investors.
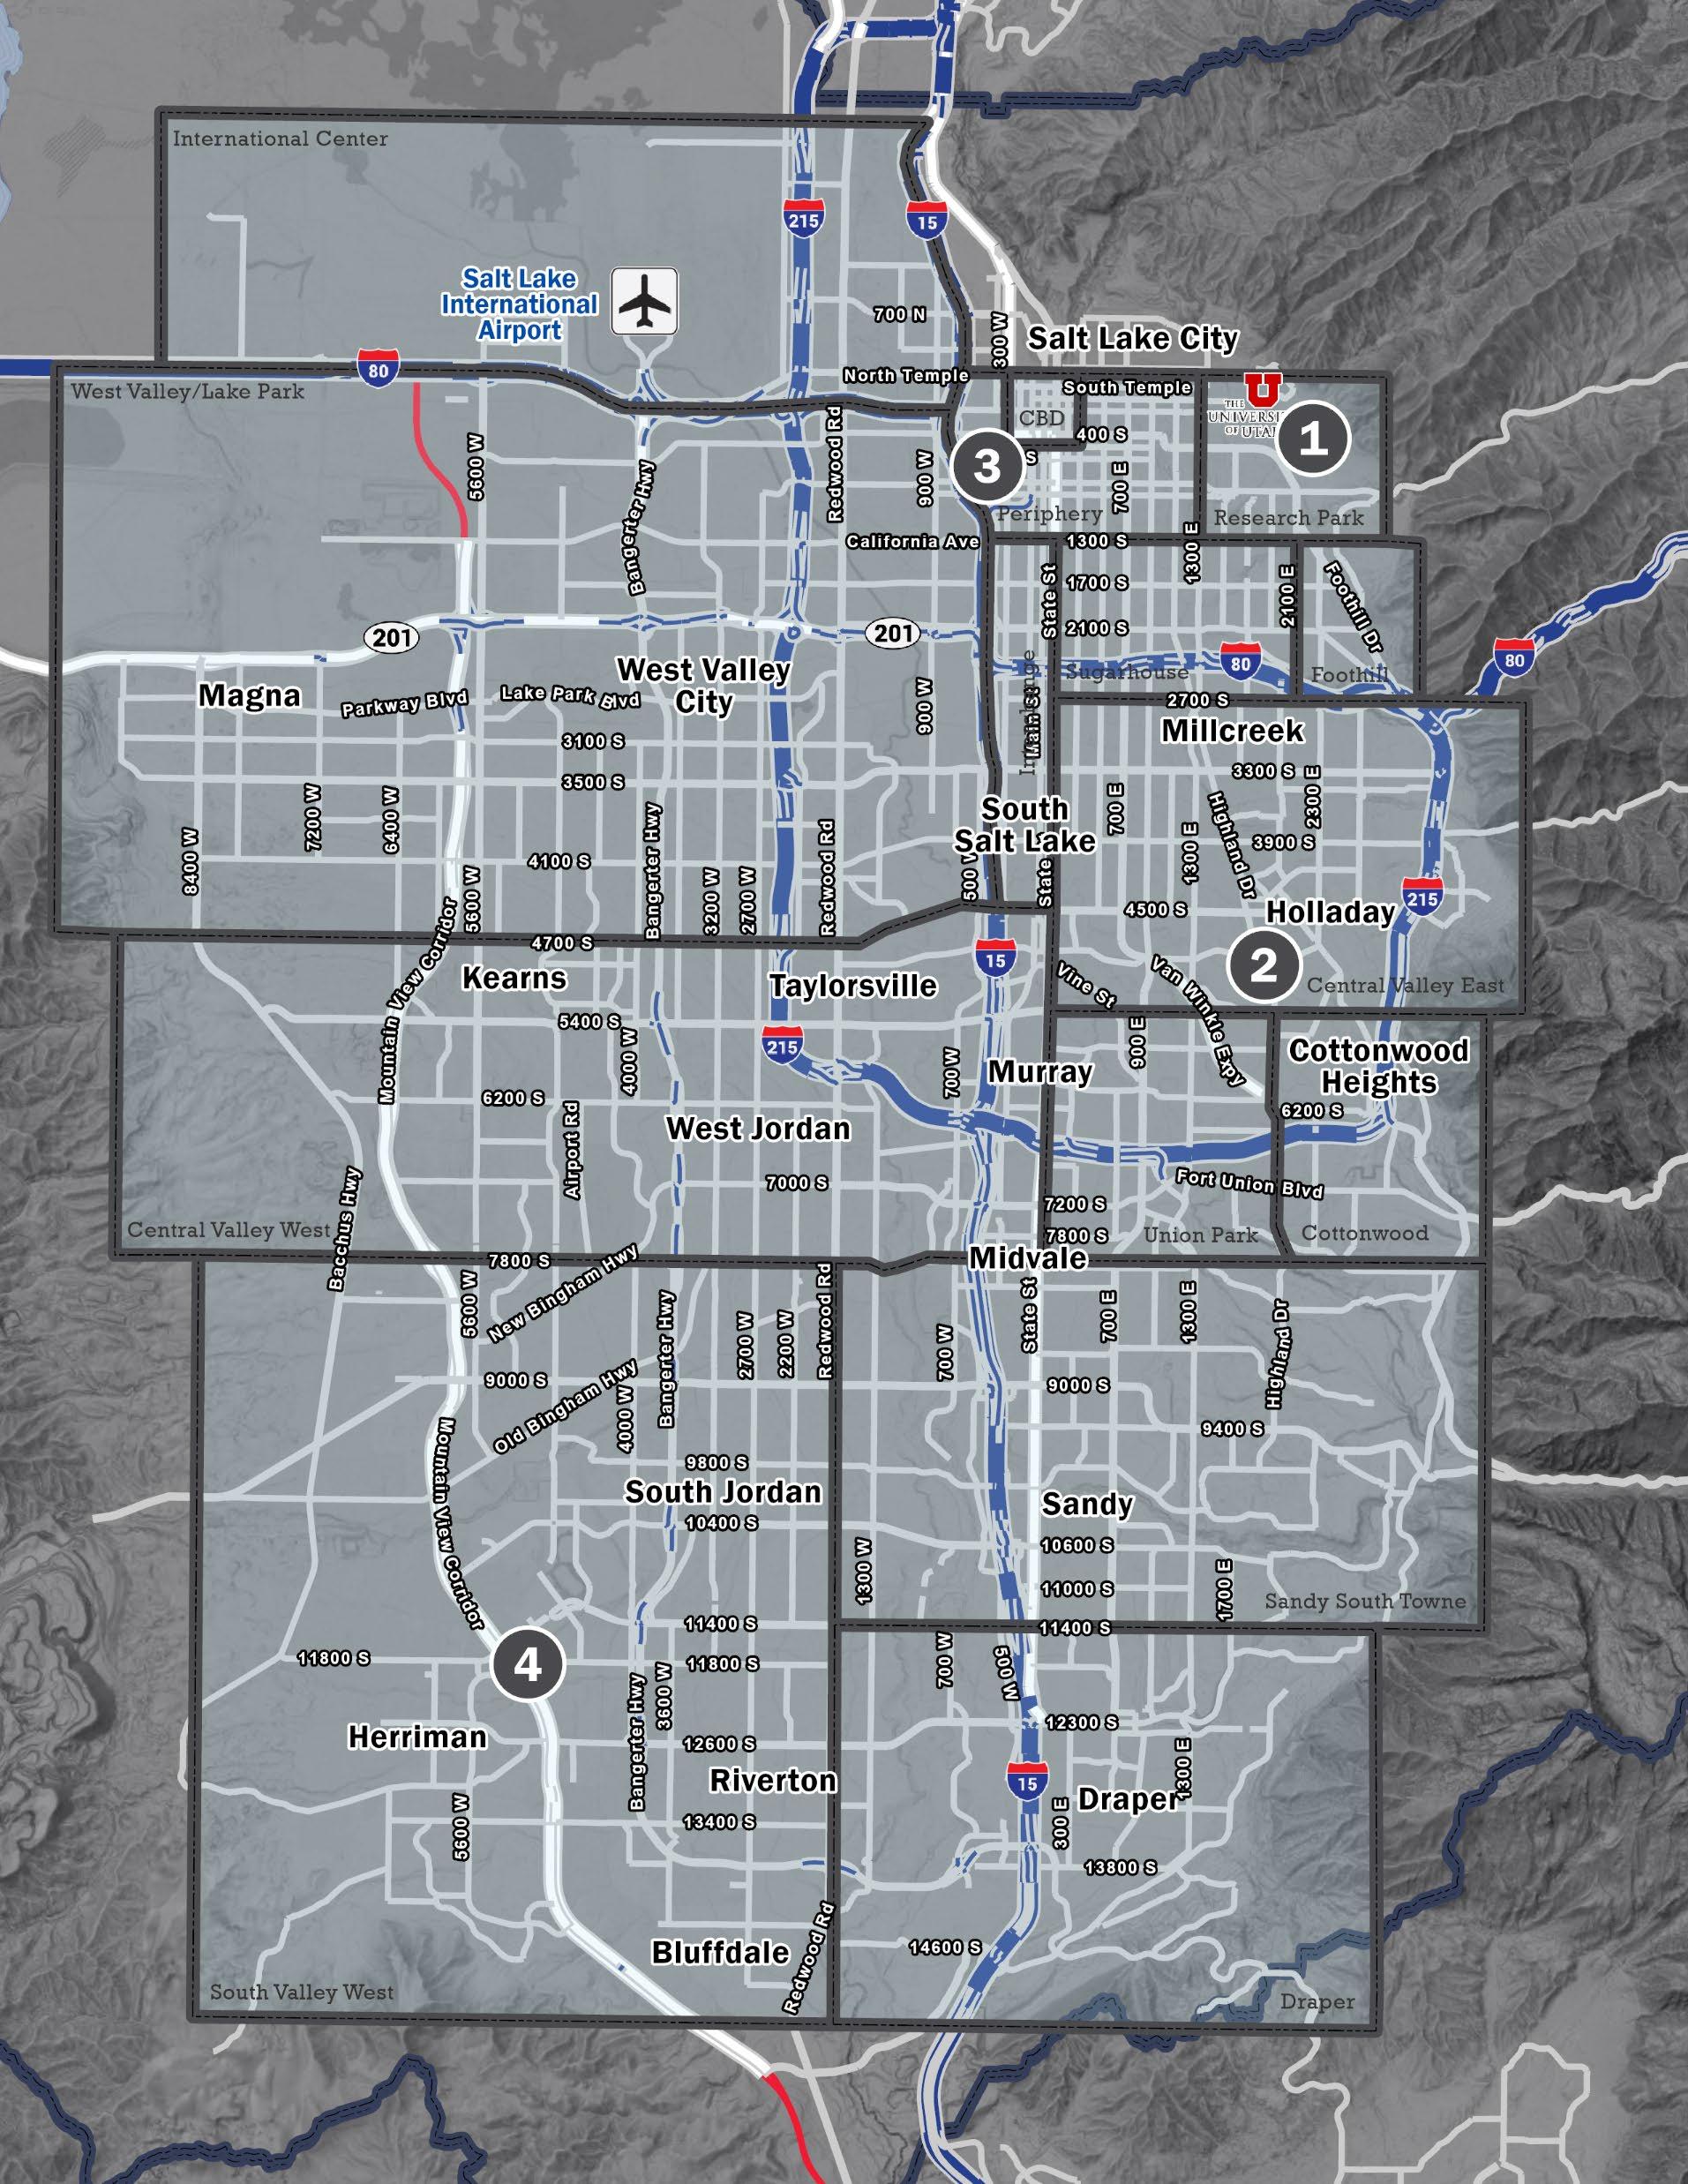
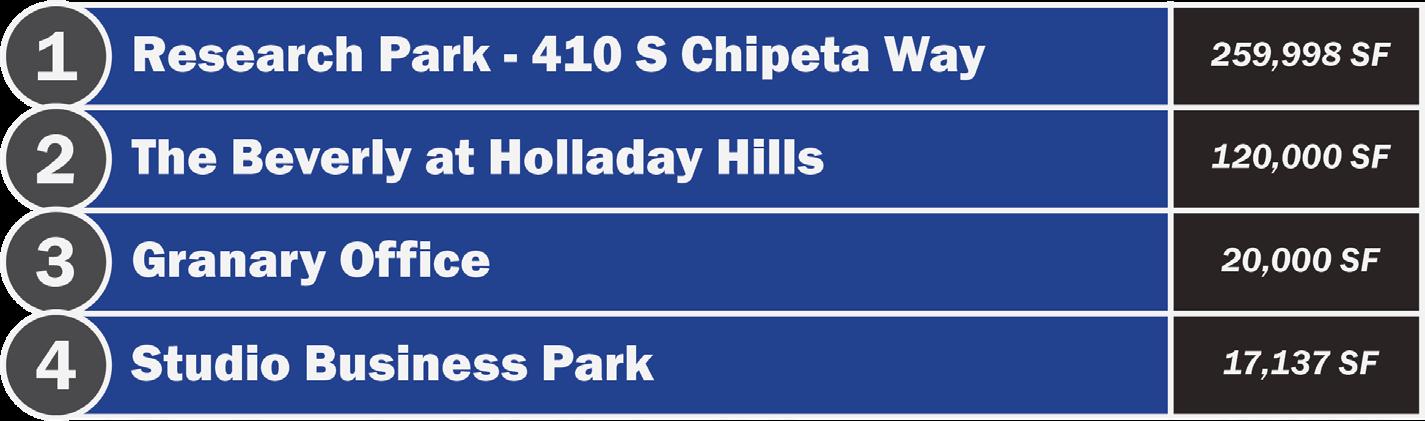
Only four office construction projects were underway in Salt Lake County at the end of the third quarter Research Park Bldg 410 accounted for 259,998 of the 417,135 total square feet of construction The remaining three projects are the Former Cottonwood Mall site and two smaller office buildings in Salt Lake City and Herriman. In the face of persistently high vacancy rates, developers are taking a cautious approach, opting to delay further construction until the market stabilizes and demand increases.
Top Construction Projects
Avg. Asking Lease Rates
Salt Lake County average asking lease rates for office space grew steadily to $27 52 full-service gross (FSG), a $0.29 increase year-over-year. Thanks to strong demand for premium space in select suburban areas, the highest rates were recorded outside of downtown, particularly in Cottonwood’s suburban submarkets, where rates climbed to $30.81 FSG, and in Sugarhouse, where rates reached $31.88 FSG. Downtown’s Central Business District sat at a competitive $30 44 FSG, while the Periphery trailed slightly at $29 25 FSG Class A rates continue to increase as landlords add upscale amenities to their buildings to attract tenants following the "flight to quality" trend.
Absorption
Absorption in Salt Lake County ended the third quarter with negative 187,976 square feet of total absorption, reaching negative 470, 245 square feet for the year. Class B product alone accounted for 210,209 square feet of negative absorption this quarter, including 151, 14 square feet in the Cottonwood submarket Class A properties, however, saw 69,761 square feet of positive absorption concentrated in Draper and Sugarhouse, where Filevine occupied 35,610 square feet at 60 Park, and LifeWave and ProofPoint added 26,854 square feet of expansion at Minuteman Park
Vacancy
The overall direct vacancy rate for office space in Salt Lake County increased from 2 96 in the third quarter of last year to 18 36 percent currently thanks to a rise in Class B vacancies from 20.35 percent to 25.84 percent year-overyear Sublease availability fluctuated around a relatively stable 4 percent throughout the year, decreasing yearover-year by 261,569 square feet As hybrid work and economic uncertainty have become the norm, expect continued downward pressure and ongoing occupancy challenges going forward
(1,000,000) (500,000) 0 500,000 1,000,000
(1,500,000)
Salt Lake County | 24Q3 | Office | Market Statistics
Foothill
Salt Lake County | 24Q3 | Office | Market Statistics
Salt Lake County | 24Q3 | Office | Market Statistics Sublease
Industrial 24Q3
Headline
Salt Lake County's resilient industrial market saw consistent demand for commercial space throughout the third quarter of 2024. With construction activity back to pre-pandemic levels, the area will likely see a limited number of new projects and deliveries moving forward Lease rates reached a stable $0 84 NNN, including a notable rise in mid-sized space rates Net absorption reached 4,266,301 square feet year-to-date, while sublease availability decreased from 3, 002, 759 square feet in the second quarter to 2,391, 717 square feet currently, thanks to ongoing demand and a tightening market. As sublease space transitioned to direct leases and fully vacant new construction entered the market, vacancy rates reached an elevated 4 65 percent by the end of the third quarter
Current Market Indicators
Absorption
Vacancy Rate 4.65%
FORECAST
Historic Comparison Construction
Avg. Asking Lease Rate (NNN) $0.84/ SF
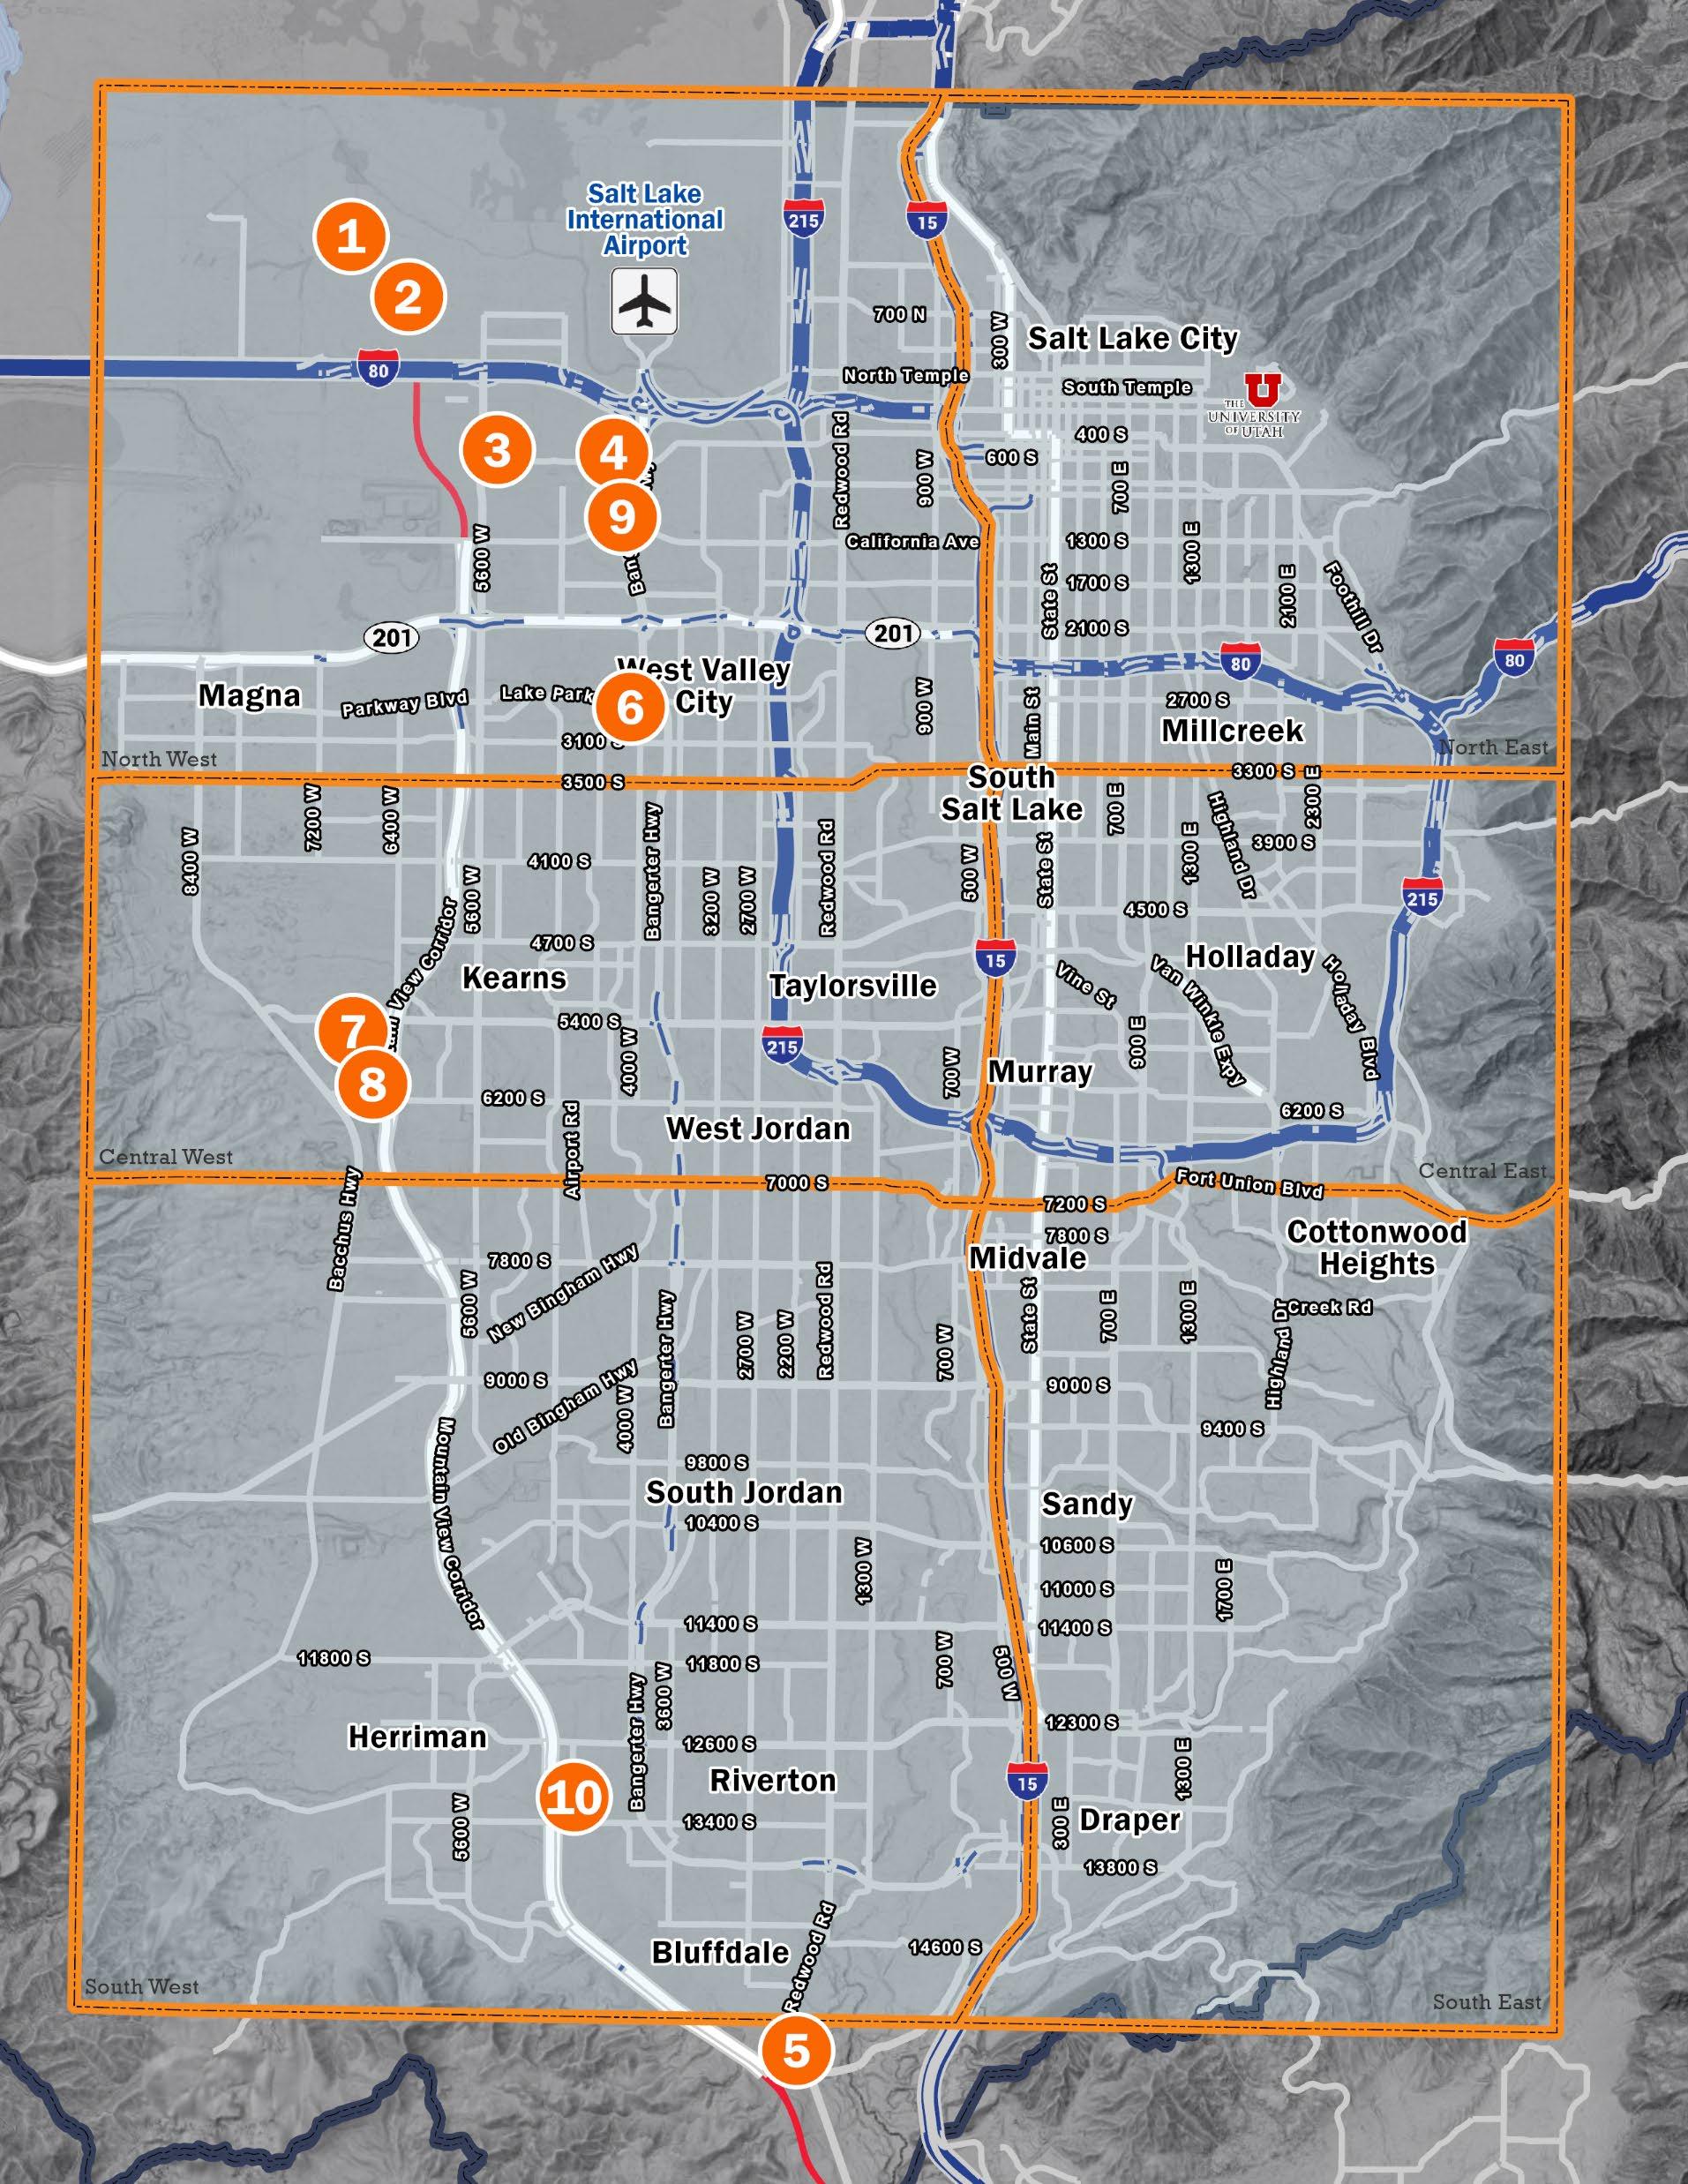
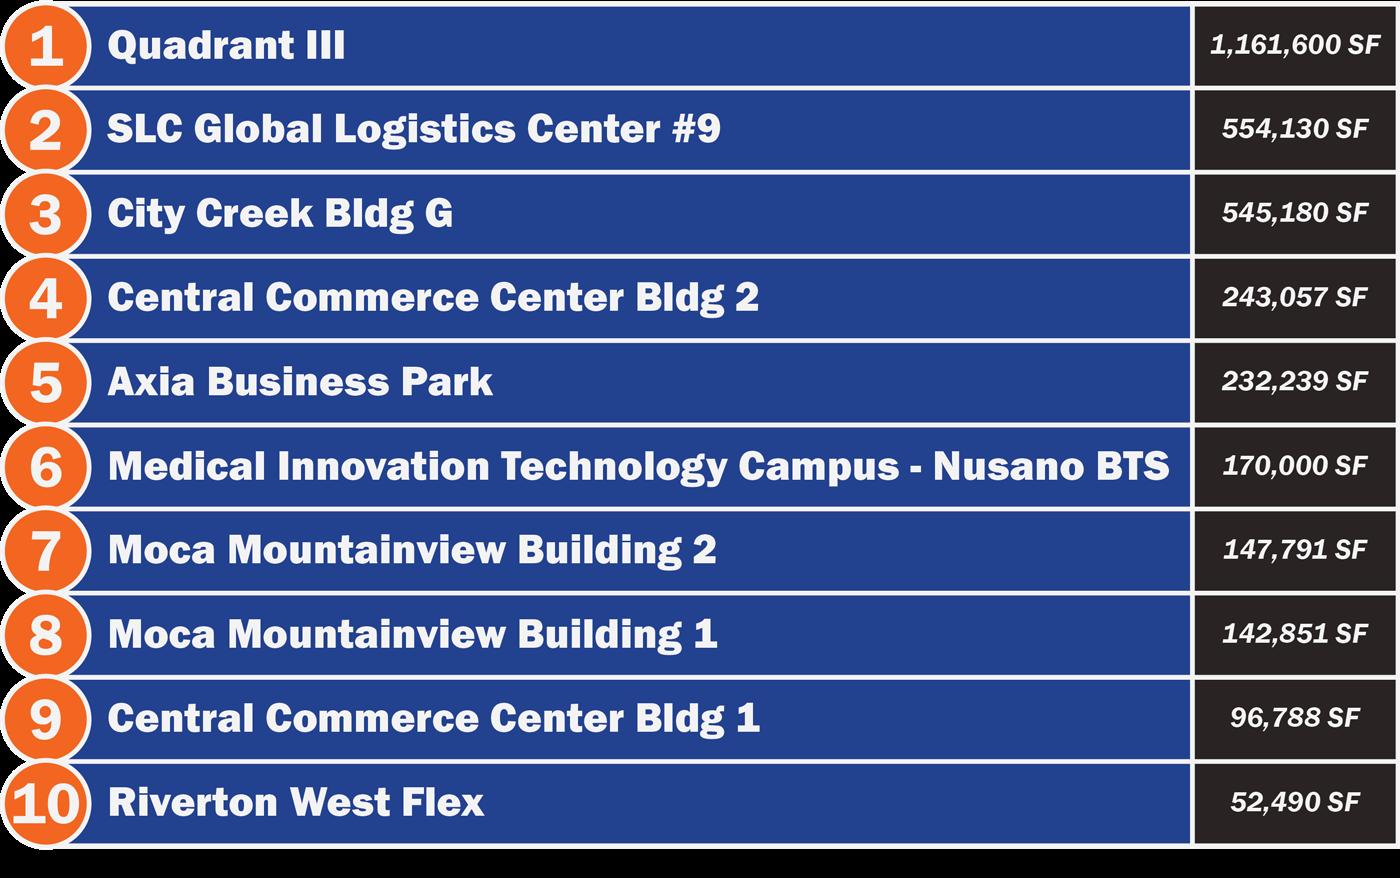
Industrial construction in Salt Lake County reached 3,365,310 square feet by the end of the third quarter a strategic pullback from the larger volumes seen in prior years. The North West quadrant remains the focal point for new development with 2,789,939 square feet of new construction underway, including City Creek Building G (at 545,180 square feet) and Central Commerce Center Buildings 1 and 2 (at 339,845 square feet) As developers focus on high-demand areas and stabilizing costs, this slowdown in construction compared to 2023 reflects a healthy recalibration of the market
Top Construction Projects
Industrial 24Q3
Avg. Asking Lease Rates
Industrial asking lease rates in Salt Lake County held steady at $0 84 NNN quarter-over-quarter and yearover-year. While the South East submarket reached a high of $1.50 NNN, limited availability in one substantial office space drove up rates that don’t fully reflect broader market trends. Strong demand for more manageable square footage brought lease rates for smaller spaces, particularly those under 100,000 square feet, in the range of $0.96 to $1.10 NNN across the county.
Absorption
Salt Lake County saw 702,894 square feet of negative absorption this quarter, bringing the year-to-date total to 4,266,301 square feet. As occupied sublease spaces became direct leases and several tenants moved out, the region saw an increase in vacant space and a noticeable uptick in negative absorption However, the market saw several significant transactions over 50,000 square feet that contributed to positive absorption overall: the Sport Complex on 3rd West leased 50,000 square feet of space on Billinis Road, and Selery Fulfillment leased 70,560 square feet on Gladiola Street
Vacancy
The overall direct vacancy rate for industrial space in Salt Lake County increased to 4 65 percent this quarter compared to 4.39 percent last quarter and 4 36 percent at the same time last year With an overall vacancy rate of 6.94 percent, spaces larger than 100,000 square feet account for a significant 86 5 percent of total direct vacancy as landlords hesitate to divide larger space into smaller units. If landlords begin to offer more flexible configurations, they will be able to lease larger spaces more quickly, especially as the pace of new development has slowed.
3rd Quarter Transactions
Sublease
264 S 5750 W
FFE Solutions Group 303,156 SF
Transaction Date: 09/27/2024
Lease
2475 S 3200 W
Rise Exhibits and Environments 90,333 SF
Transaction Date: 09/26/2024
Sublease
1420 S 4800 W
Kuhl Clothing 63,000 SF
Transaction Date: 08/29/2024
Lease
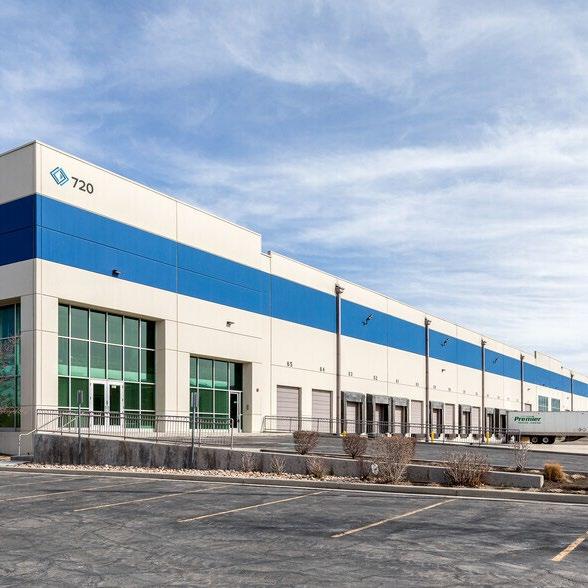
720 S Gladiola St
Selery Fulfillment
70,560 SF 08/23/2024
Extension 2455 W 1500 S Wasatch Electric 59,677 SF
Transaction Date: 09/17/2024
Market Activity
North West
Direct Vacancy Rate: 5.77%
YTD Absorption: +2,801,600 SF
Lease Rate: $0.80 NNN
Central West
Direct Vacancy Rate: 1.26%
YTD Absorption: +24,544 SF
Lease Rate: $0.99 NNN
North East
Direct Vacancy Rate: 1.69%
YTD Absorption: +98,895 SF
Lease Rate: $0.98 NNN
Central East
Direct Vacancy Rate: 1.83%
YTD Absorption: +11,528 SF
Lease Rate: $0.76 NNN
South West
Direct Vacancy Rate: 4.28%
YTD Absorption: +1,287,584 SF
Lease Rate: $1.04 NNN
South East
Direct Vacancy Rate: 0.19%
YTD Absorption: +42,150 SF
Lease Rate: $1.50 NNN
Current Market Indicators
Headline
Consumer interest continues to outpace available inventory in Salt Lake County's retail market. The overall vacancy rate decreased to 2.57 percent in the third quarter of 2024 in a landscape where tenants must compete to secure prime locations The vacancy rate in the North East submarket reached 5 05 percent as downtown retailers worked to adapt to evolving consumer preferences In the face of low overall vacancy, limited new construction and persistent supply constraints, retailers will need to be strategic when looking for growth and leasing opportunities to thrive in this resilient yet competitive environment.
Historic Comparison Construction
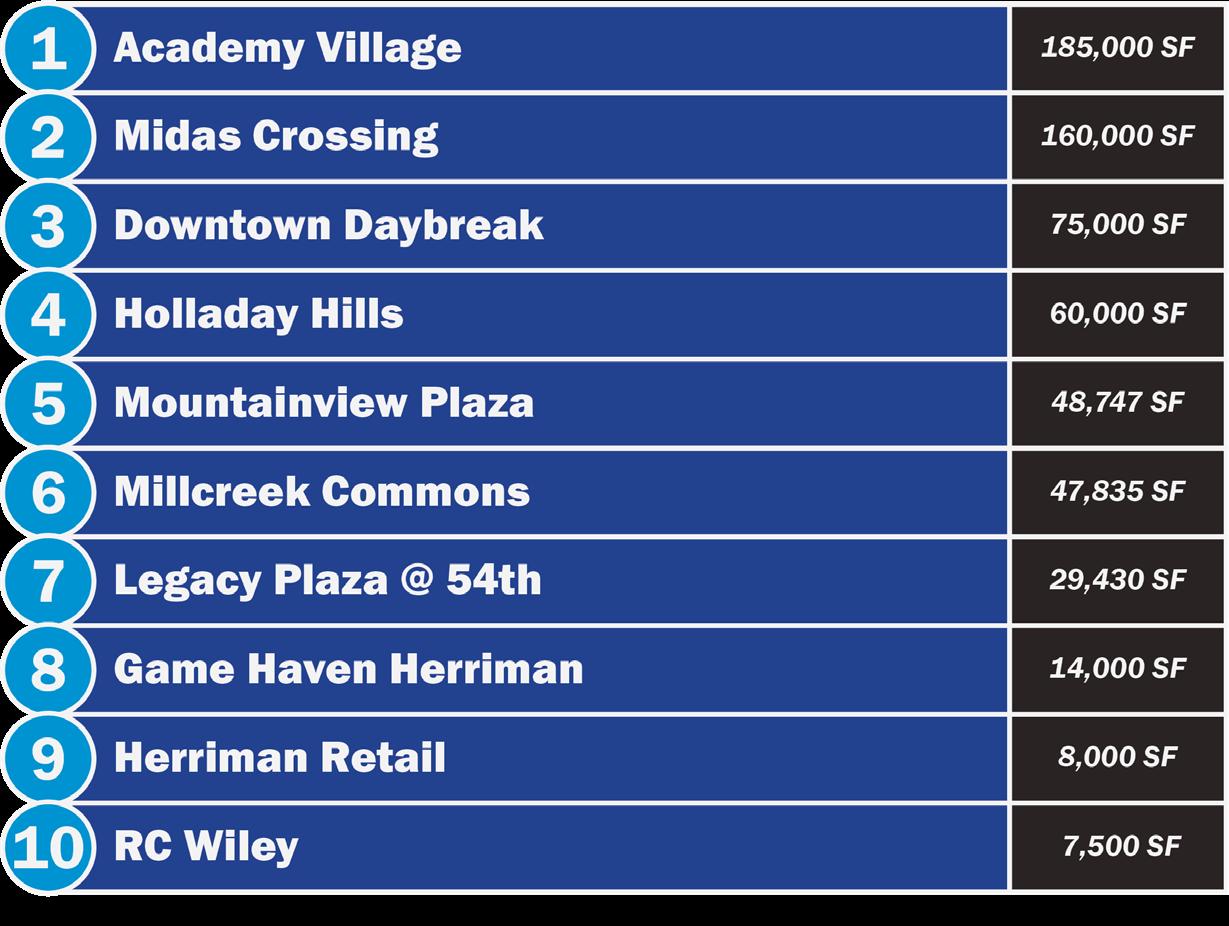
Salt Lake County closed the quarter with 637, 837 square feet of retail space under construction, a significant year-over-year increase of 163,262 square feet from the 474, 575 square feet reported at the same time last year The South West submarket continues to dominate, accounting for 77 percent of the total with 493, 072 square feet currently underway. Major projects include Academy Village (at 185, 000 square feet) and Midas Crossing (at 160, 000 square feet), both in Herriman. However, a major supply and demand imbalance across the county is keeping pressure on developers to continue pushing growth
Top Construction Projects
Retail 24Q3
Avg. Asking Lease Rates
The overall average asking lease rate for retail space in Salt Lake County reached $21 93 NNN at the end of the third quarter, a $0 76 increase since last quarter and a $0.75 increase year-over-year. The North East submarket reached an average asking lease rate of $27 27 NNN ¬ the highest by a significant margin as downtown landlords demand higher rents for prime locations with strong tenant interest
Absorption
Salt Lake County saw minimal retail absorption activity this quarter, but a few key deals helped push year-to-date absorption to a positive 77,561 square feet Downtown, Trader Joe's leased 22,192 square feet, opening its largest Utah location so far, while Williams-Sonoma Stores secured 10,546 square feet in Trolley Square However, year-to-date absorption remains significantly below the positive 529,680 square feet reported at the same time last year With vacancy rates at historic lows, tenants have limited options for relocation or expansion, leading to stagnant absorption across the county
Vacancy
The overall direct vacancy rate for retail space in Salt Lake County dropped to 2 57 percent this quarter, down from the 2 73 percent recorded last quarter, but up from 2.18 percent recorded at the same time last year Despite this slight year-over-year increase, demand continues to outpace supply. The North East submarket had the highest vacancy rate in the county at 5 05 percent as downtown retailers adjust to evolving consumer preferences. In the face of limited new construction, tenants have fewer options, keeping vacancy rates low and maintaining pressure on available retail space across the county $0.00 $5.00 $10.00
Market Overview
Overall Market Totals
Market Activity
North West
Direct Vacancy Rate: 2.64%
YTD Absorption: (25,811) SF
Lease Rate: $23.87 NNN
Central West
Direct Vacancy Rate: 2.06%
YTD Absorption: +29,032 SF
Lease Rate: $18.36 NNN
North East
Direct Vacancy Rate: 3.43%
YTD Absorption: +12,809 SF
Lease Rate: $27.27 NNN
Central East
Direct Vacancy Rate: 1.98%
YTD Absorption: (28,961) SF
Lease Rate: $23.93 NNN
South West
Direct Vacancy Rate: 1.85%
YTD Absorption: +147,807 SF
Lease Rate: $20.34 NNN
South East
Direct Vacancy Rate: 3.98%
YTD Absorption: (57,315) SF
Lease Rate: $20.40 NNN
3rd Quarter Transactions
Sale
583 W eBay Way
Canyon School District 241,095 SF
Transaction Date: 08/20/2024
Sale 175 E 400 S University of Utah 238,805 SF
Transaction Date: 08/08/2024
Expansion
1260 E Stringham Ave
Filevine 35,610 SF
Transaction Date: 07/19/2024
Renewal/Expansion
150 E Social Hall Ave
Bank of Utah 31,689 SF
Transaction Date: 08/01/2024
Lease 5295 S Commerce Dr HDR Engineering 20,317 SF
Transaction Date: 07/09/2024
Top Construction Projects
Market Overview
Overall Market Totals
Market Activity
Downtown
• Vacancy: 18.68%
• YTD Abs: (72,948) SF
• Lease Rate (FSG): $28.13
Suburban
• Vacancy: 18.28%
• YTD Abs: (363,167) SF
• Lease Rate (FSG): $25.13
3rd Quarter Transactions
Sale
583 W eBay Way
Canyon School District 241,095 SF
Transaction Date: 08/20/2024
Sale
384 S 400 W
Conservative Tax 41,742 SF
Transaction Date: 08/06/2024
Expansion
2000 W Ashton Blvd
Sales Rabbit 25,144 SF
Transaction Date: 08/23/2024
Sublease
1300 W Traverse Pkwy
Athelas 25,089 SF
Transaction Date: 09/06/2024
Lease 1100 W Traverse Pkwy
Lennar Homes of Utah 20,010 SF
Transaction Date: 09/26/2024
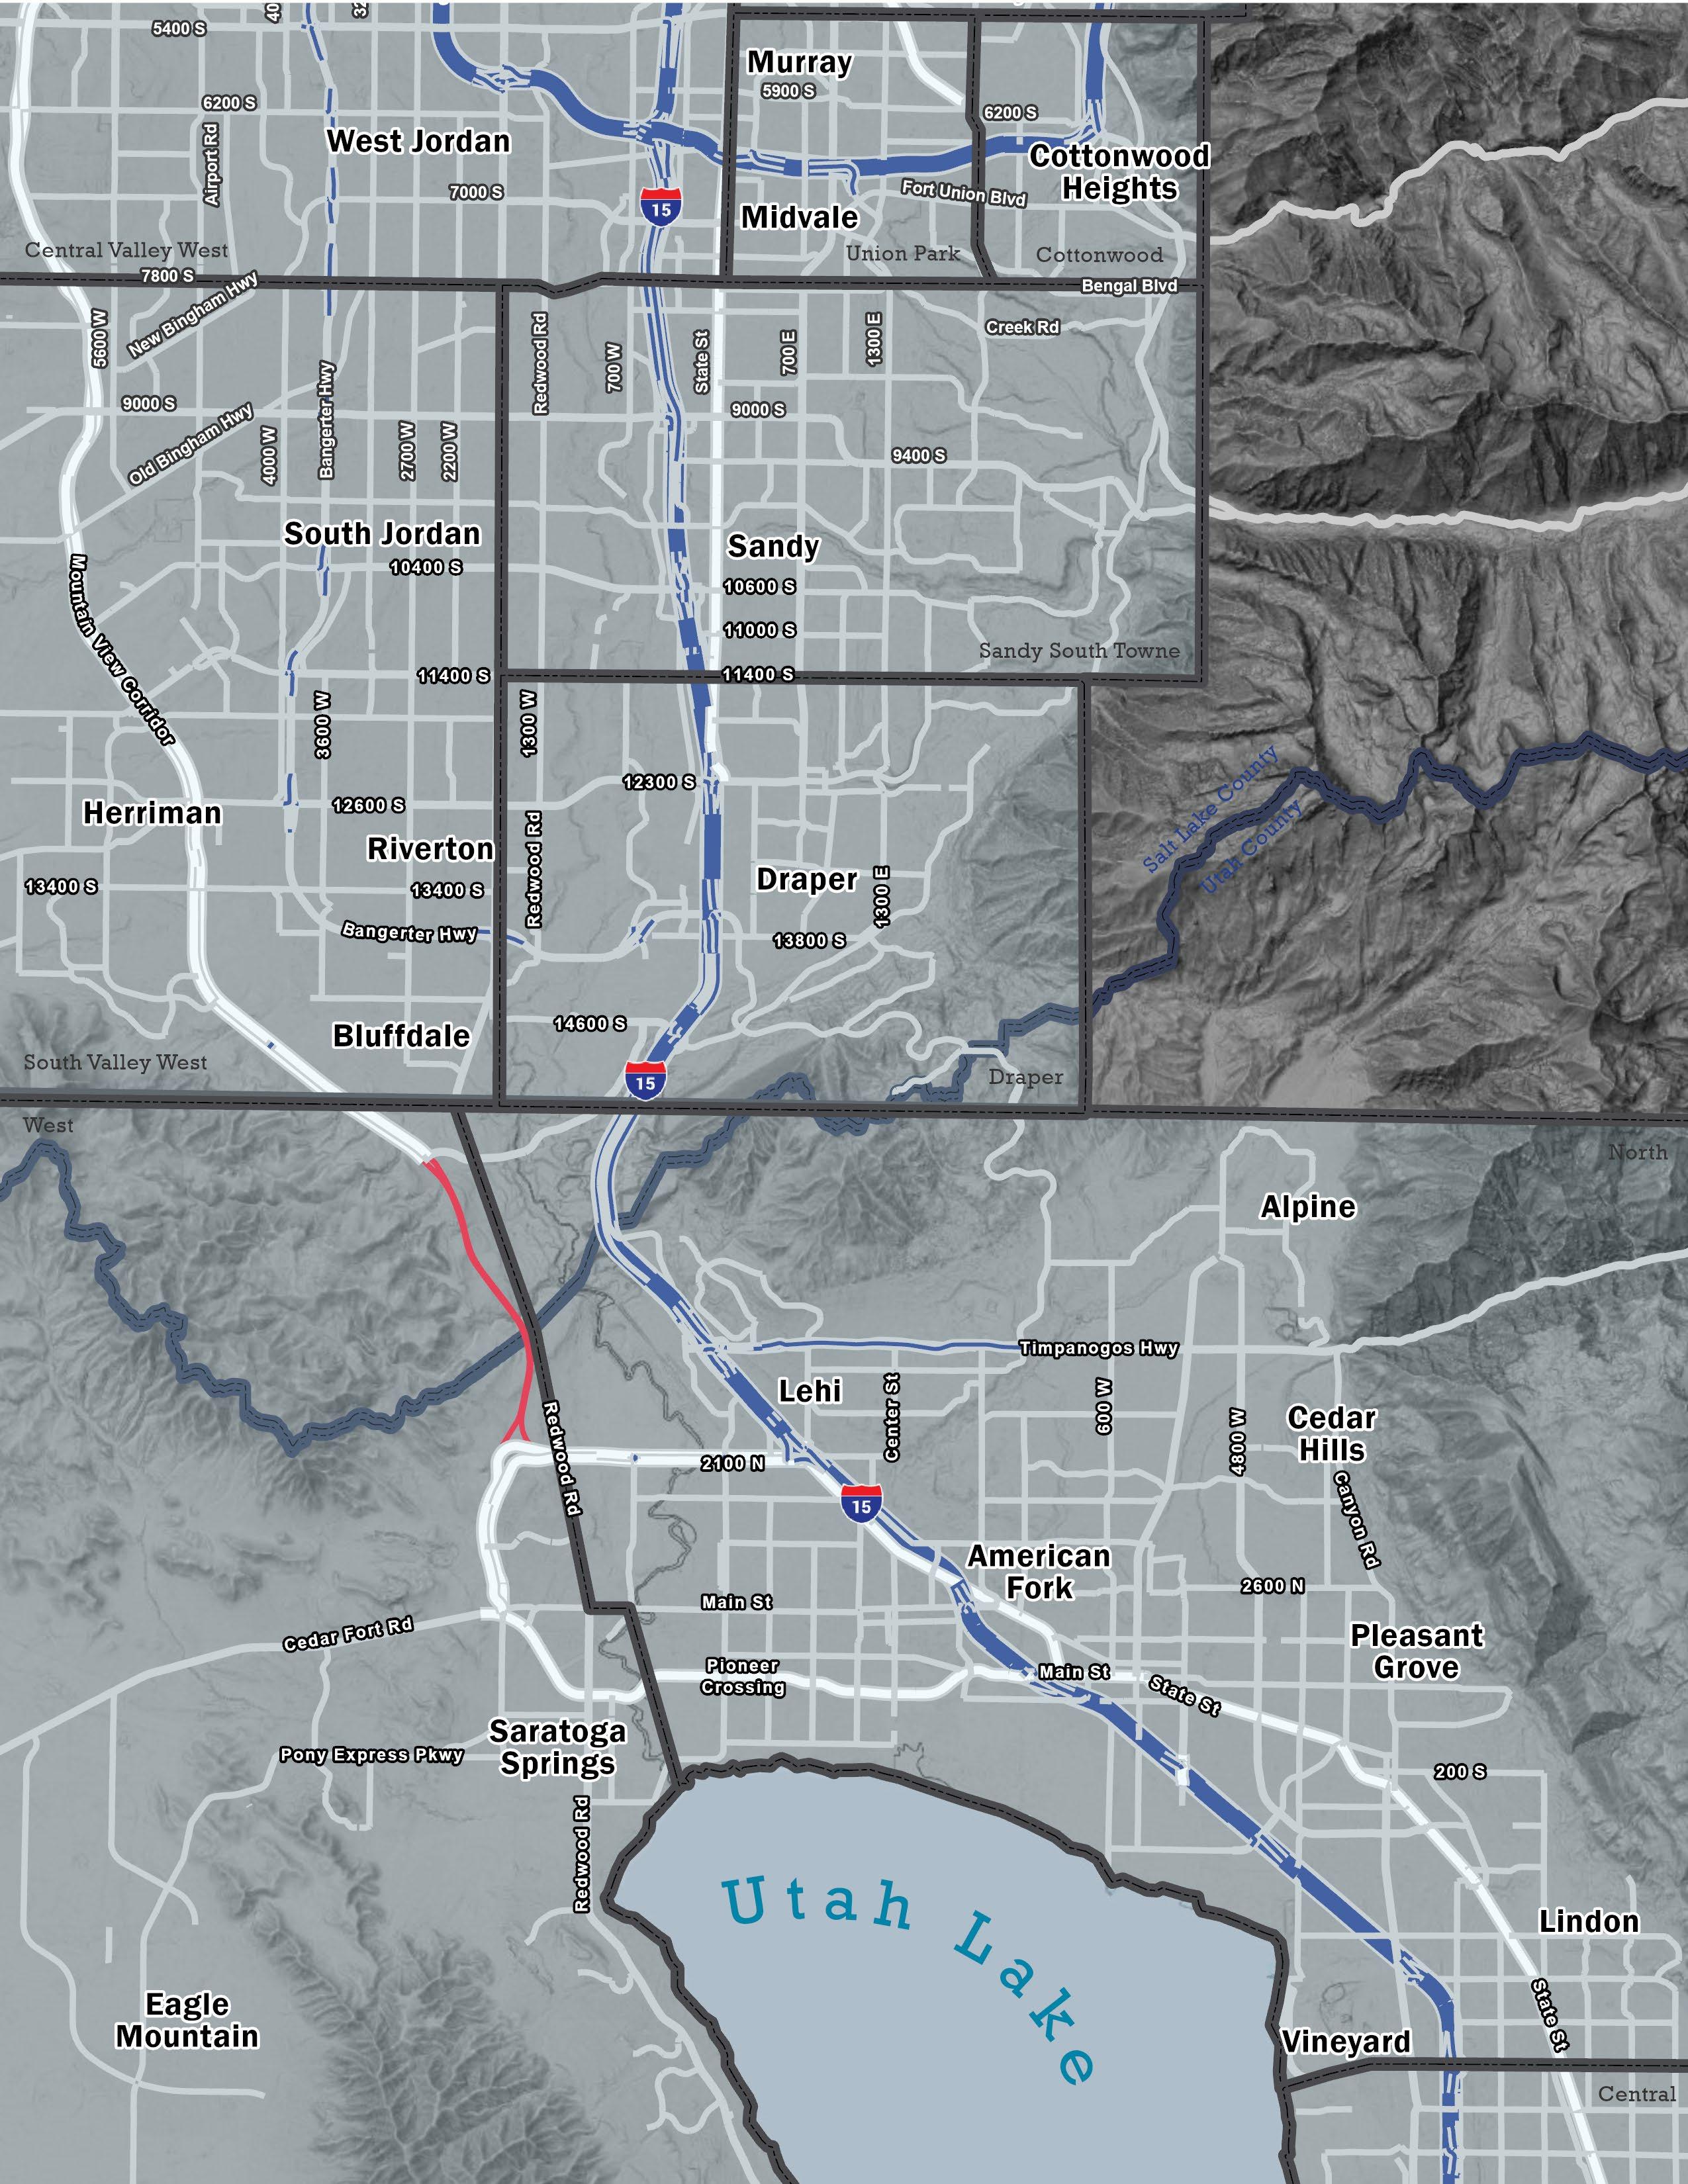
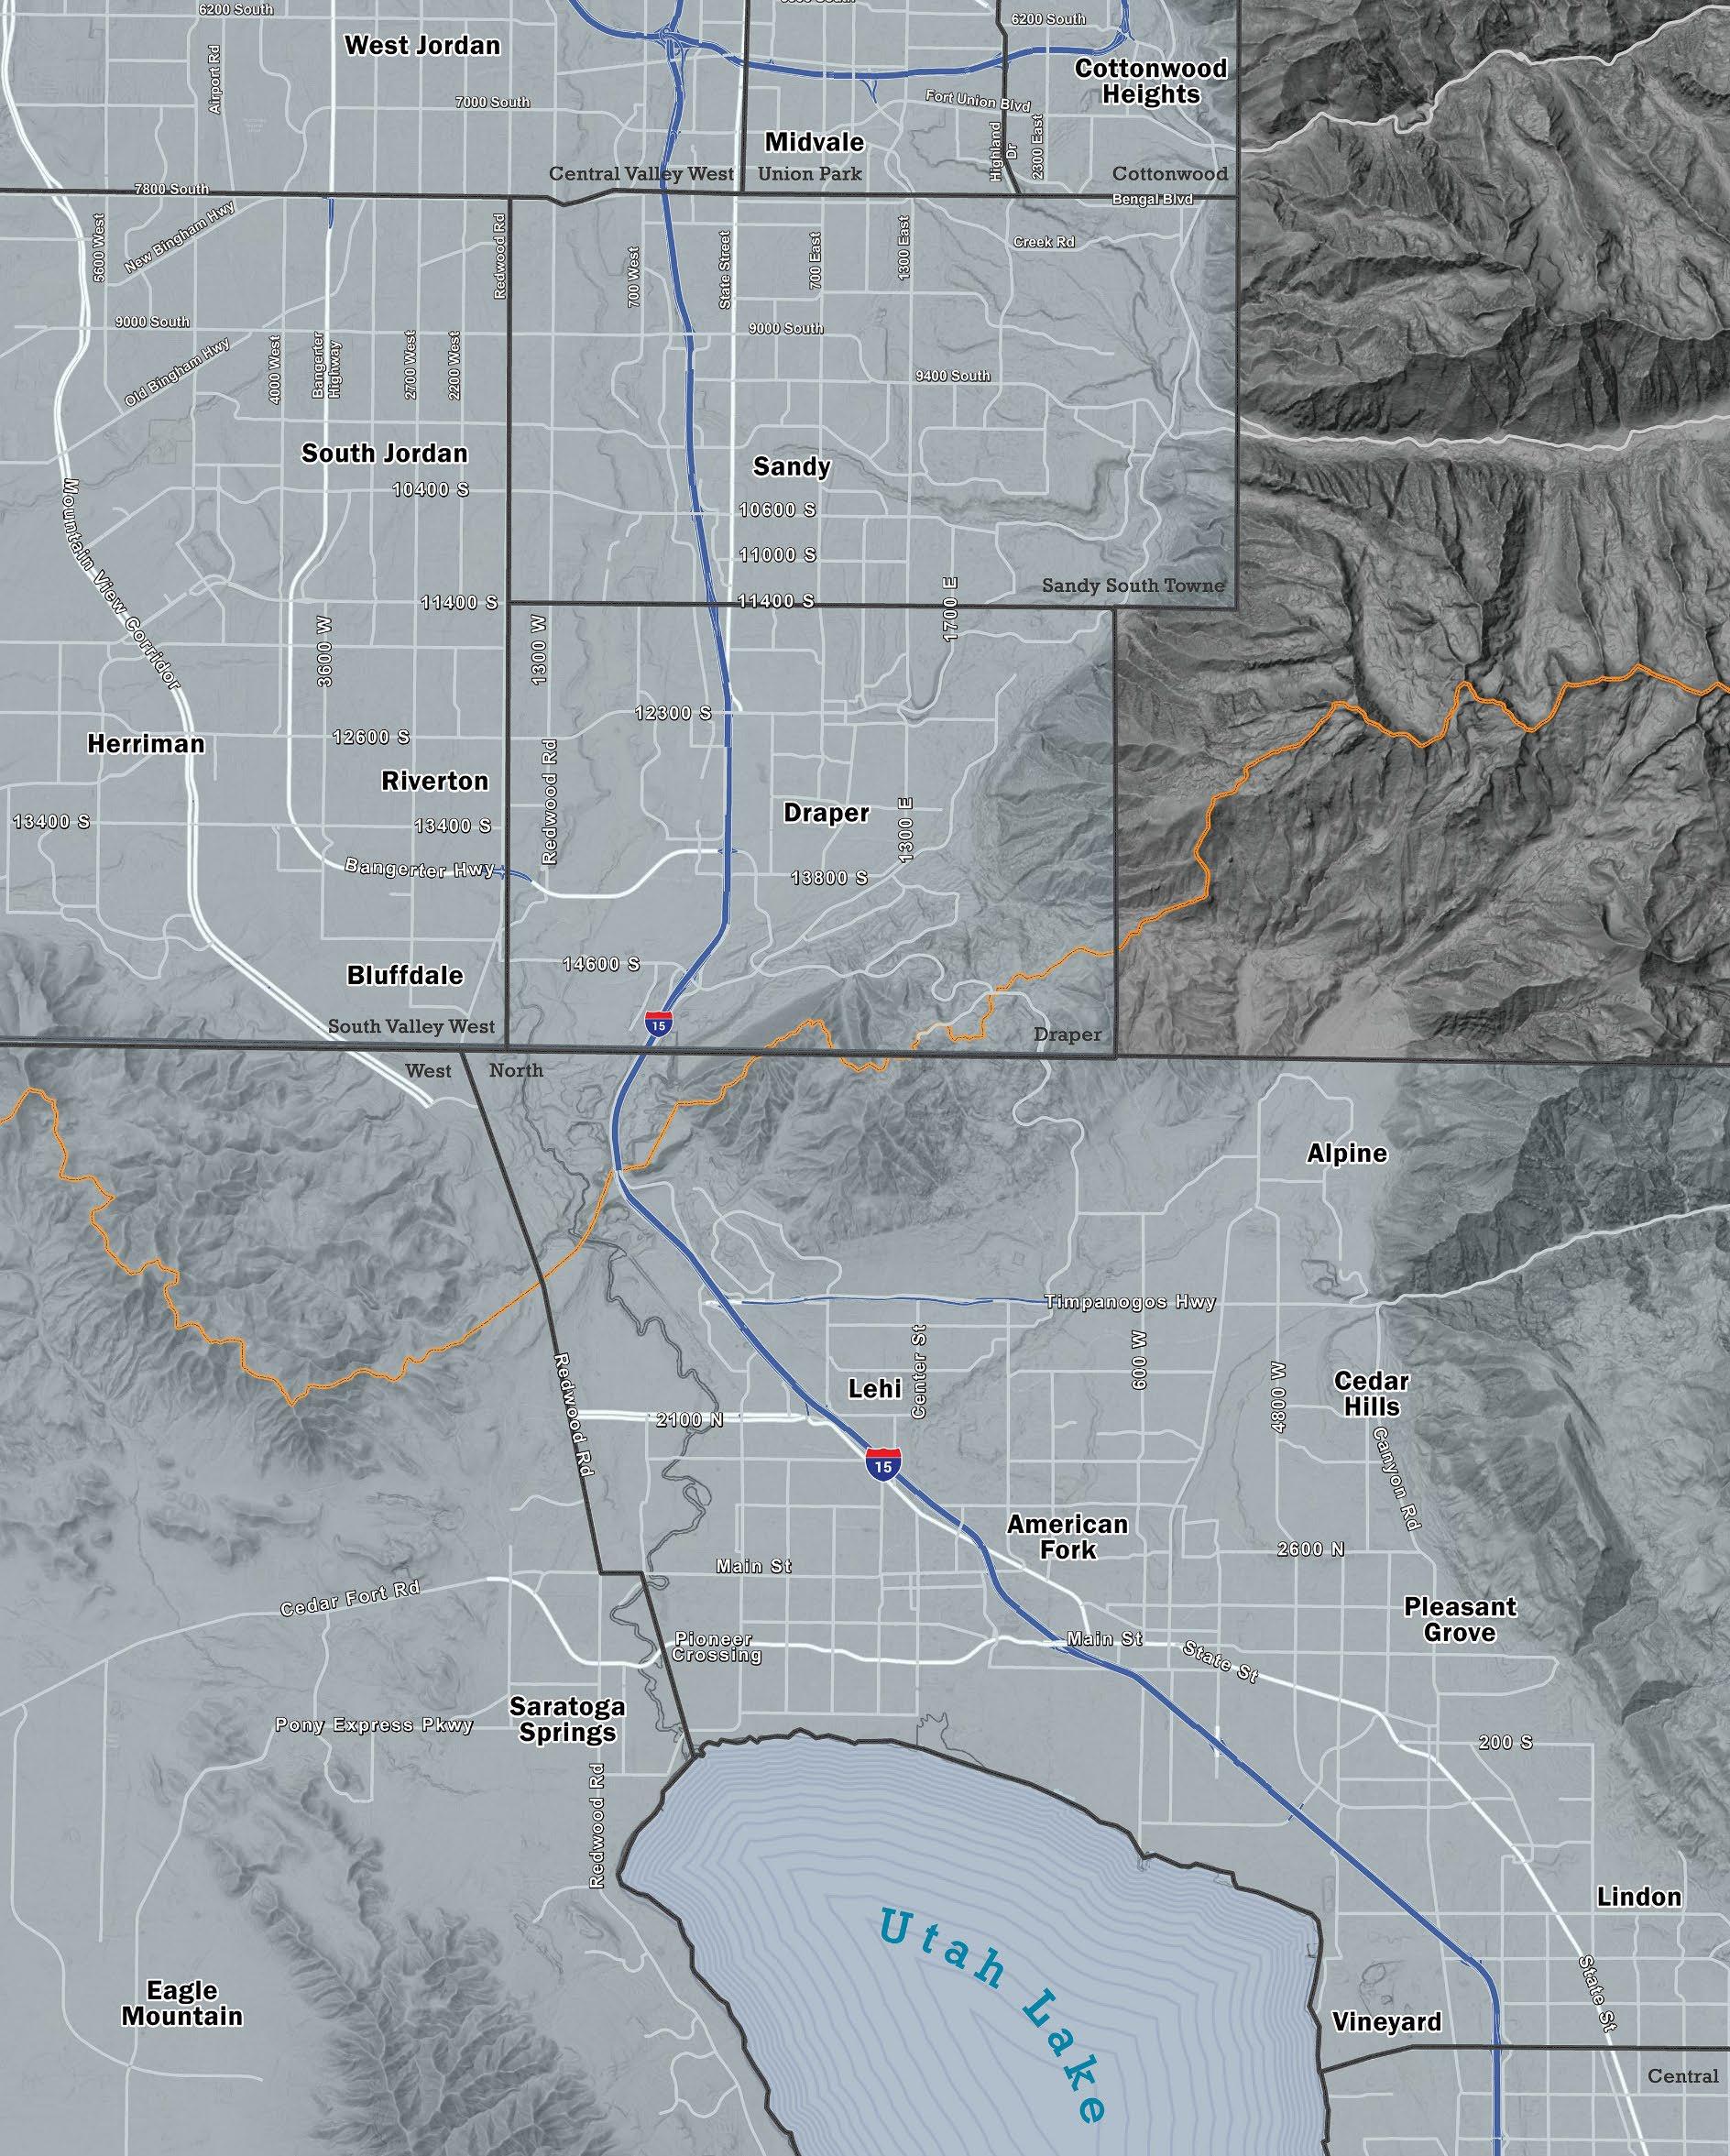
Currently, no projects are under construction at the Point of the Mountain, but this is expected to change with the recent announcement of The Point Phase 1 of the development will soon break ground, encompassing 6 3 million square feet This includes 2 3 million square feet of office space, 360,000 square feet dedicated to retail and entertainment, 380, 000 square feet of hospitality, and 3,200 multifamily units. The scale and mixed-use nature of this project are set to significantly impact the region's growth trajectory.
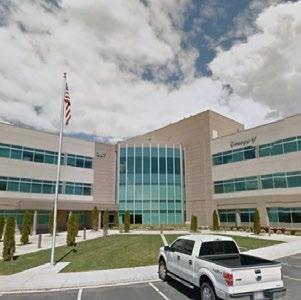
Utah County’s office market had a resilient third quarter in the face of everevolving market conditions While new construction slowed, with just a single 24,000 square-foot medical building breaking ground, developers continued to focus on stable, high-demand medical office projects. Asking lease rates held steady, especially in the North quadrant, where Class A space recorded the highest lease rates While overall absorption was negative, key properties in the North quadrant, including Traverse Ridge Center I and Canopy V, brought strong positive absorption Vacancy rates rose moderately to 12 71 percent in a market strategically positioned for future growth as tenants and developers navigate the current landscape with cautious optimism
Two medical office buildings near the new Primary Children's Hospital in Lehi reached completion this quarter, while just one medical facility in Eagle Mountain broke ground, bringing the total down from 68,000 square feet of construction to just 24,000 square feet currently Developers see medical office projects as more stable investments during uncertain times, as healthcare space is consistently in demand Thanks to high vacancy rates and ongoing uncertainty, expect developers to postpone any new projects until existing spaces see improved occupancy
Avg. Asking Lease Rates
The overall asking lease rate for office space in Utah County averaged $24.33 full-service gross (FSG), a slight decrease from the $24 37 FSG recorded at the same time last year. The North quadrant recorded the highest rates with Class A office space reaching $27.13 FSG, elevating the overall quadrant average to $25.38 FSG. This minor $0 04 year-over-year decrease underscores the market's stability and an enduring demand for quality office space, particularly in the North quadrant.
Absorption
Utah County saw 138,462 square feet of negative absorption this quarter, bringing yearto-date absorption to negative 60,638 square feet thanks to 143,725 square feet of negative absorption in Class A properties in the North quadrant alone. However, the North quadrant also saw the most positive absorption, with Traverse Ridge Center I adding 38,930 square feet and Canopy V adding 17,667 square feet to the total.
Vacancy
Overall direct office vacancy in Utah County increased 1.02 percent quarter-over-quarter and 1 68 percent year-over-year, reaching 12 71 percent by the end of the quarter. In contrast, sublease availability decreased by a slight 0.39 percent since last quarter to 5.51 percent. Tenants are opting for short-term sublease deals at lower rents, hoping for more clarity and certainty in the coming year.
500,000 1,000,000 1,500,000
Top Construction Projects
Overall Market Totals
Market Activity
Utah County North Direct Vacancy Rate: 10.25% YTD Absorption: (45,560) SF Lease Rate: $25.38 FS
Utah County West
Direct Vacancy Rate: 0.00%
YTD Absorption: 0 SF
Lease Rate: $0.00 FS
Utah County Central
Absorption: (15,419) SF
Rate: $23.59 FS
Utah County South Direct Vacancy Rate: 18.60% YTD Absorption: +341 SF Lease Rate: $21.38 FS
Industrial 24Q3
Headline
Utah County is navigating a stable yet evolving industrial market Construction activity rebounded slightly this quarter as developers took a cautious yet strategic approach, and leasing activity remained strong Vacancy rates decreased in response to increased leasing in key areas, while absorption figures reflect continued demand for large space As the market stabilizes, developers are closely monitoring demand when planning new developments, setting the stage for sustainable growth instead of rapid expansion heading into 2025.
Current Market Indicators
Historic Comparison Construction
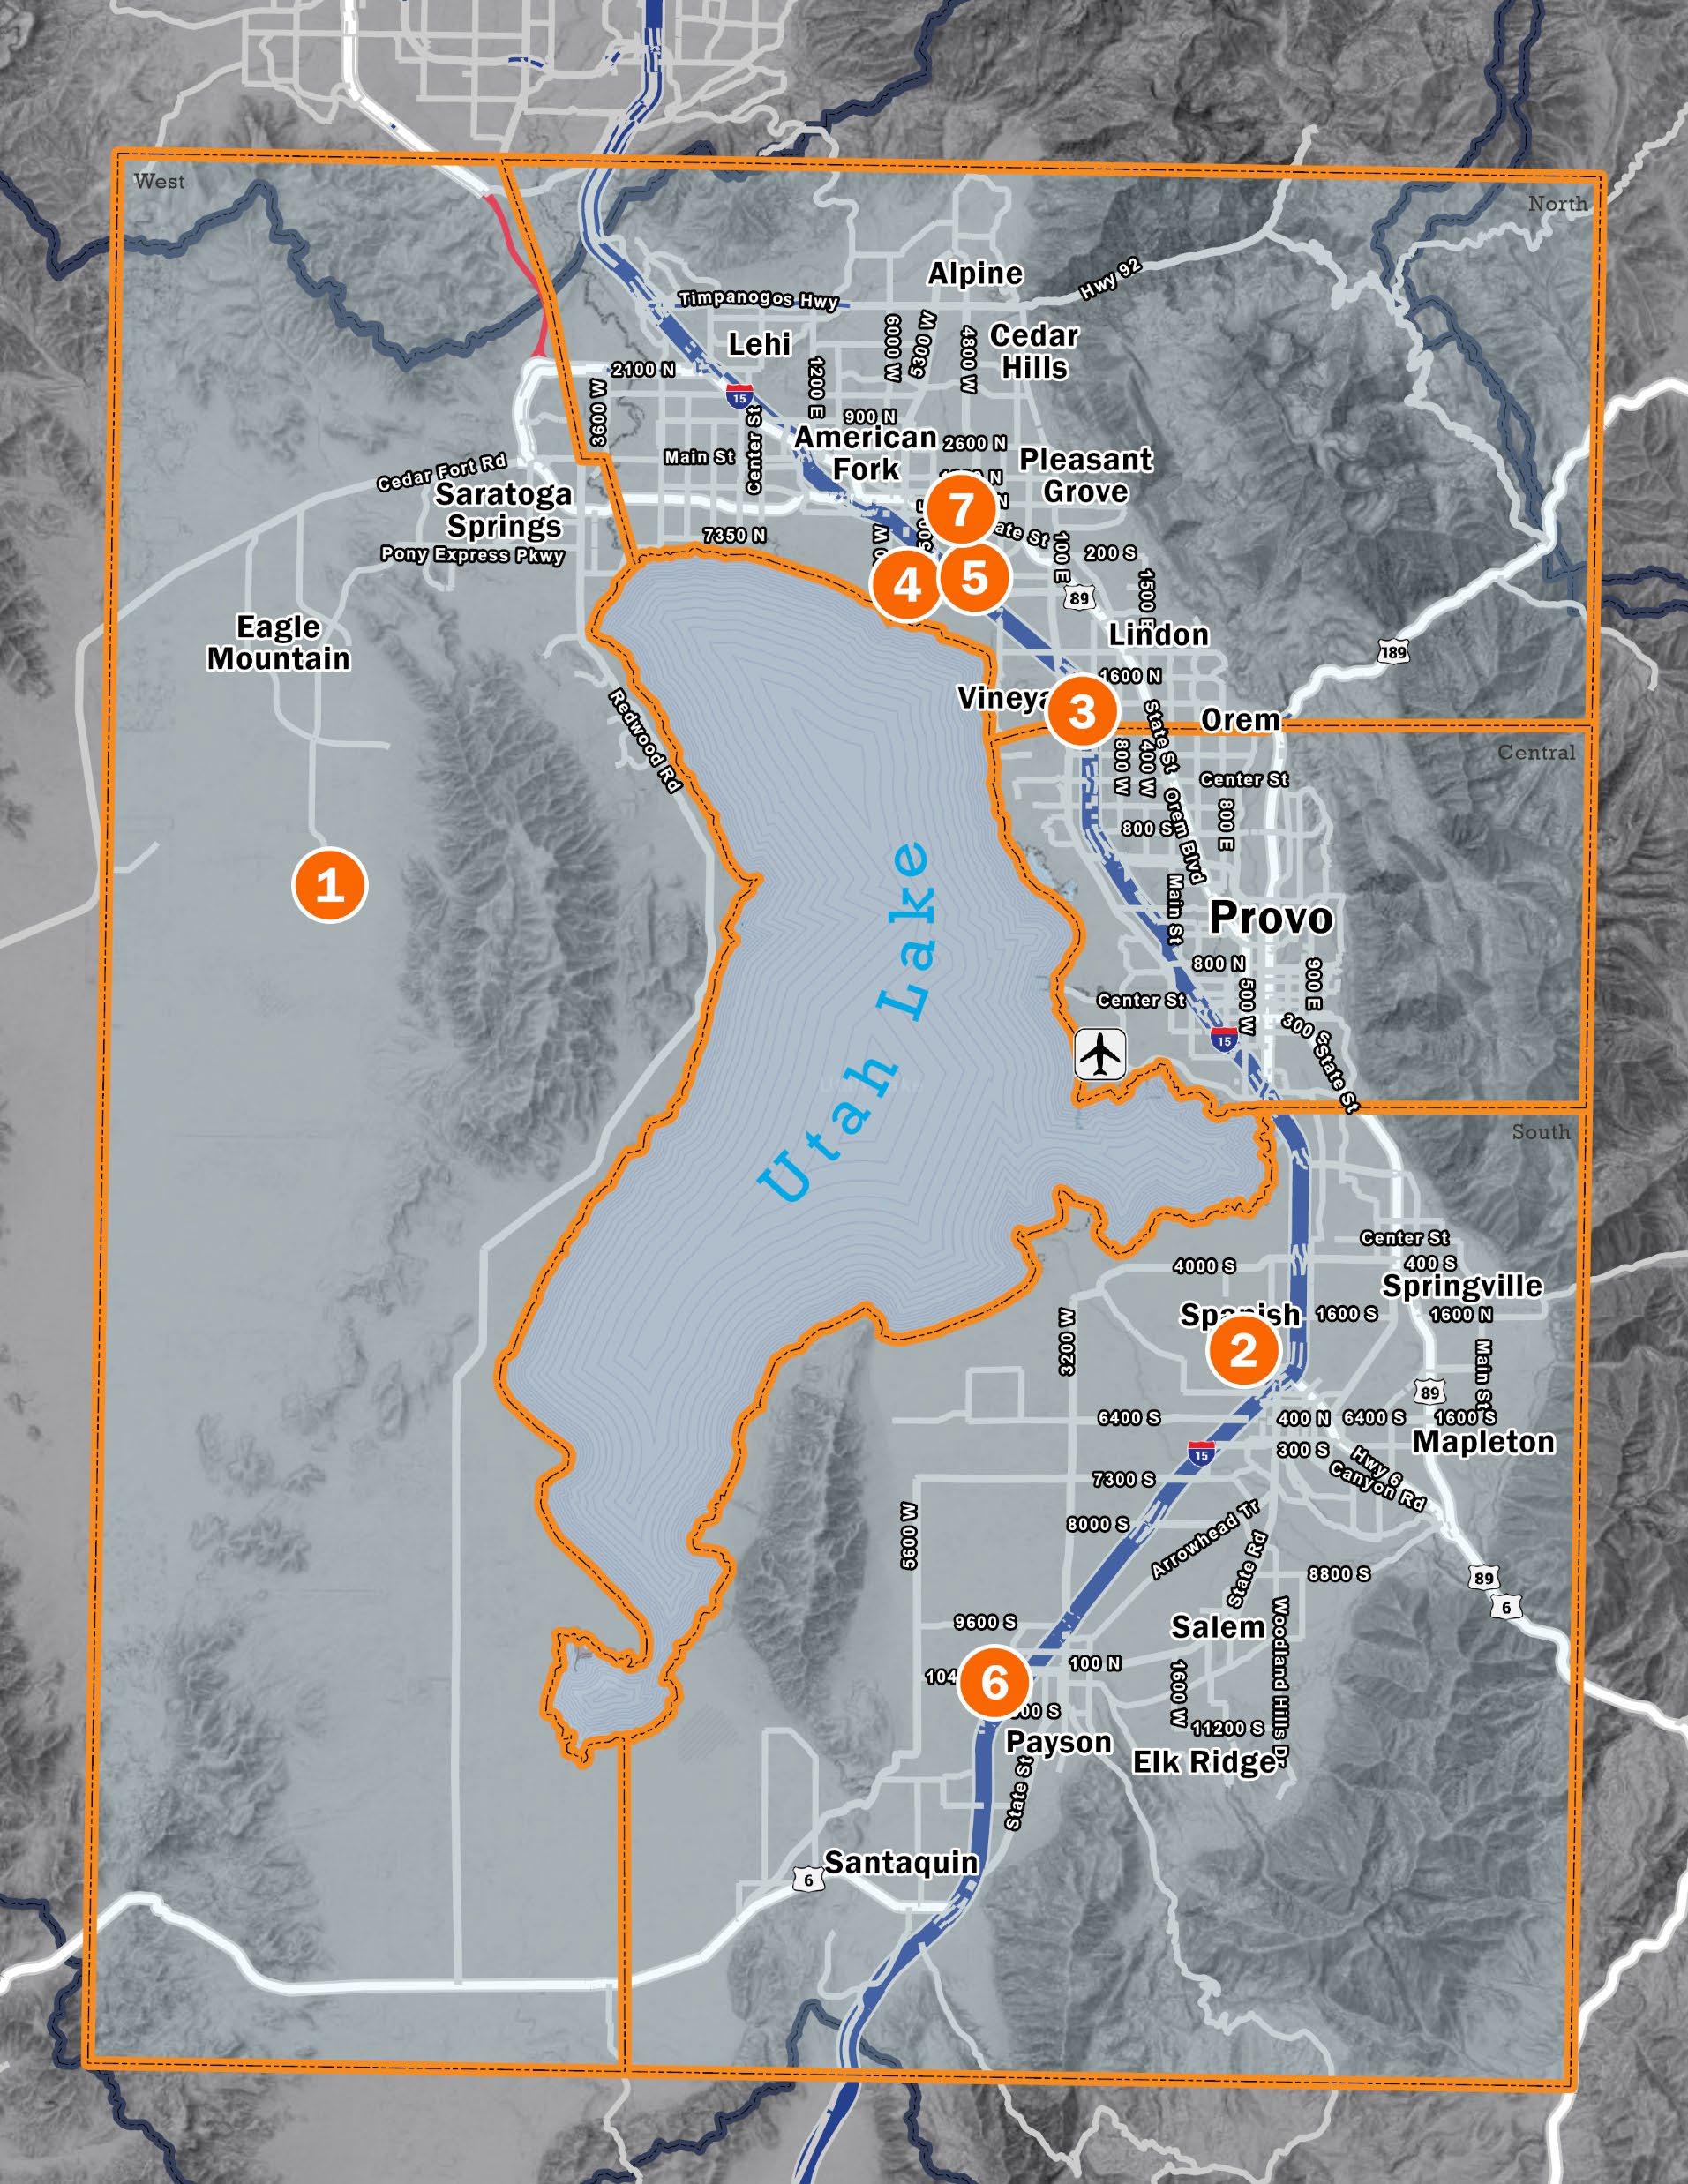
Utah County closed the quarter with 2, 994, 737 square feet of industrial construction underway, compared to 2,248,289 square feet last quarter and 3,775,820 square feet at the same time last year While several projects in the planning stages will eventually increase market inventory, reflecting growing confidence, construction is not expected to begin until early 2025. Developers are closely tracking market conditions and will move forward when pre-leasing activity, land costs and construction expenses are more optimal to ensure future projects are sustainable
Avg. Asking Lease Rates
Lease rates across Utah County's industrial market have remained relatively consistent, reaching an overall average of $0.96 NNN at the end of the third quarter, a $0.01 increase year-over-year. The North quadrant reached a high of $1 10 NNN, driven by the strong demand for quality space, while smaller spaces, particularly those under 20,000 square feet, reached a high $1.13 NNN county-wide. While limited availability of new space has created some relatively insignificant upward pressure on lease rates, new developments will likely have a shortterm impact but not drastically change overall dynamics
Continued vacancy in a few larger developments will stabilize lease rates through the end of 2025.
Absorption
Year-to-date total industrial absorption reached 1,147,638 square feet in Utah County thanks to 646,175 square feet of positive absorption this quarter Spaces over 100, 000 square feet in size contributed 523,372 square feet to the quarterly total thanks to a few major transactions: eSupplements leased nearly 300, 000 square feet at Power House Industrial in Springville, Swig Production secured 44, 000 square feet at New Vista Building 1 in Provo, and The Picklr and SCP Distributors leased 36, 000 and 22,000 square feet, respectively, at Northshore Commerce Park in Saratoga Springs Strong leasing activity in larger facilities highlights the ongoing demand for industrial space in strategic locations.
Vacancy
Overall direct industrial vacancy in Utah County decreased from 5.46 percent last quarter to 4.63 percent currently, compared to 3 18 percent at the same time last year The West quadrant still has the most vacancy despite leasing activity at Northshore Commerce Park in Saratoga Springs causing vacancy rates to decrease from 17 73 percent to 11.68 percent, followed by the South quadrant at 7.26 percent Larger spaces over 100, 000 square feet reached a county-wide high of a 7 33 percent direct vacancy, while smaller spaces under 20,000 square feet sat at just 1.08 percent Sublease availability also nearly doubled from 0.17 percent last quarter to 0.29 percent currently.
(100,000) 400,000 900,000 1,400,000 1,900,000
YTD Significant Sale Transactions
The Utah County industrial market remains a strong investment option, with 1,847,5951 square feet of industrial space changing hands in 2024 Investor demand is solid, driven by both owner-users and investors actively seeking industrial properties Despite this interest, opportunities are limited, as many current owners are holding onto their assets, recognizing the market’s future potential
3rd Quarter Transactions
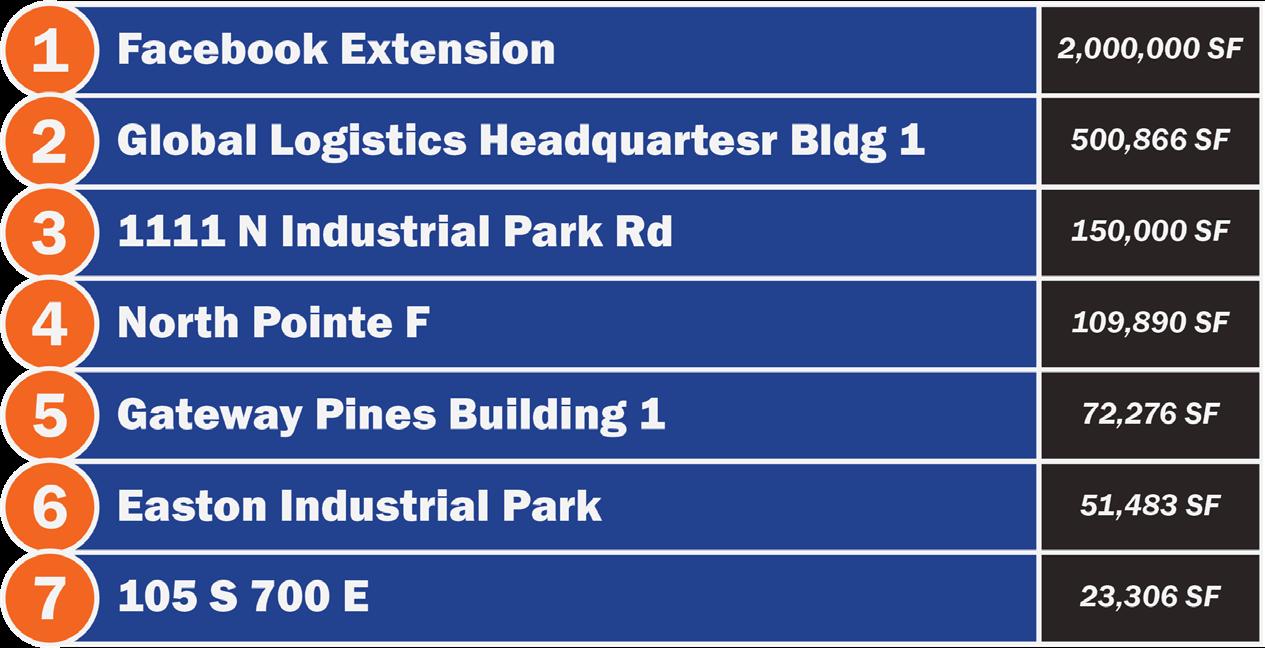
Top Construction Projects
Market Overview
Overall Market Totals
Market Activity
Utah County North
Direct Vacancy Rate: 2.00%
YTD Absorption: +669,188 SF
Lease Rate: $1.10 NNN
Utah County West
Direct Vacancy Rate: 11.68%
YTD Absorption: +132,114 SF
Lease Rate: $0.95 NNN
Utah County Central
Direct Vacancy Rate: 3.86%
YTD Absorption: (109,591) SF
Lease Rate: $0.97 NNN
Utah County South
Direct Vacancy Rate: 7.26%
YTD Absorption: +455,927 SF
Lease Rate: $0.94 NNN
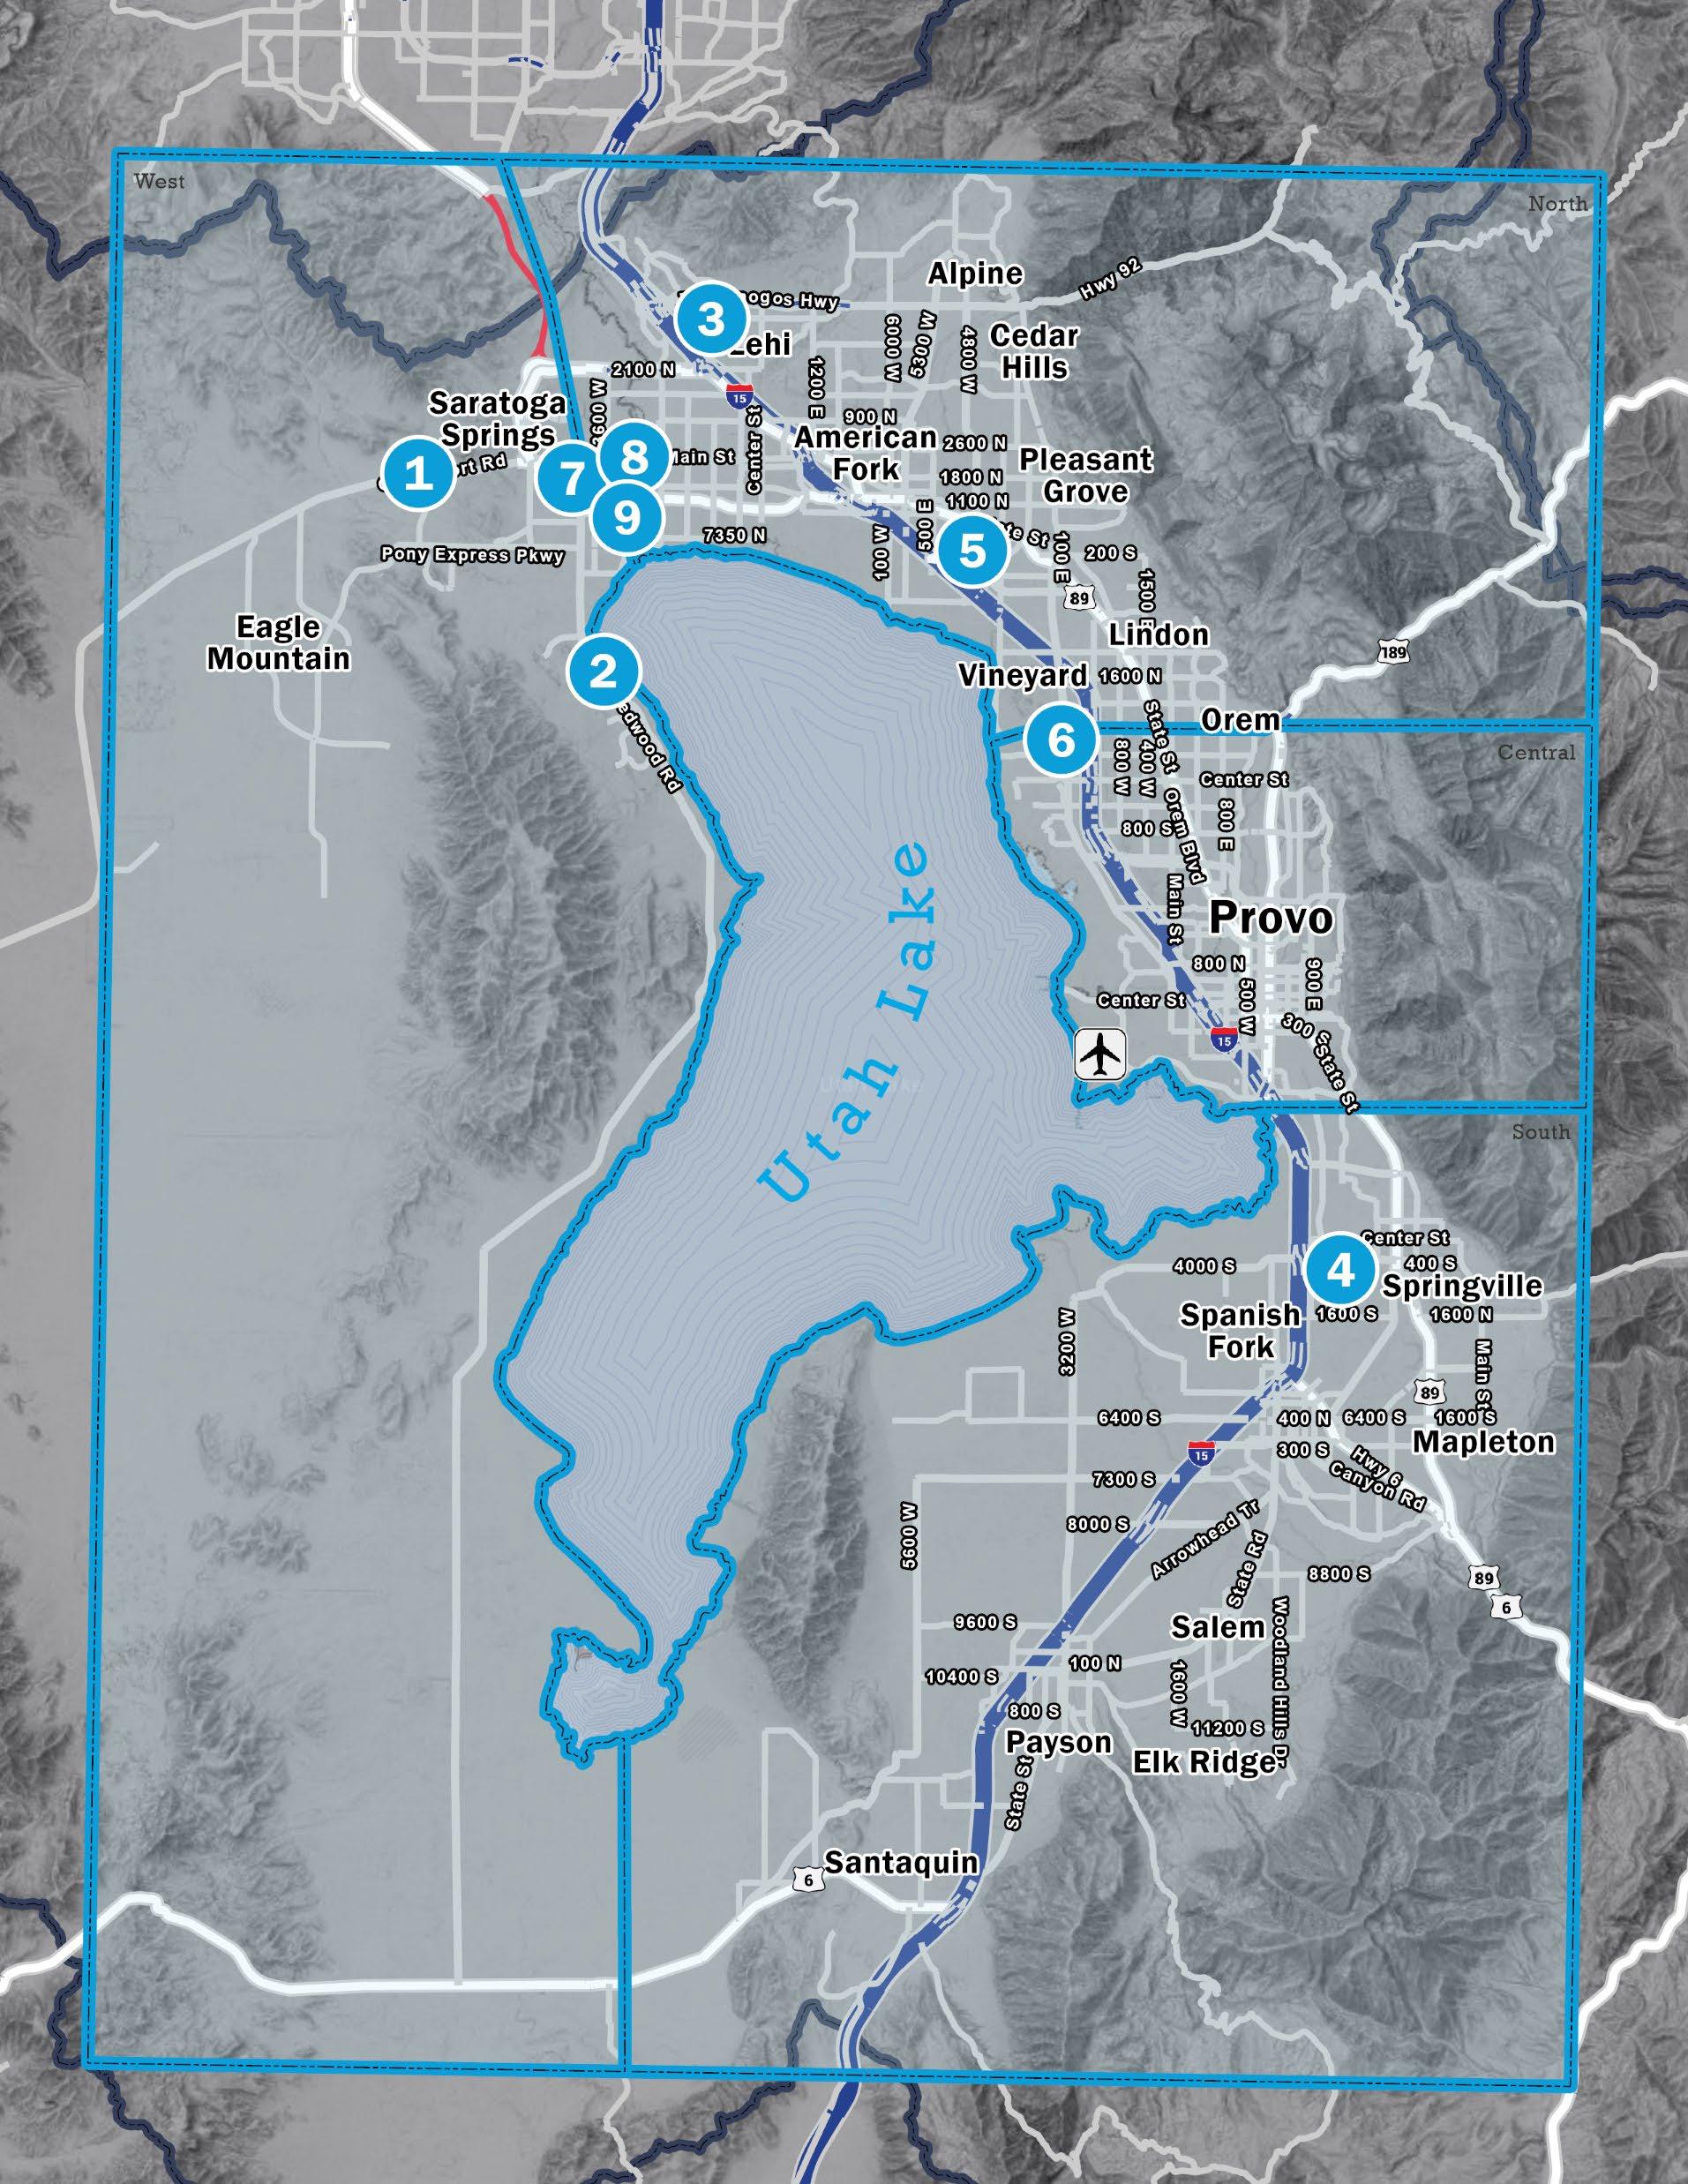
Headline
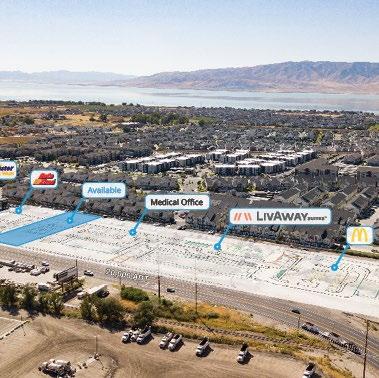
Utah County’s retail market continues to face a critical supply and demand imbalance with historically low vacancy rates and a scarcity of new construction Vacancy reached 2 47 percent at the close of the third quarter, a slight but necessary increase year-over-year. However, with no new space delivered in 2024 and only 405,772 square feet under construction unchanged since last quarter tenants are struggling to find available options Lease rates have surged, especially in newly developed areas like the West quadrant Unless construction increases significantly, the market will continue to heavily favor landlords, keeping competition high for tenants struggling to secure leases in the near term.
Current Market Indicators
Historic Comparison Construction
Retail construction activity in Utah County held steady at 405,772 square feet at the end of the third quarter, an increase of 138,240 square feet year-over-year but unchanged since last quarter No new retail projects have yet been delivered to the market in 2024 as developers struggle to make new developments financially feasible. With vacancy rates below 3 percent and no new space coming online, competition among retail tenants trying to secure available space is tight.
3rd Quarter Transactions
Sale
391 N Geneva Rd
Vineyard Hotel Holdings 83,418 SF
Transaction Date: 09/18/2024
Renewal
309 E University Pkwy Best Buy 30,729 SF
Transaction Date: 07/01/2024
Sale 1355 W 800 N Orem 800 North 11,413 SF
Transaction Date: 07/10/2024
Prelease
333 E Crossroads Blvd Wurst Smokehaus 3,572 SF
Transaction Date: 09/14/2024
Lease
2250 N University Pkwy
TCAV Investments 3,428 SF
Transaction Date: 09/23/2024
Avg. Asking Lease Rates
Overall average asking retail lease rates in Utah County climbed to $27 57 per square foot NNN by the end of the third quarter, a significant increase from the $23.60 NNN recorded at the same time last year New construction in rapidly growing areas like Saratoga Springs and Eagle Mountain brought average asking lease rates in the West quadrant to a high of $37 69 NNN thanks to newly developed spaces with modern facilities and high visibility. Expect lease rates to continue rising as extremely low vacancy rates leave tenants with limited options.
Absorption
Utah County saw just 59,264 square feet of positive retail absorption this quarter, bringing year-to-date absorption to 56,508 square feet Despite reversing last quarter’s negative absorption, activity remains limited. A single building Carillon Retail Square in Orem accounted for more than half of the quarter’s absorption with 37,365 square feet between Office Depot, Minky Couture and Roxberry. Overall absorption will likely remain constrained with continued incremental increases as demand rises despite tight vacancy and a lack of new space
Vacancy
Total direct retail vacancy in Utah County reached 2 47 percent by the end of the third quarter, a slight increase from the 2.36 percent recorded last quarter and the 2.09 percent recorded at the same time last year This minimal rise offers a much-needed adjustment to a market plagued by historically low vacancy The current lack of available space will continue to drive competition and keep vacancy rates tight thanks to limited retail construction for the foreseeable future
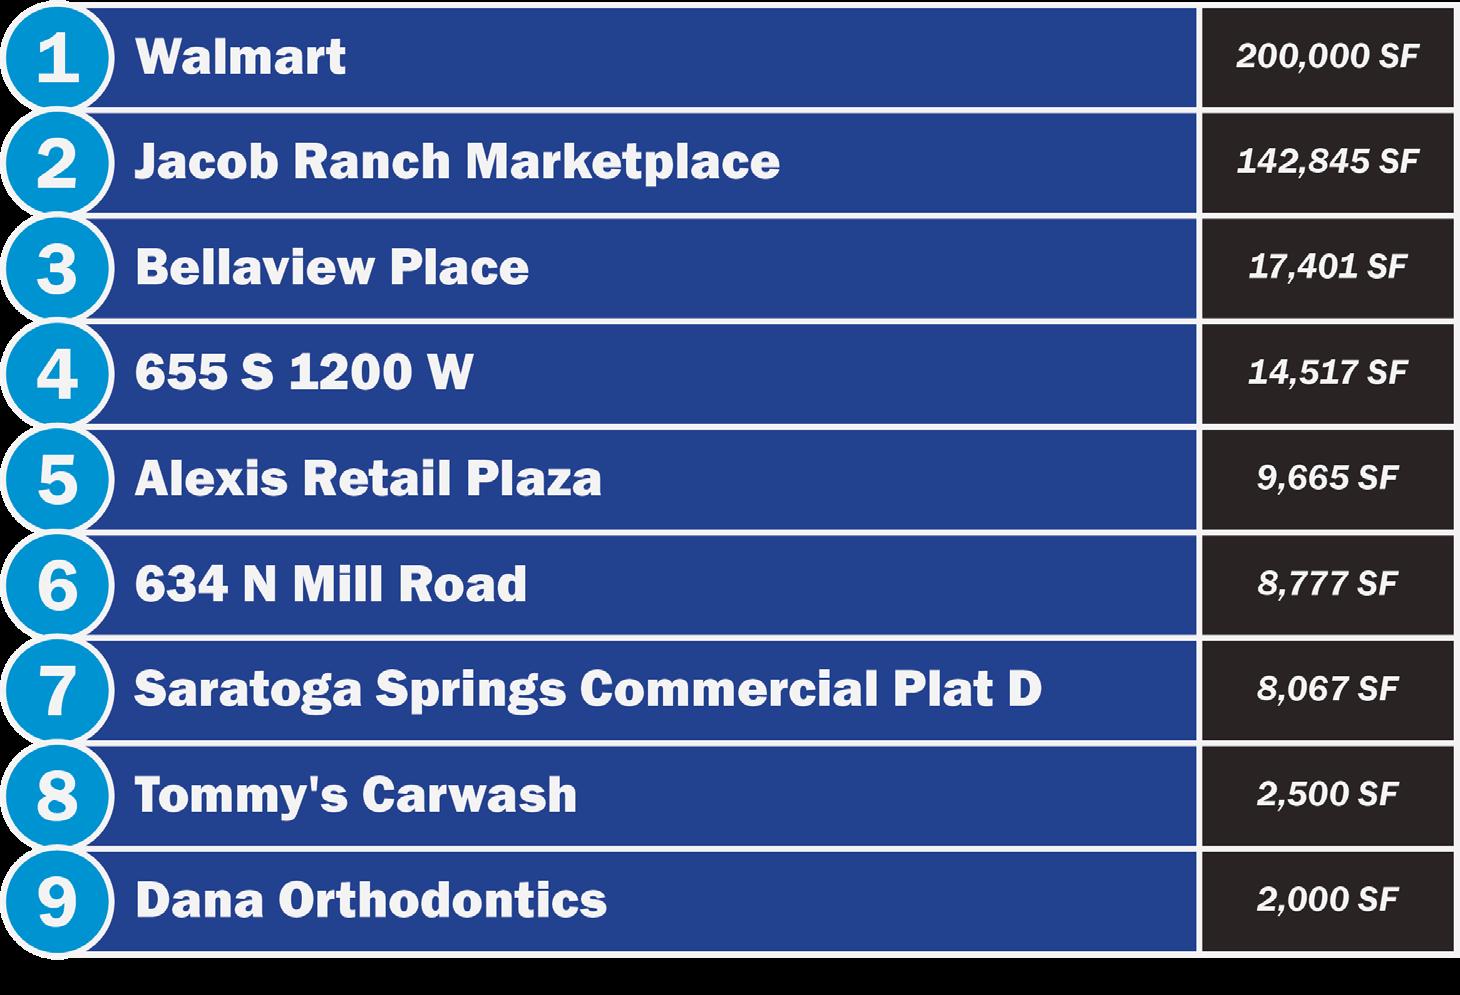
Top Construction Projects
Overall Market Totals
Market Activity
Utah County North Vacancy Rate: 1.07% YTD Absorption: +30,441 SF Lease Rate: $31.44 NNN
Utah County Central Vacancy Rate: 3.06% YTD Absorption: +119,940 SF Lease Rate: $21.72 NNN
Utah County West
Vacancy Rate: 2.38%
YTD Absorption: (7,825) SF
Lease Rate: $37.69 NNN
Utah County South Vacancy Rate: 3.47%
YTD Absorption: (86,048) SF Lease Rate: $30.23 NNN