Luxury Real Estate Market Research


• Total Las Vegas sales changed by -5.4% year over year to 1,407.

• The highest sale price changed by -24.2% year over year from $25.00M to $18.95M, while the lowest sale price changed 0.0% year over year to $1.00M.
• Average days on market for Total Las Vegas changed +6.9% year over year to 53 days.
• Total Las Vegas average price changed +27.8% year over year to $3.52M, and the median price changed +14.6% year over year to $3.18M.
Total Properties Sold
1,407
-5.4% Year Over Year
Average Price $3.52M
+27.8% Year Over Year
Highest Sale $18.95M
-24.2% Year Over Year
Days on Market
53 +6.9% Year Over Year
Median Price $3.18M
+14.6% Year Over Year
Lowest Sale $1.00M 0.0% Year Over Year
• Anthem Country Club sales changed by -25.3% year over year to 65.

• The highest sale price changed by -17.5% year over year from $10.00M to $8.25M, while the lowest sale price changed 0.0% year over year to $1.00M.
• Average days on market for Anthem Country Club changed -7.1% year over year to 35 days.
• Anthem Country Club average price changed +9.0% year over year to $2.08M, and the median price changed -15.9% year over year to $4.63M.
Total Properties Sold 65 -25.3% Year Over Year
Days on Market
35 -7.1% Year Over Year
Average Price $2.08M +9.0% Year Over Year
Median Price $4.63M -15.9% Year Over Year
Highest Sale $8.25M -17.5% Year Over Year
Lowest Sale $1.00M 0.0% Year Over Year
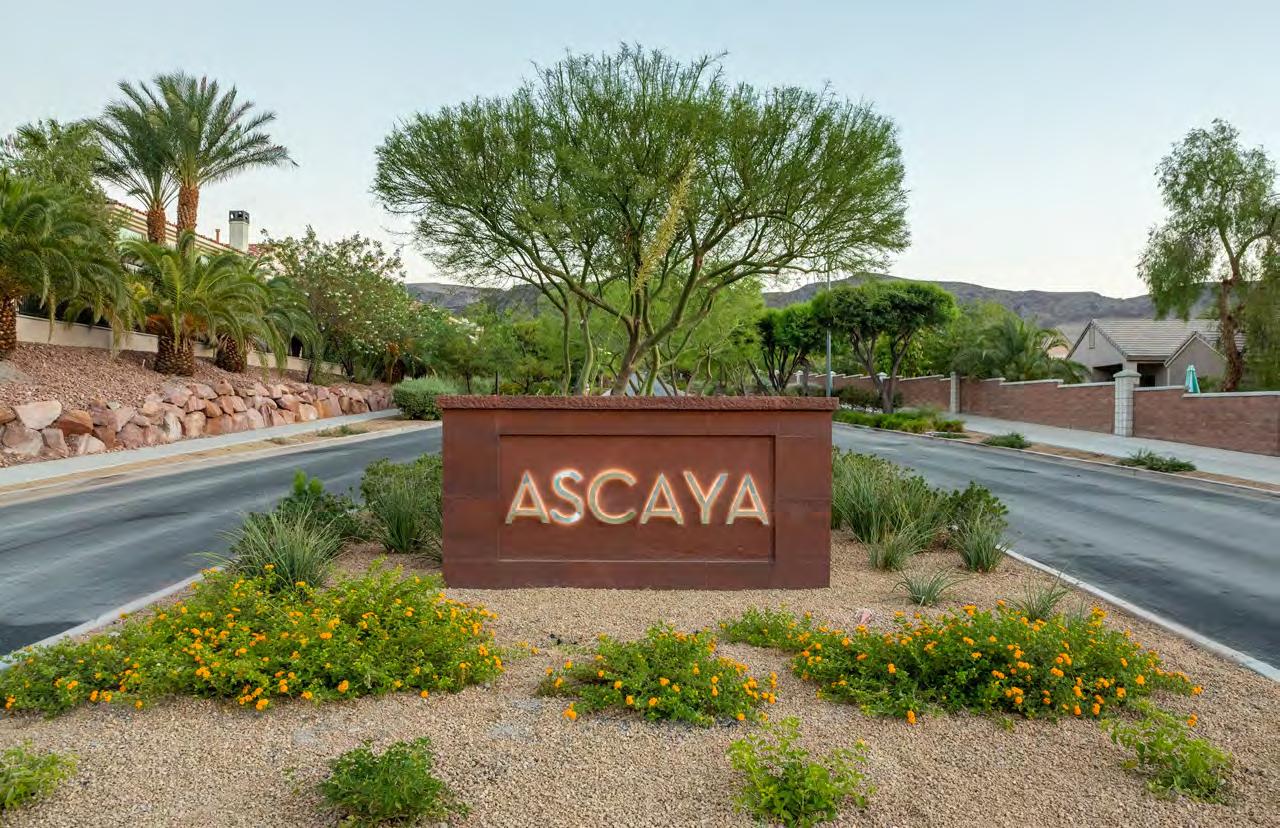
Annual 2022 • Anthem Country Club • Henderson The highest sale in this area was represented by a Douglas Elliman agent. This sale set a record for the highest Sale Price per Square Foot ever sold in the community.• Ascaya sales changed by -14.3% year over year to 6.
• The highest sale price changed by -37.9% year over year from $14.69M to $9.13M, while the lowest sale price changed +26.1% year over year to $5.80M.
• Average days on market for Ascaya changed +424.7% year over year to 127 days.
• Ascaya average price changed -12.8% year over year to $6.76M, and the median price changed -22.6% year over year to $7.46M.
Total Properties Sold
6 -14.3% Year Over Year
Days on Market
127 +424.7% Year Over Year
Average Price $6.76M -12.8% Year Over Year
Highest Sale $9.13M
-37.9% Year Over Year
Median Price $7.46M -22.6% Year Over Year
Lowest Sale $5.80M +26.1% Year Over Year
• Bellacere sales changed by -85.7% year over year to 1.
• The highest sale price changed by +20.6% year over year from $2.60M to $3.14M, while the lowest sale price changed +146.9% year over year to $3.14M.
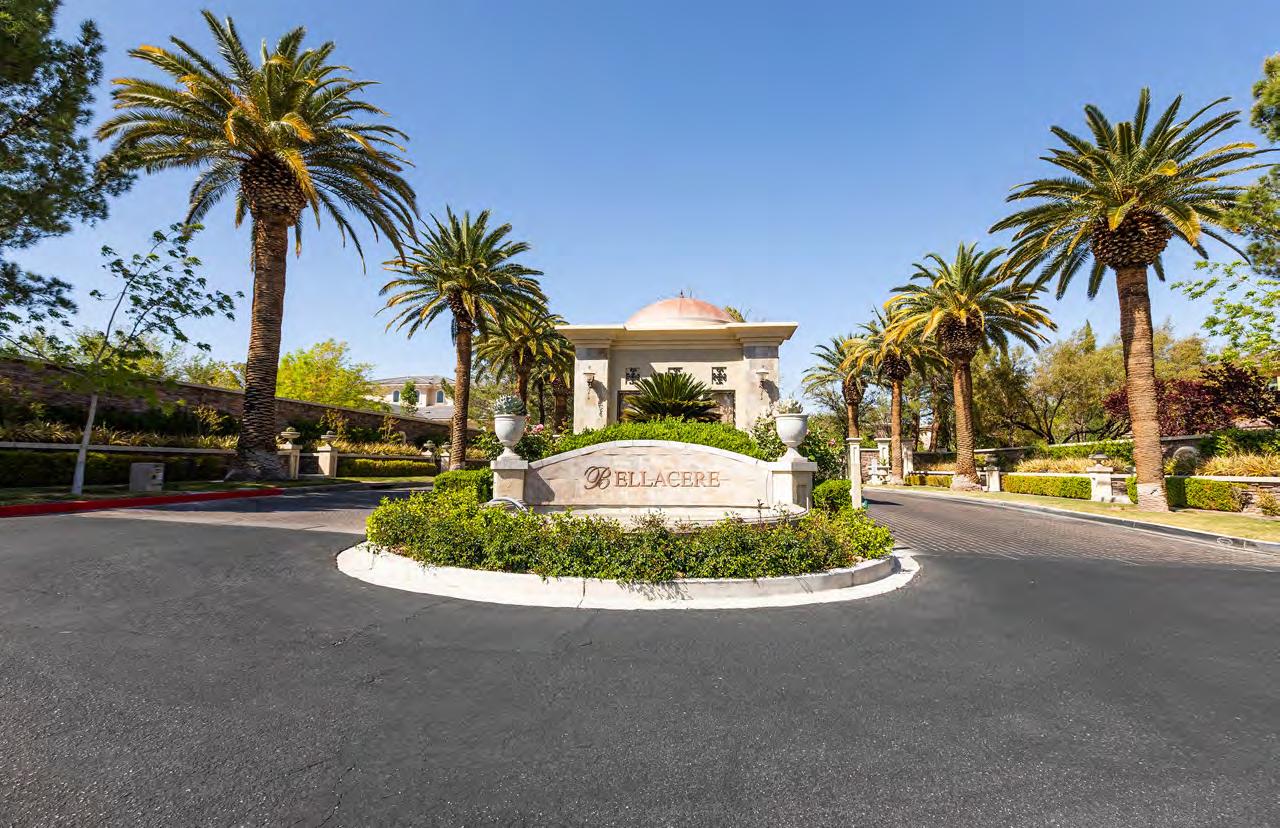
• Average days on market for Bellacere changed -41.4% year over year to 20 days.
• Bellacere average price changed +54.3% year over year to $3.14M, and the median price changed +62.0% year over year to $3.14M.
Total Properties Sold 1
-85.7% Year Over Year
Average Price $3.14M
+54.3% Year Over Year
Highest Sale $3.14M
+20.6% Year Over Year
Days on Market
20
-41.4% Year Over Year
Median Price $3.14M +62.0% Year Over Year
Lowest Sale $3.14M
+146.9% Year Over Year
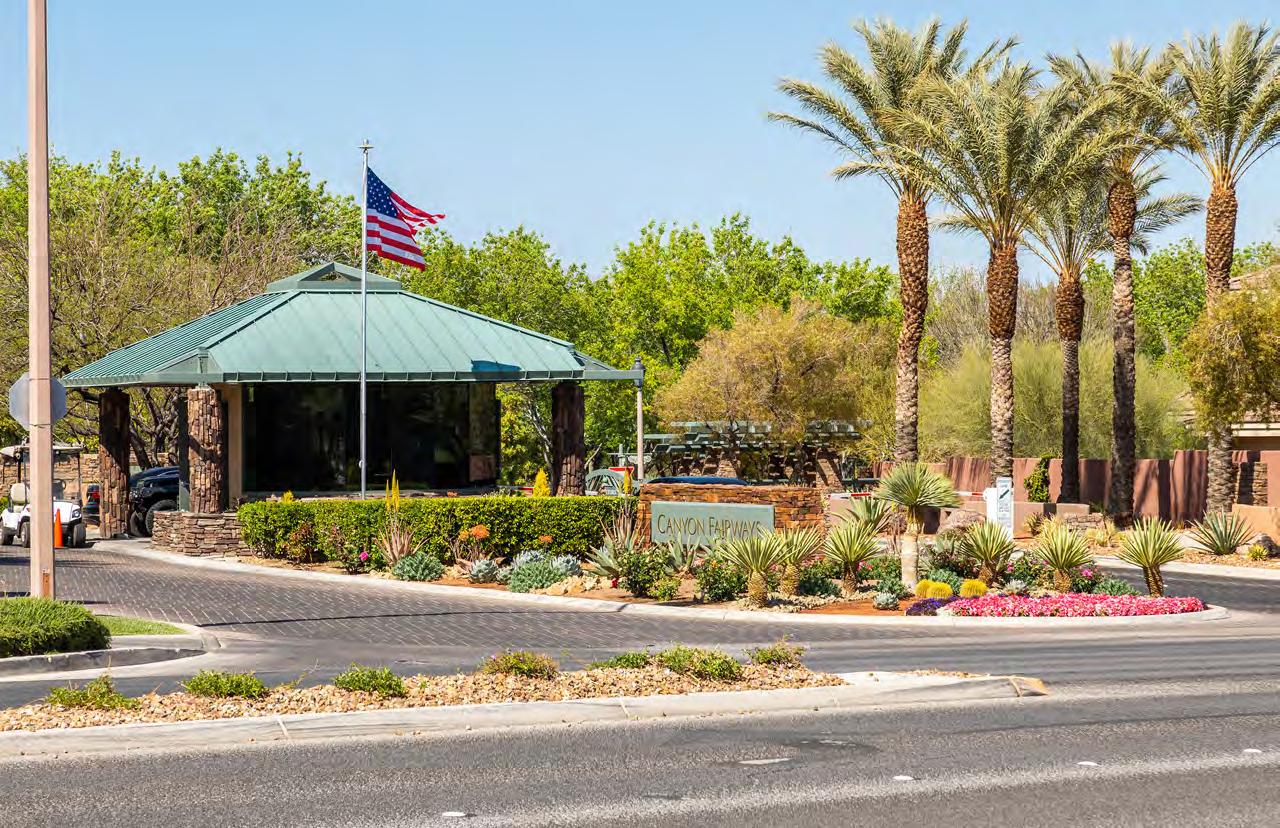
• Canyon Fairways sales changed by -64.7% year over year to 6.
• The highest sale price changed by -10.8% year over year from $3.70M to $3.30M, while the lowest sale price changed +31.8% year over year to $1.91M.
• Average days on market for Canyon Fairways changed +25.8% year over year to 48 days.
• Canyon Fairways average price changed +17.8% year over year to $2.72M, and the median price changed +1.2% year over year to $2.61M.
Total Properties Sold
6 -64.7% Year Over Year
Days on Market
48 +25.8% Year Over Year
Average Price $2.72M +17.8% Year Over Year
Highest Sale $3.30M
-10.8% Year Over Year
Median Price $2.61M +1.2% Year Over Year
Lowest Sale $1.91M +31.8% Year Over Year
• Canyon Gate sales changed by -28.6% year over year to 10.
• The highest sale price changed by +5.0% year over year from $2.40M to $2.52M, while the lowest sale price changed +2.5% year over year to $1.03M.
• Average days on market for Canyon Gate changed +43.6% year over year to 36 days.
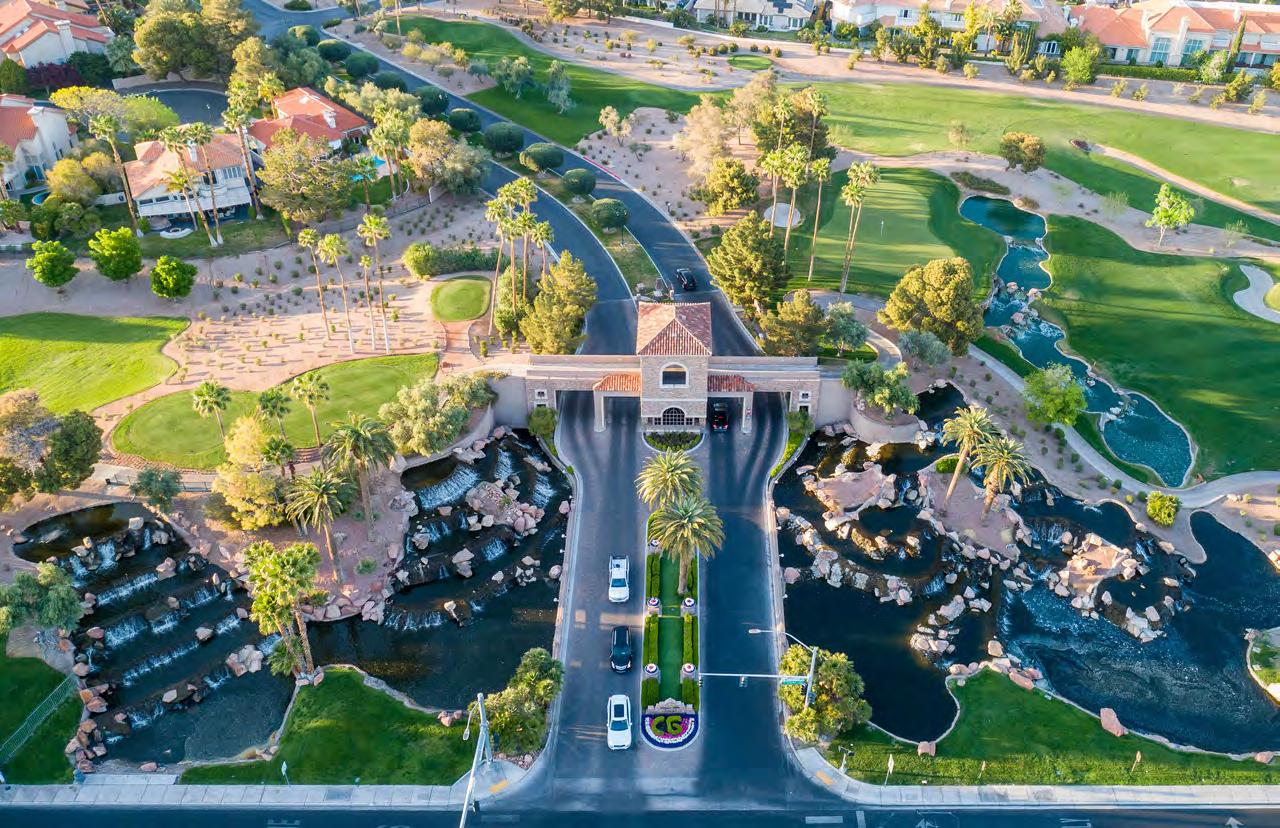
• Canyon Gate average price changed +0.8% year over year to $1.49M, and the median price changed +4.3% year over year to $1.77M.
Total Properties Sold 10 -28.6% Year Over Year
Days on Market
36 +43.6% Year Over Year
Average Price $1.49M +0.8% Year Over Year
Highest Sale $2.52M
+5.0% Year Over Year
Median Price $1.77M +4.3% Year Over Year
Lowest Sale $1.03M +2.5% Year Over Year
• Country Club Hills sales changed by -33.3% year over year to 4.
• The highest sale price changed by +54.9% year over year from $11.30M to $17.50M, while the lowest sale price changed +4.8% year over year to $1.10M.
• Average days on market for Country Club Hills changed +3.4% year over year to 54 days.
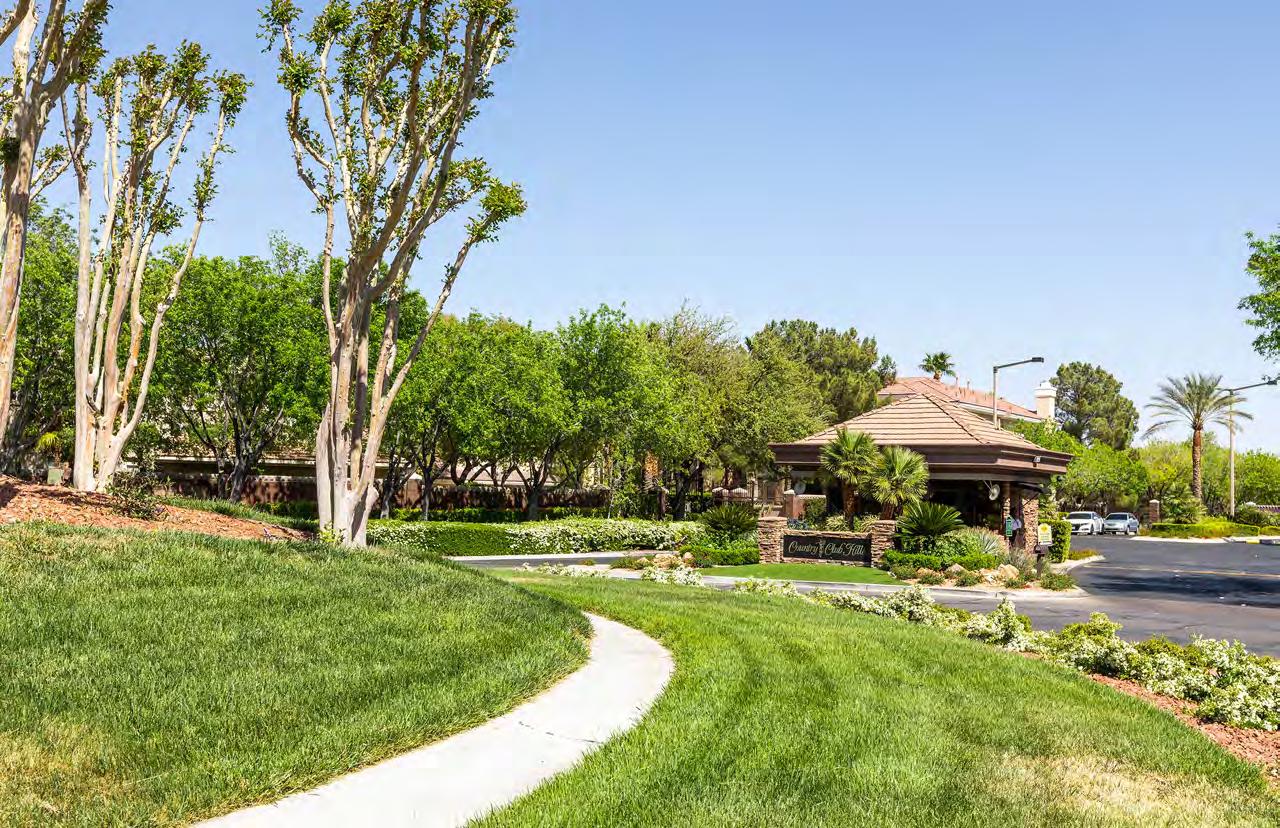
• Country Club Hills average price changed +25.3% year over year to $5.46M, and the median price changed +50.6% year over year to $9.30M.
Total Properties Sold 4 -33.3% Year Over Year
Average Price $5.46M
+25.3% Year Over Year
Highest Sale $17.50M
+54.9% Year Over Year
Days on Market
54 +3.4% Year Over Year
Median Price $9.30M +50.6% Year Over Year
Lowest Sale $1.10M +4.8% Year Over Year
• Eagle Hills sales changed by -50.0% year over year to 6.
• The highest sale price changed by +5.3% year over year from $2.85M to $3.00M, while the lowest sale price changed +36.6% year over year to $1.70M.
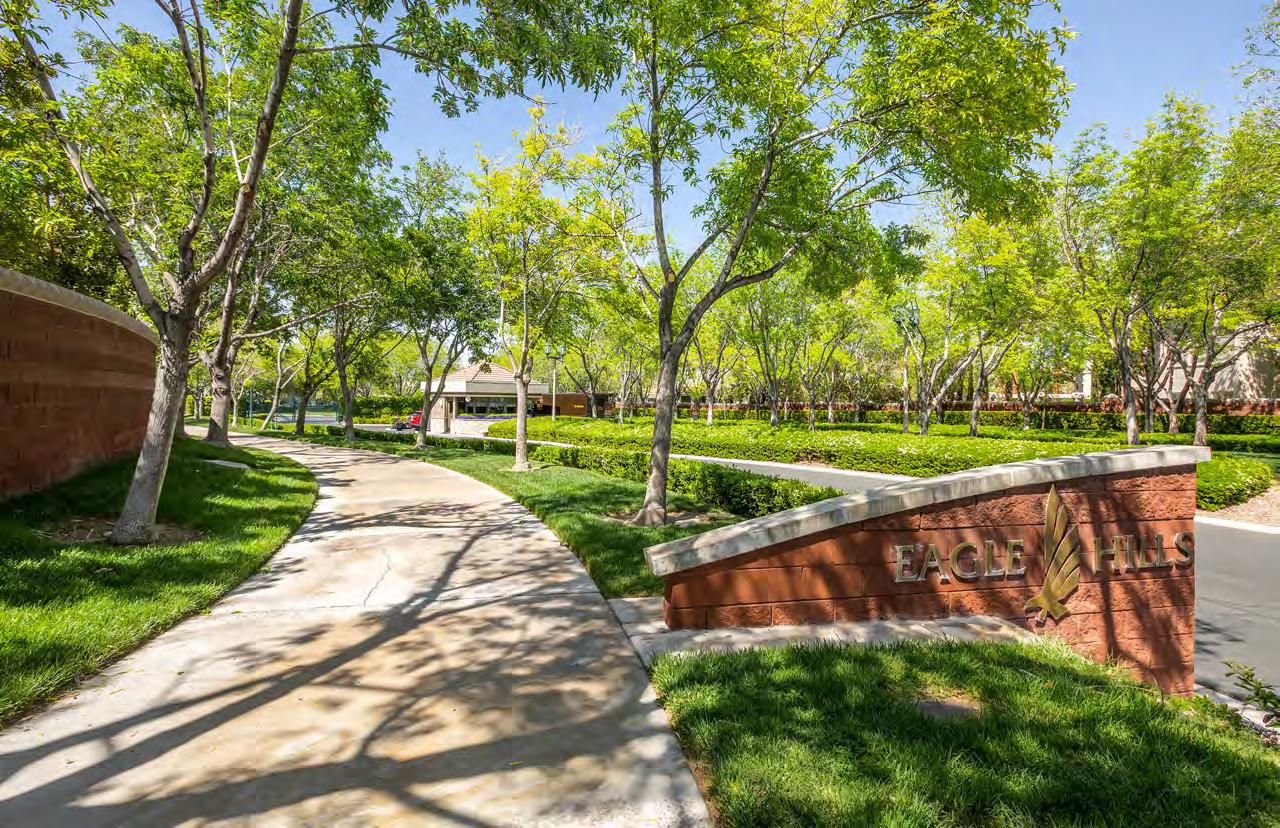
• Average days on market for Eagle Hills changed -32.1% year over year to 51 days.
• Eagle Hills average price changed +39.9% year over year to $2.49M, and the median price changed +14.8% year over year to $2.35M.
Total Properties Sold
6 -50.0% Year Over Year
Days on Market
51 -32.1% Year Over Year
Average Price $2.49M +39.9% Year Over Year
Highest Sale $3.00M
+5.3% Year Over Year
Median Price $2.35M +14.8% Year Over Year
Lowest Sale $1.70M +36.6% Year Over Year
• Lake Las Vegas sales changed by -8.8% year over year to 52.
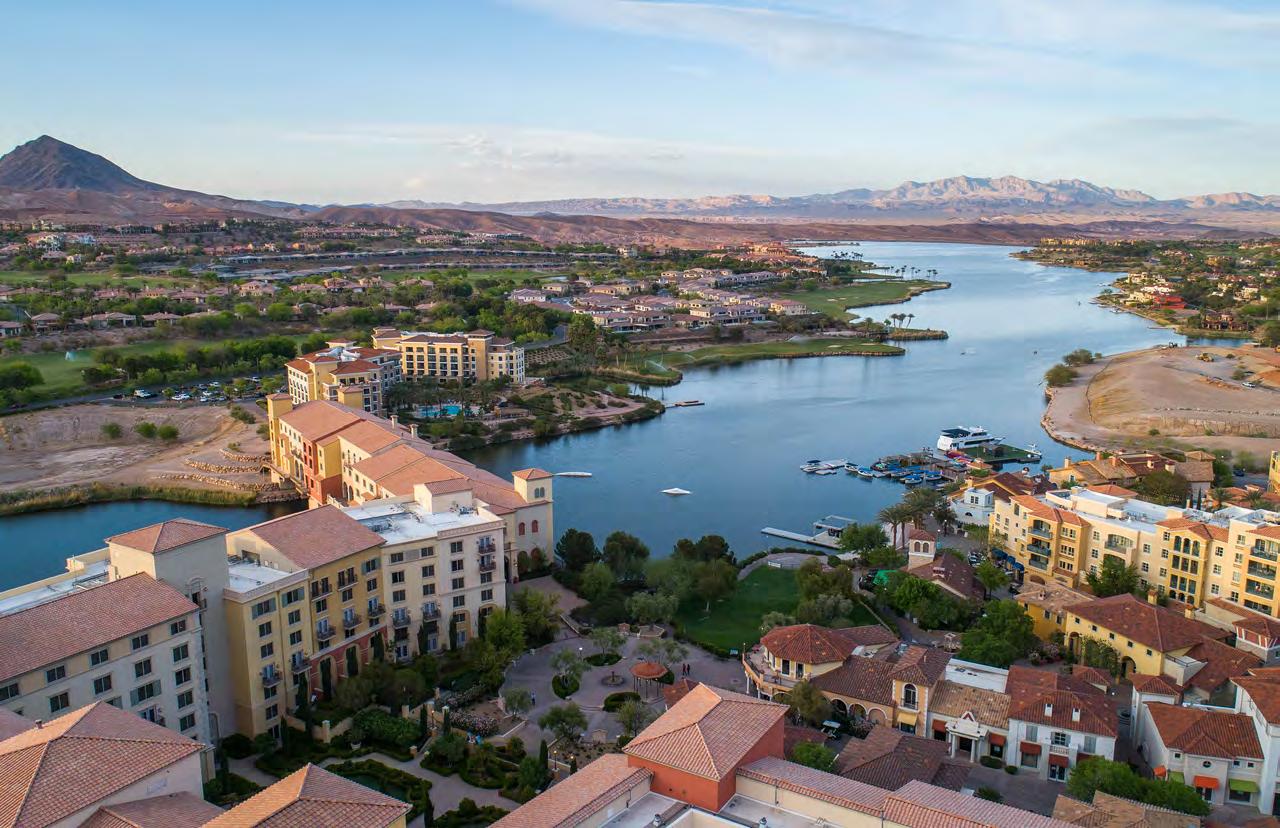
• The highest sale price changed by +26.2% year over year from $4.20M to $5.30M, while the lowest sale price changed +3.0% year over year to $1.03M.
• Average days on market for Lake Las Vegas changed -31.0% year over year to 49 days.
• Lake Las Vegas average price changed +1.4% year over year to $1.88M, and the median price changed +21.7% year over year to $3.17M.
Total Properties Sold
52
-8.8% Year Over Year
Average Price $1.88M
+1.4% Year Over Year
Highest Sale $5.30M
+26.2% Year Over Year
Days on Market
49 -31.0% Year Over Year
Median Price $3.17M +21.7% Year Over Year
Lowest Sale $1.03M +3.0% Year Over Year
• MacDonald Highlands sales changed by -40.6% year over year to 41.
• The highest sale price changed by -41.6% year over year from $25.00M to $14.60M, while the lowest sale price changed +11.4% year over year to $1.11M.

• Average days on market for MacDonald Highlands changed -36.3% year over year to 65 days.
• MacDonald Highlands average price changed +26.8% year over year to $3.98M, and the median price changed -39.6% year over year to $7.86M.
Total Properties Sold
41
-40.6% Year Over Year
Average Price $3.98M +26.8% Year Over Year
Highest Sale $14.60M
-41.6% Year Over Year
Days on Market
65
-36.3% Year Over Year
Median Price $7.86M -39.6% Year Over Year
Lowest Sale $1.11M +11.4% Year Over Year
• Mountain Trails sales changed by -40.0% year over year to 3.
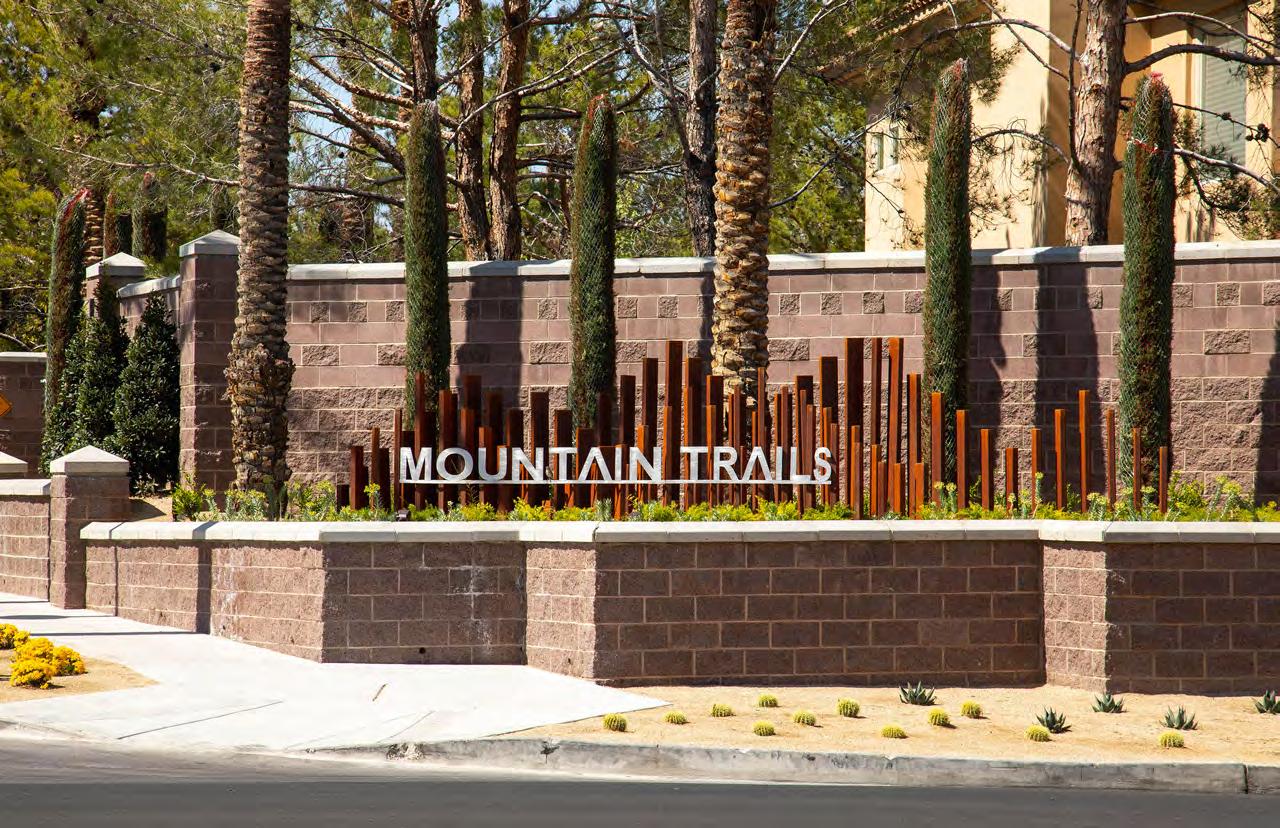
• The highest sale price changed by +39.1% year over year from $3.02M to $4.20M, while the lowest sale price changed +59.3% year over year to $2.90M.
• Average days on market for Mountain Trails changed -69.4% year over year to 34 days.
• Mountain Trails average price changed +46.3% year over year to $3.63M, and the median price changed +46.7% year over year to $3.55M.
Total Properties Sold
3
-40.0% Year Over Year
Average Price $3.63M
+46.3% Year Over Year
Highest Sale $4.20M
+39.1% Year Over Year
Days on Market
34
-69.4% Year Over Year
Median Price $3.55M +46.7% Year Over Year
Lowest Sale $2.90M +59.3% Year Over Year
• Palisades sales changed by -81.3% year over year to 3.
• The highest sale price changed by +14.3% year over year from $2.10M to $2.40M, while the lowest sale price changed +16.1% year over year to $1.38M.
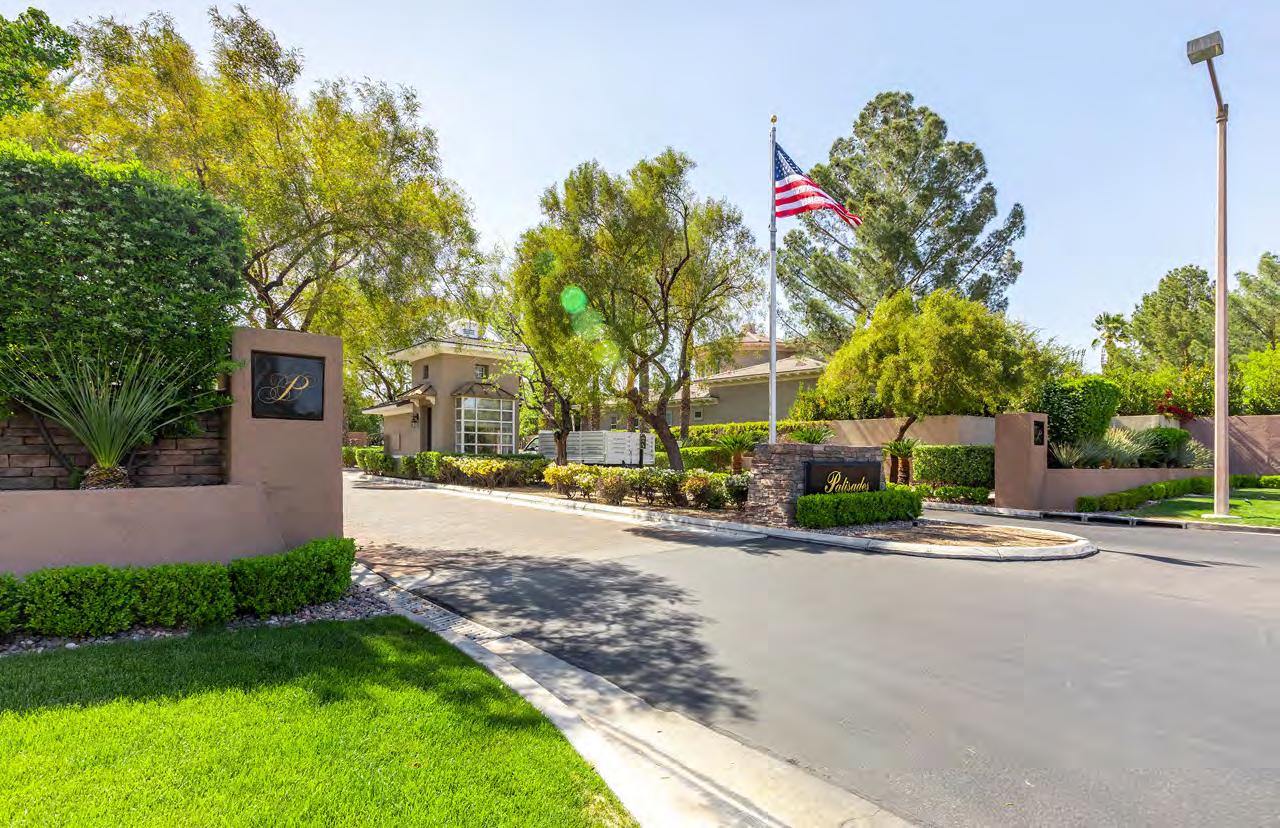
• Average days on market for Palisades changed -25.5% year over year to 30 days.
• Palisades average price changed +19.2% year over year to $1.96M, and the median price changed +14.9% year over year to $1.89M.
Total Properties Sold
3 -81.3% Year Over Year
Average Price $1.96M
+19.2% Year Over Year
Highest Sale $2.40M
+14.3% Year Over Year
Days on Market
30
-25.5% Year Over Year
Median Price $1.89M +14.9% Year Over Year
Lowest Sale $1.38M +16.1% Year Over Year
• Queensridge sales changed by -60.7% year over year to 11.
• The highest sale price changed by -28.7% year over year from $7.50M to $5.35M, while the lowest sale price changed +4.5% year over year to $1.05M.
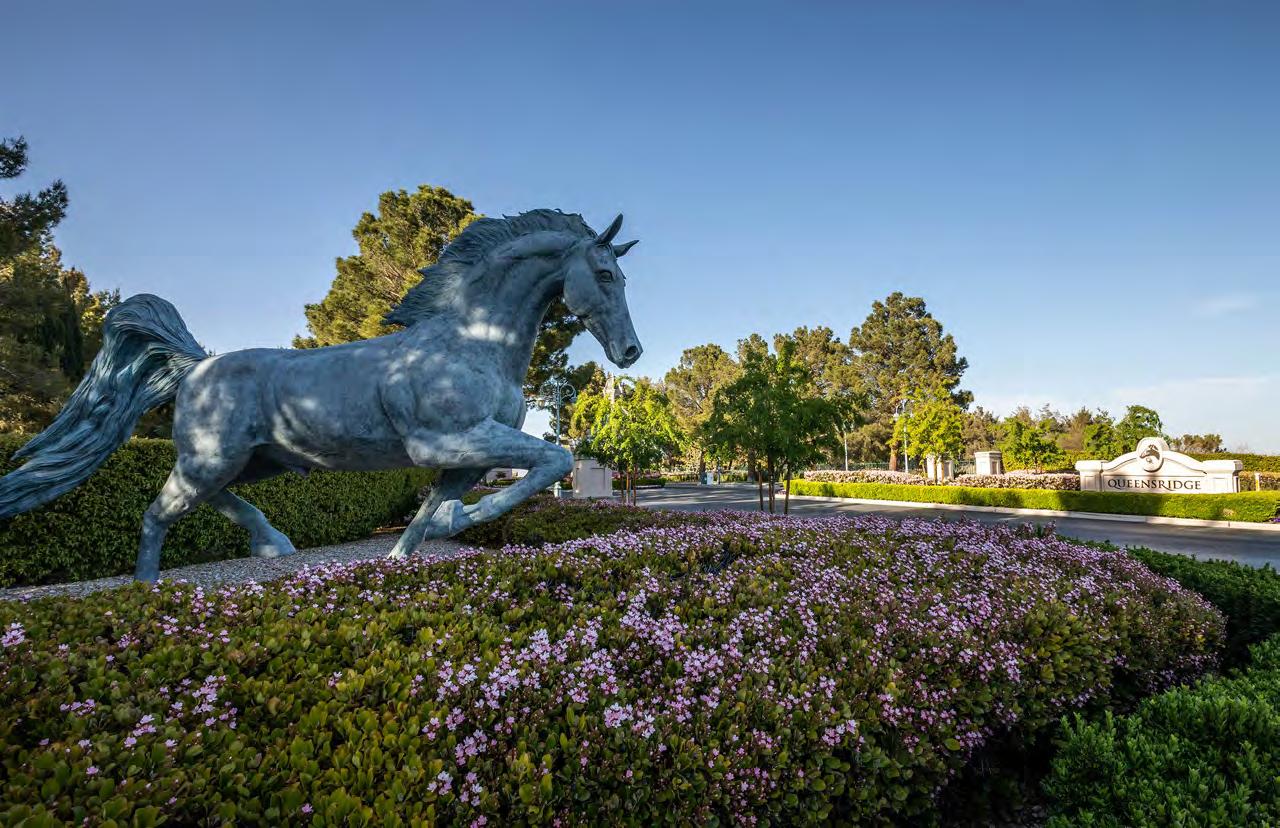
• Average days on market for Queensridge changed +2.7% year over year to 56 days.
• Queensridge average price changed +23.6% year over year to $2.31M, and the median price changed -24.8% year over year to $3.20M.
Total Properties Sold 11
-60.7% Year Over Year
Average Price $2.31M
+23.6% Year Over Year
Highest Sale $5.35M
-28.7% Year Over Year
Days on Market
56 +2.7% Year Over Year
Median Price $3.20M
-24.8% Year Over Year
Lowest Sale $1.05M +4.5% Year Over Year
• Red Rock Country Club sales changed by -29.4% year over year to 60.
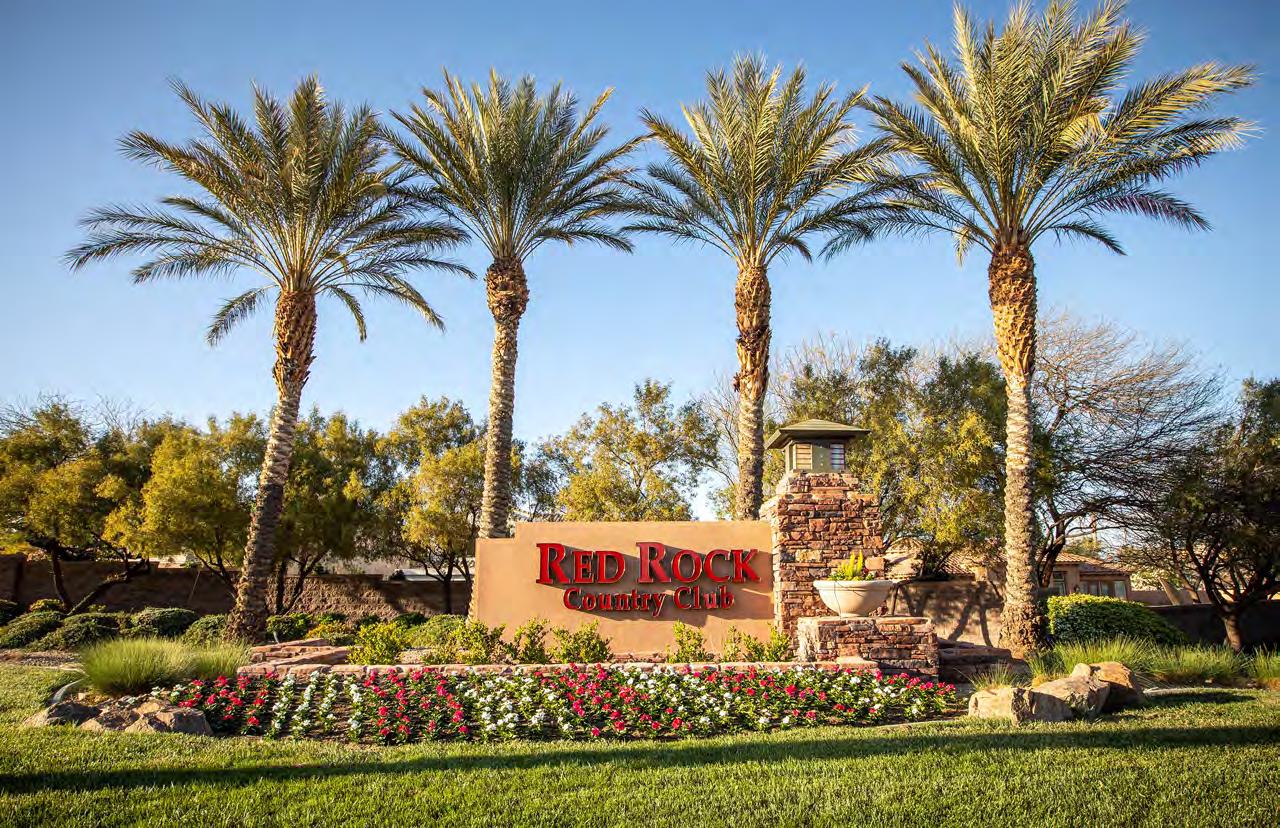
• The highest sale price changed by -14.3% year over year from $4.90M to $4.20M, while the lowest sale price changed -0.5% year over year to $1.00M.
• Average days on market for Red Rock Country Club changed +20.1% year over year to 37 days.
• Red Rock Country Club average price changed +21.0% year over year to $1.97M, and the median price changed -11.9% year over year to $2.60M.
Total Properties Sold
60
-29.4% Year Over Year
Average Price $1.97M
+21.0% Year Over Year
Highest Sale $4.20M
-14.3% Year Over Year
Days on Market
37
+20.1% Year Over Year
Median Price $2.60M
-11.9% Year Over Year
Lowest Sale $1.00M
-0.5% Year Over Year
• Roma Hills sales changed by -69.2% year over year to 4.
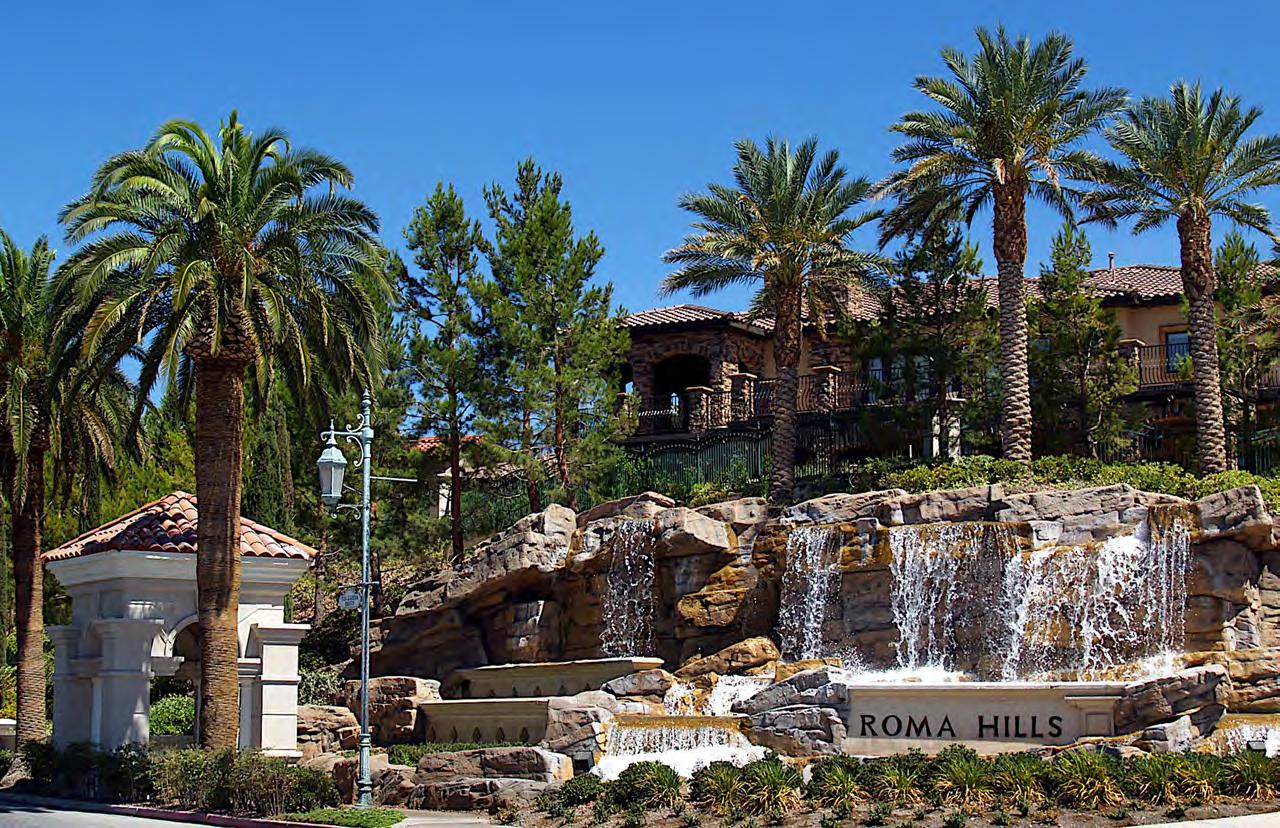
• The highest sale price changed by +6.2% year over year from $2.25M to $2.39M, while the lowest sale price changed +52.8% year over year to $1.62M.
• Average days on market for Roma Hills changed -8.7% year over year to 46 days.
• Roma Hills average price changed +19.1% year over year to $1.97M, and the median price changed +21.1% year over year to $2.00M.
Total Properties Sold
4
-69.2% Year Over Year
Average Price $1.97M +19.1% Year Over Year
Highest Sale $2.39M
+6.2% Year Over Year
Days on Market
46
-8.7% Year Over Year
Median Price $2.00M +21.1% Year Over Year
Lowest Sale $1.62M +52.8% Year Over Year
• Seven Hills sales changed by -36.2% year over year to 30.
• The highest sale price changed by -33.1% year over year from $6.88M to $4.60M, while the lowest sale price changed +2.4% year over year to $1.08M.
• Average days on market for Seven Hills changed -35.6% year over year to 42 days.
• Seven Hills average price changed -2.6% year over year to $2.28M, and the median price changed -28.4% year over year to $2.84M.
Total Properties Sold
30
-36.2% Year Over Year
Average Price $2.28M
-2.6% Year Over Year
Highest Sale $4.60M
-33.1% Year Over Year
Days on Market
42
-35.6% Year Over Year
Median Price $2.84M -28.4% Year Over Year
Lowest Sale $1.08M +2.4% Year Over Year
• Spanish Hills sales changed by -50.0% year over year to 6.
• The highest sale price changed by +42.7% year over year from $6.00M to $8.56M, while the lowest sale price changed +36.0% year over year to $1.36M.
• Average days on market for Spanish Hills changed +8.9% year over year to 53 days.
• Spanish Hills average price changed +74.1% year over year to $3.62M, and the median price changed +41.7% year over year to $4.96M.
Total Properties Sold
6 -50.0% Year Over Year
Days on Market
53 +8.9% Year Over Year
Average Price $3.62M +74.1% Year Over Year
Highest Sale $8.56M
+42.7% Year Over Year
Median Price $4.96M +41.7% Year Over Year
Lowest Sale $1.36M +36.0% Year Over Year
• Spanish Trail sales changed by -4.4% year over year to 22.
• The highest sale price changed by +64.4% year over year from $3.65M to $6.00M, while the lowest sale price changed -4.6% year over year to $1.05M.
• Average days on market for Spanish Trail changed -13.3% year over year to 40 days.
• Spanish Trail average price changed +19.9% year over year to $2.05M, and the median price changed +48.4% year over year to $3.53M.
Total Properties Sold 22
-4.4% Year Over Year
Average Price $2.05M
+19.9% Year Over Year
Highest Sale $6.00M
+64.4% Year Over Year
Days on Market
40
-13.3% Year Over Year
Median Price $3.53M +48.4% Year Over Year
Lowest Sale $1.05M
-4.6% Year Over Year
• The Fountains sales changed by -20.0% year over year to 16.
• The highest sale price changed by +58.3% year over year from $1.80M to $2.85M, while the lowest sale price changed +5.0% year over year to $1.05M.
• Average days on market for The Fountains changed +1.0% year over year to 28 days.
• The Fountains average price changed +20.9% year over year to $1.58M, and the median price changed +39.3% year over year to $1.95M.
Total Properties Sold
16
-20.0% Year Over Year
Average Price $1.58M
+20.9% Year Over Year
Highest Sale $2.85M
+58.3% Year Over Year
Days on Market
28
+1.0% Year Over Year
Median Price $1.95M
+39.3% Year Over Year
Lowest Sale $1.05M
+5.0% Year Over Year
• The Ridges sales changed by -48.9% year over year to 47.
• The highest sale price changed by +51.5% year over year from $8.25M to $12.50M, while the lowest sale price changed +45.9% year over year to $1.88M.
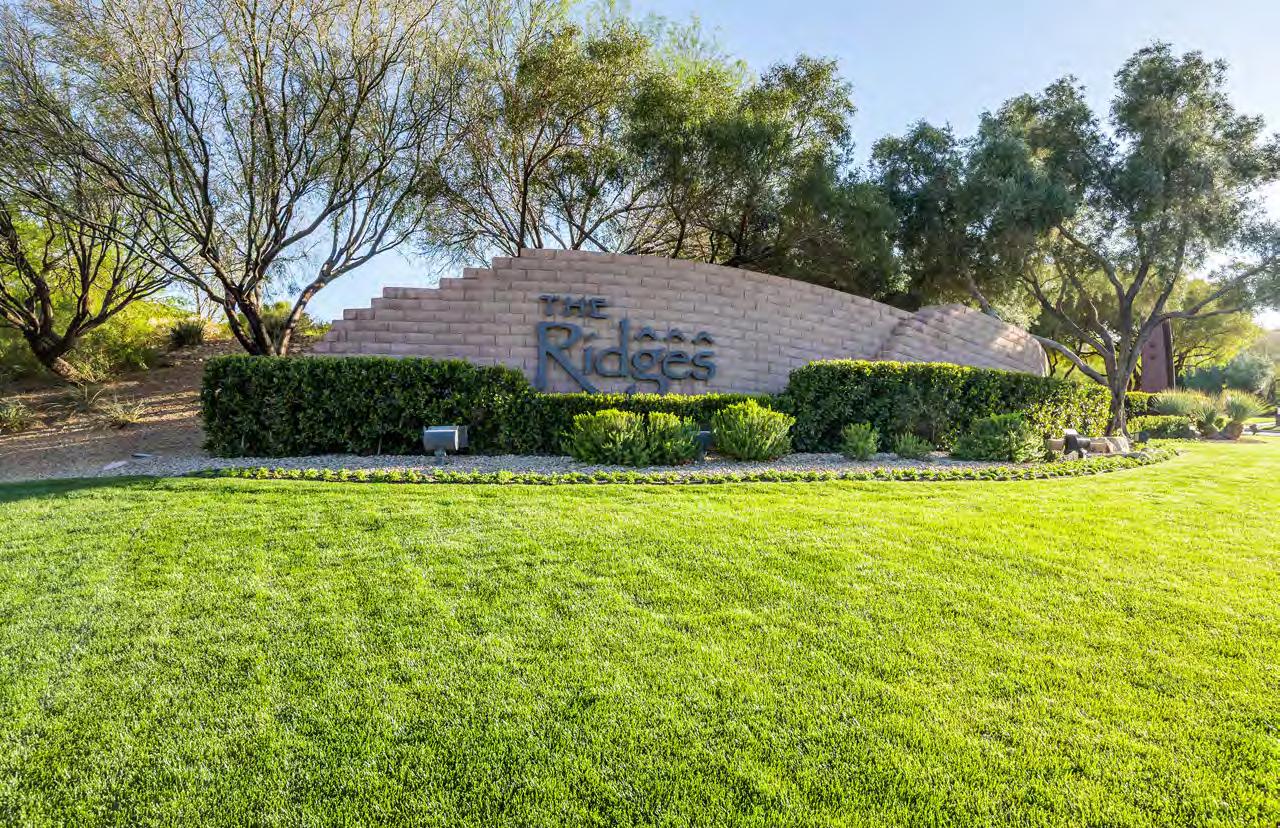
• Average days on market for The Ridges changed -6.7% year over year to 47 days.
• The Ridges average price changed +34.4% year over year to $4.66M, and the median price changed +50.8% year over year to $7.19M.
Total Properties Sold 47
-48.9% Year Over Year
Average Price $4.66M
+34.4% Year Over Year
Highest Sale $12.50M
+51.5% Year Over Year
Days on Market
47
-6.7% Year Over Year
Median Price $7.19M +50.8% Year Over Year
Lowest Sale $1.88M
+45.9% Year Over Year
• The Summit Club sales changed by -50.0% year over year to 1.
• The highest sale price changed by +23.1% year over year from $15.40M to $18.95M, while the lowest sale price changed +152.7% year over year to $18.95M.

• Average days on market for The Summit Club changed +203.9% year over year to 196 days.
• The Summit Club average price changed +65.5% year over year to $18.95M, and the median price changed +65.5% year over year to $18.95M.
Total Properties Sold
1 -50.0% Year Over Year
Average Price $18.95M
+65.5% Year Over Year
Highest Sale $18.95M
+23.1% Year Over Year
Days on Market
196
+203.9% Year Over Year
Median Price $18.95M
+65.5% Year Over Year
Lowest Sale $18.95M
+152.7% Year Over Year
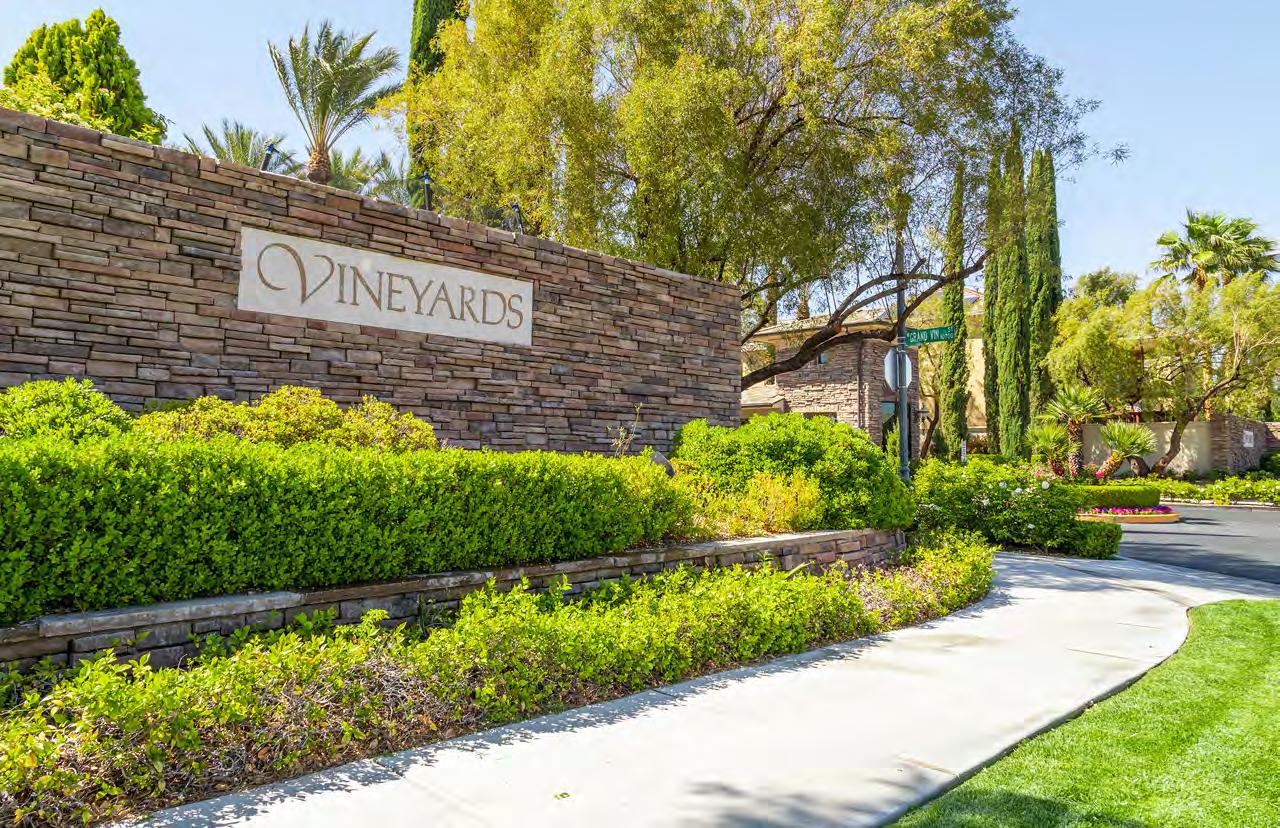
• The Vineyards sales changed by -11.1% year over year to 8.
• The highest sale price changed by +48.8% year over year from $1.43M to $2.12M, while the lowest sale price changed -12.1% year over year to $1.00M.
• Average days on market for The Vineyards changed +111.8% year over year to 42 days.
• The Vineyards average price changed +19.2% year over year to $1.51M, and the median price changed +21.8% year over year to $1.56M.
Total Properties Sold
8
-11.1% Year Over Year
Average Price $1.51M
+19.2% Year Over Year
Highest Sale $2.12M
+48.8% Year Over Year
Days on Market
42 +111.8% Year Over Year
Median Price $1.56M +21.8% Year Over Year
Lowest Sale $1.00M
-12.1% Year Over Year
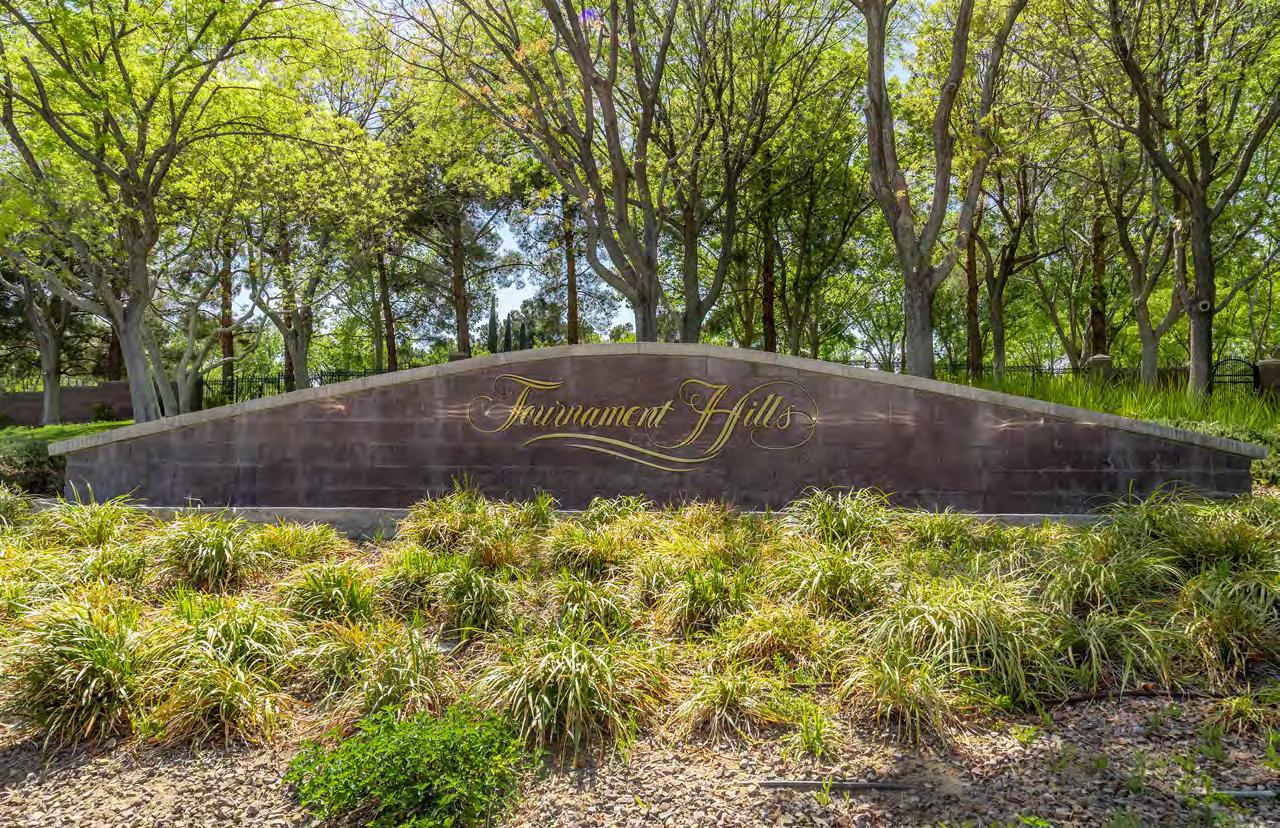
• Tournament Hills sales changed by -28.6% year over year to 5.
• The highest sale price changed by -23.4% year over year from $8.00M to $6.13M, while the lowest sale price changed -6.7% year over year to $2.10M.
• Average days on market for Tournament Hills changed +109.6% year over year to 107 days.
• Tournament Hills average price changed +9.6% year over year to $3.73M, and the median price changed -19.8% year over year to $4.11M.
Total Properties Sold
5 -28.6% Year Over Year
Average Price $3.73M +9.6% Year Over Year
Highest Sale $6.13M
-23.4% Year Over Year
Days on Market
107 +109.6% Year Over Year
Median Price $4.11M -19.8% Year Over Year
Lowest Sale $2.10M -6.7% Year Over Year
• Willow Creek sales changed by -77.8% year over year to 2.
• The highest sale price changed by +12.8% year over year from $2.58M to $2.91M, while the lowest sale price changed +169.7% year over year to $2.83M.
• Average days on market for Willow Creek changed -88.5% year over year to 5 days.
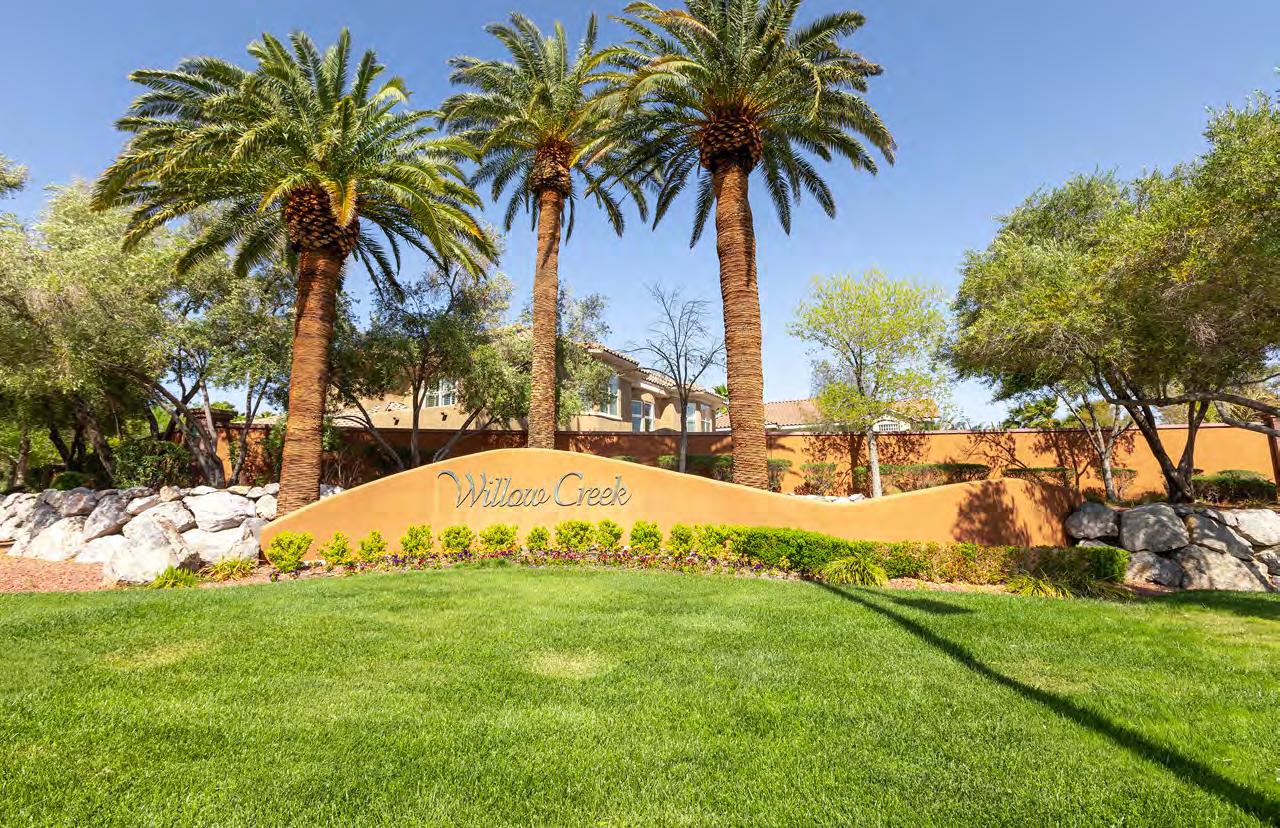
• Willow Creek average price changed +62.4% year over year to $2.87M, and the median price changed +58.3% year over year to $2.87M.
Total Properties Sold
2 -77.8% Year Over Year
Days on Market
5 -88.5% Year Over Year
Average Price $2.87M +62.4% Year Over Year
Median Price $2.87M +58.3% Year Over Year
Highest Sale $2.91M +12.8% Year Over Year
Lowest Sale $2.83M +169.7% Year Over Year
*Source: 2019-2020 Migration Data, IRS
**Source: Las Vegas Global Economic Alliance
Our market report offers current and valuable information regarding the local market. Each region reported on is broken down by neighborhood and contains specific details and insights related to that market.
Metrics
Total Properties Sold: The total number of properties that closed within the time period reported.
Highest Sale: The highest priced property that was sold in the area being reported on during the time period reported.
Lowest Sale: The lowest priced property that was sold in the area being reported on during the time period reported.
Average Price: The price calculated by dividing the combined prices of properties by the amount of sold properties in that same area.
Median Price: The middle or midpoint price where half of sales fall below and half fall above this number.
Days on Market: Averages how long a unit takes to sell and is calculated from subtracting the list date from the date of close.
*Total: Areas defined with the context of " *Total" are the combined totals of all areas reported within this report.
Source
Figures in this report are based on publicly reported closed sales information via the Multiple Listing Service. All community pages for Single Family Residential properties reflect a sale of $1M or higher.
Definitions
Payroll Tax: Local and other imposed payroll tax, as reported by individual jurisdictions.
Corporate Income Tax: An income tax is a government levy imposed on individuals or entities that varies with the income or profits of the taxpayer. Details vary widely by jurisdiction.
Individual Income Tax: An income tax is a government levy imposed on individuals or entities that varies with the income or profits of the taxpayer. Details vary widely by jurisdiction.
Sales Tax Rate: Sales tax rates vary among districts within local jurisdictions and at the state-level.
Property Tax Rate: Figures are mean effective property tax rates on owner-occupied housing (total real taxes paid / total home value). As a result, the data exclude property taxes paid by business men, renters, and others.
Cost of Living Index (US=100): The index reflects cost differentials throughout geographical areas in the United States and is based on prices in different categories of consumer expenditures (e.g., housing, utilities, grocery, transportation, health care). The national average index value is 100.
Housing Opportunity Index: Index represent the share of homes sold in a given area that meet the criteria of affordability based on local median income and a standard mortgage underwriting criteria.
©
NV 89135. NV B.1001894. All worldwide rights reserved. All material presented herein is intended for information purposes only. Based on information from multiple listing service. While this information is believed to be correct, it is represented subject to errors, omissions, changes or withdrawal without notice. All property information, including, but not limited to square footage, room count, number of bedrooms and the school district in property listings should be verified by your own attorney, architect or zoning expert. If your property is currently listed with another real estate broker, please disregard this offer. It is not our intention to solicit the offerings of other real estate brokers. We cooperate with them fully. Equal housing opportunity.
2023 Douglas Elliman Real Estate. 10845 Griffith Peak Dr. #2, Las Vegas,