
Email | Website | LinkedIn | GitHub
Kritika Kharbanda
Technology/Digital
01 Assembly Performance Analyzer Tool
Understanding the carbon footprint (A1-A3)of building assemblies
02
Carbon Literacy Application
Visual-based app for raising awareness on material environmental impact among citizens
03 LearnCarbon
Rhino3D plugin for early-stage carbon footprint prediction
Simulation/Design
04
add-on, for effective decarbonization.”
Sandy Springs, Atlanta
Modeling urban energy flows to lay roadmap for a net-zero district in the heart of Atlanta, Sandy Springs
05 Resilient Hub
High-performance, affordable, resilient and lowcarbon commercial building at the Boston Seaport
Professional
06
Cockle Bay Park
A human scale sustainable destination and a true urban icon on Sydney’s skyline, Cockle Bay boasts of energy efficiency
07 Turku Museum
A music experience inspired by nature
Contents
Objective
“I aim to transform the construction sector by bridging the digital silos and infusing sustainability as a key contributor to the design process, rather than a mere
Assembly Performance Analyzer Tool
Understanding the carbon footprint (A1-A3) of building assemblies
Developed as part of the seminar SCI 6484, Harvard GSD, Spring 2022
Authors Advisor
Kritika Kharbanda
Ellie Jungmin Han
Student Grant: Harvard Office for Sustainability Nominated Project of SCI 6484 for Harvard GSD Archives

Embodied Carbon | Life Cycle Assesment Data Science | Linear Regression
Python | PyTorch | Javascript
To establish local building standards, efficient, accessible, and transparent datasets within the industry are needed. Funded by the Harvard Office for Sustainability Student Grant, this project focuses on partnering with the building industry for the collection, analysis, and augmentation of the data for external wall assemblies, focusing on embodied carbon, and potentially including cost.


The end goal is to consolidate all the current industry data into a dynamic web application format that encourages architectural literacy on the carbon footprint of each assembly to enable conscious design. The methodology entails three major steps – Data collection, analysis and digital database development. The scope of the project is cradleto-gate (A1-A3), and the construction assemblies include building envelope and flooring details.
Legend Cost/unit

Awards Tools Brief Medium Medium
High High
Representation of the Assembly Analyzer Tool
01
Concept Legend Embodied Carbon/unit Low Low
Analysis and Visualization for Embodied Carbon values in the overall dataset (with outliers)

Analysis and Visualization for Embodied Carbon values in the overall dataset (without outliers)

Finally, the assembly information page shows all the materials with thicknesses in the detail and a heatmap diagram that depicts the embodied carbon footprint of each material


Application: Unfolded
1: Landing Page

User can access the database or move directly to a ‘Predictor’ tool that has been trained on a Linear Regression model for predicting carbon footprints of new assemblies


2: Database Overview
Before accessing the database, the application shows a distibution of all the values in the database through Violin Plots


Machine Learning Predictor Application

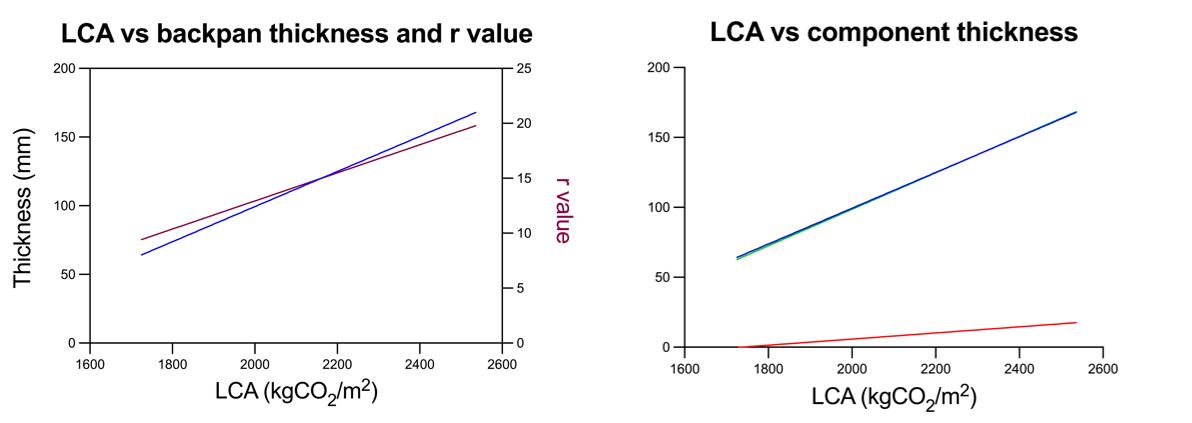
In-depth analysis to compare the Embodied Carbon values with Thickness of insulation and their respective R-Values were performed, and a Regression model was trained to predict the embodied carbon footprint of new assemblies
3: Filters
The user also has options to select from the category for details, like window, curtain wall, roof etc. and select from the available ranges of carbon footprints
4: List of Values:
A list of values from the application backend show up, and the user ca browse through these and select
Data Processing Sample Assembly
Carbon Literacy Application
Visual-based app for raising awareness on material environmental impact among citizens
Developed as part of the seminar SCI 6485, Harvard GSD, Spring 2022
Material | Embodied Carbon | Visual Machine Learning | Nueral Networks | Classification
Python | PyTorch | Tensorflow | Pix2Pix | StyleGAN
Building Industry contributes to 40% of the global CO2 Emissions. 60% is through the operational carbon, while 40% is through embodied carbon within materials, and the residential buildings play a huge role.To get the citizens on board the retrofit projects, we need to make them understand the impact of materials. Therefore, we develop a web platform that is accessible to all.
The web platform takes the users through four steps:
1. Upload an image and a predicted carbon footprint of the prominent material in the image shows up
2. Change the material by coloring over it, and understand the new predicted carbon footprint of the changed material
Concept Tools Brief Three examples highlighting the workflow (as numbered):
3. For fun: Generate new material textures by selecting a texture and a pattern
4. Finally, out of curiosity: Ask the machine to predict the carbon fooptrint of the new generated material image
User chooses an image
The ML model predicts the materials in the image by creating a segmented graphic
The user modifies the colors in the segmented graphic to change a material
The ML model generates a new image from the modified segmented graphic
Actual segmented image; B = Ground Truth (Made for testing the results)


02
Authors Advisor Position
Kritika Kharbanda, Harshika Bisht, Gabriel Lam Sabrina Osmany Teaching Assistant for SCI 6485
1.
2.
3.
4.
A
1 A A A 1 1 3 B B B 3 3 2 2 2 4 4 4 Stone Wood Brick Concrete Glass Metal Legend Materials
=
01:
Upload any image and the application predicts the prominent material, along with the carbon footprint (embodied carbon in kgCO2e/m2 or kgCO2e/unit) for the uploaded image!


For example, in this image of House Zero, wood is the prominent material with an EC factor of 0.72 and the embodied carbon value of 10kgCO2/m2
The graphs alongside reflect the training and validation percentages

Workflow Chart
02:
Now, once the image is uploaded, the user can change the material by coloring over it, or selecting an option from the drop down meny, as shown below, and understand the new predicted carbon footprint of the changed material
The sample uploaded image with white paint clad concrete facade
The drop down menu allows users to change materials, like changing the main facade to stone or increasing window area. In this case, lets select ‘Change main facade to stone’
Voila! The ML model now enhances the image to added a stone texture to the main facade, as you can see in the last image on the right, Further the app tells the user the impct they made on the embodied carbon, as in the image it says ‘Wow, you saved some carbon there!’
Classifying materials Frontend Application
Segmentation & material change
Procedural Texture Generation
HTML, CSS, Javascript Pix2Pix StyleGAN
ML model ResNet101 ML model
Application: Unfolded
LearnCarbon

Rhino3D plugin for early-stage carbon footprint prediction
Team project developed as part of the 36-hour AEC Hackathon 2021 in Denmark
Authors Kritika Kharbanda, Iliana Papadopoulou, Panayota Pouliou, Karim Daw, Anirudh Belwadi, Hariprasath Loganathan
Winner: ‘Best Project that solves a big AEC Problem’ at AEC Hackathon 2021 (LINK) Presentation during the eCAADe 2022 Conference (LINK)
Brief
LearnCarbon is a Rhino3D plugin that facilitates two neural networks trained with the Embodied Carbon Benchmark Study by Carbon Leadership Forum, which learns the relationship between building geometry, typology, and construction type with the Global Warming potential (GWP) in tons of C02 equivalent (tCO2e).
The first one, a regression model, can predict the GWP based on the massing model of a building, along with information about typology and location.
The second one, a classification model, predicts the construction type given a massing model and target GWP.
03
Embodied Carbon | Structure type Rhino3D Plugin | Machine Learning
Numpy | Pandas | Tensorflow | Keras | Grasshopper
Concept
Awards Tools
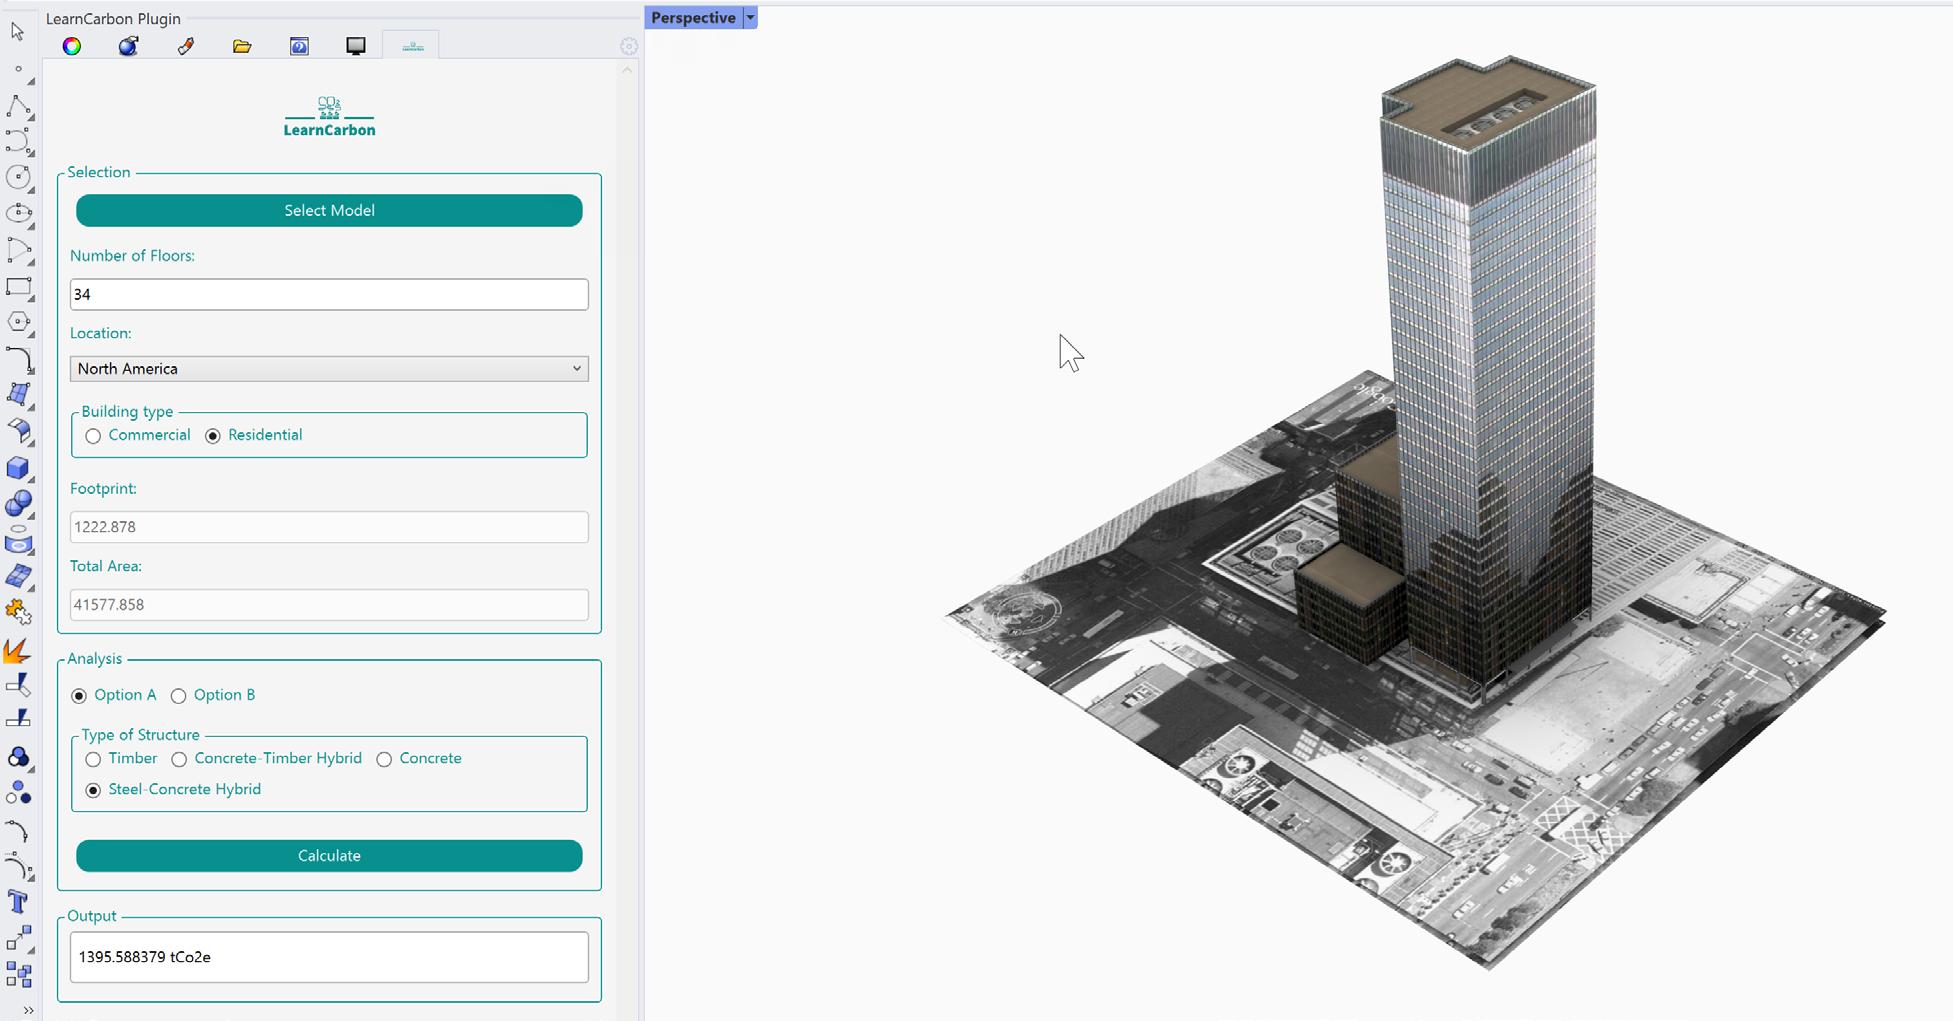
Representation of the LearnCarbon Rhino3D Plugin
The tool is designed with two ML models:


Model A, a Non-Linear Regression model, predicts the value of Global Warming Potential or GWP (kgCO2e/m2) from the trained data.
Model B, a Classification model, assigns a class label for structural typology, after describing the target GWP value attribute to input data.
Structural Typology : For Classification & Benchmarking

LearnCarbon: Plug-in Interface
Scenario 1 (using Model A):
For predicting the Global Warming Potential in kgCO2e/m2, based on the geometry attributes of floor area, height or number of floors, location, building type and structural type.
Select the 3D Model
Automated input with flexibility for manual feeding
Specify Project Location
Building Type
Automated input with flexibility for manual feeding

Finally, select the type of structure
Voila! The plug-in predicts the GWP of the current design in seconds!
Data Processing
The dataset consists of categorical and numerical features which describe building projects, and the categorical features were converted into numerical using Pandas.

From the Corelation Matrix of Features shown alongside, we observe that the features of Building Construction Type and GWP are negatively correlated, which showcases the potential of teaching this to a model. Another relevant indication to our hypothesis is between Floor Count with Location and Ground Floor Area with GWP. While the latter logically form a strong relationship, the former points out a potential bias in the dataset or even an observation of building heights per continent.


After training, the next step was connecting with Rhino3d. We used the Hops component in Rhino3d that allowed for integrating Tensorflow and Numpy into Rhino 3d CPython. The Hops infrastructure developed by McNeel is a thin wrapper around an underlying Flask server that allows running a flask server and serving data from an external python instance. Figure shown alongside depicts the final outcome for the plug-in.

Scenario 2 (using Model B):
For assigning a potential structure type for a particular geometry, based on floor area, height, building type, location and benchmark Global Warming Potential in kgCO2e/m2
Select the 3D Model
Automated input with flexibility for manual feeding
Specify Project Location
Building Type
Finally, input the target GWP for the project
Voila! The plug-in assigns a feasible structure type based on the GWP!

Workflow
Timber Reinforced Concrete Steel Concrete Timber Concrete
A Pilot study for Modeling Urban Energy Flows
Sandy Springs as a self sustainable heart of Atlanta
Developed as part of the course 4.433 at MIT, Spring 2022
Authors Advisor
Kritika Kharbanda, Yiwei Lyu, Sihui Chen, Katie Pelton
Christoph Reinhart
Building Simulation 2023 (Abstract under review)
Urban Energy Modeling | Net Zero Districts Climate Change | GHG Emissions
MIT’s Urban Modeling Interface | Urban Network Analysis toolbox for Rhino3D


Working with the municipality of Atlanta, this project aims to propose a holistic development scenario for Sandy Springs, that is tested through environmental performance simulations and scores high on the parameters of:
1. Neighborhood Walkability
2. Outdoor Thermal Comfort 3. Access of Daylight 4. Operational and Embodied Building Energy Use 5. Economic viabaility and Cash Flow 6. Resouce Efficient District Energy system and electicifying the city
7. Climate Change and Urban Heat Island
8. Resiliency and long-term building energy use
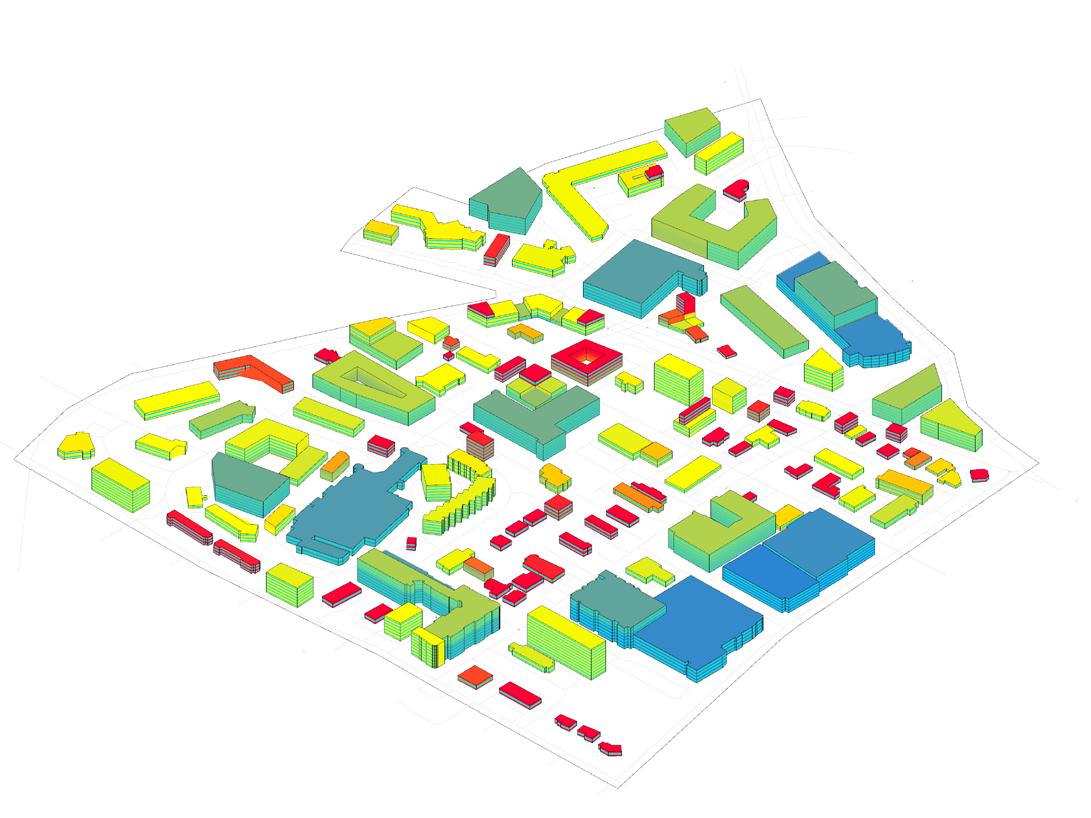
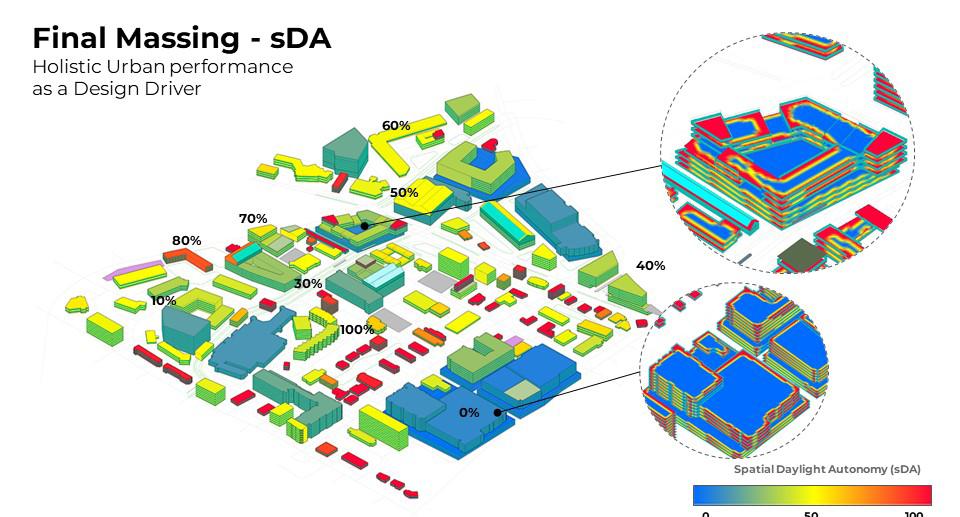
Initial studies inclue experimenting with trade-offs between daylight and massing with different building typologies for maximum economic profits for the ‘heart of the city,’ followed by several supporting simulations that guided the final proposal for the neighbourhood.
59% Average sDA
Stepped Courtyard Linear
68% Average sDA 52% Average sDA
Awards Tools Brief Legend Spatial Daylight Autonomy(sDA)
65% Commercial 35% Residential 72% Commercial 28% Residential 59% Commercial 41% Residential Retail Restaurant Residential School Office Warehouse
Legend Proposed Building Typology 1980 2004
Massing studies for trade-offs between access to sufficient Daylight (sDA), vs. Economic returns based on typology and built-up area.
04
Concept 0 50 100
Neighbourhood Concept Urban Simulations
The identified parcel for development includes pre-existing residential, commercial and reatil with large parking areas
Two corridors, Primary NorthSouth, and Secondary East-West were proposed for encouraging pedestrianized paths and reducing personal vehicles
N-S Primary Green Corridor
Proposed Civic Centre

E-W Secondary Green Corridor
Proposed new Retail


Visualizations from the Primary corridor, that focuses on a central green park along the roadway for promoting pedestrians, and with retail structures lining the street.
Trade-off between Operational Energy, Carbon Fooprint and Economic Impacts were studied for both existing and new proposed buildings, and an optimized solution was selected
Total Energy Consumed (kWh/m2) Carbon Comparison Cost Comparison
Energy consumption in a baseline case, with added dimming and LED lighting, using Energy Star appliances for reducing peak heating and cooling, and better natural ventilation with efficient glass type

Total Footprint 493,544 m2
Total Occupancy 84,717 per
Proposed Green
Current
Built-Up Proposed Typology
Added Greenroofs 9925 m2
Added Rooftop PV 5910 m2
On-Site Power Generation 3,555,252 kWh
Average sDA 64%
Spatial Daylight Autonomy Embodied Emissions (kgCO2e/m2)

Legend Spatial Daylight Autonomy(sDA) 100 175 250 Legend Utility Legend Utility Legend Utility
Normalised Footprint smaller buildings with RCC structure contribute the most
Legend Embodied Emissions (kgCO2e/m2)
Carbon and cost comparison for baseline electricity use, with unrestricted and restricted PV energy generation and installing a Heat Pump
0 50 100
To support the shift to a pedestrianized system, we propose placing the major retail and a new Civic Centre along the corridors
Service
Legend BuilT-Up Retail Greenhouse Restaurant Green Rooftop PV
Civic Parking
Natural Gas Domestic Water Grid Electricity Electricity Cooling Natural Gas Elect. Export Heating Boiler Equipment Chiller Lighting PV Cells
Legend Proposed Building Typology
Resilient Hub
High-performance, affordable, resilient and low-carbon commercial project at the Boston Seaport

Developed as part of the seminar SCI 6374, Harvard GSD, Spring 2022
Authors Advisor
Awards
Kritika Kharbanda, Lara Tomholt, Kuan-Ting Chen, Sihui Chen, Andrew Gibbs
Prof. Holly Samuelson
US DOE Solar Decathlon Third Prize: Commercial category Built Environment Plus 2021, Student Prize
ISI/APH Conference: Selected for Project Showcase
Concept
Tools
Energy Efficiency | Commercial Benchmark
Adaptable envelope | Resiliency
Climate Studio | Ladybug Tools | Cardinal LCA
Brief
ResilientHub, situated in the Seaport District of Boston, is a future-ready building that maintains the highest energy efficiency and occupant comfort level possible throughout its lifetime.
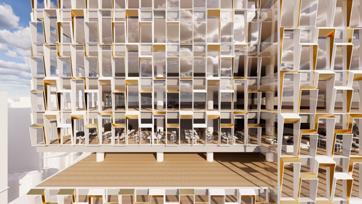
Adaptable ETFE pillow façades optimize solar heat gain and daylight access in response to daily and seasonal weather changes, and future global warming and urbanization. A solar chimney, placed prominently at its most optimal position for solar heat gain, provides buoyancy-driven natural ventilation and significantly lowers the building’s cooling loads with future rising temperatures.
The project’s maximum annual site EUI goal for the year 2025 was set to 28.6 kWh/m2, and for financial feasibility, the project’s Internal Rate of Return (IRR) was required to be above 20%
Visualization of ResilientHub, while approaching from the Summer St.
05
The adaptable ETFE pillow façade system with integrated gold-coated PDMS film. The strain of the internal PDMS layer can be modulated automatically by an array of sensors placed on the exterior of the façade that measure outdoor temperatures and irradiation and in the indoor space that measure indoor temperatures and occupancy.


Future Adaptability - Climate Change
01
Mapping the changes in solar irradation levels over the years, and integrating shading in the Southern facing facades

02
Environmental development scenario 2025-2080 for ResilientHub: An increase in temperatures by 4.1ºC and rise in sea water level by 2080. The project’s maximum annual site EUI goal for the year 2025 was set to 28.6 kWh/m2 (28.6 kBtu/ft2) and will equal an annual source EUI goal of 80 kBtu/ft2 (252 kWh/m2).

Form
Development
01 Maximize Footprint 02 Public Lower Floors 03 Wind
04
Solar Energy 05 Effective air circulation
Chimney Shaft
Tapping
Visualization of atrium - materiality palette of recycled steel, glass, timber and interior plants, highlighting flexible furniture in the multi0functional space
Cockle Bay Park
A human scale sustainable destination and a true urban icon on Sydney’s skyline, Cockle Bay boasts of energy efficiency

Sustainability Engineer on project involved from Competition till Detailed Design phases
Concept Tools Brief
Sustainability strategy | Microclimate simulations
Facade Optimization | Energy Efficiency
Ladybug Tools | OpenFoam | ENVI-Met
Thoughtful design of the public realm can create thermally comfortable, attractive and more healthy urban environments. Integrating architecture, planning and landscape design enhances the positive natural and man-made features in this commercial high rise with public podium.
An increase in the comfort quality allows for a diverse array of activities at the podium level. Spaces of varied scales are obtained by experimenting with volumes that facilitate effective seasonal shading and controlled wind influx. Great flexibility in the time and activity pattern at the podium can hence be exercised that also helps in maximising commerce in all times of the year. We were able to decrease the solar exposure at the North facade by upto 80%, reduce heat stress at plaza level by 40%, and lower high wind speeds by 25%.
As a sustainability intern, I was responsible for developing the sustainability concept, strategy and action plan for this key project located in the prime of Sydney. As a Sustainability Engineer, I worked with the consultants to prepare Material specifications based on embodied carbon footprint, Benchmarking & ensuring the Sustainability standards across all domains to satisfy the client portfolio.
06
Visualization of Cockle Bay Park as viewed from Darling Harbour (Developed by MIR)
Form Development Envelope Design


Irradiation Analysis


Plaza Design


The north-west wind is blocked by the mass of Podium. The UTCI chart shows that 67% of the time in the year ‘comfortable’ outdoor conditions are experienced
Incoming wind is funelled by fragmenting the Podium that reduces heat stress. Thischanges the UTCI chart to increase the ‘comfortable’ conditions to 78% in a year
The downdraft wind is diverted away from the podium by further fragmentation. This helps increase the time of comfortable conditions to 80%

Strategic landscaping optimises the radiation and wind to improve the microclimate. Therefore, 90% of the time, it feels comfortable at the plaza level

Materiality Study
Stack Joint Details
01
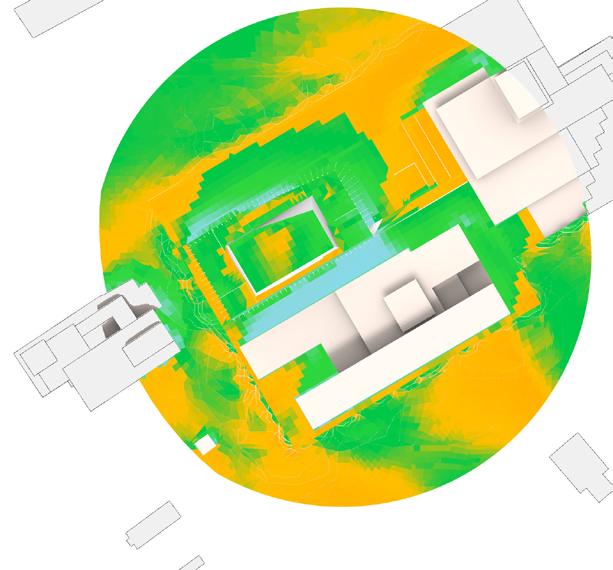
Fluid
the outdoor
Computational
Dynamic (CFD) study for
and neighbouring areas
Visualization of Pyrmont Waterfront 02 Podium Fragmentation 03 Tower Breakdown 04 Added landscape Solar
Podium Accentuated Facade Modified Louvres for Plant Room (Levels
7)
6 &
0 1 2 3 4 5 6 7 8 9 10 Very high sun exposure Low sun exposure Limited sun exposure High sun exposure Sunlight hours, clear sky (h) Wind Study Sunlight Hours Perceived Temperature Sunlight hours experienced for an average day in April Experienced temperatures for an average day in April, at 13:00PM Prominent winds from West & South-West study Expanding the human comfort season across all outdoor spaces Calm winds create pedestrian-friendly open area Sheltered area in the wind shadow region at the top levels Expansive open space that partially receives 6 hours of sunlight even in March Decent temperature of 4-8°C in the open space Lower temperatures of 2-4°C in the higher areas >7 hours of sunlight along the Beach park
Turku Concert Hall

A music experience inspired by nature
Sustainability Engineer on project for Competition phase
Microclimate simulations | Urban Comfort Energy Strategy | Life Cycle Assesment
Ladybug Tools | OpenFoam | Cardinal LCA
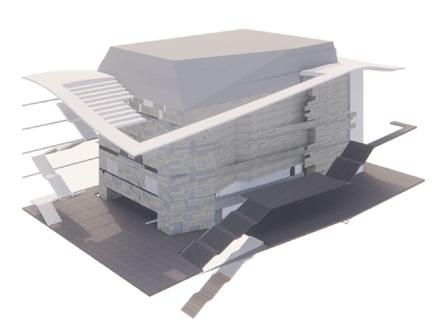
Located in Turku, the venue is a representation of the culture, a ‘house’ for music experiences. The museum building is inspired by nature resembling a Finnish forest that arises from the rock. The materiality inspiration comes from nature’s renewable resources of biomass and geothermal energy, The design boasts of a thermodynamic spatial experience with an embodied-operational energy balance.
The sustainability goals include resource return by minimizing embodied carbon, lowering peak energy demand by switching to green energy, and maximize outdoor comfort. The carbon footprint is very low due to a hybrid wood-concrete structure, with timber columns and slabs. A thermally activated building system is proposed for the concrete clad core walls, that generates a thermodynamic stimuli in the visitors and allows them to experience a difference in temperatures across the museum zones.
To maximize the outdoor spaces, the functions are stacked. The outdoor space has been strategically planned to minimize the cold winds, optimized sunlight and perceived temperatures. The timber facade also break down the winds and deflects the streams away. The trees further act as wind barrier.
07
Concept Tools Brief
Visualization of Turku Museum from the Theatre Bridge (Courtesy: Henning Larsen Architects)
Having a shared and scenic outdoor meeting venue that acts as a hub for non-visitors at the museum was an important part of the strategy.


This space is designed to be multi-functional and allow a variety of activities based on the seasons. For example, in warmer season, the space can be used as a fair space for families, for concerts in the night time; as an iceskating space in the winters and so on.


+ Biomassa Maalämpö The embodied-operational energy balance The thermodynamic spatial experience Capturing the nature´s renewable resources + Biomassa Maalämpö The embodied-operational energy balance The thermodynamic spatial experience Capturing the nature´s renewable resources + Biomassa Maalämpö The embodied-operational energy balance The thermodynamic spatial experience Capturing the nature´s renewable resources Inspired by the Natural Resources Microclimate studies for maximized outdoor comfort Core Energy Efficiency Concepts Hybrid Structure Visitor experience heightened due to thermal stimuli Sustainability goals Carbon footprint comparison Maximised Comfort at outdoor spaces by microclimate enhancement Unblocked solar exposure to all open spaces The facade break down the winds and deflects the streams away. The trees further act as wind barrier A robust building heart that lives for 100 years Flexible outer structure for multi functionality Ground source heat pumpv = + Separation of structural components Wooden columns and slabs Concrete walls and stairs kgCO2e Tuotevaihe (A1-A3) Rakentaminen (A4-A5) 25,000,000 20,000,000 15,000,000 10,000,000 5,000,000 Betonirakenne Hybridirakenne 0 1 2 3 4 5 6 7 8 9 10 Very high sun exposure Low sun exposure Limited sun exposure High sun exposure Sunlight hours, clear sky (h) Wind Study Sunlight Hours Perceived Temperature Sunlight hours experienced for an average day in April Experienced temperatures for an average day in April, at 13:00PM Prominent winds from West & South-West study Expanding the human comfort season across all outdoor spaces Calm winds create pedestrian-friendly open area Sheltered area in the wind shadow region at the top levels Expansive open space that partially receives 6 hours of sunlight even in March Decent temperature of 4-8°C in the open space Lower temperatures of 2-4°C in the higher areas >7 hours of sunlight along the Beach park The structural facade
Geothermal
Wind Study Sunlight
Temperature Prominent winds from West and South-West Sunlight hours experienced for an average day in April Experienced Temperature for an average day in April, at 1PM
Biomass
Energy
Hours Perceived
Minimal Operation Energy Low Carbon Footprint Maximized Outdoor Comfort Final Structural Composition Timber Facade and slabs Concrete Core 60% reduction in embodied carbon when compared to a Build-As-Usual scenario Using recycled material that have longevity Unblocked solar exposure at outdoor spaces with shelter from cold winds 50+ Years Curtain Wall 75+ Years Hybrid Slabs 35+ Years Timber Facade 100+ Years Concrete Core
Email | Website | LinkedIn | GitHub
