
ISBN: 978-91-8040-418-1 Trita: A-2223
KTH School of Architecture 2022 Printed by US-AB
Student Editors: Axel Åström Yang Xu Editors: Erik Stenberg Jelena Mijanovic


Teachers
Students
Katharina Maria Bitschnau, Gottfrid Björk, Robert Capaldi, Yingnan Chen, Maria Dalmer, Alice Erkhammar, Tinghao Feng, Isabella Fyfe, Ludvig Göktürk, Natalia Hedström, Fadri Horber, Torulf Jörnholm, Timothy Charles Lewis, Gabriele Lipskyte, Robert Magnusson Årebo, Robbin Modigh, Maja Nordblom, Eszter Olah, Claudia Pavilanis, Hongting Xu, Yang Xu, Yuchao Zhang, Axel Åström










4 MassMassHousingHousing Studio
Erik Stenberg Jelena Mijanovic
Table of contents
The answer is mass housing 6
LCA Timeline, housing units 8
Doughnut Diagrams 10
Norra Kvarngärdet 13
Background 14 Building Structure 16 Use & Living Conditions 18 Is it Sustainable? 20
Karl Marx-Hof 23
Historical context 24 Funding 25 Construction 26 Living in Karl Marx-Hof 27 Housing for all 28 Housing evolution 29 Refurbishments 30 Vienna today 31
Vollsmose 33
Planning 34 Construction 35 Life in Vollsmose 36 Renovations 37 Deconstruction 38 Reuse 39 Co-Housing 40 Vollsmose past - present - future 41
Vällingby 43
Historical context: the first ABC city in Sweden 44 Construction 45 Living in Vällingby 46 Maintenance 48 Situation today 50
Gottsunda 53
Historical question 54 Different features of Gottsunda 55 Economics features 56 Two cases — 57 Renovation case study 58 Question for today 59 Future development 60 Future housing 61
Bagarmossen
63
Preconditions 64 Constructions & materials 65 Use - social 66 Use - ecological 67 End of life - social/economical 68 End of life - ecological 69 Ideas for the future Bagarmossen 70 A changing population? 71
Bijlmermeer 73
Context 74 Modernism in Amsterdam 75 Construction 76 Use 77 Renewal 78 Renovation 79 Holding on to the dream 80 Today’s status 81
Märkisches Viertel 83
Timeline 84 Construction 85 Living in Märkisches Viertel 86 Renovation 88 Conclusion 90 Potential 91
Bibliography 93
Appendix 102 Norra Kvargärdet 102 Biljmermeer 106
5 Mass Housing
Introduction
Muddy and Motley Mass Housing for Millions of Homes
In the opening remarks of the International New Town Institute 2020 conference Taking Back Housing, Director Michelle Provost wondered why “...social housing, or affordable rentals, are now seen to be for losers…”? This remark can be understood as a critique of current European (and possibly global) housing practices where market driven solutions have not been able to develop adequate mass housing solutions for all. The conference went on to present a number of novel initiatives and critical perspectives on providing housing alternatives for a more and more desperate and growing group of urban dwellers. Why is an increasing number of groups of residents of the contemporary city left without the reasonable and qualitative choice that mass housing used to provide? This, the contemporary version of the Housing Question, is what we will consider in the Muddy and Motley Mass Housing for Millions of Homes Studio (4M2H) at the KTH School of Architecture throughout the academic year 20222023.
During the first project of the Fall Semester 2022, the students of 4M2H have explored mass housing solutions for a sustainable urban future through revisiting a selection of mass housing areas, such as the historical ABC-City Vällingby in Sweden and the large urban estate Märkisches Viertel in Berlin. We have looked at both Swedish and international examples of building mass housing to solve the
conflicting needs and desires of housing for the masses. This will shape a foundation for our future studies of guiding principles of mass housing during the 20th century. By interpreting living conditions and structural systems, we confronted issues of dwelling, domesticity, culture, tectonics and construction. An important aspect in the first project was the documentation and communication of our research findings. The methods and concepts of sustainability in mass housing were the broad focus and starting point. The narrower scope was to look at mass housing solutions that address the topics: Housing for All, Affordable Housing, Co-Housing, and Social Housing. The work was structured in weekly assignments looking at the social, economic, and ecological aspects of sustainability. The student’s findings were then organized following the building’s or residential areas whole life cycle; starting with the understanding of the contextual framework that made the projects possible, raw material extraction, construction, use/ living in the building, end-of-life and even looking into potential re-use in a new building project. These do not necessary mean cataloguing in an ordinary sense, but more as ways of exploring representation in drawings and model making in order to communicate research.
6 Mass Housing
What you are looking at is the catalogue of the students’ collective work for the first seven weeks. It takes its title from a lecture presented to the Housing Studio last academic year by Chalmers’ Professor Emeritus Claes Caldenby. He framed the history of Co-housing as an answer in search of its question. Over time, Caldenby explained, there have been a number of societal and architectural questions that have led to the same answer: Co-housing. How can we organize housing more efficiently? How can we make housing more sustainable? How can we promote more social interaction and use fewer square meters per person? We posit that Mass Housing has had the same fate and have re-framed the title of the lecture to reflect this perspective. Throughout the twentieth century, Mass Housing was the constant answer. Why has mass housing held this answer for so long and what are the contemporary questions?
During the remainder of the semester, the studio will continue to map an understanding of the history of mass housing architecture from a material, tectonic, structural and technological standpoints as well as engage in questioning the architect’s role in designing new living environments and its effects on society. With the contemporary housing question and sustainability as a springboard, the studio will deepen the understanding of how to develop the existing built environment and therefore limit the effects of new architectural production on our
environment. By analyzing and investigating how and why technologies such as industrialization and pre-fabrication have performed over long periods of time and how individual and common living conditions have been designed and adapted over time, we will be able to deconstruct conceptions of sustainability, mass housing and the role of the architect.
7 Introduction
“ The Answer is Mass Housing, but what is the Question?”
Norra Kvarngärdet Sweden WAR
Karl Marx Hof Austria
Vollsmose Denmark
Vällingby Sweden
Gottsunda Sweden
Bagarmossen Sweden
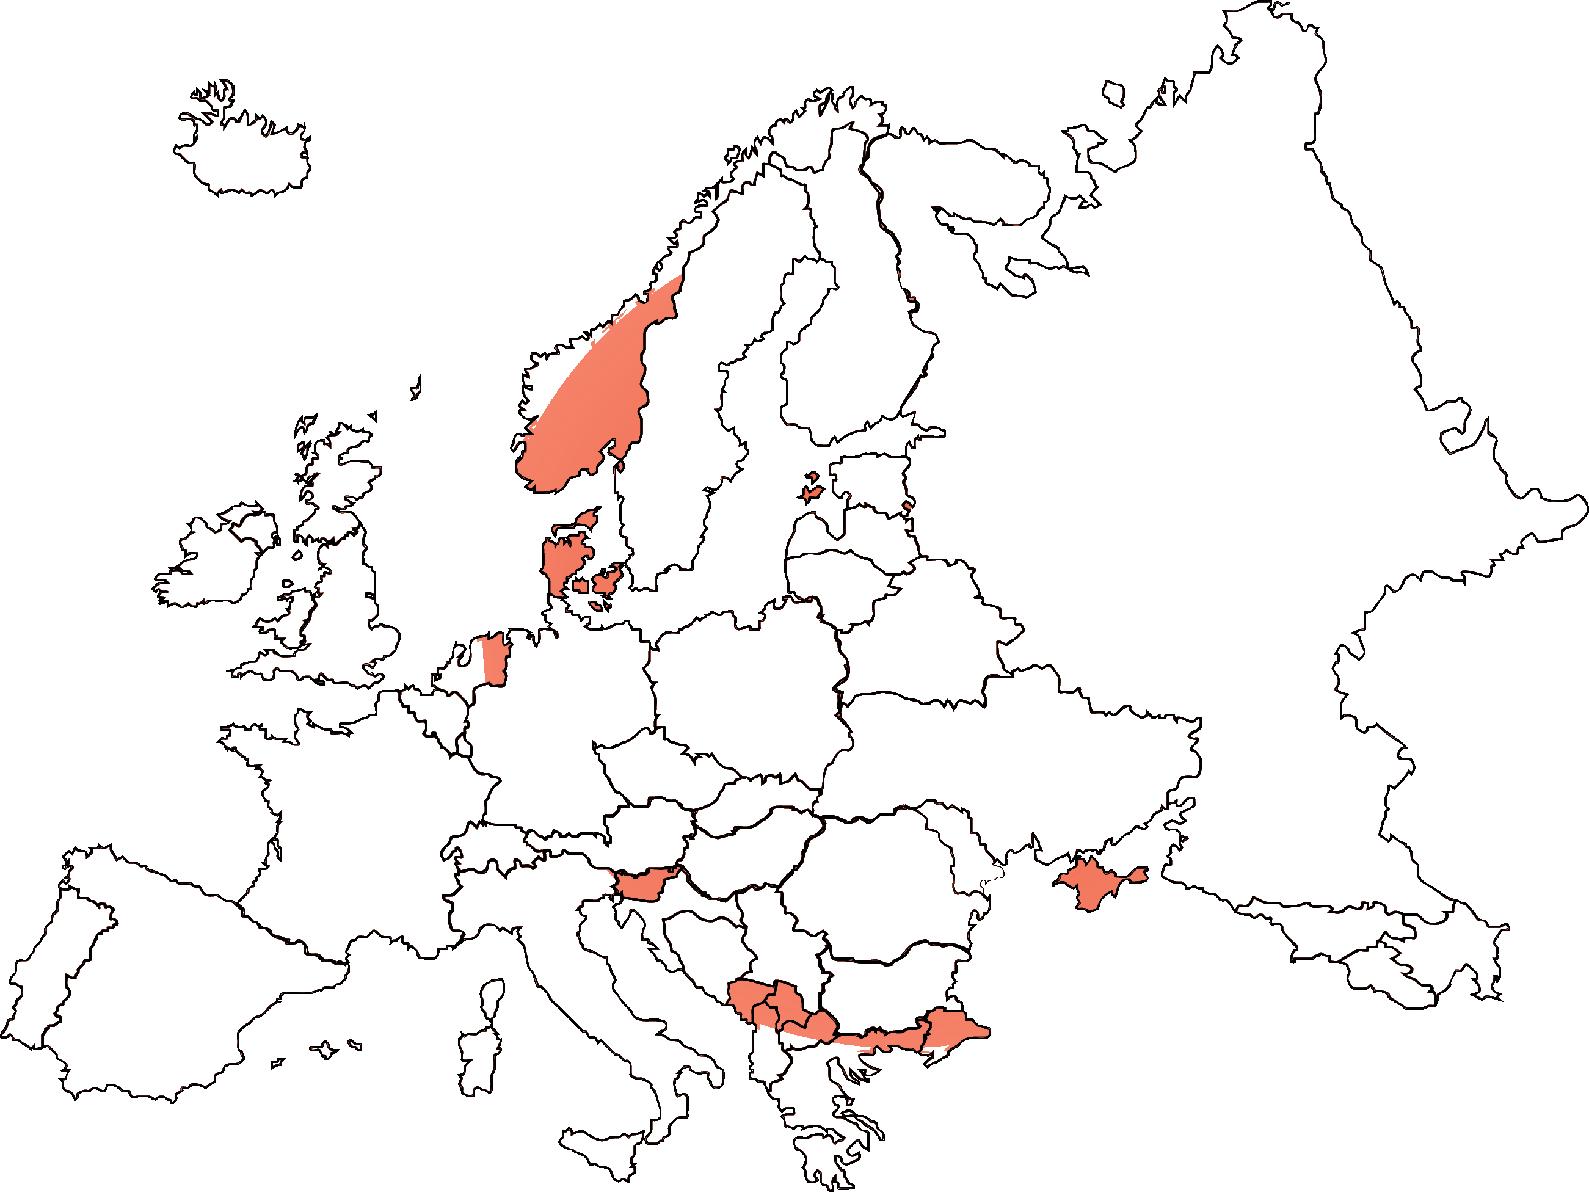
Bijlmermeer Netherlands
Märkisches Viertel Germany
8 Mass Housing
LCA Timeline, housing units
DESTRUCTION
0
A Construction B Use C Renovation World
II 1930 1940 1950 GSEduca iona Ve sion
OTTO WAGNER’S VIENNA LOSS AND COLLAPSE OF AUSTRO-HUNGARIAN EMPIRE OCCUPATION
Context LCA (Life Cycle Assesment) concept was took as reference for the stages.
War
POST WAR
9 LCA Timeline, Housing Units Global Oil Crisis Ukraine Crisis 1960 1970 1980 1990 2000 2010 2020 FALL OF THE BERLIN WALL SEPARATION OF GERMANY CENTRUM SOLD TO PRIVATE REAL ESTATE COMPANY SURINAMESE INDEPENDENCE PLANE CRASH DEMOLITION GHETTO LIST RENTAL CRISIS WAR REFURBISHMENT RESTAURATION BECAME PROTECTED HOUSING AREA RENTING PRICES INCREASED NEW DEVELOPMENT PLAN 1447 housing units 1550 housing units 3638 housing units 3885 housing units 5000 housing units 5767 housing units 13000 housing units 17000 housing units MILLION PROGRAM
MARX HOF
MARX HOF
10 Mass Housing Social Fo u n d a t i o n G r eenh ouse gasemission Climate Freshwater Consump t io n Lsso fo ytisrevedoiB noitatserofeD retawdnuorG oP l ul t oi n E c ological Ce i l i n g emocnI dE u c a t ion Living Condition W o r k
Social Fo u n d a t i o n G r eenh ouse gasemission Climate Freshwater Consump t io n Lsso fo ytisrevedoiB noitatserofeD retawdnuorG oP l ul t oi n E c ological Ce i l i n g emocnI dE u c a t ion Living Condition W o r k NORRA KVARNGÄRDET Social Fo u n d a t i o n G r eenh ouse gasemission Climate Freshwater Consump t io n Lsso fo ytisrevedoiB noitatserofeD retawdnuorG oP l ul t oi n E c ological Ce i l i n g emocnI dE u c a t ion Living Condition W o r k KARL
Social Fo u n d a t i o n G r eenh ouse gasemission Climate Freshwater Consump t io n Lsso fo ytisrevedoiB noitatserofeD retawdnuorG oP l ul t oi n E c ological Ce i l i n g emocnI dE u c a t ion Living Condition W o r k GOTTSUNDA No Data Doughnut Diagrams Social Fo u n d a t i o n G r eenh ouse gasemission Climate Freshwater Consump t io n Lsso fo ytisrevedoiB noitatserofeD retawdnuorG oP l ul t oi n E c ological Ce i l i n g emocnI dE u c a t ion Living Condition W o r k BAGARMOSSEN Social Fo u n d a t i o n G r eenh ouse gasemission Climate Freshwater Consump t io n Lsso fo ytisrevedoiB noitatserofeD retawdnuorG oP l ul t oi n E c ological Ce i l i n g emocnI dE u c a t ion Living Condition W o r k NORRA KVARNGÄRDET Social Fo u n d a t i o n G r eenh ouse gasemission Climate Freshwater Consump t io n Lsso fo ytisrevedoiB noitatserofeD retawdnuorG oP l ul t oi n E c ological Ce i l i n g emocnI dE u c a t ion Living Condition W o r k KARL
Social Fo u n d a t i o n G r eenh ouse gasemission Climate Freshwater Consump t io n Lsso fo ytisrevedoiB noitatserofeD retawdnuorG oP l ul t oi n E c ological Ce i l i n g emocnI dE u c a t ion Living Condition W o r k GOTTSUNDA No Data
BAGARMOSSEN
11 Doughnut Diagrams Social Fo u n d a t i o n G r eenh ouse gasmission Climate Freshwater Consump t io n L sso fo ytisrevedoiB noitatserofeD retawdnuorG oP l ul t noi E c ological Ce i l i n g emocnI dE u c a t ion Living Condition W o r k VOLLSMOSE Social Fo u n d a t i o n G r eenh ouse gasemission Climate Freshwater Consump t io n Lsso fo ytisrevedoiB noitatserofeD retawdnuorG oP l ul t oi n E c ological Ce i l i n g emocnI dE u c a t ion Living Condition W o r k VÄLLINGBY Social Fo u n d a t i o n G r eenh ouse gasemission Climate Freshwater Consump t io n Lsso fo ytisrevedoiB noitatserofeD retawdnuorG oP l ul t oi n E c ological Ce i l i n g emocnI dE u c a t ion Living Condition W o r k BIJLMERMEER Social Fo u n d a t i o n G r eenh ouse gasemission Climate Freshwater Consump t io n Lsso fo ytisrevedoiB noitatserofeD retawdnuorG oP l ul t oi n E c ological Ce i l i n g emocnI dE u c a t ion Living Condition W o r k MÄRKISCHES
VIERTEL
Norra Kvarngärdet
Location: Uppsala, Sweden Size: 1447 units
Years of construction: 1962-1967
Case study by: Katharina Bitschnau
Gottfrid Björk
Fadri Horber
Background

Norra Kvarngärdet was built on the outskirts of Uppsala on what was then countryside and farmland. The entire area was designed by AnckerGate-Lindegren but mainly drawn by Stig Ancker on the order of the municipal housing company, Uppsalahem. The area was built with apartments and a small center consisting of a school and a grocery store. Land costs back then were low as it was far from the city center. Originally, the idea was to build the area with 3-7-storey houses, which was common during the Million Program era. This plan changed since the ground conditions were not suiting. The soil was soft, which meant that they decided to build low rise houses instead, with a new technique where the houses “floated” on the ground. They did so in order to avoid piling into the ground and keeping the costs to a minimum.
This was the first housing area in Sweden built as low and dense. This in turn gave the houses a preservation order, which means that the houses are protected from new exploitation.
2. 5 km ra dius

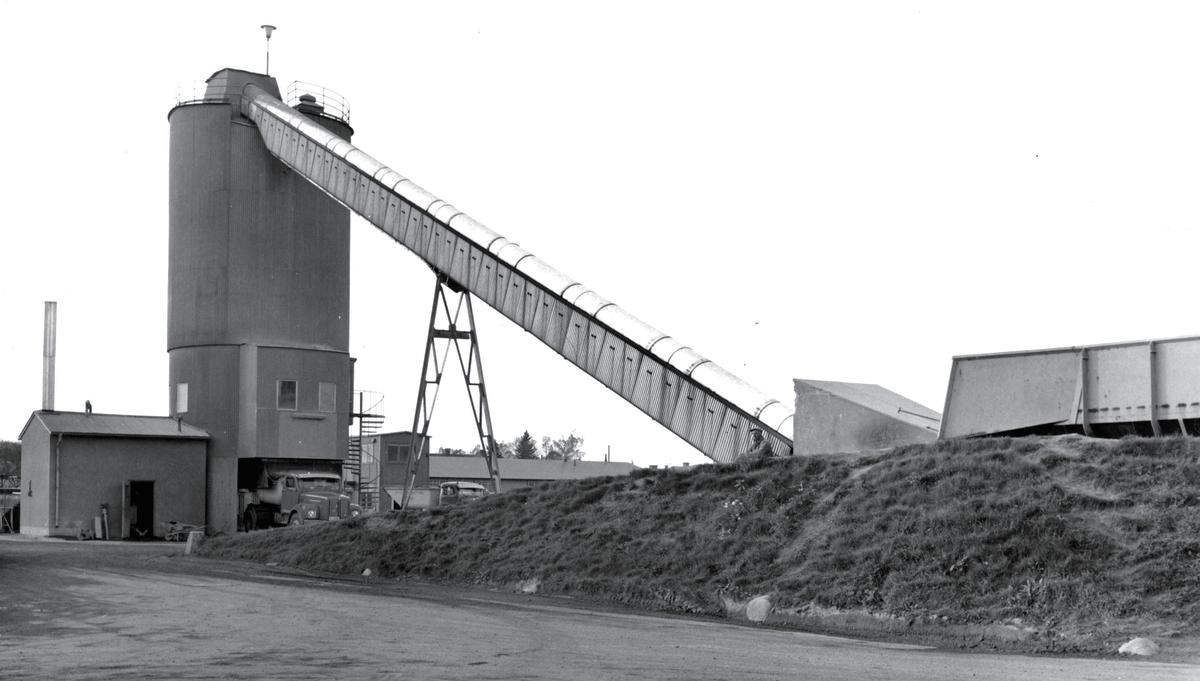
Figure 1.2.
Mass Housing from the 1960s

Figure 1.1.
Uppsala
14 Mass Housing
Historical building material suppliers (Aerial photo from 1975; https://www.lantmateriet.se/)
Upplands Betong (Photo by Evert Skirgård)
S:t Erik factory since 1909
Upplands Betong
Norra Kvarngärdet
Uppsala has grown rapidly, which has also led to Norra Kvarngärdet being considered as a central area today. Therefore, in recent years, Norra Kvarngärdet changed significantly. A number of non protected areas have been repurposed in order to create more space for new dwellings. For example, the former car parks from the 1960s are now a series of new residential buildings. The supermarket in the center was demolished and replaced by highrise apartment buildings. These areas were not part of the listed assembly, which made it possible to build new in an area that don’t have a preservation order. With the higher land costs today, it is more profitable to build higher and to undergo expensive ground piling. The new and taller houses form a “ring” around the historical area, which leads to visual segregation (fig.1.5).

Figure 1.3.
Figure 1.4.
1.5.
Norra Kvarngärdet
1960s, section west / east (Illustation based by Jolirak 2013-08-23)

Present, section west / east (Illustation based by Jolirak 2013-08-23)

15
Figure
Photo from site, 2022: looking at the new higher neighbourhood (Photo by Katharina Bitschnau)
Parking lots
Present
New Housing development
Housing
Building Structure
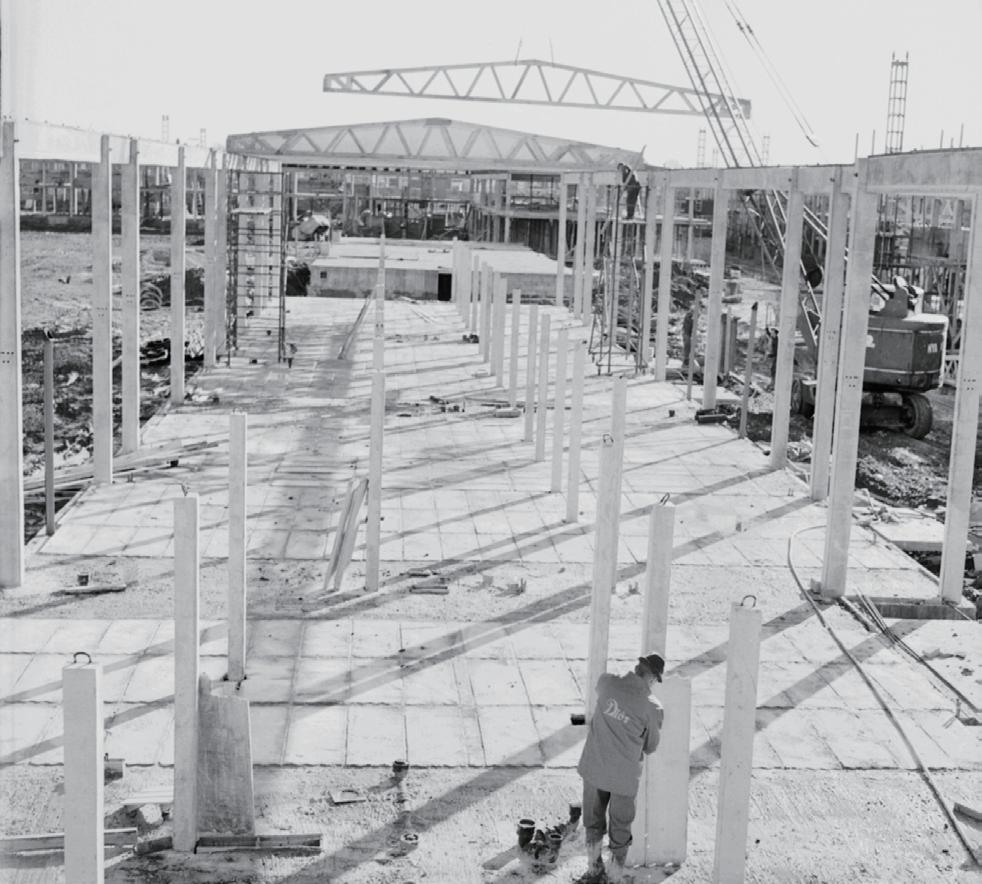
The structure of the low rise buildings is composed of 2-storey prefabricated concrete columns on the exterior wall. 1-storey prefabricated concrete in the inner part of the building. The concrete slab separating the two floors is also composed out of prefabricated concrete. The roof structure is composed out of prefabricated wood trusses, making it light-weight, thus interior columns are not needed for the upper floor. The columns are the main supports for the building, making the layout highly flexible if needed. The walls dividing the units, as well as the interior partitions are not loadbearings, thus the units and the entire floor can be altered as needed (fig.1.6, fig.1.7 & fig. 1.8).
The raw material that were used on these houses are for the most part locally sourced, in the vicinity of Uppsala (fig.1.2). Since it was housing for all, the cost had to be as low as possible. Saving money on transportation is a big factor in the production of locally sourced material. Prefabrication of certain elements also reduced the construction time-line, thus having a positive impact of the cost of the projects.
Figure 1.6.
Mass Housing from the 1960s
Figure 1.7.
Figure 1.8.
Detail based on (AGL Arkitekter plans from Archive)
16 Mass Housing 12 7 7 26
12 cm Brick 7cm Mineral wool insulation + wood structure 7cm Lightweight
F
concrete
açade structure
Revit model based on (AGL Arkitekter plans from Archive)
Nybygge på Kvarngärdet (Photo by Uppsala-bild 1963)
The structure of the new 5-storey buildings consists of prefabricated load bearing concrete walls, as well as prefabricated concrete floor slabs. The prefabricated load bearing exterior walls consist of the insulation as well as the façade material (fig.1.9, fig.1.10 & fig. 1.11). This strategy speeds up the whole construction process, but limits the overall flexibility of the units. Since the walls are loadbearing, the flexibility of each floor, and of the units itself are very limited.
As the building industry is on a more global scale, we presume that most of the elements used are not locally sourced, taking advantage of the globalization of the industry, this helps to reduce the overall cost of the projects. With lower construction cost, the units can be sold at a competitive rate, emphasizing profits over living conditions.

Figure 1.9.
Figure 1.10. Figure 1.11.
17 Norra Kvarngärdet 5
25 10 40 5 25 10 40
5 cm Façade
10 cm Mineral wool insulation 25cm Concrete
F
Present Housing
material
panels
açade structure
Detail based on observations Revit model based on observations
Construction process (Street View from Google Maps 2017)
Use & Living Conditions
In the low-rise housing area from the 1960s, more emphasis was paid on the green spaces and common areas around the houses. This means that care was taken at the planning stage to ensure that there are plenty of communal spaces. This is most evident in the northern part, where there is a clear traffic separation according to SCAFT, where the outdoor areas have been more clearly separated from car traffic to create a nicer and safer outdoor environment. The ground coverage for the low and dense buildings is only 36%. The low and dense buildings give the impression of living in detached family houses, so that one has the feeling of not being in the centre of Uppsala (fig.1.12).
Mass Housing from the 1960s
Typical 3-room apartment Each unit has on avarage 75 m2 to 80 m2 0
Apartment size 75 m2
Rent per month 8 400 SEK Rent per m2 1 380 SEK Owner Stena Fastigheter Energy 132kWh/m2year consumption
Präsentation A3
The older houses also have a much lower rent than the new apartment buildings next to them. Moreover, the lower buildings in general offer larger flats and more common areas, which create a better living environment. Originally, the flats were very affordable. However, the recent renewal has pushed the rent up significantly. It increased by up to 60%. This is still slightly below average, but it has put a lot of strain on the tenants and some have been forced to move out (fig.1.13).
Related common outdoor area
Common outdoor area includes: Court yards Playgrounds Parking lots Service streets
AREA: 75 m2
Figure 1.12. CAD drawings based on (AGL Arkitekter plans from Archive and Aerial information from Eniro.se)
Diagram information based on (Fastighetstidningen and Uppsala Kommun)
Figure 1.16.
18 Mass Housing
Vog Landscha sa ch ek en AG p CH 8006 Zü h P o ek numme P o ektname Zür ch Datum
2019 Ma VECTORWORKS EDUCATIONAL VERSION VECTORWORKS EDUCATIONAL VERSION
Planvorlage
1:1 P0000 01 01
200 400 600 800 1000 1200
Mass housing Norra Kvarngärdet owned by Stena Fastigheter
Older housing in Uppsala in general Figure 1.13.: Rent in SEK per m2 / year 2200
1400 1600 1800 2000
The new housing development next to the Million Program area from the 1960s has a very different approach when it comes to terms of space and land use. The buildings are taller to maximize the number of square meters that can be built on the plot and they are placed much closer together. As a result, the total ground coverage is by 62%, which means that there is barley any outdoor space left. In general they create a more urban environment with shops on the ground floor and flats on the upper floor, which is unlikely for this neighborhood and more typical for the central parts of Uppsala (fig.1.14).
The rents for the newly built apartments are very high, while having smaller apartments and outdoor areas. This means that tenants get much less for what they pay for. Furthermore, the apartment rents are also significantly above the average rental prices across Uppsala. However, the queue for the new flats is about half as long as for the old housing, which states that affordable housing is still high in demand and that only a fraction of people can afford this kind of new housing. Respectively, this new housing development contradicts in many ways the original idea of the Million Programme, which focused on affordable housing and high quality outdoor areas and green spaces (fig.1.15).
Typical 3-room apartment
Apartment size 62 m2 Rent per month 11 130 SEK Rent per m2 2 160 SEK Owner Stena Fastigheter Energy 123kWh/m2year consumption
Präsentation A3
AREA: 75 m2 AREA: 62 m2
Related common outdoor area
Common outdoor area includes: Court yards Playgrounds Parking lots
Figure 1.14.
CAD drawings based on (Uppsala Bostadsförmedling)
New housing in
New
Each unit has on avarage 8 to 9 m2 0
owned by Stena Fastigheter + 64% + 62%
2200 200 400 600 800 1000 1200 1400 1600 1800 2000
Figure 1.15.: Rent in SEK per m2 / year
Diagram information based on (Fastighetstidningen and Uppsala Kommun)
Present, Cross-section west / east (Illustation based by Jolirak 2013-08-23)
19 Norra Kvarngärdet
GSEducationalVersion V g L d h h k AG St b h 7 CH 800 Zür ch P o ektnummer Pro ek name Zür ch Da um
1 P0000 01 01 2019 M VECTORWORKS EDUCATIONAL VERSION VECTORWORKS EDUCATIONAL VERSION P l a n v o r l a g e P r ä s e n t a t i o n
VECTORWORKS EDUCATIONAL VERSION
Planvorlage
A 3
Norra Kvarngärdet
housing in Uppsala in gerneral
Present Housing
Is it Sustainable?
In the comparisons between the new dwellings and the mass housing from the 1960s, the findings are that the older neighborhoods are more sustainable than the newer ones. Firstly, they are more spacious both when it comes to the apartment sizes as well as the outdoor areas. This in turn creates better living conditions for its residents, while being more affordable than the average housing in Uppsala. However, the recent renovation led to a significant rental increase. To ease the burden for the tenants, they came up with a schedule to spread the rental increase over a 3 year period. Consequently, when rents are raised dramatically, the issue arises that the residents are pushed out of the city center, increasing the pressure on affordable housing to the outskirts. This has led Norra Kvarngärdet to become more segregated, as affordable rents are no longer viable. Secondly, these houses are protected so there has not been any major changes to the façades, and the owners are forced to renovate rather than to replace. This reduces material consumption and the works taken place are more economical and sensible. Thirdly, the buildings are built with columns and slabs since only the columns are load-bearing, it becomes much easier to move interior walls, this provides a more flexible design that makes adjustments easier and can be tailored to the users needs. This also allows

Figure 1.18.
Mass Housing from the 1960s
the interiors to be changed throughout the years which is especially important as the exterior of the houses are protected. Finally, we would argue that the initial energy consumption during construction of Stig Anckers’ buildings is significantly lower because materials are sourced locally. The construction methods in regards with materials were efficient and with the recent renovations, the running energy consumption could be reduced, holding up to current industry standards (fig.1.17 & fig.1.18).
nergy consumption
iousness afford ability
adabtabi
durability
Figure 1.17.
material sourcing
Diagram based on (Kate Raworth’s Doughnut Economics)
20 Mass Housing
Photo from site, 2022: Courtyards of the 1960s housing (Photo by Katharina Bitschnau)
GSEd V e
s p ac
l i t y
By observing the new housing development, it is clear that it cannot compete with the neighboring past mass housing scheme in the following aspects. Firstly, the apartments are in general smaller along with the outdoor areas because the new development is built to densify the area as a whole, while taking away precious greenspaces from Norra Kvarngärdet. Since these apartments are newly built, the residents are expected to pay higher rents, even though they are offered less living space. Secondly, the new buildings are not protected, that means that more changes can be made to the exterior, and are subjected to be demolished and re-built in the near future. The new built neighborhood, has a prefabricated load-bearing wall and slab construction. This system does not differ between load-bearing and space dividing elements. Therefore, these apartments are rather static. That makes it difficult and expensive to change their layouts. As a result, tenants are more likely to move out, if their living situation changes. This limits the possibility to accommodate the ever changing needs of the tenants. Thirdly, for the most part, the new façades are not built with the same quality of materials and will probably need to be renewed after a shorter period of time, one can also assume that the materials and elements used for the interior also have a lower quality, resulting in more frequent

Figure 1.20.
Present Housing
renovation processes. Finally, the materials are not sourced nor manufactured locally, the globalization of the construction industry leads to higher greenhouse gas emissions, that arise from the transportation sector in order to bring the materials on site. Additionally, the energy performance of the new construction is barely better than the renovated housing from the 60s. In these projects, one would think that the buildings are energy efficient as a whole, however, it turns out that the mass housing of Norra Kvarngärdet, are almost at par, even though these projects were constructed 50 years apart. (fig.1.19 & fig.1.20).
Figure 1.19.
21
Norra Kvarngärdet
Photo from site, 2022: comparing the two neighbourhood (Photo by Katharina Bitschnau)
GSEd V
energy consumption
material sourcing
durabilit y s p a c iousness afford ability
adabtabi l i t y
Diagram based on (Kate Raworth’s Doughnut Economics)
Karl Marx-Hof
Location: Heiligenstädter Straße, Vienna, Austria
Size: 156,000 m², 1,382 units
Year of completion: 1930
Case study by:
Robert Capaldi
Robert Magnusson Årebro Axel Åström
Historical context
Figure 2.1.
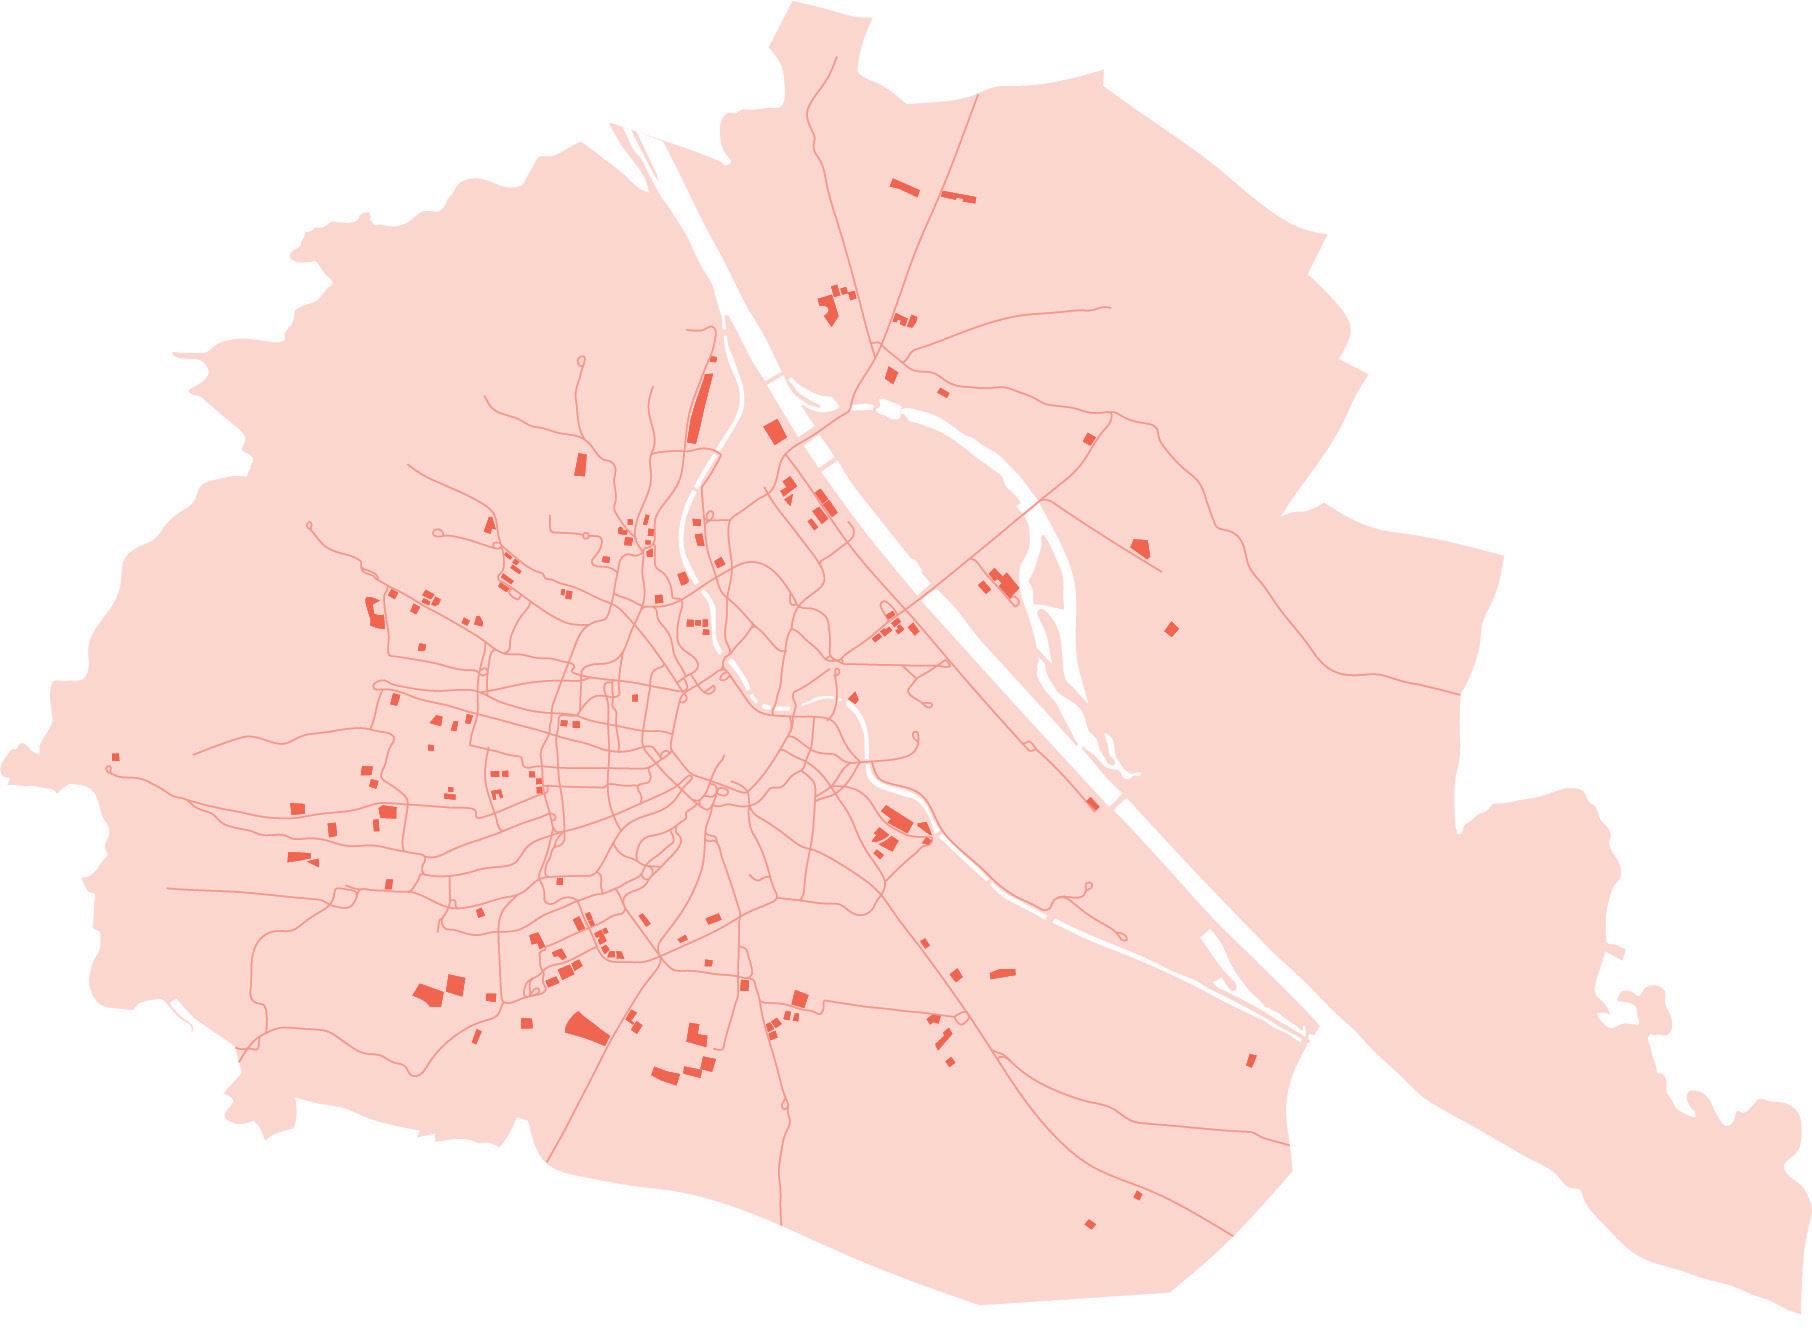
Red Vienna
Post-war Vienna was a cultural melting pot where the working-class converged under poor living conditions. In 1919, the number of households in the city had increased, which in combination with stalled construction, galloping inflation and an influx of workers resulted in severe overcrowding and a widespread housing shortage. The standard of the existing housing stock was generally low, plagued by sanitary issues, poor air quality, excessive moisture, and lack of natural light. It was under these circumstances that the Social Democrats gained control of the municipal administration and declared housing as a fundamental need for all humans,
stating that ’’A good, spacious, and bright home is an important cultural factor in every person’s life’’.
Consequently, housing construction was declared a social product and integrated into social policy. The call for affordability and improved living conditions marked the start of a period known as Red Vienna, during which the Viennese municipality pursued a series of rigorous social housing programs across the city. The social democratic administration also introduced several taxation schemes aiming to stimulate the economy and raise the necessary funds for the planned municipal housing programs.
24 Mass Housing
Municipal housing projects in Vienna, 1934 (Wienbibliothek.at, 2022)
The start of Red Vienna Breitner’s tax is introduced 1st housing construction program
Karl Marx-Hof is completed
Karl Marx-Hof
Vienna becomes a federal province
2nd housing construction program
The fall of Red Vienna
1919 1922 1923 1927 1930 1934
Funding
Factories produce materials for social housing built by government owned construction companies
Factories employ the working class
Government runs the factories, allowing them to control both working conditions and output

The worker pays tax to the government
The new housing increses the living standard of the workers

By taxing assets, the government activates stale cash, allowing it to re-enter the economy and boost production
Figure 2.2.
New taxation policy
In 1923, Hugo Breitner, the City Councilor of Finance, introduced a new tax system that taxed people progressively according to their expenditures. The new tax reform included a variety of different taxation schemes, designed to allocate the costs from the poor majority to the rich minority.
Breitner abolished the existing flat tax on rental units and replaced it with one that only affected the top 20 percent of rents. A progressive housing construction tax was also introduced, which was mainly aimed at larger properties and luxury apartments. These were taxed at extraordinarily high rates, while the
Government gets returns in form of rents, taxes and profits
The politics that built Karl Marx-Hof (2022)
working-class residences were left relatively untouched. Breitner’s taxes were also imposed on luxury goods to raise further funds for investments in social and public infrastructure.
Examples of taxes implemented
- Social wellfare fee - Car tax
- Concession tax - Pitch fee
- Entertainment tax - Horse fee
- Subletting fee - Sales tax
- Service charge - Utilities tax
- Meals and drinks charge - Advertising fee
Karl Marx-Hof
25
Rent relative to income
Pre-war Red Vienna
Figure 2.3
Figure 2.4.

The five year plan

Figure 2.5. Annual construction rate (10=10 000 units) (Blau, Eve, 1999)
In 1923, the municipality of Vienna announced a major housing development plan, consisting of 25 000 units over a five-year period. The construction goal was reached one year in advance and exceeded by 5 000 units in 1928. Therefore, the second five-year plan was initiated one year earlier than planned, in 1927, with a more ambitious goal of 6 000 dwellings a year until 1932.

To streamline the construction process, everything from metal fittings to windows and park benches was standardized and mass-produced. The standardization of building components was so
Resource extraction sites (Wienbibliothek.at, 2022)
Standardization streamlined production (2022)
extensive that even the dimensioning of bricks was affected. The construction material was transported by municipally owned trams and trains, which further reduced construction costs.
Raw materials were locally sourced, with the majority coming from within the city limits. Limestone was transported from quarries west of the city and bricks were produced in the southern district of Ober-laa. The close contact with production made the Viennese builders informed customers, allowing them to maintain a high standard of materials without going over budget.
26 Mass Housing Construction
1923 1922 1925 1927
Launch of second housing program 1929 1924 1926 1928 1930 1931 1932 10 20 30 40 50
Karl Marx-Hof
Limestone quarry Kaltbrunn Limestone quarry Hinterbrühl
Oberlaa brick kilns
Living in Karl Marx-Hof
Figure 2.6.
Figure 2.9.
Figure 2.7.
6 m
Figure 2.8.
Improved living conditions
The schematic plan of Karl Marx-Hof is related to the load bearing ‘heart-wall’ centrally located throughout the plan (Fig. 2.9). The structure is stabilized by the ‘towers’, which are shown in plan (Fig. 2.8) as rooms with a dept of 6 m.
Horizontal construction such as slabs, floors and roofs were standardized concrete elements, while the vertical structure was made in brick (Fig. 2.11). Although the bricks had standardized measurements (Fig. 2.10), this was a time-consuming method. A necessary element to increase labor and involve as many workers as possible in construction.
Figure 2.10. Figure 2.11.
Karl Marx-Hof drawings (2022)
Since its completion, Karl Marx-Hof has gone through a series of alterations and updates. Since the original plan was supported by communal baths the most natable is changes in the bath- facilities. The kitchen and bath has a determent relation to each other thanks to the original piping (Fig. 2.8).
The complex was originally designed to house around 5 000 tenants. However, as living standards improved, the apartments were inhabited by fewer people. Today, the number of tenants has decreased significantly to around 3 000. The households are generally smaller and home to 1 or 2 people.
Karl Marx-Hof
27
Housing for all
Figure 2.12.
Figure 2.13.
Courtyard space throughout the years (2022)
Site plan, Karl Marx-Hof (2022)
Figure 2.14.
More light, more space
The issue of housing and its social significance had been approached during the 19th century. Largely at the mercy of speculation of land within the free market. The result was an exploitation rate of up to 85% of the plot. 83% of all apartments where small or minimal flats, 16 to 40m². 44% of the oneroom apartments housed more than 3 persons while 36% of the two-room apartments housed more than 5 persons.
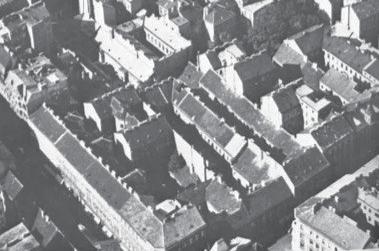
Out of this inadequacy, the social democratic municipality stated a new agenda turning to new ideals regarding the social housing policy: That
Increased living space (2022)
Figure 2.15.
Ottakring, Vienna (Wulz, Fritz, 1979)
Figure 2.16.

Aerial view, Karl Marx-Hof (Wienbibliothek.at, 2022)
only healthy and sufficiently spacious housing should be built. This policy originated with a new ideal: 70% of the plot was to be left unbuilt.
In Karl Marx-Hof as much as 83% of the plot was left unbuilt. The shifting morphology of the volumes creates a variation within the urban context, as well as including the citys fabric, roads, gardens, within the structure. This creates a social and ecological urban strategy that holds until today in Vienna. The importance of social, sanitary and hygienic aspects changed from a technical aspect into an acitve socio-political stance.
28 Mass Housing
15 % 50 % 70%
Housing evolution
Dwellings before Gemeindebau
This survey, who reaches from the mid 1700-dwellings until the 1900-dwellings of Karl MarxHof, is investigating the inhabitants relationship to basic living qualities. Relationship to the street is of importance, hence it points out a citizens relationship to public space within the city.
Manufakturhaus (mid 1700) a common way of housing was related to place of employment, in this case a “Weinhauerhaus” a production factory for wine and spirits. The master and manufacturer was living in the front while the workers shared space in the back, facing the yard and the manure stack.
Rinnböckhof, (1864) A planned hosing facility for workers under the employer Josef Rinnöck. This strategy for houising allowed connection to the facade and surroundings, allthough structures like this was usually built outside the city limits. There are eleven units, 16-40 m² of living space, connected to one single shared corridor that access to 4 toilets. The avarage occupancy rate of 5 persons meant that 55 people was compelled to share 4 toilet facilities.
Bassenahaus (end 1800) A commonly used scheme for housing under the bourgeois free market approach to Vienna. The middleclass dwellings are located in relation to the street while the workers are located to the backyard. The common corridor is only providing secondary light to the apartments, while the centrally located courtyard (15% of the plot) is providing less than effecient daylight to the 5 units shared among workers. With an occupancy of 5 people - 25 tennants shared 3 bathrooms among them.
Karl Marx-Hof (1927-1930) 57m² is shared between 2-3 occupants, 4 units is distributed around the staircase. The toilet facilities has been moved inside the apartments while the common spaces are placed centrally in the plan. The apartments windows are now facing the street, and the greater couryard (83% of the plot) presenting another social class to the public life in Vienna.
Figure 2.17. Generic floor plan, Manufakturhaus
Figure 2.18. Floor plan, Rinnböckhof
Figure 2.19. Generic floor plan, Bassenahaus
Figure 2.20. Floor plan, Karl Marx-Hof
Karl Marx-Hof
29
Street Street Street Street Master dwelling Worker
Worker Worker Middle Class
Courtyard Courtyard Courtyard Common Common Common Wc Wc Wc Wc
Worker
Dwellings
Refurbishments
1950s
Reparation of the damage caused during the Austrian Civil War
€35 €30 €25 €20 €15 €10 €5
1986 - 1992

General restoration including the installation of new water pipes, lifts, windows, and doors
2010 - 2015
Refurbishment including roofs, terraces, loggias and surfaces
Figure 2.22. Figure 2.21. EU Waste Hierarchy (environment.ec.europa.eu, 2022)
Conservation measures
Refurbishment funding (in millions) (geschichtewiki.wien.gv.at, 2022)

Since its completion, Karl Marx-Hof has undergone a series of refurbishments, to restore original details and modernize the apartments according to today’s standards. The first refurbishment took place in the 1950s, during which the damage that was caused during the Austrian Civil War was repaired. Between 1989 and 1992, a general restoration was carried out, including the installation of new water pipes and lifts as well as energy efficient windows and doors. Smaller units were reconfigured into larger ones and the building complex was connected to the district heating system, providing the tenants with central heating. The refurbishment was conducted in
accordance with the Vienna Housing Promotion and Rehabilitation Act, which contains provisions for the subsidization of new housing and the rehabilitation of existing residential buildings and dwellings. The renovation costs amounted to 32,4 million euros, of which 29,2 million originated from municipal funding.
In 2010, Karl Marx-Hof underwent its latest refurbishment, including roofs, terraces, loggias, and surfaces. General maintenance and modernization work was carried out, including the implementation of a new waterwell system for the irrigation of the large green areas.
30 Mass Housing
1 2 3
Reduction Recycling Recovery Disposal
Self-financed Municipal subsidies
Prevention
Most preferred Least preferred
Vienna today
Amsterdam
46%

Vienna 45% 650 € Paris 20% 1750 € 30
apartment 10 30
Figure 2.23.
1961 40 50
Figure 2.24.
Share of housing stock (%) (Data from Wiener Wohnen, 2018)
Figure 2.25.
Rent comparison in Europe (Data from Wiener Wohnen, 2018)
Property ownership in Vienna

Municipal flat Condominium House ownership Other main rent Other 10% 1000 € 20 40
Tenants Flat owners House owners Sub-tenants and others
Standard of municipal dwellings
Category A - Min. 30m2 floor space, kitchen, toilet, bath room; heating system or fixed heating installation
Category B - Bed/living room, kitchen, toilet, bathroom
Category C - Running water and toilet inside flat
Category D - No running water and/or no toilet inside flat
1971 1981 1991 2001 2017
Evolution of living space in Vienna (m² per capita) (Data from Wiener Wohnen, 2018)
Vienna, the world’s best city?
Today, the City of Vienna excels in a variety of different fields. Most notably is probably the city’s high quality of life, as international surveys have suggested many times over. On closer inspection, it’s easy to see why the viennese model is so highly regarded. The city offers among the most affordable, accessible and stabile housing in Europe, with low rents, short waiting lists and long-term leases.
Today, subsidized rental apartments make up a quarter of Vienna’s total housing stock and are distributed according to a maximum income limit system similar to the one introduced a century ago.
Figure 2.26.
Vienna in figures (Data from Wiener Wohnen, 2018)
The Austrian capital has the world’s highest quality of life, Europe’s highest proportion of rental housing and is one of the least segregated capitals in Europe. It has also recieved numerous awards throughout the years, relating to topics such as liveability, sustainability and innovation. Many of these are attributable to the municipal social housing model that was introduced during the Red Vienna era. Despite the many new housing policies that have been implemented over the years, the key principles that were adopted during the First Republic still hold true: affordability, high quality, social cohesion and a good social mix.

31
Karl Marx-Hof
Share of rental housing Average rent 1100 € Zurich 29% 1450 € Munich Cooperative 20
Vienna Austria
Vollsmose
Location: Vollsmose, Odense, Denmark Size: 255,353 m² (3,638 units), and 54,000 m² business Years of construction: 1966 - 1970, 1970 - 1974, 1978 - 1981, and 2020 - 2029 (proposed)
Case study by:
Isabella Fyfe Eszter Olah
Birkeparken Bøgeparken
Egeparken
Other buildings
Stage one: 1966 - 1970
Stage two: 1970 - 1974
Stage three: 1978 - 1981
Figure 3.1. The construction stages of Vollsmose (Diagram based on information from multiple sources)
The Vollsmose Plan
The Vollsmose Plan was proposed in 1964. The plan comprised nine housing areas bordered by four major roads within the ‘Vollsmose square’. Construction began in 1966 and finished in 1981, occurring in three stages (fig. 3.1.). The plan changed considerably in response to shifting societal ideals over time. The uniform appearance of stage one was criticized upon its completion in 1970, as was the idea of the ‘planned city’. Stage two was thus modified to include buildings of varying lengths, heights, and typologies. By the time construction began on stage three, ideals had changed so much that the buildings were built as terraced houses.
Demolition Partial demolition / renovation Preservation New boundary
Figure 3.2. 2019 statutory development plan proposed works (Diagram based on information from Civica, FAB and Odense Municipality, 2019)
The Vollsmose of the Future
In 2018, the Danish Government released the One Denmark without Parallel Societies: No Ghettos in 2030 strategic plan. Additionally, Vollsmose’s boundary changed to exclude three of the nine housing areas. The six that remain were labeled ‘hard ghettos’. In 2019, the statutory Development Plan: The Vollsmose of the Future was released. The plan shows how the share of public family housing will be reduced to no more than 40 percent by 2030 to achieve the goal of the 2018 strategic plan. 1,000 public family homes will be demolished, those preserved will be renovated, and 1,600 new private family homes will be built by 2030 (fig. 3.2.).
34 Mass Housing
Planning
Granparken Lærkeparken Fyrreparken
Egeparken
Bøgeparken
Birkeparken
Hybenhaven Slåenhaven
Tjørnehaven Granparken Lærkeparken Fyrreparken
Egeparken
Bøgeparken
Birkeparken
Hybenhaven Slåenhaven Tjørnehaven
Granparken Lærkeparken Fyrreparken
Egeparken
Birkeparken Bøgeparken Granparken Lærkeparken Fyrreparken
Construction
The construction of Vollsmose began in 1966. Buildings were erected using prefabricated concrete elements that were lifted into place by cranes and cast together on site (fig. 3.3.). This industrialized construction technique was typical for public housing in Denmark at the time, though, it was a relatively new and untried method. Between 1960 and 1980, the majority of Denmark’s public housing was built using this technique which was developed to quickly erect many buildings due to a lack of housing, resources, and skilled work force after WWII. The construction method allowed Denmark to successfully overcome it’s housing shortage in a short period of time. Many buildings in Denmark constructed using this method are still in use today.
16,000 0
As part of the 2019 statutory development plan, 35 percent of Vollmose’s existing residential building stock or 89 374 m2 will be demolished. Additionally, there will be 143 759 m2 of new construction. The majority of the demolition will comprise the prefabricated concrete high-rise residential structures. The concrete elements in these structures have a considerable embedded CO2 footprint. For example, almost 2 000 tonnes of CO2 eq. is embedded in Birkeparken block 65’s concrete elements alone. Birkeparken block 65 accounts for approximately one fifth of the total proposed demolition works in m2. Therefore, constructing The Vollsmose of the Future will have a substantial environmental impact in terms of carbon footprint.
n
c o n
n s
14,000 i
o n b e g
c
s m o s e c o n
o
35 Vollsmose
1910 1920 1930 1940 1950 1960 1970 1980 1990 2000 2010 2020
2,000 P r e f a b r i c a t e d
4,000 s t r u c t i o
6,000 b e i n g s V
8,000 l
10,000 s t r u
12,000 t i
Figure 3.4. Number of newly built public houses in Denmark per year. The majority were built in a 20 year period between 1960 and 1980. (Graph based on information from Heunicke et al., 2021) 35% or 89 374 m2 demolition 56% or 143 759 m2 new build
Joint cast in place between wall elements
Joint cast in place between external vertical wall elements
Joint cast in place between inner wall element and deck
Figure 3.3. Prefabricated concrete construction method (Diagram based on information from Heunicke et al., 2021)
Figure 3.5. Proposed demolition and construction works (Pie charts based on information from Heunicke et al., 2021)
Life in Vollsmose
The first residents moved into Vollsmose in April, 1968. Since then, Vollsmose and to a greater extent Denmark have undergone significant changes across more than half a century. In 1972, Vollsmose experienced a rental crisis and a large portion of apartments became vacant. Rent was affordable for socially disadvantaged people thanks to housing subsidies and thousands began to move into Vollsmose. By the mid 1970s, several social issues had started to emerge and the high proportion of non-Western residents were seen as the causation. This mindset continues today in Vollsmose. Because of this, non-Western immigrants and descendants face discrimination based on race, ethnicity, national origin, and other protected grounds, says the UN.
1. Figure 3.6. New residents move into Vollsmose, March 1969 (Photo taken by Fyens Stiftstidende’s press photographers, 1969)

2. Figure 3.7. Excerpts from a documentary film about Vollsmose. Resident Ibrahim El-Hassan reflects on their life in Vollsmose and Danish Prime Minister Lars Lokke Rasmussen’s 2018 New Year’s speech. (Photo taken by Baker, 2019)


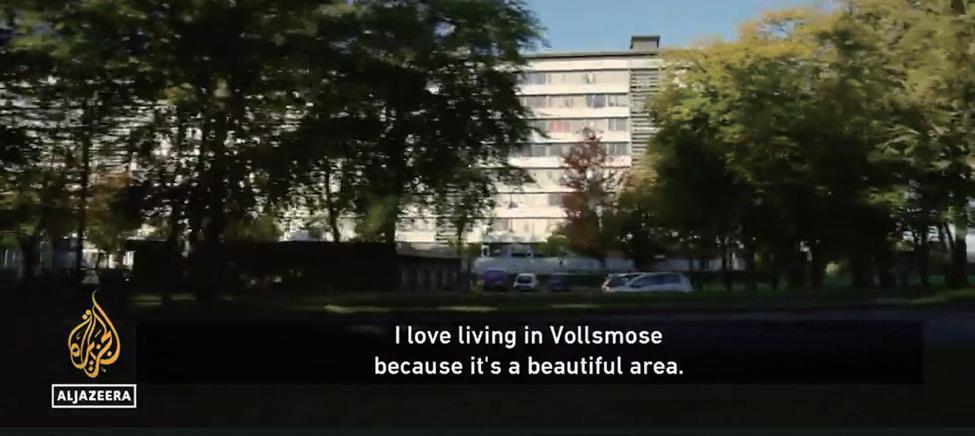
3. Figure 3.8. Children in Bøgeparken walk towards a billboard that reads ‘Do you have questions about the future of your home?’ (Photo taken by Ringkjøbing, 2022 2019)
4. Figure 3.9. Demolition works underway in Bøgeparken, 2022 (Photo taken by Wedell, 2022)
36 Mass Housing
2 1 4
3
Renovations
Figure 3.10. Between 1994 - 1995, half the units in Egeparken’s seven-storey block were converted from four- and one-bedroom units to two- and three- bedroom units. (Diagram based on information from Engberg, 2000)
1968 - 2006
Vollsmose underwent several renovations between 1968 and 2006. In the 1980s, renovations were conducted to fix extensive construction damages that resulted from the use of new building techniques and materials in the 1960s and 1970s. Other renovations attempted to tackle social issues that had started to emerge in the mid 1970s. For example, at Egeparken during 1994 and 1995 a major physical renovation was undertaken in an attempt to deter large ethnic families from living there by downsizing half the units (fig. 3.10.). In turn, it was hoped that the relative number of Danish residents in Egeparken would increase.
The objective of Egeparken’s renovations in the mid 1990s was not realised. Bosnian refugees moved to Vollsmose just after the renovations and many settled in Egeparken. This example typifies how physical renovation projects in the Danish social housing sector have tried and failed to address social issues in ‘problem’ housing estates. Today, radical and long-term physical and social changes, in addition to wider urban strategic solutions, are favoured in Denmark as the appropriate means eradicate these ‘ghetto’ residential areas. The Vollsmose of the Future is one example of this. The plan has sparked much debate between government policies, residents, and the social housing sector as to whether it is the ideal solution.
Plumbing upgrades
Electrical improvements
New kitchen, bath, and toilet Plastering and painting works
New patio, doors, and windows
Replacement of flooring and fixtures
Improving accessibility in some units Balcony extension and new glass protection
Upgrade of outdoor areas including landscaping
New ventilation system, refurbishment of heating
Post-insulation of facade and improvement of thermal bridges
Figure 3.11. List of proposed renovation works at Birkeparken (List based on information from FAB, January 2021)
2 000
Preparation works for the installation of washing machines, and dryers 1 099 DKK increase 1 000
Future monthly rent Current monthly rent
Figure 3.12. Birkeparken 2021/2022 current and future rent. The increase will help fund the statutory renovations. (Graph based on information from FAB, 2022)
2020 - 2029 (proposed)
A series of demolitions and renovations will occur from 2020 to 2029 to transform Vollsmose in line with the statutory development plan. Public housing associations Civica and FAB are responsible for these works. In Birkeparken alone, FAB will demolish 200 out of 439 homes and renovate those that remain between 2022 and 2025. These renovations (fig. 3.11.) will be done with a focus on achieving DGNB silver certification in sustainability. They will be financed through loans and grants again from The National Building Fund, the housing department’s ongoing savings for renovations and maintenance, and rent increases (fig. 3.12.).
37 Vollsmose
3 000 4 000 5 000 6 000 0 DKK
Granparken Granparken
Deconstruction
Birkeparken
Birkeparken 65 Vollsmose
Birkeparken
Birkeparken
Brick facade 22 m³
Birkeparken
Concrete facade 444 m³
Interior walls 346 m³
Concrete primary walls 1463 m³
Ton of CO2 2286 tonnes
Concrete floor slabs 3296 m³
ton C O 2 eq.æ k v 2286 ton
3000 2500 2000 1500 1000 500 0
3000 2500 2000 1500 1000 500 0
Ton of CO2 2286 tonnes 3000 2500 2000 1500 1000 500 0
Roof deck 533 m³
Steel 40m³
Concrete stairs 91m³
Lift 7pieces
Glass 44m³
Figure 3.13 Birkeparken Block material catalogue (Diagram based on Ressource Blokken, 2021)
The Resource Block is a joint research project between industry partners,housing association and research institutions. The project is working with two residential areas on the ghetto list and maps the existing resource stock, tests and documents the quality of the secondary materials in the buildings and investigates the potential to disassemble and reuse the secondary materials in new buildings. The aim is to develop scalable reuse solutions.

Ny produktion Birkeparken
Window frames 78m³
Ny produktion Birkeparken
Disassembly of the buildings will happen in steps: as in a traditional demolition the existing buildings will be stripped down to the structure, the structure is then cut with a diamond cutter into box modules and deck/wall elements that are lifted out with a crane. The advantage of demounting the building into larger modules and elements is that the monetary and environmental cost of cutting and crane lifting can be reduced.
The Danish Technological Institute tested the concrete for its composition, strength and potential pollution and found that the majority of the building elements are clean of toxic chemical compounds and can thus be reused. However, the concrete elements are only suitable for use in passive environments (i.e. non-loadbearing functions) as their composition and the strength do not live up to current standards.
Distribution of CO2 emission from the the recycling of concrete elements
Possible environmental savings by recycling concrete 1732 tonnes of CO2
Possible environmental savings by recycling concrete 1732 tonnes of CO2
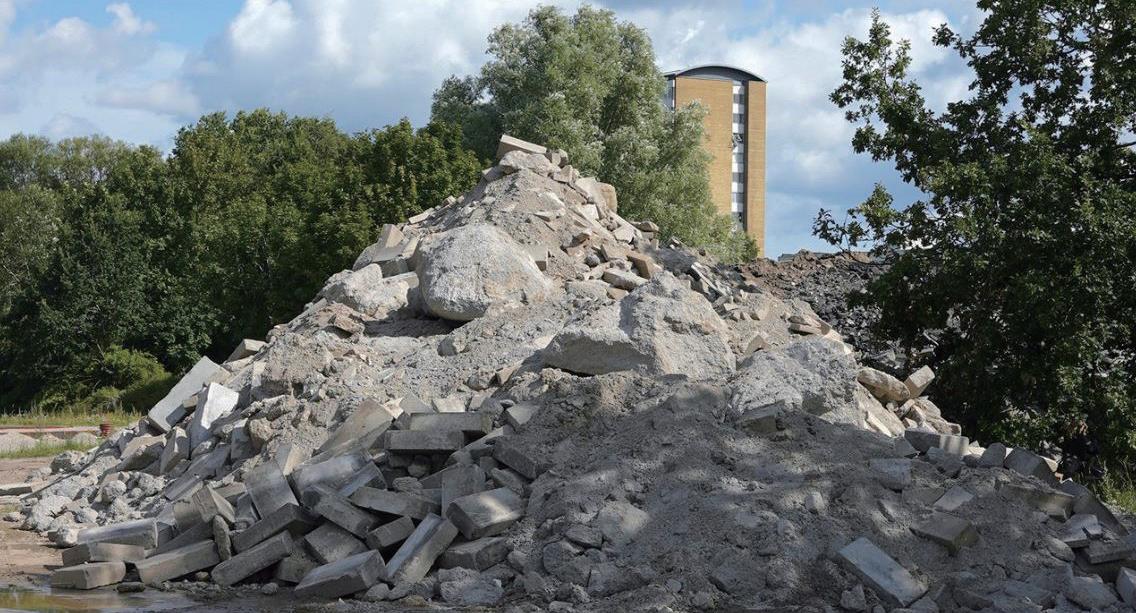
Figure 3.15. Embedded CO2 in all concrete elements of buildings in Vollsmose (Diagram based on Ressource Blokken, 2021)
Beton gulvplader
Concrete floor slabs
Concrete primary walls
Distribution of CO2 emission from the the recycling of concrete elements
Interior walls
Concrete facade
The pie chart shows the amount of embedded CO2 for all concrete in the building, as well as the estimated CO2 impact during separation of the elements for the purpose of recycling. This constitutes 14% of the total CO2 and thus enables saving a total 1700 tonnes of CO2
Brick facade
Window frames
Glass
Concrete floor slabs
Proportion of CO2 from cutting elements Birkeparken New construction
Birkeparken
Interior walls
Concrete facade
Brick facade
Beton primære vægge Indvendige vægge Beton facade Mur facade Vinduesrammer Glas
Beton gulvplader
Concrete stairs Steel Roof deck Roof insulation Asphalt roofing Energy consumption for cutting Blades replacement
Betontrappe Stål Tagdæk Tagisolering Tagpap Energiforbrug til skæring Udskif tning af klinger
Birkeparken
3000 2500 2000 1500 1000 500 0
Window frames
Concrete primary walls Glass
Beton primære vægge Indvendige vægge Beton facade Mur facade Vinduesrammer Glas
Concrete stairs Steel Roof deck Roof insulation Asphalt roofing Energy consumption for cutting Blades replacement
Proportion of CO2 from cutting elements Birkeparken New construction
Betontrappe Stål Tagdæk Tagisolering Tagpap
Energiforbrug til skæring Udskif tning af klinger
ton C O 2 eq.æ k v. 2286 ton
tonnes
Ny produktion
Figure 3.16. CO2 emmission in case of a new construction (Diagram based on Ressource Blokken, 2021)
An LCA has been carried out on the residential block Birkeparken 65. The calculation is representative, i.e. that it has been calculated what a similar building would have in terms of CO2 impact if it were to be built today.
38 Mass Housing Betont appe Ene giforbrug til skæring Udski tning af klinger
Birkeparken
Concrete Concrete Glass Window Brick Concrete Interior Birkeparken New construction 3000 2500 2000 1500 1000 500 0 Ton of CO2 2286
3000 2500 2000 1500 1000 500 0 ton C O 2 eq.æ k v 2286 ton
Figure 3.14.
Demolition in Vollsmose (Photo taken by Hanne Kjær, 2022)
Reuse
Figure 3.17.
Circular urban regeneration (Diagram based on Ressource Blokken, 2021)
Based on the development plan for Vollsmose, six Danish architects:Effekt, Panum & Kappel, Spektrum, JaJa and 3XN were asked to participate in a design process and to come up with technical solutions for how to reuse the existing building stock to build new row houses in the area. As the concrete elements cannot be reused in load bearing functions the designers had to find other solutions to fulfil the loadbearing requirements e.g. using steel frames.

Figure 3.18.
Figure 3.19.
Figure 3.20. Figure 3.21. Figure 3.22.
Vollsmose regeneration project concepts (Ressource Blokken, 2021)
JAJA
When the block in Vollsmose is to be demolished, we suggest one separation arranged to reestablish a new residential quarter, built around a strong community on a human scale.
3XN


The project seeks to create a modular building system based on recycled concrete elements from Birkeparken.

Future buildings are designed so that their structural principles are prioritized according to the greatest need possible flexibility in layout and use, long lifetime and a rational construction process. Facades can for example appear in brick and wood. Brick is a long-lasting material that patinas beautifully and is already well known in Vollsmose’s context.
EFFEKT
A wooden building system, which is ‘designed for disassembly’, gives new life and new value to old prefabricated building components.
SPEKTRUM ARKITEKTER
The proposal challenges the traditional ‘betragtning af et hjem og’ comes with a bid on social housing enclaves with fluid and graduated boundaries between private and public spaces.
39 Vollsmose End of use phase Maintenance and flexibility Installation of elements in new construction Screening of construction - Should it be dismantled or simpky renovated? Environmental and resource mapping Inclusion of residents. - What can we do together? Preparation of tender materials with requirements for dismantling.
performs environmental remediation. Items are forwarded to the other user Processing with a view to recycling and upcycling Storage in warehouse Removal of elements Circular process local application Use phase Preparation for disassembly
Contractor
PANUM & KAPPEL
Montagerækkerne is an offer for a new housing development, created based on directly recycled elements and ma terials, resulting from the demolition of Blok 45 in Birkeparken.
Co-Housing
Concept of co-housing
Based on Danish experiences with bofællesskaber, the concept of ‘co-housing’ was introduced internationally in the late 1980s by McCamant and Durrett (1988). Key recurring values in definitions and practices of co-housing are community, autonomy (as in self-governance), affordability and, since the 1970s, ecology (as in resource-saving, ecological housing and lifestyle). Since the 2010s, these values have tended to be subsumed under the umbrella of ‘sustainability’ and its different dimensions – social, ecological and economic.
Employment and occupation, education, image and safety, cultural bridging and multicultural dynamic development, commitment, co-operation and local ownership (The Secretariat of Vollsmose 2003).
The belief is that by raising the standards of the area you can attract a better tax base and lessen the burden on the social services and thereby create a more mixed group of residents. The rationale of this strategy is that success in attracting more resourceful residents will endorse the area with more social and economic capital, which will raise the area as a whole.
Social and economic sustainability are prioritized in order to create more socially mixed neighbourhoods and attract citizens that will constitute a larger tax base.
Example of cohabitation
- small, close-to-low housing with common rooms - shared cultivation gardens, laundry, car sharing - young couples - duplexes - single parents - young people who share housing
Multigenerational homes - duplexes on multiple floors - small accessible homes - two storey family homes - families with children - grandparents/ seniors
Mixed housing cluster - common outdoor areas - apartments - townhouses - duplexes - single parents - singles
Figure 3.23.
Cohabitation (Diagram based on Bydelsplan for Fremtidens Vollsmose,Konkurrenceforslag, 2022)
The communitarian view of social capital prevalent in the Kvarterløft programme ties it to the nexus of ideas around the reinvention of community in urban policy, which is an international phenomenon of the 1990s. In the Danish case the community imaginary invokes the idea of the close-knit village community saturated with capabilities for communal action. The aim of the Kvarterløft programme is through topdown initiated bottom-up action foster the re-building of communities based on this imaginary.
Extra barriers for ethnic minorities are likewise the case in relation to the development of social capital. The increasingly popular concept of social capital in academic and policy arenas take in relation to the Kvarterløft programme the form of responsibility, ownership, and networks among residents which lead to increased capacity for action to improve the environment in, and reducing the problems of local neighbourhoods.
40 Mass Housing
gasmission
“There are parallel societies around the Danmark. Many people with the same problems are lumped together. It creates a negative curve. A counterculture. There where one does not take responsibility, does not use the possibilities we have in Denmark – but stands out. Holes have been made on the map of Denmark. Therefore, we must drop the illusion that parallel societies and ghettos will disappear if we just give them time. For example, Vollsmose, the powerlessness and isolation. ” (“Lars Løkke Rasmussens nytårstale 1. januar 2018”)
“Vollsmose’s edge must be broken. Today, the area is like an island in Odense, surrounded by four-lane roads and with border planting on all sides. The way to a new and stronger Vollsmose is to break with Vollsmose’s basic idea, plan, structure and create an open district in immediate connection with the rest of the city and the river valleys, with more businesses, educaion and services.”
The quote is from the latest publication in a long series of reports about the analysis of Vollsmose. 2Break Kanten- Open Vollsmose” is pulished by the Multifunktional Bydel, which was a project in he housing comprehensive plan 2008-2012, a collaboration between Odense Municipality and housing associations, Højstrup, OAB and FAB, the residents of Vollsmose and the Landsbyggefonden.
The case of Vollsmose is a complex package. It has to be examined from many different aspects. We have to take into account the social, economical, ecological, historical and political sides in order to get closer to the understanding of the evolution os Vollsmose.
The comprehensive regeneration plan of Vollsmose is targeting the improvement of housing conditions, social integration, aiming to provide job opportunities, puts emphasis on education, while taking into account the environmental impact.
On the other hand the project is somewhat bilateral. While we see the intention to a change towards the better, the question arises, is it what the residents want?
“We must set a new goal of completely tearing down the ghettos. In some places by tearing down the concrete, demolishing buildings, spreading out the inhabitants and rehousing them in different areas. In other places by taking a control of who moves in. We must close the holes in the map of Denmark and recreate the mixed neighbourhoods, where we meet each other across our differences” (“Lars Løkke Rasmussens nytårstale 1. januar 2018”)
41 Vollsmose
Fo u n d a t i o n G r eenh
Climate F
t io n L sso
retawdnuorG oPull t noi E
Ce i l i n g
dE u c a t ion Living
W o r k
Social
ouse
reshwater Consump
fo ytisrevedoiB noitatserofeD
c ological
emocnI
Condition
Vollsmose past - present - future
Vällingby

Historical context: the first ABC city in Sweden
Figure 4.1.: the historical events and background of the inauguration of Vällingby as the first ABC city in Sweden. It is important to note that the history of co-housing in Sweden dated back to the 1930s: the word ‘kollektivhus’ came into widespread use with the first modernist projects. Proposals to build large kollektivhus around 1930 were intended to solve two problems at the time: a shortage of housemaids, and the right of married middle-class women to work.

From Acceptera to ABC city
In Sweden, the relationship of modern architecture to the welfare state starts with their common ascendance around 1931-1932. Created by architects and city planners, the manifesto Acceptera mentioned the concept ‘family hotel’ and claimed that housing should embrace a functionalism orientation. With the architectural exploration into the future form of living, the model ABC city was accepted. ABC stands for work, dwelling and centre. In this model, the new town would be largely self-functioning units consisting of working, housing, and their commercial and cultural functions in the centre.
The neighborhood unit was a town planning idea of the 1940s intended to highlight the democratic importance of the ‘group society’, with certain collective facilities in the neighborhood. Since the Social Democrats achieved their first majority in the Stockholm municipal elections and formed their national government, over a long period of Social Democrats hegemony, housing policies were manifested as ‘social engineering’, associating urban planning and the design of dwellings with the paradigm of ‘the good life’ and ‘the just society’.
44 Mass Housing
Question: how do we build a new modern city for the new democratic society?
Figure 4.2.
Building types in 1950s Vällingby. (Illustration based on Svenska Bostäder, Vällingby)
1950s Vällingby
During 1950s, a large amount of residential buildings, industries, offices, shops and infrastructures were constructed in Vällingby along with the new subway line (Fig. 4.2). Engaged by architects Paul Hedqvist, Ragnar Uppman etc. and construction companies SB(Svenska Böstader), HSB(Hyresgästernas Sparkasse), SKB(Stockholms Kooperativa Bostadsförening) etc.
According to the 1954 general plan led by Sven Markelius, Vällingby centre and offices were built surrounded by multiple types of housing units for different group of people.

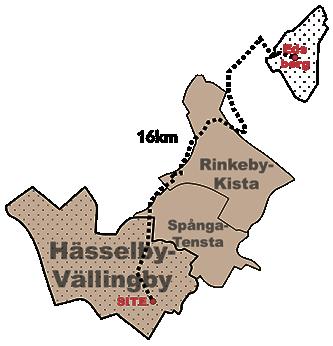
Figure 4.3.
Case 1 - Silvret 2
Statistis systems of Silvret 2 (Illustration based on Ingemar Nyquist, “Elementbyggda flerfamiljshus - 9 metoder”)
Year of completion: 1958
Construction Cost: 640 SEK/ m²
Ownership: SB → Condominium Association (2020)
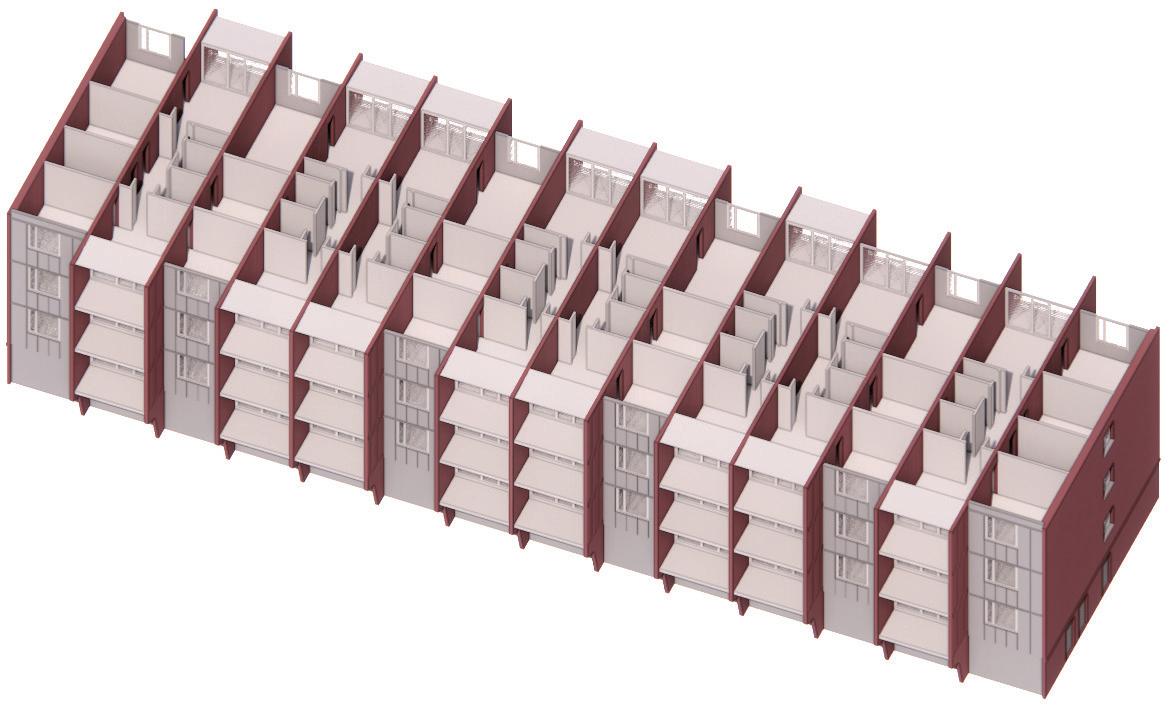
Frame system: Bifurcating inner walls load-bearing Lifting device: Tower slewing crane
Factory Location: Edsberg (16 km from site)
The limitation of housing production due to a lack of labour are the context for Silvret 2. To reduce the need for labor on site, a new prefabricated method of construction was used. The construction time dropped to 60 percent compared to traditionally built houses.

Figure 4.4.
Case 2 - Atlantis

Type: row house
Overview of Atlantis (Illustration based on Stockholm stad, “Construction matters of Atlantis“)
Ownership: condominium association
Living area: 3 886 m2, 29 terrace houses
Inhabitants: family with at least two children
Year of completion: 1954

Architects: Jon Höjer, Sture Ljungqvist, Fritz Ridderstolpe, Hasse Hansson
Construction cost: ca. 571 SEK/per house unit
Rent in 1956: 1300 SEK/m2
Before the project began, those who were interested were required to invest 5 percent of the estimated production cost.
45
Vällingby Construction
Load-Bearing Walls
cenrtrum industriområde småhus allmänt ändamal fler familjshus
Living in Vällingby
Greenspace map in Vällingby (data from dataportalen.stockholm.se)
Greenspace map in Vällingby (data from dataportalen.stockholm.se)
Figure 4.5.: social changes in Vällingby

Skog Urban gronstruktur av oppen karaktar
Skog Urban gronstruktur av oppen karaktar
Greenspace map in Vällingby (data from dataportalen.stockholm.se)

Figure 4.6.
Urban gronstruktur av naturtomtskaraktar
Urban gronstruktur av naturtomtskaraktar
Skog Urban gronstruktur av oppen karaktar
Urban gronstruktur av lummig karaktar
Urban gronstruktur av tradkaraktar
Urban gronstruktur av tradkaraktar Urban gronstruktur av lummig karaktar
Urban gronstruktur av tradkaraktar Urban gronstruktur av lummig karaktar Urban gronstruktur av naturtomtskaraktar
Oppen till halvop pen grasmark oppen vatternyta Buskmark
Oppen till halvop pen grasmark oppen vatternyta Buskmark
Oppen till halvop pen grasmark oppen vatternyta Buskmark
Oppen hallmark Odlingslott eller frukttradgard
Oppen hallmark Odlingslott eller frukttradgard
Oppen hallmark Odlingslott eller frukttradgard
Green space map in Vällingby today. (Illustration based on Stockholms stad, "Dataportalen")
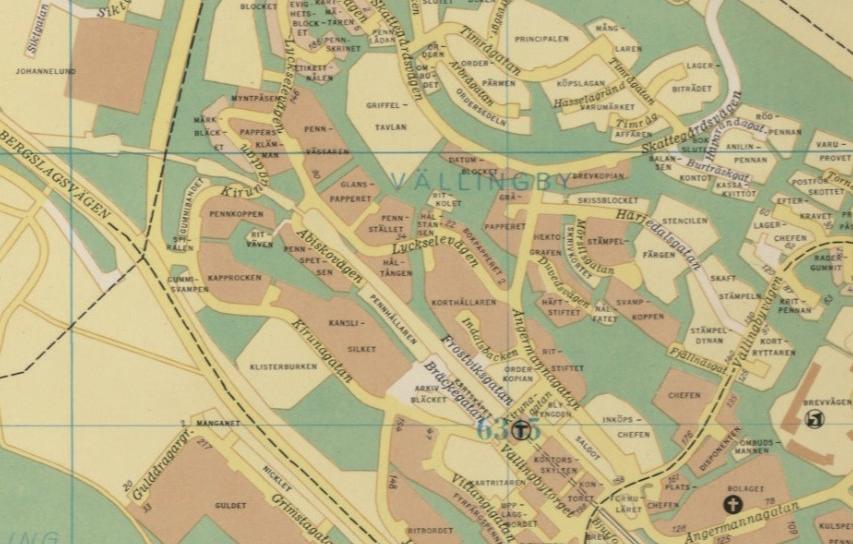
Figure 4.7.: green space map in 1954 Vällingby. The distribution of greenery has remained intact. The abundance of nature is an asset for the district and refines living experience. (Stockholms stad, "Compare Maps")
70 years in Vällingby
Since 1952 when people moved into Välllingby gradually, the new town witnessed its heydays as well as slow decay (Fig. 4.5). The first decade was the most prominent era when families arrived with their young children. Then problems arose with teenage boom, and increasing crime rates. People moved out for multiple reasons: the long commutes from Vällingby to their working places, old city centre continuing to attract people with the history and diversity, buildings and infrastructure becoming dilapidated, the segregation between north and south Vällingby, and the increase of housing price with the process of privatization.
46 Mass Housing
Case1 - Silvret 2
The Silvret 2 includes 119 apartments with total area of 8,020 m². Apartments were wider than usual, 12 meters, resulted in large living space. The floor plan is strongly typified, which brings flexibility in apartment size (Fig. 4.8). In the 1960s, Grimsta began to have several social and youth problems. One cause of the problems was considered to be the too many small apartments. The one-room apartments with a kitchenette, which were initially intended for pensioners, often went to socially deprived people. Thanks to the efforts of community workers, the trend turned in the mid1970s.
Case 2 - Atlantis
The Atlantis neighborhood includes 29 terrace houses and common buildings such us laundry room, garage, storage, sauna, and exercise room. Though there are several different types of housing, the basic layout is the same: made up of three halflevels, kitchen open to a large family space for social need and adaptivity, which an advanced approach for the time (Fig. 4.10).
As a ‘bostadsrättsförening’ housing, Atlantis has developed a different form of living and ownership. A distinctive feature of Atlantis is the united community and the engagement of its members, which contributes a lot to the sustainability and vitality of Atlantis.
Figure 4.8.
Plans (Illustration based on Ingemar Nyquist, “Elementbyggda flerfamiljshus - 9 metoder,” )
Figure 4.10.
Entry floor plan (Illustration based on Hemnet, “Lövängersgatan 23”)
Figure 4.9.
Figure 4.11.
Second floor plan (Illustration based on Hemnet, “Lövängersgatan 23”)


47 Vällingby
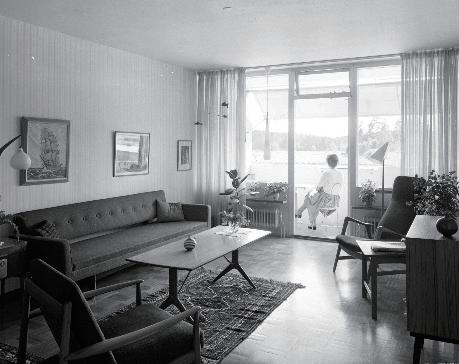
interior space of apartment in Silvret (Svenska Bostäder, “a Picture Story of Silvret 2")
Roof material change (from asbestos to tin) in 1997 Renovated in 2006 2032
Bathroom change in 2006
25 years 6 years
20 years
Facade Cladding Renovation in 1983, 2008, 2022
Glazing of Balcony in 1986, 2017

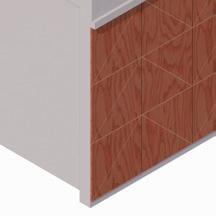
Wood Panel Add in 2009 Repaint in 2028
OVK Control in 2019 2025 Case 1 - Silvret 2
Svenska Bostäder depreciation plans: LAND PLANT: FRAMES: CEILINGS: FACADE AND BALCONIES: WINDOWS AND FRONT DOORS: BATHROOMS: ELECTRICITY: PIPES: VENTILATION: LIFTS/ ESCALATORS:
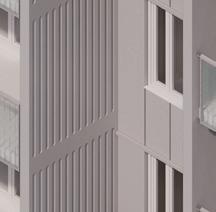
100 years
30 years Figure 4.12. Maintenance detail of Silvret 2 (Illustration based on Ombildningskonsulten, “Ekonomisk Plan för Bostadsrättsföreninggen Silvret 2”)
Maintainence cost in next 10 years (2020 - 2030)
40 years 40 years 40 years 50 years 50 years 50 years

ROOF: FACADE: BALCONIES: LAUNDRY ROOM: HEAT FACILITIES: SEWAGE/WATER: VENTILATION: OVK CONTROL: ELECTRICITY: TOTAL: ESTIMATED FEE RAISED:
500 000 SEK
50 years 20 years 30 years
20 years 55 000 SEK 100 000 SEK 900 000 SEK 400 000 SEK 2 550 000 SEK 250 000 SEK 300 000 SEK 2 200 000 SEK 7255 000 SEK 9 SEK/ m² and year
48 Mass Housing
Maintenance
Figure 4.13.
Case2 - Atlantis: life cycle of building elements
Maintenance detail of Atlantis (Illustration based on Stockholms stad, “Construction Matters of Atlantis”)
-ROOF: -DOWN PIPES: 25 years 25 years Painted in 1957
Leakage in 1985 and repaired in approx. 1987 Replacement in 2011
Hot-water pipes insulated in 1979 Repaired in 1985
Replacement of cold-water pipes in 1993 Renovation of water and sewage systems: 2021 -CEILING: Insulated with new false ceilings in 1975 Insulated with horizontal ceilings in 1992
-HEATING SYSTEM:

20 years 15 years
Added a new boiler to the joint heating system in 1969; Proposal of installing a heat pump system in 1984; Updated to the central heating system in 1987; Reconstruction of heating plant in 1989; Added a new central boiler in 1992.

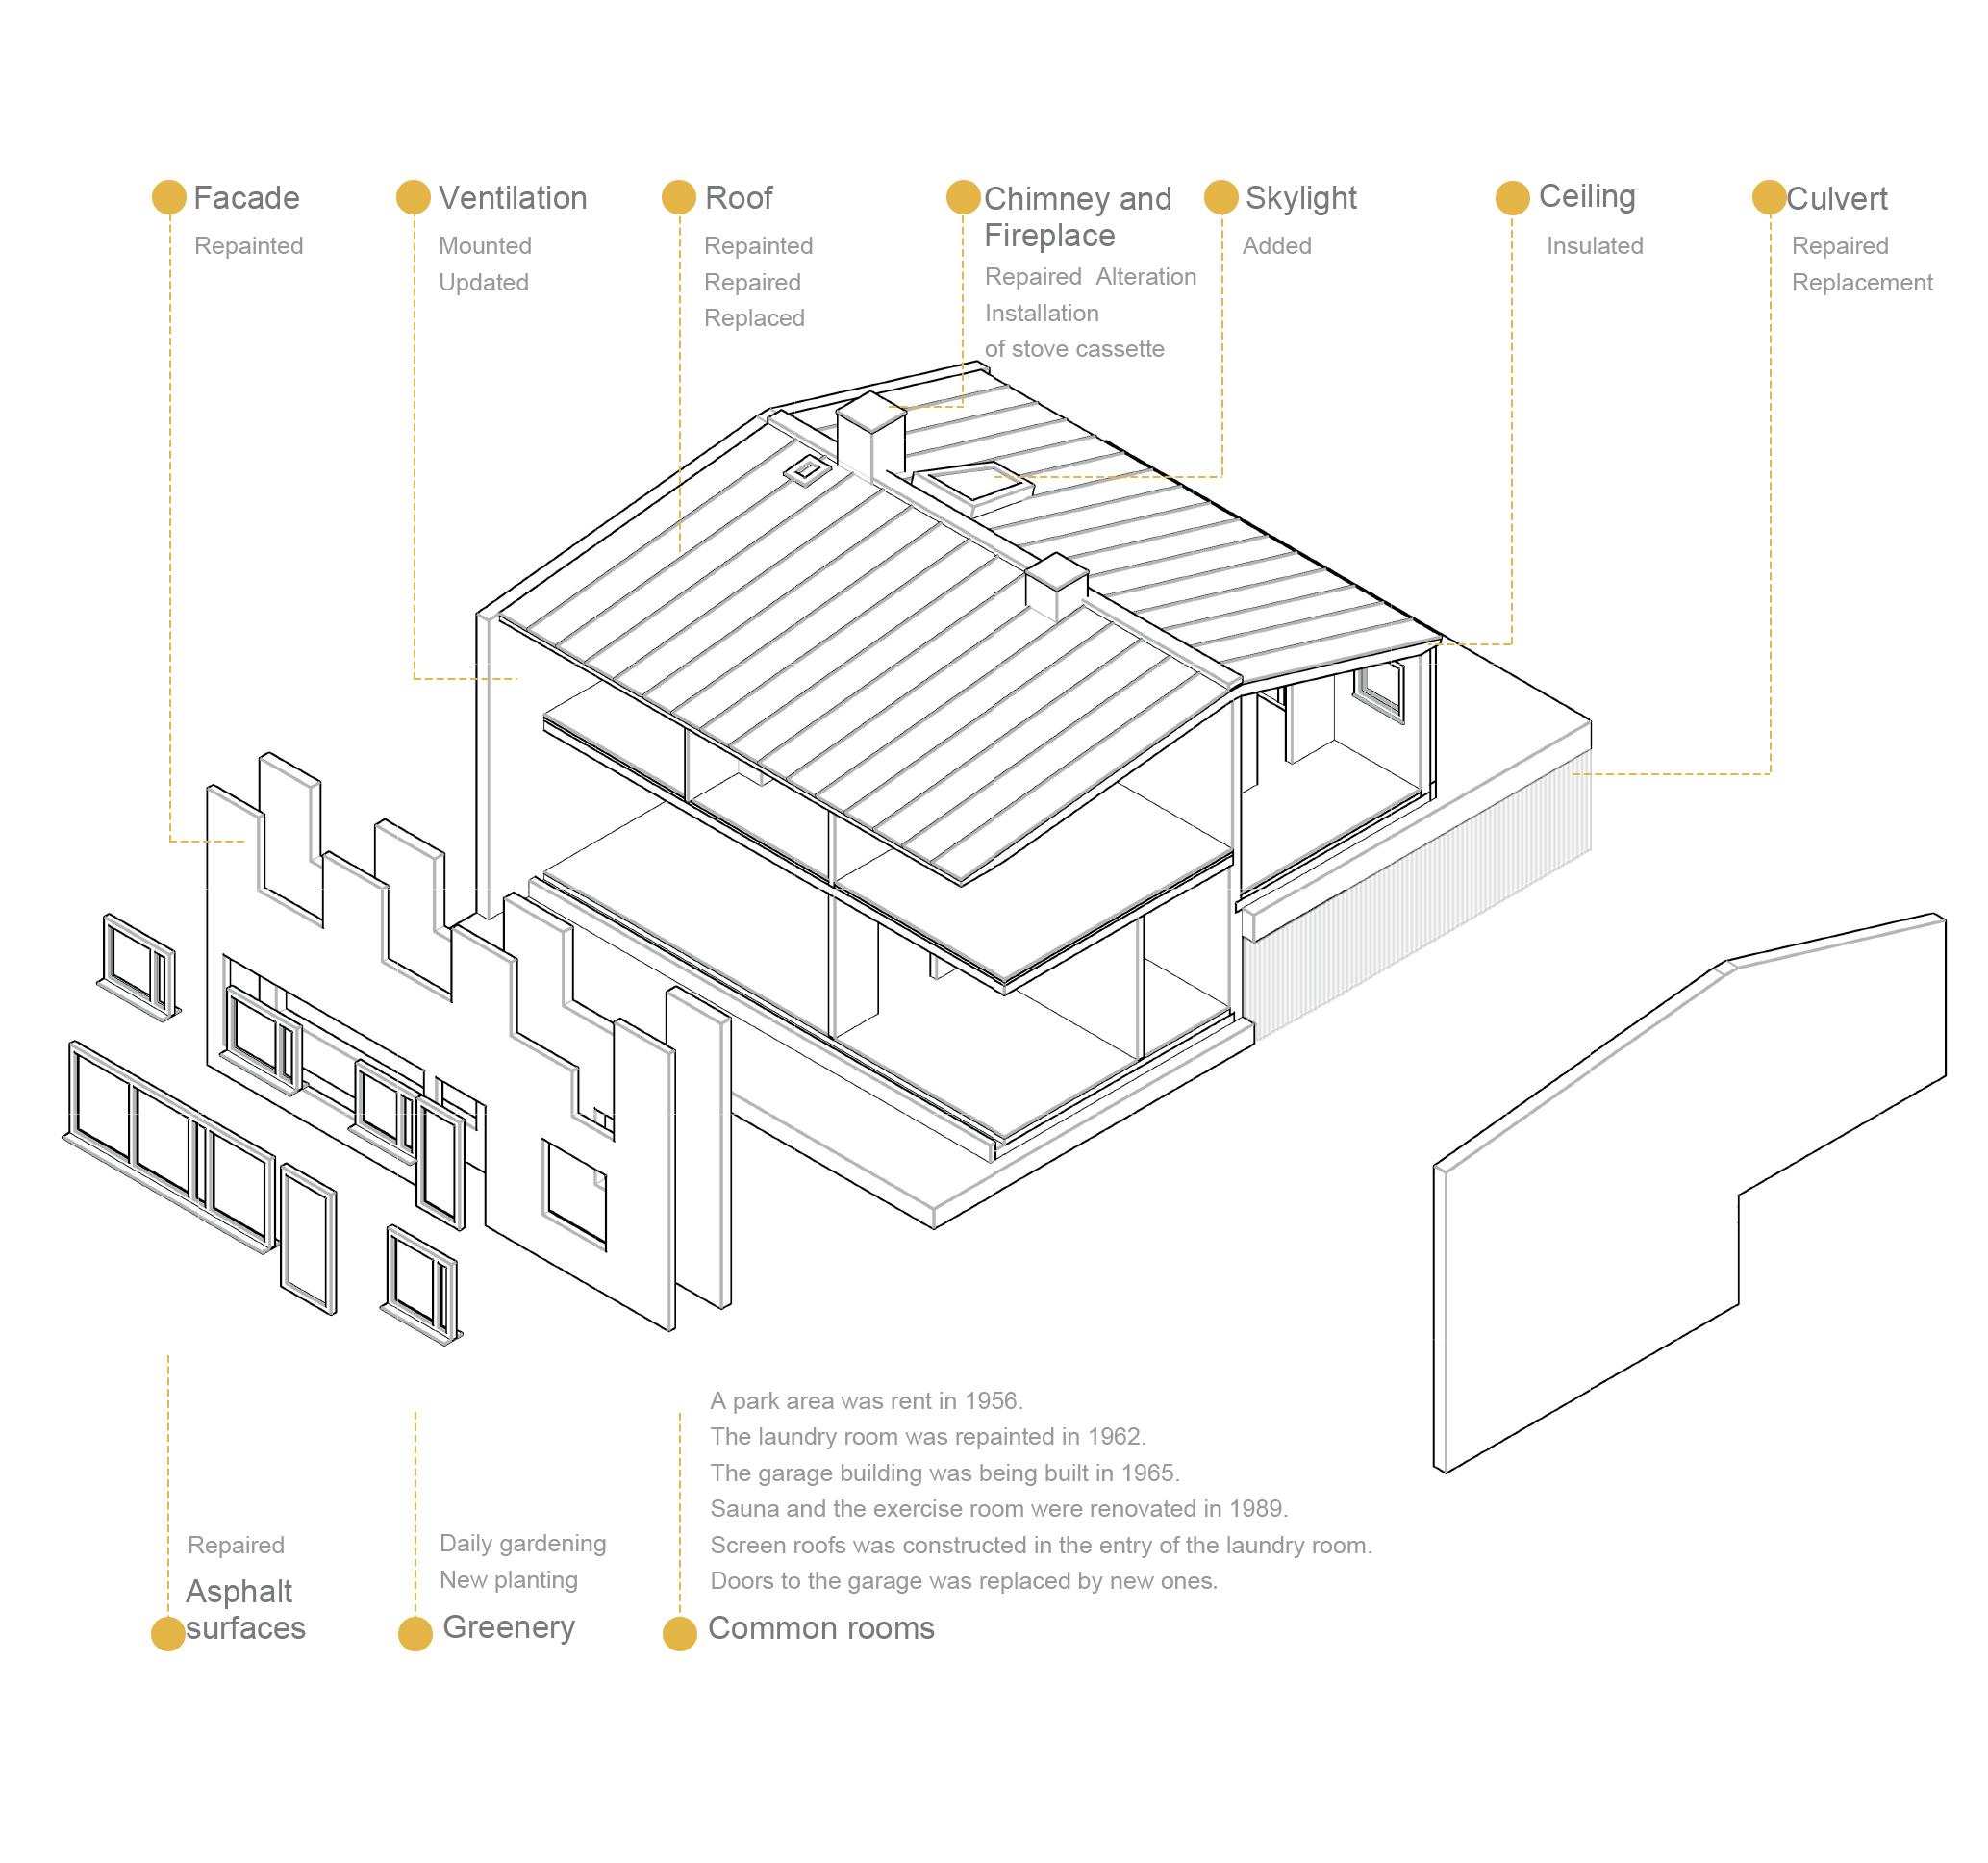

*ENERGY:
Energy saving measurements to reduce the oil consumption in 1979.
An energy investigation in 1983. An energy inspection in 1992. The energy declaration was completed in 2007.
49 Vällingby
Situation today
Figure 4.14.: energy consumption of residential buildings in Välllingby (classified by kWh/m2 per year). Most of housing built in 1950s has a relatively high consumption of electricity. (Illustration based on Boverket)
Ecological Sustainability
Today in Sweden, the energy performance requirements of new buildings are strict. However, when Vällingby was constructed, the carbon footprint of buildings did not draw so much attention. To compensate the high consumption of energy (Fig. 4.14.), several measurements were adopted, for example improving envelope’s insulation. Today, some old buildings have an excellent energy class because of the adoption of thermal mass energy supply system, which offers clean and renewable energy. New housing buildings, such as the Vällingby Allé, were built with the potential to install solar cells on roofs.
Social sustainability
An obvious segregation of income exists between the north and south Vällingby (Fig. 4.15), which are the rowhouse neighborhood and the apartments respectively.
Figure 4.15.: average income (in SEK) of residents in Vällingby, together with the location of municiple services and public spaces. (Illustration based on Hitta)

The average data of the whole area compared with that of Stockholm shows that inhabitants in Vällingby have lower income, lower education, higher unemployment, and less health. Additionally, Vällingby also has a relatively higher percentage of residents with foreign backgrounds, 45.9 percent (Fig. 4.17.), which means today the ABC city is an arrival city for new comers to Sweden.
Economic sustainability
Dating back to 1990s or earlier, neo-liberalism began to influence Swedish politics and society. In 1992, the government formally allowed local decisionmaking concerning conversion of public rental housing into market forms (cooperative housing). The municipal housing companies were selling their properties in Vällingby to private real estate companies. The housing price was soaring while income was growing unstably (Fig. 4.18.).
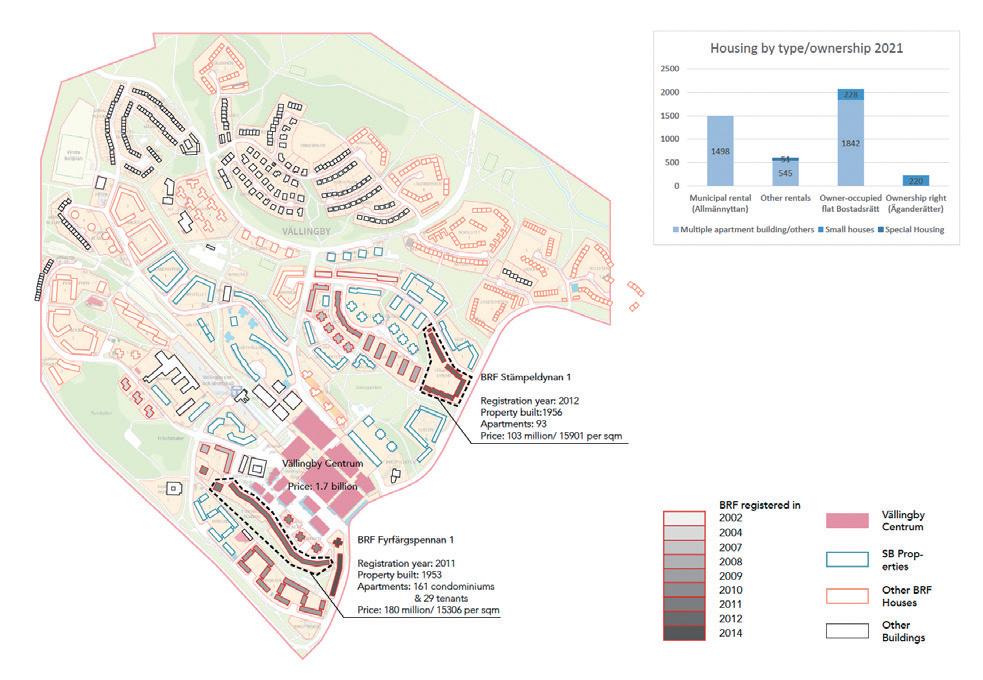
Figure 4.16.: ownership map of housing buildings in Vällingby; ownership composition in various types of housing. (Illustration based on Stockholms Stad, “Områdesfakta Vällingby Stadsdel”)
At the same time, housing built in 1950s was aging and renovations became necessary. This expenditure becomes another burden on the financial situation of the local inhabitants.
50 Mass Housing
Energy Declaration of Housing building in Vällingby in unit of kWh/m² och år (data from www.boverket.se)
<60 60-85 85-110 110-135 >210 135-160 160-185 185-210
<60 60-85 85-110 110-135 >210 135-160 160-185 185-210 <60 60-85 85-110 110-135 >210 135-160 160-185 185-210
Figure 4.17.: population with foreign background in Vällingby compared with the percentage in Stockholm. (Illustration based on Stockholms stad, “Facts of Sub-urban Area ” )

Spånga Station
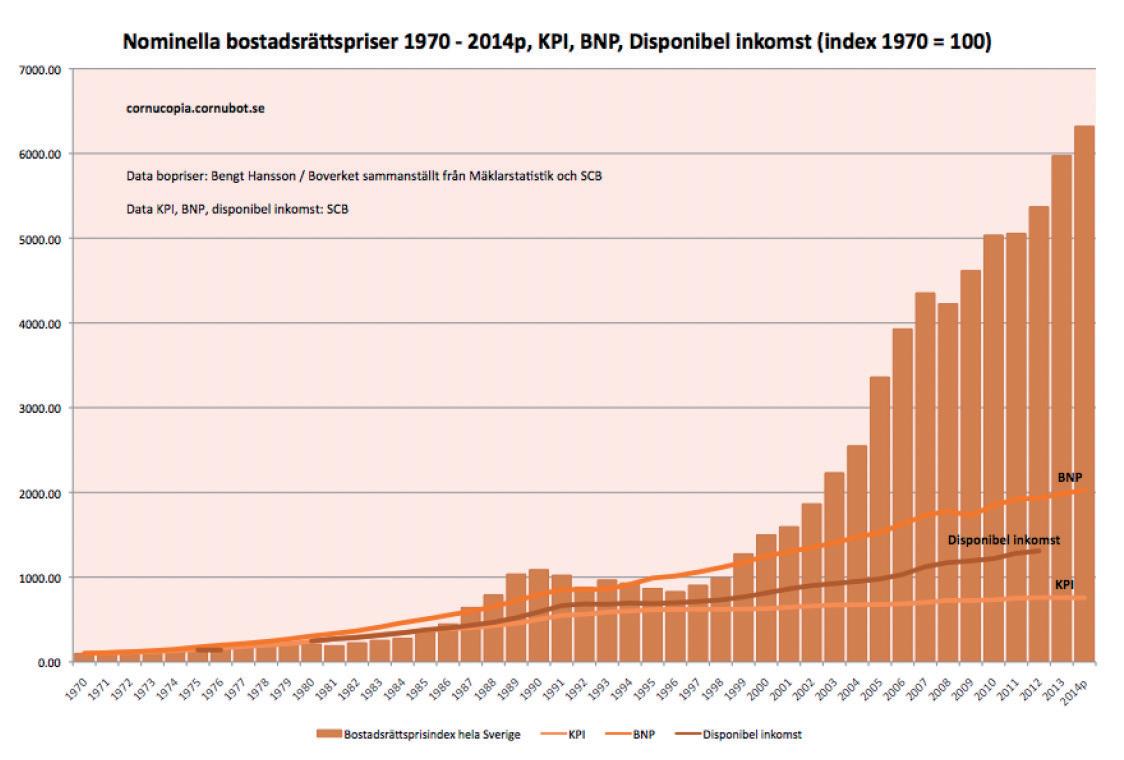
Figure 4.18. housing price change compared with income. (Cornucopia, “Bostadsrättspriser 1970 – 2014”)


Beckomberga
Figure 4.19.
Future plan
Hässelby Stand

- Urban development within the existing street layout.
- Vällingby centre continues to be reinforced as a centre for several districts, which will involve adding houses, workplaces, and town centre functions in a way that reinforces the value inherent in its status as a heritage environment of national interest.
- Improved public transport links are required.

Centre Key meeting point Metro station
Nature/culture reserve Urban corridor Strategic connection rail or road devel opment agreed or in progress


Strategy of Vällingby development (Illustration based on Stockholms stad, “Stockholm City Plan”)
- Improve the safety and accessibility of the park corridor between Hässelby Gård and Ormängstorget.
- Create an attractive recreation area with better links between Nälsta and Vällingby.
- Strengthen the connection across Vinsta to Hässelby Gård.
- Develop serviced and business surrounding Råcksta metro station.
51 Vällingby
Hässelby Gård
Gottsunda
Location: Uppsala, Sweden
Size: 5 000 units
Year of construction: started at 1960s

Case study by:
Robbin Modigh
Feng Tinghao Zhang Yuchao
Historical question
Population problems
The development of residential areas in Gottsunda began in the 1960s with the Million Housing Programme, which aimed to provide affordable, high-quality housing to all Swedish citizens. Uppsala faced rapid population growth at the time, as did the rest of Sweden. Until 1963, Uppsala’s population growth rate was maintained at around one percent per year, but after 1963, it increased rapidly to over two percent.
Therefore, in order to solve the housing problem caused by the population growth, the Uppsala municipality approved in the planning proposal for South Valsätra in 1966, with a plan to build more

than 3,000 new collective housing units and 490 detached houses. In 1970, the municipality planned an additional 5,000 housing units in North Gottsunda, in which several distinctive features of the Million Housing Programme were reflected, including a central, enclosed residential area, underground passageways connecting to external areas.
Between 1973 and 1974, approximately 1,000 new residential units were planned in the eastern and southwestern parts. In 1978, 670 collective houses and 155 detached houses for the southern part of Gottsunda Center was completed.
54 Mass Housing
North Gottsunda, 1970 Gottsunda, 1973-74
South Gottsunda, 1978 South Gottsunda, 1991
(Illustration
(Illustration based by Uppsala Kommun, 2021)
based by Uppsala Kommun, 2019)
Gottsunda historical development Figure 5.1. Figure 5.2. social democrats proposal Valsätra was seen here as a continuation of the Norby residential area the mass construction of dwellings in concrete and 15%-20% were pre- cast concrete buildings Milion program starts and continues until year 1974 Norra Gottsunda built a new road Hugo Alfvéns väg This connected Valsättra with Gottsunda. After received criticism from the public, district 6, 7 and 8 started to consturct much lower height buildings District 9, 10, 11 and 12 distributed housings around the small farms with various heights and formation 1933: New housing program Be fo re W orld W ar two 1960s: New residential area V alsätra 1961-1975: Record years of massive construc tio n 1965-1974: M illion housing program 1970: Norra Gottsunda af ter 1975: criticism to million housing program 1980s: various types and heights of housing
Gottsunda development
Different features of Gottsunda
Figure 5.3
Figure 5.4.
(Illustration based by Uppsala Kommun, 2019)
Figure 5.6.
Age distribution, 2016 20-64 year-employment, 2015

Figure 5.5.
Housing size, 2016
(Illustration based by Uppsala Kommun, 2019)
(Illustration based by Uppsala Kommun, 2019)
Residential background, 2015 Figure 5.7.


(Illustration based by Uppsala Kommun, 2019)
Housing property within Gottsunda
Different buildings have different ownership in Gottsunda region. The personal raw housing for single family apartments, personal housing for multifamily apartments and rental housing.
Figure 5.8
(Illustration based by Uppsala Kommun, 2019) (Uppsala Kommun, 2019)
Gottsunda mapping Comprasion with Uppsala
Compared with Uppsala, Gottsunda has more immigrants and fewer employing age at 2064 years region. However, the housing size of Gottsunda is bigger than Uppsala.

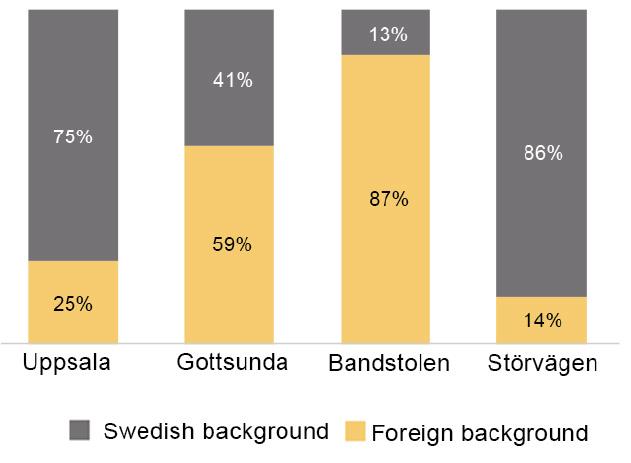

55 Gottsunda
Housing property of Gottsunda
Economics features
Assumed renovation cost
The diagram below shows different parts of building renovation cost in Gottsunda region by assumption. Meanwhile, with the older the construction age is, the higher cost will be.

Investment
The construction of Gottsunda involved various investors. The blue color shows the municipality investment and the red color indicates the personal investment.
Figure 5.9.

Assumed renovation cost
(Illustration based by Uppsala Kommun, 2019)
Figure 5.10.
(Illustration based by Uppsala Kommun, 2007)
56 Mass Housing
Investor and architect involved in Gottsunda
Two cases —
Stackmästarvägen 21, Stenhammars väg 6
Figure 5.11.
Stenhammars väg 6 and Stackmästarvägen 21

Stackmästarvägen 21 is the building that was designed by Gösta Wikforss and constructed in 1968, with a 106 m² total floor area. It is a personal raw housing with single family apartment that contains one floor with a basement.
Meanwhile, Stenhammars väg 6, built in 1973, which was the million housing project program era, with 7 floors and a basement.
Renovation and reuse possibility
The material that Stackmästarvägen 21 used:
Leca blocks: 100 years Mineral wood borad: 60 years c/c compond material: 25 years Raspont panel: 15 years

The material that Stenhammars väg 6 used:
Plastic pipes: 100 years Raw sheet panel: 25 years Bricks: 150 years
57 Gottsunda
(Illustration based by Uppsala Kommun,1971&1972)
The building analysis within Gottsunda
Renovation case study

August Södermans
In January 2016 a new pricing model for district heating was introduced by Vattenfall in Uppsala. The Swedish state-owned company Vattenfall is the biggest heat producer in Europe. Their production plant for district heating in Uppsala is the fifth biggest in Sweden and delivers heat to 95 percent of the dwelling houses in Uppsala. The public housing corporation Uppsalahem is one of Vattenfall’s biggest customers, which provides accommodation to nearly 30 000 people in Uppsala. Vattenfall’s new pricing model introduced new heat power prices and spring & autumn energy prices in addition to the previous model, and increased the winter and summer energy prices by 55% and 81% respectively.
However, in 2013, Uppsalahem renovated the windows and ventilation of 187 apartments in 11 dwelling houses on August Södermans Road for energy efficiency. By replacing windows with a u-value of 3.1W/(m2°C) with windows with a u-value of 0.9W/(m2°C) and changing the ventilation system from FT to FTX, the total energy consumption of this residential area was significantly reduced by 38% from 2450 MWh to 1510 MWh.
In this case, despite the partial increase in energy prices offered by Vattenfall, Uppsalahem was able to save 21,000 SEK per year on energy costs in the August Södermans Road area due to its investment in energy efficiency improvements in residential areas.
58 Mass Housing
(Illustration based by Uppsala University, 2015)
Figure 5.12.
The renovation case study
Question for today
Vulnerable Area
In 2015, Valsätra was assessed as a vulnerable area in the first assessment. Subsequently, in the second assessment in 2017, Gottsunda was defined as an especially vulnerable area, which is the most critical of the three levels. Both areas have maintained this rating in the assessments so far. The presence of vulnerable areas is most likely the main reason for the unusual successive yearly decline of the population in Gottsunda since 2017, especially considering that the percentage of teenagers in the area is even higher than the average for Uppsala and the whole kingdom.

According to a report issued by the National Operations Department of Sweden, the main reasons for the formation of vulnerable areas are the influence of criminals and the difficulty of police intervention. The influence of criminals includes systematic threats and violence against the local residents, illegal activities such as drug trafficking, as well as the influence of crime in the neighbouring areas. The difficulties of police intervention can be traced back to the spatial characteristics of the residential areas built during the Million Housing Programme.

59 Gottsunda
Figure 5.14.
(Illustration based by Uppsala Kommun, 2019) Criminal
events
(Illustration based by Police in Sweden-Nationella Operativa Avdelningen,2017) The vulnerable area analysis
Figure 6.1
Future development
The 5 principles of future development
Five urban planning principles have been formulated for the Gottsunda area. The principles originate in the area’s conditions and takes aim at the programme’s objectives.
They are:
1. Central development: Central development must create clear values and build up the connection of different central points.
2. Create arenas for dialogue and creation: The knowledge and creativity found in. The Gottsunda area must be taken care of through continued dialogue and co-creation.
3. Connect the city and the district: The Gottsunda area must be better connected with the rest of Uppsala. Experiences of distance, both physical and mental, should decrease.


4. Transform roads and parking lots into living streets and places: roads should be transformed into living street space and parking spaces are regenerated for spaces that contribute to the life of the city. The human scale and experience must be in focus.
5. All additions must create added value: New building additions must create added value which gives back to the city and district.
60 Mass Housing
Road
Transportation
values
connection
friendly Additional
Public dialogue
Central development
Gottsunda future development (Illustration based by Uppsala Kommun,2007)
The renovation case study
Figure 5.15.
Future housing
The Gottsunda area is estimated to be able to be supplemented with 5,000–7,000 new homes and premises for trade, service, workplaces, and public spaces. Development must take place with consideration of the areas qualities and shortcomings in a way that creates positive synergies in both the short and long term. The area is estimated to be fully developed by 2050.,
A. Central quarter: Neighborhoods with large elements of commerce, businesses, and workplaces together with housing. Greater mobility solutions in strategic locations.

B. City street block that meets existing large-scale construction: • Neighborhoods that contain a mix of housing and businesses to varying degrees.• A continuity of active and living ground floors with large elements of premises and operations. • Building heights between 5 and 7 floors with features of both lower and higher buildings
C. larger landscape rooms strengthen the street through well-maintained ground floors, entrances facing the street, and premises in strategic locations.
D. Infill block against block street/ prioritized line
• Neighborhoods with mainly housing.
• Buildings are placed against the street to strengthen the street space and contribute to safety and well-being.

61 Gottsunda
(Illustration based by Uppsala Kommun, 2019)
The future housing design strategy Figure 5.17. (Illustration based by Uppsala Kommun, 2019)
Future imagination of Gottsunda Figure 5.16.
Location:
Size:
units Year of completion:
Stockholm, Sweden
5 767
1950 - still developing Case study by: Maria Dalmer Alice Erkhammar Maja Nordblom Bagarmossen
Preconditions
Built before 1967 Million programme housing 1967-1973 Densification 1970s to present
Built before 1967 Million Programme housing 1967-1972 Densification 1970’s - present
(Based on information from Stockholms Stadsbyggnadskontor, 2022) Figure 6.1.
Preconditions
In 1935, the Swedish government decides to start a loan-and subsidy fund so that the municipalities can arrange for accommodations for families with many children and low income, to solve overcrowding. In Stockholm and the rest of the country municipal housing companies are formed. 1939 is a record year for housing production in Sweden, but the war years make the production slow down after that.
In 1940, the district of Skarpnäck has it’s city plan approved and in 1950 the new district starts to be built. The housing provided is rental housing and consists mostly of three-story houses.
In the 1960s, Sweden suffers from housing shortage. This makes the Swedish government initiate the Million Programme in 1965, which enables the construction of one million dwellings in ten years. As a part of this public housing program, Bagarmossen is expanded in the north, and a new residential area around the street Byälvsvägen is completed in 1972.
In the 1980’s and from the early 2000’s until today, Bagarmossen is densified with new housing blocks, filling in gaps in the existing building structure.
64 Mass Housing
Built before 1967
Million programme housing 1967-1973
Densification 1970s to present
Constructions & materials
1950’s housing
The concrete framework is cast in place, which was the standard in this time period. The facade is “ädelputs”, a plaster that is a mix of limestone, cement and dolomite marble, which makes it gleam in the sunlight. The interior parts, such as doors, windows, built-in wardrobes and kitchen cupboards are made out of wood. The balconies have railings of corrugated steel.
Figure 6.2.
(Drawing from Stadsbyggnadskontoret, 2022)
Terraced houses on Riksrådsvägen
The framework is made of prefabricated concrete beams called Erge beams, and smaller prefabricated concrete elements that are manually put in place on the site. The walls separating the apartments are made of brick. The facade is a mix of cement fiber board, brick and eternit (asbestos cement sheeting). In the 1950’s, houses started to be heated by oil or the water was distributed with central heating, and the need for a basement was reduced. The foundation could there for be simplified and the terraced houses could be adapted to the typology by building souterrain floors.
Figure 6.3.
(Drawing from Stadsbyggnadskontoret, 2022)
Million Programme housing on Byälvsvägen
The concrete framework is cast in place, but in a more industrialized manner than the 1950’s housing, where the frames in which the concrete are cast are reused throughout the building. The system is a so called “bookshelf” system. The facade is a mix of calcareous sandstone and bricks.
Figure 6.4.
(Drawing from Stadsbyggnadskontoret, 2022)
65 Bagarmossen
Building envelope ”Ädelputs” (limestone, cement and dolomite marble), sheet metal, woodwork, roofing tiles Building envelope Cement fiber board, brick, eternit, corrugated sheet metal Building envelope Calcareous sandstone, steel, woodwork (windows, doors) Building frame Concrete Building frame Concrete, brick Building frame Concrete Installations Installations Installations Interior Linoleum, parquet flooring, ceramic tiles, woodwork (doors, skirting boards etc) Interior Linoleum, parquet flooring, ceramic tiles, woodwork, lime stone, brick Interior Linoleum, parquet flooring, ceramic tiles, woodwork (doors, skirting boards etc) Furnishing Kitchenware, wood cupboards, sanitary fittings (bathtub, sink, lavatory) Furnishing Kitchenware, wood cupboards, sanitary fittings (bathtub, sink, lavatory) Furnishing Kitchenware, wood cupboards, sanitary fittings (bathtub, sink, lavatory)
Use - social
A - Arbete/work Schools
Retirement homes, LSS/service homes, preschools Industries, animal hospital, distri bution, community hall etc
B - Bostad/housing C - Centrum/center
Housing
Center with stores, restaurants, church, library, community house and health center Subway station
Distance to subway station ≤ 500 m Recreation
Nackareservatet nature reserve
Sports field
(Based on information from SCB, 2022) Figure 6.5.
Investigating the ABCDEF in Bagarmossen
Bagarmossen was not planned to be an ABCtown. With the subway station finished in 1958, the thought was for the inhabitants to be able to live in Bagarmossen and work in the city. Today, businesses and schools has provided work oppurtunities and Bagarmossen has in a way transformed into an ABC-town.
The D (diversity) in the area is connected to the people living there, the housing types and the work opportunities. In that sense, Bagarmossen is diverse, but when looking at specific areas (see fig. 6.13) there is a segregation between them.
The E (equality) in the area is connected to the diversity. There are differences in income that can be linked to the different housing types (see fig. 6.20), where there are a lot of rental housing the people seem to have lower income, and in the areas with private owned housing the incomes are higher.
The F (fair) in Bagarmossen is also connected to the other topics. The closeness to communication and recreational areas make Bagarmossen a fair town in that sense.
66 Mass Housing
Use - ecological

The condominium association Emågatan acquired the property Stockholm Stadsfogden 9 in Stockholm municipality on November 20, 2015. The associ ation’s property consists of three interconnected apartment buildings at the address Emågatan 2840A. The property was built in 1953 and renovated during 2018-2019. The property has 54 apartments and a number of premises. The total building area amounts to 3 319 m2, of which 3 132 m2 is apart ment space and 187 m2 is room space. In the asso ciation there are 13 parking spaces and 3 garages as well as a large courtyard. The construction also included, among other things, additional insulation of facades, remodeling of roofs, replacement of win dows, recasting of balconies and drainage.
Figure 6.8. Location of condominium association Emågatan (Based on information from SCB, 2022)
Figure 6.7. (Based on information from Energ, 2022)
Figure 6.9. (Based on information from Energimyndigheten, 2022)
Figure 6.10.(Based on information from Energimyndigheten, 2022)
Figure 6.11. (Based on information from Allabrf annual report, 2018)
Figure 6.12. (Based on information from Allabrf annual repport, 2018)


67 Bagarmossen
energy consumption in homes Heat losses in homes Energy consumption co-op
Costs for facade renovation co-op Emågatan
Average
Emågatan
75% 25% Energy consumptions
homes Space hating&ventilation Water heating&appliances,electronics and lighting Space heating & ventilation Water heating & appliances, electronics and lighting 75% 25% 15% 15% 35% 20% 15% Heat losses in homes Ventilation Roof Windows and doors Walls Floor &foundation 15% 15% 15% 20% 35% Ventilation Roof Windows & doors Walls Floor & foundation 64% 36% Energy consumption 2017 2018 2017 2018 64% 36% 81% 19% Costs for facade renovation 2017 2018 2018 2017 19% 81% 2017 2018 0 20 40 60 80 100 120 140 160 180 200 Before renovation After renovation kWh/m2 Energy consumptions before and efter renovation Space heating Water heating Electrical appliances&lighting Ventilation Energy consumptions before and after renovation Space heating Water heating Electrical appliances&lighting Ventilation Before renovation Efter renovation kWh/m2 200 180 0 20 40 60 80 100 120 140 160 SKALA DATUM UPPDRAG NR 2019-09-10OLA 293 316 STADSFOGDEN RELATIONSHANDLING BETANT Hus B och C A-40.3-01 A1 - 1:100 A3BL FASADER BOSTADSRÄTTSFÖRENINGEN Arkitekt: +36,50 +41,34 +38,44 +35,74 +44,24 +37,00 +37,00 +36,53 +37,00 +36,87 +36,50 +36,87 +44,24 +41,34 +38,44 +35,45 +35,64 SKALA 1:100 012 5 10 METER 1:200 FÖRKLARINGAR Samtliga mått Plushöjder höjdsystemet tillkomst. Ritningsmarkeringar: Ursprungsarkitekter Gate-Lindegren HUS B, FASAD MOT SÖDER HÄNVISNINGAR Utsnitt fasad Fasadsnitt Detaljer Stadsfogden bygglovsansökan HUS C, FASAD MOT VÄSTER Inkom till Stockholms stadsbyggnadskontor2019-09-20, Dnr 2017-19949 Figure 6.6. Facade drawing of co-op Emågatan (Stadsbyggnadskontoret, 2022)
in
The areas of Bagarmossen has a variation of housing types, but mostly rental (65%). There is a segregation within the area, where the million programme area (1) consists only of rental apartments while the 1950’s housing (the larger part of Bagarmossen), which started as rental, has in some extent transformed into housing cooperations, when the municipal housing companies has offered the tenants to buy their apartments. The areas with private housing (single family houses and terraced houses) has a small change in housing types.
Figure 6.13.
Riksrådsvägen - housing for whom?
When the terraced houses on Riksrådsvägen by Léonie and C.E. Geisendorf were built, they were rental houses provided by the housing company Hyreshus u.p.a. (later Svenska Bostäder). The terraced houses could be built with the same density as the three-story multifamily houses, but with the benefits of a single family house. The rental housing was an alternative for families with many children that could not afford to buy a house. The houses stayed rental until 2000, and were then transformed into a housing cooperation. Today, the final prices for a house on Riksrådsvägen lies between 8-12 million SEK.
Figure 6.14.

68 Mass Housing End of life - social/economical 1 2 3 4 5 6 7 0 100 1 2 3 4 5 6 7 Rental Condominium Ownership 0 100 200 300 400 500 600 1 2 3 4 5 6 7 Bergsrådsvägen Rental Condominium Ownership 0 100 200 300 400 500 600 700 800 900 1 2 3 4 5 6 7 Lagaplan / Emågatan Rental Condominium Ownership 0 50 100 150 200 250 300 350 1 2 3 4 5 6 7 Byälvsvägen + Ljusnevägen Rental Condominium Ownership 0 100 200 300 400 500 600 700 1 2 3 4 5 6 7 Byälvsvägen 2015 2016 2017 2018 2019 2020 2021 0 100 200 300 400 500 600 700 1 2020 2021 963 909 180 234 0 0 11 11 588 589 82 82 498 498 202 202 100 98 517 517 261 266 0 0 760 763 126 126 0 0 328 328 306 306 195 193 644 644 0 0 0 0 0 200 400 600 800 1000 1200 2015 2016 2017 2018 2019 2020 2021 Fogdevägen + Sockenvägen Rental Condominium Ownership 0 100 200 300 400 500 600 700 1 2 3 4 5 6 7 Södra Bagarmossen Småhus Rental Condominium Ownership 0 100 200 300 400 500 600 1 2 3 4 5 6 7 Svartågatan + Lillågatan + Småhus Rental Condominium Ownership 0 100 200 300 400 500 600 1 2 3 4 5 6 7 Bergsrådsvägen Rental Condominium Ownership 0 100 200 300 400 500 600 700 800 900 1 2 3 4 5 6 7 Lagaplan / Emågatan Rental Condominium Ownership 0 50 100 150 200 250 300 350 1 2 3 4 5 6 7 Byälvsvägen + Ljusnevägen 2015 2016 2017 2018 2019 2020 2021 0 100 200 300 400 500 600 700 3 Antal lägenheter efter region, upplåtelseform och år 2015 2016 2017 2018 2019 2020 2021 0180C1940 0180C1940 1 Rental 887 887 887 887 963 963 909 2 Condomini 118 180 180 180 180 180 234 3 Ownership 0 0 0 0 0 0 0 0180C1740 0180C1740 1 Rental 15 11 11 11 11 11 11 2 Condomini 576 588 588 588 588 588 589 3 Ownership 83 85 85 85 83 82 82 0180C1750 0180C1750 1 Rental 498 498 499 498 498 498 498 2 Condomini 202 202 202 202 202 202 202 3 Ownership 98 98 95 99 99 100 98 0180C1800 0180C1800 1 Rental 517 517 517 517 517 517 517 2 Condomini 246 255 260 261 261 261 266 3 Ownership 0 0 0 0 0 0 0 0180C1900 0180C1900 1 Rental 790 814 814 760 760 760 763 2 Condomini 93 72 72 126 126 126 126 3 Ownership 0 0 0 0 0 0 0 0180C1950 0180C1950 1 Rental 328 328 328 328 328 328 328 2 Condomini 306 306 306 306 306 306 306 3 Ownership 190 194 193 193 195 195 193 0180C2040 0180C2040 1 Rental 644 644 644 644 644 644 644 2 Condomini 0 0 0 0 0 0 0 3 Ownership 0 0 0 0 0 0 0 0 200 400 600 800 1000 1200 2015 2016 2017 2018 2019 2020 2021 Fogdevägen + Sockenvägen Rental Condominium Ownership 0 100 200 300 400 500 600 700 1 2 3 4 5 6 7 Södra Bagarmossen Småhus Rental Condominium Ownership 0 100 200 300 400 500 600 1 2 3 4 5 6 7 Svartågatan + Lillågatan + Småhus Rental Condominium Ownership 0 100 200 300 400 500 600 1 2 3 4 5 6 7 Bergsrådsvägen Rental Condominium Ownership 0 100 200 300 400 500 600 700 800 900 1 2 3 4 5 6 7 Lagaplan / Emågatan Rental Condominium Ownership 0 50 100 150 200 250 300 350 1 2 3 4 Byälvsvägen + Ljusnevägen Rental Condominium Ownership 0 100 200 300 400 500 600 700 1 2 3 4 Byälvsvägen 2015 2016 2017 2018 2019 2020 2021 0 100 200 300 400 500 600 4 Antal lägenheter efter region, upplåtelseform och år 2015 2016 2017 2018 2019 2020 2021 0180C1940 0180C1940 1 Rental 887 887 887 887 963 963 909 2 Condomini 118 180 180 180 180 180 234 3 Ownership 0 0 0 0 0 0 0 0180C1740 0180C1740 1 Rental 15 11 11 11 11 11 11 2 Condomini 576 588 588 588 588 588 589 3 Ownership 83 85 85 85 83 82 82 0180C1750 0180C1750 1 Rental 498 498 499 498 498 498 498 2 Condomini 202 202 202 202 202 202 202 3 Ownership 98 98 95 99 99 100 98 0180C1800 0180C1800 1 Rental 517 517 517 517 517 517 517 2 Condomini 246 255 260 261 261 261 266 3 Ownership 0 0 0 0 0 0 0 0180C1900 0180C1900 1 Rental 790 814 814 760 760 760 763 2 Condomini 93 72 72 126 126 126 126 3 Ownership 0 0 0 0 0 0 0 0180C1950 0180C1950 1 Rental 328 328 328 328 328 328 328 2 Condomini 306 306 306 306 306 306 306 3 Ownership 190 194 193 193 195 195 193 0180C2040 0180C2040 1 Rental 644 644 644 644 644 644 644 2 Condomini 0 0 0 0 0 0 0 3 Ownership 0 0 0 0 0 0 0 0 200 400 600 800 1000 1200 2015 2016 2017 2018 2019 2020 2021 Fogdevägen + Sockenvägen Rental Condominium Ownership 0 100 200 300 400 500 600 700 1 2 3 4 5 6 7 Södra Bagarmossen Småhus Rental Condominium Ownership 0 100 200 300 400 500 600 1 2 3 4 5 6 7 Svartågatan + Lillågatan + Småhus Rental Condominium Ownership 0 100 200 300 400 500 600 1 2 3 4 5 6 7 Bergsrådsvägen Rental Condominium Ownership 0 100 200 300 400 500 600 700 800 900 1 2 3 4 5 6 7 Lagaplan / Emågatan Rental Condominium Ownership 0 50 100 150 200 250 300 350 1 2 3 4 Byälvsvägen + Ljusnevägen Rental Condominium Ownership 0 100 200 300 400 500 600 700 1 2 3 4 Byälvsvägen 2015 2016 2017 2018 2019 2020 2021 0 100 200 300 400 500 600 5 0180C1800 0180C1800 1 Rental 517 517 517 517 517 517 517 2 Condomini 246 255 260 261 261 261 266 3 Ownership 0 0 0 0 0 0 0 0180C1900 0180C1900 1 Rental 790 814 814 760 760 760 763 2 Condomini 93 72 72 126 126 126 126 3 Ownership 0 0 0 0 0 0 0 0180C1950 0180C1950 1 Rental 328 328 328 328 328 328 328 2 Condomini 306 306 306 306 306 306 306 3 Ownership 190 194 193 193 195 195 193 0180C2040 0180C2040 1 Rental 644 644 644 644 644 644 644 2 Condomini 0 0 0 0 0 0 0 3 Ownership 0 0 0 0 0 0 0 2015 2016 2017 2018 2019 2020 2021 Rental Condominium Ownership 0 100 200 300 400 500 600 700 1 2 3 4 5 6 7 Södra Bagarmossen Småhus Rental Condominium Ownership 0 100 200 300 400 500 600 1 2 3 4 5 6 7 Svartågatan + Lillågatan + Småhus Rental Condominium Ownership 0 100 200 300 400 500 600 1 2 3 4 5 6 7 Bergsrådsvägen Rental Condominium Ownership 0 100 200 300 400 500 600 700 800 900 1 2 3 4 5 6 7 Lagaplan / Emågatan Rental Condominium Ownership 0 50 100 150 200 250 300 350 1 2 3 4 5 6 7 Byälvsvägen + Ljusnevägen Rental Condominium Ownership 0 100 200 300 400 500 600 700 1 2 3 4 5 6 7 Byälvsvägen 2015 2016 2017 2018 2019 2020 2021 100 0 400 700 900 800 600 500 300 200 6 Antal lägenheter efter region, upplåtelseform och år 2015 2016 2017 2018 2019 2020 2021 0180C1940 0180C1940 1 Rental 887 887 887 887 963 963 909 2 Condomini 118 180 180 180 180 180 234 3 Ownership 0 0 0 0 0 0 0 0180C1740 0180C1740 1 Rental 15 11 11 11 11 11 11 2 Condomini 576 588 588 588 588 588 589 3 Ownership 83 85 85 85 83 82 82 0180C1750 0180C1750 1 Rental 498 498 499 498 498 498 498 2 Condomini 202 202 202 202 202 202 202 3 Ownership 98 98 95 99 99 100 98 0180C1800 0180C1800 1 Rental 517 517 517 517 517 517 517 2 Condomini 246 255 260 261 261 261 266 3 Ownership 0 0 0 0 0 0 0 0180C1900
1
790 814 814 760 760 760 763 2
93 72 72 126 126 126 126 3
0 0 0 0 0 0 0 0180C1950
1
328 328 328 328 328 328 328 2 Condomini 306 306 306 306 306 306 306 3 Ownership 190 194 193 193 195 195 193 0180C2040
1 Rental 644 644 644 644 644 644 644 2 Condomini 0 0 0 0 0 0 0 3 Ownership 0 0 0 0 0 0 0 0 200 400 600 800 1000 1200 2015 2016 2017 2018 2019 2020 2021 Fogdevägen + Sockenvägen Rental Condominium Ownership 0 100 200 300 400 500 600 700 1 2 3 4 5 6 7 Södra Bagarmossen Småhus Rental Condominium Ownership 600 Svartågatan + Lillågatan + Småhus 0 100 1 2 3 4 5 6 7 Rental Condominium Ownership 50 100 150 200 250 300 350 Byälvsvägen + Ljusnevägen 2015 2016 2017 2018 2019 2020 2021 0 200 400 600 800 1000 1200 7 0 100 200 1 2 3 4 5 6 Rental Condominium Ownership 0 50 100 150 200 250 300 350 1 2 3 4 5 6 Byälvsvägen + Ljusnevägen Rental Condominium Ownership 0 100 200 300 400 500 600 700 1 2 3 4 5 6 Byälvsvägen Rental Housing co-op 0 100 200 1 2 3 4 5 6 7 Rental Condominium Ownership 0 50 100 150 200 250 300 350 1 2 3 4 5 6 7 Byälvsvägen + Ljusnevägen Rental Condominium Ownership 0 100 200 300 400 500 600 700 1 2 3 4 5 6 7 Byälvsvägen Private ownership 0 100 200 1 2 3 4 5 6 Rental Condominium Ownership 0 50 100 150 200 250 300 350 1 2 3 4 5 6 Byälvsvägen +
0 100 200 300 400 500 600 700 1 2 3 4 5 6
0180C1900
Rental
Condomini
Ownership
0180C1950
Rental
0180C2040
Ljusnevägen Rental Condominium Ownership
Byälvsvägen Changes in housing types 2015-2021
517 517 261 266 0 0 760 763 126 126 0 0 328 328 306 306 195 193 644 644 0 0 0 0 2015 2016 2017 2018 2019 2020 2021 Rental Condominium Ownership 0 100 200 300 400 500 600 700 1 2 3 4 5 6 7 Södra Bagarmossen Småhus Rental Condominium Ownership 0 100 200 300 400 500 600 1 2 3 4 5 6 7 Svartågatan + Lillågatan + Småhus Rental Condominium Ownership 0 100 200 300 400 500 600 1 2 3 4 5 6 7 Bergsrådsvägen Rental Condominium Ownership 0 100 200 300 400 500 600 700 800 900 1 2 3 4 5 6 7 Lagaplan / Emågatan Rental Condominium Ownership 0 50 100 150 200 250 300 350 1 2 3 4 5 6 7 Byälvsvägen + Ljusnevägen Rental Condominium Ownership 0 100 200 300 400 500 600 700 1 2 3 4 5 6 7 Byälvsvägen 2015 2016 2017 2018 2020 2021 0 50 100 150 200 250 300 350 2 2019
Terraced houses on Riksrådsvägen (Image by Johansson, Ingrid)
(Based on information from SCB, 2022)
End of life - ecological
Interior parts
Bath, cast steel 50 yrs
Toilet 50 yrs
Mirror cabinet 25 yrs
Refrigerator/freezer 12 yrs
Stove/oven 20 yrs
Sealing layer, bathroom 30 yrs
Linoleum floor 25 yrs
Sheet metal works 20 yrs
Balconies 50 yrs
Kitchen-ware 20 yrs
Parquet floor 40 yrs
Wallpapers 10 yrs
Indoor painting 10 yrs
Ceramic tiles 40 yrs
Maintenance periods
10 20 30 40 50 60 70 0
84 kg CO2-ekv/pc 10 kg CO2-ekv/pc 39 kg CO2-ekv/pc 202 kg CO2-ekv/pc 152 kg CO2-ekv/pc 2,4 kg CO2-ekv/pc 0,3 kg CO2-ekv/m2 3,4 kg CO2-ekv/m2
YEAR 1960 1970 1980 1990 2000 2010 2020 1950
1950’s housing, 1952 -
Million Programme, 1972 -
Figure 6.15.
(Based on information from ConstructingArchitecture, 21)
Estimation of climate impact
By looking at the maintenance periods of different interior parts and using the information that we managed to find on green house gas emissions on some of those parts, we could do an estimation on how much the maintenance on an average sized apartment in the 1950’s housing (50 m2) and the Million Programme housing (79 m2) has let out in green house gases until today, at the very least. The average amount of green house gas emissions when building a multi family house is 550 kg CO2ekv/m2.
Interior parts
Bath, cast steel 50 yrs
Toilet 50 yrs
Mirror cabinet 25 yrs
Refrigerator/freezer 12 yrs
Stove/oven 20 yrs
Parquet floor 40 yrs
Indoor painting 10 yrs
Ceramic tiles 40 yrs
Climate impact Total kg CO2-ekv 84 kg CO2-ekv/pc 10 kg CO2-ekv/pc 39 kg CO2-ekv/pc 202 kg CO2-ekv/pc 152 kg CO2-ekv/pc 2,4 kg CO2-ekv/m2 0,3 kg CO2-ekv/m2 3,4 kg CO2-ekv/m2
Figure 6.16.
(Based on information from Arkitektur, mate rialflöden och klimatpåverkan i bostäder, 67)
69 Bagarmossen
CLIMATE IMPACT
? ? ? ? ? ?
x1 = 84 x1 = 84 x1 = 10 x1 = 10 x1 = 39 x1 = 39 x5 = 1010 x4 = 808 x3 = 456 x2 = 304 1x20 = 48 1x20 = 48 7x180 = 1260 5x114 = 570 1x9 = 30,6 1x6 = 20,4 2937,6
1883,4
Ideas for the future Bagarmossen
Planning project by Spridd (2010), Byälvsvägen
A project that was never realised. It focused on the necessary renovations and technical upgrade of the Million Programme buildings, with regard to the original architecture and focus on energy saving solutions. There was also a social aspect, with ideas about creating common spaces and shared services, like locally produced food and repairs.
Figure 6.17.
Housing project by Vera Arkitekter and Stockholmshem (2020 to present), Byälvsvägen

A project that is currently in the planning phase. The proposal is to build 225 new rental apartments along the south side of Byälvsvägen, to create a more defined urban space around the street. The buildings are planned to be of similar height and materials as the existing buildings. The linden walk and the green character of the neighbourhood are considered as important values that should be preserved.
Figure 6.18.
Elevation and situation plan of the new buildings. (Stockholms stad, 2021)


Housing projects in the early planning phase
There are, beside the Byälvsvägen project, proposals for new apartment blocks at Ljusnevägen in north-eastern Bagarmossen, and Bergholmsbacken in southern Bagarmossen.
In total, these three projects will add about 1060 housing units to Bagarmossen. About 540 of these will be rental, and the rest will be condominium housing.
Figure 6.19. The areas of development in Bagarmossen. (Based on statistics from Stockholms stad, 2022)
70 Mass Housing
A proposed extension to an existing building at Byälvsvägen. (Image by Spridd, 2010)
2015 2016 2017 2018 2019 2020
0180C2040 192500 199800 206500 211200 212100 204700
A changing population?
0180C1950 259100 265900 260700 274700 279700 289300
0180C1740 282900 284400 290600 282700 292700 296700
0180C1750 245700 248100 250700 253200 261500 259700
0180C1800 231600 238000 241000 241300 242300 247900
0180C1940 219100 233700 237600 242300 243100 246800
0180C1900
Figure 6.20. (Based on statistics from SCB, 2022)
High Low 2017
Higher education rate Employment rate Mean income 2000
Figure 6.21. (Based on statistics from Södertörnsmodellen, 2022)
Price per sqm (SEK)
Figure 6.22. (Based on statistics from Hemnet, 2022)
Mean income in different areas of Bagarmossen, 2015-2020
The area around Byälvsvägen in northern Bagarmossen stands out in the statistics. As we could see earlier (fig. 6.13), there is almost exclusively rental housing in northern Bagarmossen, while the rest of Bagarmossen is more varied in terms of housing forms.
Mean income, employment rate and higher education rate in northern Bagarmossen, 2000-2017
Northern Bagarmossen has a history of rather low mean income and employment rate, and a very low higher education rate. However, in recent years there has been a clear increase in all three areas.


Final prices in northern Bagarmossen, 2014-2022
In 2022, private housing in northern Bagarmossen has been sold for almost 70 000 SEK per sqm. It is lower than the average price in Stockholm municipality (around 83 000 SEK per sqm), but much higher than the average price in Sweden (46 000 SEK per sqm).
71 Bagarmossen
Apartments with 3 rooms, Ljusnevägen 2014 2015 2016 2017 2018 2019 2020 2021 2022 75 000 70 000 65 000 60 000 55 000 50 000 45 000 40 000 35 000 Row housing, Ljusnevägen Apartments with 3-4 rooms, Sockenvägen
221900 229900 235500 242700 243900 240600 190000 210000 230000 250000 270000 290000 310000 2015 2016 2017 2018 2019 2020
Diagramrubrik 0180C2040 0180C1950 0180C1740 0180C1750 0180C1800 0180C1940 0180C1900 310 000 290 000 270 000 250 000 230 000 210 000 190 000 Mean income (SEK) 2015 2016 2017 2018 2019 2020
Bijlmermeer
Location: Amsterdam-Zuidoost, Netherlands
Size: 6 000 m2, 13 000 housing units Year of completion: 1975
Case study by:
Natalia Hedström
Gabrielė Lipskytė
Claudia Pavilanis
7,6KM
Figure 7.1.
Expansion Plan
As early as 1928, the city of Amsterdam had an urban development department. Among other things, this department reflected on the city’s future. In 1935, they published the General Expansion Plan of Amsterdam, which was adopted by the city council in 1938. In this plan, they predicted that Amsterdam will need to house 960 000 inhabitants by the year 2000.
Their main goals were to scale up building devel opments, integrate them into Amsterdam through the construction of a metro line, and to provide both collectivism and privacy in these areas.
Housing Shortage
During World War II, the Netherlands lost 87 000 homes and 43 000 were severely damaged. In 1945, there were only 2 million houses standing in the country for a growing population of 9 million. The Dutch started building in mass quantities to solve the housing crisis. The number of post-war homes built by 1962 had reached 1 million, and by 1972, 2 million. During this time, the City Periphery Commis sion proposed to expand Amsterdam towards the south-east, an agricultural area, which will become the residential destination of Bijlmer (fig. 7.1.). In 1961, the plan to expand the city to this area became official.
74 Mass Housing
Context
Bijlmermeer
Bijlmermeer neighborhood in Zuidoost district (Diagram based on information from istockphoto, 2020)
Modernism in Amsterdam
The Modernist Dream
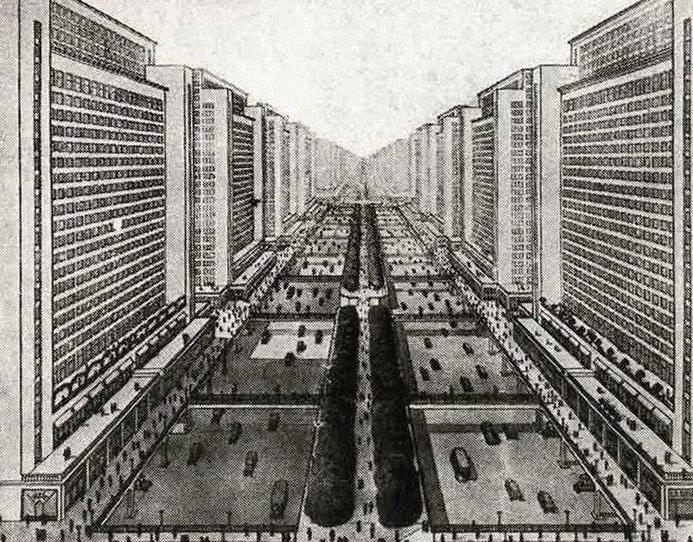
The International Congresses of Modern Architec ture, led by Le Corbusier was a group of architects that believed that modernism could improve low-cost housing in cities by optimizing construction. They felt that cities were too chaotic, so they imagined a futur istic city where all of it’s functions would be separat ed into distinct zones: housing, working, recreation, and traffic. This city’s living spaces would be in highrise apartments and roads would be elevated so that the ground level is solely dedicated to recreation and collective spaces. They emphasized that creating this order within a city would eliminate the chaos and congestion.
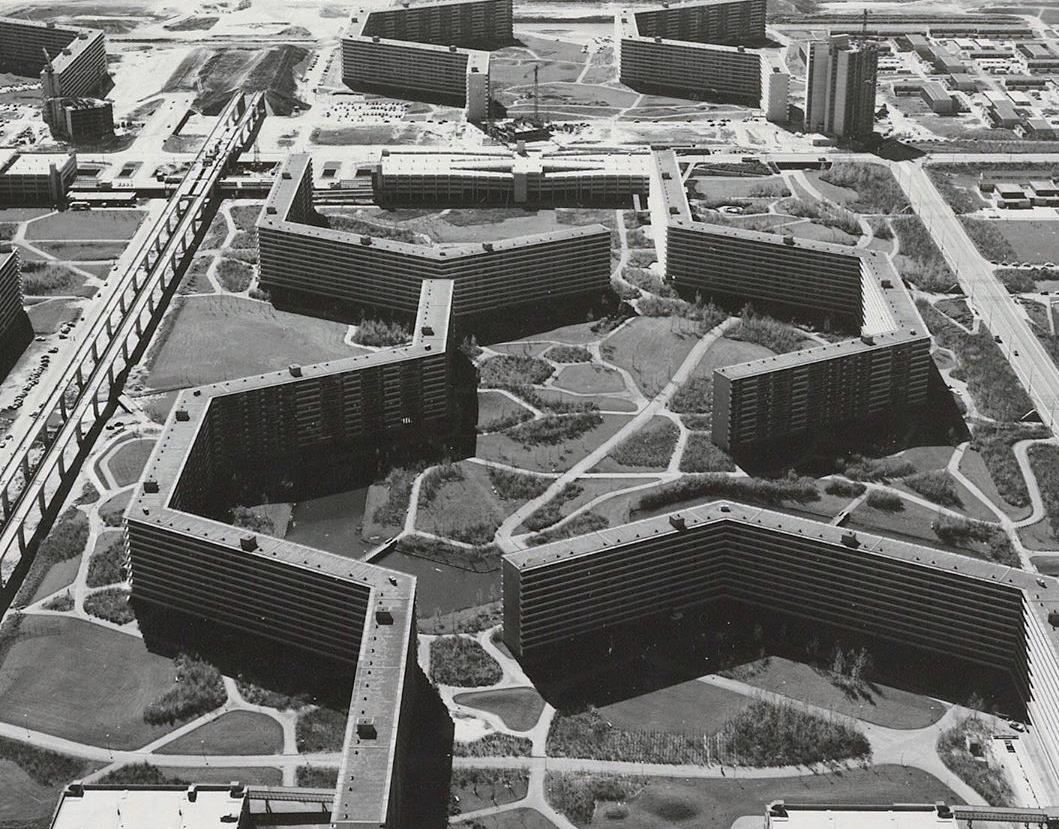

The plan for Bijlmermeer fully integrated this mod ernist approach. It focused on the separation of living, working, traffic and recreation. It’s buildings were designed in a hexagonal shape, which is where they got the name “honeycomb flats” from. They were designed this way in order to maximize sunlight in the apartments. Different levels of the building had different functions, such as storage rooms on the ground floor and areas for communal activities such as playgrounds and sports fields on the first floor. The idea was to provide car-free landscapes with cycling and walking paths. The roads were elevated and connected directly to the parking garages so that residents could walk straight into their flat from the car park. It was a modernist dream.
Bijlmermeer Team
The decision makers consisted of the following members: the municipality of Amsterdam, architects Ms Mulder, Van Ecsteren, Angenot, De Gier, Blaauw and Nassulth, also Arkcnbout and the engineering consultants Zuidcrhock, Wicgcr Bruin and Kloos. More importantly, the Bijlmer team was led by urban planner Ton de Gier and Siegfried Nassuth as chief designer and architect. In 1965 they decided the density of houses and that around 70 % of them will be for middle class Dutch citizens. In 1966, Mayor Gijs van Hall of Amsterdam drove the first pile in the Bijlmer and proudly said: “Nowhere in the world has a more beautiful and modern city [...].”
Figure 7.3.
Figure 7.4.
75 Bijlmermeer
Figure 7.2. Le Corbusier’s ideal city on different levels (Image from article Bijlmer (city of the future), 2018 )
Bijlmermeer on different levels (Image from Gemeente Amsterdam, 2019)
Mayor of Amsterdam driving the first pile in the Bijlmer (Image by Nijs, Jac. de / Anefo, 1966)
Construction
2.7 2.7 2.7 3.7 3.7 3.7 2.7
Figure 7.5.
EBA system module (Diagram based on information from Niet-tra ditionele woningbouw in Nederland Re search-Instituut voor de Woningbou, 1970)
Figure 7.6.
Apartment variations in Bijlmer (Diagram based on information from Bijlmermeer als grensverleggend ideaal: Een studie over Am sterdamse stadsuitbreiding, 1989)
14.03 42.95
42.35
Figure 7.7.
EBA system modules in plan (Diagram based on information from Niet-traditionele woningbouw in Nederland Research-Instituut voor de Woningbou, 1970)
Pre-construction
The honeycomb shape of the 100m-long Bijlmer meer flats was chosen due to the north line diago nally crossing the site. In order to make them more attractive, the planning team focused on adding amenities such as garages, storage rooms, com munity centers, as well as incorporating design elements such as landscaping and non-obstructed views. These elements were proposed to fulfill the needs of “future” dwellers (fig. 7.6.).
1964, Estimated cost of preparing construction is 160 million guilders 1966, 181 million guilders; 1967, 507 million guilders for infrastructure such as high roads, metro, elongating existing roads, etc;
The number of homes built was calculated into the profit of the construction companies so even though the built high-rises in Bijlmermeer were already de creasing in popularity, construction continued.
Efficiency of the EBA system (fig. 7.5. and 7.7.)
Out of the 13 000 Bijlmermeer homes, Kromhout en Groet architects built 1 200 with this system. The EBA system required only 574 man hours/module, while traditional building methods required 1 285 hours. The optimal construction speed per crane was 5 homes/week, and the annual capacity was around 2 000 homes. To be profitable, at least 1 500 homes/year had to be constructed.
76 Mass Housing
1970s-1980s
Due to increasing construction expenses and the services that these buildings promised and offered, the rent prices were high. Rents were considered too expensive by the Dutch middle-class, who were the targeted population. They believed that the project offered too little for its high rents (fig. 7.8.). There fore, Bijlmermeer became vacant.
In 1975, Suriname, previously a Dutch colony, gained independence. The Surinamese received Dutch citizenship and many moved to the Neth erlands. As a reaction, rules were implemented in Amsterdam and neighborhoods were closed off to immigrants (fig. 7.9.). In 1977, only 15 % of immi grants were allowed per neighborhood.
Surinamese and Bijlmermeer
In the 1970s almost half of the Surinamese popula tion migrated to the Netherlands. The migrants from Suriname were called “labor” migrants and were not welcomed as Dutch citizens. Getting housing through associations was almost impossible for them, so they ended up in “boarding homes” which had terrible living conditions. Seeking for better living conditions, the Surinamese started squatting in the empty buildings in Bijlmer. Bijlmer rents decreased and it became a “ghetto” due to the high concentra tion of immigrants and low-incomers. However, so cial life in Bijlmer in the 1980s was positive. Almost anything was allowed and possible. Inhabitants took ownsership of public spaces and created spaces for things like art and playgrounds.
Emerging problems
It was expensive to maintain the good condition of the dwellings. Only 20 % of dwellers paid their rent on time. Most people were in “rent arrears”.
Maintenance teams were dispatched and were suc cessful but were disbanded due to the high costs. Maintenance of the semi-public spaces and the sur roundings were not prioritzed and therefore became areas prone to crime, vandalism, and degradation.
People were generally happy about the size of the dwellings and the social life in the neighborhood, but safety, common spaces, and cleanliness were problematic elements in the area (fig. 7.10.).
Figure 7.8.
7
Figure 7.9.
6
4
1974 1978 1981 1
5
239 403 297 503 2
Monthly rent in Bijlmer compared to other developments (Diagram based on information from Naar het jongste verleden gekeken : over de opbouwfase van de Zuidoost lob van de agglomeratie Amsterdam, 1983) Dark grey areas on a map from the Zwartboek depicting the neighborhoods closed to Surinamese people (Diagram is based on information from Zwarboek arti cle,2017)
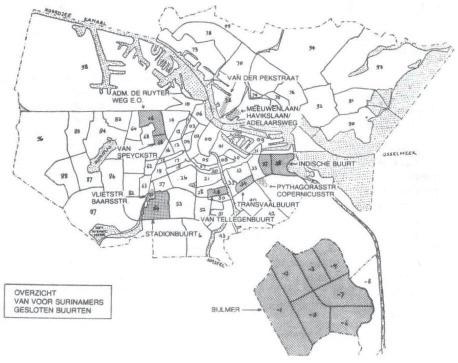
pre-war post-war bijlmer 0
8 1989 1990 1992 1994 1995 1996 1998 1999 dwelling size living in the neighbourhood rents social contacts cleanliness safety common spaces
10 9 8 7 6 5 4 3 2 1 0 1989 1990 1992 1994 1995 1996 1998 1999
in 3
size living in the neighborhood rents social contacts cleanliness safety common spaces
dwelling
77 Bijlmermeer
Use
230 180 128
170 295
0 1 2 3 4 5 6 7 8 1989 1990 1992 1994 1995 1996 1998 1999 dwelling size living
Figure 7.10. the neighbourhood rents social contacts cleanliness safety common spaces
Resident opinions on the quality of living (scale 1-10). (Diagram is based on information from Large Housing Estates: Ideas, Rise, Fall and Recovery: The Bijlmermeer and beyond, 2013)
Renewal
Measures
In the 1990s, 20 - 25 % of people wanted to move out of Bijlmer (Fig. 7.11.). Taken measures could not work on the massive scale of Bijlmermeer, and, therefore, the area was unable to gain a respect in the housing market. The Neuw Amsterdam housing association for Bijlmer was on the edge of bankrupt cy due to large amounts of debt. The conclusions of discussions about the area were that Bijlmer had to drastically change. The urban plan was rated as a failed one. It was too massive and there were too many high-rises; and those were the only type of rentals. The radical plans to change Bijlmermeer were introduced in the early 1990s. The 1992 plane crash was an accelerator to start taking serious measures.
Figure 7.11.


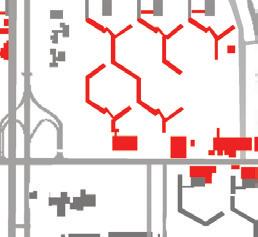

Main problems which lead to moving out (%) (Diagram is based on information from Large Housing Estates: Ideas, Rise, Fall and Recovery: The Bijlmer meer and beyond, 2013)
Figure 7.12.


Questioning renewal plans
Demolition and new construction plans (red being demolished; green being built (Diagram is based on information from De vernieuwing van de Bijlmermeer Ach tergronden en ontwikkelingen, 2014
New construction


A quarter of the housing stock was planned to be de molished to free the land for low-rise developments. This was believed to be the way to solve social problems in the area (fig. 7.12.).

645 million guilders were given for the demolition and renovation of Bijlmer, and only 2.5 million were allocated to social innovations. These solutions did not directly deal with the problems like unemployement.
Most people feared demolition and they criticized the urban renewal plans, especially having so little initiatives to involve the people living in Bijlmer.
The renewal plan focused on the ground level and scaling-up the number of dwellings. Newly construct ed low-rise building developments offered more vari ety in housing prices (between 157 500 and 298 000 guilders) and still offered social housing. Elevated roads and underpasses were replaced by roads and roundabouts. Recreational buildings were introduced to make the area more active.
These interventions densified the area to accommo date housing needs, however, the green spaces had to be surrendered.
78 Mass Housing
vandalism safety cleaniness 60 52 40 1989 1990 1991 46 51 55 59 66 65
Renovation
Inhabitants perspective
In 2001 a survey was conducted in the areas to be renewed. 70 % of the inhabitants agreed that it was a great idea to continue demolition of the high-rise blocks, and even 60 % supported demolition when it included their own apartment (fig. 7.13.). There are three reasons inhabitants were in favor of demoliton:
1. They blamed high-rises for the problems Bi jlmer was facing and it’s current state;
2. They got high priority in choosing from vacant dwellings in Amsterdam. They also received relo cation compensation (3 000 - 4 500 euros);
3. The new housing developments in the 90s were a great success and much more appealing.
Kleiburg renovation example
Kleiburg was the last building in its original state. In 2013, the first two phases of it’s renovation started. The renovation included fixing problematic parts like the dark corners on the ground floors, getting rid of the storage and internal streets to make the build ings more safe (fig. 7.14.).
The renovation also included selling the apartments for private ownership. These apartments were stripped to the bare minimum in order to allow the new owners to design their dwellings themselves. This allowed for apartments within the high-rise to feel more personal and unique. This initiative helped to improve the negative reputation of high-rise build ings.
Renovations today
The renovation and demolition are still evident today. There are garages that have been recently demol ished, or that are planned to be demolished, due to being unsafe and prone to vandalism. Some of the buildings that have been worn off are either being renovated, or competitions are being held to suggest ways of dealing with their current state.
Whilst having good intentions, the renewal plans were lacking inhabitant involvement. Even if the aesthetics of the buildings have been improved, the general social problems that Bijlmer have been deal ing since 1970s remain unresolved (fig. 7.15.).

Demolition of the high-rise buildings in general

Demolition
Figure 7.13.
Figure 7.14.
Figure 7.15.
79 Bijlmermeer
of own dwelling Renovate the dwellings 37 % 68 % 60 % 18 % 14 % 17 % 45 % 18 % 25 %
Residents opinions on buildings’ future (Diagram is based on information from Large Hous ing Estates: Ideas, Rise, Fall and Recovery: The Bijlmermeer and beyond, 2013)
Bijlmer 2022 (image by Gabriele Lipskyte)
Kleiburg renovation (Image by Stijn Brakkee, 2017)
Holding on to the dream
Figure 7.16.
Figure 7.18.
Initial dream
Designers believed in the modernists’ innovative urban ideas and used them all over Europe. The right amount of greenery per person was calculated, sufficient square meters for kitchens and storage areas, and large balconies with enough direct sun light in a day (fig. 7.16. and 7.18.). This was seen as the “formula” of tomorrow’s city. However, these plans came with a price and compromises had to be made. Not only was the cost of the rent shocking to middle-class families, the dwellings were also very different from the single-family housing that most people were used to. This dream seemed to have turned in a different direction than foreseen.

Figure 7.17.
Bijlmer Museum area (Diagram is based on information from Gemeente Amsterdam, 2019)
Figure 7.19.
Bijlmer Museum protected area (Diagram is based on information from Gemeente Amsterdam, 2019)
Architectural-historical value
In 2009, a part of Bijlmer (fig. 7.17.) was protected by the municipality with its surroundings, including the raised metro and the landscape around it (fig. 7.19.). For years, Bijlmermeer was an area of interest for many architects who stood firmly by the innovative development of the area. It is a living example of modern urban planning and housing es tates. At that time, high-rises which could be reached by metro and foot or bicycle were very experimen tal. The area also holds a testament to many taken measures to fix the social problems around without having to demolish the buildings themselves.


80 Mass Housing
50m 50m
Bijlmermeer green spaces today (Image by Jan Olphert Vaillantlaan, 2019)
A look into a Bijlmermeer apartment (Image from Biljmer Ontwerp article)
Today’s status

Figure 7.22.

Another dream
The repetitive concrete high-rises create a metropol itan atmosphere with the multiple different ethnicities living within them. Contrasting with Amsterdam’s density, Bijlmer offers vast greenery, an abundance of pedestrian and cycling paths, and a different relation ship to the transport system. These positive features were preserved from Siegfried Nassuth’s initial urban plan. Through time the inhabitants appropriated these spaces for their cultural and social activities. The inhabitants themselves, mostly immigrants, were historically forced out of Amsterdam to Bijlmer. Bijlmer gave them the opportunity to create their own commu nity (fig. 7.20.).
Figure 7.21.
Figure 7.23.

Real estate values in Amsterdam (red most expen sive, blue the cheapest) (Diagram is based on information from CBS, 2022)

Today, outsiders still consider Bijlmer to be a prob lematic area due to the high concentration of immi grants. The population of 24,430 people consists mostly of non-westerners. The 17,295 people of different ethnicities (fig. 7.21.) live in Bijlmer because it mostly offers social and affordable housing. Bijlmer in general is the most affordable area in Amsterdam (fig. 7.23.). Even with the multiple renewal initiatives that focused on architecture and amenities social problems remained unsolved. Inhabitants took matters into their own hands and tried to solve them. That gave a common purpose and a good foundation for a community.

81 Bijlmermeer
Surinamese 38% Dutch antilles 8% Marocco 4% Turkey 3% Other 47%
Figure 7.20. Kwaku festival in Nelson Mandela park (Image from article Omgeving Kwaku Summer Festival weer afgesloten, 2019)
Bijlmer today (Image by Bo Van De Wall Perne)
Percentages of different ethnicities in Bijlmermeer (Diagram based on information from CBS and ESR, 2022)
Märkisches Viertel
Location: Reinickendorf, Berlin, Germany Size: 3,015,000 m2, 17,000 units Year of completion: 1974
Case study by:

Ludvig Gokturk Tim Lewis
Hongting Xu
Figure 8.1.
Timeline
Märkisches Viertel is a satellite town in Berlin. Planned in the 1960s and consisting of 17,000 residences as well as a commercial city centre, it was the first large scale residential development project in then West Berlin.
In the 1960s, two satellite city projects epitomized Berlin’s search for the organic city; Märkisches Viertel being one of them, and Gropiousstadt being the other. The initial overall urban planning concept of Märkisches Viertel was proposed by the architects

Hans-Christian Müller, Georg Heinrich and Werner Düttman, adopting an organic urban design concept.
Construction spanned from 1963–1974 and was done primarily by the state-owned construction and housing company Gesobau, which acted both as a landlord and construction company. In total, about 17,000 residences were built and are still owned by Gesobau. (Figure 8.1)
84 Mass Housing
Timeline
of Märkisches Viertel (Diagram based on information from Google, 2022)
Figure 8.2.
Figure 8.3.
Time consumption of site versus industrialized construction (Diagram based on information from EY Building a Better Working World, 2020)
Cost of industrialized construction (Diagram based on information from EY Building a Better Working World, 2020)
About half the apartment buildings were built using industrialised methods (Figure 8.3), primarily through two types of building systems; the Swedish in-situ casting Allbetong system and the French prefabricated Camus building system. (Figure 8.2)
The urban plan was designed with the motto ”urbanity through density”, and aesthetics was fundamental: to overcome the repetetiveness normally characterising mass housing developments, they aimed to design space-defining volumes that, despite their modularity, would create unique urban spaces and identity at the same time.
To reach density goals, the 14,000 housing units originally planned in 1961 were later increased to 17,000. One way in which this was achieved was by adding additional storeys to individual buildings.
Figure 8.4.
Overall social sustainability (Diagram based on UN-Habitat, 2012)


85 Märkisches Viertel
Construction
Living in Märkisches Viertel
Figure 8.5.
Site
The project was planned to achieve social sustainability (Figure 8.4) and based on the concept of ”organic urban design” (Figure 8.6) by Hans Bernhard Reichow. However, in 1968, it was subject for a radical change in how people perceived it; at first it was praised as a success, and very shortly after scorned on both practical or functional basis and an aesthetical basis; lack of daycare, transportation, public leisure places and commercial functions that they promised (Figure 8.5), as well as the buildings being too monotonous and gray.

The promised vast green spaces were substandard, the rent was excessive, the inhabitants were poor, and crime was high. The gap between the rich and the poor in the German cities was growing larger rather quickly.
Albeit in agreement about the infrastructural shortcomings, conflict between residents and the press occurred, as the medial depiction of the area as a ghetto and the residents as criminal refuse or victims insulted them. For the residents, that generally deemed the area an upgrade from their previous substandard tenements (although with an excessive rent), this dishonor would soon overshadow their discontent with the infrastructural issues, even though the press was only trying to defend their interests.
In terms of typologies (Figure 8.7 & 8.8), it met the needs of different residents. As the majority of people who live in this area are families of couples with kids and single, most of the typologies are 2-bedroom apartments and 1-bedroom apartments.
86 Mass Housing
Housing Density (units/hectare) Civic Centres School / Childcare Sports facility 30 - 65
65 - 100
100+ (u/ha) Church Commercial Healthcare Culture Work Oppurtunities
(u/ha)
(u/ha)
Axonometric of the ABC-city (Diagram based on information from GESOBAU AG, 1969)
Figure 8.6.
Figure 8.7.
Figure 8.8.
Plan organization (Diagram based on information from Sam Jacoby, 2018)

Attic plan of Dannenwalder Weg 172 (Diagram based on information from GESOBAU AG, 1969)

Typologies of Dannenwalder Weg 172 (Diagram based on information from GESOBAU AG, 1969)
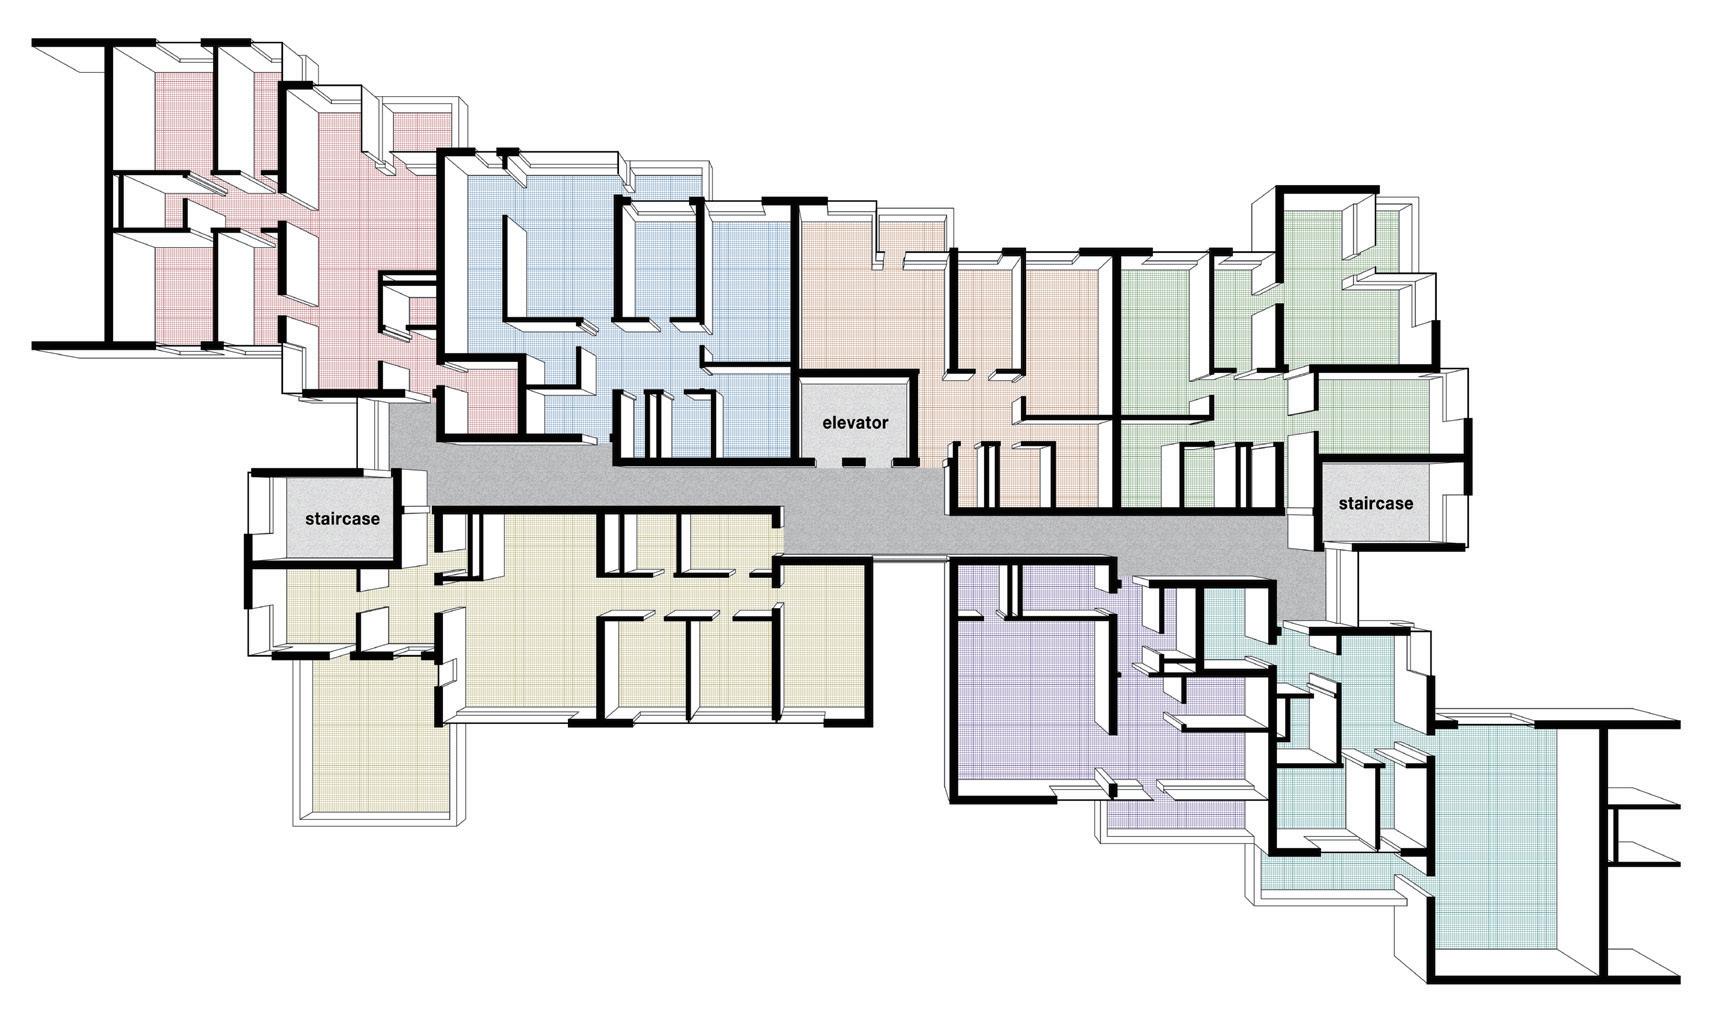
87 Märkisches Viertel 3-bedroom apartment 3-bedroom apartment 1-bedroom apartment 1-bedroom apartment 1 LIVING ROOM 2 DINING ROOM 3 KITCHEN 4 ROOM FOR CHILDREN 5 BEDROOM 6 LIVING-BEDROOM 7 STUDIO 8 BATHROOM 9 TOILET 10 STORAGE 11 BALCONY 2-bedroom apartment 2-bedroom apartment 1-bedroom apartment
Renovation
In 2009, Gesobau presented a modernization concept for the development in the governmentinitiated competition aiming to exhibit development potential of mass housing development, to prove that mass housing development is viable in a demanding future.
The concept presented was an economically sustainable model that met the ecological requirements, with emphasis on energy efficiency to reduce use of fossil fuels for heating.
The inability for the tenants to pay higher rent makes a low impact on the total rent burden essential, so in essence the objective was to attain maximum possible energy efficiency while maintaining a net zero on rent impact.


Pre-2008 ecological conditions in the Markisches Viertel were exceptionally bad. Initial construction quality was very poor and this severly affected living conditions. Any improvement or update would generate a significant ecological and/or economic win.
Primary energy consumption in Märkisches Viertel exceeded average for state-owned Berlin apartments by circa two thirds, and corrispondingly, operating costs were exceptionally high. Additionally, vacancy rates were high.
Economically, a decrease in operating costs and lower vacancy rates would therefore potentially cover up for an increased net rent, financing the investment costs.
Measures included increased landscaping, a large material upgrade in the building fabric, and a modern heating system.
As the old insulation was poor and the windows had low U value, air exchange rate was high. New insulation was put externally on the walls and roofs. (Figure 8.9 & 8.10)
The outdated single pipe heating system had to feed heat through uninsulated pipes constantly. Lack of insulation of the pipes increases heat loss within the system, and additionally, an inability to control heat operating costs individually lead to unfairly high rent to some. The new heating system was double piped, well insulated, and enabled individual billing. (Figure 8.11)
Figure 8.9.
Old external walls of the apartment buildings (building shell) are com posed mainly of concrete sandwich panels with little insulation (35 to 40 mm) with K-values averaging between 0.7 and 0.9 W/m2K.
Insulation
Either a polystyrene hard foam in sulation or mineral fiber insulation have been used—depending on the applicable fire safety regula tions— each from the heat con ductivity class 035. The thickness ranges from 80 to 140 mm.
Figure 8.10.
Old obsolete single pipe system has been replaced by an ener gy-efficient two-pipe plant, set for heating temperatures from 70° to 55° C.
Heating system
The lines and distribution system have been insulated in accordance with the EnEV.Installation of new low-loss systems for heat supply and the replacement of radiators.
Figure 8.11.
Old building windows (U value: on average 2.7 W/m2K) are dou ble-glazed but not with insulation glazing. The window frames are usually wood and with some exceptions metal.
Windows (Diagrams based on information from GESOBAU AG, 2018)
All the windows that had not yet been upgraded have been re placed by double-glazed insulated, plastic frame windows with a K-value of at least 1.4 W/m2K and minimum sound insulation of 37 dB (B4–9A–3 class).
88 Mass Housing
Figure 8.12.
Outcome:
Following the eight year renovation project, CO2 emissions were reportably down 75 % and rent levels were slightly increased, albeit with a potential for the tenants to further decrease the gross rent through conservative energy consuming habits.
The renovations aimed to be a balance between ecological (Figure 8.12 & 8.13) and economic improvements and this was largely successful. In comparison to the rest of Berlin and to purpose built ecological projects however, annual energy consumption is still relatively high.


This is a compromise as bringing all properties to a Passive house standard, for example, would be an excessive cost causing a further rent increase.
Figure 8.13.
89
Märkisches Viertel
Landscape renovation in Märkisches Viertel (Diagram based on information from GESOBAU AG and SWUP, 2020)
Landscape in Märkisches Viertel (Photos taken by GESOBAU AG, 2021)
beforeCurrentcustomer renovation afterCurrentcustomer renovation Newcustomer
Conclusion
From the site’s tumultuous construction in a divided city, to its credibility as an example of retrofit in the age of the anthropocene, Märkisches Viertel consistently has provided great interest. The perception of the area and its architecture has changed greatly, and there are several lessons to be learnt here. While we can question the original urban plan, its density and sometimes excessive scale; the longevity of the buildings in comparison to other mass housing speaks volumes. Nearly 50 years after its construction, Märkisches Viertel is an popular and successful neighbourhood.
Figure 8.14.
beforeCurrentcustomer renovation afterCurrentcustomer renovation Newcustomer
Figure 8.15.
Was the renovation successful?
beforeMarkischesViertelrenovationMarkischesViertel afterrenovation BerlinaverageGermanyPassivehousein

Year
beforeMarkischesViertelrenovationMarkischesViertel afterrenovation BerlinaverageGermanyPassivehousein afterCurrentcustomer renovation Newcustomer
As shown in this case study, pre - 2008 ecological conditions in Märkisches Viertel were bad. Poor constuction quality had a negative impact on living conditions. Thus, any improvement or update would generate a significant advancement in sustainability.
However following this, Märkisches Viertel has only been brought in line with the Berlin average for annual energy consumption. Furthermore this figure is still three times that of Passive house standard. Perhaps the suggestion that the area is the largest low energy neighbourhood in Germany, is simply greenwashing.
The increase in rent will undoubtedly pay for the renovation, but following this there is only profit for GESOBAU. Despite some of the most unstable years in recent history, the company is still boasting outstanding profits of near €300 million. (Figure 8.15)
GESOBAU’s own report negatively labels the areas inhabitants as working class, and admits that they aim to increase the middle class population of the area. While the renovation is a definite improvement in sustainability, some may view the effort as gentrification.
90 Mass Housing
2.00 3.00 4.00 5.00 6.00 7.00 8.00 9.00 10.00 0.00
/ m 2 ) RENT BILLS TOTAL RENT BILLS TOTAL RENT BILLS TOTAL Under 5 5-9 10-14 15-19 20-24 25-29 35-39 40-44 45-49 50-54 55-59 60-64 70-74 75-79 80-84 Over 85 0 100 200 300 400 500 600 700 800 900 1000 Female Male 100 200 300 400 500 600 700 800 900 1000 €300M €350M €400M €450M €500M annual revenue 20 40 60 80 100 120 140 160 180 200 0
1.00
Rent (EUR
Annual energy consumption (kWh/m 2 )
RENT BILLS TOTAL RENT BILLS TOTAL 5 Male 100 200 300 400 500 600 700 800 900 1000 20 40 60 80 100 120 140 160 180 200 0
Annual energy consumption (kWh/m 2 )
Over 85 800 900 1000 2014 €300M €250M €200M €150M €100M €50M €0M €350M €400M €450M €500M
2015 2016 2017 2018 2019 2020 2021
GESOBAU annual revenue
Model of Dannenwalder Weg 172 (Diagram based on information from GESOBAU AG, 1969)
Data of Märkisches Viertel (Diagram based on information from GESOBAU AG, 2020 and Northdata.com, 2022)
3260m 3
Figure 8.16.
3510m 3
Primary concrete walls
Material breakdown of Dannenwalder Weg 172
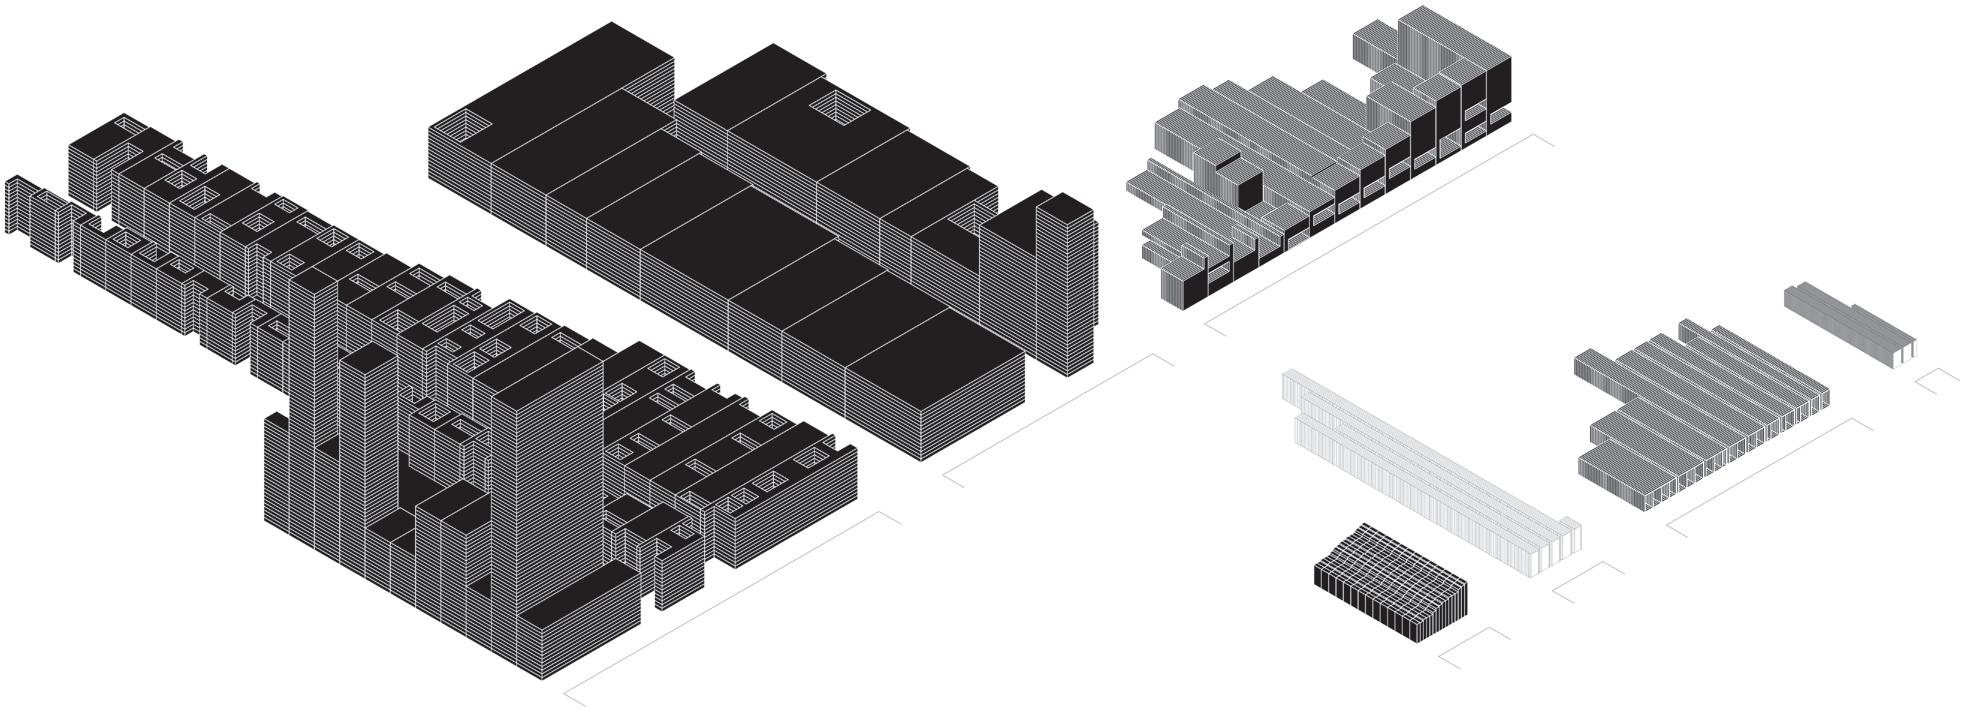
(Figure 8.14 & 8.16)
Material: - Primary concrete walls - Floor slabs - Ballastrades - Roofing - Internal walls - Doors - Window frames - Glass
The future?
Potential: Broken into a workable size and re-used as loadbearing concrete blocks
Bitumen sheet can be remanufactured into asphalt for roads
Plasterboard can be recycled or used as argicultural soil Timber can be reused Questionable recycling of uPVC Melted down and recycled again into glass
The current demand for housing in Berlin is perhaps greater than ever. Municipalities need to act against this, not only in terms of finance, but in architecture. The large scale renovation of Markisches Viertel prolonged the life of several buildings. But not indefinitely. When the building reaches the end of its lifecycle, what happens? (Figure 8.17)
We think the industrialized construction, the large scale and surrounding industry (Figure 8.18) mean Markisches Viertel has high potential. In response to the titular provocation, we can ask where can to source the next generation of non-extractive materials? Mass housing.
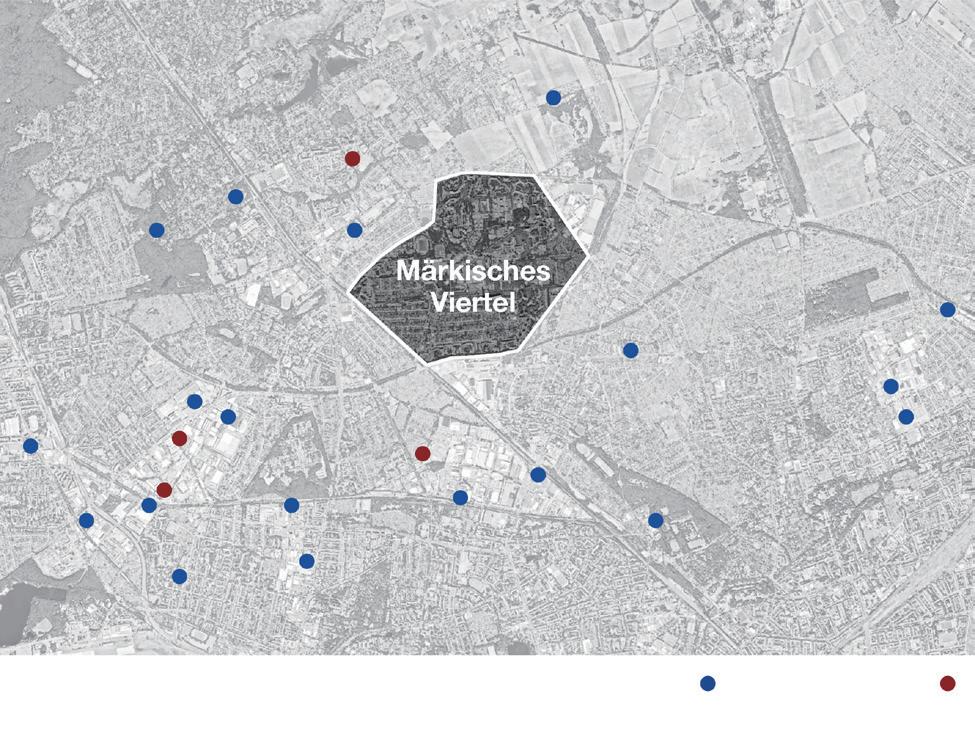
Floor slabs and roofing
Internal walls 675m 3 Ballastrades 100m 3
938 doors 90m 3
35m 3
728 window frames
25m 3
1316 panes of glass
Elements breakdown of Dannenwalder Weg 172 (Diagram based on information from GESOBAU AG, 1969)
Life cycle of building materials (Diagram based on information from Tapani Jokinen, 2017)
The key to the diagram of circular economy is to keep as close to the centre as possible, to maintain and prolong the life of the initial product. However it is important to acknowledge that this isn’t always possible, and to see solutions in terms of reuse and recycling.

Recyling factories Building material factories
Figure 8.18.
Figure 8.17. Surrounding industries (Diagram based on information from Google Map, 2022)
91 Märkisches
Viertel
Potential
Bibliography
Norra Kvarngärdet, Uppsala
1. Anker Gate Lindegren.” Architekter SAR- Monografier.” Stock holm: K L Beckmans Tryckerier AB, 1971.
2. ArkDes. “DigitaltMuseum.” Accessed October 3, 2022. https://digitaltmuseum.se/search/?q=stig+ancker&aq=own er%3F%3A%22S-ARK%22.
3. Boverket. “Sök och hämta energideklaration.” Accessed October 20, 2022. https://www.boverket.se/sv/energideklaration/ sok-energideklaration/.
4. Bergold, Carl E.”Uppsala Stadsbyggande 1900 - 1960.” Uppsa la Stads Historia, 6,9. Uppsala: Almqvist & Wiksell, 1989.
5.‘Detaljplan För Norra Kvarngärdet, Uppsala Kommun’, n.d.
6. Enköpings-Posten. “En Tredjedel i Riskzonen.” Accessed Oc tober 20, 2022. https://eposten.se/nyheter/uppsala/en-tredjedel-iriskzonen-unt4520819.aspx.
7. Eniro. “Kartor, Vägbeskrivningar, Flygfoton, Sjökort & Mycket Mer På Eniro.Se.” Accessed October 19, 2022. https://kartor. eniro.se/?c=59.869829,17.649128&z=16&l=aerial&q=%22kvar ng%C3%A4rdet,%20uppsala%22;geo&som=0.
8. Fil. dr Anna, Vikstrand. Norra Kvarngärdet En Arkitekturhistorisk Analys Och Värdering Av Ett Bostadsområde Statt i Förändring. Uppsala: Upplandsmuseet, 2009.
9. Fastighetstidningen. “Hovrätten Fastställer Hyreshöjning På Upp till 60 Procent.” Accessed October 20, 2022. https://fastighet stidningen.se/hovratten-faststaller-hyreshojning-pa-upp-till-60procent/.
10. Hitta. “Kvarngärdet Karta.” Accessed September 29, 2022. https://www.hitta.se/kartan/pl/Kvarng%C3%A4rdet%20 /2000952118!~59.86848,17.65833,14.244028914954198z/ tr!i=h8VNrpUz/tileLayer!l=1/lifestyle!l=59.86848:17.65833/geo code!l=59.87252:17.64441.
11. Lambert, Lars, ed. Uppsalas Arkitekter Och Arkitekternas Uppsala: Fran Domkyrkan till Ångströmlaboratoriet. Uppsala: Kornhuset, 2002.
12. Lantmäteriet. “Självservice.” Accessed October 3, 2022. https://www.lantmateriet.se/sjalvservice/.
13. Lundgren, Per. Ny Bebyggelse Vid Kvarntorget Kulturhistorisk Utred- Ning Av Kvarngärdet 30:1, Kv. Kvarnen, Uppsala Stad Och Kommun. Uppsala: Upplandsmuseet, 2023.
14. Rikshem. “Uppsala Kvarngärdet.” Accessed October 3, 2022. https://www.rikshem.se/om-oss/vara-fastigheter/uppsala/kvarn gardet/.
15. Svenssons Nyheter. “De 15 Familjerna.” Accessed October 20, 2022. https://15familjer.zaramis.se/2018/01/23/anders-diosoch-anders-zorn/.
16. S:T Eriks. “S:t Eriks historia ska vi vårda.” Accessed October 20, 2022. https://steriks.se/om-st-eriks/historik/.
17. SVT Nyheter. “Chockhöjda Hyror På Norra Kvarngärdet.” Accessed October 20, 2022. https://www.svt.se/nyheter/lokalt/ uppsala/chockhojda-hyror-pa-norra-kvarngardet.
18. Stadt Eupen. “Das Innovative Bauprojekt „Neue Höfe Dür wiß“.” Accessed October 9, 2022. https://www.eupen.be/das-inno vative-bauprojekt-neue-hoefe-duerwiss/.
19. Stena Fastigheter. “Hittade 17 träff(ar) för “norra kvarngär det”.” Accessed October 3, 2022. https://www.stenafastigheter.se/ sok/?q=norra+kvarng%C3%A4rdet.
20. Sundquist, Nils, and Axel Stigenberg. Byggnadsfirman Anders Diös : 30 År Som Byggmästare i Uppsala 1925-55. Uppsala: Almqvist & Wiksell, 1956.
21. Svevia. “Uppsala.” Accessed October 20, 2022. https://www. svevia.se/vart-erbjudande/grus-och-kross/krossanlaggningar/ uppsala.
22. Uppsala Vatten. “Hovgårdens Avfallsanläggning.” Accessed October 20, 2022. https://www.uppsalavatten.se/foretag/av fall-och-atervinning/hovgardens-avfallsanlaggning.
23. Uppsala Bostadsförmedling. “Råbyvägen 21.” Accessed October 20, 2022. https://www.bostad.uppsala.se/mypages/app/ visa/200010474945.
24. Öhrt, Weronica. ‘Uppdrag Om Genomsnittshyra i Uppsala’.
Uppsala, 4 March 2021. https://www.uppsala.se/contentas sets/9e3e06979d044a99ae6b22cb0979c433/11-amn-up pdrag-genomsnittshyra-uppsala.pdf.
FIGURES
Figure 1.1 Upplands Betong, original title “Upplands Betong i stadsdelen Boländerna, Uppsala”; https://digitaltmuseum.se/011013952398/upplands-beto ng-i-stadsdelen-bolanderna-uppsala.
Figure 1.2 Historical building material suppliers, Aerial photo from 1975; https://www.lantmateriet.se/sjalvservice/.
Figure 1.3 1960s, section west/ east, Illustration based by Jolirak 2013-08-23, https://bygg.uppsala.se/globalassets/uppsala-vaxer/ dokument/stadsplanering--utveckling/detaljplanering/antagna-de taljplaner/norra-kvarngardet/planhandling-norra-kvarngardet.pdf.
Figure 1.4, 1.16 Present, section section west/ east, Illustra tion based by Jolirak 2013-08-23, https://bygg.uppsala.se/glo balassets/uppsala-vaxer/dokument/stadsplanering--utveckling/ detaljplanering/antagna-detaljplaner/norra-kvarngardet/planhan dling-norra-kvarngardet.pdf.
Figure 1.5 Photo from site, 2022 looking at the new higher neigh bourhood, photo by Katharina Bitschnau.
Figure 1.6 Revit model based on; AGL Arkitekter plans from Archive.
Figure 1.7 Nybygge på Kvarngärdet; Photo by Uppsala-bild 1963, https://digitaltmuseum.se/021018564042/nybygge-pa-kvarngar det-uppsala-1963.
Figure 1.8 Detail based on; AGL Arkitekter plans from Archive
Figure 1.9 Revit model based on; observations.
Figure 1.10 Construction process, 2017 Street View from Google Maps, https://www.google.com/maps/@59.8710923,17.648912,3 a,75y,64.9h,96.52t/data=!3m7!1e1!3m5!1sq38LlTc8d35dPRRQA w7z0A!2e0!5s20170701T000000!7i13312!8i6656.
Figure 1.11 Detail based on; observations.
Figure 1.12 CAD drawings based on; AGL Arkitekter plans from Archive and Aerial information from Eniro.se, https://www.eniro. se.
Figure 1.13, 1.15 Rent in SEK per m2 / year, Diagram information based on; Fastighetstidningen and Uppsala Kommun, https:// fastighetstidningen.se/hovratten-faststaller-hyreshojning-pa-upptill-60-procent/.
Figure 1.14 CAD drawings based on; Uppsala Bostadsförmedling, https://www.bostad.uppsala.se/mypages/app/visa/200010474945.
Figure 1.17 Diagram based on; Kate Raworth’s Doughnut Eco nomics, https://www.kateraworth.com.
Figure 1.18 Photo from site, 2022: Courtyards of the 1960s hous ing, photo by Katharina Bitschnau.
Figure 1.19 Diagram based on; Kate Raworth’s Doughnut Eco nomics, https://www.kateraworth.com.
Figure 1.20 Photo from site, 2022: comparing the two neighbour hood, photo by Katharina Bitschnau.
Karl Marx Hof, Vienna
1. Antalovsky, Dr. Eugen, and Jana Löw. 2019.” Why Vienna gets high marks.” Report, UIV Urban Innovation, Vienna GmbH, Vienna: European Investment Bank.
2. Bittner, Josef. 1930.”Neubauten der Stadt Wien : 2. Neubauten der Stadt Wien.” Pamphlet, Vienna/New York: Wien, Gerlach & Wiedling.
3. Blau, Eve. 2018.”The Architecture of Red Vienna, 1919-1934.“Vienna: MIT Press. Caldenby, Claes. 1986. “Alien ation och Kreativitet.” Arkitektur 3: 18-19.
4. Caldenby, Claes. 1986. “En Wienguide.” Arkitektur 3: 30-32.
5. Caldenby, Claes. 1986. “Wien genom tre.” Arkitektur 3: 4-9.
6. Cheal, Marc. 2017. “Marc Cheal - MArch Thesis - Speculations 1.” Issuu. June 25. Accessed 09 20, 2022. https://issuu.com/ mchizz/docs/marc_cheal_-_pt3_-_speculations_1_-.
7. Chicharro, Dámaso, Jose Moreno, Aridane Sánchez Garcia, Antonio Serrano, Richardo Velasco, and María Zurita. Karl-Marx
93 Bibliography
Hof, trabajo de investigación. Student work, ?: doyoucity.com.
8. City of Vienna. 2022. Social Housing Wien. 09 20. Accessed 09 20, 2022. https://socialhousing.wien.
—. 2022. Wiener Wohnen. 09 20. Accessed 09 20, 2022. https:// www.wienerwohnen.at.
9. Czech, Hermann. 1986. “Ett sätt att förstå Josef Frank idag.” Arkitektur 3: 28-29. Economist Intelligence. 2019. The Global Liveability Index 2019. Report, London: The Economist Intelli gence Unit Limited.
10. Economist Intelligence. 2022.”The Global Liveability Index 2022.” Report, London: The Economist Intelligence Unit Limited.
11. Eriksson, Eva. 1986. “Från Wagner till Loos.” Arkitektur 3: 20-25.
12. Friesenecker, Michael, and Yuri Kazepov. 2021. “Housing Vi enna: The Socio-Spatial Effects of Inclusionary and Exclusionary Mechanisms of Housing Provision.” Social Inclusion (Cogitatio) 9 (2): 77-90.
13. Gundacker, Hans. 1950. “Bostadsbyggandets utveckling i Wien.” Byggmästaren 157-160.
14. Hallermar, Dan, and Håkan Forsell. 2014. #18 Staden Wien. Cond. Sveriges Arkitekter. Comps. Dan Hallermar and Håkan Forsell. Podcast. Hidden Architecture. 2017. Red Vienna (I): Karl Marx Hof. 07 18. Accessed 09 20, 2022. https://hiddenarchitec ture.net/red-vienna-i-karl-marx-hof/.
15. Luke Jones, George Gingell. “About Buildings + Cities.” Apple Podcasts, December 22, 2019.
16. Kalfaoglu Hatipoglu, Hatice. 2020. “UNDERSTANDING POST-WAR SOCIAL HOUSING STRATEGIES OF VIENNA: A REFERENCE FOR THE REPRODUCTION OF CURRENT CITIES?” In Theory and Research in Architecture, Planning and Design, by Sibel Demirarslan, 201-220. Ankara: Gece Publishing. 17. Lingdahl, Göran. 1986. “1800-talets Wien, Ringstrasse och det offentliga samtalet.” Arkitektur 3: 12-17.
18. Mossberg, Robert. 1925. “Hur Wien söker lösa Bostadsprob lemet.” Byggmästaren 272-276. OECD. 2020. Social housing: A key part of past and future housing policy”, Employment, Labour and Social Affairs Policy Brief. Brief, Paris: OECD.
19. Official Statistics of Sweden. 2021. Number of dwellings by type of ownership and year. Accessed 10 14, 2022. https:// www.statistikdatabasen.scb.se/pxweb/en/ssd/START__BO__ BO0104__BO0104D/BO0104T03/table/tableViewLayout1/.
20. Pelling, Lisa. 2019. Wienmodellen, Inspiration till en ny social bostadspolitik. Study, Stockholm: Areena Idé.
21. Rob McFarland, Georg Spitaler, Ingo Zechner. 2020. The Red Vienna Sourcebook. Vienna: Boydell & Brewer.
22. Seidl, Christian. 1994. “The Bauer-Schumpeter controversy on socialization.” History of Economic Ideas (Accademia Editori ale) 2 (2): 41-69.
23. Statistik Austria. 2022. WOHNEN Zahlen, Daten und Ind ikatoren der Wohnstatistik. Statistical research, Vienna: Verlag Österreich GmbH.
24. Tenghoff, Britt-Marie. 1986. “Det Röda Wien.” Arkitektur 3: 2627. Verwiebe, Dr.Roland, and Bernd Liedl. 2020. Lebensqualität in einer wachsenden Stadt. Study, Vienna: Institut für soziologie, Univresität Wien.
25. ViennaGIS. 2022. Flächenwidmungs- und Bebauungsplan. Prod. Stadt Wien. Vienna.
26.Wulz, Fredrik. 1986. “Stadsbyggnadshistoria.” Arkitektur 10-11. 27. Wulz, Fritz. 1979. Wien, En arkitekturpolitiskl studie av en stad i förändring. Uddevalla: Svensk Byggtjänst, Almquist & Wik sell International.
FIGURES
Figure 2.1 Fremdenverkehrskommission det Bundesländer Wien und Niederösterriech, 1932 Das Neue Wien: Ein Album mit Plan, Wien: Elbemühl 2022, https://www.digital.wienbibliothek. at/wbrobv/content/titleinfo/2580745?query=neue%20Wien%20 album%20plan.
Figure 2.2 Seidl, Christian. 1994. ”The Bauer-Schumpeter con troversy on socialization.” History of Economic Ideas (Accademia
Editorial) 2 (2): 41-69.
Figure 2.3 Fremdenverkehrskommission det Bundesländer Wien und Niederösterriech, 1932 Das Neue Wien: Ein Album mit Plan, Wien: Elbemühl 2022, https://www.digital.wienbibliothek. at/wbrobv/content/titleinfo/2580745?query=neue%20Wien%20 album%20plan.
Figure 2.4 Blau, Eve. The Architecture of Red Vienna, 1919-1934. Cambridge, Mass: The MIT Press, 1999.
Figure 2.5-2.11 Drawing material provided by the City of Vienna, Stadt Wien / Wiener Wohnen. Digitaized by author.
Figure 2.12 Open Street Map, produced by author https://www.openstreetmap.org/.
Figure 2.13, 2.14 Diagrams produced by author.
Figure 2.15 Wulz, Fredrik F. Wien 1848-1934 : en arkitektur politisk studie av en stad i förändring. Stockholm: Byggforsknings rådet, 1979.
Figure 2.16 Fremdenverkehrskommission det Bundesländer Wien und Niederösterriech, 1932 Das Neue Wien: Ein Album mit Plan, Wien: Elbemühl 2022, https://www.digital.wienbibliothek. at/wbrobv/content/titleinfo/2580745?query=neue%20Wien%20 album%20plan.
Figure 2.17-2.20 Wulz, Fredrik F. Wien 1848-1934: en arkitektur politisk studie av en stad i förändring. Stockholm: Byggforsknings rådet, 1979.
Figure 2.21 Geschichtewiki.Bildungsgrad und Berufsgliederung 1869-2001. Accessed Sept-Oct,2022. https://www.geschichtewiki. wien.gv.at/Bildungsgrad_und_Berufsgliederung_1869-2001.
Figure 2.22 Europa.Waste prevention and management. Ac cessed Sept-Oct,2022. https://ec.europa.eu/environment/greengrowth/waste-prevention-and-management/index_en.htm.
Figure 2.23-2.26 City of Vienna – Wiener Wohnen, Municipal Housing in Vienna. History, facts & figures, Domus Verlag, 2018 htt https://www.wienerwohnen.at/dms/workspace/SpacesS tore/6e498f59-7962-48ee-ba88-0f9ed9ce7b10/WW10720-Wie ner-Gemeindebau-WEB-english.pdf.
Vollsmose, Odense, Denmark
1. Buconjic, Paola. “Marginalised by Denmark’s “Ghetto” Laws.” Thesis., Aalborg Universitet, 31 May, 2021. https://projekter.aau. dk/projekter/files/414942603/Master_s_Thesis_Paola_Buconjic. pdf.
2. Charlotte, L, Eberhardt, M, and Birgisdottir, H. “Building the future using the existing building stock: the environmental potential of reuse.” IOP Conf. Series: Earth and Environmental Science. 2022. doi:10.1088/1755-1315/1078/1/012020. https:// iopscience.iop.org/article/10.1088/1755-1315/1078/1/012020/pdf.
3. David Gaarsdal Rønnov, Anton Ahnfelt-Rønne. “Transforming the “Ghetto” – Strategic Planning in Distressed Social Housing Estates.” Master’s Thesis, Aalborg University Copenhagen, 2018. https://projekter.aau.dk/projekter/files/281247685/Final_thesis.pdf.
4. Forest, Andreas. “Vollsmose.” First published April 1, 2021. https://trap.lex.dk/Vollsmose.
5. Funen Almennyttige Boligselskab (FAB). “Birkeparkenhuslejeberegning.” Last modified September 6, 2022. https:// fabbo.dk/wp-content/uploads/Birkeparken-huslejeberegni ng-2021-2022-08.06.2022.pdf.
6. Funen Almennyttige Boligselskab (FAB). “Birkeparkenprojektmappe.” Last modified December, 2021. https://fabbo.dk/ wp-content/uploads/Birkeparken-projektmappe.pdf.
7. Larsen, Kim, and Rohleder, Niels. “A people-friendly district.” Last modified October 9, 1999. https://www.information. dk/1999/10/menneskevenlig-bydel.
8. Ministry of the Interior and Housing. Ét Danmark uden parallelsamfund: Ingen ghettoer i 2030. Danmark: Regeringen, 2018. https://www.regeringen.dk/aktuelt/publikationer-ogaftaletekster/%C3%A9t-danmark-uden-parallelsamfund/. 9. Rønnov, David Gaarsdal, and Ahnfelt-Rønne, Anton. “Transforming the “Ghetto” – Strategic Planning in Distressed
94 Mass Housing
Social Housing Estates.” Masters Thesis, Aalborg University Copenhagen. 2018. https://projekter.aau.dk/projekter/ files/281247685/Final_thesis.pdf.
10. United Nations. “UN human rights experts urge Denmark to halt contentious sale of “ghetto” buildings”. Last modified October 23, 2020. https://www.ohchr.org/en/press-releases/2020/10/unhuman-rights-experts-urge-denmark-halt-contentious-sale-ghettobuildings.
11. Mia Arp Fallov,Department of Sociology,Lancaster University,Danish Urban Policy as Capacity-Building: Reproducing boundaries of exclusion? Paper to be presented at “Transformations, Boundaries and Dialogues” the 22nd Nordic Sociology Congress, Malmö 20-22 August 2004.
12. MARGINALISED BY DENMARK’S ”GHETTO” LAWS MASTER’S THESIS Paola Buconjic ,Culture, Communication and Globalisation, The Faculty of Humanities 31.05.2021.
13. L Charlotte et al 2022 IOP Conf. Ser.: Earth Environ. Sci. 1078 012020.
FIGURES
Figure 3.1 Multiple sources referenced.
Figure 3.2 Civica, FAB, and Odense Municipality. Udviklingsplan Fremtidens Vollsmose. May 29, 2019. https:// www.fremtidensvollsmose.dk/wp-content/uploads/2020/04/ Udviklingsplan-Fremtidens-Vollsmose-20190529_web.pdf.
Figure 3.3-3.5 Heunicke, Nichlas Moos, Gimmel, Kathrin Susanna, Poulsgård, Kåre Stockholm, Udbye, Katja, Smith, Katrine Hauge, Dalvang, Lene, Haukhol, Jens, and Eberhardt, Leonora. Ressource Blokken: Upcycling af 60’erne og 70’ernes almene byggeri. Danmark: JAJA Architects, March 2021. https:// jaja.archi/wp-content/uploads/2021/04/Ressource_Blokken_-_ Idekatalog.pdf.
Figure 3.6 Fyens Stiftstidende’s press photographers. Moved into Vollsmose, March 1969. 1969. Photograph. Odense City Archives, arkiv.dk. https://arkiv.dk/vis/5044607.
Figure 3.7 Baker, Fiona Lawson, com., Bezares, Daniel, dir., and Ali, Filson, prod. Am I Danish?: Ibrahim vs the Ghetto Laws. Com. by Al Jazeera Media Network. TV-Documentary, 25 min. Nov 29, 2019. https://www.aljazeera.com/program/witness/2021/11/29/ami-danish-ibrahim-vs-the-ghetto-laws.
Figure 3.8 Ringkjøbing, Erik. Vollsmose - a district in transformation. 2022. Photograph. Odense City Archives, arkiv.dk. https://arkiv.dk/vis/6404160.
Figure 3.9 Wedell, Flemming. Vollsmose 2022 - a district in transformation. 2022. Odense City Archives, arkiv.dk. https://arkiv. dk/vis/6404167.
Figure 3.10 Engberg, Lars A. “Social housing in Denmark.” Research Papers from the Department of Social Sciences: Research Paper no. 6/00. Roskilde University, Denmark. January 2000. https://www.researchgate.net/publication/277037231_ Social_housing_in_Denmark.
Figure 3.11 Funen Almennyttige Boligselskab (FAB). “Lejlighedskatalog-Birkeparken.” January, 2021. https://fabbo.dk/ wp-content/uploads/Lejlighedskatalog-Birkeparken.pdf.
Figure 3.12 Funen Almennyttige Boligselskab (FAB). ‘Birkeparken - What will happen?’. Last modified, 2022. https://fabbo.dk/ birkeparken_helhedsplan/#omdannelse-og-nedrivning.
Figure 3.13-3.22 Ressource Blokken Publiceret Marts 2021 Den publikation er udarbejdet med støtte fra Realdania,Upcycling af 60’erne og 70’ernes almene byggeri.
Figure 3.23 Konkurrenceforslag. “Bydelsplan for Fremtidens Vollsmose.” Last modified April 22, 2022. https://www. fremtidensvollsmose.dk/wp-content/uploads/2022/06/Forslag-tilbydelsplan-for-fremtidens-Vollsmose.pdf.
Vällingby, Stockholm
1. Albert Aronson. “Elementbyggeri.” Byggmästaren 1958, B 5: 115-116.
2. Boverket. “Energideklaration, Lövångersgatan 22.” Last modi
fied July 24, 2020. https://brfatlantis.se/om-foreningen/.
3. Brf Atlantis. “Årsredovisning 2017.” Last modified April 27, 2018. https://brfatlantis.se/om-foreningen/.
4. Brf Atlantis. Brf Atlantis (Stockholm: Brf Atlantis). 2005. 3-15.
5. Claes Caldenby. “Sweden: in between Co-housing and Public Housing” in Contemporary Co-housing in Europe, edited by Per nilla Hagbert, (Routledge, New York, 2022), 38-57.
6. Gun Hallberg and Alice Thiberg. “Respect Basic Require ments”, in Housing Research and Design in Sweden, edited by Sven Thiberg, trans,Madi Gray, (Swedish Council for Building Research, Stockholm, 1990), 142-201.
7. Hemnet. “Lövängersgatan 23.” https://www.hemnet.se/bostad/ radhus-7rum-vallingbyhojden-stockholms-kommun-lovangersga tan-23-19026477.
8. Ian R. Cook. “Showcasing Vällingby to the World: Post-war Suburban Development, Informational Infrastructures, and the Extrospective City”, Planning Perspectives, 33:3 (2018): 315-333.
9. Ian R. Cook. “ Suburban Policy Mobilities: Examining North American Post-war Engagements with Vällingby, Stockholm”, Geografiska Annaler: Series B, Human Geography, 100: 4 (2018): 343-358.
10. Ingemar Nyquist. “Elementbyggda Flerfamiljshus - 9 metoder”, Byggmästaren 1956, B 5: 85-104.
11.International New Town Institute. “Lab#4 | Vällingby - Adapting the Welfare State Model to Present Needs - The ABC-Town in Transition”, New Towns Arrival Cities, May, 2019.
12. Jon Höjer and Sture Ljungqvist. “Radhus i Vällingby,” Bygg mästaren 1956, A 12: 239-242.
13. Karl Tham. “Något om bostadskostnaden för enfamiljs bostäder”, Byggmästaren 1958, A 12: 114-115.
14. Lucy Creagh. “From acceptera to Vällingby: The Discourse on Individuality and Community in Sweden (1931-54)”, The Europe an Welfare State Project: Ideals, Politics, Cities and Buildings, vol. 5/2 (Autumn 2011) : 5-24.
15. Pass David. Vällingby and Farsta - from Idea to Reality : the Suburban Development Process in a Large Swedish City (Stock holm: Statens inst. f. byggnadsforskning, 1969), 105-163.
16.Stockholms stad. “Parkplan i Hässelby Vällingby – Beskrivning av parker.” https://start.stockholm/om-stockholms-stad/sa-ar betar-staden/natur-parker-och-gronomraden/.
17. Sten Albrektsson. “Byggnadsstommen.” Byggmästaren 1959, nr 6: 117-122.
18. Stockholms stad. “Construction Matters of Atlantis.” https:/ /etjanst.stockholm.se/Byggochplantjansten/arenden?is Search=True&exactSearch=false&propertyAddress=L%C3%B 6v%C3%A5ngersgatan%20&activeCases=true&archivedCas es=true&p=0.
19. Stockholm Stad. “Statistisk Årsbok för Stockholm 2022.” Last modified December, 2021.https://start.stockholm/globalassets/ start/om-stockholms-stad/utredningar-statistik-och-fakta/statistik/ arsbok/statistisk-arsbok-for-stockholm-2022.pdf.
20. Svenska Bostäder. “09 Ombildning Silvret 2.” Last modified September 3, 2020. https://insynsverige.se/documentHandler. ashx?did=1989494.
21. Svenska Bostäder. “Hållbarhets- och Årsredovsning 2021.” Last modified 2021. https://www.svenskabostader.se/ globalassets/om-oss/vart-hallbarhetsarbete/svenska_bostad er_h-ar_2021_tillganglighetsanpassad.pdf.
22. Svenska Bostäder. Vällingby (Stockholm: Svenska bostäder, 1966), 3-25.
23. Svenska bostäder. Vällingby, Grimsta: att Vårda och Utveckla ett 1950-Talsområde (Svenska bostäder, 2003, Stockholm), 1415, 18-35.
24. Torsten Ljungberger, J Lechner, Carl Knutsson, A Tengelin, Börge Algers, Åke Grauers, J H Martin, Sigurd Vikander, Anders Cronström, E David Svensson, Bengt M Nilsson, Harald Gustavs son and Arne T Bergqvist. “Exploateringen av Södra Spånga,” Byggmästaren 1953 B 4: 85-86.
95 Bibliography
FIGURES
Figure 4.1 Stockholms stad. “Facts of Sub-urban Area ”.
Figure 4.2 Svenska Bostäder. Vällingby (Stockholm: Svenska bostäder, 1966), 3-25.
Figure 4.3 Ingemar Nyquist. “Elementbyggda Flerfamiljshus - 9 metoder,” Byggmästaren 1956, B 5: 85-104.
Figure 4.4 Stockholms stad. “Construction Matters of Atlantis”, https://etjanst.stockholm.se/Byggochplantjansten/arenden?is Search=True&exactSearch=false&propertyAddress=L%C3%B 6v%C3%A5ngersgatan%20&activeCases=true&archivedCas es=true&p=0.
Figure 4.5 Stockholms stad. “Facts of Sub-urban Area ” https:// start.stockholm/om-stockholms-stad/utredningar-statistik-och-fak ta/statistik/omradesfakta/.
Figure 4.6 Stockholms stad. “Dataportalen.” https://dataportalen. stockholm.se/dataportalen/.
Figure 4.7 Stockholms stad. ”Compare Maps.” https://stockhol mskallan.stockholm.se/skola/lektioner/jamfor-kartor-gymnasiet/.
Figure 4.8 Ingemar Nyquist. “Elementbyggda Flerfamiljshus - 9 metoder,” Byggmästaren 1956, B 5: 85-104.
Figure 4.9 Svenska Bostäder. “a Picture Story of Silvret 2.” https:// www.svenskabostader.se/var-historia/omraden/grimsta--experi mentomradet/.
Figure 4.10, 4.11 Hemnet. “Lövängersgatan 23.” https://www. hemnet.se/bostad/radhus-7rum-vallingbyhojden-stockholms-kom mun-lovangersgatan-23-19026477.
Figure 4.12 Ombildningskonsulten. “Ekonomisk Plan för Bostads rättsföreninggen Silvret 2.” Last modified March, 2021.
Figure 4.13 Stockholms stad. “Construction Matters of Atlantis.” https://etjanst.stockholm.se/Byggochplantjansten/arenden?is Search=True&exactSearch=false&propertyAddress=L%C3%B 6v%C3%A5ngersgatan%20&activeCases=true&archivedCas es=true&p=0.
Figure 4.14 Boverket. “Sök och hämta energideklaration.” https:// www.boverket.se/sv/energideklaration/sok-energideklaration/.
Figure 4.15 Hitta. https://www.hitta.se/.
Figure 4.16 Hässelby-Vällingby Fastighetsägare. “Fas tighetsägare i Vällingby.” Last modified June, 2021. https://www. havafast.se/wp-content/uploads/2021/08/U_Fastighetsagarkar ta_Vallingby2021_L.pdf.
Figure 4.17 Stockholms stad. “Facts of Sub-urban Area.” https:// start.stockholm/om-stockholms-stad/utredningar-statistik-och-fak ta/statistik/omradesfakta/.
Figure 4.18 Cornucopia. “Bostadsrättspriser 1970 – 2014.” https:// cornucopia.se/2015/04/bostadsrattspriser-1970-2014/.
Figure 4.19 Stockholms stad. “Stockholm City Plan.” Last mod ified March, 2018. https://vaxer.stockholm/globalassets/tema/ oversiktplan-ny_light/english_stockholm_city_plan.pdf.
Gottsunda, Uppsala
1. Boverket. “Building process.” Last modified March 17, 2022. https://www.boverket.se/en/start/building-in-sweden/swedishmarket/laws-and-regulations/building-process/.
2. Building Sweden. “Permits and Processes.” Accessed September 30, 2022. https://www.buildingsweden.com/ permission-to-build.
3. Brick development association. “CLAY BRICK: END OF LIFE CYCLE.” Last modified August, 2020. https://www.brick.org.uk/ admin/resources/clay-brickwork-end-of-lifecycle-rev-b.pdf.
4. BostadsPorta. “housing rental price.” Accessed September 30, 2022. https://bostadsportal.se/en/rental-properties/all-cities/ all-rooms/?view=map&zoom=15¢er=17.620047751802872 %2C59.81205555510974&min_lat=59.80649837851078&min_ lng=17.60263485087785&max_lat=59.81761180532661&max_ lng=17.63746065272713.
5. Cecilia Björk, Per Kallstenius and Laila Reppen. “Så byggdes husen 1880-2020.” (Svensk Byggtjänst, 2021), 90-91.
6. Diva-portal. “Re-imagining the Million Programme.” https://
www.diva-portal.org/smash/get/diva2:1130343/FULLTEXT01.pdf.
7. Hitta. “Bandstolsvägen 22.” Last modified July 16, 2014. https://www.hitta.se/uppsala+l%C3%A4n/uppsala/ bandstolsv%C3%A4gen+22/omr%C3%A5de/59.81441:17.624561
8. Hitta. “Spinnrocksvägen 41.” Last modified Arpil 07, 2015, https://www.hitta.se/uppsala+l%C3%A4n/ uppsala/spinnrocksv%C3%A4gen+41/ omr%C3%A5de/59.81586993396574:17.62476629923502.
9. Hengdingcf. “the duration of c/c compound material-Carbon fiber processing.” http://hengdingcf.com/a/news/33/462.html.
10. Hus.se. “Byta tak - kostnad att göra själv.” Last modified April 13, 2021. https://www.hus.se/byta-tak/.
11. Insulationinstitute. “mineral wool board-environmental product declaration.” http://insulationinstitute.org/wp-content/ uploads/2016/03/NAIMA_min_wool_board_EPD.pdf.
12. Kostnadsguiden. “Badrumsrenovering, kostnad och tips.” Last modified October 6, 2011. https://kostnadsguiden.se/ badrumsrenovering-kostnad-och-tips/.
13. KTH Arkitektur och samhpällsbyggnad. “Renovering av miljonprogrammet.” Last modified June 19, 2012. http://www.divaportal.org/smash/get/diva2:548800/FULLTEXT01.pdf.
14. Leadme. “Totalrenovering – Kostnad per kvm.” Last modified September 26, 2020. https://leadme.se/news/totalrenoveringkostnad-per-kvm/.
15. Morneon. “BALKONGRENOVERING.” Last modified September 26, 2020. https://morneonfasad.se/tjanst/balkonger/.
16. Offerta. “Kostnad för fasadrenovering.” Last modified August 5, 2020. https://offerta.se/bygg-och-renovering/fasadrenovering/ kostnad-for-fasadrenovering/.
17. Radea. “Blåbetong – vad är det?” Last modified February 10, 2015. https://radea.se/blog/2015/02/10/blabetong-vad-ar-det/.
18. Rentberry. “housing rental price.” Accessed September 30, 2022. https://rentberry.com/se/apartments/s/gottsunda-756-49uppsala-sweden?tl=59.8239693264981,17.59871270571187&br= 59.802196313773855,17.63810899172261&zoom=15.
19. Total pipeline systems. “HOW LONG DO PLASTIC PIPES LAST?” Accessed September 30, 2022. https://www.totalpipes. co.uk/blog/how-long-do-plastic-pipes-last.
20.Uppsalahem.”Stenhammars Väg 6.” Last modified Arpil 09, 2020, https://www.uppsalahem.se/bostader/vara-omraden/ blomdahls-vag-och-stenhammars-vag/.
21. United Nations Global Compact.”Social Sustainability.” Accessed September 10,2022. https://www.unglobalcompact.org/ what-is-gc/our-work/social.
22. Frida Gidlöf, Mollie Hasselberg, Isac Kylberg. “The New Pricing Model for District Heating: How it will affect Uppsalahem’s residential area August Södermans road.” Thesis, Uppsala University, 2015. https://uu.diva-portal.org/smash/get/ diva2:817756/FULLTEXT01.pdf.
23. Uppsala Kommun. “Plan description and plan map of South Valsätra.” Accessed September 29, 2022. https://www.uppsala. se/bygga-och-bo/samhallsbyggnad-och-planering/detaljplanerprogram-och-omradesbestammelser/hitta-detaljplaner-ochomradesbestammelser/1961-1970/sodra-valsatra/.
FIGURES
Figure 5.1 Uppsala Kommun. “Detailed plans and area regulations.” Accessed September 29, 2022. https://www.uppsala. se/bygga-och-bo/samhallsbyggnad-och-planering/detaljplanerprogram-och-omradesbestammelser/hitta-detaljplaner-och-omra desbestammelser/?diarienummer=&aktbeteckning=&optionId=& optionText=&optionLayerType=&ignoreserverside=all&tgle=arcgi smap-tab&page=&isAjax=false.
Figure 5.2, 5.3, 5.8, 5.9, Uppsala kommun. “Gottsundaområdet Planprogram 2019.” Last modified April, 2019. https://www. uppsala.se/contentassets/9f62a66e449042ae81ba39f9578d11d9/ planprogram-for-gottsundaomradet.pdf.
Figure 5.4, 5.5, 5.14-5.17 Uppsala kommun. “Gottsundaområdet Planprogram 2019.” Last modified April, 2019. https://www. uppsala.se/contentassets/9f62a66e449042ae81ba39f9578d11d9/
96 Mass Housing
planprogram-for-gottsundaomradet.pdf.
Figure 5.10 Uppsala Kommun, “The investor and architect involved in Gottsunda” Accessed September 29, 2022. Arkitekturguide-Gottsunda-och-Valsätra.pdf.
Figure 5.11 Uppsala Kommun, “The building analysis within Gottsunda” Accessed September 29, 2022. https://www.uppsala. se/bygga-och-bo/samhallsbyggnad-och-planering/lantmaterikartor-och-handlingar/bestall-ritningar-kartor-och-allmannahandlingar/bestall-ritningar-detaljplaner-och-handlingar/bestallritningar-och-allmanna-handlingar/.
Figure 5.12 Frida Gidlöf, Mollie Hasselberg, Isac Kylberg. “The New Pricing Model for District Heating: How it will affect Uppsalahem’s residential area August Södermans road.” Thesis, Uppsala University, 2015.https://uu.diva-portal.org/smash/get/ diva2:817756/FULLTEXT01.pdf.
Figure 5.13 Utsatta områden-sociala risker, kollektiv förmåga och oönskade händelser. Police in Sweden-Nationella Operativa Avdelningen, December 2015. Utsatta områden-Social ordning, kriminell struktur och utmaningar för polisen. Police in SwedenNationella operativa avdelningen-Underrättelseenheten, June 2017.
Bagarmossen, Stockholm
1. BoSthlm.”Sold apartment on Emågatan.”Accessed October 4, 2022. https://www.bosthlm.se/1482849/emagatan-28.
2. Björk, Cecilia & Reppen, Laila, Tidstypiskt: arkitekturdetaljer i flerbostadshus 1880-1980. Svensk byggtjänst: Stockholm, 2016.
3. Degerfeld Anna,Helena Kihlanki and Linnea Eklöf. “Kollektivförmåga i Bagarmossen.”Stockholm:Urban Utveckling,2020.
4. Deplazes, Andrea. Constructing architecture: materials, processes, structures: a handbook. Basel: Birkhäuser, 2005.
5. Emad Kasra Kermanshahi,Mohammad Hossein Zaeimbashi Isaabadi,Ehsan Harirchian. “Material Waste Reducion between IBS and Conventional Construction.” (University Technology Malaysia,2015) 2-5.
6. Emågatan. “Condominium association Emågatan-information.” Accessed September 29, 2022. https://www.emagatan.se/.
7. Femenías, Paula, Holmström, Cecilia, Jonsdotter, Lina, Thuvander, Liane. Arkitektur, materialflöden och klimatpåverkan i bostäder. Stockholm: Energimyndigheten, 2016. https://www. e2b2.se/library/2310/39703-1-slutrapport-2016_2-arktiekturmaterialfloeden-och-klimatpaaverkan-i-bostaeder.pdf.
8. Forsman, Peter. “Nätverk i Stockholm stoppar ombildning.” Last modified Febrary 6, 2020. https://www.hyresgastforeningen. se/fortroendevald/tidningen-hyresgasten2/arkiv-tidningenhyresgasten/2020/natverk-i-stockholm-stoppar-ombildning/.
9. Hallin, Anna, Schöllin, Erica. Stockholm: Stockholms Stadsmuseum, 2002. https://riksradsvagen.se/wp-content/ uploads/2018/12/Stadsmuseets-inventering.pdf.
10. Hall, Thomas, and Sonja Vidén. “The Million Homes Programme: A Review of the Great Swedish Planning Project.” Planning Perspectives 20 (July 2005): 301‒328.
11. Hemnet. “Final prices for terraced houses on Riksrådsvägen.” Accessed October 6, 2022. https://www.hemnet.se/salda/radhus/ stockholms-kommun/riksradsvagen.
12. Hemnet. “Sold apartment on Emågatan.” Accessed October 4,2022. https://www.hemnet.se/salda/lagenhet/stockholmskommun/emagatan.
13. Hemnet. “Sök bostad.” Accessed October 9, 2022. https:// www.hemnet.se/.
14. Naturskyddsföreningen. “Energirenovera miljonprogrammet.” Accessed September 30, 2022. https:// www.naturskyddsforeningen.se/artiklar/energirenoveramiljonprogrammet/.
15. Nordström, Christer. “Möjligheter för miljonprogrammet.” Stockholm: Svensk Byggtjänst, 1999.
16. Renoveringsraseriet. “Hyresgästerna som tagit strid
mot Svenska Bostäder.” Accessed October 4, 2020. https:// renoveringsraseriet.se/hyresgasternas-strid-mot-svenskabostader/.
17. Reppen, Laila, and Sonja Vidén. “Att underhålla bostadsdrömmen.” Stockholm: Formas, 2006.
18. SehedTresson. “Pictures before and after renovation of condominium Emågatan.” Accessed October 8,2022. https:// sehedtresson.se/fore-och-efterbilder-pa-brf-emagatansrenovering/.
19. Schönning, Klas. “Bagarmossen.” Stockholm: Stockholmshem, 1997.
20. Skatteverket. “Söka taxeringsvärde.” Accessed Oct 9, 2022. https://www7.skatteverket.se/portal/fastighet-sokataxeringsvarde/.
21. Spridd. “Byälvsvägen.” Accessed October 14, 2022. https:// www.spriddarchitecture.com/byalvsvagen.
22. Statistics on Bagarmossen. “Statistiska Centralbyrån.” https:// www.statistikdatabasen.scb.se/pxweb/sv/ssd/.
23. Stockholmshem. “Byälvsvägen, Bagarmossen.” Accessed October 17, 2022. https://www.stockholmshem.se/vi-bygger/vibygger-nytt/byalvsvagen-bagarmossen/.
24. Stockholm Stad. “Bygg och plantjänsten.” Accessed October 9, 2022. https://etjanst.stockholm.se/Byggochplantjansten/ arenden.
25. Stockholm Stad. “Områdesfakta Bagarmossen Stadsdel.” Acessed October 4, 2022. https://start.stockholm/globalassets/ start/om-stockholms-stad/utredningar-statistik-och-fakta/statistik/ omradesfakta/soderort/skarpnack/bagarmossen.pdf.
26. Stockholms stadsbyggnadskontor. Planbeskrivning: Detaljplan för del av fastigheterna Socialministern 1, Försvarsministern 1 och Handelsministern 1 vid Byälvsvägen i stadsdelen Bagarmossen. Stockholm: Stockholms stad, 2021.
27. Svenska Bostäder. “Ombildning till bostadsrätt.” Last modified May 20, 2019. https://www.svenskabostader.se/om-oss/pressoch-media/nyhetsarkiv/2019/maj/ombildning-till-bostadsratt/. 28. Svensk mäklarstatistik. “Bostadspriser i riket.” Accessed October 23, 2022. https://www.maklarstatistik.se/omrade/riket/. 29. The Government of Sweden. “Waste flows, treatment capacity and forecasts.” Accessed October 13, 2022. https://www.regeringen.se/ contentassetsc286a4ac8d8042a98266490bc13ddf7d/bilaga-2--avfallsfloden-behandlingskapacitet-och-prognoser.pdf.
30. The Swedish Environmental Protection Agency. “Renovation waste in Sweden.” Accessed October 14, 2022. https://www. naturvardsverket.se/data-och-statistik/avfall/avfallsmangder/.
31. Vidén, Sonja, and Gunilla Lundahl. “Miljonprogrammets bostäder: Bevara – förnya - förbättra.” Stockholm: Byggforskningsrådet, 1992.
32. Warfvinge, Catarina. “Mycket energi att spara i miljonprogrammet!” VVS-forum – Värme och energi (April 2008): 7-12.
FIGURES
Figure 6.1 Stockholms Stadsbyggnadskontor. “Bygg-och plantjänsten.” Accessed October 10, 2022. https://etjanst. stockholm.se/Byggochplantjansten/arenden.
Figure 6.2, 6.3 Stockholms Stadsbyggnadskontor. “Bygg-och plantjänsten.” Accessed October 17, 2022. https://etjanst. stockholm.se/Byggochplantjansten/arenden.
Figure 6.4 Stockholms Stadsbyggnadskontor. “Bygg-och plantjänsten.” Accessed October 18, 2022. https://etjanst. stockholm.se/Byggochplantjansten/arenden.
Figure 6.5 Statistiska Centralbyrån. “Statistikdatabasen.” Accessed September 28, 2022. https://www.statistikdatabasen. scb.se/pxweb/sv/ssd/.
Figure 6.6 Stockholm Stad. “Bygg och plantjänsten-Stadsfogden 9.” Accessed October 10, 2022. https://etjanst.stockholm.se/ Byggochplantjansten/arenden.
Figure 6.7 Energ. “Building energy balance.” Accessed September 10, 2022. https://swiadectwa-energ.pl/swiadectwaenergetyczne/bilans-energetyczny-budynku/.
97 Bibliography
Figure 6.8 Statistics on Bagarmossen. “Statistiska Centralbyrån.” Last modified October 15, 2022. https://www.statistikdatabasen. scb.se/pxweb/sv/ssd/.
Figure 6.9, 6.10 Energimyndigheten. “Hur värmer du upp ditt hus?” Last modified October 6, 2022. https://www. energimyndigheten.se/snabblankar/lattlast/hur-varmer-du-uppditt-hus/.
Figure 6.11, 6.12 Allabrf. “Condominium Emågatan-Annual report 2018.” Accessed September 30, 2022.https://www.allabrf.se/brfemagatan-bagarmossen/styrelse.
Figure 6.13 Statistiska Centralbyrån. “Statistikdatabasen.” Accessed October 9, 2022. https://www.statistikdatabasen.scb.se/ pxweb/sv/ssd/.
Figure 6.14 Photography by Ingrid Johansson, Aug 2001-Apr 2002. Accessed October 26, 2022. https://riksradsvagen.se/wpcontent/uploads/2018/12/Fotodokumentation.pdf.
Figure 6.15 Deplazes, Andrea. Constructing architecture: materials, processes, structures: a handbook. Basel: Birkhäuser, 2005.
Figure 6.16 Femenías, Paula, Holmström, Cecilia, Jonsdotter, Lina, Thuvander, Liane. Arkitektur, materialflöden och klimatpåverkan i bostäder. Stockholm: Energimyndigheten, 2016. https://www.e2b2.se/library/2310/39703-1-slutrapport-2016_2arktiektur-materialfloeden-och-klimatpaaverkan-i-bostaeder.pdf.
Figure 6.17 Spridd. “Byälvsvägen.” Accessed October 14, 2022. https://www.spriddarchitecture.com/byalvsvagen.
Figure 6.18 Stockholms stadsbyggnadskontor. Planbeskrivning: Detaljplan för del av fastigheterna Socialministern 1, Försvarsministern 1 och Handelsministern 1 vid Byälvsvägen i stadsdelen Bagarmossen. Stockholm: Stockholms stad, 2021.
Figure 6.19 Stockholms stad. “Bergholmsbacken utvecklas med skola, förskolor och bostäder.” Accessed October 23, 2022. https://vaxer.stockholm/projekt/bergholmsbacken-utvecklas-medskola-forskolor-och-bostader/.
Figure 6.20 Statistiska Centralbyrån. “Statistikdatabasen.” Accessed October 9, 2022. https://www.statistikdatabasen.scb.se/ pxweb/sv/ssd/.
Figure 6.21 Södertörnsmodellen. “Södertörn model.” Accessed October 23, 2022. https://sodertornskommunerna.se/projekt/arkiv/ sodertornsmodellen.html.
Figure 6.22 Hemnet. “Sök bostad.” Accessed October 9, 2022. https://www.hemnet.se/.
Norra Kvarngärdet, Uppsala
1. Anker Gate Lindegren.” Architekter SAR- Monografier.” Stockholm: K L Beckmans Tryckerier AB, 1971.
2. ArkDes. “DigitaltMuseum.” Accessed October 3, 2022. https:// digitaltmuseum.se/search/?q=stig+ancker&aq=owner%3F%3A% 22S-ARK%22.
3. Boverket. “Sök och hämta energideklaration.” Accessed October 20, 2022. https://www.boverket.se/sv/energideklaration/ sok-energideklaration/.
4. Bergold, Carl E.”Uppsala Stadsbyggande 1900 - 1960.” Uppsala Stads Historia, 6,9. Uppsala: Almqvist & Wiksell, 1989. 5.‘Detaljplan För Norra Kvarngärdet, Uppsala Kommun’, n.d. https://bygg.uppsala.se/globalassets/uppsala-vaxer/dokument/ stadsplanering--utveckling/detaljplanering/antagna-detaljplaner/ norra-kvarngardet/planhandling-norra-kvarngardet.pdf
6. Enköpings-Posten. “En Tredjedel i Riskzonen.” Accessed October 20, 2022. https://eposten.se/nyheter/uppsala/entredjedel-i-riskzonen-unt4520819.aspx.
7. Eniro. “Kartor, Vägbeskrivningar, Flygfoton, Sjökort & Mycket Mer På Eniro.Se.” Accessed October 19, 2022. https://kartor. eniro.se/.
8. Fil. dr Anna, Vikstrand. Norra Kvarngärdet En Arkitekturhistorisk Analys Och Värdering Av Ett Bostadsområde Statt i Förändring. Uppsala: Upplandsmuseet, 2009.
9. Fastighetstidningen. “Hovrätten Fastställer Hyreshöjning
På Upp till 60 Procent.” Accessed October 20, 2022. https:// fastighetstidningen.se/hovratten-faststaller-hyreshojning-pa-upptill-60-procent/.
10. Hitta. “Kvarngärdet Karta.” Accessed September 29, 2022. https://www.hitta.se/kartan/pl/Kvarng%C3%A4rdet%20 /2000952118!~59.86848,17.65833,14.244028914954198z/ tr!i=h8VNrpUz/tileLayer!l=1/lifestyle!l=59.86848:17.65833/ geocode!l=59.87252:17.64441.
11. Lambert, Lars, ed. Uppsalas Arkitekter Och Arkitekternas Uppsala: Fran Domkyrkan till Ångströmlaboratoriet. Uppsala: Kornhuset, 2002.
12. Lantmäteriet. “Självservice.” Accessed October 3, 2022. https://www.lantmateriet.se/sjalvservice/.
13. Lundgren, Per. Ny Bebyggelse Vid Kvarntorget Kulturhistorisk Utred- Ning Av Kvarngärdet 30:1, Kv. Kvarnen, Uppsala Stad Och Kommun. Uppsala: Upplandsmuseet, 2023.
14. Rikshem. “Uppsala Kvarngärdet.” Accessed October 3, 2022. https://www.rikshem.se/om-oss/vara-fastigheter/uppsala/ kvarngardet/.
15. Svenssons Nyheter. “De 15 Familjerna.” Accessed October 20, 2022. https://15familjer.zaramis.se/2018/01/23/anders-diosoch-anders-zorn/.
16. S:T Eriks. “S:t Eriks historia ska vi vårda.” Accessed October 20, 2022. https://steriks.se/om-st-eriks/historik/.
17. SVT Nyheter. “Chockhöjda Hyror På Norra Kvarngärdet.” Accessed October 20, 2022. https://www.svt.se/nyheter/lokalt/ uppsala/chockhojda-hyror-pa-norra-kvarngardet.
18. Stadt Eupen. “Das Innovative Bauprojekt „Neue Höfe Dürwiß“.” Accessed October 9, 2022. https://www.eupen.be/dasinnovative-bauprojekt-neue-hoefe-duerwiss/.
19. Stena Fastigheter. “Hittade 17 träff(ar) för “norra kvarngärdet”.” Accessed October 3, 2022. https://www. stenafastigheter.se/sok/?q=norra+kvarng%C3%A4rdet.
20. Sundquist, Nils, and Axel Stigenberg. Byggnadsfirman Anders Diös : 30 År Som Byggmästare i Uppsala 1925-55. Uppsala: Almqvist & Wiksell, 1956.
21. Svevia. “Uppsala.” Accessed October 20, 2022. https://www. svevia.se/vart-erbjudande/grus-och-kross/krossanlaggningar/ uppsala.
22. Uppsala Vatten. “Hovgårdens Avfallsanläggning.” Accessed October 20, 2022. https://www.uppsalavatten.se/foretag/avfalloch-atervinning/hovgardens-avfallsanlaggning.
23. Uppsala Bostadsförmedling. “Råbyvägen 21.” Accessed October 20, 2022. https://www.bostad.uppsala.se/mypages/app/ visa/200010474945.
24. Öhrt, Weronica. ‘Uppdrag Om Genomsnittshyra i Uppsala’. Uppsala, 4 March 2021. https://www.uppsala.se/contentasse ts/9e3e06979d044a99ae6b22cb0979c433/11-amn-uppdraggenomsnittshyra-uppsala.pdf.
FIGURES
Figure 1.1 Upplands Betong, original title “Upplands Betong i stadsdelen Boländerna, Uppsala”; https://digitaltmuseum. se/011013952398/upplands-betong-i-stadsdelen-bolandernauppsala.
Figure 1.2 Historical building material suppliers, Aerial photo from 1975; https://www.lantmateriet.se/sjalvservice/.
Figure 1.3 1960s, section west/ east, Illustration based by Jolirak 2013-08-23, https://bygg.uppsala.se/globalassets/uppsala-vaxer/ dokument/stadsplanering--utveckling/detaljplanering/antagnadetaljplaner/norra-kvarngardet/planhandling-norra-kvarngardet. pdf.
Figure 1.4, 1.16 Present, section section west/ east, Illustration based by Jolirak 2013-08-23, https://bygg.uppsala.se/ globalassets/uppsala-vaxer/dokument/stadsplanering--utveckling/ detaljplanering/antagna-detaljplaner/norra-kvarngardet/ planhandling-norra-kvarngardet.pdf .
Figure 1.5 Photo from site, 2022 looking at the new higher neighbourhood, photo by Katharina Bitschnau.
Figure 1.6 Revit model based on; AGL Arkitekter plans from
98 Mass Housing
Archive.
Figure 1.7 Nybygge på Kvarngärdet; Photo by Uppsala-bild 1963, https://digitaltmuseum.se/021018564042/nybygge-pakvarngardet-uppsala-1963.
Figure 1.8 Detail based on; AGL Arkitekter plans from Archive. Figure 1.9 Revit model based on; observations.
Figure 1.10 Construction process, 2017 Street View from Google Maps, https://www.google.com/maps/@59.8710923,17.648912,3 a,75y,64.9h,96.52t/.
Bijlmermeer, Amsterdam
1.Andersen Skrifter, Hans. 2013. “Frank Wassenberg: Large housing estates: ideas, rise, fall and recovery. The bijlmermeer and beyond.” J Hous and the Built environ (2014) 29:557-558. DOI 10.1007/s10901-013-9378-xdata=!3m7!1e1!3m5!1sq38LlTc8 d35dPRRQAw7z0A!2e0!5s20170701T000000!7i13312!8i6656.
2. Archdaily.DeFlat / NL Architects + XVW architectuur. 2017https://www.archdaily.com/806243/deflat-nl-architectsplus-xvw-architectuur?fbclid=IwAR0Re0yjWDKRkGXRlfyHnWkgdxryR4u_B-m_YYgAOjVDN5QADk8AWeGOlk.
3. Bajema, Chris., Mingle, Katie. 2018. Blood, Sweat & Tears (City of the Future, Part 2) https://99percentinvisible.org/episode/bloodsweat-tears-city-future-part-2/?fbclid=IwAR0tIJGMXHCT8XKRhoq DLr9stkElBZs8eom6gQp9RYoVv1_Or7SyV05NC0A.
4. Bajema, Chris., Mingle, Katie. 2020. Bijlmer (City of the Future, Part 1) https://99percentinvisible.org/episode/bijlmer-city-futurepart-1/?fbclid=IwAR2O6YHVi7t8FkDVrioxvf5t3tXVJO4SEN97boC GH8OTT_V1zY5lFlcMQ6w.
5. Bijlmermuseum. https://bijlmermuseum.com.
6. Blair, Thomas L., Hulsbergen, Edward D. 1993. Designing renewal on Europe’s multi-ethnic urban edge. 02642751/93/040283-16, Butterworth-Heinemann Ltd, pp. 283-298.
7. Boudewijn, Sterk., Zahirovic, Selma. 2007. The Bijlmer: a Dutch Approach to Multiculturalism. Humanity in action Nederland. https://humanityinaction.org/knowledge_detail/the-bijlmer-a-dutchapproach-to-multiculturalism/?fbclid=IwAR0ObAaCaalueF4CKtK WyrfU48nxBr8VLirVpw_SQ-LWgNfjfVQqUAlc2ug.
8. Carlier, Ingrid V. E,. Gersons, Berthold P. R. 1997. “Stress reactions in disaster victims following the Bijlmermeer plane crash”. Journal of Traumatic Stress, Vol. 10, No. 2, 1997.
9. Documentatie systeemwoningen ´50-´70. 2013. BouwhulpGroep.
10. Dukes, Thea. 2016. Urban Europe, URBAN Bijlmermeer How a European programme became the catalyst for a ‘black revolution’ in Amsterdam Southeast. Amsterdam University Press, pp. 377-385. https://www.jstor.org/stable/j.ctvcszzrh.50.
11. Ezzeroili, Nadia., Dekker, Daan. De kraakactie die de Bijlmer voorgoed verandere. https://www.volkskrant.nl/kijkverder/2017/ gliphoeve/?referrer=https%3A%2F%2Fwww.google. com%2F&fbclid=IwAR00ybBrpSVDnd2kmZlDMpA_fAsdL_ rNQp9HfRalyT0wzwrBQK1KFORkZQU.
12. Heilbron, Miguel., 2022. “Not for Surinamese”. E-flux Architecture.https://www.e-flux.com/architecture/where-ishere/466510/not-for-surinamese/.
13. Helleman, Gerben., Wassenberg, Frank. 2003. “The renewal of what was tomorrow’s idealistic city. Amsterdam’s Bijlmermeer high-rise.” Cities, Vol. 21, No. 1, p. 3-17, 2004. Elsevier Ltd. doi:10.1016/j.cities.2003.10.011. https://issuu. com/itscreative/docs/documentatie_systeemwoningen139593?fbclid=IwAR1HChn3zdTX_68fYKqWTaOE1256tt2_ Fnvs8eHwdxAXQrAnqh9A5LRRCx4.
14. Infocentre Amsterdam Southeast.he development of Amsterdam Southeast. 2009. https://web.archive.org/ web/20090731063515/http://www.advisory.amsterdamarena.nl/ files/u1/evelopment_A_dam_South_East.pdf.
15. Kleiburg.Archello. https://archello.com/project/kleiburg?fbclid= IwAR1WaDFno5QxD4jQNSilkF3nHU4KRQceCjODHzG9Kb0Cwl 2jQQBxtK4-Z3U.
16. Kleiburg De Flat, winner of Mies van der Rohe Award 2017. 2017. Arqa. https://arqa.com/en/_arqanews-archivo-en/ kleiburg-de-flat.html?fbclid=IwAR0VGdQCOqTtNr9QHRSbLx58QH9FWe5tLYl-VXmVjPJ73O4y-XRv84RVQs.
17. Kleiburg. NL Architects. http://www.nlarchitects.nl/slideshow/2 01/?fbclid=IwAR3vNDrWsge93RZiowQqf560YeFd1aXMtlSzZIIUlK 4iBh1lTfgy-QBlQ-c.
18. Laurent J.G. van der Maesen, Han Vogelezang, Naar het jongste verleden gekeken : over de opbouwfase van de Zuidoostlob van de agglomeratie Amsterdam, 1983.
19. Loerakker, Jan., Olsson, Lea. 2013. Revisioning Amsterdam Bijlmermeer. FA Failed Architecture. 25 min. https:// failedarchitecture.com/the-story-behind-the-failure-revisioningamsterdam-bijlmermeer/?fbclid=IwAR3cRhhWQoP1MmfzeQiKTu FtEFYnkib1LJIdwqFLi6koicgs8YoXy50U6Zk.
20. Mentzel, Maarten. 1990. “The Birth of Bijlmermeer (1965): The origin and explanation of high-rise decision making. “ The Netherlands Journal of Housing and environmental Research, 1990, Vol. 5, No. 4 (1990), pp. 359-375. https://www.jstor.org/ stable/43928470.
21. Research-Instituut voor de Woningbouw, Delft Ir. R. S. F. J. van Elk Dr. ir. H. Priemus, Niet-traditionele woningbouw in Nederland (Stichting Bouwresearch, 1970) 11.9.
22. Stal, Georgina Y., Zuberi, Daniyal M. 2009. Endin the cykle of poverty through socio-economic integration: A comparison of Moving to Opportunity (MTO) in the United States and the BIjlmermeer Revival Project in the Netherlands. https://www.sciencedirect.com/science/article/abs/pii/ S0264275109001115?via%3Dihub.
23. Vpro. 2017. “Webdocumentaire: Gliphoeve - een vergeten strijd.” Uploaded on September 8, 2017. YouTube video, 14:20 min. https://www.youtube.com/watch?v=Y50VYAm6A4E.
24. Wassenberg, Frank.. Demolition in the Bijlmermeer: lessons form transforming a large housing estate. 2011 Building Research & Information, 39:4, 363-379. https://doi.org/10.1080/096132 18.2011.585104.
25. Wassenberg, Frank.Large Housing Estates: Ideas, Rise, Fall and Recovery: The Bijlmermeer and beyond (Sustainable Urban Areas), 2013 p. 162, 164.
26. Wassenberg, Frank. “The integrated renewal of Amsterdam’s Bijlmermeer high-rise.”. Informationen zur Raumentwicklung Heft 3/4. 2006. pp. 191-201.
27. Wilkinson, Tom. Bijlmermeer estate by NL Architects with XVW architectuur. The Architectural 2017 Review.https://www. architectural-review.com/buildings/bijlmermeer-estate-by-nlarchitects-with-xvw-architectuur?fbclid=IwAR1e1UqZvZnizrWM9n k1xA0DgHBSSCCvHRDxiRNCvXyaBo63-SyND_w175A.
FIGURES
Figure 7.1 https://www.istockphoto.com/se/vektor/amsterdamnederl%C3%A4nderna-karta-nederl%C3%A4nderna-karta-ieuropeiska-landet-gm1215604963-354119972.
Figure 7.2 Pedestrians and Cars on Different Levels in Ideal City as Envisioned by Le Corbusier. Bijlmer, City of the Future, Part 1. 99% Invisible, February 20, 2018. https://99percentinvisible.org/ episode/bijlmer-city-future-part-1/.
Figure 7.3 Bijlmermeer Aerial Photograph. Heritage of the Week: The Bijlmer Museum as the Dream City of the Future. Gemeenste Amsterdam, June 5, 2019. https://www.amsterdam.nl/kunstcultuur/monumenten/erfgoed-week/bijlmermuseum-stadsgezicht/.
Figure 7.4 https://commons.wikimedia.org/wiki/
File:Burgemeester_Van_Hall_slaat_eerste_paal_in_de_ Bijlmermeer,_Bestanddeelnr_918-9198.jpg?fbclid=IwAR2CC0c-Hf 7iaK9dSiDR73efaPlBD4amn3kbWrRHMRmnRuxUf_kN-BsftpQ.
Figure 7.5 R. S. F. J. van Elk Dr. ir. H. Priemus, Niet-traditionele woningbouw in Nederland Research-Instituut voor de Woningbouw, Delft Ir.Stichting Bouwresearch, 1970. 11.9.
Figure 7.6 Mentzel, M.A., Bijlmermeer als grensverleggend ideaal: Een studie over Amsterdamse stadsuitbreiding, 1989.
Figure 7.7 R. S. F. J. van Elk Dr. ir. H. Priemus, Niet-traditionele
99 Bibliography
woningbouw in Nederland Research-Instituut voor de Woningbouw, Delft Ir.Stichting Bouwresearch, 1970. 11.9.
Figure 7.8 Laurent J.G. van der Maesen, Han Vogelezang, Naar het jongste verleden gekeken : over de opbouwfase van de Zuidoostlob van de agglomeratie Amsterdam, 1983.
Figure 7.9 Miguel Heilbron ZWARTBOEK: Segregatie in Amsterdam en de rol van discriminerend ‘spreidingsbeleid’ door de gemeente in de jaren’70, 2017. https://www.theblackarchives.nl/tba-blog/zwartboek-segregatie-inamsterdam-en-de-rol-van-discriminerend-spreidingsbeleid-doorde-gemeente-in-de-jaren-70
Figure 7.10, 7.11, 7.13 Wassenberg, Frank.Large Housing Estates: Ideas, Rise, Fall and Recovery: The Bijlmermeer and beyond (Sustainable Urban Areas), 2013 p. 162, 164.
Figure 7.12 Projectbureau Vernieuwing Bijlmermeer, De vernieuwing van de Bijlmermeer Achtergronden en ontwikkelingen, 2014, p 13,15 https://saboadvies.nl/wpcontent/uploads/2017/05/achtergronden_en_ontwikkelingen_ vernieuwing_bijlmermeer_-_background_information_renewal_ bijlmermeer.pdf.
Figure 7.14 Stijn Brakkee, Bijlmermeer estate by NL Architects with XVW architectuur. The Architectural 2017 Review. http://www.nlarchitects.nl/slideshow/201/?slide=46.
Figure 7.15 Image by Gabriele Lipskyte.
Figure 7.16 Jan Olphert Vaillantlaan, Bijlmermeer, Amsterdam, North Holland, Amsterdam Southeast, Europe, 2019 https:// www.flyingholland.nl/-/portfolio/portfolio/architectuur/-/medias/ fb8a5705-b573-4e72-908a-316042d788b0-overzicht-oostelijkdeel-bijlmermeer-met-honingraatflats-van-de#.
Figure 7.17 Monumenten & Archeologie, Gemeente Amsterdam, Cultuurhistorische verkenning Bijlmermuseum C 16-010 Amsterdam 2016/2019, 2019, p 3.
Figure 7.18 Biljmer Ontwerp, https://bijlmermuseum.com/hetbijlmer-ontwerp/.
Figure 7.19 Monumenten & Archeologie, Gemeente Amsterdam, Cultuurhistorische verkenning Bijlmermuseum C 16-010 Amsterdam 2016/2019, 2019, p 11.
Figure 7.20 Omgeving Kwaku Summer Festival weer afgesloten, 2019 https://www.bijlmer.net/category/cultuur-events/?fbclid =IwAR2AuyqSFsAaREMFt7_cmbhjfCKFPm0dwBbgA6yttrsHAMCP6kz6qi9hTE.
Figure 7.21 Information about borough Bijlmer Centrum (DFH), 2022 https://allcharts.info/the-netherlands/borough-bijlmercentrum-d-f-h-amsterdam/.
Figure 7.22 Bo Van De Wall Perne, In opdracht van: Heesterveld broedplaats Amsterdam, https://bovandewallperne.nl/portfolio/inopdracht-van-heesterveld-broedplaats-amsterdam/.
Figure 7.23 CBS Inflation and index figures, WoningwaardkaartVerkoopprijs per m2 https://maps.amsterdam.nl/ woningwaarde/?LANG=nl.
Märkisches Viertel, Berlin
1. Asma Mehan. “An integrated model of achieving social sustainability in urban context through Theory of Affordance.” PhD diss., Politecnico di Torino, 2016.
2. Anna Granath Hansson. “City strategies for affordable housing: the approaches of Berlin, Hamburg, Stockholm, and Gothenburg.” International Journal of Housing Policy 19 (February 2019): 95119. https://doi.org/10.1080/19491247.2017.1278581.
3. Bezirksamt Reinickendorf von Berlin. “Märkisches Viertel.” Last modified December 11, 2015. https://www.berlin.de/bareinickendorf/ueber-den-bezirk/ortsteile/maerkisches-viertel/ artikel.85001.php
4. City-Facts. “Märkisches Viertel.” Accessed September 30, 2022. https://www.city-facts.com/m%C3%A4rkisches-viertel#.
5. Daniel Baldwin Hess, Tiit Tammaru and Maarten van Ham. Housing Estates in Europe: Poverty, Ethnic Segregation and Policy Challenges. Switzerland: Springer Nature Switzerland AG,
2018.
6. DAHM Architekten + Ingenieure GmbH. “Komplexe energetische Modernisierung von 536 Wohnungen als Pilotprojekt im Märkischen Viertel.” Accessed September 27, 2022. https:// www.dahm-ai.de/projekte/modernisiertes-wohnen/mv908.html.
7. Guthmann Estate. “Berlin Real Estate Report 2022.” Last modified October 17, 2022. https://guthmann.estate/en/marketreport/berlin/.
8. GESOBAU. “Es ist vollbracht.” Last modified March 22, 2016. https://www.hallonachbar.berlin/gesobau-details/es-ist-vollbracht.
9. GESOBAU. “Zukunft Märkischen Viertels.” Accessed September 29, 2022. https://www.gesobau.de/wohnen/rund-umswohnen/wohnquartiere/maerkisches-viertel/zukunft-maerkischesviertel.html.
10. J. H. Gonzalez-Libreros, A. Bertolazzi, U. Turrini and C. Pellegrino. “Assessment of an Existing Reinforced-Concrete Prefabricated Building: The Case of the Procédé Camus.” ASCE (March 2020): 2.
11. Karim Ghazi Wakili, Christoph Dworatzyk, Maximilian Sanner, Andreas Sengespeick, Mikael Paronen and Thomas Stahl. “Energy efficient retrofit of a prefabricated concrete panel building (Plattenbau) in Berlin by applying an aerogel based rendering to its facades.” Energy and Buildings Volume 165 (April 2018): 293-300.
12. La Fabrique de la Cité. “Berlin: the challenge of affordable housing in a city of low-income tenants.” Last modified June 4, 2019. https://www.lafabriquedelacite.com/en/publications/berlinthe-challenge-of-affordable-housing-in-a-city-of-low-incometenants/.
13. Mordor Intelligence. “Germany Prefabricated Buildings Industry is segmented by Material Type (Concrete, Glass, Metal, Timber and Other Material Types) and Application (Residential, Commercial, and Other Applications (Infrastructure and Industrial)).” Last modified October 29, 2020. https://www. mordorintelligence.com/industry-reports/germany-prefabricatedbuildings-market.
14. Mark Swenarton, Tom Avermaete and Dirk van den Heuvel. Architecture and the Welfare State. New York: Routledge, 2015.
15. Nordregio. “Energy saving for 13 000 flats in Berlin.” Accessed September 13, 2022. https://archive.nordregio.se/en/Metameny/ About-Nordregio/Journal-of-Nordregio/Journal-of-Nordregiono-1-2011/Energy-saving-for-13-000-flats-in-Berlin/index.html.
16. National Geographic. “Human Impacts on the Environment.” Last modified September 1, 2022. https://education. nationalgeographic.org/resource/resource-library-human-impactsenvironment.
17. North Data. “GESOBAU AG, Berlin, Germany.” Accessed September 30, 2022. https:// www.northdata.com/GESOBAU+AG,+Berlin/ Amtsgericht+Charlottenburg+%28Berlin%29+HRB+396+B.
18. Smart City Berlin. “Partner Detail, GESOBAU AG.” Accessed September 30, 2022. https://smart-city-berlin.de/en/members-ofsmart-city-berlin-network/partner-detail?tx_news_
19. S.T.E.R.N. GmbH. “Stadtumbau West im Märkischen Viertel.” Last modified February, 2009. https://www.stadtentwicklung. berlin.de/nachhaltige-erneuerung/fileadmin/user_upload/ Dokumentation/Projektdokumentation/Reinickendorf/FG_ Maerkisches_Viertel/PDF/Insek_MV_Kurzfassung_.
20. Slow Travel Berlin. “The Battle for Social Housing in Berlin.” Last modified August 25, 2022. https://www.slowtravelberlin.com/ the-battle-for-social-housing-in-berlin/#.
21. The Guardian. “Berlin’s vote to take properties from big landlords could be a watershed moment.” Last modified September 29, 2021. https://www.theguardian.com/ commentisfree/2021/sep/29/berlin-vote-landlords-referendumcorporate.
22. Uncube. “RADICALLY MODERN IN 60S BERLIN.” Last modified October 13, 2015. https://www.uncubemagazine.com/ blog/16132547.
23. VonLux. “Historische Aufnahmen aus dem Märkischen
100 Mass Housing
Viertel.” Last modified October 8, 2022. https://xn-mrkischesviertel-vnb.de/historische-fotos-aus-demmaerkischen-v-81022/.
24. Vrije Universiteit Brussel. “Heavy prefab systems.” Last modified June 24, 2016. http://postwarbuildingmaterials.be/ material/heavy-prefab-systems/.
FIGURES
Figure 8.1 Wikipedia. “Berlin-Märkisches Viertel.” Last modified May 16, 2009. https://de.wikipedia.org/wiki/BerlinM%C3%A4rkisches_Viertel.
Figure 8.2, 8.3 Eric Ottinger, Harshit Minglani, Mark Gibson, FRICS and Amanda Alexander. “The four dimensions of industrialized construction.” EY Building a Better Working World (May 2020): 2-17.
Figure 8.4 UN-Habitat. State of the World’s Cities 2012/2013: Prosperity of Cities. Cambridge: Bounford.com, 2012. https:// sustainabledevelopment.un.org/content/documents/745habitat. pdf.
Figure 8.5, 8.7, 8.8, 8.14, 8.16 Brücke-Museum. “Märkisches Viertel Residential Buildings.” Last modified August 4, 2022. https://wernerduettmann.de/en/karte/wohnbauten-immaerkischen-viertel.
Figure 8.6 Sam Jacoby. “Dialectical principles of design.” The Journal of Architecture 23 (September 2018): 1230-58. https://doi. org/10.1080/13602365.2018.1513415.
Figure 8.9-8.11 GESOBAU. “Modernisation of the Märkisches Viertel in Berlin.” Last modified August 12, 2018. https://www. gesobau.de/mieten/wohnquartiere/reinickendorf/maerkischesviertel.html.
Figure 8.12 GESOBAU, SWUP. “Neugestaltung des Märkischen Viertels.” Last modified August 11, 2020. https://www.swup.de/ news/neugestaltung-des-m%C3%A4rkischen-viertels.
Figure 8.13 Urban Sustainability Exchange. “Energy efficient refurbishment at Berlin’s Märkisches Viertel neighborhood.” Last modified November 25, 2021. https://use.metropolis.org/ case-studies/deutschlands-grosste-niedrigenergiesiedlung-dasmarkische-viertel.
Figure 8.15 North Data. “North data smart research.” Accessed October 3, 2022. https://www.northdata.com/.
Figure 8.17 SVID. “System-wide life cycle thinking.” Accessed October 3, 2022. http://postwarbuildingmaterials.be/material/ heavy-prefab-systems/.
Figure 8.18 Google Map. “Märkisches Viertel.” Accessed September 12, 2022. https://goo.gl/maps/aTRdgUEBxDHRx4Na6.
101 Bibliography


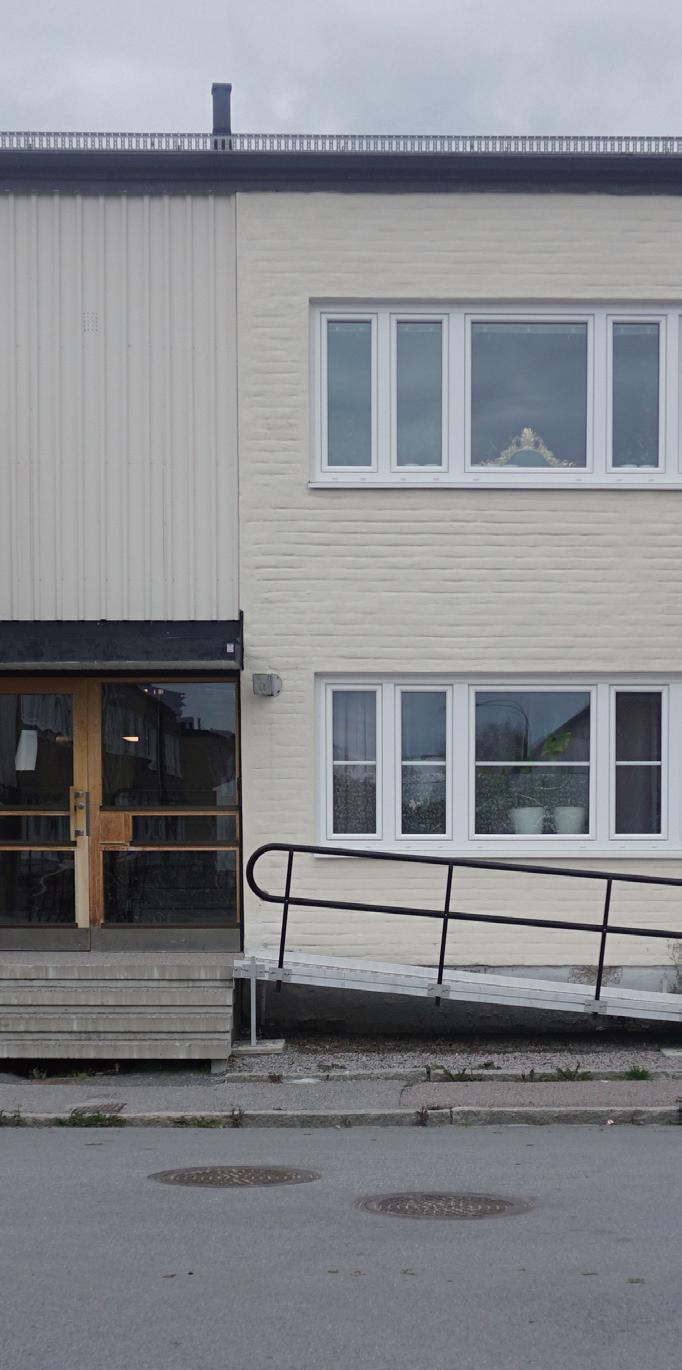
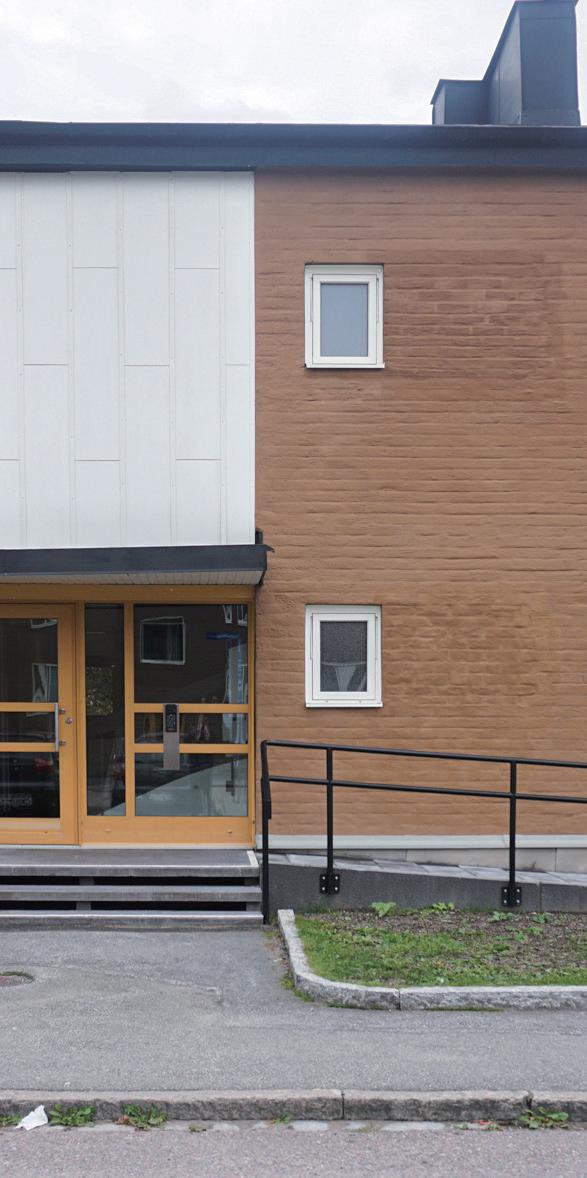
102 Mass Housing
Renovation methods Forecort Greenery Stairs Ramp for accessibility Door Paint Realtering the size of the windows Roof Appendix Norra Kvarngärdet
Uppsalahem Rikshem Stena Fastigheter

103 Appendix Replacement of balcony fronts & façade panels Raw mteril from nature Production of building materials Transport Building phase Renovation of some buildings & repainting the façades Façade insulation, piping, windows, lighting in stairwells, kitchens and bathrooms
New
Recycling eg. glss, metal Waste to energy Down-cycling eg. concrete, brick Landfill just 1% of Sweden‘s waste goes to landfill Demolition of the school and the supermarket School from 1960s Supermarket 1950 1960 1970 1980 1990 2000 2010 2020 Housing from the 1960s Housing today New construction where the supermarket was Energy flow
Continued Being Used
Construction
Appendix Biljmermeer
1974:Surinamesepeoplestrikingtoprotestthe overcrowdedboardinghouses.


1974:Surinamesesquattingintheeightyoutofa hundredvacanthomesinGliphoeve,Bijlmermeeras aresponsetotheircurrenthousingsituation.
Fig.1.PhotobyNationalOrganizationofSurinameseinthe Netherlands(LOSON).https://www.e-flux.com/architecture/ where-is-here/466510/not-for-surinamese/
1980:Thenewmetroontheelevatedtracks connectingBijlmermeertoAmsterdam.

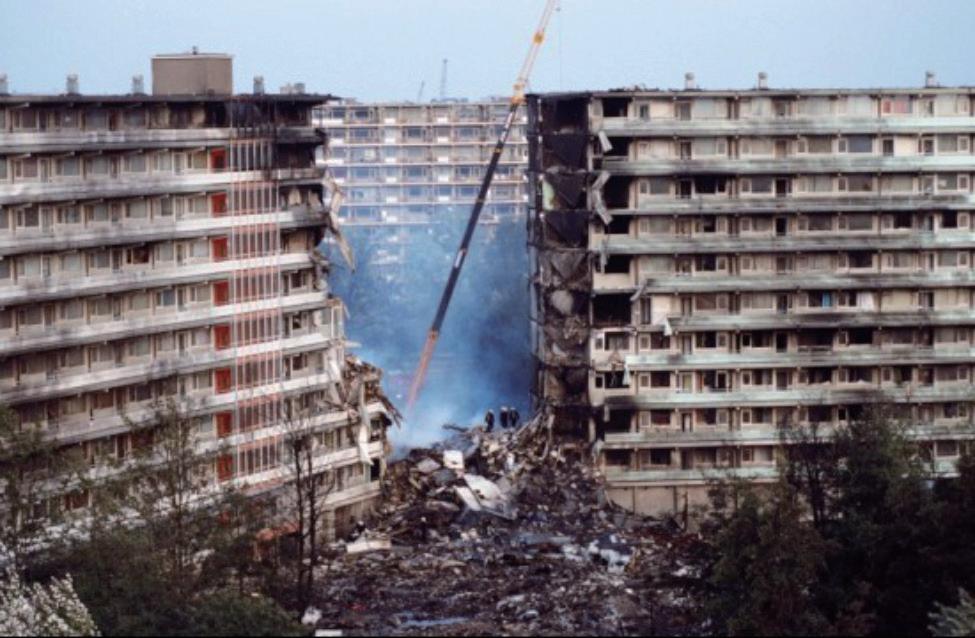
Fig.2.DeGliphoeve.PhotobyHansPeters/NationaalArchief https://www.e-flux.com/architecture/where-is-here/466510/not-forsurinamese/
1992:Theplanecrashthatopenedupthepubliceye towardsBiljmermeerandinitiatedthedebateofthe futureoftheneighbourhood.
Fig.3.TheBijlmer.PhotobyRichardkiwi.https:// exchange.prx.org/pieces/234374-99-invisible-297-blood-sweatand-tears-city-o/floating_piece
Fig.4.PhotobyANP/M.Antonisse.https://exchange.prx.org/ pieces/234374-99-invisible-297-blood-sweat-and-tears-city-o/ floating_piece
104 Mass Housing
Appendix
Appendix
2022:Themetroonelevatedtrackslookingoverthe honeycombhousesofBijlmermeer.

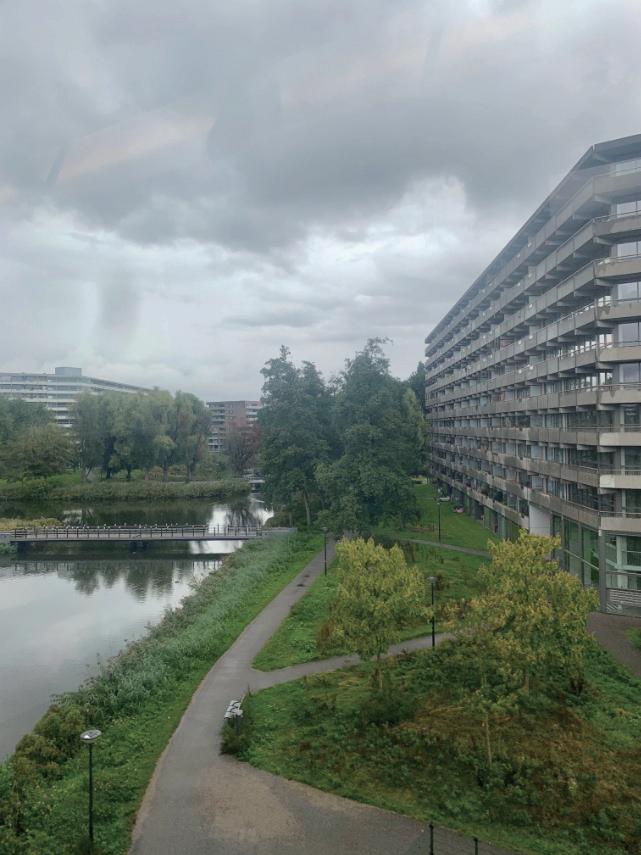
2022:Oneofthehoneycombhouseswithgreen spaceandwateradjecent.

Fig.5.Bijlmermeer.PhotobyGabrielėLipskytė,2022.
2022:Oneofthehoneycombhouseswithvisible changestothegroundfloorsfromstorageunitsto studiosandapartments.
Fig.6.Bijlmermeer.PhotobyGabrielėLipskytė,2022.
Fig.7.Bijlmermeer.PhotobyGabrielėLipskytė,2022.
105 Appendix


