


April2023 CopyrightbyKWAdvisors2023
EastBayarea
CountyComparison
JumptoCountyComparison
AlamedaCounty
Alameda
JumptoAlamedaReport
Albany
JumptoAlbanyReport
Berkeley
JumptoBerkeleyReport
CastroValley
JumptoCastroValleyReport
Emeryville
JumptoEmeryvilleReport
Fremont
JumptoFremontReport
Hayward
JumptoHaywardReport
Oakland
JumptoOaklandReport
Piedmont
JumptoPiedmontReport
SanLeandro
JumptoSanLeandroReport
ContraCostaCounty
JumptoContraCosta
Alamo
JumptoAlamoReport
Concord
JumptoConcordReport
Danville
JumptoDanvilleReport
ElCerrito
JumptoElCerritoReport
ElSobrante
JumptoElSobranteReport
Lafayette
JumptoLafayetteReport
Napa
JumptoNapaReport
Sonoma
JumptoSonomaReport
Moraga
JumptoMoragaReport
Orinda
JumptoOrindaReport
PleasantHill
JumptoPlesantHillReport
SanPablo
JumptoSanPabloReport
WalnutCreek
JumptoWalnutCreekReport
ABOUTME
Anissawasbornandraisedinthe EastBayandNorthernPeninsula,and hasmaintainedapassionforreal estatesinceshepurchasedherfirst homeinthePiedmontAvenue neighborhoodnearLakeMerritt.She hashelpednumerousclients purchasehomesinSanFrancisco andNewYorkasanagentand broker/closingattorney,respectively. Clientdriven,Anissaishardworking andadventurous

AnissaattendedUCBerkeleyand GeorgeWashingtonLawandhas practicedlawforovertenyearsin commercialrealestate,securities andantitrustclassactionlitigation, aswellascomplianceandlegalinhousecounselforconstructionand civilengineeringcompanieson internationalprojects.Inherpersonal andprofessionalcareer,Anissahas traveledextensivelyadvisingclients inChina,Australia,Europeand SoutheastAsia.Duetoherinterestin internationallegalsystemsshehas livedandworkedinHongKong,the UKandAustralia.
Checkoutmywebsitehere
Eachofficeisindependentlyownedandoperated
ANISSA BURNLEY REALTOREXTRAORDINAIRE DRE#01471819 (415)290-5886 anissaburnley@kw.com www.heartmyhome.com
4937TelegraphAveSuiteA Oakland,CA94609
Iamdedicatedtomaintaininga long-termbusinessrelationshipwith you,asevidencedbymypastwork. Pleasecontactmewhenyou'reready tomoveforwardwithyournext purchaseorsale,andlet'sdiscuss howtomakeithappen. ScheduleAMeeting Workwith AnissaBurnley Bookaconsultationhere Let’sTalk AnissaBurnley (415)290-5886 anissaburnley@kw.com Let’sMeet 4937TelegraphAveSuiteA Oakland,CA94609
MyMobileApp
Curiousaboutwhat’strendinginyour neighborhood?Readytomakea move?Downloadourappforreal estateinsights,ondemand.
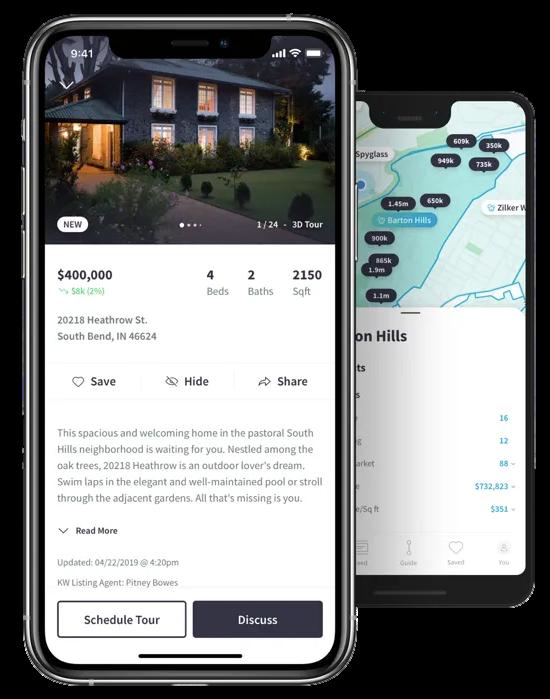
KeyFeatures
WorkwithanAgent CustomSearches
DynamicMap
GetLocal
AnytimeAccess
ShareInformation
DownloadtheKellerWilliamsReal EstateMobileAppforiPhone,iPad, andAndroidviathelinksbelow:

Formoreinformation,clickhere
HowChangingMortgageRates CanAffectYou
The30-yearfixedmortgageratehasbeenbouncing between6%and7%thisyear.Ifyou’vebeenonthefence aboutwhethertobuyahomeornot,it’shelpfultoknow exactlyhowa1%,orevena0.5%,mortgagerateshift affectsyourpurchasingpower

What’syourhome reallyworthin today’smarket?
That'sreally thequestionyoushouldbe askingyourself
Ourmarketisincrediblydiverse,and rapidlychanging.Valuesvarynotjustby neighborhood,butbystreet Yourhome isn'tnecessarilyworthwhatyourneighbors’ homeis.Attheendoftheday,it’sthe currentmarketthatsetsthevalueofyour home.

So,doyouknowwhatyourhomeisworth intoday'smarket?
Icanhelp...
Contactmeforaconfidential,noobligation assessmentofyourhome'svalue.

EastBay CountyComparison
SFR,Condominiums,Townhouses—March2023
ComparingAveragePrice,MedianPrice,andHighestPrice/SF
TheaveragepriceofapropertyinAlamedaCountyis$1,183,471witha medianpriceof$1,050,000,andthehighestpricepersquarefootis$1,436.
Ontheotherhand,inContraCostaCounty,theaveragepriceis$1,006,619 withamedianpriceof$760,000,andthehighestpricepersquarefootis $1,237.
EastBay CountyComparison
SFR,Condominiums,Townhouses—March2023
ComparingNumberofSold,NumberofNewListings,andDayson Market
InAlamedaCounty,therewere792propertiessold,1,032newlistings,and theaveragenumberofdaysonthemarketwas22.InContraCostaCounty, therewere797propertiessold,1,026newlistings,andtheaveragenumber ofdaysonthemarketwas26.
Alameda County
COUNTYOVERVIEW
SFR,Condominiums,Townhouses
March2023
ComparingAveragePrice,MedianPrice,andHighestPrice/SF
Alameda County
COUNTYOVERVIEW
SFR,Condominiums,Townhouses March2023
ComparingNumberofSales,NumberofNewListings,andDayson Market
AlamedaCity
ALAMEDA COUNTY
What's in the Alameda data?
Currently,thereare49single-familyhomes forsale,providing1monthofinventory. Therewere33newlistings,and24homes soldatamediansalepriceof$1.3m.The medianoverbidpercentagewas115.2%,with anaverageof16daysonthemarket.
Therearecurrently29condoandtownhome unitsforsale,providing1monthofinventory. Therewere15newlistings,and13unitssold atamediansalepriceof$885k.Themedian overbidpercentagewas100.6%,withan averageof27daysonthemarket.

ales in eryville, santon, oncord, nMarch nd are ndently et

15 New Listings 1 Months of Inventory $885K Median Sale Price 100.6% Median Sale vs List 27 Avg Days on Market 13 Sold Listings CONDO Condo & Townhomes
Last 12 months,
Condos
Last 12 months, year-over-year.
March2022 April2022 May2022 June2022 July2022August2022September2022October2022November2022December2022January2023February2023 March2023 125 100 75 50 25 0 March2022 April2022 May2022 June2022 July2022August2022September2022October2022November2022December2022January2023February2023 March2023 75 50 25 0 AlamedaCity MARCH2022-MARCH2023
Homes
Single-Family
year-over-year.
& Townhomes
LISTINGS FOR SALE SOLD LISTINGS
Median SalesPrice
Overbids
Single-Family
Theoverbidpercentage hasdecreasedfrom118.5% lastMarch2022,to115.2%a yearlater.
Condos& Townhomes
Theoverbidpercentage hasdecreasedfrom120.1% lastMarch2022,to100.6% ayearlater.
AVGDays OntheMarket
Theaveragetimespent onmarketwentupfrom12 dayslastMarch2022,to16 daysasofMarch2023.
Theaveragetimespent onmarketwentupfrom18 daysinMarch2022,to27 daysasofMarch2023.
March2022April2022May2022June2022July2022August2022September2022October2022November2022December2022January2023February2023March2023 $2,000,000 $1,500,000 $1,000,000 $500,000 $0 March2022April2022May2022June2022 July2022August2022September2022October2022November2022December2022January2023February2023March2023 50 40 30 20 10 0 March2022April2022May2022June2022 July2022August2022September2022October2022November2022December2022January2023February2023March2023 150% 100% 50% 0%
Condos& Townhomes Themediansalesprice hasdecreasedfrom $925klastMarch2022,to $885k asofMarch2023 Single-Family Homes Themediansalesprice
hasdecreasedfrom$15m lastMarch2022,to$13m asofMarch2023
Condos& Townhomes
Homes
Single-Family
Homes
BacktoTableofContents

Albany ALAMEDA COUNTY
What's in the Albany data?
Currently,thereare12single-familyhomes forsale,providing1monthofinventory. Therewere11newlistings,and8homessold atamediansalepriceof$1.4m.Themedian overbidpercentagewas136.7%,withan averageof8daysonthemarket.
Therearecurrently10condoandtownhome unitsforsale,providing0monthsof inventory.Therewere5newlistings,and7 unitssoldatamediansalepriceof$805k. Themedianoverbidpercentagewas105.3%, withanaverageof18daysonthemarket.

8 Sold Listings
%
$1.4M Median Sale Price
8 Avg Days on Market
ily, townhome, and condominium sales in stro Valley, El Cerrito, El Sobrante, Emeryville, Moraga, Oakland, Orinda, Piedmont, San staCounty,Alamo,Concord,Danville,Pleasant from Broker Metrics on March 3rd, and data urced from Broker Metrics on April 18th Data but may contain errors and are subject to ved Each Office Is Independently Owned and
y
ily Homes

5 New Listings 0 Months of Inventory $805K Median Sale Price 105.3% Median Sale vs List 18 Avg Days on Market 7 Sold Listings CONDO Condo & Townhomes
Last
Last 12 months, year-over-year.
March2022 April2022 May2022 June2022 July2022August2022September2022October2022November2022December2022January2023February2023 March2023 40 30 20 10 0 March2022 April2022 May2022 June2022 July2022August2022September2022October2022November2022December2022January2023February2023 March2023 30 20 10 0 Albany MARCH2022-MARCH2023
Homes
Single-Family
year-over-year.
& Townhomes
12 months,
Condos
LISTINGS FOR SALE SOLD LISTINGS
Median SalesPrice
Single-Family
Theaveragetimespent onmarketwentdown from12dayslastMarch 2022,to8daysasof March2023.
Overbids
Single-Family Homes
Condos& Townhomes
Theoverbidpercentage hasdecreasedfrom 1087%lastMarch2022,to 1053%ayearlater
BacktoTableofContents
March2022April2022May2022June2022July2022August2022September2022October2022November2022December2022January2023February2023March2023 $2,000,000 $1,500,000 $1,000,000 $500,000 $0 March2022April2022May2022June2022 July2022August2022September2022October2022November2022December2022January2023February2023March2023 100 75 50 25 0 March2022April2022May2022June2022 July2022August2022September2022October2022November2022December2022January2023February2023March2023 150% 100% 50% 0%
Condos& Townhomes
hasincreasedfrom$525k
Homes
Townhomes
Themediansalesprice
lastMarch2022,to$805k asofMarch2023 Single-Family
Themediansalesprice hasdecreasedfrom $149mlastMarch2022,to $145masofMarch2023 AVGDays OntheMarket Condos&
Theaveragetimespent onmarketwentupfrom15 daysinMarch2022,to18 daysasofMarch2023. Homes
Theoverbidpercentage hasincreasedfrom1366% lastMarch2022,to1367% ayearlater

Berkeley ALAMEDA COUNTY
What's in the Berkeley data?
Currently,thereare81single-familyhomes forsale,providing0.8monthsofinventory. Therewere42newlistings,and35homes soldatamediansalepriceof$1.5m.The medianoverbidpercentagewas116%,with anaverageof22daysonthemarket.
Therearecurrently26condoandtownhome unitsforsale,providing0.9monthsof inventory.Therewere13newlistings,and5 unitssoldatamediansalepriceof$827k. Themedianoverbidpercentagewas107%, withanaverageof33daysonthemarket.

M e sales in Emeryville, mont, San ,Pleasant and data 18th Data subject to wned and ket

1 Media
Months
2January2023February2023 March2023 022January2023February2023 March2023 y y LISTINGS FOR SALE SOLD LISTINGS
Median SalesPrice
Single-Family Homes
Themediansalesprice hasdecreasedfrom$1.7m lastMarch2022,to$1.5m asofMarch2023.
Themediansalesprice hasdecreasedfrom$917k lastMarch2022,to$827k asofMarch2023.
Overbids
Single-Family Homes
Theoverbidpercentage hasdecreasedfrom 134.6%lastMarch2022,to 116%ayearlater.
Condos& Townhomes
Theoverbidpercentage hasdecreasedfrom112.6% lastMarch2022,to107%a yearlater.
AVGDays OntheMarket
Single-Family Homes
Theaveragetimespent onmarketwentupfrom13 dayslastMarch2022,to 22daysasofMarch2023
Theaveragetimespent onmarketwentupfrom13 daysinMarch2022,to33 daysasofMarch2023.
March2022April2022May2022June2022July2022August2022September2022October2022November2022December2022January2023February2023March2023 $2,000,000 $1,500,000 $1,000,000 $500,000 $0 March2022April2022May2022June2022 July2022August2022September2022October2022November2022December2022January2023February2023March2023 50 40 30 20 10 0 March2022April2022May2022June2022 July2022August2022September2022October2022November2022December2022January2023February2023March2023 150% 100% 50% 0%
Condos& Townhomes
Condos& Townhomes
BacktoTableofContents

Castro Valley
ALAMEDA COUNTY
What's in the Castro Valley data?
Currently,thereare50single-familyhomes forsale,providing0.7monthsofinventory. Therewere27newlistings,and19homes soldatamediansalepriceof$1.1m.The medianoverbidpercentagewas102.2%,with anaverageof15daysonthemarket.
Therearecurrently8condoandtownhome unitsforsale,providing3monthsof inventory.Therewere6newlistings,and4 unitssoldatamediansalepriceof$781k. Themedianoverbidpercentagewas101.8%, withanaverageof6daysonthemarket.

19 Sold Listings
$1.3M Median Sale Price List
15 Avg Days on Market
e family, townhome, and condominium sales in ey, Castro Valley, El Cerrito, El Sobrante, Emeryville, ayette, Moraga, Oakland, Orinda, Piedmont, San raCostaCounty,Alamo,Concord,Danville,Pleasant ourced from Broker Metrics on March 3rd, and data ma sourced from Broker Metrics on April 18th Data eliable but may contain errors and are subject to s reserved Each Office Is Independently Owned and
tory
mily
Homes
6 New Listings

4 Sold Listings
3 Months of Inventory
$781K Median Sale Price
101.8% Median Sale vs List
6 Avg Days on Market
Condo
CONDO
& Townhomes
Single-Family
Last 12 months, year-over-year.
Last 12 months, year-over-year.
March2022 April2022 May2022 June2022 July2022August2022September2022October2022November2022December2022January2023February2023 March2023 200 150 100 50 0 March2022 April2022 May2022 June2022 July2022August2022September2022October2022November2022December2022January2023February2023 March2023 30 20 10 0 CastroValley MARCH2022-MARCH2023
Homes
Condos & Townhomes
LISTINGS FOR SALE SOLD LISTINGS
Median SalesPrice
Single-Family
Theaveragetimespent onmarketwentupfrom8 dayslastMarch2022,to15 daysasofMarch2023
Overbids
Single-Family Homes
Condos& Townhomes
March2022April2022May2022June2022July2022August2022September2022October2022November2022December2022January2023February2023March2023 $1,500,000 $1,000,000 $500,000 $0 March2022April2022May2022June2022 July2022August2022September2022October2022November2022December2022January2023February2023March2023 125 100 75 50 25 0 March2022April2022May2022June2022 July2022August2022September2022October2022November2022December2022January2023February2023March2023 125% 100% 75% 50% 25% 0%
Condos& Townhomes Themediansalesprice hasdecreasedfrom $780klastMarch2022,to $781kasofMarch2023
Homes Themediansalesprice
OntheMarket Condos& Townhomes
Single-Family
hasdecreasedfrom$14m lastMarch2022,to$11m asofMarch2023 AVGDays
Theaveragetimespent onmarketwentdown from8daysinMarch 2022,to6daysasof March2023 Homes
Theoverbidpercentage hasdecreasedfrom 107.4%lastMarch2022,to 101.8%ayearlater.
BacktoTableofContents
Theoverbidpercentage hasdecreasedfrom119.8% lastMarch2022,to102%a yearlater.

Emeryville ALAMEDA
COUNTY
What's in the Emeryville data?
Currently,thereis1single-familyhomefor sale,providing0monthsofinventory.There were0newlistings,and1homesoldata salepriceof$1m.Theoverbidpercentage was107.7%,withanaverageof0daysonthe market.
Therearecurrently32condoandtownhome unitsforsale,providing1.6monthsof inventory.Therewere13newlistings,and11 condossoldatamediansalepriceof$525k. Themedianoverbidpercentagewas98.7%, withanaverageof65daysonthemarket.

ales in eryville, t, San easant d data h Data ject to ed and et

13 New Listings 1.6 Months of Inventory $525K Median Sale Price 98.7% Median Sale vs List 65 Avg Days on Market 11 Sold Listings CONDO Condo & Townhomes
Last 12 months,
Condos
Last 12 months, year-over-year.
March2022 April2022 May2022 June2022 July2022August2022September2022October2022November2022December2022January2023February2023 March2023 6 4 2 0 March2022 April2022 May2022 June2022 July2022August2022September2022October2022November2022December2022January2023February2023 March2023 75 50 25 0 Emeryville MARCH2022-MARCH2023
Homes
Single-Family
year-over-year.
& Townhomes
LISTINGS FOR SALE SOLD LISTINGS
Median SalesPrice
Single-Family Homes
Themediansalesprice hasincreasedfrom$813k lastMarch2022,to$1mas ofMarch2023
AVGDays OntheMarket
Single-Family Homes
Theaveragetimespent onmarketwentdown from12dayslastMarch 2022,to0daysasof March2023.
Condos& Townhomes
Theaveragetimespent onmarketwentupfrom 28daysinMarch2022,to 65daysasofMarch2023.
Overbids
Single-Family Homes
Theoverbidpercentage hasdecreasedfrom 149.4%lastMarch2022,to 107.7%ayearlater.
Condos& Townhomes
Theoverbidpercentage hasdecreasedfrom 104.9%lastMarch2022,to 98.7%ayearlater.
March2022April2022May2022June2022July2022August2022September2022October2022November2022December2022January2023February2023March2023 $1,500,000 $1,000,000 $500,000 $0 March2022April2022May2022June2022 July2022August2022September2022October2022November2022December2022January2023February2023March2023 75 50 25 0 March2022April2022May2022June2022 July2022August2022September2022October2022November2022December2022January2023February2023March2023 150% 100% 50% 0%
Condos& Townhomes Themediansalesprice hasincreasedfrom$472k lastMarch2022,to$525k asofMarch2023
BacktoTableofContents

Fremont ALAMEDA COUNTY
What's in the Fremont data?
Currently,thereare122single-familyhomes forsale,providing0.7monthsofinventory. Therewere64newlistings,and61homes soldatamediansalepriceof$1.5m.The medianoverbidpercentagewas102.2%,with anaverageof13daysonthemarket.
Therearecurrently112condoandtownhome unitsforsale,providing1.2monthsof inventory.Therewere59newlistings,and44 unitssoldatamediansalepriceof$865k. Themedianoverbidpercentagewas100.5%, withanaverageof29daysonthemarket.


59 New Listings 1.2 Months of Inventory $865 Median Sal 100.5% Median Sale vs List 2 Avg Days on 4 Sold L COND Condo & Townho
y y
Median SalesPrice
AVGDays OntheMarket
Single-Family
Theaveragetimespent onmarketwentupfrom8 dayslastMarch2022,to13 daysasofMarch2023
Overbids
Single-Family Homes
Condos& Townhomes
Theoverbidpercentage hasdecreasedfrom112.1% lastMarch2022,to100.5% ayearlater.
BacktoTableofContents
March2022April2022May2022June2022July2022August2022September2022October2022November2022December2022January2023February2023March2023 $2,000,000 $1,500,000 $1,000,000 $500,000 $0 March2022April2022May2022June2022 July2022August2022September2022October2022November2022December2022January2023February2023March2023 50 40 30 20 10 0 March2022April2022May2022June2022 July2022August2022September2022October2022November2022December2022January2023February2023March2023 125% 100% 75% 50% 25% 0%
Condos& Townhomes Themediansalesprice hasdecreasedfrom$910k lastMarch2022,to$865k asofMarch2023 Single-Family Homes Themediansalesprice hasdecreasedfrom$17m
asofMarch2023
lastMarch2022,to$15m
Condos& Townhomes
Theaveragetimespent onmarketwentupfrom11 daysinMarch2022,to29 daysasofMarch2023. Homes
Theoverbidpercentage hasdecreasedfrom116.9% lastMarch2022,to102.2% ayearlater.
Hayward ALAMEDA
COUNTY
What's in the Hayward data?
Currently,thereare136single-familyhomes forsale,providing0.9monthsofinventory. Therewere71newlistings,and73homes soldatamediansalepriceof$875k.The medianoverbidpercentagewas100.1%,with anaverageof23daysonthemarket.
Therearecurrently58condoandtownhome unitsforsale,providing1.3monthsof inventory.Therewere30newlistings,and15 unitssoldatamediansalepriceof$642k. Themedianoverbidpercentagewas98.3%, withanaverageof24daysonthemarket.

SFH Single-Family Homes
71 New Listings
73 Sold Listings
0.9 Months of Inventory
$875K Median Sale Price
100.1% Median Sale vs List
23 Avg Days on Market
Data includes all single family, townhome, and condominium sales in Alameda, Albany, Berkeley, Castro Valley, El Cerrito, El Sobrante, Emeryville, Fremont, Hayward, Lafayette, Moraga, Oakland, Orinda, Piedmont, San Leandro,SanPablo,ContraCostaCounty,Alamo,Concord,Danville,Pleasant Hill, and Walnut Creek sourced from Broker Metrics on March 3rd, and data sales in Napa and Sonoma sourced from Broker Metrics on April 18th Data from sources deemed reliable but may contain errors and are subject to revision © 2023 All rights reserved Each Office Is Independently Owned and Operated DRE#02029039

New Listings 1.3 Months of Inventory $642K Median Sale Price 98.3% Median Sale vs List 24 Avg Days on Market 15 Sold Listings CONDO Condo & Townhomes
30
March2022 April2022 May2022 June2022 July2022August2022September2022October2022November2022December2022January2023February2023 March2023 400 300 200 100 0 March2022 April2022 May2022 June2022 July2022August2022September2022October2022November2022December2022January2023February2023 March2023 150 100 50 0 Hayward MARCH2022-MARCH2023 Single-Family Homes
12 months, year-over-year. Condos & Townhomes
Last
year-over-year. LISTINGS FOR SALE SOLD LISTINGS
Last 12 months,
Median SalesPrice
AVGDays OntheMarket
Single-Family
Theaveragetimespent onmarketwentupfrom9 dayslastMarch2022,to 23daysasofMarch2023.
Overbids
Single-Family Homes
Condos& Townhomes
Theoverbidpercentage hasdecreasedfrom 1054%lastMarch2022,to 983%ayearlater
BacktoTableofContents
March2022April2022May2022June2022July2022August2022September2022October2022November2022December2022January2023February2023March2023 $1,250,000 $1,000,000 $750,000 $500,000 $250,000 $0 March2022April2022May2022June2022 July2022August2022September2022October2022November2022December2022January2023February2023March2023 75 50 25 0 March2022April2022May2022June2022 July2022August2022September2022October2022November2022December2022January2023February2023March2023 125% 100% 75% 50% 25% 0%
Condos& Townhomes Themediansalesprice hasdecreasedfrom$767k lastMarch2022,to$642k asofMarch2023 Single-Family Homes Themediansalesprice
asofMarch2023
hasdecreasedfrom$11M lastMarch2022,to$875K
Townhomes
Condos&
Theaveragetimespent onmarketwentupfrom9 daysinMarch2022,to24 daysasofMarch2023. Homes
Theoverbidpercentage hasdecreasedfrom117.4% lastMarch2022,to1001% ayearlater

Oakland ALAMEDA COUNTY
What's in the Oakland data?
Currently,thereare491single-familyhomes forsale,providing1.4monthsofinventory. Therewere231newlistings,and156homes soldatamediansalepriceof$1m.The medianoverbidpercentagewas109.7%,with anaverageof31daysonthemarket.
Therearecurrently168condoand townhomeunitsforsale,providing1.6 monthsofinventory.Therewere69new listings,and45unitssoldatamediansale priceof$659k.Themedianoverbid percentagewas101.4%,withanaverageof 29daysonthemarket.

SFH Single-Family Homes
231 New Listings
156 Sold Listings
1.4 Months of Inventory
$1M Median Sale Price
109.7% Median Sale vs List
31 Avg Days on Market
Data includes all single family, townhome, and condominium sales in Alameda, Albany, Berkeley, Castro Valley, El Cerrito, El Sobrante, Emeryville, Fremont, Hayward, Lafayette, Moraga, Oakland, Orinda, Piedmont, San Leandro,SanPablo,ContraCostaCounty,Alamo,Concord,Danville,Pleasant Hill, and Walnut Creek sourced from Broker Metrics on March 3rd, and data sales in Napa and Sonoma sourced from Broker Metrics on April 18th Data from sources deemed reliable but may contain errors and are subject to revision © 2023 All rights reserved Each Office Is Independently Owned and Operated DRE#02029039

69 New Listings 1.6 Months of Inventory $659K Median Sale Price 101.4% Median Sale vs List 29 Avg Days on Market 45 Sold Listings CONDO Condo & Townhomes
March2022 April2022 May2022 June2022 July2022August2022September2022October2022November2022December2022January2023February2023 March2023 1000 750 500 250 0 March2022 April2022 May2022 June2022 July2022August2022September2022October2022November2022December2022January2023February2023 March2023 400 300 200 100 0 Oakland MARCH2022-MARCH2023 Single-Family Homes
12 months, year-over-year. Condos & Townhomes
Last
year-over-year. LISTINGS FOR SALE SOLD LISTINGS
Last 12 months,
Median SalesPrice
Themediansalesprice hasdecreasedfrom $109mlastMarch2022,to $101masofMarch2023
Overbids
Single-Family Homes
Theoverbidpercentage hasdecreasedfrom 1269%lastMarch2022,to 1097%ayearlater
Condos& Townhomes
Theoverbidpercentage hasdecreasedfrom 1032%lastMarch2022,to 101.4%ayearlater.
AVGDays OntheMarket
Theaveragetimespent onmarketwentupfrom17 dayslastMarch2022,to31 daysasofMarch2023
Theaveragetimespent onmarketwentupfrom 28daysinMarch2022,to 29daysasofMarch2023.
March2022April2022May2022June2022July2022August2022September2022October2022November2022December2022January2023February2023March2023 $1,500,000 $1,000,000 $500,000 $0 March2022April2022May2022June2022 July2022August2022September2022October2022November2022December2022January2023February2023March2023 60 40 20 0 March2022April2022May2022June2022 July2022August2022September2022October2022November2022December2022January2023February2023March2023 150% 100% 50% 0%
Condos& Townhomes Themediansalesprice hasdecreasedfrom $670klastMarch2022,to $659kasofMarch2023.
Single-Family Homes
Condos& Townhomes
Single-Family Homes
BacktoTableofContents

Piedmont
ALAMEDA COUNTY
What's in the Piedmont data?
Currently,thereare19single-familyhomes forsale,providing2.4monthsofinventory. Therewere14newlistings,and10homes soldatamediansalepriceof$2.6m.The medianoverbidpercentagewas109.6%,with anaverageof11daysonthemarket.
Thereiscurrentlynodataforthecondoand townhomemarket.

amily Homes
10 Sold Listings
ntory
6% s List
$2.6M Median Sale Price
11 Avg Days on Market
gle family, townhome, and condominium sales in eley, Castro Valley, El Cerrito, El Sobrante, Emeryville, afayette, Moraga, Oakland, Orinda, Piedmont, San ntraCostaCounty,Alamo,Concord,Danville,Pleasant sourced from Broker Metrics on March 3rd, and data noma sourced from Broker Metrics on April 18th Data reliable but may contain errors and are subject to hts reserved Each Office Is Independently Owned and 39
CONDO

Condo & Townhomes
No data for this month.
Single-Family
Last 12 months, year-over-year.
Condos
Last 12 months, year-over-year.
March2022 April2022 May2022 June2022 July2022August2022September2022October2022November2022December2022January2023February2023 March2023 60 40 20 0 March2022 April2022 May2022 June2022 July2022August2022September2022October2022November2022December2022January2023February2023 March2023 100 75 50 25 0 Piedmont MARCH2022-MARCH2023
Homes
& Townhomes
LISTINGS FOR SALE SOLD LISTINGS No data for this month.
Overbids
March2022April2022May2022June2022July2022August2022September2022October2022November2022December2022January2023February2023March2023 $4,000,000 $3,000,000 $2,000,000 $1,000,000 $0 March2022April2022May2022June2022 July2022August2022September2022October2022November2022December2022January2023February2023March2023 40 30 20 10 0 March2022April2022May2022June2022 July2022August2022September2022October2022November2022December2022January2023February2023March2023 125% 100% 75% 50% 25% 0% Median
Condos& Townhomes Single-Family Homes Themediansalesprice hasincreasedfrom$22m lastMarch2022,to$26m asofMarch2023
Condos& Townhomes Single-Family Homes Theaveragetimespent onmarketwentdown from12dayslastMarch 2022,to11daysasof March2023
SalesPrice
AVGDays OntheMarket
Condos& Townhomes Single-Family Homes Theoverbidpercentage hasdecreasedfrom 1228%lastMarch2022,to 1096%ayearlater BacktoTableofContents No data for this month No data for this month No data for this month

San Leandro
ALAMEDA COUNTY
What's in the San Leandro data?
Currently,thereare60single-familyhomes forsale,providing1monthofinventory. Therewere30newlistings,and31homes soldatamediansalepriceof$835k.The medianoverbidpercentagewas103.3%,with anaverageof22daysonthemarket.
Therearecurrently32condoandtownhome unitsforsale,providing1.7monthsof inventory.Therewere20newlistings,and8 unitssoldatamediansalepriceof$539k. Themedianoverbidpercentagewas101%, withanaverageof22daysonthemarket.

mes
1 d Listings
35K an Sale Price
2 Days on Market
nd condominium sales in rrito, El Sobrante, Emeryville, nd, Orinda, Piedmont, San ,Concord,Danville,Pleasant
ics on March 3rd, and data
r Metrics on April 18th Data
n errors and are subject to
s Independently Owned and
Con
2 New Listi
1. Months of Inven
101% Median Sale vs
2022November2022December2022January2023February2023 March2023 2022November2022December2022January2023February2023 March2023 o r. y y r. OLD LISTINGS
Median SalesPrice
Themediansalesprice hasdecreasedfrom$952k lastMarch2022,to$835k asofMarch2023
Overbids
Single-Family Homes
Theoverbidpercentage hasdecreasedfrom119% lastMarch2022,to1033% ayearlater
Condos& Townhomes
Theoverbidpercentage hasdecreasedfrom 106.8%lastMarch2022,to 101%ayearlater.
AVGDays OntheMarket
Theaveragetimespent onmarketwentupfrom9 dayslastMarch2022,to 22daysasofMarch2023.
Theaveragetimespent onmarketwentupfrom13 daysinMarch2022,to22 daysasofMarch2023
March2022April2022May2022June2022July2022August2022September2022October2022November2022December2022January2023February2023March2023 $1,250,000 $1,000,000 $750,000 $500,000 $250,000 $0 March2022April2022May2022June2022 July2022August2022September2022October2022November2022December2022January2023February2023March2023 60 40 20 0 March2022April2022May2022June2022 July2022August2022September2022October2022November2022December2022January2023February2023March2023 125% 100% 75% 50% 25% 0%
Condos& Townhomes
Homes
Themediansalesprice hasdecreasedfrom $550klastMarch2022,to $539kasofMarch2023. Single-Family
Condos& Townhomes
Single-Family Homes
BacktoTableofContents

ContraCostaCounty
COUNTYOVERVIEW
SFR,Condominiums,Townhouses
March2023
ComparingAveragePrice,MedianPrice,andHighestPrice/SF
March2023
Market
ContraCostaCounty COUNTYOVERVIEW SFR,Condominiums,Townhouses
ComparingNumberofSales,NumberofNewListings,andDayson
ContraCosta County
What's in the Contra Costa data?
Currently,thereare1,500single-family homesforsale,providing0.9monthsof inventory.Therewere792newlistings,and 617homessoldatamediansalepriceof $825k.Themedianoverbidpercentagewas 99.1%,withanaverageof26daysonthe market.
Therearecurrently439condoand townhomeunitsforsale,providing0.9 monthsofinventory.Therewere234new listings,and180unitssoldatamediansale priceof$580k.Themedianoverbid percentagewas100.3%,withanaverageof 25daysonthemarket.

SFH Single-Family Homes
792 New Listings
617 Sold Listings
0.9 Months of Inventory
$825K Median Sale Price
99.1% Median Sale vs List
26 Avg Days on Market
Data includes all single family, townhome, and condominium sales in Alameda, Albany, Berkeley, Castro Valley, El Cerrito, El Sobrante, Emeryville, Fremont, Hayward, Lafayette, Moraga, Oakland, Orinda, Piedmont, San Leandro,SanPablo,ContraCostaCounty,Alamo,Concord,Danville,Pleasant Hill, and Walnut Creek sourced from Broker Metrics on March 3rd, and data sales in Napa and Sonoma sourced from Broker Metrics on April 18th Data from sources deemed reliable but may contain errors and are subject to revision © 2023 All rights reserved Each Office Is Independently Owned and Operated DRE#02029039

25
Condo & Townhomes
234 New Listings 0.9 Months of Inventory $580K Median Sale Price 100.3% Median Sale vs List
Avg Days on Market 180 Sold Listings CONDO
Last
March2022 April2022 May2022 June2022 July2022August2022September2022October2022November2022December2022January2023February2023 March2023 4000 3000 2000 1000 0 March2022 April2022 May2022 June2022 July2022August2022September2022October2022November2022December2022January2023February2023 March2023 1000 750 500 250 0 ContraCostaCounty MARCH2022-MARCH2023 Single-Family Homes
12 months, year-over-year.
& Townhomes
Last
Condos
12 months, year-over-year. LISTINGS FOR SALE SOLD LISTINGS
Median SalesPrice
Single-Family Homes
Theaveragetimespent onmarketwentupfrom11 dayslastMarch2022,to 26daysasofMarch2023.
Overbids
Single-Family Homes
Theoverbidpercentage hasdecreasedfrom1117% lastMarch2022,to991%a yearlater
Condos& Townhomes
Theoverbidpercentage hasdecreasedfrom 1089%lastMarch2022,to 1003%ayearlater
Theaveragetimespent onmarketwentupfrom13 daysinMarch2022,to25 daysasofMarch2023
March2022April2022May2022June2022July2022August2022September2022October2022November2022December2022January2023February2023March2023 $1,000,000 $750,000 $500,000 $250,000 $0 March2022April2022May2022June2022 July2022August2022September2022October2022November2022December2022January2023February2023March2023 50 40 30 20 10 0 March2022April2022May2022June2022 July2022August2022September2022October2022November2022December2022January2023February2023March2023 125% 100% 75% 50% 25% 0%
Townhomes
Homes
Condos&
Themediansalesprice hasdecreasedfrom $583klastMarch2022,to $580kasofMarch2023. Single-Family
Themediansalesprice hasdecreasedfrom $950klastMarch2022,to $825kasofMarch2023 AVGDays OntheMarket
Condos& Townhomes
BacktoTableofContents

Alamo
CONTRA COSTA COUNTY
What's in the Alamo data?
Currently,thereare36single-familyhomes forsale,providing1.1monthsofinventory. Therewere24newlistings,and13homes soldatamediansalepriceof$2.4m.The medianoverbidpercentagewas98.3%,with anaverageof31daysonthemarket.
Therearecurrently3condoandtownhome unitsforsale,providing0.5monthsof inventory.Therewere2newlistings,and1 unitsoldatamediansalepriceof$1m.The medianoverbidpercentagewas91.7%,with anaverageof78daysonthemarket.

Homes
and condominium sales in Valley, El Cerrito, El Sobrante, Emeryville, aga, Oakland, Orinda, Piedmont, San ounty,Alamo,Concord,Danville,Pleasant Broker Metrics on March 3rd, and data from Broker Metrics on April 18th Data may contain errors and are subject to Each Office Is Independently Owned and
$2.4M Median Sale Price 13 Sold Listings
ownhome,
31 Avg Days on Market
2 New Listings

1 Sold Listings
0.5 Months of Inventory
$1M Median Sale Price
91.7% Median Sale vs List
78 Avg Days on Market
&
CONDO Condo
Townhomes
Last 12 months,
Condos
Last 12 months, year-over-year.
March2022 April2022 May2022 June2022 July2022August2022September2022October2022November2022December2022January2023February2023 March2023 75 50 25 0 March2022 April2022 May2022 June2022 July2022August2022September2022October2022November2022December2022January2023February2023 March2023 6 4 2 0 Alamo MARCH2022-MARCH2023
Homes
Single-Family
year-over-year.
& Townhomes
LISTINGS FOR SALE SOLD LISTINGS
Median SalesPrice
Single-Family
Theaveragetimespent onmarketwentupfrom4 dayslastMarch2022,to31 daysasofMarch2023.
Overbids
Single-Family Homes
Condos& Townhomes
Theoverbidpercentage hasincreasedfrom0% lastMarch2022,to91.7%a yearlater.
BacktoTableofContents
March2022April2022May2022June2022July2022August2022September2022October2022November2022December2022January2023February2023March2023 $4,000,000 $3,000,000 $2,000,000 $1,000,000 $0 March2022April2022May2022June2022 July2022August2022September2022October2022November2022December2022January2023February2023March2023 150 100 50 0 March2022April2022May2022June2022 July2022August2022September2022October2022November2022December2022January2023February2023March2023 125% 100% 75% 50% 25% 0%
Condos& Townhomes
hasincreasedfrom$0 lastMarch2022,to$1mas ofMarch2023
Homes
$24masofMarch2023
Townhomes
Themediansalesprice
Single-Family
Themediansalesprice hasdecreasedfrom $28mlastMarch2022,to
AVGDays OntheMarket Condos&
Theaveragetimespent onmarketwentupfrom4 daysinMarch2022,to78 daysasofMarch2023. Homes
Theoverbidpercentage hasdecreasedfrom103% lastMarch2022,to98.3%a yearlater.


%
Homes
62 Sold Listings
$792K Median Sale Price
16 Avg Days on Market
ly, townhome, and condominium sales in stro Valley, El Cerrito, El Sobrante, Emeryville, Moraga, Oakland, Orinda, Piedmont, San taCounty,Alamo,Concord,Danville,Pleasant from Broker Metrics on March 3rd, and data urced from Broker Metrics on April 18th Data but may contain errors and are subject to ved Each Office Is Independently Owned and
ily

26 New Listings 0.7 Months of Inventory $449K Median Sale Price 98.4% Median Sale vs List 27 Avg Days on Market 24 Sold Listings CONDO Condo & Townhomes
March2022 April2022 May2022 June2022 July2022August2022September2022October2022November2022December2022January2023February2023 March2023 400 300 200 100 0 March2022 April2022 May2022 June2022 July2022August2022September2022October2022November2022December2022January2023February2023 March2023 125 100 75 50 25 0 Concord MARCH2022-MARCH2023 Single-Family Homes
12 months, year-over-year. Condos & Townhomes
Last
year-over-year. LISTINGS FOR SALE SOLD LISTINGS
Last 12 months,
Median SalesPrice
Single-Family
AVGDays OntheMarket
Single-Family Homes
Theaveragetimespent onmarketwentupfrom12 dayslastMarch2022,to16 daysasofMarch2023.
Condos& Townhomes
Theaveragetimespent onmarketwentupfrom9 daysinMarch2022,to27 daysasofMarch2023
Overbids
Single-Family Homes
Theoverbidpercentage hasdecreasedfrom112.8% lastMarch2022,to100.3% ayearlater.
Condos& Townhomes
Theoverbidpercentage hasincreasedfrom16.6% lastMarch2022,to984% ayearlater
March2022April2022May2022June2022July2022August2022September2022October2022November2022December2022January2023February2023March2023 $1,000,000 $750,000 $500,000 $250,000 $0 March2022April2022May2022June2022 July2022August2022September2022October2022November2022December2022January2023February2023March2023 50 40 30 20 10 0 March2022April2022May2022June2022 July2022August2022September2022October2022November2022December2022January2023February2023March2023 125% 100% 75% 50% 25% 0%
Condos& Townhomes
hasincreasedfrom$435k
asofMarch2023
Themediansalesprice
lastMarch2022,to$449k
Homes
Themediansalesprice hasdecreasedfrom$935k lastMarch2022,to$792k asofMarch2023
BacktoTableofContents

Danville CONTRA COSTA COUNTY
What's in the Danville data?
Currently,thereare121single-familyhomes forsale,providing1.1monthsofinventory. Therewere83newlistings,and51homes soldatamediansalepriceof$2m.The medianoverbidpercentagewas96.6%,with anaverageof17daysonthemarket.
Therearecurrently18condoandtownhome unitsforsale,providing1monthofinventory. Therewere11newlistings,and13unitssold atamediansalepriceof$1m.Themedian overbidpercentagewas99.9%,withan averageof11daysonthemarket.

SFH ingle-Family Homes
83 ew Listings
51 Sold Listings
1.1 onths of Inventory
$2M Median Sale Price
96.6% edian Sale vs List
17 Avg Days on Market
ta includes all single family, townhome, and condominium sales in ameda, Albany, Berkeley, Castro Valley, El Cerrito, El Sobrante, Emeryville, emont, Hayward, Lafayette, Moraga, Oakland, Orinda, Piedmont, San andro,SanPablo,ContraCostaCounty,Alamo,Concord,Danville,Pleasant , and Walnut Creek sourced from Broker Metrics on March 3rd, and data es in Napa and Sonoma sourced from Broker Metrics on April 18th Data m sources deemed reliable but may contain errors and are subject to vision © 2023 All rights reserved Each Office Is Independently Owned and erated DRE#02029039

11 New Listings 1 Months of Inventory $1M Median Sale Price 99.9% Median Sale vs List 11 Avg Days on Market 13 Sold Listings CONDO Condo & Townhomes
Last
Last 12 months,
March2022 April2022 May2022 June2022 July2022August2022September2022October2022November2022December2022January2023February2023 March2023 300 200 100 0 March2022 April2022 May2022 June2022 July2022August2022September2022October2022November2022December2022January2023February2023 March2023 50 40 30 20 10 0 Danville MARCH2022-MARCH2023
Homes
Single-Family
12
year-over-year.
& Townhomes
months,
Condos
LISTINGS FOR SALE SOLD LISTINGS
year-over-year.
Median SalesPrice
Theaveragetimespent onmarketwentupfrom7 dayslastMarch2022,to17 daysasofMarch2023
Overbids
Single-Family Homes
Theoverbidpercentage hasdecreasedfrom115.9% lastMarch2022,to96.6% ayearlater.
Condos& Townhomes
Theoverbidpercentage hasdecreasedfrom112.8% lastMarch2022,to999% ayearlater
Theaveragetimespent onmarketwentdown from13daysinMarch 2022,to11daysasof March2023
March2022April2022May2022June2022July2022August2022September2022October2022November2022December2022January2023February2023March2023 $3,000,000 $2,000,000 $1,000,000 $0 March2022April2022May2022June2022 July2022August2022September2022October2022November2022December2022January2023February2023March2023 50 40 30 20 10 0 March2022April2022May2022June2022 July2022August2022September2022October2022November2022December2022January2023February2023March2023 125% 100% 75% 50% 25% 0%
Condos& Townhomes Themediansalesprice hasdecreasedfrom$12m
ofMarch2023
Homes Themediansalesprice
lastMarch2022,to$1mas
Single-Family
hasdecreasedfrom $24mlastMarch2022,to $2masofMarch2023 AVGDays OntheMarket Condos& Townhomes
Single-Family Homes
BacktoTableofContents

ElCerrito
CONTRA COSTA COUNTY
What's in the El Cerrito data?
Currently,thereare23single-familyhomes forsale,providing0.8monthsofinventory. Therewere13newlistings,and16homes soldatamediansalepriceof$1.1m.The medianoverbidpercentagewas109.9%,with anaverageof22daysonthemarket.
Therearecurrently7condoandtownhome unitsforsale,providing2monthsof inventory.Therewere2newlistings,and2 unitssoldatamediansalepriceof$735k. Themedianoverbidpercentagewas102.3%, withanaverageof24daysonthemarket.

on Market
dominium sales in Sobrante, Emeryville, da, Piedmont, San rd,Danville,Pleasant March 3rd, and data
s on April 18th Data and are subject to endently Owned and
M
ale Price ngs
Inven
102.3% Median Sale vs

New Listi Months of
Con
2022November2022December2022January2023February2023 March2023 2022November2022December2022January2023February2023 March2023 r. y y r. OLD LISTINGS
Median SalesPrice
Single-Family Homes
Themediansalesprice hasdecreasedfrom$1.2m lastMarch2022,to$1.1m asofMarch2023.
AVGDays OntheMarket
Single-Family Homes
Theaveragetimespent onmarketwentupfrom12 dayslastMarch2022,to 22daysasofMarch2023.
Condos& Townhomes
Theaveragetimespent onmarketwentdown from53daysinMarch 2022,to24daysasof March2023
Overbids
Single-Family Homes
Theoverbidpercentage hasdecreasedfrom 134.6%lastMarch2022,to 109.9%ayearlater.
Condos& Townhomes
Theoverbidpercentage hasdecreasedfrom 1058%lastMarch2022,to 1023%ayearlater
March2022April2022May2022June2022July2022August2022September2022October2022November2022December2022January2023February2023March2023 $1,500,000 $1,000,000 $500,000 $0 March2022April2022May2022June2022 July2022August2022September2022October2022November2022December2022January2023February2023March2023 200 150 100 50 0 March2022April2022May2022June2022 July2022August2022September2022October2022November2022December2022January2023February2023March2023 150% 100% 50% 0%
Condos& Townhomes Themediansalesprice hasdecreasedfrom $850klastMarch2022,to $735kasofMarch2023
BacktoTableofContents

ElSobrante
CONTRA COSTA COUNTY
What's in the El Sobrante data?
Currently,thereare24single-familyhomes forsale,providing0.6monthsofinventory. Therewere9newlistings,and7homessold atamediansalepriceof$820k.Themedian overbidpercentagewas92.4%,withan averageof39daysonthemarket.
Therearecurrently3condoandtownhome unitsforsale,providing0monthsof inventory.Therewere0newlistings,and0 unitssoldatamediansalepriceof$0.The medianoverbidpercentagewas0%,withan averageof0daysonthemarket.

He-Family Homes
ngs
6 of Inventory
7 Sold Listings
$820K Median Sale Price
.4% Sale vs List
39 Avg Days on Market
s all single family, townhome, and condominium sales in any, Berkeley, Castro Valley, El Cerrito, El Sobrante, Emeryville, ward, Lafayette, Moraga, Oakland, Orinda, Piedmont, San Pablo,ContraCostaCounty,Alamo,Concord,Danville,Pleasant ut Creek sourced from Broker Metrics on March 3rd, and data and Sonoma sourced from Broker Metrics on April 18th Data deemed reliable but may contain errors and are subject to 23 All rights reserved Each Office Is Independently Owned and #02029039

Mon Me
023February2023 March2023 2023February2023 March2023 y y S
Median SalesPrice
Theaveragedayson marketwentupfrom10 dayslastMarch2022,to 39daysasofMarch2023.
Overbids
Single-Family Homes
Theoverbidpercentage hasdecreasedfrom114% lastMarch2022,to92.4%a yearlater.
Condos& Townhomes
Theoverbidpercentage hasdecreasedfrom101.3% lastMarch2022,to0%a yearlater.
Theaveragedayson marketwentdownfrom 42daysinMarch2022,to 0daysasofMarch2023
March2022April2022May2022June2022July2022August2022September2022October2022November2022December2022January2023February2023March2023 $1,000,000 $750,000 $500,000 $250,000 $0 March2022April2022May2022June2022 July2022August2022September2022October2022November2022December2022January2023February2023March2023 60 40 20 0 March2022April2022May2022June2022 July2022August2022September2022October2022November2022December2022January2023February2023March2023 125% 100% 75% 50% 25% 0%
Condos& Townhomes Themediansalesprice hasdecreasedfrom$318k lastMarch2022,to$0as ofMarch2023
Homes
Single-Family
Themediansalesprice hasdecreasedfrom$931k lastMarch2022,to$820k asofMarch2023 AVGDays OntheMarket Condos& Townhomes
Single-Family Homes
BacktoTableofContents

Lafayette
CONTRA COSTA COUNTY
What's in the Lafayette data?
Currently,thereare43single-familyhomes forsale,providing1monthofinventory. Therewere25newlistings,and11homes soldatamediansalepriceof$1.8m.The medianoverbidpercentagewas99.7%,with anaverageof10daysonthemarket.
Therearecurrently11condoandtownhome unitsforsale,providing1.5monthsof inventory.Therewere11newlistings,and3 unitssoldatamediansalepriceof$1.3m. Themedianoverbidpercentagewas93.8%, withanaverageof74daysonthemarket.

SFH Single-Family Homes
25 New Listings
11 Sold Listings
1 Months of Inventory
$1.8M Median Sale Price
99.7% Median Sale vs List
10 Avg Days on Market
Data includes all single family, townhome, and condominium sales in Alameda, Albany, Berkeley, Castro Valley, El Cerrito, El Sobrante, Emeryville, Fremont, Hayward, Lafayette, Moraga, Oakland, Orinda, Piedmont, San Leandro,SanPablo,ContraCostaCounty,Alamo,Concord,Danville,Pleasant Hill, and Walnut Creek sourced from Broker Metrics on March 3rd, and data sales in Napa and Sonoma sourced from Broker Metrics on April 18th Data from sources deemed reliable but may contain errors and are subject to revision © 2023 All rights reserved Each Office Is Independently Owned and Operated DRE#02029039
CONDO

Condo & Townhomes
11 New Listings
3 Sold Listings
1.5 Months of Inventory
$1.3M Median Sale Price
93.8% Median Sale vs List
74 Avg Days on Market
Last
Last 12 months, year-over-year.
March2022 April2022 May2022 June2022 July2022August2022September2022October2022November2022December2022January2023February2023 March2023 125 100 75 50 25 0 March2022 April2022 May2022 June2022 July2022August2022September2022October2022November2022December2022January2023February2023 March2023 20 15 10 5 0 Lafayette MARCH2022-MARCH2023
Homes
Single-Family
year-over-year.
& Townhomes
12 months,
Condos
LISTINGS FOR SALE SOLD LISTINGS
Median SalesPrice
Single-Family
Themediansalesprice hasdecreasedfrom $2.6mlastMarch2022,to $1.8masofMarch2023.
AVGDays OntheMarket
Single-Family Homes
Theaveragetimespent onmarkethasnot changedfrom10daysin March2022,to10daysas ofMarch2023
Condos& Townhomes
Theaveragetimespent onmarketwentupfrom21 daysinMarch2022,to74 daysasofMarch2023.
Overbids
Single-Family Homes
Theoverbidpercentage hasdecreasedfrom1149% lastMarch2022,to997%a yearlater
Condos& Townhomes
Theoverbidpercentage hasdecreasedfrom 100.3%lastMarch2022,to 93.8%ayearlater.
March2022April2022May2022June2022July2022August2022September2022October2022November2022December2022January2023February2023March2023 $3,000,000 $2,000,000 $1,000,000 $0 March2022April2022May2022June2022 July2022August2022September2022October2022November2022December2022January2023February2023March2023 100 75 50 25 0 March2022April2022May2022June2022 July2022August2022September2022October2022November2022December2022January2023February2023March2023 125% 100% 75% 50% 25% 0%
Townhomes
hasincreasedfrom$1.2m
Condos&
Themediansalesprice
lastMarch2022,to$13m asofMarch2023
Homes
BacktoTableofContents

Moraga
What's in the Moraga data?
Currently,thereare18single-familyhomes forsale,providing0.7monthsofinventory. Therewere13newlistings,and6homessold atamediansalepriceof$2m.Themedian overbidpercentagewas107.5%,withan averageof10daysonthemarket.
Therearecurrently2condoandtownhome unitsforsale,providing0monthsof inventory.Therewere0newlistings,and1 unitsoldatasalepriceof$750k.The overbidpercentagewas98%,withan averageof17daysonthemarket.
 CONTRA COSTA COUNTY
Hle-Family Homes
tings
7 of Inventory
6 Sold Listings
$2M Median Sale Price
7.5% Sale vs List
10 Avg Days on Market
es all single family, townhome, and condominium sales in bany, Berkeley, Castro Valley, El Cerrito, El Sobrante, Emeryville, ayward, Lafayette, Moraga, Oakland, Orinda, Piedmont, San nPablo,ContraCostaCounty,Alamo,Concord,Danville,Pleasant nut Creek sourced from Broker Metrics on March 3rd, and data pa and Sonoma sourced from Broker Metrics on April 18th Data s deemed reliable but may contain errors and are subject to 023 All rights reserved Each Office Is Independently Owned and RE#02029039

0 New Listings 0 Months of Inventory $75 Median Sa 98% Median Sale vs List Avg Days on Sold COND Condo & Townho
May2022 June2022 July2022August2022September2022October2022November2022December2022January2023February2023 March2023 May2022 June2022 July2022August2022September2022October2022November2022December2022January2023February2023 March2023 raga 022-MARCH2023 amily Homes onths, year-over-year. & Townhomes onths, year-over-year.
FOR SALE SOLD LISTINGS
GS
Median SalesPrice
Single-Family Homes
Themediansalesprice hasdecreasedfrom $2.2mlastMarch2022,to $2masofMarch2023.
Condos& Townhomes
Themediansalesprice hasincreasedfrom$686k lastMarch2022,to$750k asofMarch2023.
Overbids
Single-Family Homes
Theoverbidpercentage hasdecreasedfrom122.1% lastMarch2022,to107.5% ayearlater.
Condos& Townhomes
Theoverbidpercentage hasdecreasedfrom1145% lastMarch2022,to98%a yearlater
AVGDays OntheMarket
Single-Family Homes
Theaveragetimespent onmarketwentupfrom9 dayslastMarch2022,to10 daysasofMarch2023.
Condos& Townhomes
Theaveragetimespent onmarketwentupfrom9 daysinMarch2022,to17 daysasofMarch2023
March2022April2022May2022June2022July2022August2022September2022October2022November2022December2022January2023February2023March2023 $3,000,000 $2,000,000 $1,000,000 $0 March2022April2022 May2022June2022 July2022August2022September2022October2022November2022December2022January2023February2023 50 40 30 20 10 0 March2022April2022May2022June2022 July2022August2022September2022October2022November2022December2022January2023February2023March2023 125% 100% 75% 50% 25% 0%
BacktoTableofContents

Orinda CONTRA
COSTA COUNTY
What's in the Orinda data?
Currently,thereare43single-familyhomes forsale,providing0.8monthsofinventory. Therewere26newlistings,and20homes soldatamediansalepriceof$1.8m.The medianoverbidpercentagewas97%,with anaverageof20daysonthemarket.
Therearecurrently3condoandtownhome unitsforsale,providing0.5monthsof inventory.Therewere2newlistings,and1 unitsoldatamediansalepriceof$580k. Themedianoverbidpercentagewas122.1%, withanaverageof2daysonthemarket.

inium sales in ante, Emeryville, Piedmont, San anville,Pleasant h 3rd, and data April 18th Data are subject to ntly Owned and
M
s
Price
Market
2 New Listings
1 Sold Listings
0.5 Months of Inventory
$580K Median Sale Price

122.1% Median Sale vs List
2 Avg Days on Market
Condo & Townhomes
CONDO
Single-Family Homes
Last 12 months, year-over-year.
Condos & Townhomes
Last 12 months, year-over-year.
March2022 April2022 May2022 June2022 July2022August2022September2022October2022November2022December2022January2023February2023 March2023 100 75 50 25 0 March2022 April2022 May2022 June2022 July2022August2022September2022October2022November2022December2022January2023February2023 March2023 8 6 4 2 0 Orinda MARCH2022-MARCH2023
LISTINGS FOR SALE SOLD LISTINGS
Median SalesPrice
Overbids
Single-Family Homes
Theoverbidpercentage hasdecreasedfrom113.4% lastMarch2022,to97%a yearlater.
Condos& Townhomes
Theoverbidpercentage hasincreasedfrom116.1% lastMarch2022,to1221% ayearlater
AVGDays OntheMarket
Single-Family Homes
Theaveragetimespent onmarketwentupfrom12 dayslastMarch2022,to 20daysasofMarch2023.
Theaveragetimespent onmarketwentdown from5daysinMarch 2022,to2daysasof March2023
March2022April2022May2022June2022July2022August2022September2022October2022November2022December2022January2023February2023March2023 $2,500,000 $2,000,000 $1,500,000 $1,000,000 $500,000 $0 March2022April2022May2022June2022 July2022August2022September2022October2022November2022December2022January2023February2023March2023 75 50 25 0 March2022April2022May2022June2022 July2022August2022September2022October2022November2022December2022January2023February2023March2023 125% 100% 75% 50% 25% 0%
Condos& Townhomes
Themediansalesprice hasdecreasedfrom$13m lastMarch2022,to$580k asofMarch2023
Single-Family Homes Themediansalesprice hasdecreasedfrom$2.1m lastMarch2022,to$1.8m asofMarch2023.
Condos& Townhomes
BacktoTableofContents

Pleasant Hill
CONTRA COSTA COUNTY
What's in the Pleasant Hill data?
Currently,thereare40single-familyhomes forsale,providing0.9monthsofinventory. Therewere28newlistings,and20homes soldatamediansalepriceof$979k.The medianoverbidpercentagewas100.9%,with anaverageof13daysonthemarket.
Therearecurrently9condoandtownhome unitsforsale,providing1.2monthsof inventory.Therewere8newlistings,and7 unitssoldatamediansalepriceof$620k. Themedianoverbidpercentagewas101.2%, withanaverageof12daysonthemarket.

SFH Single-Family Homes
28 New Listings
20 Sold Listings
0.9 Months of Inventory
$979K Median Sale Price
100.9% Median Sale vs List
13 Avg Days on Market
Data includes all single family, townhome, and condominium sales in Alameda, Albany, Berkeley, Castro Valley, El Cerrito, El Sobrante, Emeryville, Fremont, Hayward, Lafayette, Moraga, Oakland, Orinda, Piedmont, San Leandro,SanPablo,ContraCostaCounty,Alamo,Concord,Danville,Pleasant Hill, and Walnut Creek sourced from Broker Metrics on March 3rd, and data sales in Napa and Sonoma sourced from Broker Metrics on April 18th Data from sources deemed reliable but may contain errors and are subject to revision © 2023 All rights reserved Each Office Is Independently Owned and Operated DRE#02029039
8 New Listings

7 Sold Listings
1.2 Months of Inventory
$620K Median Sale Price 101.2% Median Sale vs List 12 Avg Days on Market
Condo & Townhomes
CONDO
Last 12 months,
Condos
Last 12 months, year-over-year.
March2022 April2022 May2022 June2022 July2022August2022September2022October2022November2022December2022January2023February2023 March2023 125 100 75 50 25 0 March2022 April2022 May2022 June2022 July2022August2022September2022October2022November2022December2022January2023February2023 March2023 50 40 30 20 10 0 PleasantHill MARCH2022-MARCH2023
Homes
Single-Family
year-over-year.
& Townhomes
LISTINGS FOR SALE SOLD LISTINGS
Median SalesPrice
Themediansalesprice hasdecreasedfrom$12m lastMarch2022,to$979k asofMarch2023
Themediansalesprice hasdecreasedfrom $682klastMarch2022,to $620kasofMarch2023.
Overbids
Single-Family Homes
Theoverbidpercentage hasdecreasedfrom114.3% lastMarch2022,to100.9% ayearlater.
Condos& Townhomes
Theoverbidpercentage hasdecreasedfrom110% lastMarch2022,to1012% ayearlater
Single-Family Homes
Theaveragetimespent onmarketwentupfrom8 dayslastMarch2022,to12 daysasofMarch2023.
Condos& Townhomes
Theaveragetimespent onmarketwentupfrom10 daysinMarch2022,to12 daysasofMarch2023
March2022April2022May2022June2022July2022August2022September2022October2022November2022December2022January2023February2023March2023 $1,500,000 $1,000,000 $500,000 $0 March2022April2022May2022June2022 July2022August2022September2022October2022November2022December2022January2023February2023March2023 60 40 20 0 March2022April2022May2022June2022 July2022August2022September2022October2022November2022December2022January2023February2023March2023 125% 100% 75% 50% 25% 0%
Condos& Townhomes
Single-Family Homes
AVGDays OntheMarket
BacktoTableofContents

SanPablo
CONTRA COSTA COUNTY
What's in the San Pablo data?
Currently,thereare29single-familyhomes forsale,providing0.7monthsofinventory. Therewere12newlistings,and11homessold atamediansalepriceof$555k.Themedian overbidpercentagewas97.2%,withan averageof32daysonthemarket.
Therearecurrently3condoandtownhome unitsforsale,providing2monthsof inventory.Therewas1newlisting,and3units soldatamediansalepriceof$365k.The medianoverbidpercentagewas97.2%,with anaverageof214daysonthemarket.

mes
1 d Listings
555K ian Sale Price
2 Days on Market
and condominium sales in errito, El Sobrante, Emeryville, and, Orinda, Piedmont, San mo,Concord,Danville,Pleasant etrics on March 3rd, and data ker Metrics on April 18th Data ain errors and are subject to Is Independently Owned and
1 New Listings

214
CONDO Condo & Townhomes
2 Months of Inventory $365K Median Sale Price 97.2% Median Sale vs List
Avg Days on Market 3 Sold Listings
Single-Family Homes
Last 12 months, year-over-year.
Condos & Townhomes
Last 12 months, year-over-year.
March2022 April2022 May2022 June2022 July2022August2022September2022October2022November2022December2022January2023February2023 March2023 100 75 50 25 0 March2022 April2022 May2022 June2022 July2022August2022September2022October2022November2022December2022January2023February2023 March2023 25 20 15 10 5 0 SanPablo MARCH2022-MARCH2023
LISTINGS FOR SALE SOLD LISTINGS
Median SalesPrice
Themediansalesprice hasdecreasedfrom$700k lastMarch2022,to$555k asofMarch2023
OntheMarket
Single-Family
Theaveragetimespent onmarketwentupfrom15 dayslastMarch2022,to 32daysasofMarch2023.
Overbids
Single-Family Homes
Theoverbidpercentage hasdecreasedfrom 110.70%lastMarch2022,to 97.2%ayearlater.
Condos& Townhomes
Theoverbidpercentage hasdecreasedfrom 1098%lastMarch2022,to 972%ayearlater
Theaveragetimespent onmarketwentupfrom31 daysinMarch2022,to214 daysasofMarch2023.
March2022April2022May2022June2022July2022August2022September2022October2022November2022December2022January2023February2023March2023 $750,000 $500,000 $250,000 $0 March2022April2022May2022June2022 July2022August2022September2022October2022November2022December2022January2023February2023March2023 250 200 150 100 50 0 March2022April2022May2022June2022 July2022August2022September2022October2022November2022December2022January2023February2023March2023 125% 100% 75% 50% 25% 0%
Condos& Townhomes Themediansalesprice hasdecreasedfrom
Homes
$507klastMarch2022,to $365kasofMarch2023 Single-Family
AVGDays
Condos& Townhomes
Homes
BacktoTableofContents

WalnutCreek
CONTRA COSTA COUNTY
What's in the Walnut Creek data?
Currently,thereare78single-familyhomes forsale,providing1.3monthsofinventory. Therewere40newlistings,and38homes soldatamediansalepriceof$1.5m.The medianoverbidpercentagewas99.2%,with anaverageof17daysonthemarket.
Therearecurrently168condoand townhomeunitsforsale,providing0.8 monthsofinventory.Therewere90new listings,and70unitssoldatamediansale priceof$615k.Themedianoverbid percentagewas102.5%,withanaverageof 27daysonthemarket.

SFH Single-Family Homes
40 New Listings
38 Sold Listings
1.3 Months of Inventory
$1.5M Median Sale Price
99.2% Median Sale vs List
17 Avg Days on Market
Data includes all single family, townhome, and condominium sales in Alameda, Albany, Berkeley, Castro Valley, El Cerrito, El Sobrante, Emeryville, Fremont, Hayward, Lafayette, Moraga, Oakland, Orinda, Piedmont, San Leandro,SanPablo,ContraCostaCounty,Alamo,Concord,Danville,Pleasant Hill, and Walnut Creek sourced from Broker Metrics on March 3rd, and data sales in Napa and Sonoma sourced from Broker Metrics on April 18th Data from sources deemed reliable but may contain errors and are subject to revision © 2023 All rights reserved Each Office Is Independently Owned and Operated DRE#02029039

90 New Listings
Median
Median Sale vs List
CONDO Condo & Townhomes
0.8 Months of Inventory $615K
Sale Price 102.5%
27 Avg Days on Market 70 Sold Listings
Last
Last 12 months,
March2022 April2022 May2022 June2022 July2022August2022September2022October2022November2022December2022January2023February2023 March2023 250 200 150 100 50 0 March2022 April2022 May2022 June2022 July2022August2022September2022October2022November2022December2022January2023February2023 March2023 400 300 200 100 0 WalnutCreek MARCH2022-MARCH2023
Homes
Single-Family
year-over-year.
& Townhomes
12 months,
Condos
LISTINGS FOR SALE SOLD LISTINGS
year-over-year.
Median SalesPrice
Overbids
Single-Family Homes
Theoverbidpercentage hasdecreasedfrom113.5% lastMarch2022,to99.2%a yearlater.
Condos& Townhomes
Theoverbidpercentage hasdecreasedfrom108% lastMarch2022,to102.5% ayearlater.
AVGDays OntheMarket
Theaveragetimespent onmarketwentupfrom8 dayslastMarch2022,to17 daysasofMarch2023.
Theaveragetimespent onmarketwentupfrom12 daysinMarch2022,to27 daysasofMarch2023
March2022April2022May2022June2022July2022August2022September2022October2022November2022December2022January2023February2023March2023 $2,000,000 $1,500,000 $1,000,000 $500,000 $0 March2022April2022May2022June2022 July2022August2022September2022October2022November2022December2022January2023February2023March2023 40 30 20 10 0 March2022April2022May2022June2022 July2022August2022September2022October2022November2022December2022January2023February2023March2023 125% 100% 75% 50% 25% 0%
Condos& Townhomes Themediansalesprice hasdecreasedfrom
$615kasofMarch2023.
Homes
$639klastMarch2022,to
Single-Family
Themediansalesprice hasdecreasedfrom$16m lastMarch2022,to$15m asofMarch2023
Condos& Townhomes
Single-Family Homes
BacktoTableofContents

Napa
What's in the Napa data?
Currently,thereare25single-familyhomes forsale,providing1.9monthsofinventory. Therewere12newlistings,and6homessold atamediansalepriceof$724k.Themedian overbidpercentagewas96.3%,withan averageof35daysonthemarket.
Therearecurrentlynocondosforsale, inventory,newlistings,orcondosales reportedinMarchandJanuary.

He-Family Homes
ngs of Inventory
6 Sold Listings
$724K Median Sale Price
.3% Sale vs List
35 Avg Days on Market
s all single family, townhome, and condominium sales in any, Berkeley, Castro Valley, El Cerrito, El Sobrante, Emeryville, ward, Lafayette, Moraga, Oakland, Orinda, Piedmont, San Pablo,ContraCostaCounty,Alamo,Concord,Danville,Pleasant ut Creek sourced from Broker Metrics on March 3rd, and data and Sonoma sourced from Broker Metrics on April 18th Data deemed reliable but may contain errors and are subject to 23 All rights reserved Each Office Is Independently Owned and #02029039
COND
Condo & Townho
No data for this month.

Last 12 months, year-over-year.
Last 12 months, year-over-year.
May2022 June2022 July2022August2022September2022October2022November2022December2022January2023February2023 March2023 May2022 June2022 July2022August2022September2022October2022November2022December2022January2023February2023 March2023 LISTINGS FOR SALE SOLD LISTINGS Napa
MARCH2022-MARCH2023
Single-Family Homes
Condos & Townhomes
Median SalesPrice
Themediansalesprice hasdecreasedfrom$937k lastMarch2022,to$724k asofMarch2023
AVGDays OntheMarket
Theaveragetimespent onmarketwentdown from8dayslastMarch 2022,to35daysasof March2023.
Condos& Townhomes
Theaveragetimespent onmarketwentdown from5daysinMarch 2022,to0daysasof March2023.
Overbids
Single-Family Homes
Theoverbidpercentage hasdecreasedfrom 103.2%lastMarch2022,to 96.3%ayearlater.
Condos& Townhomes
Theoverbidpercentage hasdecreasedfrom104.1% lastMarch2022,to0%a yearlater.
March2022April2022May2022June2022July2022August2022September2022October2022November2022December2022January2023February2023March2023 $4,000,000 $3,000,000 $2,000,000 $1,000,000 $0 March2022April2022May2022June2022 July2022August2022September2022October2022November2022December2022January2023February2023March2023 100 75 50 25 0 March2022April2022May2022June2022 July2022August2022September2022October2022November2022December2022January2023February2023March2023 125% 100% 75% 50% 25% 0%
Townhomes
Condos&
Themediansalesprice hasdecreasedfrom$774k lastMarch2022,to$0as ofMarch2023.
Single-Family Homes
Single-Family Homes
BacktoTableofContents

Sonoma
What's in the Sonoma data?
Currently,thereare22single-familyhomes forsale,providing1monthofinventory. Therewere5newlistings,and8homessold atamediansalepriceof$750k.Themedian overbidpercentagewas93.3%,withan averageof118daysonthemarket.
Therearecurrently1condoandtownhome unitsforsale,providing0monthofinventory. Therewas1newlisting,and1unitsoldata mediansalepriceof$895k.Themedian overbidpercentagewas110.3%,withan averageof0daysonthemarket.

ory
% st
8 Sold Listings
$750K Median Sale Price
118
Avg Days on Market
family, townhome, and condominium sales in , Castro Valley, El Cerrito, El Sobrante, Emeryville, ette, Moraga, Oakland, Orinda, Piedmont, San CostaCounty,Alamo,Concord,Danville,Pleasant rced from Broker Metrics on March 3rd, and data a sourced from Broker Metrics on April 18th Data able but may contain errors and are subject to eserved Each Office Is Independently Owned and
mily
Homes

1 New Listings 0 Months of Inventory $895K Median Sale Price 110.3% Median Sale vs List 0 Avg Days on Market 1 Sold Listings CONDO Condo & Townhomes
Single-Family
Last 12 months,
Condos
Last 12 months, year-over-year.
March2022 April2022 May2022 June2022 July2022August2022September2022October2022November2022December2022January2023February2023 March2023 50 40 30 20 10 0 March2022 April2022 May2022 June2022 July2022August2022September2022October2022November2022December2022January2023February2023 March2023 8 6 4 2 0 Sonoma MARCH2022-MARCH2023
Homes
year-over-year.
&
Townhomes
LISTINGS FOR SALE SOLD LISTINGS
Median SalesPrice
Single-Family Homes
Themediansalesprice hasdecreasedfrom $949klastMarch2022,to $750kasofMarch2023
Condos& Townhomes
Themediansalesprice hasincreasedfrom$420k lastMarch2022,to$895k asofMarch2023.
Overbids
Single-Family Homes
Theoverbidpercentage hasdecreasedfrom 107.8%lastMarch2022,to 93.3%ayearlater.
Condos& Townhomes
Theoverbidpercentage hasincreasedfrom104.9% lastMarch2022,to110.3% ayearlater.
Single-Family Homes Theaveragetimespent onmarketwentupfrom11 dayslastMarch2022,to 118daysasofMarch2023.
Condos& Townhomes Nodataforthismonth.
March2022April2022May2022June2022July2022August2022September2022October2022November2022December2022January2023February2023March2023 $1,000,000 $750,000 $500,000 $250,000 $0 March2022April2022May2022June2022 July2022August2022September2022October2022November2022December2022January2023February2023March2023 125 100 75 50 25 0 March2022April2022May2022June2022 July2022August2022September2022October2022November2022December2022January2023February2023March2023 125% 100% 75% 50% 25% 0%
AVGDays OntheMarket
BacktoTableofContents
Team of Succes and Excellence
Weareanindependentl operatedfranchiseofKe RealtyInternational.Our teamconsistsofmoreth associatesandprofessio officesstrategicallyloca Alameda,andCastroVa territoryfromCrockettd andthroughthetunnelt Ourownershipgroupha theCaliforniacoastlinef SanDiego.


Withuncompromisingp officehasestablisheda ofexcellencewithinthei company’sgrowthhasb andexciting.Sinceopen 2016,theteamhassucce representedmorethan5 transactions,totalingmo billionintotalsales.
Dedicatedtoupholding standardsforintegritya theystrivetocreateacu agentsthrivew ownbusinesse potential.Thec
© 2023. All rights reserved. Each Office Is Operated. DRE#02029039. This information distributed without Keller Williams consent. Data and Broker Metrics. While information is believed of accuracy. All data, including all measurements obtained from various sources and has not been, Keller Williams or MLS.
agentsover$1,


2437SantaClaraAve,Alameda,CA94609 KellerWilliamsAlameda 20273PatioDrive,CastroValley,CA94546 KellerWilliamsCastroValley 4937TelegraphAve.SuiteAOakland,CA94609 KellerWilliamsEastBay :
