Fatemah Nikchehi - September 2024 Market Report | San Francisco Bay Area
San Francisco Bay area
Jump to Alameda Report Alameda
Contra Costa
Jump to Contra Costa Report
Jump to Napa Report Napa County
San Francisco County
Jump to San Francisco County Report
San Mateo
Jump to San Mateo Report
Santa Clara
Jump to Santa Clara Report
Solano County
Jump to Solano Report
Sonoma County
Jump to Sonoma Report
Jump to Marin Report Southern/Central Marin
What’syourhome reallyworthin today’smarket?
That's the question you should be asking yourself.
Our market is incredibly diverse and rapidly changing. Values vary not just by neighborhood but by street. Your home isn't necessarily worth what your neighbors' home is. It's the current market that sets the value of your home.
So, do you know what your home is worth in today's market?
Icanhelp...
Contact me for a confidential, no obligation assessment of your home's value.
TiptheScale
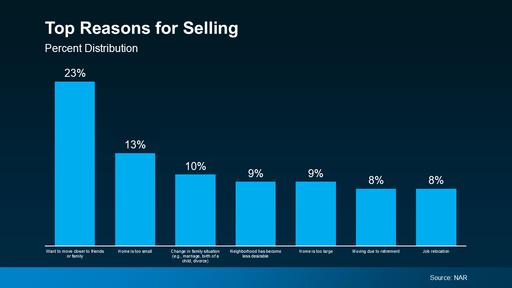
Are you on the fence about whether to sell your house now or hold off? It’s a common dilemma, but here’s a key point to consider: your lifestyle might be the biggest factor in your decision. While financial aspects are important, sometimes the personal motivations for moving are reason enough to make the leap sooner rather than later.
An annual report from the National Association of Realtors (NAR) offers insight into why homeowners like you chose to sell. All of the top reasons are related to life changes. As the graph below highlights:
Smart Strategies for a Mortgage Application
Avoid paying off debts or collections without professional advice.
Don't have your credit report pulled too many times - this can hurt your credit score. 3 4 5 6 1 2
Always consult your mortgage professional before making large financial moves. Use verified funds for deposits to prevent closing delays.
PROTECT
WHAT YOU DON’T EXPECT
You can’t always see a breakdown coming, but you can plan for it with American Home Shield. Our home service plans help fix or replace covered home systems and appliances, and help you stay on budget. Protect what you don’t expect.
CLICK HERE TO WATCH THE VIDEO
Looking to lighten the mood in your laundry room?
EIGHTEYECATCHING
Laundry Room Colors
To Look Out For
These refreshing colors make the wash-and-dry chore a little more pleasant.
Tranquil Blue
View it here
Sage Green
View it here
Eight Colrs fo Laundry
White
View it here
Yellow
View it here
Gray
View it here
Dusty Pink
View it here
View it here
Navy Blue Purple
View it here
Create a tranquil laundry space with Benjamin Moore's Beach Glass Its light blue shade, coupled with a subtle gray undertone, offers a clean and versatile aesthetic that avoids any baby nursery associations.
Transform your space with earthy tones like October Mist and Gloucester Sage from Benjamin Moore. Test out the trendy sage in your laundry room for a lowcommitment update easy to change and customize, ensuring lasting satisfaction with your design choice.
Create an elegant laundry room with Chantilly Lace by Benjamin Moore The classic white choice adds sophistication, opens up the space, and simplifies stain detection.
Elevate your laundry space with the energizing touch of yellow. Behr's Roasted Corn or Upbeat bring warmth and optimism, while Pearly White offers a mellow option a yellow-based white that brings a perfect harmony of vibrancy and calmness
Gray remains a top choice for laundry room walls, providing a timeless and serene backdrop A soft gray for a whisper of sophistication, easily personalized with printed patterned tile flooring or Behr's bold 2024 Color of the Year, Cracked Pepper.
Sherwin-Williams' Rosebud for a touch of romance in laundry rooms. The dusty pink hue, paired with gold accents, adds a luxurious and warm atmosphere
Navy as the key to a striking laundry room. Beyond lighter blues, navy paired with lighter accents or white fixtures, especially Benjamin Moore's Hale Navy, creates a bold choice that makes the laundry room stand out.
Dare to take a style risk in your laundry room with a pop of color Opt for the subtle smoky lavender of Farrow & Ball's Peignoir for a neutral touch or go all-out glam with Backdrop's dark and vampy McQueen, drawing inspiration from the famous fashion designer.
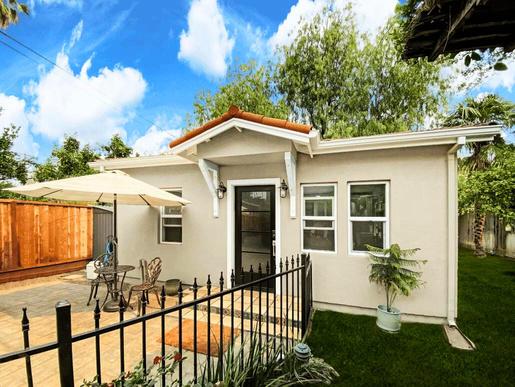
Adding an Accessory Dwelling Unit (ADU) boosts your property value and adds living space. Choose the right partner to ensure your project is smooth and successful.
Choose Expertise Over Inexperience
Building an ADU needs more than construction skills; it requires knowledge of local rules and design. Trust Acton ADU's expertise to avoid mistakes and ensure a seamless process.
Verify
Your ADU Partner’s Credentials
Check that your contractor knows ADU design and local rules to avoid errors. Choose someone with a strong track record in ADU projects.
Conduct Thorough Site Assessments
Not every property suits ADUs. Use experts for site assessments to avoid costly mistakes.
Put Your Trust in The Right Company
Acton ADU has been successfully helping homeowners achieve their property goals for over 35 years. Making the wrong choice in the ADU market can lead to serious financial setbacks. ADUs aren't always ways, but Acton ADU can make it feel that way.
START YOUR ADU PROJECT RIGHT
VENDOR DIRECTORY
When it comes to home ownership, knowing who you can trust is crucial. That's why we've curated a select list of trusted vendors who are ready to help with your home goals.
Alameda
What's in the Alameda data?
There were 2,045 single-family homes for sale, providing 1.5 months of inventory. There were 891 new listings, and 664 homes sold at a median price of $1.2m. The median overbid percentage was at 105%, with an average of 24 days on the market.
There were 987 condo and townhome units for sale, providing 2 7 months of inventory There were 362 new listings and 219 units sold at a median sale price of $700k. The median overbid percentage was at 99.6%, with an average of 29 days on the market.
SFH
Single-Family Homes
891 New Listings
664 Sold Listings
1.5 Months of Inventory
$1.2M Median Sale Price
105% Median Sale vs List
24 Avg Days on Market
The data, sourced from InfoSparks, includes all single-family homes, condos and townhomes in the California Area above from August 2023 to August 2024. This may include preliminary data, and may vary from the time the data was gathered. All data is deemed reliable but not guaranteed. DRE# 01995149. Copyright KW Advisors San Francisco | Napa Valley 2024. Each office is independently owned and operated.
AlamedaCounty
AUGUST 2023 - AUGUST 2024
le-Family Homes
12 months, year-over-year.
dos & Townhomes
12 months, year-over-year
Single-Family Homes
The median sale price has increased from $1 25m last August 2023, to $1 255m as of August 2024
Condos & Townhomes
The median sale price has decreased from $717k last August 2023, to $700k as of August 2024
AVGDays OntheMarket
Single-Family Homes
The average time spent on the market went up from 17 days last August 2023, to 24 days as of August 2024
Condos & Townhomes
The average time spent on the market went up from 24 days in August 2023, to 29 days as of August 2024.
Overbids
Single-Family Homes
The overbid percentage has decreased from 105 9% last August 2023, to 105% a year later
Condos & Townhomes
The overbid percentage has decreased from 101% last August 2023, to 99.6% a year later.
Contra Costa
What's in the Contra Costa data?
There were 1,227 single-family homes for sale, providing 2 months of inventory. There were 844 new listings, and 666 homes sold at a median price of $849k. The median overbid percentage was at 100 1%, with an average of 27 days on the market.
There were 491 condo and townhome units for sale, providing 2.8 months of inventory. There were 285 new listings and 187 units sold at a median sale price of $600k. The median overbid percentage was at 100%, with an average of 40 days on the market
Single-Family Homes
844
New Listings
666 Sold Listings
2 Months of Inventory
$849K
Median Sale Price
100.1%
Median Sale vs List
27
Avg Days on Market
The data, sourced from InfoSparks, includes all single-family homes, condos and townhomes in the California Area above from August 2023 to August 2024. This may include preliminary data, and may vary from the time the data was gathered. All data is deemed reliable but not guaranteed. DRE# 01995149. Copyright KW Advisors San Francisco | Napa Valley 2024. Each office is independently owned and operated.
AUGUST 2023 - AUGUST 2024
Median SalesPrice
Single-Family Homes
The median sale price has increased from $836k last August 2023, to $849k as of August 2024
Condos & Townhomes
The median sale price has remained the same from $600k last August 2023, to $600k as of August 2024
AVGDays OntheMarket
Single-Family Homes
The average time spent on the market went up from 21 days last August 2023, to 27 days as of August 2024
Condos & Townhomes
The average time spent on the market went up from 23 days in August 2023, to 40 days as of August 2024.
Overbids
Single-Family Homes
The overbid percentage has decreased from 101 4% last August 2023, to 100 1% a year later
Condos & Townhomes
The overbid percentage has remained the same from 100% last August 2023, to 100% a year later.
Napa County
What's in the Napa data?
There were 332 single-family providing 4.7 months of inve new listings, and 64 homes s of $989k. The median overbi 99 1%, with an average of 58
There were 49 condo and tow sale, providing 5.1 months of were 20 new listings and 10 sale price of $641k. The med percentage was at 100%, wit days on the market.
homes, condos and August 2024. This may was gathered. All data is Copyright KW Advisors San Francisco | Napa Valley 2024. Each office is independently owned and operated.
Condo & Townhomes
20
New Listings
10
Sold Listings
5.1
Months of Inventory
$641K
Median Sale Price 100%
Median Sale vs List 76 Avg Days on Market
apaCounty
AUGUST 2023 - AUGUST 2024
TINGS FOR SALE SOLD LISTINGS
Family Homes
months, year-over-year. & Townhomes
months, year-over-year
Median SalesPrice
Single-Family Homes
The median sale price has decreased from $1m last August 2023, to $989k as of August 2024
Condos & Townhomes
The median sale price has decreased from $665k last August 2023, to $641k as of August 2024
AVGDays OntheMarket
Single-Family Homes
The average time spent on the market went up from 54 days last August 2023, to 58 days as of August 2024
Condos & Townhomes
The average time spent on the market went up from 33 days in August 2023, to 76 days as of August 2024.
Overbids
Single-Family
Homes
The overbid percentage has decreased from 100% last August 2023, to 99 1% a year later
Condos & Townhomes
The overbid percentage has remained the same from 100% last August 2023, to 100% a year later.
San Francisco County
What's in the San Francisco County data?
There were 219 single-family homes for sale, providing 1.2 months of inventory. There were 188 new listings, and 154 homes sold at a median price of $1.5m. The median overbid percentage was at 108%, with an average of 32 days on the market.
There were 592 condo and townhome units for sale, providing 3.5 months of inventory. There were 246 new listings and 151 units sold at a median sale price of $1m. The median overbid percentage was at 99.5%, with an average of 61 days on the market.
Single-Family Homes
188 New Listings
154 Sold Listings
1.2 Months of Inventory
$1.5M Median Sale Price
107.6%
Median Sale vs List
32 Avg Days on Market
The data, sourced from InfoSparks, includes all single-family homes, condos and townhomes in the California Area above from August 2023 to August 2024. This may include preliminary data, and may vary from the time the data was gathered. All data is deemed reliable but not guaranteed. DRE# 01995149. Copyright KW Advisors San Francisco | Napa Valley 2024. Each office is independently owned and operated.
Condo & Townhomes
246
New Listings
151 Sold Listings
3.5
Months of Inventory
$1M
Median Sale Price 99.5%
Median Sale vs List
61 Avg Days on Market
SanFranciscoCounty
AUGUST 2023 - AUGUST 2024
LISTINGS FOR SALE SOLD LISTINGS
Single-Family Homes
Last 12 months, year-over-year.
Condos & Townhomes
Last 12 months, year-over-year
Median SalesPrice
Single-Family Homes
The median sale price has decreased from $1 57m last August 2023, to $1 54m as of August 2024
Condos & Townhomes
The median sale price has decreased from $1 1m last August 2023, to $1m as of August 2024
AVGDays OntheMarket
Single-Family Homes
The average time spent on the market went down from 35 days last August 2023, to 32 days as of August 2024
Condos & Townhomes
The average time spent on the market went up from 58 days in August 2023, to 61 days as of August 2024.
Overbids
Single-Family Homes
The overbid percentage has increased from 102 8% last August 2023, to 108% a year later
Condos & Townhomes
The overbid percentage has increased from 99.4% last August 2023, to 99.5% a year later.
SanMateo County
What's in the San Mateo County data?
There were 451 single-family homes for sale, providing 1.5 months of inventory. There were 417 new listings, and 319 homes sold at a median price of $1.7m. The median overbid percentage was at 104 2%, with an average of 24 days on the market.
There were 219 condo and townhome units for sale, providing 2.4 months of inventory. There were 141 new listings and 97 units sold at a median sale price of $910k. The median overbid percentage was at 100%, with an average of 37 days on the market
Single-Family Homes
417 New Listings
319 Sold Listings
1.5 Months of Inventory
$1.7M Median Sale Price
104.2%
Median Sale vs List
24 Avg Days on Market
The data, sourced from InfoSparks, includes all single-family homes, condos and townhomes in the California Area above from August 2023 to August 2024. This may include preliminary data, and may vary from the time the data was gathered. All data is deemed reliable but not guaranteed. DRE# 01995149. Copyright KW Advisors San Francisco | Napa Valley 2024. Each office is independently owned and operated.
141 New Listings
Median Sale vs List 37 Avg Days on Market 97 Sold Listings
2.4 Months of Inventory $910K Median Sale Price
SanMateoCounty
AUGUST 2023 - AUGUST 2024
LISTINGS FOR SALE SOLD LISTINGS
Single-Family Homes
Last 12 months, year-over-year.
Condos & Townhomes
Last 12 months, year-over-year
Median SalesPrice
Single-Family Homes
The median sale price has decreased from $1 785m last August 2023, to $1 78m as of August 2024
Condos & Townhomes
The median sale price has decreased from $1m last August 2023, to $910k as of August 2024
AVGDays OntheMarket
Single-Family Homes
The average time spent on the market went down from 28 days last August 2023, to 24 days as of August 2024
Condos & Townhomes
The average time spent on the market went down from 48 days in August 2023, to 37 days as of August 2024.
Overbids
Single-Family Homes
The overbid percentage has increased from 101 1% last August 2023, to 104 2% a year later
Condos & Townhomes
The overbid percentage has remained the same from 100% last August 2023, to 100% a year later.
Santa Coun
What's in the County data?
There were 794 single providing 1.2 months new listings, and 738 price of $1.8m. The m was at 103%, with an market.
There were 525 condo sale, providing 1.8 mo were 429 new listings median sale price of $ percentage was at 10 days on the market
38 Listings
s single-family homes, condos and 2023 to August 2024. This may the data was gathered. All data is 01995149. Copyright KW Advisors San Francisco | Napa Valley 2024. Each office is independently owned and operated.
1.8M an Sale Price
9 Days on Market
Condo & Townhomes
429
New Listings
290 Sold Listings
1.8
Months of Inventory
$1M
Median Sale Price
100.1%
Median Sale vs List
24 Avg Days on Market
antaClaraCounty
AUGUST 2023 - AUGUST 2024
TINGS FOR SALE SOLD LISTINGS
Family Homes
2 months, year-over-year.
s & Townhomes
2 months, year-over-year
Median SalesPrice
Single-Family Homes
The median sale price has increased from $1 82m last August 2023, to $1 83m as of August 2024
Condos & Townhomes
The median sale price has increased from $950k last August 2023, to $1m as of August 2024
AVGDays OntheMarket
Single-Family Homes
The average time spent on the market went up from 18 days last August 2023, to 19 days as of August 2024
Condos & Townhomes
The average time spent on the market went up from 19 days in August 2023, to 24 days as of August 2024.
Overbids
Single-Family Homes
The overbid percentage has decreased from 104% last August 2023, to 103% a year later
Condos & Townhomes
The overbid percentage has decreased from 102.3% last August 2023, to 100.1% a year later.
Solano County
What's in the Solano County data?
There were 631 single-family homes for sale providing 2.2 months of inventory. There we new listings, and 284 homes sold at a media price of $600k. The median overbid percenta was at 100%, with an average of 41 days on market.
There were 70 condo and townhome units fo sale, providing 2.6 months of inventory. Ther were 29 new listings and 26 units sold at a m sale price of $372k. The median overbid percentage was at 100%, with an average of days on the market
He-Family Homes
7 ngs
284 Sold Listings
2 f Inventory
$600K Median Sale Price
0% ale vs List
41 Avg Days on Market
sourced from InfoSparks, includes all single-family homes, condos and the California Area above from August 2023 to August 2024. This may minary data, and may vary from the time the data was gathered. All data is reliable but not guaranteed. DRE# 01995149. Copyright KW Advisors San Francisco | Napa Valley 2024. Each office is independently owned and operated.
AUGUST 2023 - AUGUST 2024
NGS FOR SALE SOLD LISTINGS
amily Homes months, year-over-year. & Townhomes months, year-over-year
Median SalesPrice
Single-Family Homes
The median sale price has increased from $595k last August 2023, to $600k as of August 2024
Condos & Townhomes
The median sale price has increased from $370k last August 2023, to $372k as of August 2024
AVGDays OntheMarket
Single-Family Homes
The average time spent on the market went up from 28 days last August 2023, to 41 days as of August 2024
Condos & Townhomes
The average time spent on the market went up from 28 days in August 2023, to 54 days as of August 2024.
Overbids
Single-Family Homes
The overbid percentage has remained the same from 100% last August 2023, to 100% a year later
Condos & Townhomes
The overbid percentage has remained the same from 100% last August 2023, to 100% a year later.
Son Cou
What's in
There were 82 providing 2.7 m new listings, a price of $819k was at 100%, w market. There were 96 sale, providing were 43 new li sale price of $ percentage wa days on the m
and may data is San
Median Sale vs List Avg Days
AUGUST 2023 - AUGUST 2024
INGS FOR SALE SOLD LISTINGS
amily Homes months, year-over-year. & Townhomes months, year-over-year
Median SalesPrice
Single-Family Homes
The median sale price has decreased from $850k last August 2023, to $819k as of August 2024
Condos & Townhomes
The median sale price has decreased from $485k last August 2023, to $470k as of August 2024
AVGDays OntheMarket
Single-Family Homes
The average time spent on the market went up from 47 days last August 2023, to 52 days as of August 2024
Condos & Townhomes
The average time spent on the market went up from 20 days in August 2023, to 52 days as of August 2024.
Overbids
Single-Family Homes
The overbid percentage has remained the same from 100% last August 2023, to 100% a year later
Condos & Townhomes
The overbid percentage has decreased from 101.5% last August 2023, to 100% a year later.
HFamily Homes
129 Sold Listings
from InfoSparks, includes all single-family homes, condos and California Area above from August 2023 to August 2024. This may data, and may vary from the time the data was gathered. All data is but not guaranteed. DRE# 01995149. Copyright KW Advisors San Francisco | Napa Valley 2024. Each office is independently owned and operated. s ventory
$1.4M Median Sale Price
% vs List
40 Avg Days on Market
34
New Listings
28 Sold Listings
2.6
Months of Inventory
$801K
Median Sale Price 98.8%
Median Sale vs List 82 Avg Days on Market
S/CMarin
AUGUST 2023 - AUGUST 2024
LISTINGS FOR SALE SOLD LISTINGS
Single-Family Homes
Last 12 months, year-over-year.
Condos & Townhomes
Last 12 months, year-over-year
Median SalesPrice
Single-Family Homes
The median sale price has decreased from $1 5m last August 2023, to $1 4m as of August 2024
Condos & Townhomes
The median sale price has decreased from $840k last August 2023, to $801k as of August 2024
AVGDays OntheMarket
Single-Family Homes
The average time spent on the market went up from 34 days last August 2023, to 40 days as of August 2024
Condos & Townhomes
The average time spent on the market went up from 56 days in August 2023, to 82 days as of August 2024.
Overbids
Single-Family Homes
The overbid percentage has remained the same from 100% last August 2023, to 100% a year later
Condos & Townhomes
The overbid percentage has decreased from 100% last August 2023, to 98.8% a year later.