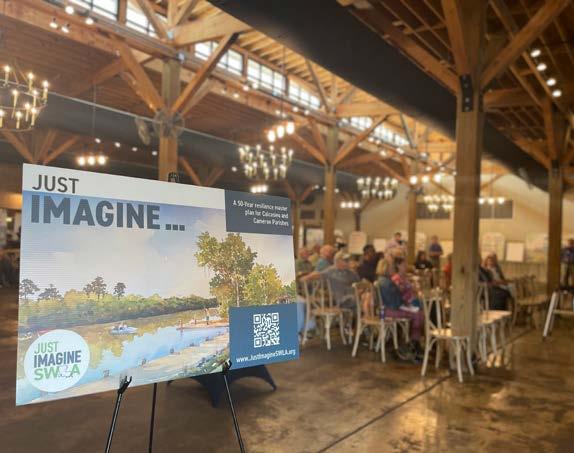
JUST IMAGINE SWLA
A 50-Year Resilience Master Plan for Calcasieu and Cameron Parishes

December 2022
©2022 URBAN DESIGN ASSOCIATES
BACK COVER — INTENTIONALLY LEFT BLANK

LEAD
Community Foundation Southwest Louisiana
FUNDED BY
Angela and David Filo
PARTNERS
Parishes and Municipalities
Calcasieu Parish Police Jury
Cameron Parish Police Jury
City of Lake Charles
City of Westlake
City of Sulphur
City of DeQuincy
Town of Vinton
Town of Iowa
Other Partners
Alliance for Positive Growth
Arts & Humanities Council of SWLA
Calcasieu Parish Public Library
Calcasieu Parish School Board
Cameron Parish School Board
Chennault International Airport
FEMA
Green Infrastructure Center
Lake Charles Housing Authority
Louisiana Office of Community Development
McNeese State University
National Park Service – Rivers, Trails & Conservation
Assistance Program
Phoenix Group
Port of Cameron
Port of Lake Charles
Project Build a Future
SOWELA Technical Community College
SWLA Economic Development Alliance
Visit Lake Charles
Ward 3 Marshal’s Office
West Cal Event Center
ADVISORY COMMITTEE MEMBERS
Kara Bonsall
Coastal Zone Administrator
Cameron Parish Police Jury
Lauren Boring
Project Specialist — Planning & Development
City of Lake Charles
Alberto Galan
Assistant to the Administrator
Calcasieu Parish Police Jury
Sandra Gunner
Special Projects Manager
Louisiana Office of Community Development
Dr. Shannon LaFarge
Superintendent
Calcasieu Parish School Board
Angie Manning
Vice President of Communications
Visit Lake Charles
Nicole Miller
Program Manager — Disaster Housing Recovery
Calcasieu Parish Police Jury
Willie Mount
Former Mayor of Lake Charles, Former State Senator
Glenn Pumpelly
Pumpelly Tire Company
Jim Rock
Executive Director, Lake Area Industry Alliance
Wade Rousse
VP of University Advancement and Executive VP
McNeese Foundation
Marshall Simien
Attorney, Simien Law Firm
Kenny Stinson
Former Mayor of Town of Vinton
Bart Yakupzack
Attorney, Jack Lawton Companies
PLANNING CONSULTANT
Project Lead
Urban Design Associates
Subconsultant Team
Stantec
Franklin Associates
Dr. Daniel Groft
Dr. James Richardson
WHLC Architecture
Hurricane Laura made landfall in Cameron Parish, Louisiana on August 27, 2020 as a Category 4 hurricane. With sustained wind speeds of 150 miles per hour, it tied as the strongest hurricane on record to hit Louisiana. The storm caused over $19 billion in damage in the state of Louisiana according to the National Oceanic and Atmospheric Administration (NOAA). Calcasieu and Cameron parishes experienced up to nine feet of storm surge and extreme winds, which caused catastrophic damage to utilities, residential and commercial buildings and roofs, mature trees, and critical facilities.
While the region was struggling to recover from Hurricane Laura, Hurricane Delta made landfall in Cameron Parish on October 9, just nine miles east of where Hurricane Laura hit only six weeks earlier. The region was already in a state of emergency, with the majority of people displaced and thousands of homes with tarped roofs. Tarps and debris
from Laura were blown away and even more homes were destroyed by rainfall and flooding.
In February 2021, Calcasieu and Cameron parishes were impacted by the uncharacteristic winter storms that affected numerous Southern states. SWLA experienced frozen power lines, burst water pipes, and iced roads. This caused leaks in the water distribution system, resulting in low or no water pressure for a week in the City of Lake Charles, which impacted critical facilities and residents. The problem was exacerbated due to the significant number of vacant homes and buildings.
On May 17, 2021, severe storms and tornadoes caused flash flooding with more than 12 inches of rainfall impacting Calcasieu Parish. Quickly rising waters enveloped cars and made roads and neighborhoods unsafe. Over half the roads in the parish were under some water. The storm marked the
Southwestern Louisiana was ravaged by four consecutive federally declared major disasters in 10 months in 2020 and 2021. The region emerged with a united resolve to rebuild a stronger, more resilient, and vibrant community.
third most rainfall in a single day in Lake Charles’s history and more rain fell than during either Hurricane Laura or Delta.
Together, these disasters devastated the region and traumatized the residents and business owners of Southwest Louisiana. They placed an urgent emphasis on the need to rebuild more resiliently to bolster the region against future storms.
Recognizing the pressing need to build a resilient future for his hometown region, Moss Bluff native and co-founder of Yahoo!, David Filo and his wife Angela, made a generous donation of $2.5 million to the Community Foundation Southwest Louisiana. The Foundation engaged stakeholders to determine the path forward — a master plan for Calcasieu and Cameron parishes. This led to a national request for proposal to vet world-class planning firms for this once in a generation opportunity. Urban Design
Associates and its Louisiana-based team was eventually selected from the five firms that submitted proposals.
The Just Imagine SWLA process launched publicly in October 2021, a little over one year after Hurricane Laura. Despite being in the middle of personal crises and stressful situations, over 2,500 people across Calcasieu and Cameron parishes gave generously and passionately of their time and ideas to drive a collective vision for the future of the region. What resulted was a strong consensus about the types of projects that will catalyze positive change in quality of life, housing, infrastructure, and the economy. Political leadership, the parishes and municipalities, large employers and other economic engines, non-profits, and residents are united and committed to implementing the recommendations laid out in this master plan.
Together the region imagined what is possible for Southwest Louisiana and committed to making those visions a reality.
Process Overview
Resident, community, and local leadership input formed the foundation on which the 50-Year Resilience Master Plan recommendations stand. A 10-month community engagement process was laid out in three steps:
• Step 1 — Understanding
• Step 2 — Testing
• Step 3 — Feasibility & Deciding
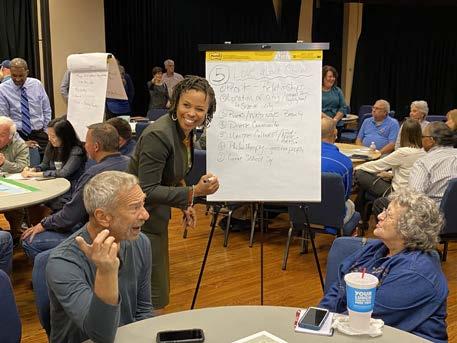
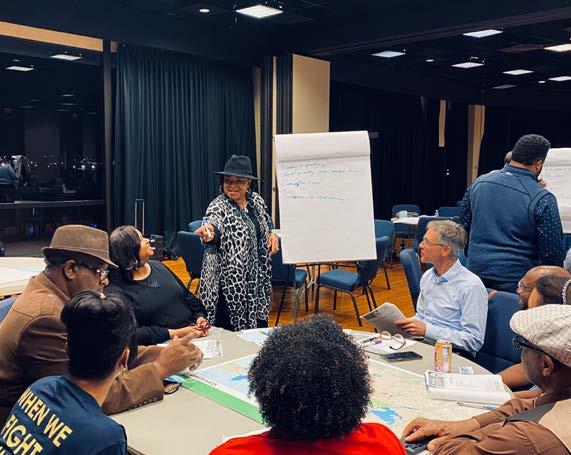
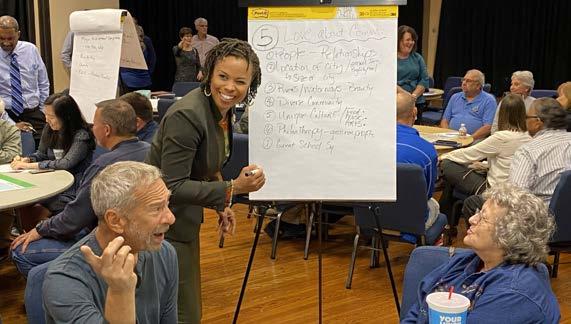
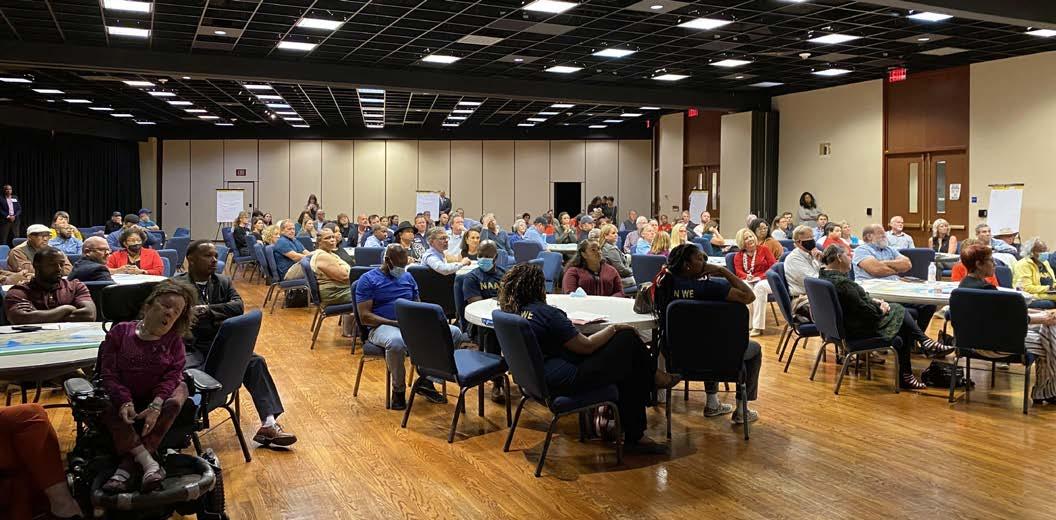
During each step of the process, there were in-person, online, text, and small group opportunities for engagement and participation. Each round of in-person meetings were held in three locations to make it easier for residents to participate — one meeting in Lake Charles, one meeting in West Calcasieu Parish, and one meeting in Cameron Parish. Detailed summaries of the input during each step were shared with the community to confirm priorities.
2,500+
7,320+ people participated comments and ideas were received
Guiding Groups
In-Person Public Meetings
Types of Engagement
Online Idea Wall
Online Interactive Map
Surveys (Including Youth Surveys)
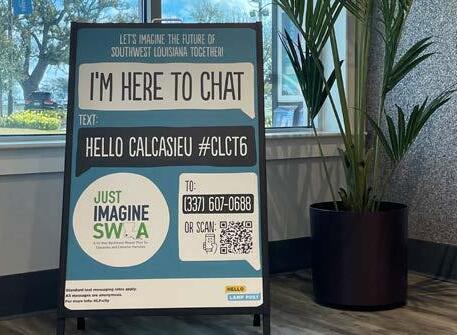
Hello Lamp Post
Ambassador Meetings
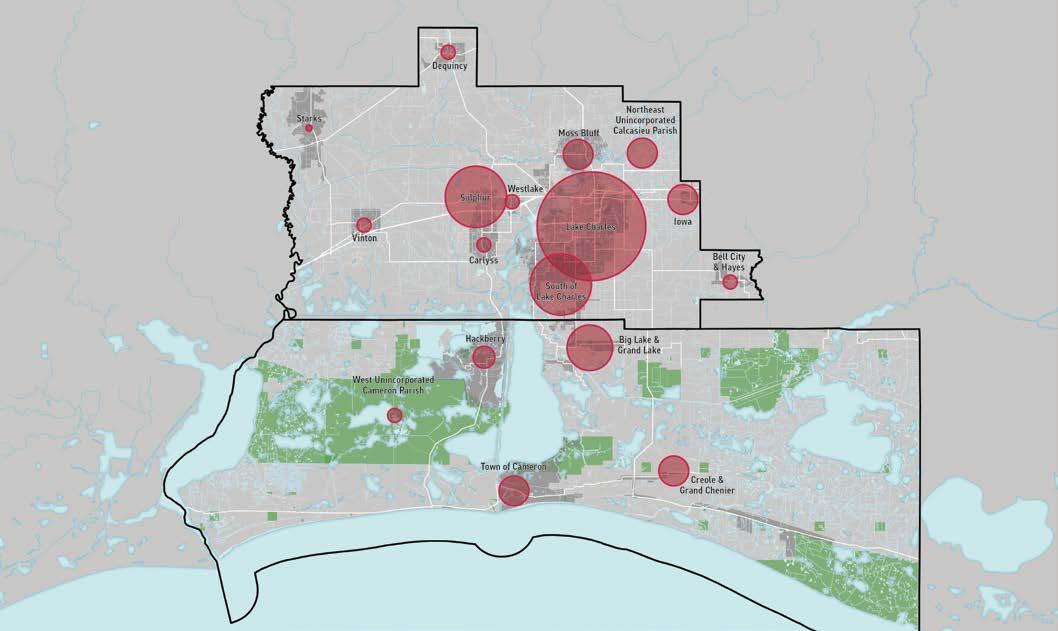
The geographical focus for Just Imagine SWLA is Calcasieu and Cameron parishes. The Lake Charles MSA is contiguous with the boundaries of Calcasieu and Cameron parishes, which is important demographically. The population of the two parishes was 222,402 in 2020 and estimated at 210,362 in 2021. The Lake Charles MSA had the largest percentage drop in population due to migration in the country during this time period.
Calcasieu and Cameron parishes were the most heavily impacted by the 2020 and 2021 disasters. However, the Just Imagine SWLA projects and recommendations are intended to be broadly applicable to all five parishes in Southwest Louisiana, including Allen, Beauregard, and Jefferson Davis parishes.
Southwest Louisiana is home to large liquefied natural gas (LNG) and petrochemical industries. These employers attract skilled process engineers and drive the regional economy, especially during the construction of new plants and facilities. However, a troubling trend has emerged that affects both the large industries as well as smaller contributors to the regional economy. Concerns about the resilience of the region’s infrastructure, the aesthetics of the major commercial corridors, and the quality of life options for families and individuals have made it difficult to attract and retain employees and residents. Until this process, residents have felt resigned to accept the current conditions or
may not have had an opportunity to broadly impact the decisions about investments that could improve quality of life. What the region looks like impacts who chooses to invest; the types of jobs available impacts how stable the region is during downturns; the options for entertainment, dining, shopping, and recreation impact whether families choose to move or stay; and the availability of housing determines who can afford to live in SWLA.
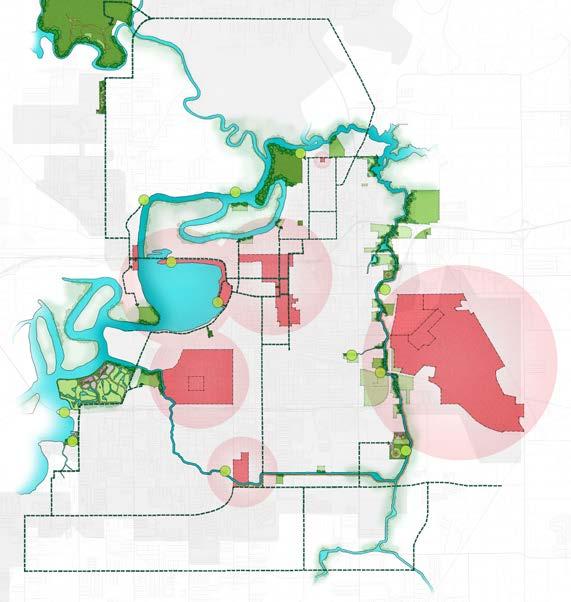
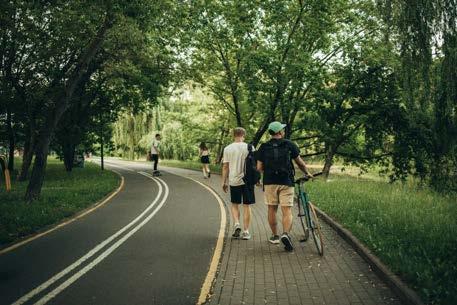
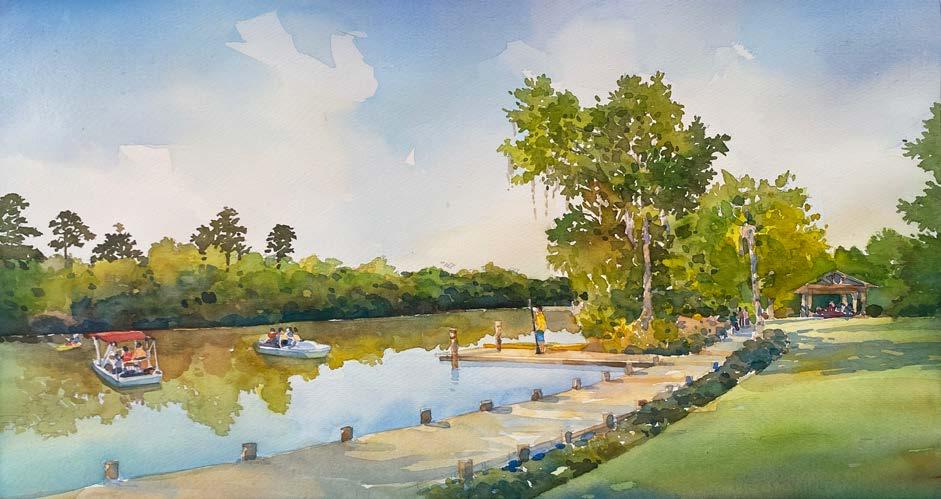
Bayou Greenbelt is a community-led project supported by the Community Foundation SWLA and the National Park Service. The future greenway and blueway will include a 23-mile water loop around Lake Charles that will expand public recreational access and enhance hidden natural features that are not currently accessible. The project will build trails on public land adjacent to waterways for walking, running, biking, and paddling. Bayou Greenbelt will have a measurable impact on the quality of life in Calcasieu Parish and the region.
Five of the 10 catalytic projects connect to the Bayou Greenbelt, capitalizing on economic development and quality of life enhancements:
The priorities emerged from the Strengths, Weaknesses, and Visions exercise in Step 1: Understanding. This included input gathered across both Calcasieu and Cameron parishes from in-person, online, and text engagement.
The Just Imagine: 50-Year Resilience Master Plan intentionally aligned the plan topics with five of the six Recovery Support Functions (RSFs) in the Calcasieu Parish Police Jury Hurricanes Laura and Delta Long-Term Community Recovery Plan. The five plan topics in the 50-Year Resilience Master Plan are:
1. Community Planning
2. Housing
3. Economic Development
4. Infrastructure
5. Natural and Cultural Resources
Within each topic area, the Advisory Committee and Guiding Groups developed and affirmed a set of goals to direct the selection of catalytic projects and the plan recommendations in the following chapters of this master plan.
The community reviewed and confirmed these vision statements and specific goals throughout the process, affirming their relevance as the overarching framework of the master plan. The goals serve as the benchmarks for assuring projects and policies achieve the community’s visions.
Collaborative community planning that focuses on implementing a better quality of life.
Resilient housing in attractive neighborhoods that people can afford and access.
A diverse and strong economy that adapts to stresses and provides all residents and businesses with the opportunity to thrive.
Reliable and resilient infrastructure that improves the quality of life and makes the region safer.
A region that fully celebrates and protects its unique natural and cultural resources.
1. Work together to implement a common vision
2. Invest to ensure Calcasieu and Cameron parishes are clean, safe, and beautiful
3. Create a more walkable and bikeable region
4. Make the region attractive to families and youth
5. Make it easy and clear for developers to implement the community’s vision
1. Educate people about the best practices for resilient housing, including retrofitting existing buildings
2. Increase the construction and supply of housing
3. Stabilize and enhance existing neighborhoods
4. Build new resilient housing and neighborhoods
5. Build economically integrated and mixedincome housing to ensure that everyone can afford a quality place to live
1. Maintain the strong economic sectors in Calcasieu and Cameron parishes
2. Diversify the economy and make it more resilient by expanding to new sectors
3. Build a resilient workforce development pipeline
4. Enhance destinations and connections to the amenities that will encourage people to visit Calcasieu and Cameron parishes and support local businesses
1. Upgrade the capacity of, protect, and harden existing infrastructure
2. Develop new infrastructure to be resilient and minimize future risk
3. Provide safe and reliable connections to critical facilities and community resources
4. Implement regional standards for infrastructure
5. Scale streets to work for people
1. Make the region’s natural beauty and outdoor activities more accessible and family-friendly
2. Reduce coastal risk
3. Enhance and create dedicated spaces for gathering and cultural events
4. Expand SWLA’s network of parks, green spaces, and trails
5. Preserve natural areas and protect air and water quality
The 10 catalytic projects were selected through a deliberate and comprehensive process to ensure they were impactful and implementable. This entailed:
• Performing a qualitative analysis of the themes in the Step 1 Understanding engagement data by project topic area and geography
• Tracking suggestions for projects in community input and Guiding Group meetings
• Developing a common definition for ‘catalytic’ and a set of metrics and criteria
• Vetting potential catalytic projects with the advisory committee
• Confirming the selected projects with the community through multiple feedback loops
The catalytic projects are intended to be highly visible projects that can be funded and implemented in the first 1–10 years to jump-start economic growth and improve infrastructure and quality of life. There are two categories of projects:
• Projects 1–6 are location-specific. They will be implemented in key locations based on geographical and ecological assets like the waterways, opportunities for economic growth, and locations of anchor institutions. These projects can serve as examples for similar projects at a smaller scale throughout SWLA.
• Projects 7–10 apply across both parishes. They will be implemented in multiple locations in Calcasieu and Cameron parishes, as well as in the other parishes of Southwest Louisiana.
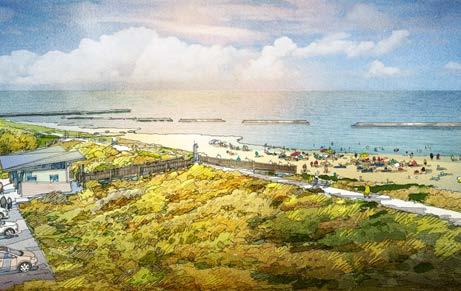
Sealevel rise and increased intensity of tropical storms are the largest threats to the long-term viability and protection of assets in Calcasieu and Cameron parish. This project focuses on protecting the coast in Cameron, while ensuring that investments in both parishes are shielded against future devastation. It layers structural and non-structural interventions to reduce loss of life and property from surge events, lower flood insurance, and build on the ongoing work of the Coastal Protection and Restoration Authority (CPRA).
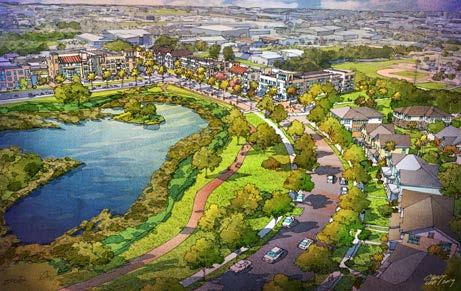
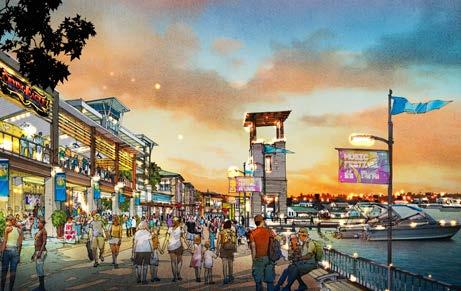
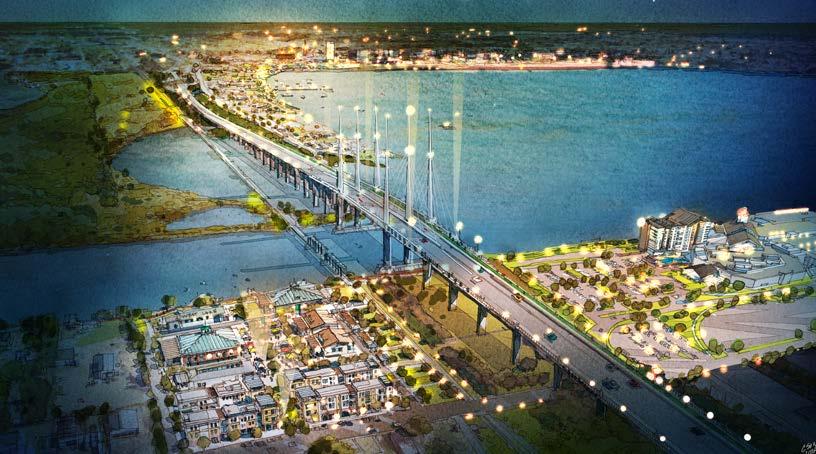
The region’s waterfronts are an untapped asset for quality of life and economic development. Exciting new projects like the Port Wonder Children’s Museum and Nature Center, a new Crying Eagle Brewery restaurant, and Lake Area Adventures will activate the lakefront. Making an investment in a continuous public edge from the Lake Charles Civic Center, across the new I-10 bridge, to Westlake would connect over four miles of pedestrian promenades with vibrant restaurants, recreation, and entertainment.
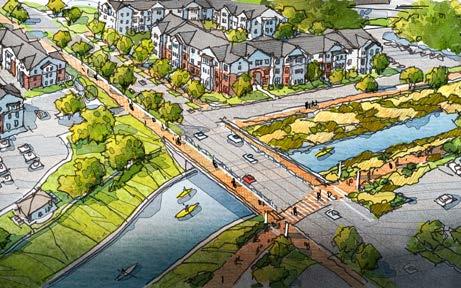
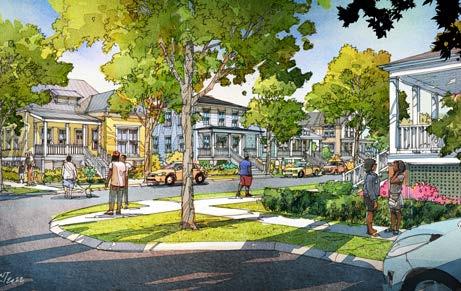
Neighborhood transformation requires creating quality housing that offers choices for everyone. A mixed-income housing approach is being explored for the Lake Street Area between I-210 and W. Sallier Street. Older public housing would be redeveloped into high-quality housing to serve a mix of low-income, workforce, and market-rate individuals and families. All families would enjoy high-quality homes and beautiful amenities. A mixed-income housing approach could help the Mid-City neighborhood compete for HUD’s $40 million Choice Neighborhoods Implementation Grant, leveraging over $200 million of additional investment.
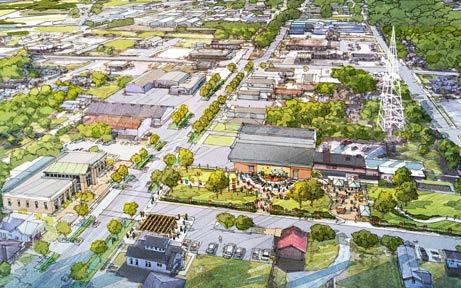
Enterprise Boulevard can become a new cultural destination district and gateway for economic development along the I-10 corridor. New and existing dining, entertainment, and cultural uses will attract people who are traveling along I-10 as well as residents looking for a creative and vibrant district. Streetscape improvements to Enterprise Boulevard and Broad Street would connect from Downtown to the Nellie Lutcher District to North Lake Charles.
McNeese State University is a valuable anchor for SWLA. The Contraband Bayou project that is under construction will enhance resilience and provide access to the water, as the first phase of the Bayou Greenbelt. The LNG Center of Excellence, retail center renovations, new student housing, and a road diet for Common Street would have economic development benefits while enlivening the edges of campus. A Resilience District would tie multiple projects together and target available funding.
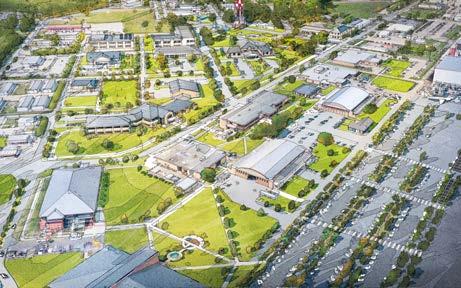
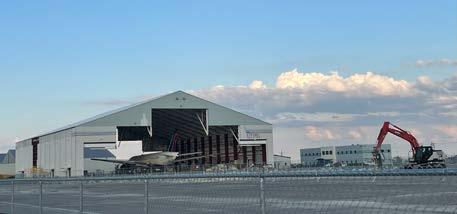
Chennault and SOWELA are planning to invest in bringing more jobs and businesses to the area, enhancing parking lots, and building new educational buildings. Sewer, water, and road upgrades are needed to support new development. A resilience district for Chennault and SOWELA would encompass multiple projects and help make infrastructure upgrades eligible for funding. In the future, the Chennault/SOWELA Resilience District could be a destination with restaurants, housing, and other amenities to serve students and employees at Chennault and SOWELA.
A highly visible project that can be funded and implemented in the first 1-10 years to jump-start economic growth and improve infrastructure and quality of life.
1. Coastal Flood Risk Reduction
2. Waterfront Development
3. Mid-City Neighborhood Transformation
4. Nellie Lutcher District
5. McNeese Area Resilience District
6. Chennault/SOWELA Area Resilience District
7. Strong Downtowns
8. Community Resilience Hubs
9. Resilient Housing for SWLA
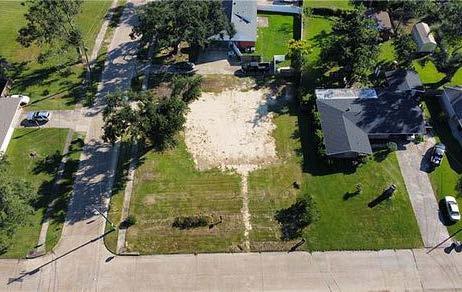
10. Strategies to Address Vacant and Underutilized Property
Benefits
• Provides measurable benefit to greatest needs:
– Affordable housing
– Quality of life
– Drainage
• Regional impact that provides benefits to both parishes and beyond
• Attracts future investment by public and private sectors
• Generates positive economic growth for the future
• Improves quality of life
– Health
– Culture
– Access to nature and water
– Hazard risk reduction
• Co-benefits social and environmental resiliency
Implementation
• Ability to move forward within a 10-year horizon
• Available funding sources
• Proven concept or solution
• Constructible within public property, rights-of-way (ROW), or on partner-owned property
Resiliency
• Addresses future conditions (sea level rise, higher intensive storms, heat hazards)
• Include blue and green infrastructure
• Able to withstand frequent stresses and major disaster events
• Reduces risk beyond the immediate location
Community and Stakeholder Buy-In
• Prioritized as important by residents, stakeholders, and partners
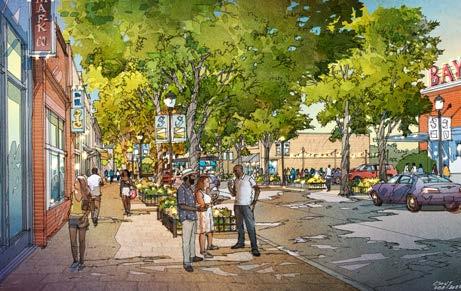
Walkable, active downtowns are vibrant locations for nurturing new and existing small businesses, jobs, and services. They also foster cultural identity and offer spaces for community gatherings and festivals. This project offers a toolkit for strengthening the downtowns in SWLA with walkable streets, stormwater management, drainage, active infill uses, and public spaces for gathering and celebration.
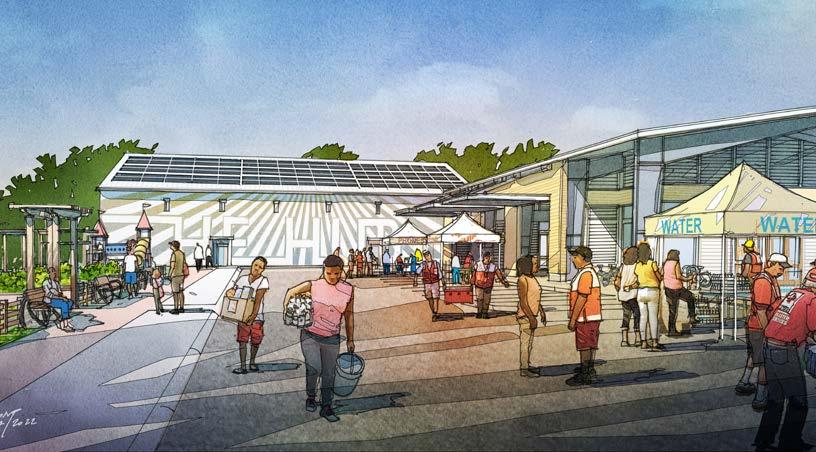
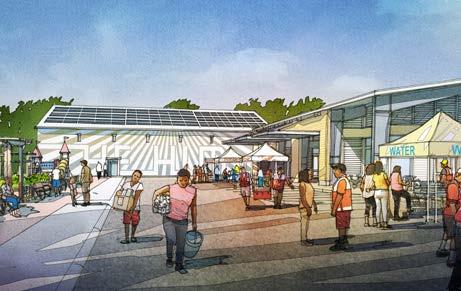
The safety of residents during and after disaster events continues to be a critical need for SWLA. Resilience hubs are community-serving facilities that support residents, coordinate communication, distribute resources, and enhance quality of life. In emergencies, Community Resilience Hubs would provide places for food and water distribution, shelter, charging, cooling, and disaster response coordination. During non-disaster times, these facilities can serve as community buildings for gatherings and recreation. Parishes can start by identifying existing facilities, publicly owned land outside of the Special Flood Hazard Area, and each community’s specific needs to develop a customized strategy.
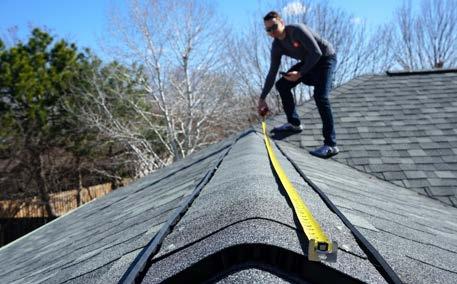
Increasing resilient, affordable housing is a critical issue for this region. Residents are facing the high cost of flood insurance, rising sale prices and rents, and insufficient practices in rebuilding post-disaster. The Resilient Housing Toolkit is a short, easy-to-navigate document that combines valuable resources from FEMA and others to outline the steps needed to build and rebuild resilient housing in the region.
The strategies in this section aim to move vacant and underutilized properties into productive uses, such as housing, community-serving retail, job opportunities, and green space. An entity should be identified, empowered, or created to address adjudicated properties; track and categorize risk levels for adjudicated properties; and consider strategic locations and approaches for redevelopment. The entity should also explore creative solutions to challenging properties with legal and financial encumbrances.
Each of the 10 catalytic projects addresses the five plan topic areas. In addition to the specific recommendations, the Just Imagine SWLA 50-Year Resilience Master Plan also includes policy recommendations and actions in each of the five topics. These plan recommendations will be critical to helping the region reach its resiliency goals.
The plan recommendations are based on:
• Analysis of the existing conditions, including physical infrastructure and development patterns, market and economic factors, and the state of infrastructure;
• Guiding Group meetings and input; and
• Public input throughout the process.
The plan recommendations include projects that are less visible, more limited in influence, or longer term than the 10 catalytic projects. However, they are still critically important to the advancement of the region. The plan recommendations will be implemented by partnership of public, private, and non-profit partners. The lists to the right demonstrate the types of recommendations found in the Plan Recommendations chapter.
Community Planning
– Zoning and Regulatory Updates
– Walkability and Bikeability Recommendations
Housing
– Zoning and Regulatory Updates
– Strategies for Affordable Housing
– Recommendations for Training and Advancement of Resilient Building Practices
Economic Development
– Downtown Lake Charles Recommendations
– I-10 Corridor Recommendations
– Economic Diversification Recommendations
Infrastructure
– Recommendations to Improve Access & Connectivity
– Recommendations to Improve Standards of Existing Roads
– Resilient Utility Recommendations
– Higher Standards for Flood and Wind Risk
Natural and Cultural Resources
– Food and Culinary Culture Recommendations
– Cultural Venue and Event Recommendations
– Family-Friendly Entertainment Recommendations
– Recommendations for the Protection and Enhancement of Natural Resources
The Just Imagine SWLA Master Plan placed the highest priority on the 10 catalytic projects and plan recommendations being implementable with available resources and political support. The projects will be implemented through:
• Public-private partnerships
• Publicly funded and led projects within rightsof-way and on publicly owned land
• Incentives and improved economic environment for private investment
• Ordinance and policy updates
• Public support for taxes and millages
• Rezoning and entitlement of strategic parcels
• Leveraging of the region’s disaster recovery funds and federal appropriations
A Project Lead has agreed to lead each of the catalytic projects. For each project, the lead partner will ensure that measurable progress is made and that action steps are moving forward. Supporting partners will play key roles in aspects of the projects. Project Champions have been identified — they will advocate for and educate who about the project.
The catalytic projects and plan recommendations will be funded through combinations of public, private, and philanthropic funding sources.
Example Funding Stack for a Public Project
Philanthropic Funding for Gaps not covered by other sources
Leveraged Private Investment
Example Funding Stack for a Private Project
Philanthropic Grants
Public Incentives
Owner/Developer Equity
Local match and/or tax/millage
Total Project Cost
Subordinated Debt
Total Project Cost
State & Federal grants & bonds
Conventional Bank Debt
The Just Imagine SWLA 50-Year Resilience Master Plan for Calcasieu and Cameron parishes is rooted in an inclusive, collaborative, broad community engagement process. The 10 catalytic projects and numerous plan recommendations in this document are a product of community input, local leadership guidance, and extensive partnerships received and created throughout a 10-month engagement process. Areas of focus within the Master Plan will be housing, infrastructure, economic development, community planning, natural and cultural resources, and other quality of life enhancements that will positively impact the region for decades. Documentation of the residents’ responses can be found in this report’s Appendix.
The planning process utilized in developing the Just Imagine SWLA 50 Year Resilience Master Plan included three steps:
1. Understanding
2. Testing
3. Deciding
Step 1 utilized several strategies for reaching and engaging the public in conversations about their current needs and future visions for Southwest
At the heart of this process is resident, community, and local leadership input on ways to make Southwest Louisiana a safer, stronger, more resilient community.
Louisiana. Step 1 marked the kick-off of the community engagement process and set the framework for the engagement strategies and methods used throughout the process. The first step’s focus was listening to the residents and stakeholders. The team asked four questions:
• What do you love about your community?
• What were the problems in your community before the 2020 storms?
• What are the hurdles you are facing now?
• What are your dreams for the future of your community?
Upon receiving a robust response from all engagement platforms, the feedback was incorporated into one community-led vision statement and a series of goals for each of the five plan topic areas: Community Planning, Economic Development, Housing, Infrastructure, and Natural and Cultural Resources.
Step 2 continued the engagement process by focusing on solidifying the community vision statements and goals with local leadership, community leaders, stakeholders, and residents. The community had an opportunity to review the visions and goals and provide feedback on whether or not they were an accurate reflection of the region’s greatest needs and desires. Once confirmed, these visions and goals helped to establish 10 catalytic projects. Catalytic projects are highly visible projects that can be funded and implemented in the first 1-10
years to jump-start economic growth and improve infrastructure and quality of life. Each of the catalytic projects has elements that first address the needs stated by the community while also involving one or more of the five plan topic areas. During Step 2, the community had an opportunity also to review the proposed catalytic projects and provide feedback.
Step 3 is the final step in the Just Imagine SWLA Resilience Master Plan process and resulted in the 50-Year Resilience Master Plan for Calcasieu and Cameron parishes. Engagement during this step focused on refining the 10 catalytic projects, testing project feasibility, advocating for additional plan-topic-area-specific recommendations, and strategizing ways that the community can achieve and implement all elements of the Master Plan. The catalytic projects and plan recommen-
dations are articulated throughout this report. After a 12-month engagement process, the Just Imagine SWLA 50-Year Resilience Master Plan for Calcasieu and Cameron parishes captures the community’s ideas, visions, and goals for a resilient future for Southwest Louisiana, along with a series of actionable and implementable catalytic projects and plan recommendations which will guide Southwest Louisiana to recovery, resilience, and rebirth over the next 50 years.
The Community Foundation Southwest Louisiana would like to acknowledge and thank the many volunteers that made the community engagement process a success by allowing residents’ and local leaders’ voices to be heard and incorporated into the Just Imagine SWLA 50-Year Resilience Master Plan.
First round of community meetings to listen to the needs of residents and their visions for the future
In developing a strategy for engaging the residents, stakeholders, and local leaders across Southwest Louisiana, the Just Imagine SWLA team took into consideration geographic distance, access to online tools and technology, and the rate of displacement following Hurricanes Laura and Delta. In response to these factors, the engagement approach included several tools, strategies, and meeting locations to accommodate the largest cross section of the population. These included: in-person community meetings, satellite ambassador meetings, online interactive maps, online idea walls, online surveys, and an interactive text-platform.
The Just Imagine SWLA 50-Year Resilience Master Plan for Calcasieu and Cameron parishes is the result of twelves months of extensive community engagement with residents, stakeholders, Parish and City administrators, potential funders, and local community leadership. Over the course of those twelve months, the community had several opportunities to learn about the process, share ideas, and help shape visions for the future of Southwest Louisiana.
Step 1 — Understanding Community Meetings
Step 2 — Testing Community Meetings
Step 3 — Deciding Community Meetings
Community Planning Guiding Group
Housing Guiding Group
Economic Development Guiding Group
Infrastructure Guiding Group
Natural & Cultural Resources Guiding Group
Advisory Committee
Hello Lamp Post Signs Around the Community
Testing
Second round of community meetings to present the visions and goals and test ideas for 10 catalytic projects
Feasibility & Deciding
Last round of community meetings to explore feasibility and develop strategies for implementation
Hello Lamp Post Signs Around the Community
Ongoing Ambassador Meetings
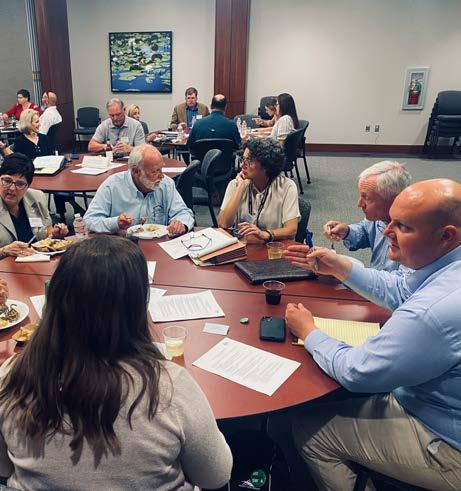
Implementers Working Dinner
Meetings with parish and city administrators, potential funders, and local leaders to take community feedback and develop a list of catalytic projects for the region
Plan Topic Guiding Group Meetings
Continued conversations with local leadership to refine catalytic projects and create a list of plan recommendations with action steps and necessary implementation strategies
Plan Topic Guiding Group Meetings
2,500+ people participated
Project champions, lead entities, and working groups will continue to meet and implement catalytic projects
7,320 comments and ideas were received
The Just Imagine SWLA Advisory Committee helped kick off the master planning process in October 2021. Comprised of local leaders from both Calcasieu and Cameron parishes, the members’ extensive knowledge and diverse experiences helped guide the planning process through each step. They will continue to facilitate implementation for the next several years. Members of the Advisory Committee were hand-picked by the Community Foundation Southwest Louisiana to ensure equal and diverse representation across parishes and all industries or areas of interest.
Throughout the process, the Advisory Committee had six (6) meetings. These meetings strategically took place before the major community listening sessions during each step of the process to glean insight on responsibly engaging with the public, discuss presentation and discussion topics, and provide an opportunity to collaborate on approach.
• Kara Bonsall — Coastal Zone Administrator, Cameron Parish Police Jury
• Lauren Boring — Project Specialist, Planning & Development, City of Lake Charles
• Alberto Galan — Assistant to the Administrator, Calcasieu Parish Police Jury
• Sandra Gunner — Special Projects Manager, Louisiana Office of Community Development
• Dr. Shannon LaFargue — Superintendent, Calcasieu Parish School Board
• Angie Manning — Vice President of Communications, Visit Lake Charles
• Nicole Miller — Program Manager,Disaster Housing Recovery, Calcasieu Parish Police Jury
• Willie Mount — Former Mayor of Lake Charles and State Senator
• Glenn Pumpelly — Pumpelly Tire Company
• Jim Rock — Executive Director, Lake Area Industry Alliance
• Wade Rousse — VP of University Advancement and Executive VP, McNeese Foundation
• Marshall Simien — Attorney, Simien Law Firm
• Kenny Stinson — former Mayor of Town of Vinton
• Bart Yakupzack — Attorney, Jack Lawton Companies
Guiding groups for the Just Imagine SWLA master planning process offered relevant and technical plan-topic-area-specific feedback and recommendations, which governed the development of the 10 catalytic projects and numerous plan recommendations. Members of the Guiding Groups were selected for their plan topic group by the Community Foundation Southwest Louisiana based on their industry-specific expertise and diverse representation throughout Calcasieu and Cameron parishes.
Throughout the process, each Guiding Group met in individual roll-up-the-sleeves working sessions three (3) times, once during each step — Understanding, Testing, and Deciding. All of the guiding groups then met for a second time during the Understanding step on Zoom to reflect on what we heard from the community during the in-person meetings. During these meetings, the Guiding Group members offered technical support and advice, which helped clarify existing conditions, establish local priorities, and elevate beyond regional standards.
• Lauren Boring — City of Lake Charles
• Jennifer Cobian — Calcasieu Parish Police Jury
• Walter Council — Imperial Calcasieu Regional Planning Commission
• Jason Garcille — Capital Growth Burchalter
• Faith Hooks — Alliance for Positive Growth
• Christi Kingsley — West Calcasieu Cameron Hospital
• Carrie Kudla
• Clair Marceaux
• John Noble M.D. — Noble Development
• Jake Porche — Porche Advanced Systems
• Matt Redd — Redd Properties
• Gray Stream — Stream Companies
• Kimberly Vidrine — Calcasieu Parish Police Jury
• Bart Yakupzack — Jack Lawton Companies
• Jerry Chaumont — Entergy
• Keith DeRousseau — Keiland Construction
• Stacy Dowden — City of Lake Charles
• Jason Elliot — Civil Construction Company
• Alberto Galan — Calcasieu Parish Police Jury
• Mike Hollier — Imperial Calcasieu Regional Planning Commission
• Mark McMurray — McMurray Leadership and Management
• Phillip Miller — Alfred E Miller Construction
• Jerry Milner — City of Westlake
• Marshall Simien — Simien Law Firm
• Devan Corbello — Arts & Humanities Council of SWLA
• Angie Manning — Visit Lake Charles
• Doug Miller — Grosse Savanne
• Stella Miller — Black Heritage Gallery
• Zoey Reed — Louisiana Association of Public Charter Schools
• Joe Stough — Ducks Unlimited National Board of Directors
• Thom Trahan — Brimstone Museum & Henning Cultural Arts Center
• Scooter Trosclair — Rockefeller Wildlife Refuge
• Jason VanMeter — Calcasieu Parish School Board
• Matt Young — City of Lake Charles
• Charla Blake — Project Build a Future
• Krystle Blue — Home Builders Association of SWLA
• Ross Byerly — Shelter Insurance
• Kimberly Dellafosse — City of Lake Charles
• Melissa Dickson — First Federal Bank of Louisiana
• Braylon Harris — SWLA Responds
• Nicole Miller — Calcasieu Parish Police Jury / Lake Charles Housing Authority
• Randy Roach — former Mayor Lake Charles
• Ben Taylor — Lake Charles Housing Authority
• Eric Avery — Crying Eagle Brewing Company
• Barry Brown — Red River Bank
• Mac Carheel — Carheel Consulting
• Kyle Edmiston — Visit Lake Charles
• Gary Gobert — Lake City Trucking
• Stephen Liles — Oak Grove Wealth Management
• Deb McCormick — Teamed Up Consulting
• Kevin Melton — Chennault International Airport
• Glenn Pumpelly — Pumpelly Tire
• Jolie Rhinehart — Phillips 66
• Jon Ringo — Port of Lake Charles
• Dennis Stine — Stine Home & Yard
As part of the public engagement process for Just Imagine SWLA, the project team recruited 62 volunteers to serve as project ambassadors. After training, ambassadors were asked to gather community feedback through one-on-one interactions and small group meetings with the community. These ambassadors met with over a thousand people, and their efforts provided valuable thoughts and feedback that shaped the project vision and developed the 10 catalytic projects. In addition to coordinating and hosting these small meetings, ambassadors continued the Just Imagine SWLA master plan process by helping to promote large community meetings, volunteering at meetings and events, distributing surveys, and spreading information to the community.
Ambassadors
• Joy Abshire
• Edriena Alexander
• Josh Anderson
• Kennedy Anderson
• Katie Armentor
• Kaysie Bolton
• Kara Bonsall
• Damian Boudreaux
• Mallie Bowers
• Mac Carheel
• Timothy Ceasar
• Mark Conner
• Christine Detiveaux
• Mary Jo Diaz
• Amy Donald
• Daren Dotson
• Kathryn Shea Duncan
• Mary Kay Eason
• Lillian Emory
• Elizabeth Eustis
• Liz Fuselier
• Prissy Gayle
• Russ Godwin
• Georgina Graves
• Elijah Guillory Jr.
• Nomica Guillory
• Melinda Hardy
• Tom Hatfield
• Penny Haxthausen
• Faith Hooks
• Jessica Hutchings
• Rachel Judson
• Jean Kamla
• Heather Koonce
• Carrie Kudla
• Maria Laborde
• Bryan Lambert
• Sara Lasher
• Veronica Manthiel
• Robin Morales
• Deb McCormick
• Janet Melton
• Mark Mitchell
• Danielle Nava
• Monique Nichols
• Randy Partin
• Linda Patrick
• Katie Pennington
• Eloise Pruitt
• Claire Pumpelly
• Denise Rau
• Zoey Reed
• Cindy Robertson
• Jim Rock
• Jeanne Rogers
• Taylor Beard Stanley
• Philip Stelly, D.V.M.
• Liz Trahan
• Billy Vincent
• Brittany Zaunbrecher
A total of nine in-person listening sessions and community workshops took place over the 12-month process to solicit feedback from residents, stakeholders, and community leaders. For each of the three steps in the process, there were three identical public meetings, one offered in each major geographic region in Southwest Louisiana — Lake Charles, West Calcasieu Parish, and Cameron Parish.
During the Understanding Step, the in-person meetings kicked off the community engagement process with listening sessions on November 15-17, 2021. As part of these three identical meetings, residents in Lake Charles, Calcasieu Parish, and Cameron Parish had an opportunity to answer the following four questions:
• What do you love about your community?
• What were the problems in your community before the 2020 storms?
• What are the hurdles you are facing now?
• What are your dreams for the future of your community?
In attendance at the three listening sessions were approximately 200 residents, including 52 in West Calcasieu, 114 in Lake Charles, and 38 in Cameron Parish. These conversations helped lay the groundwork for existing conditions and future ambitions for SWLA while also helping to establish the visions and goals for each plan topic area.
Three public meetings took place during the Testing Step on March 15-17, 2022. These testing workshops aimed for residents to confirm what was heard during the Understanding Step, provide feedback on the community-based visions and goals, and evaluate the 10 initial catalytic project proposals. Meeting attendees were asked the following questions:
• What ideas do you like? (green dots)
• What ideas do you not like? (red dots)
• What other ideas do you have?
Results from these meetings guided the refinement of the 10 catalytic projects moving into the Feasibility & Deciding Step and provided additional feedback on enhancing the projects for maximum community benefit. In attendance at the three listening sessions were approximately
175 residents, including 31 in West Calcasieu, 117 in Lake Charles, and 26 in Cameron Parish.
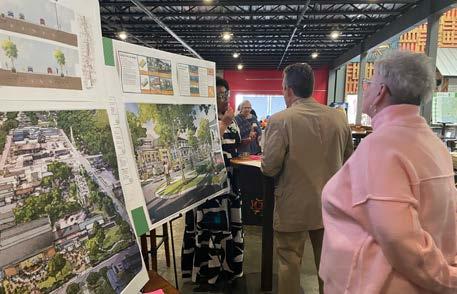
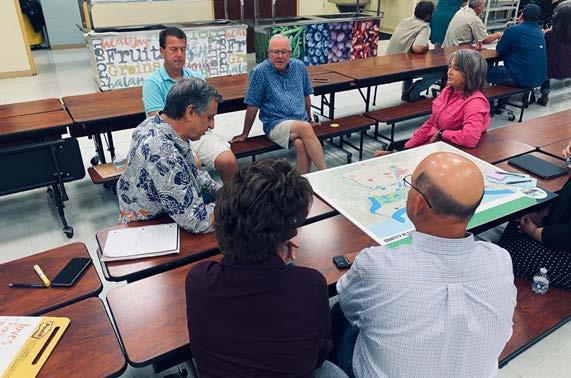
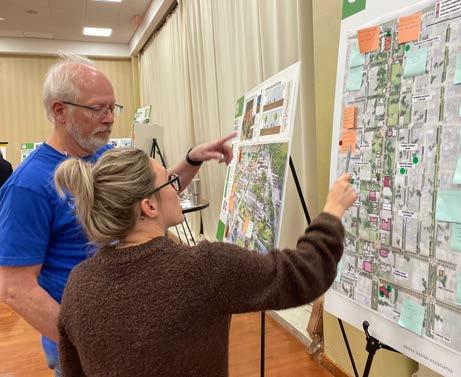
The final round of three in-person community meetings occurred during the Feasibility & Deciding Step on June 6-8, 2022. During these final conversations with residents from Calcasieu and Cameron parishes, meeting attendees were presented with 10 refined catalytic projects that included action steps, implementation timelines, potential funding sources and partnerships, project impacts on the region, and descriptions of relevance for Calcasieu and Cameron parishes. In an open house format, those in attendance could leave green dots on elements of each project they liked, red dots on elements of each project they did not like, and post-it notes where they had questions or additional feedback.
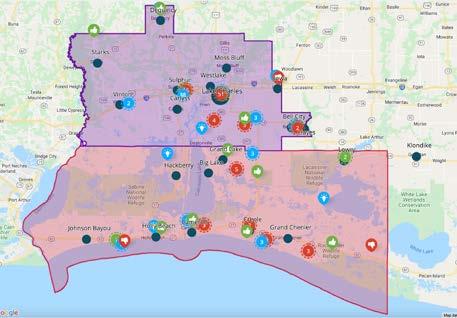
The online interactive map served as a digital pin board for place-based feedback throughout the process. For those unable to attend any of the in-person community meetings, the interactive map allowed them to still participate in the Just Imagine SWLA process from the comfort of their home. The interactive map mirrored the same questions being asked during the public meetings. The first round of comments focused on areas that people love in their community, problem areas, and dreams for the future. The second round of comments focused on the catalytic projects.
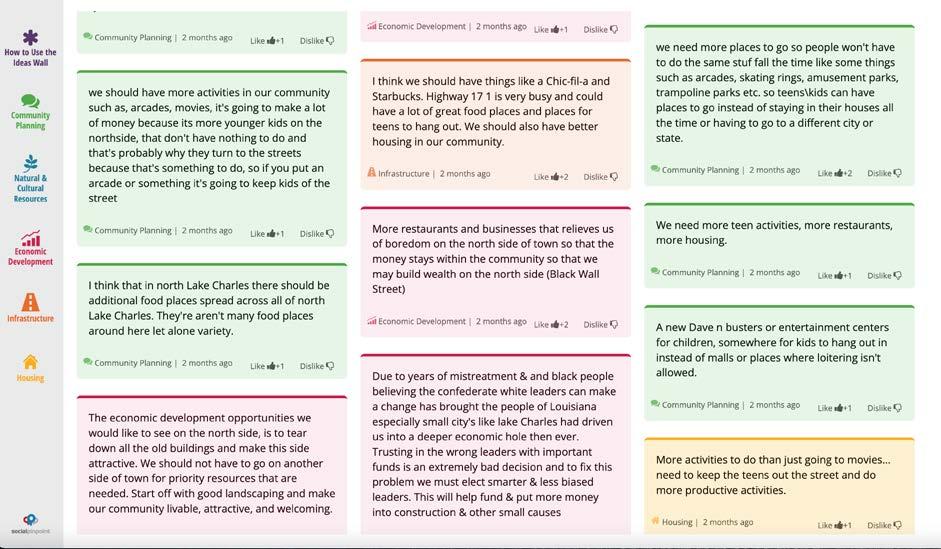
Just like the interactive map, the online idea wall provided an additional space for feedback without attending an in-person engagement session. The first round of comments focused on the five plan topic areas and what must be addressed from those areas in the 10 catalytic projects. The second round of comments focused on the extensive plan recommendations, and offered residents the opportunity to vote up for recommendations they liked, voted down on recommendations they did not like, and provide additional suggestions.
Across the project steps, there were three online surveys — one for each step of the project which mirrored the content covered in the in-person public meetings. During Step 1 — Understanding, the survey included four main questions:
• What do you love about your community?
• What were the problems in your community before the 2020 storms?
• What are the hurdles you are facing now?
• What are your dreams for the future of your community?
Just Imagine SWLA Ambassadors collected over 300 survey responses from friends and family, with an additional 1,089 responses from area high school students.
After presenting the 10 catalytic projects to the community during the Testing Step, the second online survey allowed respondents to answer questions about the projects that were of interest to them. This survey helped reveal which aspects of each project the community liked, disliked, and were unsure about. Nearly 360 responses were received.
At the end of the final round of public meetings during the Feasibility & Deciding step, the team used an exit survey to ask two questions for each catalytic project:
• What priority level would you assign this project?
• Do you support this project?
The team received 70 responses to add to those responses received during the in-person public meetings.
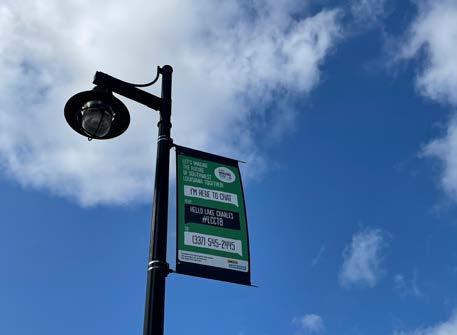
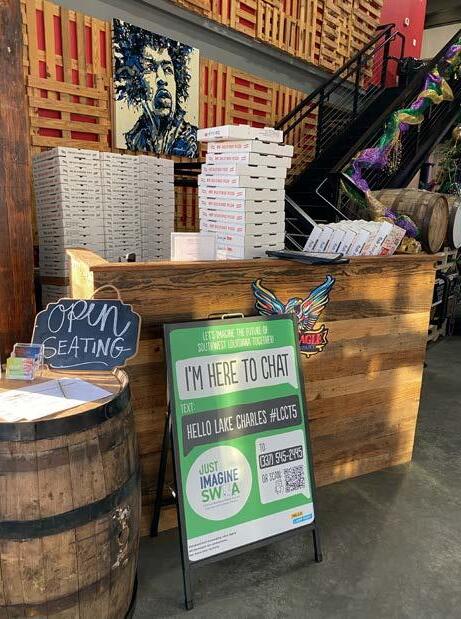
Hello Lamp Post is a friendly, interactive text messaging platform that allows residents and visitors to playfully interact with signs around their community and share their visions for the future. Signs across the region said “I’m Here to Chat” and offered an approachable, easy way for people to participate in the Just Imagine SWLA planning process from the comfort of the places they take their kids to school, visit on the weekend with family, or see on their way to work. Over 80 signs were placed across Lake Charles, Calcasieu Parish, and Cameron Parish, and brought in hundreds of interactions and ideas for SWLA.
Guiding Group
In-Person Public Meetings
Online Idea Wall
Online Interactive Map
High School Survey
Hello Lamp Post
Ambassadors
Over 1,700 people participated in Step 1, providing over 4,000 comments about the strengths, weaknesses, and opportunities for Southwest Louisiana.
Utilizing all engagement methods in the toolbox, the Just Imagine SWLA team explored every opportunity to reach the people of Calcasieu and Cameron parishes where they live, work, and do life to engage in the Just Imagine SWLA Planning Process. During Step 1 — Understanding, the focus of engagement was on trust building and storytelling, hearing the stories residents and stakeholders had to share, along with their visions for the future.
The breakdown of comments and participation by engagement method is as follows:
Guiding Group
• 55 Guiding Group members
• 350 comments received from participants
In-Person Public Meetings
• 200 In-Person Meeting attendees
• 1,030 comments received from attendees
Online Idea Wall
• 63 Idea Wall participants
• 192 comments on the Idea Wall
1,700
4,000
Across all engagement methods over people have participated, sharing a total of over comments and ideas
Online Interactive Map
• 84 Interactive Map participants
• 405 comments on the Interactive Map
High School Survey
• 1,052 high school survey responses submitted
Hello Lamp Post
• 124 interactions with Hello Lamp Post
• 252 comments received through text
Ambassadors
• In Person Meetings: 34, 839 attendees
• Virtual Meetings: 3, 20 attendees
• Emails: 3, 1125 people reached
What do people love most about their community?
People and communities in SWLA are supportive, friendly, and family-oriented
Appreciation for beautiful, natural landscapes and waterways
People love and use the local parks and green spaces
Unique culture and heritage around food
The region, cities, communities, and neighborhoods are home
The first step in understanding and processing all of the answers from Step 1 — Understanding was to identify the top 5-6 responses for the three questions asked across all engagement methods and sort them into their applicable plan topic area:
– What do you love about your community?
– What were the problems in your community before the 2020 storms? What are the hurdles you are facing now?
– What are your dreams for the future of your community?
What are the biggest problem areas in the community?
Flooding and poor drainage
Traffic patterns, congestion, and poor circulation
The cost of all housing is going up and many households are being priced out
Lack of sidewalks, bike paths, and safe pedestrian routes
Abandoned properties and dilapidated buildings in need of repair
Difficulty attracting and retaining workforce in most areas of the economy
What are people’s dreams for the future of Southwest Louisiana?
Sidewalks, bike trails, and pedestrian paths in both developed and natural areas
More choices for restaurants and food experience
Attract entertainment and shopping amenities to the region
Improve parks and outdoor recreation (paddle boats, splash pad, playgrounds, etc.)
More places and activities for families and teens
After reviewing the over 4,000 comments received during Step 1 — Understanding, 15 top visions arose to the surface as the most important opportunities for the future of Southwest Louisiana. Those 15 visions are broken down by plan topic area and illustrate the guiding inspiration for the rest of the Just Imagine SWLA Resilience Master Plan.
• Improve bike networks and sidewalks/ pedestrian connectivity
• Offer more opportunities for family and youth activities
• Improve city codes and building standards with expedited/ease of city and parish processes
• Develop housing that is affordable for families of all incomes
• Diversify housing types, while limiting sprawl
• Improve existing housing
• Increase access to entertainment, shopping, restaurants, and grocery stores
• Activate and connect the waterfront
• Explore opportunities for economic development and diversity
• Improve the I-10 Corridor (Build a new bridge; develop and beautify areas visible from I-10)
• Improve connectivity by building new roads and bridges and fixing existing roads that are in poor condition
• Upgrade existing and build new drainage and flood control infrastructure
• Enhance outdoor recreational amenities, parks, and green spaces; plant trees
• Natural methods for shoreline protection and hazard mitigation
• Expand existing cultural and institutional assets
I love how we come together to help each other out in times of need! My community does a great job of encouraging each other in building each other up!
I love the natural beauty of it. I appreciate how much greenery there is.
My dreams for the community are that we stay together, work with each other and try our hardest to make the town a safer place for the adults and children living here.
Roads and bridges are terrible. I’m afraid I’m going to harm myself or someone else every time I get on the road.
Clean up is needed! Drainage is well below standard, and our beautiful parks need regular maintenance.
Enhance the sectors that make the region unique (seafood industry, quality of life, etc.)
Beautify and develop the I-10 Corridor.
Clean sturdy buildings, more plants in the environment, easier work access, easier roads to travel, less struggles for my family and the ones around us.
Improve hurricane protection.
I hope that one day we will recover fully and will prosper bigger and better than before.
I wish for everyone to be able to return to their lives in better condition than they had before.
Build strong neighborhoods with bike lanes and connected sidewalks.
Recreate a beautiful community that has enriching amenities for families.
During the Testing Step, participants evaluated the 10 Catalytic Projects and identified projects they were most interested in.
As a part of the Testing Step public meetings, residents and stakeholders had an opportunity to hear about the proposed 10 catalytic projects, talk with members of the project team in an open house format, and evaluate those projects based on the following questions:
• What ideas do you like? (green dots)
• What ideas do you not like? (red dots)
• What other ideas do you have?
Following the public meetings, a survey was released with the intention of replicating in-person conversations. Each catalytic project was a separate page in the survey, where survey-takers could skip through and answer questions only about the projects that directly interested them. These survey questions were also made available on the interactive map. While questions varied slightly on a project-by-project basis, a few of the same questions across all projects were:
• Do you think this project will benefit Southwest Louisiana?
• Would you visit this project?
• In which of the following ways do you think that this project would positively impact the region? (Select all that apply)
– This project would increase walkability, create more destinations, and/or promote a better quality of life for residents of SWLA.
– This project would promote a more resilient SWLA, with improved infrastructure and drainage.
– This project would provide needed housing — increasing choices and making housing more resilient and affordable.
– This project would improve access to natural spaces and cultural amenities.
– This project would bring much needed jobs and economic diversity to SWLA.
Across all engagement methods in the Testing Step, there were over comments and ideas
1,320
The breakdown of comments and participation by engagement methods is as follows:
Guiding Group
• 55 Guiding Group members
In-Person Public Meetings
• 175 In-Person Meeting attendees
• 540 comments received from attendees
Online Interactive Map
• 342 Interactive Map survey responses
• 23 comments on the Interactive Map
Catalytic Projects Survey
• 359 survey responses
Hello Lamp Post
• 60 interactions with Hello Lamp Post Ambassadors
• Used their network to provide information and gather survey responses
I would visit a protected beach with amenities like parking, public restrooms, and accessible walking trails.
In which of the following ways do you think that this project would positively impact the region? (Select all that apply)
Increase walkability, create more destinations, and/or promote a better quality of life for residents of SWLA.
Promote a more resilient SWLA, with improved infrastructure and drainage.
I think this project will benefit SWLA.
I would visit a protected beach with amenities like parking, public restrooms, and accessible walking trails.
I think this project will benefit SWLA.
Improve access to natural spaces and cultural amenities.
Bring much needed jobs and economic diversity to SWLA.
None of the above.
In which of the following ways do you think that this project would positively impact the region? (Select all that apply)
Increase walkability, create more destinations, and/or promote a better quality of life for residents of SWLA.
Promote a more resilient SWLA, with improved infrastructure and drainage.
Provide needed housing — increasing choices and making housing more resilient and affordable. Provide needed housing — increasing choices and making housing more resilient and affordable.
Improve access to natural spaces and cultural amenities.
Bring much needed jobs and economic diversity to SWLA.
None of the above.
NELLIE LUTCHER DISTRICT 3 4
MID-CITY NEIGHBORHOOD TRANSFORMATION
I think this project will benefit SWLA.
In which of the following ways do you think that this project would positively impact the region? (Select all that apply)
Increase walkability, create more destinations, and/or promote a better quality of life for residents of SWLA.
I’M NOT SURE
I think this project will benefit SWLA.
of respondents said of respondents said
of respondents said of respondents said 6% 12%
Promote a more resilient SWLA, with improved infrastructure and drainage.
of respondents said of respondents said YES NO
I’M NOT SURE
I would visit a Nellie Lutcher District with food, gathering, and entertainment options.
Improve access to natural spaces and cultural amenities.
Bring much needed jobs and economic diversity to SWLA.
None of the above.
Increase walkability, create more destinations, and/or promote a better quality of life for residents of SWLA.
Promote a more resilient SWLA, with improved infrastructure and drainage.
Provide needed housing — increasing choices and making housing more resilient and affordable. Provide needed housing — increasing choices and making housing more resilient and affordable.
Improve access to natural spaces and cultural amenities.
Bring much needed jobs and economic diversity to SWLA.
None of the above.
I would visit this project
In which of the following ways do you think that this project would positively impact the region? (Select all that apply)
Increase walkability, create more destinations, and/or promote a better quality of life for residents of SWLA.
Promote a more resilient SWLA, with improved infrastructure and drainage.
I think this project will benefit SWLA.
I would visit a protected beach with amenities like parking, public restrooms, and accessible walking trails.
I think this project will benefit SWLA.
Improve access to natural spaces and cultural amenities.
Bring much needed jobs and economic diversity to SWLA.
None of the above.
In which of the following ways do you think that this project would positively impact the region? (Select all that apply)
Increase walkability, create more destinations, and/or promote a better quality of life for residents of SWLA.
Promote a more resilient SWLA, with improved infrastructure and drainage.
Provide needed housing — increasing choices and making housing more resilient and affordable. Provide needed housing — increasing choices and making housing more resilient and affordable.
Improve access to natural spaces and cultural amenities.
Bring much needed jobs and economic diversity to SWLA.
None of the above.
I would visit downtowns that implemented designs to enhance streetscapes and public spaces.
In which of the following ways do you think that this project would positively impact the region? (Select all that apply)
Increase walkability, create more destinations, and/or promote a better quality of life for residents of SWLA.
Promote a more resilient SWLA, with improved infrastructure and drainage.
I think this project will benefit SWLA.
I would use a resilience hub during and after a disaster.
I would use a resilience hub as a community center during nondisaster times.
I think this project will benefit SWLA.
88% 4% 8%
of respondents said of respondents said of respondents said
YES NO
I’M NOT SURE
Improve access to natural spaces and cultural amenities.
Bring much needed jobs and economic diversity to SWLA.
None of the above.
In which of the following ways do you think that this project would positively impact the region? (Select all that apply)
Increase walkability, create more destinations, and/or promote a better quality of life for residents of SWLA.
Promote a more resilient SWLA, with improved infrastructure and drainage.
Provide needed housing — increasing choices and making housing more resilient and affordable. Provide needed housing — increasing choices and making housing more resilient and affordable.
Improve access to natural spaces and cultural amenities.
Bring much needed jobs and economic diversity to SWLA.
None of the above.
RESILIENT HOUSING TOOLKIT
I would use the Resilient Housing Toolkit.
I’M NOT SURE DOESN’T APPLY
I think this project will benefit SWLA.
In which of the following ways do you think that this project would positively impact the region? (Select all that apply)
Increase walkability, create more destinations, and/or promote a better quality of life for residents of SWLA.
Promote a more resilient SWLA, with improved infrastructure and drainage.
I think this project will benefit SWLA.
I’M NOT SURE
Improve access to natural spaces and cultural amenities.
Bring much needed jobs and economic diversity to SWLA.
None
of
In which of the following ways do you think that this project would positively impact the region? (Select all that apply)
Increase walkability, create more destinations, and/or promote a better quality of life for residents of SWLA.
Promote a more resilient SWLA, with improved infrastructure and drainage.
Provide needed housing — increasing choices and making housing more resilient and affordable. Provide needed housing — increasing choices and making housing more resilient and affordable.
Improve access to natural spaces and cultural amenities.
Exit
Hello Lamp Post
Ambassadors
During the Feasibility & Deciding Step, residents, local leadership, and the advisory committee identified support and priority for the 10 Catalytic Projects in preparation for implementation.
In the final phase of engagement, the focus was on refining the 10 catalytic projects, identifying support for each project, and determining the level of priority for implementation.
The breakdown of comments and participation by engagement methods is as follows:
Guiding Group
• 55 Guiding Group members
In-Person Public Meetings
• 175 In-Person Meeting attendees
Online Idea Wall
• 40 Idea Wall participants
Exit Survey
• 70 survey forms submitted
Hello Lamp Post
• 133 interactions with Hello Lamp Post
• 274 comments received through text
Ambassadors
• Used their network to provide information and gather survey responses
Across all engagement methods in the Feasibility & Deciding Step, there were over comments and ideas
2,000
The Advisory Committee, Local Leadership Group, and General Public all voted on the priority for the catalytic projects. The “Resulting Priority” indicates a weighted averages of the responses across all three groups, with some preference
given to the Advisory Committee and Leadership Group responses, which indicate knowledge about strategic implementation and capacity for completion in the first 10 years of the plan.
As a part of the Exit Survey, residents and stakeholders were asked to highlight their support for each of the catalytic projects.
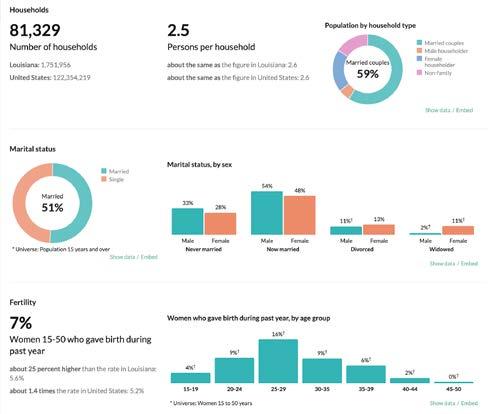
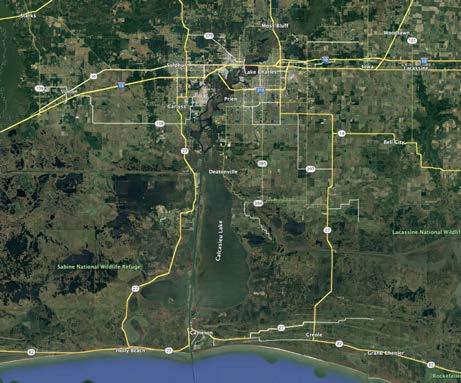
The Lake Charles MSA encompasses Calcasieu and Cameron parishes. Calcasieu Parish includes a mixture of rural, suburban, and urban communities. Cameron Parish is primarily rural, with a few remote suburban areas due to its proximity to the coast and its unique natural environment that is primarily wetland area.
The population of the two parishes was 222,402 in 2020 and estimated at 210,362 in 2021. This data illustrates a major drop in population
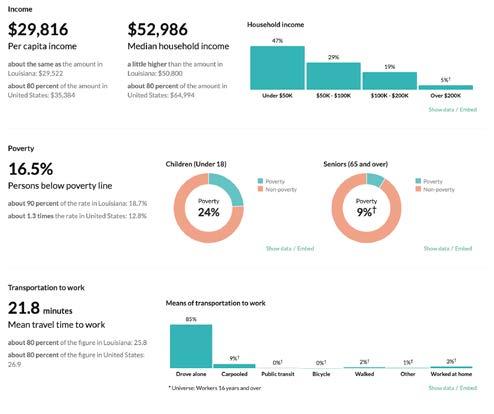
between the 2020 Census to the 2021 estimates, due to the weather-related disasters in 2020. The Lake Charles MSA was the number one MSA in the country in terms of percentage drop in population due to migration, which demonstrates the dire effect the storms had on the region. Other important metrics for the region show that household incomes is above Louisiana medians, but below the US median household income. Similarly, the poverty index is lower compared to the state of Louisiana, but higher than the national poverty index.
Southwest Louisiana is a unique and beloved place, but it has a fragile environment and challenges that must be addressed.
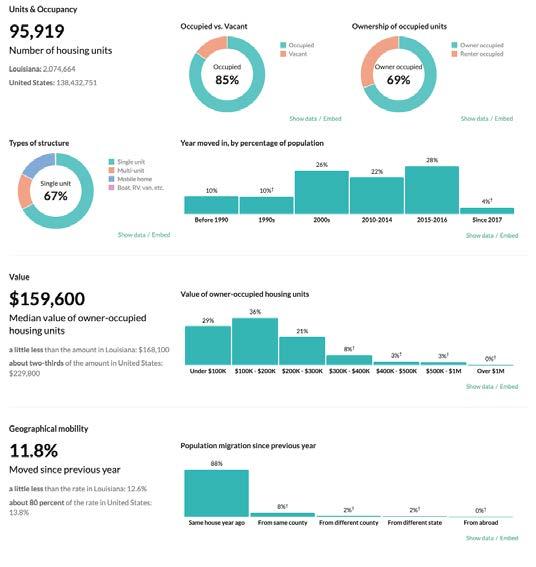
Social Demographics: Data sourced from the ACS 2020 5-year (CensusReporter.org) Housing Demographics: Data sourced from the ACS 2020 5-year (CensusReporter.org)
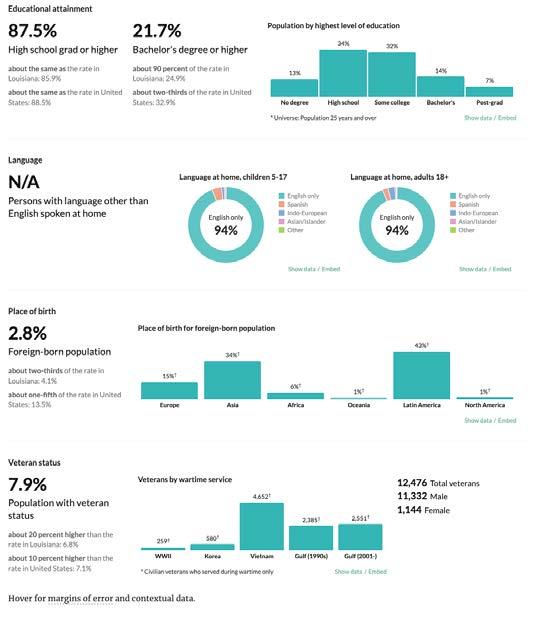
Population Demographics: Data sourced from the ACS 2020 5-year (CensusReporter.org)
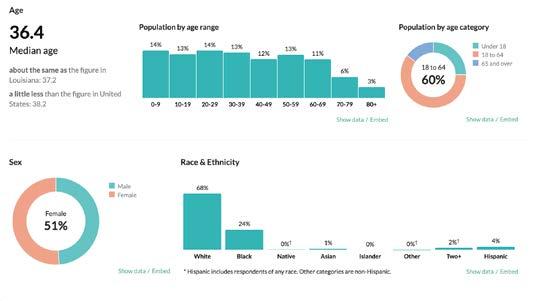
NOTES:
The Lake Charles MSA includes Calcasieu and Cameron Parishes
The geography of the Just Imagine SWLA aligns with the Lake Charles MSA
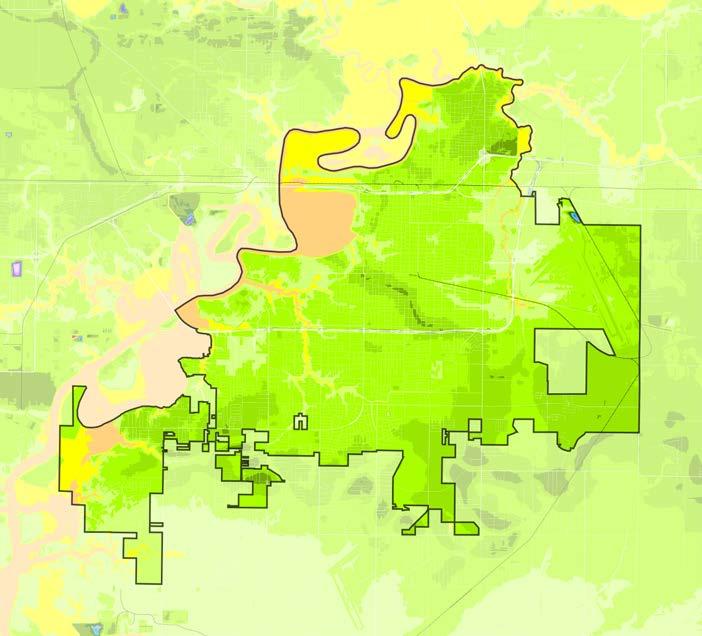
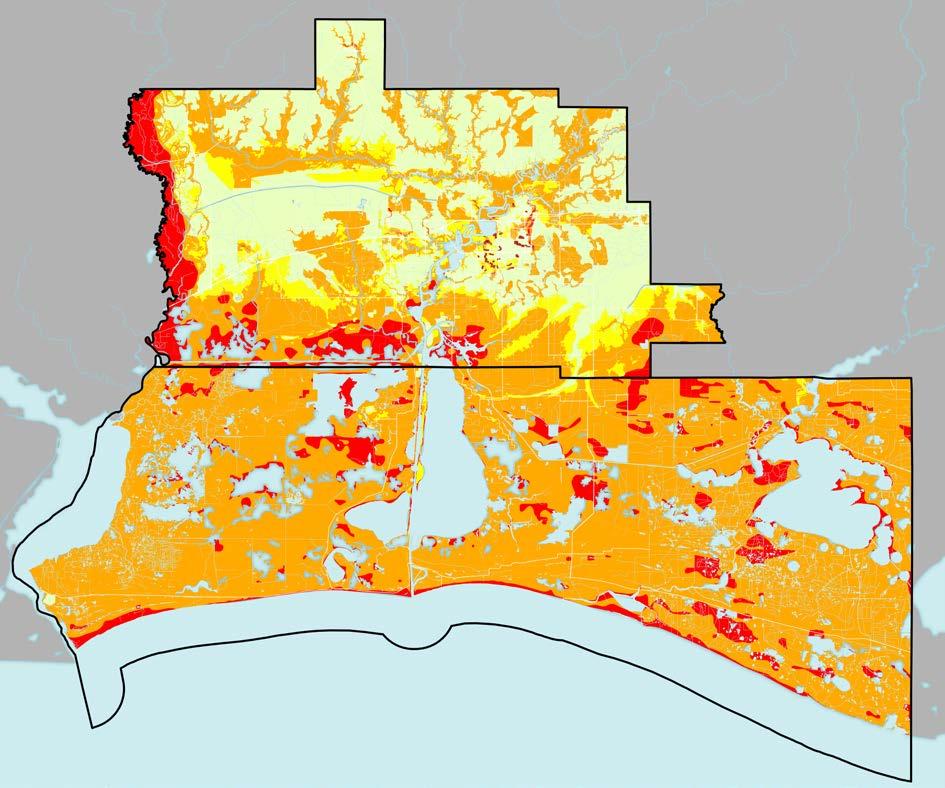
The landforms in Southwest Louisiana are primarily low-lying and relatively flat, with sweeping views. Ground elevations increase the further north from the coast one moves. Because higher elevations reduce the number of feet that a building will need to be raised to meet Base Flood Elevation (BFE) or the freeboard requirement, the existing landform conditions are in conflict with the southward progression of development in the region.
There are also a number of bayous and coulees that connect to the primary waterways. These smaller waterways impact flooding risks and factor into FEMA’s Risk Rating 2.0 for the National Flood Insurance Program (NFIP). As shown in the Flooding Risk map to the right, repetitive losses increase the risks.
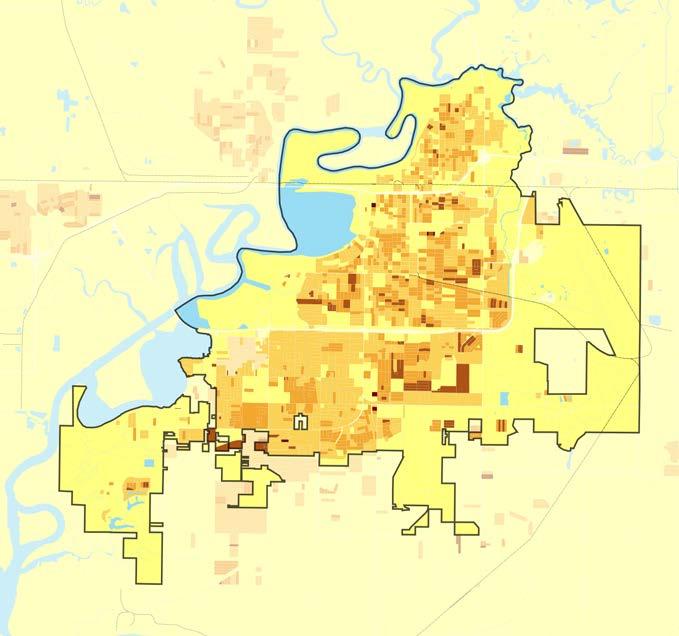
Ground Elevations, City of Lake Charles
Flood Risk, City of Lake Charles
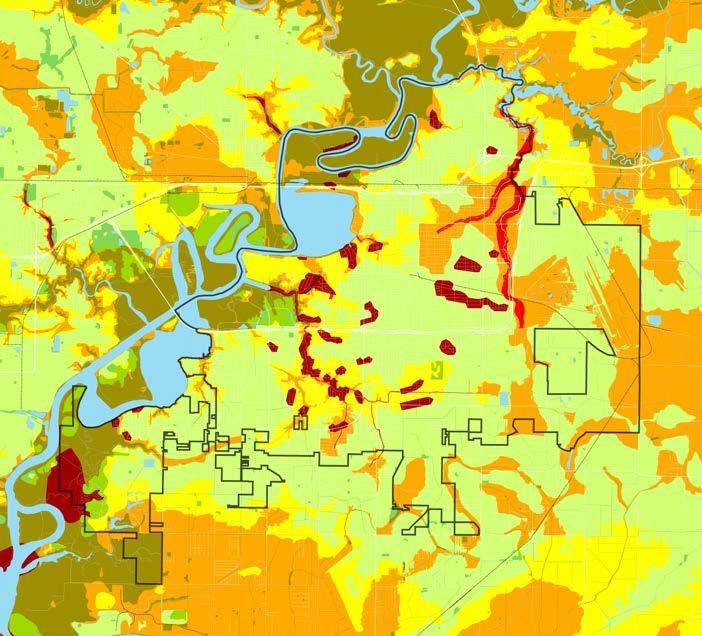
VERY LOW RISK
LOW RISK (2% ANNUAL FLOOD RISK)
MEDIUM RISK (1% ANNUAL FLOOD RISK)
HIGH RISK (COASTAL FLOOD ZONE & FLOODWAY)
REPETITIVE LOSS
To assess the infrastructure needs of the SWLA region, an inventory of the existing, scheduled, ongoing, and planned infrastructure was investigated and compiled. The resources used to collect this information included:
• LADOTD Statewide Transportation Improvement Plan (STIP)
• LADOTD Long Range Improvement Plan
• Metropolitan Planning Organization Transportation Plan (MTP)
• Capital Improvement Plan of Local Parishes, Municipalities, and Agencies
• Input from local stakeholders (Community Foundation SWLA, Infrastructure Guiding Group, local leaders, residential, public meeting attendees, comments submitted through the interactive online tools, etc.)
Once this information was compiled, an evaluation of additional needs was also developed to identify gaps in the needs of the region from a localized and regional perspective. All the information was organized and presented to key stakeholders and champions. Their input and feedback was used to refine and align the needs of the region with the improvements proposed. Stakeholders discussing infrastructure stressed the need for short-term and long-term success and growth in the region.
Strong, and hardened infrastructure is essential for a resilient SWLA; to support the long-term growth and functionality of this region, the current infrastructure is in need of upgrades.
Hard Infrastructure
• Roads
• Bridges and Ferries
• Utilities (water, sewer, gas, electrical, broadband, alternative energy)
• Stormwater/Drainage
• Coastal flood protection
• Ports (Air and Marine)
• Rail (Freight and Passenger)
• Transit System
• Trails, Sidewalks, and Bike Facilities
Social Infrastructure
• Public facility buildings (municipal/parish administration, public works, EMS, 911, etc.)
• Schools
• Hospitals
• Parks and Community Centers
1. LA 109 (FROM LA 12 TO BEAUREGARD)
2. NELSON RD EXTENSION & BRIDGE, PART 1
3. NELSON RD EXTENSION & BRIDGE, PART 2
4. TOPSY ROAD SIDEWALK
5. LA 3092 (FROM GAUTHIER RD AT LAKE ST ROUNDABOUT)
6. MYRTLE SPRINGS ROAD
7. I-10 WEST OF LA 108 TO I-210 INTERCHANGE
8. LA 12 BRIDGES, PART 1
9. LA 12 BRIDGES, PART 2
10. I-10 FROM TEXAS STATE LINE TO EAST OF COONE GULLY
11. LA 397 (LEFT TURN LANE AT MCNEESE EXTENSION)
12. LA 284 (MOVEABLE BRIDGE REPAIR AND RELATED WORK, BLACK BAYOU)
13. LA 378 (CALCASIEU RIVER WEST FORK BRIDGE REPAIRS AND RELATED WORK)
14. I-10 CALCASIEU RIVER BRIDGE (ENVIRONMENTAL)
15. I-10 CALCASIEU RIVER BRIDGE (P3 PROJECT)
16. ICWW MB REPAIR (GRAND LAKE) BRIDGE REPAIR AND RELATED WORK
17. LA 27 CAMERON FERRY LANDING REPAIRS, PART 1
18. LA 27 CAMERON FERRY LANDING REPAIRS, PART 2
Key Roads adjacent to 10 Catalytic Projects that are listed in the LADOTD Road Transfer program:
• Project 03: Mid-City Neighborhood Transformation
– W. Prien Lake Road
– Ryan Street
• Project 04: Nellie Lutcher District
– Enterprise Boulevard from Broad Street to I-10
– Broad Street from Enterprise headed east
• Project 05: McNeese University Area Resilient District
– W. McNeese Street
– University Drive
Road and Bridge Network
• Poor connectivity
• Outdated bridges throughout parish
• Congestion
• Lack of transit service
• Limited bike lanes/trails and sidewalks/trails
Utilities (water, sewer, gas, electrical, broadband)
• Lack of sewer and water
• Exposed overhead power lines
• Large land areas without access to power
Stormwater/Drainage
• Many areas easily flooded
• Occasional street flooding
Coastal Flood Protection
• Increased intensity of tropical storms and sealevel rise
• Prolonged damage to city infrastructure
Railroads
• Railroad crossing delays due to lack of grade separated overpasses
• Lack of safety gates at crossings
• Safety and mobility
• Connectivity and resiliency
• Improved access for industrial uses
• Elevation of roadways
• Coordination of land uses/development with transportation improvements
• Additional sewer and water pump stations
• Moving electrical lines underground
• Increase the capacity of existing drainage systems
• Pump stations
• Levee/gates surge protection system
• Flood Reduction Pump stations
• Interior drainage improvements
• High speed rail from NOLA to Houston
For more detailed infrastructure information, reference the following reports in the Appendix:
• Sewer Investigation
• SW Louisiana Master Transportation Plan Projects List
• Long Range Transportation Plan Summary
• Utility Electrical Investigation
• Water Infrastructure Capital Improvements
• LA Road Transfer Program Roads
Road and Bridge Network
• Roads not up to current LADOTD standards
• Additional East-West connections
• Non-ferry crossing of Calcasieu Lake
• Elevate evacuation roads
• Improved access for industrial uses
Utilities (water, sewer, gas, electrical, broadband)
• Exposed overhead power lines
• Unsustainable/Unsafe treatment plants/package plants
• Lack of sewer and water
• Exposed overhead power lines
• Large gaps of land with no access to power
• Limited sewer
Stormwater/Drainage
• Many areas easily flooded
• Outdated/undersized/poorly maintained
• Aging water towers
Coastal Flood Protection
• Underground electrical transmission and loop system
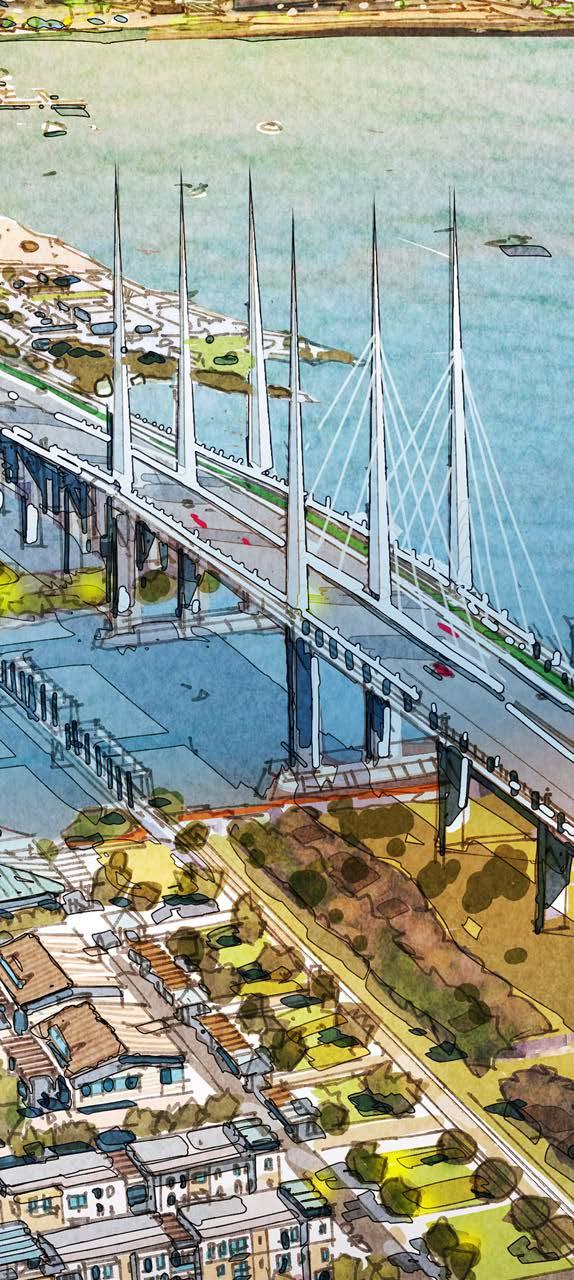
The I-10 bridge crossing over the Calcasieu River is a structure well over 70 years old. It is a steel girder bridge with steep grades that connects the City of Westlake and destinations west of the City of Lake Charles as well as provides marine navigation for various purposes (industrial, recreational, etc.). This bridge has been rehabilitated many times over the years and features two lanes in each direction with virtually no shoulders. Accidents on this bridge can result in miles of interstate backups and hours of delay depending on the severity of the crash. In the past 10 years, large industrial companies have increased traffic on the bridge and brought more attention to the ever increasing need for an improved bridge crossing.
Railroads
• Increased intensity of tropical storms and sealevel rise
• Lack of federal funding
• Prolonged damage to city infrastructure
• No RR lines currently
• Generators
• Upgrading lines to meet needs of increasing population
• Surge barrier reduction system
• Shoreline breakwater projects
• Saltwater intrusion prevention projects
• Extending rail from Chennault to Cameron
LADOTD worked with state and local leaders to propose the construction of a new bridge crossing that meets today’s standards, which include wider shoulders and travel lanes than what exists today. Access to industrial areas to the west and commercial and tourist areas to the east are important to encourage and promote continued economic development and growth.
DOTD is currently performing an environmental analysis to improve I-10 between the I-210 interchange to the west and east. The first phase is currently proposed to begin near the I-210 interchange to the west and end near the Ryan Street interchange in Lake Charles.
This project being proposed would be a P3 (Public Private Partnership), which will solicit investors to participate in the funding of design and construction of this phase of work. Once a P3 team is selected, the project design and construction process will begin. The finished product is likely to result in tolling of the segment constructed by the P3, until the funds collected from tolling reimburse the initial investment. Local leaders have stressed the importance of eliminating tolls for local trips.
The Parish hazard mitigation plans and the Calcasieu Long-Term Community Recovery plan support to the 10 Just Imagine SWLA projects. Key areas where the plans complement the projects include:
• Cameron Parish mitigation action Coastline Restoration Projects are potentially eligible for FEMA hazard mitigation assistance grants.
• Calcasieu Parish mitigation actions and projects addressing drainage support the Chennault & SOWELA Resiliency District and Strong Downtowns, with projects identified near the Sulphur and Westlake downtowns.
• The Calcasieu Long-Term Community Recovery plan and both mitigation plans offer direct support for the Community Resilience Hubs with mitigation actions and recovery priorities for safe rooms and shelters.
• The Calcasieu Long-Term Community Recovery plan supports the Redevelopment Authority with the recommendation to evaluate the creation of a recovery authority with broad ability to receive and quickly implement programs with federal and state funding.
Calcasieu Parish has identified 59 hazard mitigation projects to advance for FEMA hazard mitigation assistance grants. At this time, they have not been funded, however the Parish is confident most, if not all, will be funded.
• 34 drainage improvement projects totaling $189 million
– This will include increasing stormwater capacity through projects that increase the capacity of existing drainage laterals, widen channels, construct detention basins, and increase existing pump station capacity. Improving overall stormwater capacity and drainage will relieve flooding problems, reduce flood damage and costs of damage, reduce overtopping of roads with drain water, while also keeping open roadways during periods of high precipitation.
• 7 safe room projects totaling $31 million
– Construction of a safe room(s) for first responders and critical employees to remain in the parish during an event.
• 25 building retrofit/hardening projects for public infrastructure and facilities totaling $203million
– Harden critical facilities to maintain use during and after storm events. Hardening will reduce damage from high winds and other hazards to ensure the critical infrastructure can be used and operable during or after storms.
• 31 generator and communications projects totaling $11 million
– Purchase generators and install at critical facilities to continue essential operations parish-wide during events. Develop an interoperability/communications plan identifying resources and equipment needed to establish a single, interagency, mobile incident and communications command post.
Cameron Parish is using their current $9 million HMGP allotment for elevation and reconstruction of damaged facilities.
The most critical and prevalent hazards identified in the Cameron Parish Hazard Mitigation Plan (HMP) include:
1. Flooding from rivers and waterways, rainstorms, tropical cyclones, and hurricanes in the following forms:
– Riverine
– Stormwater
– Surge
– Backwater flooding (as the result of river flooding and surge)
– Coastal
2. High wind damage most commonly resulting from hurricanes, thunderstorms, and tornadoes
There are numerous other hazards of concerns like land loss, power outages, and extreme temperatures.
The HMP identified the prevalent exposures as:
3. Flooding:
– 89% of Cameron Parish population lives in the regulatory (1%) floodplain.
– 411 residential and 25 commercial lots are repetitive loss properties (2+ flood impacts in a 10-year period with insurance claims of $10,000+)
– All of the Cameron Parish essential facilities, with the exception of Grand Lake Schools and the Grand Lake Fire District #1 site, are in the regulatory (1%) floodplain and are at risk to storm surge for category 2 or higher hurricanes. Six are repetitive loss properties (fire and rescue, government, law enforcement, public health, and schools).
4. Wind:
– All populations and structures are vulnerable to wind from hurricanes, thunderstorms, and tornadoes.
– All essential facilities are vulnerable to wind from hurricanes.
– Wind also causes land loss due to coastal erosion including impacts on critical wetland, marsh, and mangrove ecosystems. These areas not only provide protection against hurricanes, they offer critical habitat for fish, birds, and other species.
The Cameron Parish HMP identifies key mitigation actions and corresponding activities that will address the hazards:
1. Flooding Mitigation Actions:
– Drainage Improvements: Improvements to ensure usability of roads and buildings that serve a public purpose such as government, healthcare, and school districts by retrofitting and improving drainage structures to reduce flood risk.
– Acquisitions and Elevations: $9 million in HMGP dedicated to these projects: Continue to mitigate flood damage by acquiring properties in the parish. Mitigate parish flood damage by elevating homes and buildings throughout the parish.
– Coastline Restoration: See CPRA information: Identify and implement coastline preservation and restoration projects that continue to protect the parish coastline from coastal hazards.
– Additional Flood Mitigation Measures: Elevate, acquire, floodproof, floodgates, floodwalls, green infrastructure, blue-green infrastructure, nature-based solutions (e.g., stream restoration), increased storage and conveyance (culverts, drainage system improvements)
2. Wind Mitigation Actions:
– Safe rooms: Construction of a safe room for first responders located in Cameron Parish.
– Building Retrofits: Improvements to reduce damage from high winds and help assure that the public buildings can be used, occupied, and operable during or after storms.
– Additional Wind Mitigation Measures: Maintain vegetation (trim large trees); install pressure-rated windows or storm shutters; manage loose roof shingles; add additional roof clips or hurricane straps to roofs; safe rooms.
• Sea level rise leads to coastal erosion, subsidence, land loss, and more frequent coastal flooding, which has significant impacts on transportation and other infrastructure, as well as critical wildlife habitat and coastal recreation areas.
• Increased intensity and frequency of tropical cyclones leads to coastal erosion, wetland degradation, and significant impacts to people and their homes as well as damage to critical wildlife habitat and coastal recreation areas.
• Increased frequency and intensity of thunderstorms and rainfall events leads to more frequent and less predictable flooding.
• Other Information
– Sea level around Louisiana is up to 24 inches higher than it was in 1950 (NOAA).
– In the worse emissions scenarios, Louisiana could see a seven-foot rise in water levels, which when combined with subsidence, would likely result in the loss of another 2,250 to 4,150 square miles of coastal wetland (Master Plan).
The most critical and prevalent hazards identified in the Calcasieu Parish Hazard Mitigation Plan (HMP) include:
1. Flooding from rivers and waterways, rainstorms, tropical cyclones, and hurricanes in the following forms:
– Riverine

– Stormwater
– Surge
– Backwater flooding (as the result of river flooding and surge)
2. High wind damage most commonly resulting from hurricanes, thunderstorms, and tornadoes
3. Drought, extreme heat, and wildfires (noted to cause property and crop damage)
There are numerous other hazards of concern, like land loss and power outages.
The HMP identified the prevalent exposures as:
1. Flood
– 52% of Calcasieu Parish population lives in the regulatory (1%) floodplain.
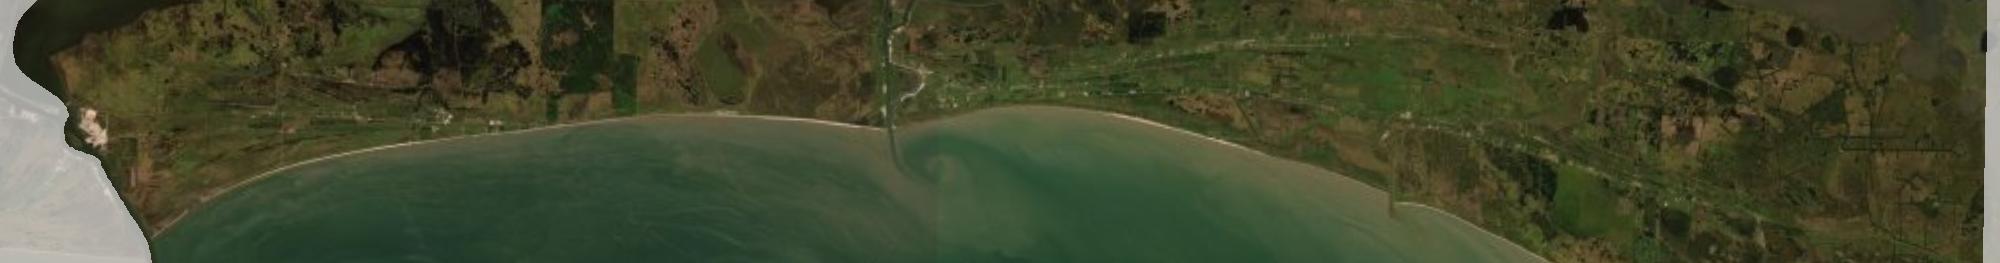
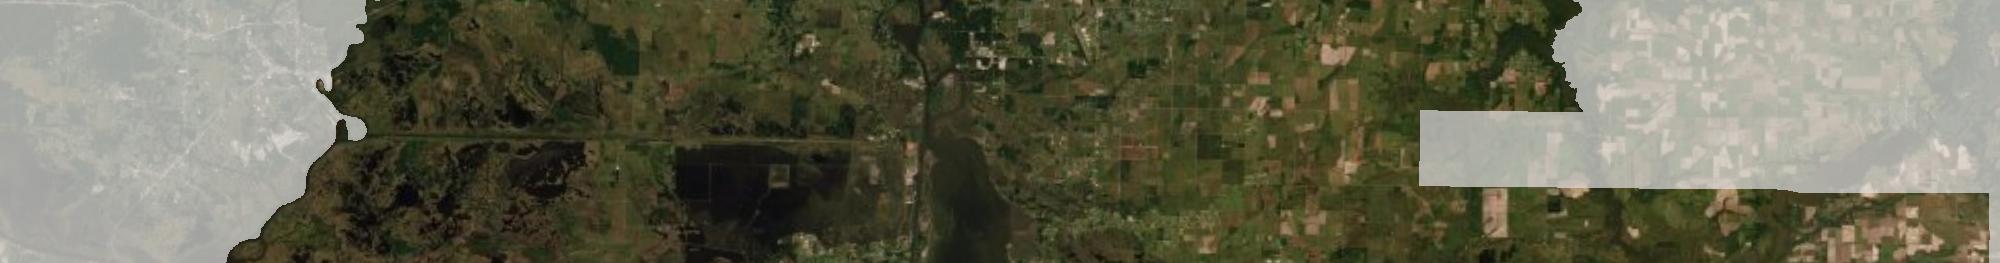

– 883 residential and 2 commercial lots are repetitive loss properties.

– Many Calcasieu Parish essential facilities are in the regulatory (1%) floodplain. 21 are repetitive loss properties.
– See the list on page 60 for a breakdown of the essential facilities in the floodplain. Required
– All populations and structures are vulnerable to wind from hurricanes.
– All essential facilities are vulnerable to wind from hurricanes.
– Wind also causes land loss due to coastal erosion including impacts on critical wetland, marsh, and mangrove ecosystems. These areas not only provide protection against hurricanes, they offer critical habitat for fish, birds, and other species.
The Calcasieu Parish HMP identifies key mitigation actions and corresponding activities that will address the hazards:
1. Flooding Mitigation Actions
– Building Retrofits (25 HMGP projects totaling $203 million): Harden critical facilities to maintain use during and after storm events. Hardening will reduce damage from high winds and other hazards to ensure the critical infrastructure can be used and operable during or after storms.
– Drainage Improvements (34 HMGP projects totaling $189+ million): This will include increasing stormwater capacity through projects that increase the capacity of existing drainage laterals, widening channels, constructing detention basins, and increasing existing pump station capacity. Improving overall stormwater capacity and
drainage will relieve flooding problems, reduce flood damage and damage costs, and reduce overtopping of roads with drain water while keeping open roadways during periods of high precipitation.
– Acquisitions and Elevations: Elevation, acquisition demolition, acquisition, relocations, and reconstruction of repetitive loss, severe repetitive loss, substantially damaged, and/or other hazard-prone properties.
2. Wind Mitigation Actions
– Safe rooms (7 HMGP projects totaling $31 million): Construction of a safe room(s) for first responders and critical employees to remain in the parish during an event.
– Generators and Communications (31 HMGP projects totaling $11 million): Purchase generators and install at critical facilities to continue essential operations parish-wide during events. Develop an interoperability/communications plan identifying resources and equipment needed to establish a single, interagency, mobile incident and communications command post.
3. Wildfire Mitigation Actions
– Ordinances: Strengthen penalties and improve enforcement capabilities of burn ban ordinance.
• Increased intensity and frequency of tropical cyclones leads to wetland degradation, and significant impacts to people and their homes as well as bayous and natural areas that include critical habitat and recreation areas.
• Increased frequency and intensity of thunderstorms and rainfall events leads to more frequent and less predictable flooding.
• Increased frequency of drought and heat waves could lead to more wildfires.
Fire and rescue — 14 in floodplain
Government — 18 in floodplain
Law enforcement — 9 in floodplain
Public health and nursing homes — 3 in floodplain
Schools — 22 in floodplain
Calcasieu Parish Hazard Mitigation Plan Update (2020)
Cameron Parish Hazard Mitigation Plan Update (2020)
2019 State of Louisiana Hazard Mitigation Plan Update
National Hurricane Center National Storm Surge Hazard Maps https://www.nhc.noaa.gov/nationalsurge/#map
GENERATORS
DRAINAGE
INFRASTRUCTURE HARDENING
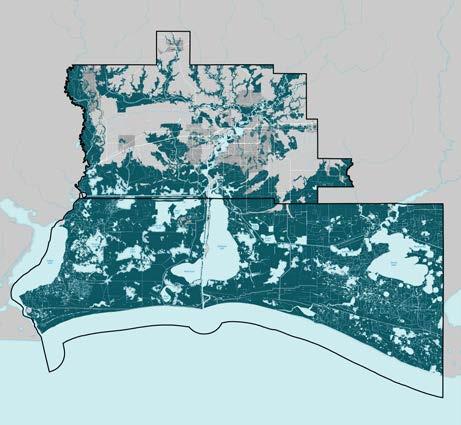
SAFE ROOMS
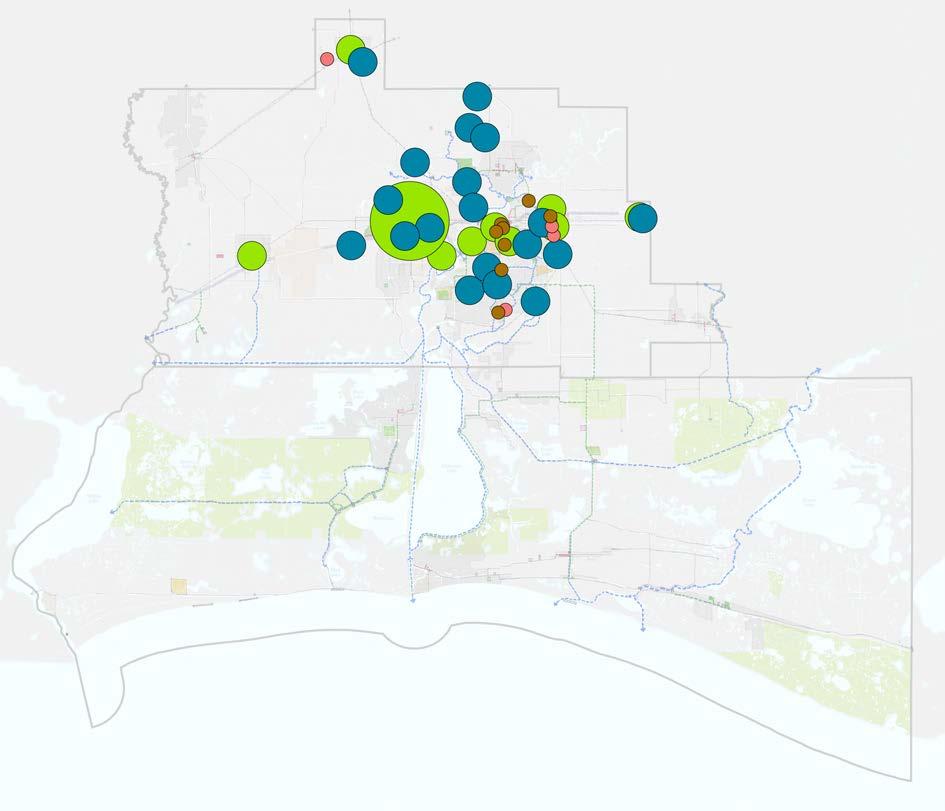
Positive Economic Growth Cycle: Southwest Louisiana faces a challenge in attracting and retaining new residents, employees for existing businesses, and new businesses. Investments in quality-of-life (trails, places to walk, mixed-use entertainment districts, and things for families to do) will both encourage existing residents to stay, but will also start to attract new residents and businesses. This growth will bring additional tax revenue to the region, allowing further investments to be made in quality of life and the built environment.
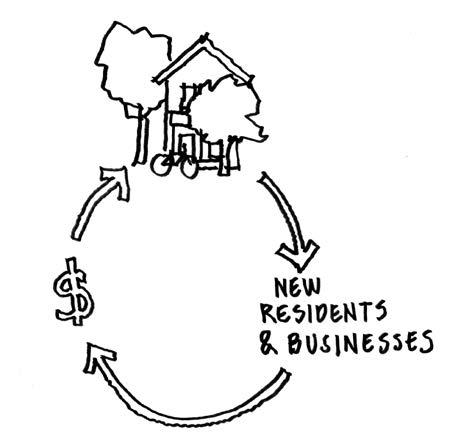
Utilizing a wide variety of federal and proprietary data sources, the team analyzed the past and projected economy of Lake Charles. The area saw large drops in employment, business closures, and outmigration due to the natural disasters. Lake Charles has an opportunity to build on its strengths while diversifying into other industries that will make it an attractive destination for residents and visitors.

From 1990 to 2018, the Lake Charles MSA experienced 60% employment growth. Between 2018 and 2020, there was a 25% reduction. Compared to the state of Louisiana and the Beaumont, TX metropolitan area, the growth in the Lake Charles MSA outpaced the state from 1990 and 2018; however, the drop in employment growth between 2018 and 2020 was more drastic.
The projections indicate that the region will grow by 9% in 2022 and another 6% in 2023, based on returning construction (Scott). ULL projects more modest growth in employment.
The chemical industries are attracted to Calcasieu Parish due to the long-time presence of these industries in the region along with state and local taxation incentives, economic development programs, and the national and international marketplace for chemical products. LNG industries are location-dependent and will continue to be attracted to the SWLA region, where previous investments have been made.
The construction industry includes routine maintenance, small projects, and large projects. Large projects have slowed since the 2010-2019 period, but should pick up again as additional LNG plants are constructed.
Investments will enable Chennault to expand its portfolio and attract new tenants thereby stimulating growth in regional employment.
The City of Lake Charles has identified three economic development districts. These districts increase the sales tax and allocate it to economic activity within the boundary.
• I-10 Corridor Economic Development District
• Enterprise Boulevard Economic Development District
• Lakefront Economic Development District
The City of Westlake also created an economic development district along the waterfront to incentivize the Horseshoe Casino and adjacent development.
Opportunities for growth exist in several sectors of the economy:
• Leisure/hospitality (non-casino)
• Professional and business services
• Healthcare
• Finance
• Expanded role of ports:
– Potential transition to containers
– Port of Lake Charles
– Cameron ports
Growth opportunities should expand the SWLA marketplace to include southeastern Texas, national, and global potential. Other issues need to be addressed simultaneously and are essential for growth — housing, infrastructure, community involvement, natural and cultural resources, and protection of the community’s assets.
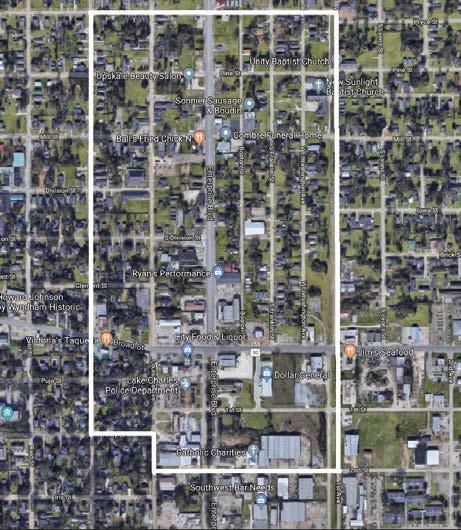
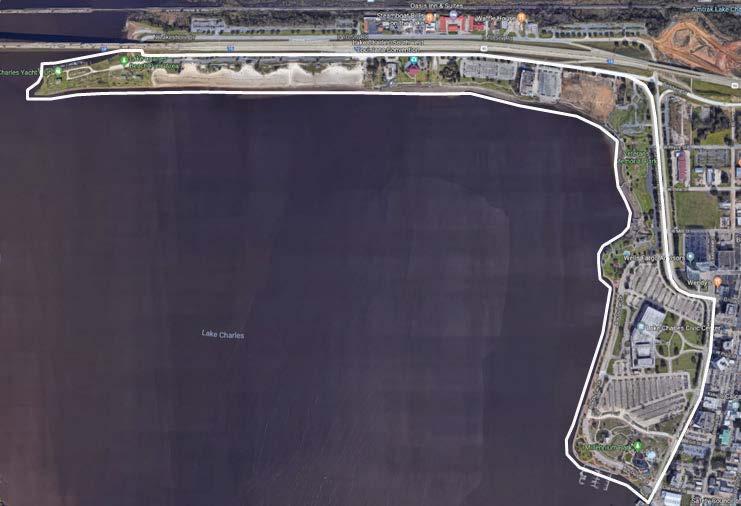
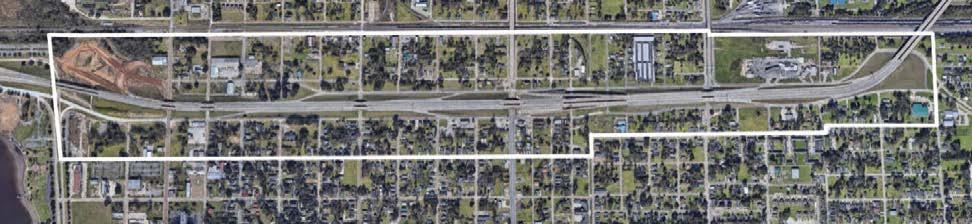
The economic development team compared the Lake Charles MSA to 10 peer MSAs:
10. Virginia Beach, Virginia
These cities were compared to the Lake Charles MSA along the four following metrics:
• Population: The Lake Charles MSA has the lowest population growth rate of the 11-region data set.
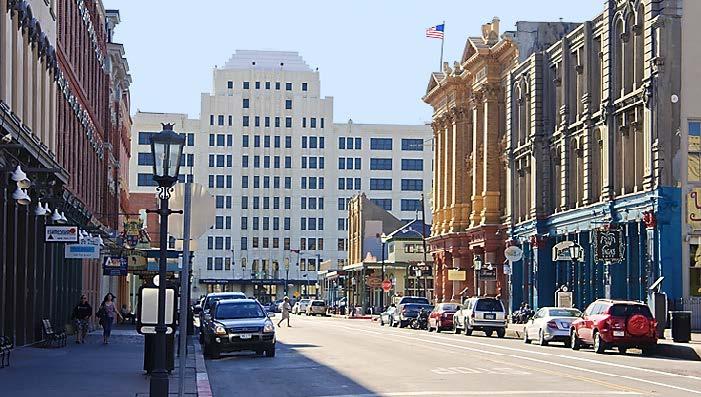
• Total Employment: The Lake Charles MSA experienced rapid employment growth between 2015 – 2018, but growth dropped off sharply, such that by 2019, the Lake Charles MSA was outpaced in employment growth by six of the 10 comparison regions.
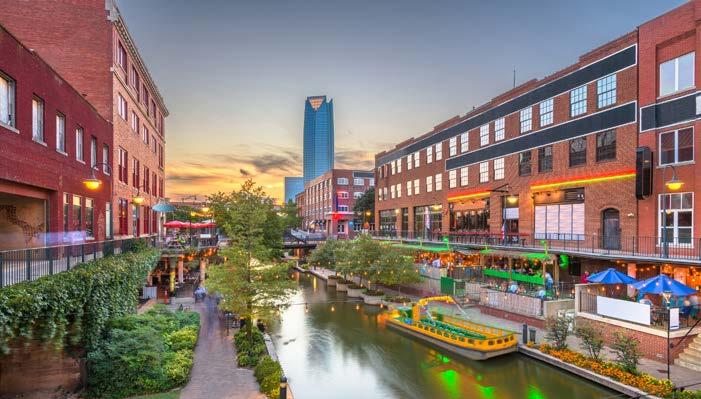
• Personal Income: Personal incomes are higher in nine of the 10 peer regions than in the Lake Charles MSA.
• Total Real GDP: Total Real GDP in the Lake Charles MSA is significantly more volatile than the GDPs of the comparison regions. Furthermore, the Lake Charles MSA is below the GDPs of all 10 of the comparison regions.
Preliminary results show that the areas projected to grow the most in absolute terms are the local industries with low supply chain needs met in the region. This points to the need to increase the percentage supply chain needs that can be met locally.
Clusters with the highest potential for job growth and local supply chain deficits include:
• Hospitality and tourism
• Water transportation
• Aerospace
• Insurance services
• Performing arts
Occupations projected to grow most in terms of jobs and job openings generally do not require post-secondary education. This emphasizes the need for an immediate focus on quality of life to attract more residents to the region in general.
Some of the cities that are used as examples have experienced much stronger growth and have weathered economic downturns far better
as examples have experienced much stronger growth and downturns far better
Openings forecasts show that most needed bachelor’s degrees will be in the fields of:
• Business
• Education
• Health
• Personal and culinary services
Two of the top employment clusters (local real estate, construction, and development and construction products and services) are projected to lose jobs over the next 10 years. Both of these job categories are related to construction, underlining the importance of diversifying the SWLA economy to ensure high-paying jobs remain as sectors evolve.
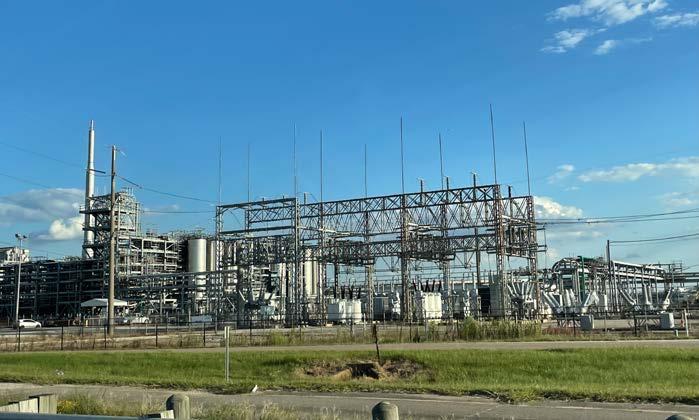
Given that many of the projected job growth sectors do not require formal educational credentials or require a high school diploma or equivalent, the
strategy should be to attract more people, regardless of educational attainment and to award more bachelor’s degrees in the areas listed as showing higher demand for graduates.
Current gaps in the area show a need for the following occupations:
• Educational instruction and library
• Transportation and material moving
• Healthcare support
• Community and social services
• Personal care and services
• Healthcare practitioners and technicians
• Business and financial operations
Some of the cities that are used as examples have experienced much stronger growth and have weathered economic downturns far better
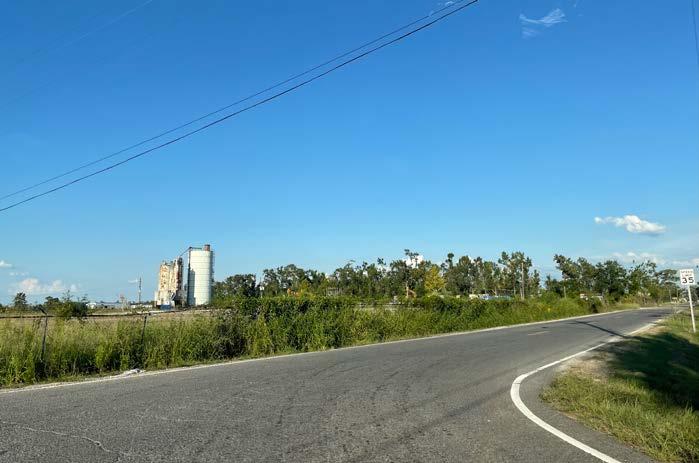
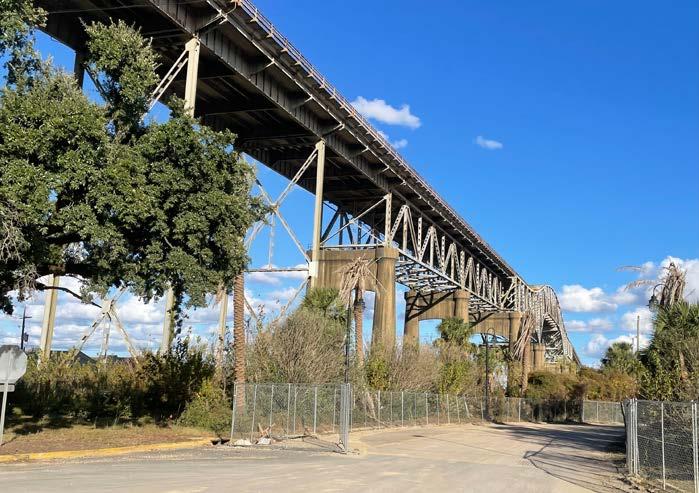
In tradable sectors, goods and services are traded outside the region where they are produced. These sectors tend to be geographically concentrated and historically have higher outputs per job. Workers tend to be more educated, work more hours, and earn higher average wages. While tradable sectors are often thought of as manufacturing, the category also includes other industries where products can be exported, such as tradable services or technology.
Currently, over half the tradable sector jobs in SWLA are concentrated in manufacturing.
Nontradable or local sector services can only be consumed in the economy in which they are pro -
duced. These nontradable sector transactions play an important role in affecting the regional economic capacity and the health of the traded sector.
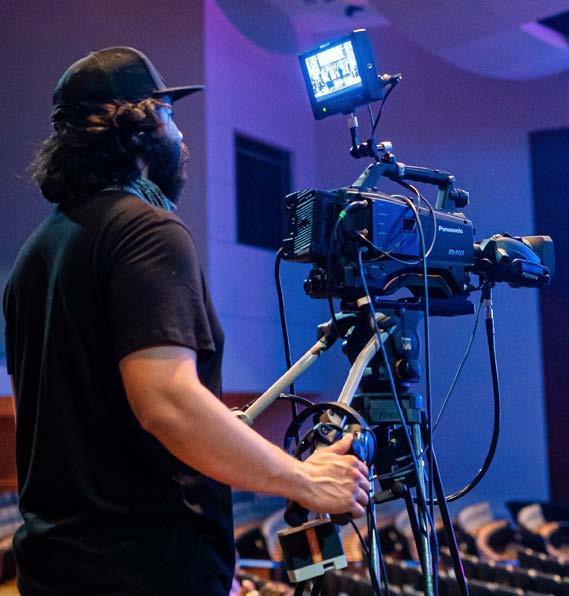
Having a weak local sector lowers the traded sector’s competitiveness. Examples of this include having poor local construction conditions, subpar schooling and healthcare systems, which impact the local workforce, or having low quality of life, which decreases the ability to attract employees and higher-paid workers to the area.
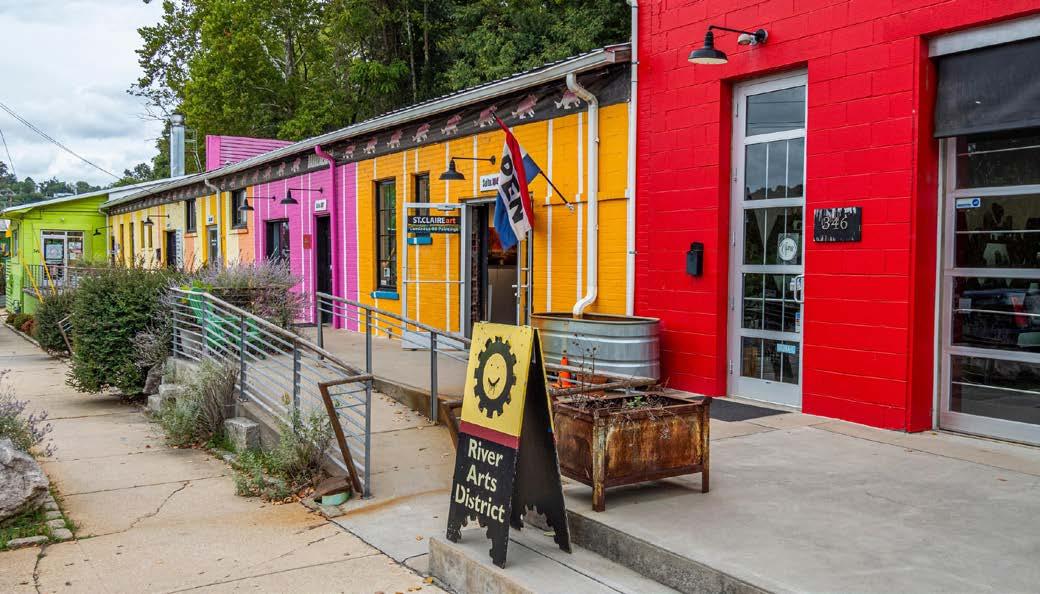
Currently, the largest concentration of jobs in the local sector in SWLA is in construction. This analysis reinforces the themes reiterated by thousands of people during the Just Imagine process — SWLA lacks the quality of life amenities (desti-
nations, restaurants, shopping, recreation, trails, etc.), which affects the ability of employers in the region to attract and retain employees.
Calcasieu and Cameron parishes need to change the mix of tradable sector jobs. Increasing the high-skilled tradable sector jobs has a larger multiplier effect than non-high-skilled tradable jobs. Secondly, the regions must build an environment conducive to nontradable sector growth. As nontradable (local) services increase in number and quality, so does the quality of life, increasing the competitiveness and recruiting for new tradable businesses.
The Cultural (and Creative) Economy sector makes up a small amount of employment in the area (between 1 and 9%, depending on the source) and a small proportion of area GDP (between 0.6 to 3.1%).
The top creative and cultural employers in the area are:
• Independent artists, writers, and performers
• Used merchandise stores
• Civic and social organizations
• Fine arts schools
• Photography studios
However, the absolute numbers of jobs is relatively low as a percentage of jobs in the region.
The creative industries that are projected to grow the most from 2021–2023 are:
• Civic and social organizations
• Promoters of performing arts, sports, and similar events without facilities
• Software publishers
In creative industries, the biggest gaps for workers occur in the following professions:
• Teachers
• Performers
• General workers
• Designers (within jobs requiring a bachelor’s degree)
The cultural and creative economy produces nontradable experiences that are specific to the local environment. Expanding cultural offerings in SWLA such as performances, events, floral services, photography, specialty craft materials and instruction, and entertainment will accomplish multiple objectives:
• Grow the nontradable sector
• Improve quality of life and the diversity of experiences available in the region
• Attract and retain experienced employees in the tradable sectors
There is also an opportunity to build on the tradeable strength of the area by expanding creative manufacturing. This will build up the local sector and result in new businesses and venues that will enhance the quality of life with a supply source right next door.
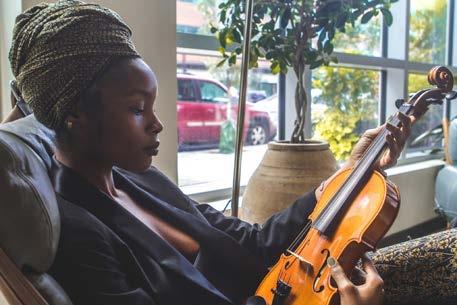
Examples of creative jobs and professions include:
• Artists (Painters, Sculptors, Mixed-Media)
• Illustrators
• Art Dealers
• Art Directors
• Performers (Dancers, Musicians, Actors, Spoken Word Performers)
• Theater Companies and Dinner Theaters
• Television Broadcasting
• Film Direction and Production
• Special Effects Artists and Animators
• News Analysts, Reporters, and Journalists
• Writers, Authors, Editors, Book Store Owners
• Radio Stations and Podcasting
• Advertising Professionals
• Photographers
• Architects
• Landscape Architects
• Interior Designers
• Screen Printers
• Graphic Designers
• Software Publishers and Designers
• Library Technicians and Media Collections Specialists
• Furniture Repair and Reupholstery
• Upcycling and Resale
• Jewelry, Watch, Precious Stone, and Precious Metal Merchants and Wholesalers
Southwest Louisiana has a strong foundation of plans and ongoing projects on which to build.
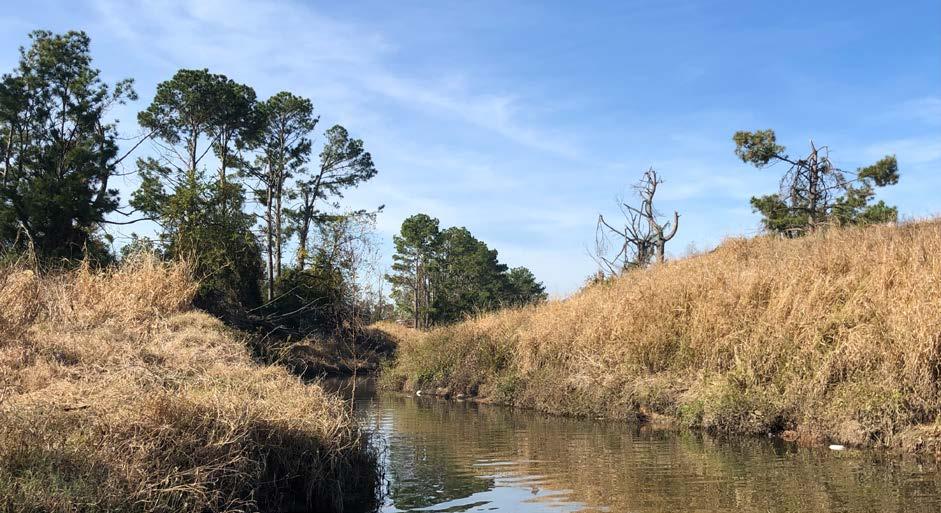
The Just Imagine process built on previous work that analyzed the region’s strengths, challenges, and opportunities. This plan lifts up many of the recommendations developed in response to those challenges. The catalytic projects and plan recommendations are more implementable as a result
of the strong foundation of planning and existing working relationships.
Additionally, many projects are currently moving forward, or are planned to move forward, once funding is in place.


• The Just Imagine 50-Year Resilience Master Plan for Calcasieu and Cameron parishes builds on the Calcasieu Parish LTCRP.
• The LTCRP addresses immediate recovery from Hurricanes Laura and Delta and meets FEMA’s guidelines for the creation of a plan that will qualify Calcasieu Parish for funding, based on recommendations.

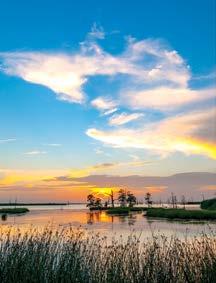
• Additionally, one of the recommendations in the LTCRP was to create a regional resilience master plan.
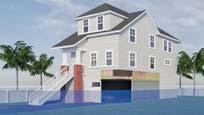

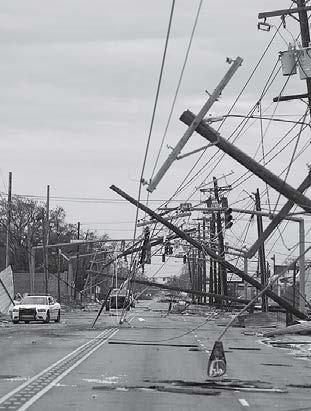

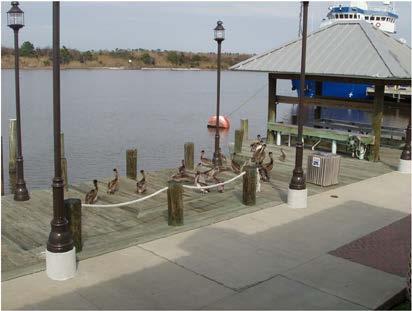
• The 50-Year Resilience Master expands the geography to include Cameron Parish, which does not have a LongTerm Community Recovery Plan.
• The 50-Year Resilience Master Plan looks at a longer timeframe than the LTCRP and explores the needed investments for future growth, beyond disaster recovery.
• The 50-Year Resilience Master Plan focuses on the implementation of 10 defined catalytic projects, some of which are also mentioned in the LTCRP.

Calcasieu Parish Plans and Studies
• Calcasieu Parish Hurricanes Laura and Delta Recovery Framework
• Calcasieu Parish Hazard Mitigation Plan (2020)
• Calcasieu Parish Strategic Plan (2022–2024, 2019–2022)
• Calcasieu Parish Coastal Restoration Master Plan (2018)
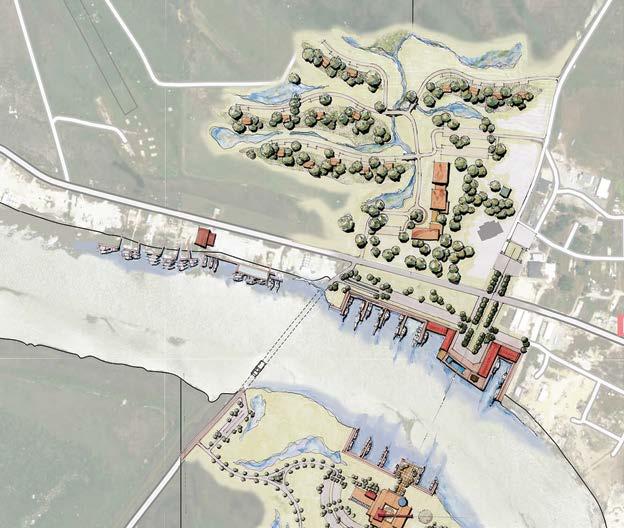
• Calcasieu Parish Drainage Study (2019)
• Calcasieu Parish Stormwater Management Program Plan (2018–2023)
• Vision Calcasieu (2009)
Cameron Parish Plans and Studies
• Cameron Parish Hazard Mitigation Plan (2020)
• Cameron Answers: Solutions for the Future of Cameron Parish, Master Research Summary (2013)
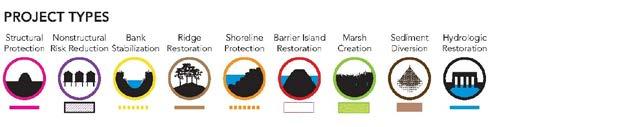
City of Lake Charles Plans and Studies
• City of Lake Charles Capital Improvement Plan (2017–2023)
• City of Lake Charles Bicycle and Pedestrian Master Plan (2012)
• Downtown Lake Charles: Analysis of Residential Market Potential
• Downtown Lake Charles: Commercial Market Findings
Regional Plans and Studies
• Hurricanes Laura & Delta Recovery Housing Study (2020)
• Louisiana Housing Needs Assessment: Region 5 Lake Charles (2019)
• Bayou Bikeshare Feasibility and Implementation Plan
• Southwest Louisiana Comprehensive Economic Development Strategy (2016)
• Lake Charles Urbanized Area 2045 Metropolitan Transportation Plan
• Transportation Improvement Program for the Lake Charles Urbanized Area (2019–2022)
• Coordination in Human Services Transportation Plan (2020–2023)
• Lake Charles Regional Intelligent Transportation Systems Architecture (2017)
Louisiana State Plans and Studies
• Statewide Transportation and Improvement Plan (2019–2022)
• Statewide Human Services Transportation Coordination Plan (2018)
• CPRA 2017 Coastal Master Plan
• Louisiana Watershed Initiative: Greinwich Terrace Buyout Program
• Louisiana Watershed Initiative: Watershed Mapping and Modeling Program
• Louisiana Climate Action Plan
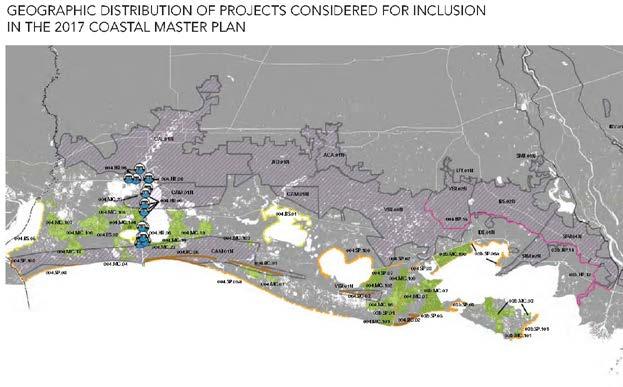

There are currently over 20 oil and gas and petrochemical mega projects in Calcasieu and Cameron parishes, each investing over $100 million in capital expenditures. The projects include gas-toliquid (GTL) projects, liquefied natural gas (LNG) plants, and other projects such as port investments, electrical plants, and methanol/ethanol processing plants. These projects have attracted and will continue to attract specialized engineering professionals and associated professions to the region. Large scale industry makes up an important portion of the region’s economy, but also needs to be supplemented with more diverse scales and types of production, professional, and creative industries in order to maximize SWLA’s potential.
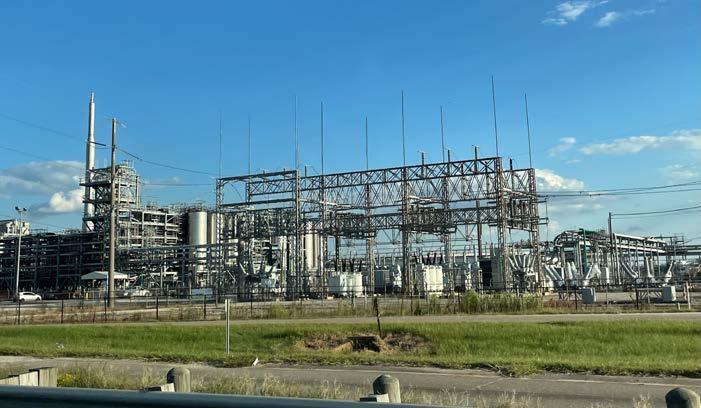
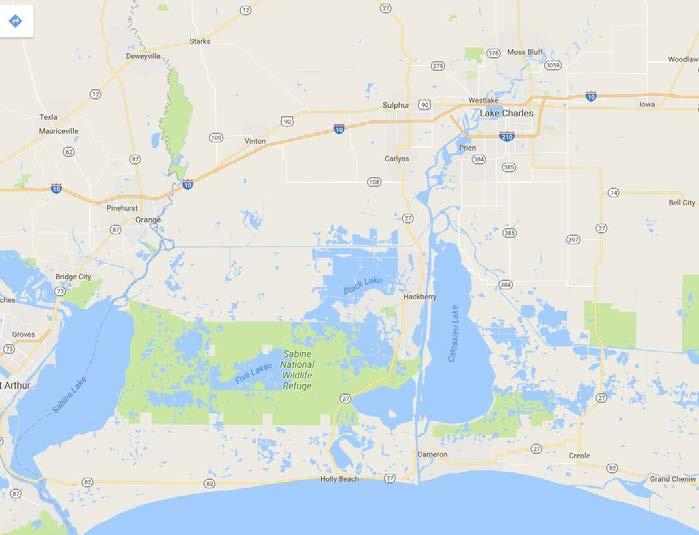
National Parks Service: Rivers, Trails, and Conservation Assistance (RTCA) Program
Southwest Louisiana is the recipient of a competitive grant through the National Parks Service (NPS), supported by FEMA. The grant provides technical assistance through the Rivers, Trails, and Conservation Assistance (RTCA) program. NPS-RTCA assists communities and public land managers in developing or restoring parks, conservation areas, rivers, and wildlife habitats, as well as creating outdoor recreation opportunities and programs that engage future generations in the outdoors.
In SWLA, six projects were identified that will benefit the region’s access to outdoor amenities and bolster long-term recovery:
1. West Park — The process will develop a concept plan to restore West Park in DeRitter.
2. Mill Creek — The Mill Creek project will develop a potential pilot project for public outdoor recreation and flood mitigation in Allen Parish.

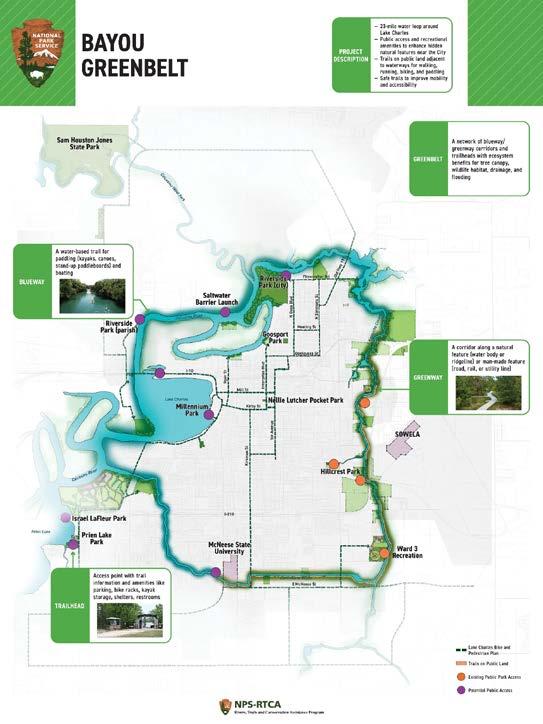
3. Calcasieu Parish Parks — The Calcasieu Parish Parks project will develop a parks inventory to be used as a public outreach tool and will explore concepts for disaster-impacted parks.
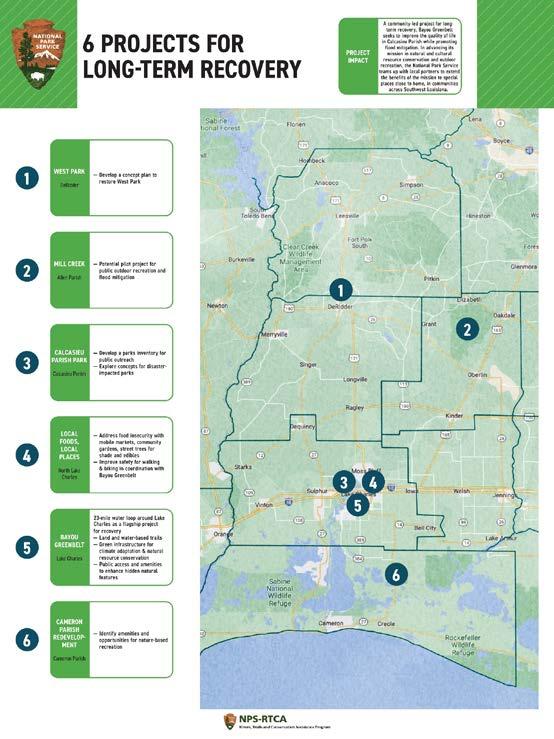
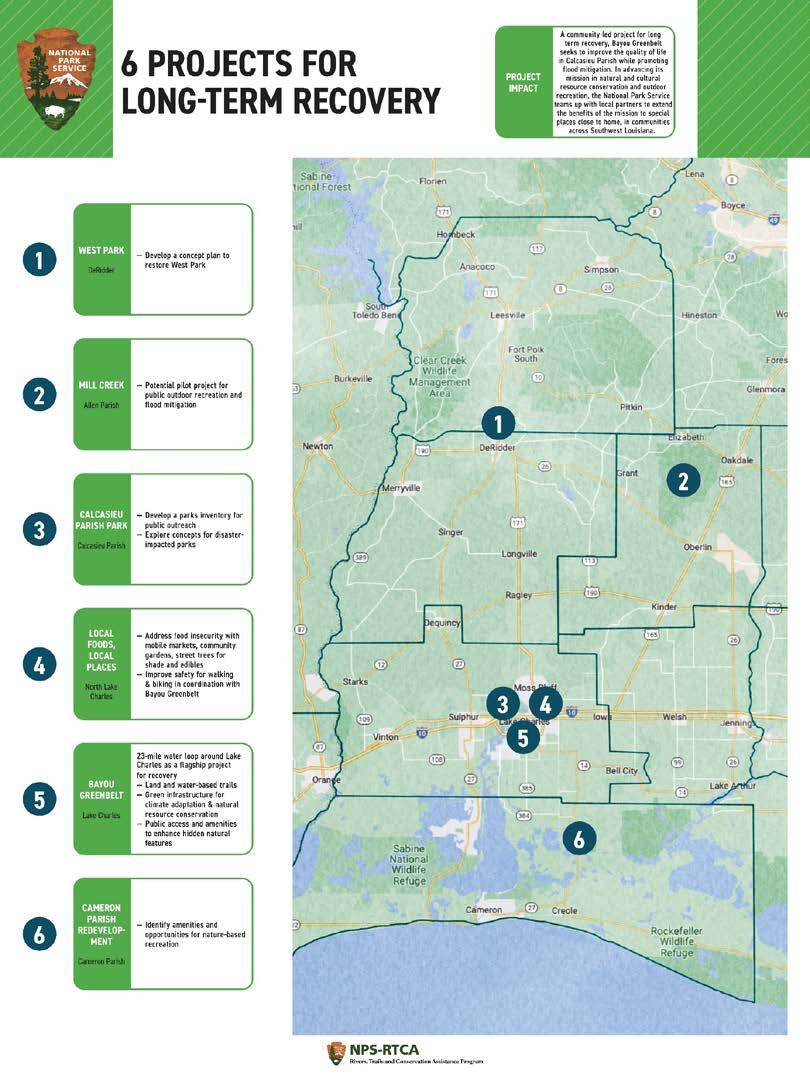
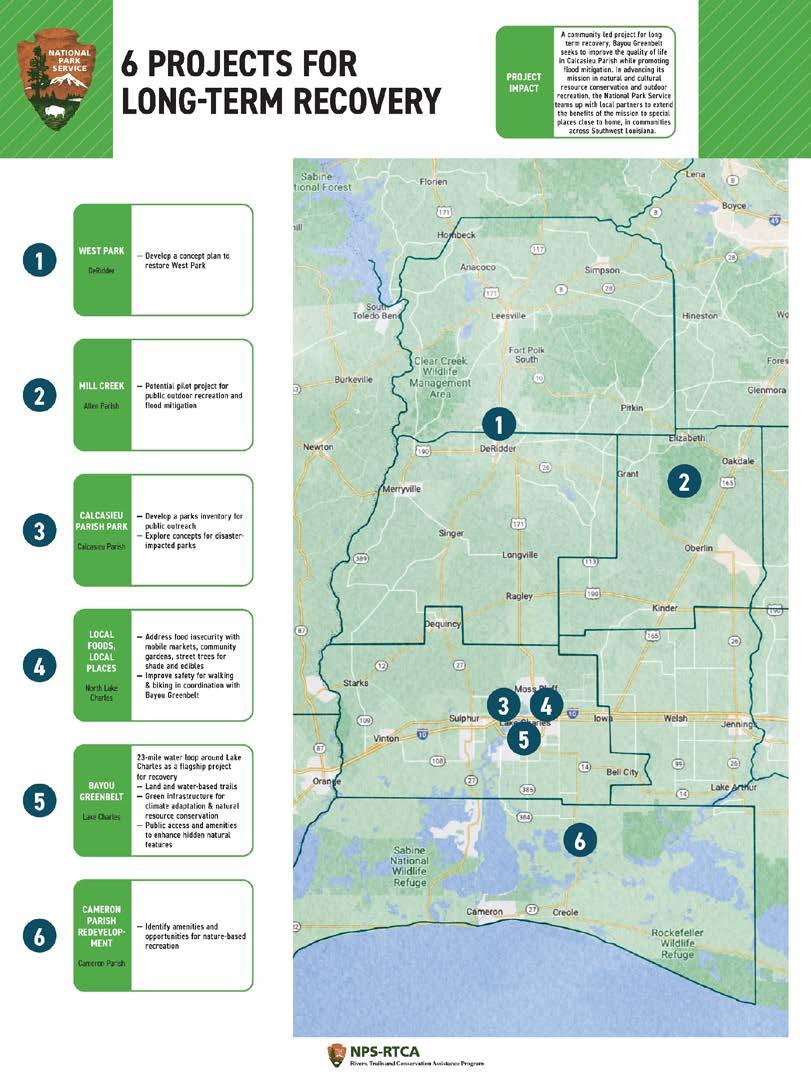

4. Local Foods, Local Places — The Local Foods, Local Places projects is addressing food insecurity, especially in North Lake Charles, through mobile markets, community gardens, and street trees for shade and edibles. The project will improve safety for walking and biking in coordination with the Bayou Greenbelt project.
5. Bayou Greenbelt — Bayou Greenbelt will be a 23-mile water loop around Lake Charles that will expand public access and recreational amenities to enhance hidden natural features that are near and within the city, but not currently accessible. The project will build trails on public land adjacent to waterways for walking, running, biking, and paddling. This project will have a measurable impact on the quality of life in Calcasieu Parish and the region, while improving flood mitigation. Bayou Greenbelt will be a cultural and environmental resource.
6. Cameron Parish Redevelopment — The Cameron Parish project will identify amenities and opportunities for nature-based recreation.

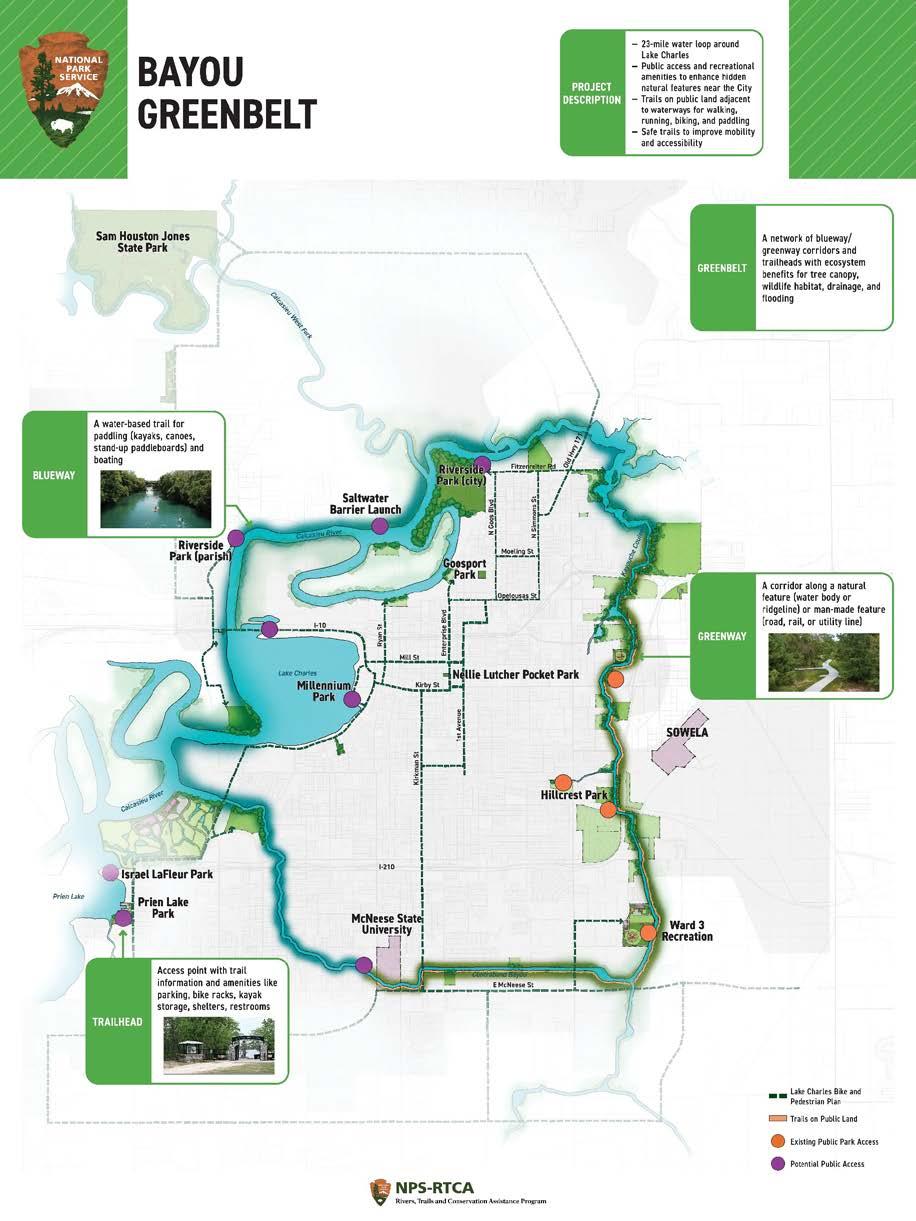
Just imagine...a dynamic region, with enviable quality of life, that allows all existing and future residents and businesses to thrive.
Each of the 10 catalytic projects addresses the five plan topic areas. In addition to the specific recommendations, additional policy recommendations and actions in each of the five topics will be critical to help the region reach its resiliency goals.
The Just Imagine: 50-Year Resilience Master Plan for Calcasieu and Cameron parishes intentionally aligned the plan topics with five of the six Recovery Support Functions (RSFs) in the CPPJ Hurricanes Laura and Delta Long-Term Community Recovery Plan. The five plan topics in the 50-Year Resilience Master Plan are:
1. Community Planning (RSF 1 — Community Planning and Capacity Building)
2. Housing (RSF 4 — Housing)
3. Economic Development (RSF 2 — Economic)
4. Infrastructure (RSF 5 — Infrastructure)
5. Natural and Cultural Resources (RSF 6 — Natural and Cultural Resources)
The issues covered in Recovery Support Function
3 — Health and Social Services were not included in the scope of the Just Imagine process. These include health, behavioral health, public health infrastructure, education, and social services. These topics were raised by community members and stakeholders through the process. The project team and Community Foundation affirm that these issues are critically important to the success and growth of the region. While they couldn’t be directly addressed, many of the Just Imagine recommendations acknowledge the interconnectedness and impact of health, well-being, and education on the five included plan topics.
The vision, goals, projects, and recommendations in the Just Imagine Master Plan are uniquely positioned to affect positive change in SWLA.
• The plan includes Calcasieu and Cameron parishes, and many recommendations are applicable and relevant to the entire region.
• Thousands of people engaged in the process across Calcasieu, providing over 7,300 comments and ideas, which generated and affirmed the vision.
• The process was led by the Community Foundation and supported by both parishes and the municipalities within Calcasieu and Cameron parishes. The neutral and regionally inclusive leadership helped to convene public, private, community, and non-profit partners.
• There is an intentional focus on implemen-
tation that includes action steps, funding sources, partnerships, and time frames.
The people of Southwest Louisiana envision a future that is focused on collaboration, quality of life, resilient housing, a diverse and strong economy, reliable infrastructure, and protection of its unique natural and cultural resources. The vision statements are located immediately to the right.
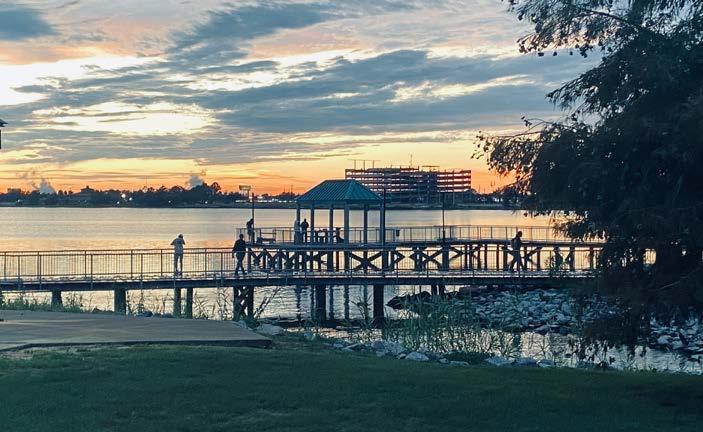
Within each topic area, the Advisory Committee and Guiding Groups developed and affirmed a set of goals to direct the selection of catalytic projects and the plan recommendations in the following chapters of this master plan. These goals follow the SMART goal framework — they are specific, measurable, attainable, relevant, and timely.
Collaborative community planning that focuses on implementing a better quality of life.
Resilient housing in attractive neighborhoods that people can afford and access.
A diverse and strong economy that adapts to stresses and provides all residents and businesses with the opportunity to thrive.
Reliable and resilient infrastructure that improves the quality of life and makes the region safer.
A region that fully celebrates and protects its unique natural and cultural resources.
1. Work together to implement a common vision
2. Invest to ensure Calcasieu and Cameron parishes are clean, safe, and beautiful
3. Create a more walkable and bikeable region
4. Make the region attractive to families and youth
5. Make it easy and clear for developers to implement the community’s vision
1. Educate people about the best practices for resilient housing, including retrofitting existing buildings
2. Increase the construction and supply of housing
3. Stabilize and enhance existing neighborhoods
4. Build new resilient housing and neighborhoods
5. Build economically integrated and mixed-income housing to ensure that everyone can afford a quality place to live
1. Maintain the strong economic sectors in Calcasieu and Cameron parishes
2. Diversify the economy and make it more resilient by expanding to new sectors
3. Build a resilient workforce development pipeline
4. Enhance destinations and connections to the amenities that will invite people to stay in, spend in, and enjoy Calcasieu and Cameron parishes
1. Upgrade the capacity of, protect, and harden existing infrastructure
2. Develop new infrastructure to be resilient and minimize future risk
3. Provide safe and reliable connections to critical facilities and community resources
4. Implement regional standards for infrastructure
5. Scale streets to work for people
1. Make the region’s natural beauty and outdoor activities more accessible and family-friendly
2. Reduce coastal risk
3. Enhance and create dedicated spaces for gathering and cultural events
4. Expand SWLA’s network of parks, green spaces, and trails
5. Preserve natural areas and protect air and water quality
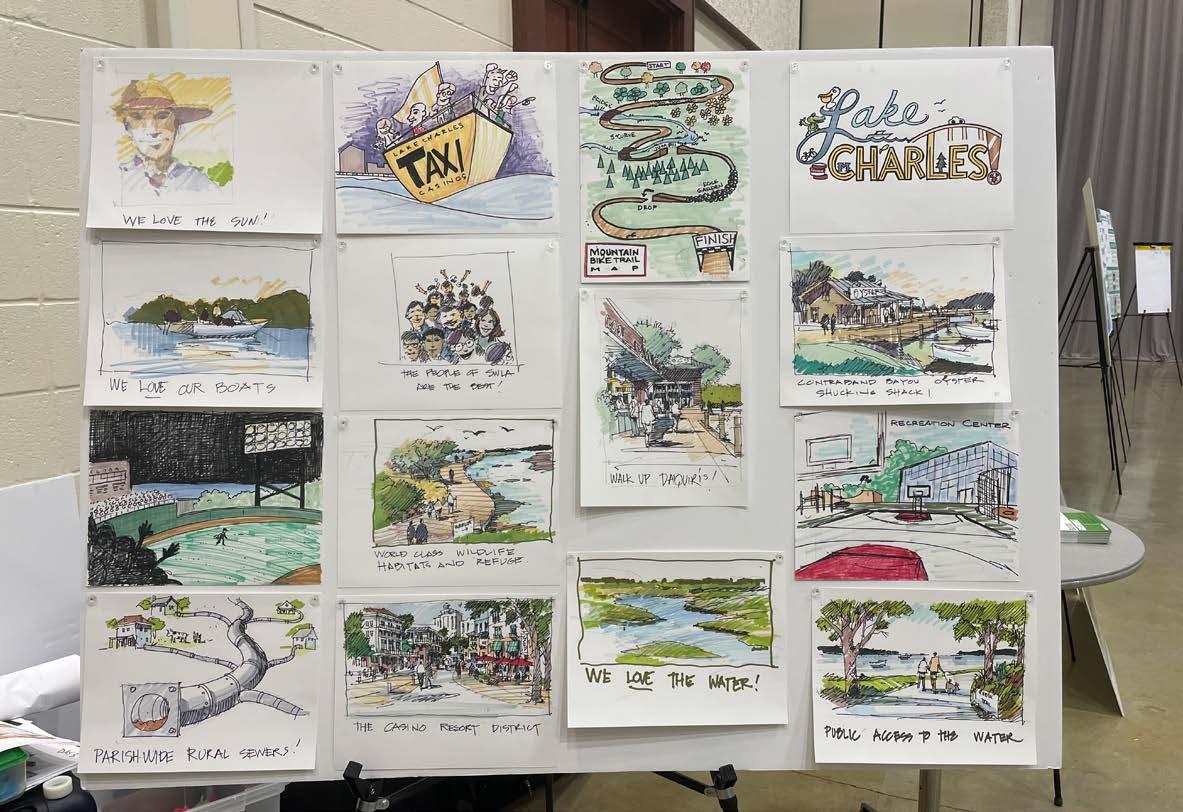
Today, Calcasieu and Cameron parishes are a constellation of populated places with some urban amenities and beautiful natural areas with limited access.
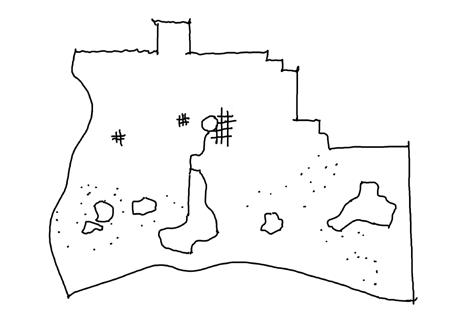
When the Just Imagine 50-year vision is implemented, the region will be connected through a network of improved streets and roads for vehicular movement, trails for pedestrians, bicyclists, and recreational vehicles, ecotourism and entertainment destinations, and attainable housing to support the growth.
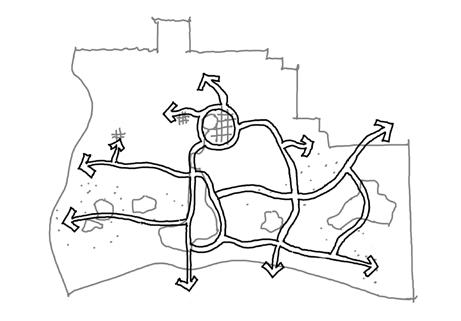
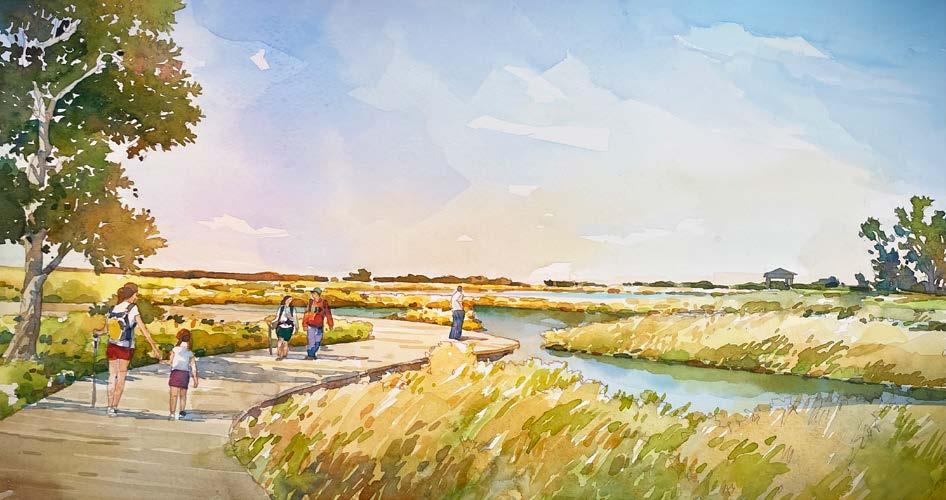
The selection and confirmation of the 10 catalytic projects followed a deliberate and comprehensive process to ensure that the most impactful and implementable projects were chosen. The process entailed:
1. Performing a qualitative analysis of the themes in the Step 1 Understanding engagement data by project topic area and geography
2. Tracking suggestions for projects in community input and Guiding Group meetings
3. Developing a common definition for ‘catalytic’ and a set of metrics and criteria
4. Vetting potential catalytic projects with the Advisory Committee
5. Confirming the selected projects with the Community through multiple feedback loops
Benefits
• Provides measurable benefit to greatest needs:
– Affordable housing
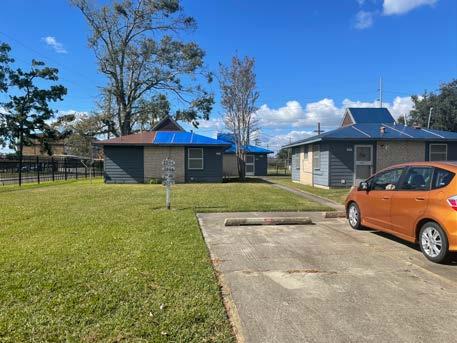
– Quality of life
– Drainage
• Regional impact that provides benefits to both parishes and beyond
• Attracts future investment by public and private sectors
• Generates positive economic growth for the future
• Improves quality of life
– Health
– Culture
– Access to nature and water
– Hazard risk reduction
• Co-benefits social and environmental resiliency
Implementation
• Ability to move forward within a 10-year horizon
• Available funding sources
• Proven concept or solution
• Constructible within public property, Rights-of-Way (ROW), or on partner-owned property
Resiliency
• Addresses future conditions (sea level rise, higher intensive storms, heat hazards)
• Include blue and green infrastructure
• Able to withstand frequent stresses and major disaster events
• Reduces risk beyond the immediate location
Community and Stakeholder Buy-In
• Prioritized as important by residents, stakeholders, and partners
A highly visible project that can be funded and implemented in the first 1–10 years to jump-start economic growth and improve infrastructure and quality of life.Redeveloping the Dixy Drive Lake Charles Housing Authority property would be catalytic for the Lake Street area
The Just Imagine vision for Southwest Louisiana will be accomplished by implementing 10 catalytic projects. In the description of each catalytic project, the following aspects are described.
Each of the 10 catalytic projects has been identified as a priority for SWLA — they were selected because of their importance to the region’s community planning, housing, economic development, infrastructure, and natural and cultural resources. Within the projects, the public, partners, elected leadership, and the advisory committee participated in a ranking system to assign a level of priority to each project. The priority does not directly determine how quickly a project will happen or the order in which it will be implemented. In context with the other five aspects, the priority ranking is intended to be one consideration for decision-makers and funders.
Catalytic projects were selected to ensure that they could be completed within or have substan-
tial progress in 10 years. However, every project has early action steps that should occur in the first three years. This will signal momentum to the community that progress and growth are occurring.
The catalytic projects are multi-faceted, and most are collections of public sub-projects with adjacent private development projects. Where possible, public project costs and/or total economic impacts have been identified. These costs are estimated in 2022 dollars and are subject to changes in the many input factors.
Each project will rely on multiple public, private, non-profit, and community partners. The Just Imagine process engaged and built working relationships with each of the partners to facilitate early action and momentum. More information about public-private partnerships can be found in the Implementation chapter.
For each project, you’ll see three icons:
– Priority — each project has been designated as high, medium, or lower priority
– Time — The time icon displays the number of years in which the project can be complete or demonstrate progress
– Cost — Project costs are estimate in 2022 dollars for all or portions of each project
Because catalytic projects are large in scale and complex, this chapter breaks each project down into clear action steps. Different partners may lead specific action steps, and different funding sources may be required for specific action steps.
Potential public funding sources have been identified for each project. Each catalytic project is a combination of public and private sub-projects. In most cases, the funding sources identified are most applicable for public projects with demonstrated public benefit, such as street transformations, greenways and trails, green infrastructure, public gathering space, affordable housing, and flood mitigation. Private development will be funded and financed through a combination of private equity, debt, and gap financing. In complex projects like these, each will have a complicated set of funding sources — no single source can fund projects of this scale. More information about public-private funding can be found in the Implementation chapter.
Catalytic projects are highly visible, can be funded and implemented in the first one to 10 years to jump-start economic growth, and improve infrastructure and quality of life.
Project 1
COASTAL RISK REDUCTION
Project 2
WATERFRONT DEVELOPMENT
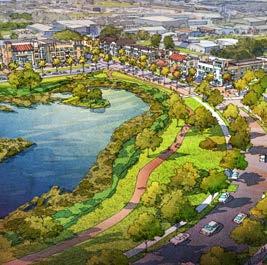
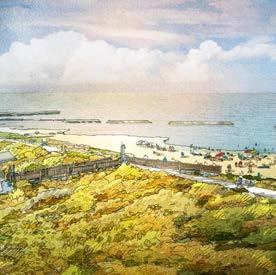
Project 3
MID-CITY NEIGHBORHOOD TRANSFORMATION
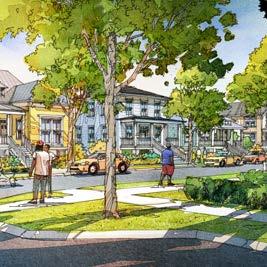
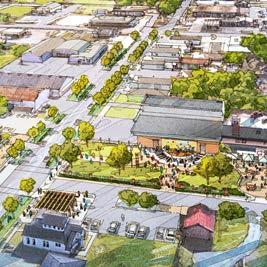
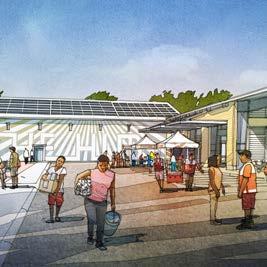
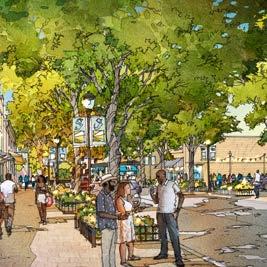
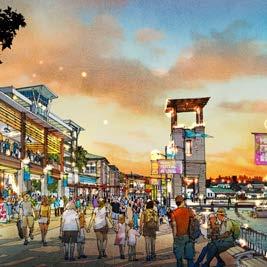
Project 4
NELLIE LUTCHER DISTRICT
Project 5
MCNEESE RESILIENCE DISTRICT
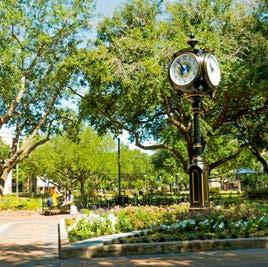
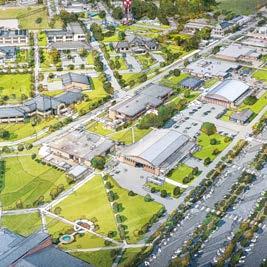
Project 6
CHENNAULT & SOWELA
RESILIENCE DISTRICT
Project 7
STRONG DOWNTOWNS
Project 8
COMMUNITY RESILIENCE HUBS
Project 9
RESILIENT HOUSING FOR SWLA
Project 10
STRATEGY FOR VACANT AND UNDERUTILIZED LAND
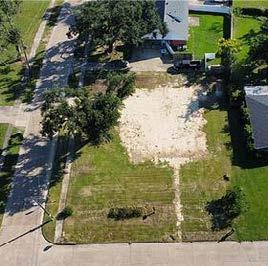
Access to trails and recreational amenities increases property values, desirability of neighborhoods, and mental well-being of residents. Southwest Louisiana is well positioned for an expansion of ecotourism. Visitors are attracted to the region for hunting, fishing, boating, birding, and other outdoor activities. However, lower Cameron Parish and some of the most beautiful places in the parish are inaccessible to outsiders — both in terms of physical accessibility and information accessibility. Cameron Parish lacks basic travel amenities, such as public bathrooms, places to get food and water, and gas stations that would make it easier for families and out-of-town travelers to visit.
A coalition of property owners, elected officials, and advocates are exploring a large development along the I-10 corridor west of Sulphur that would create a regional destination for sports tournament play. The development would be a draw for visitors and local families, with dining, hotels, and
family-friendly entertainment. Sulphur Parks and Recreation (SPAR) has beautiful, well amenitized parks. They are a clear partner for expanding to attract a multi-state sports tourism base to new amenities.
Old Highway 171 could be converted into a pedestrian and bicycle greenway that could connect North Lake Charles to River Bluff Park in Moss Bluff. The Old Highway 171 Green Bypass is described in more detail in the Community Planning section of the Plan Recommendations chapter.
The Bayou Greenbelt is a 23-mile water loop around Lake Charles that will expand public access and recreational amenities to enhance hidden natural features. Bayou Greenbelt is explained in more detail on the following pages.
There are stunning kayaking opportunities on the Mermentau River in Cameron. During the Just Imagine process, community members expressed interest in developing more formalized ecotour-
ism adventure options between Lake Arthur and Grand Chenier with rentals, places to stay overnight, tourism marketing, and other amenities.
The 71,000-acre Rockefeller Wildlife Refuge borders the Gulf of Mexico for 26.5 miles and extends inland toward the Grand Chenie ridge, a stranded beach ridge, 6 miles from the Gulf. The refuge offers opportunities for trapping, fishing and boating, and birding and wildlife viewing. Since 2016, the refuge has been implementing a master plan to manage and restore the precious habitat, agricultural land, forests, and threatened and endangered species.
The Cameron Preservation Alliance is in the process of restoring and repairing the Sabine Pass Lighthouse after damage from Hurricanes Laura and Delta. There are plans to create a walking trail network around the lighthouse for visitors.
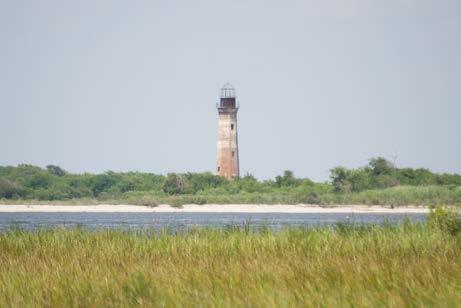
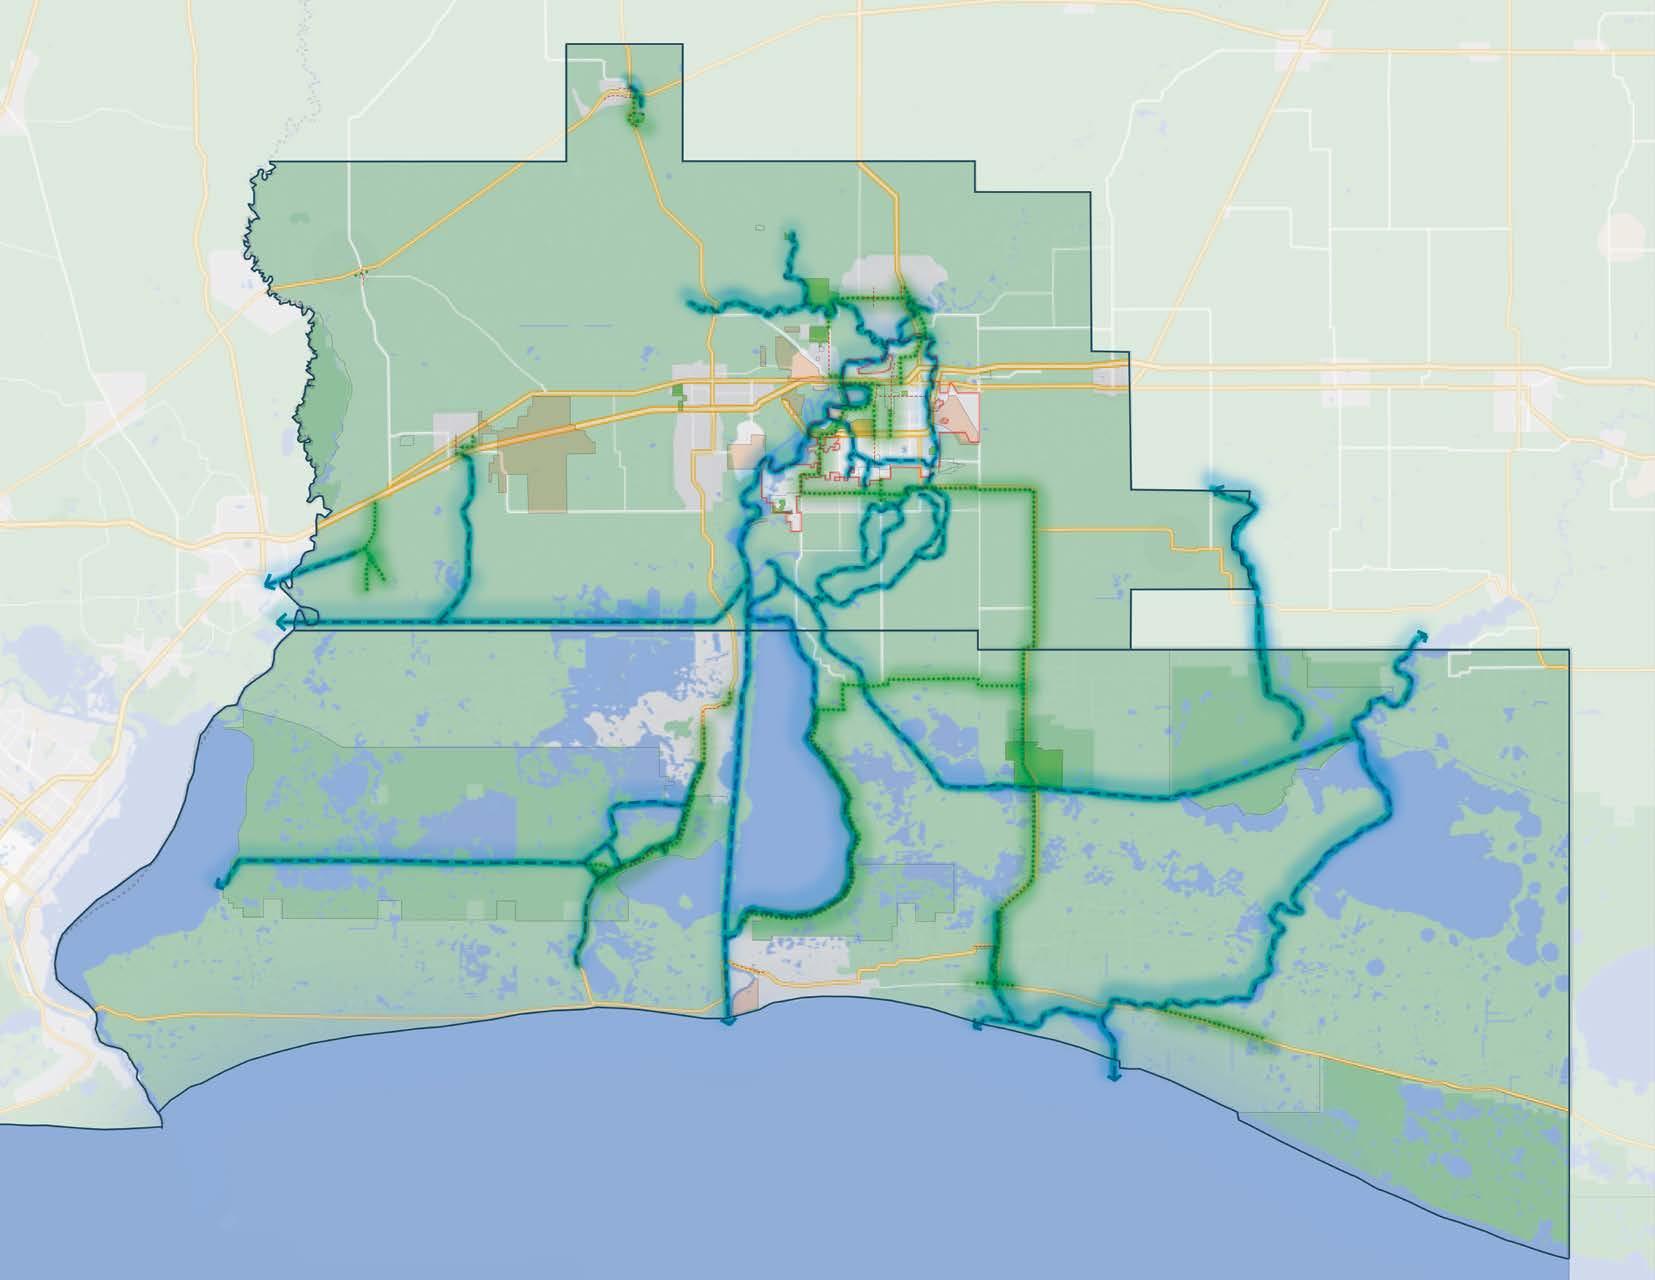
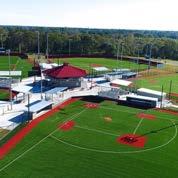
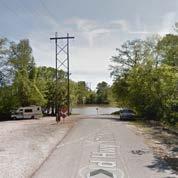
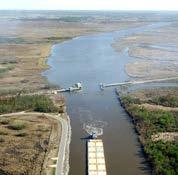
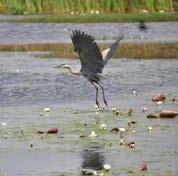
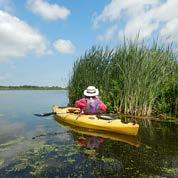
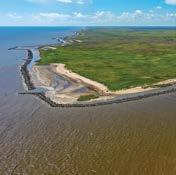
 Sulphur Sports and Recreation Complex
Old Highway 171 Green Bypass to Moss Bluff
Black Bayou Expansion of the Bayou Greenbelt
Cameron Prairie Pintail Drive
Lake Arthur to Grand Chenier Kayak Route
Rockefeller Wildlife Refuge Master Plan
Big Lake ATV Trail
Sabine National Wildlife Refuge
Sabine Pass Lighthouse Restoration and Trail Network
Sulphur Sports and Recreation Complex
Old Highway 171 Green Bypass to Moss Bluff
Black Bayou Expansion of the Bayou Greenbelt
Cameron Prairie Pintail Drive
Lake Arthur to Grand Chenier Kayak Route
Rockefeller Wildlife Refuge Master Plan
Big Lake ATV Trail
Sabine National Wildlife Refuge
Sabine Pass Lighthouse Restoration and Trail Network
• Calcasieu Parish
• National Park Service
• Community Foundation Southwest Louisiana
• City of Lake Charles
• McNeese State University
Bayou Greenbelt is a 23-mile water loop around Lake Charles that will expand public access and recreational amenities to enhance hidden natural features that are near and within the city, but not currently accessible. The project will build trails on public land adjacent to waterways for walking, running, biking, and paddling. This project will have a measurable impact on the quality of life in Calcasieu Parish and the region, while improving flood mitigation. Bayou Greenbelt will be a cultural and environmental resource.
The National Park Service Rivers, Trails, and Conservation Assistance (RTCA) program is providing support to the Community Foundation SWLA and the region on the Bayou Greenbelt process.
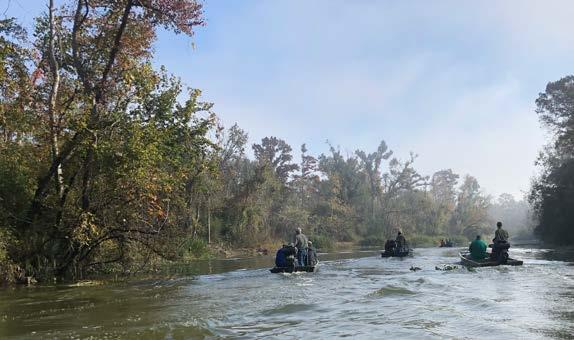
Detailed hydraulic modeling of the Kayouche Coulee will determine the feasibility of connecting Contraband Bayou, Kayouche Coulee, and English Bayou. In December 2021, a group of partners spent a day exploring the waterways, observing opportunities for trailheads, boat launches, and other enhancements, as well as challenges such as debris and litter that ends up in the coulees. As the process continues, the design team will identify publicly owned land adjacent to the waterways for launches, parks, and greenway trails.
The Bayou Greenbelt will serve multiple purposes in SWLA — it will improve stormwater management and drainage through green infrastructure; it will increase regional access to parks, trails, waterways, and open space; and it will act as an economic development and value generator for adjacent neighborhoods, developments, and projects.
A community-led project for long-term recovery, Bayou Greenbelt seeks to improve the quality of life in Calcasieu Parish while promoting flood mitigation.
A community-led project for long-term recovery, Bayou Greenbelt seeks to improve the quality of life in Calcasieu Parish while promoting flood mitigation.
Five of the 10 catalytic projects connect to the Bayou Greenbelt, capitalizing on economic development opportunities and fostering a strong connection between the region’s future projects.
Nellie Lutcher District
McNeese Resilience District
Chennault & SOWELA Resilience District
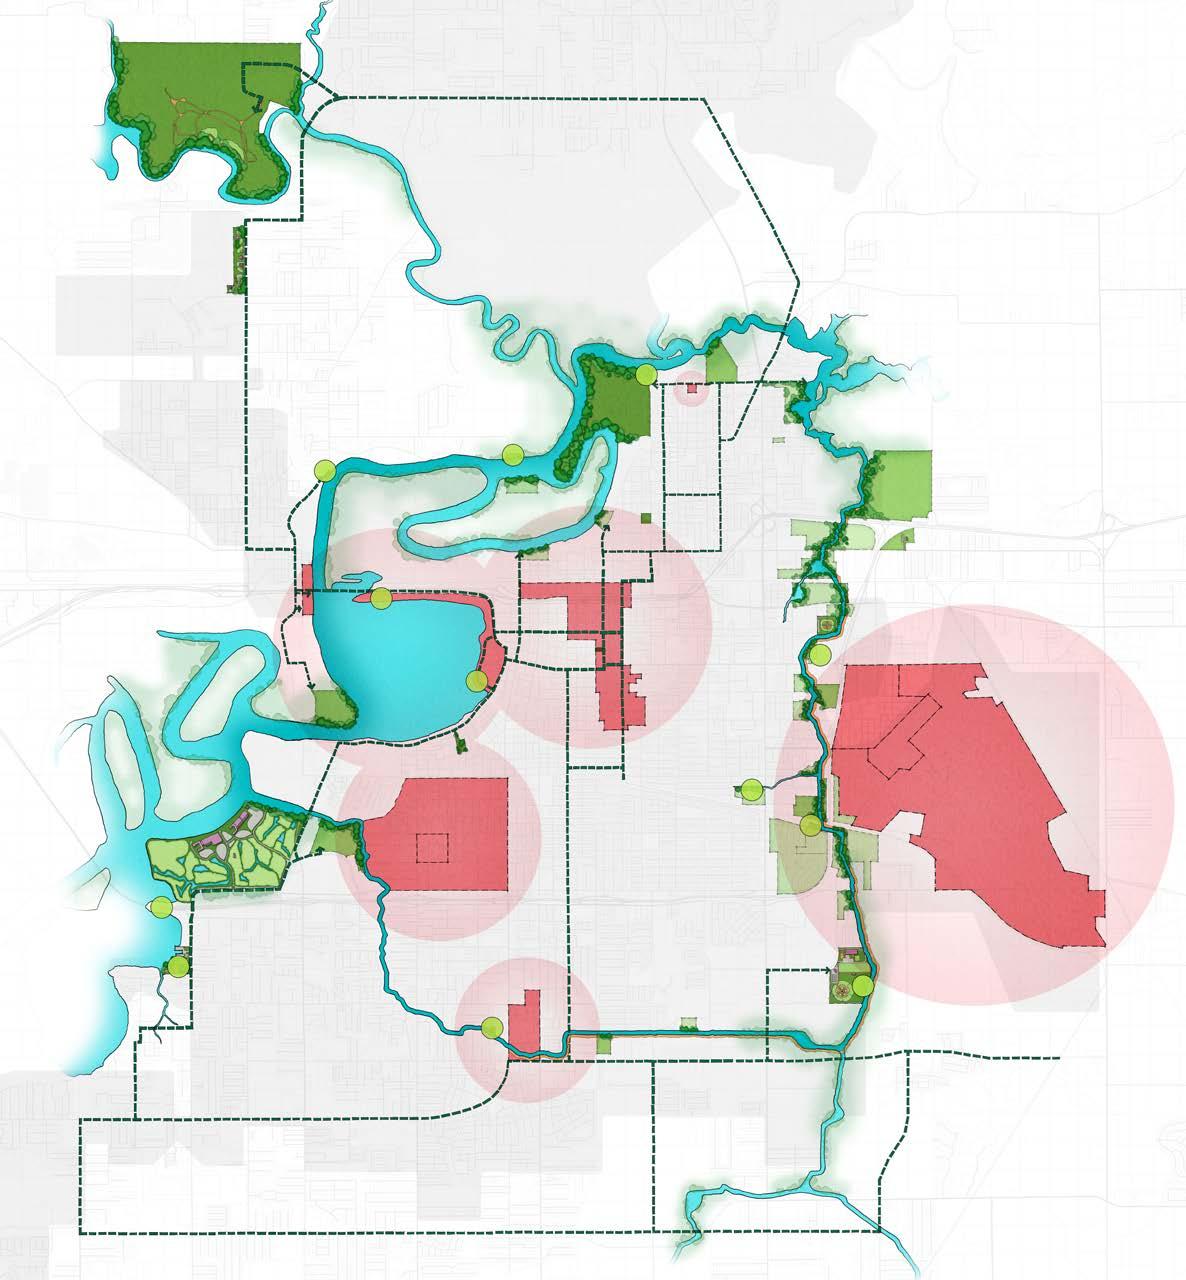
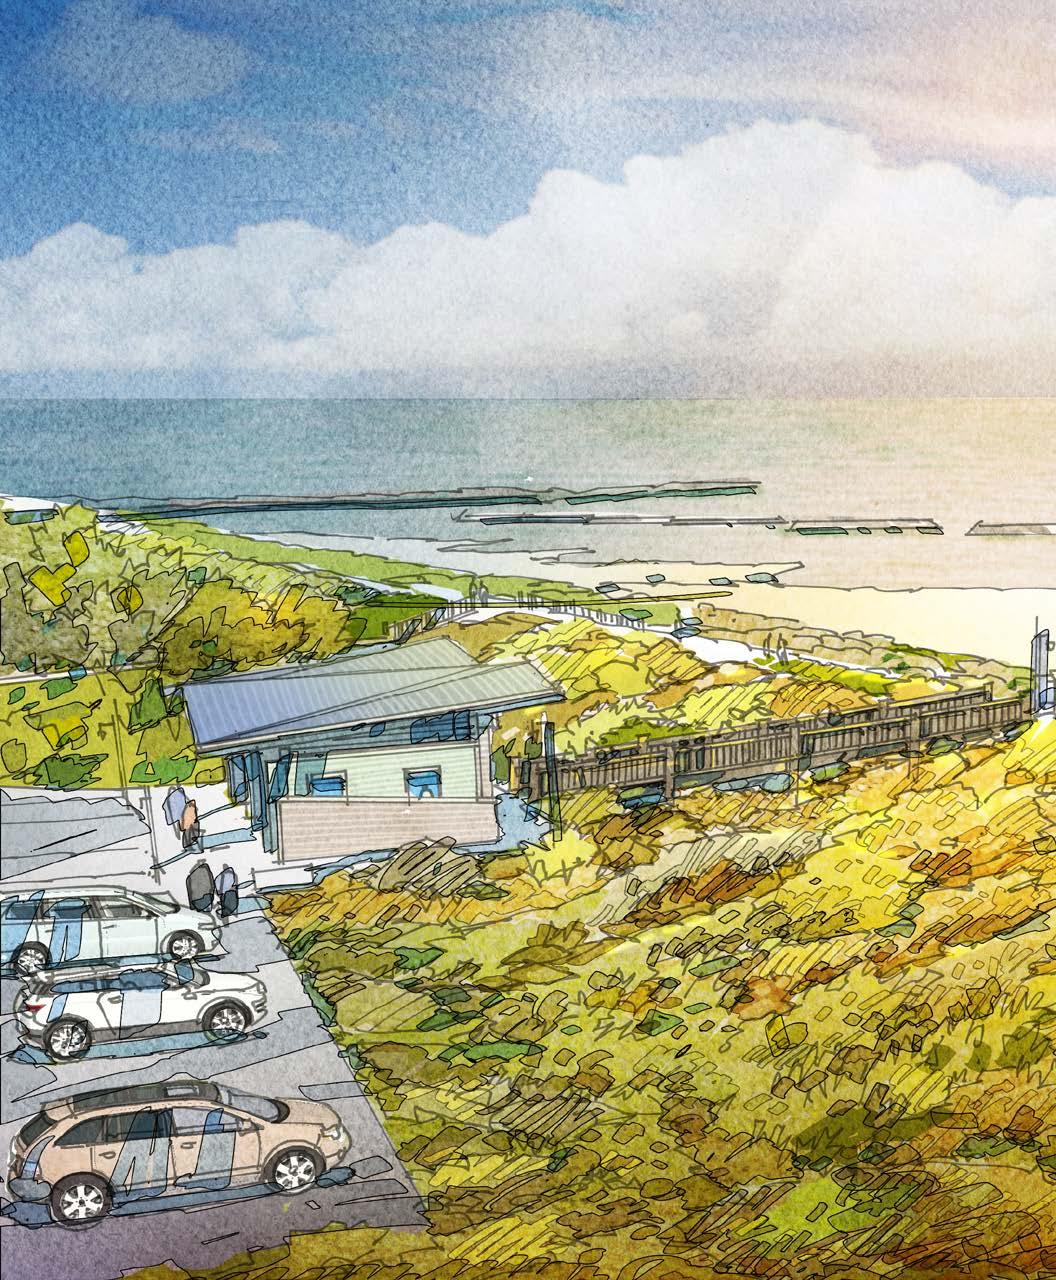
Sea
Sea level rise, more frequent, higher-intensity tropical storms, and hurricanes are the largest threat to the long-term viability and protection of assets in Calcasieu and Cameron parishes. Coastal Flood Risk Reduction focuses on protecting the coast and marshes in Cameron, while also ensuring that investments in both parishes are shielded against future devastation. Risk reduction projects layer structural and non-structural interventions to reduce loss of life and property damages from surge events and lower flood insurance. These projects build on the Coastal Protection and Restoration Authority’s (CPRA) work with additional layers of structural protection.
HIGH priority 20 years
$2.65 billion
level rise and more frequent storms are the largest threat to long-term viability and protection of assets in both Cameron and Calcasieu parishes.
Even though most residents don’t think of Calcasieu Parish as coastal, assets are increasingly more at risk, especially with sea level rise. As the region invests in jobs, infrastructure, and quality of life, coastal protections are needed in Calcasieu Parish as well to help protect those investments.
Coastal Flood Risk Reduction means long term viability, including a safe place to live and the protection of residents’ lives and properties. With each storm, residents and their homes are more at risk. Protecting the coastline and ship channel by layering structural elements with non-structural strategies would help protect assets, foster economic investments, and enhance the natural environment. Investing in public beaches will support ecotourism and attract people to Cameron Parish.
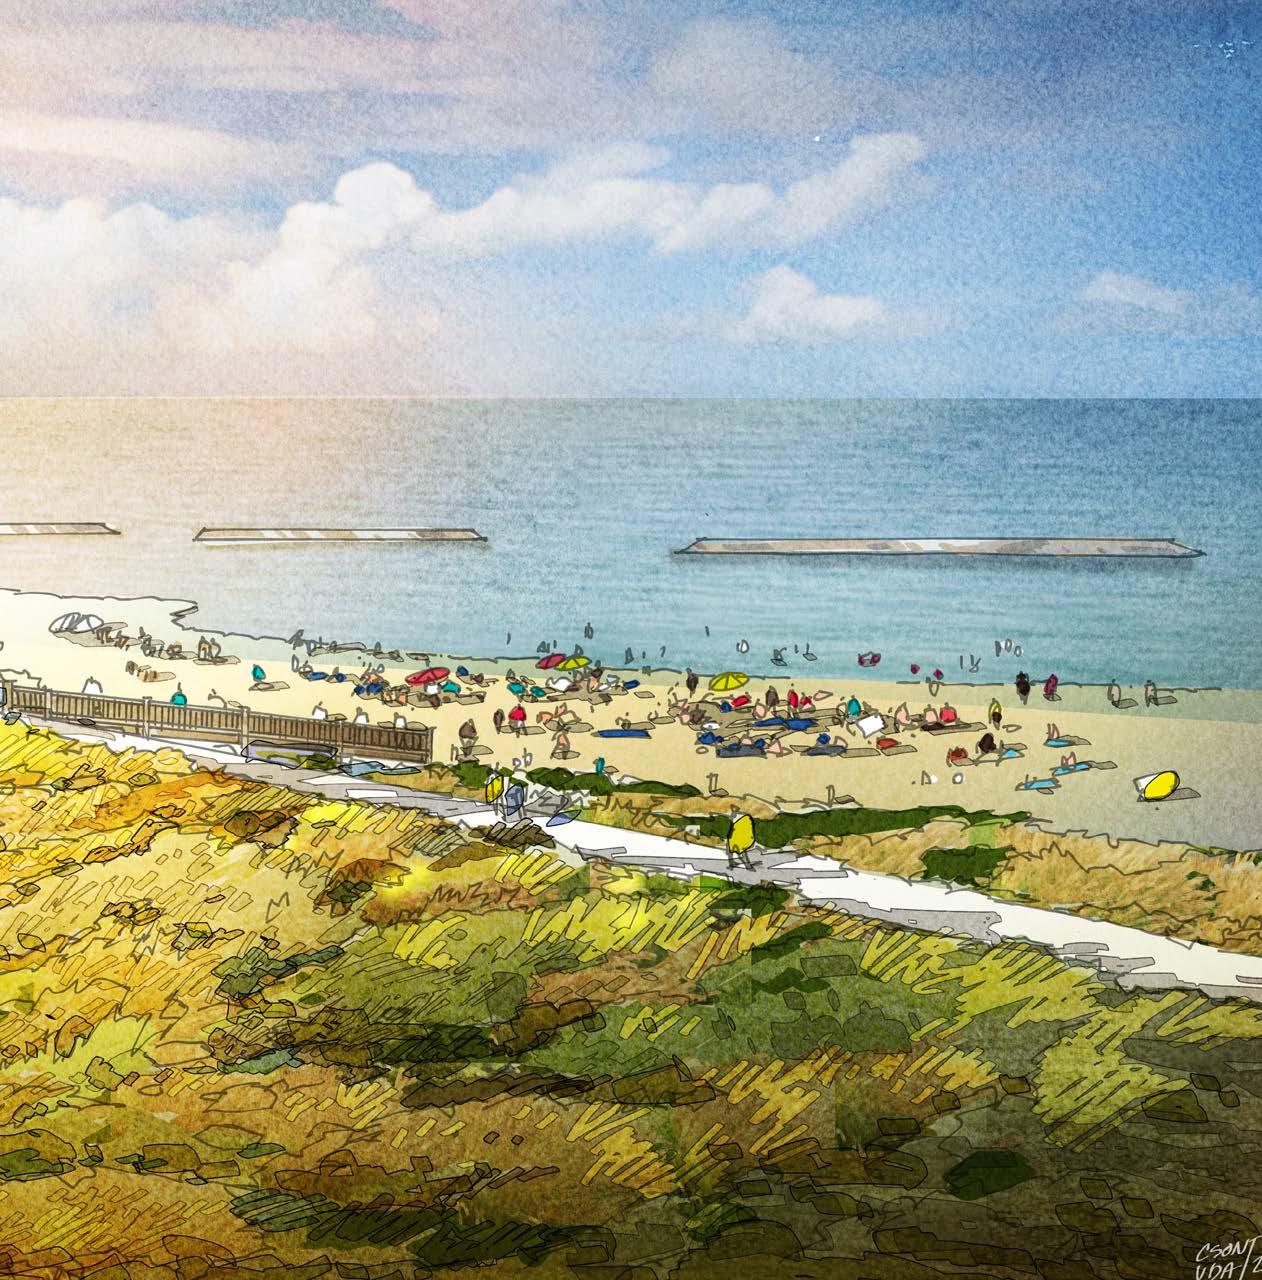
SWLA is facing an existential crisis related to land loss and climate change. The community’s long-term survivability and economic viability depend on instilling confidence and providing a plan to protect life and property from devastating storms and coastal flooding that we have been experiencing more intensely and frequently in recent years. Expected sea level rise in the next 50 to 100 years will further expose both parishes. A 50- to 100-year coastal vision and plan allows the community to take steps to a resilient future. This plan lays out specific projects and concepts that have been proven in coastal Louisiana and Texas. These neighboring communities serve as the blueprint and an example of how to implement a similar Coastal Risk Reduction System, including examples of feasibility studies, types of projects, and securing funding.
• Risk reduction projects would reduce loss of life and property damage due to surge events, lower flood insurance, and reduce fear of future sea level rise and hurricanes, resulting in increased investment and prosperity.
• Beach erosion threatens the shoreline and ecosystems today — proven strategies can improve beach amenities and access, while reducing protecting the environment.
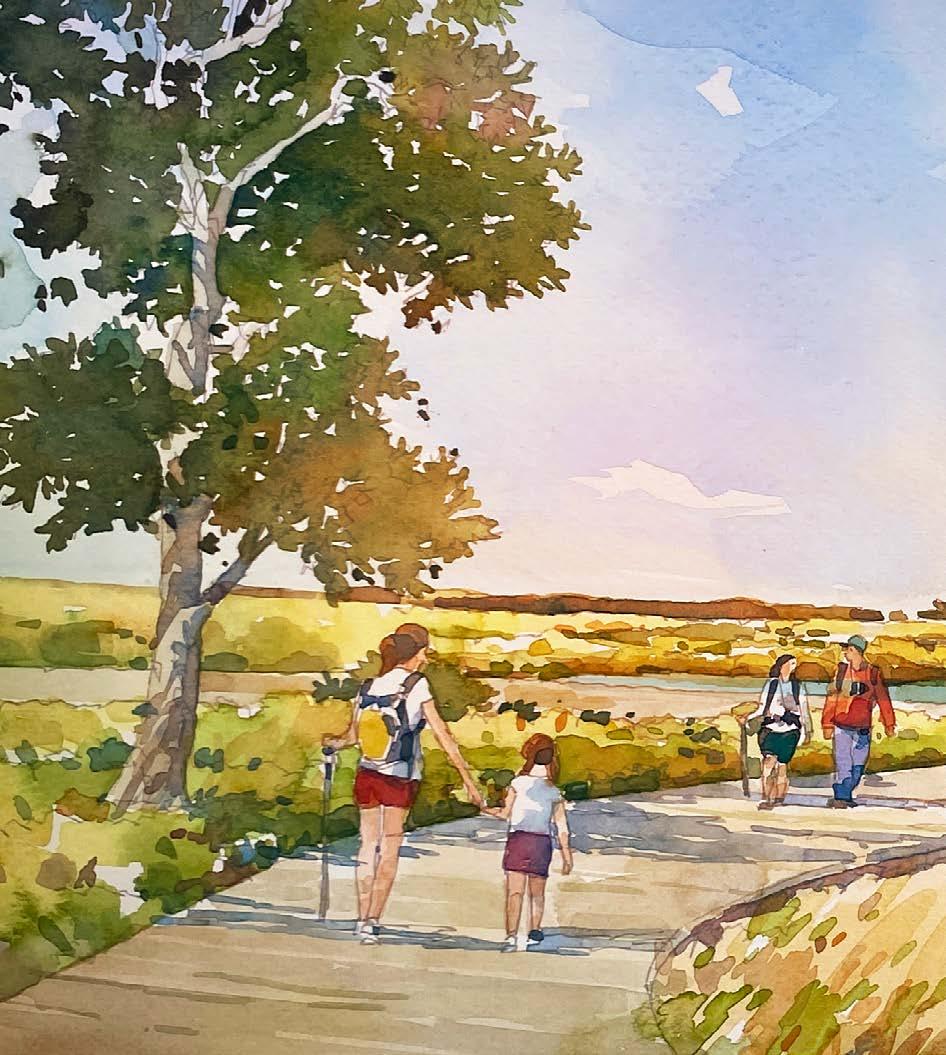
• A layered approach would build on CPRA’s ongoing work, adding structural protection projects that can be incorporated into future Coastal Master Plan updates.
The construction of a resilient coastline is critical, not only by creating a better environment for recreation, but primarily because it would help protect SWLA from storm surge and erosion of the coastline.
Coastal Flood Risk Reduction focuses on growth in Community Planning, Housing, Economic Development, Infrastructure, and Natural and Cultural Resources. A resilient Southwest Louisiana would help:
• Increase bike and pedestrian connectivity around beaches in Cameron Parish through eco-revetment and raised pathways, making safe connections for residents and tourists along the entire coastline of Cameron Parish.
• Reduce property damage and loss of homes due to surge events while lowering flood insurance, making home ownership and housing more attainable.
• Increase developable areas not susceptible to flooding to encourage additional housing development.
• Minimize uncertainty and fear of flooding, improving the long-term viability of the economies of both parishes. Increasing longterm confidence and economic activity in the area and availability of employment will make this area a more viable investment for industry and businesses. Encouraging workers to have safe, protected, and affordable housing will increase the available workforce and make this area attractive to businesses.
• Provide a layered approach with structural and non-structural interventions like erosion protection, drainage improvements, and the protection of marshes.
• Make communities more resilient by reducing the impact of surge events, sea level rise, and land loss. With sea level rise, the land loss will accelerate if no action is taken, eliminating any buffer to hurricanes. These projects will protect all built infrastructure and assets in both parishes.
• Utilize proven techniques and innovative solutions to promote an interconnected waterway system that reduces risk and provides long-term viability.
• Enhance and protect the environment as coastal Louisiana marshes are valuable assets constantly at risk or threatened. It’s essential to protect this delicate resource.
• Promote improved access to beaches and waterways and become a destination for the public to enjoy which will encourage continued investments.
• Prevent the loss of marshes. They are not only vital for the ecosystem but are a part of providing resiliency.
The following action steps are broken down by Calcasieu and Cameron parishes. It is critical for both parishes to work together in a coordinated manner on analysis, design, funding, construction, and maintenance of a coherent system.
The first step in advancing these projects is to analyze and refine the proposed concepts. A feasibility study will provide the necessary assessment of the practicality of each conceptual design, along with analyzing the cost to achieve the proposed benefits.
A feasibility study, along with conceptual designs, will be invaluable information to progress the proposed projects. The study will provide the detailed assessment of many aspects of the projects such as location, size, materials, cost, and benefits. This information will be key when partnering and securing funding.
Action Steps
1 Feasibility study and conceptual design
2 Cost benefit analysis
3 Application for capital funding — includes partnering with USACE and CPRA to provide funds for design, construction, and long-term maintenance
4 Implement a layered approach (structural and non-structural) that builds on the work of CPRA
4a Structural beach protection with living shoreline, vegetated dunes, earthen berms, and eco-revetment
4b Living shoreline with rock revetment, backwater pump stations, and drainage
4c Storm surge gate system
After completion...Operation and maintenance of the system.
Potential Partners
• Cameron Parish
• Chenier Plain Coastal Restoration & Protection Authority
• Louisiana Coastal Protection and Restoration Authority (CPRA)
• US Army Corps of Engineers (USACE)
• Louisiana Wildlife and Fisheries
• Port of Lake Charles
Potential Funding Sources
• FEMA — BRIC PDM (Pre-Disaster Mitigation), HMGP
• US Army Corps of Engineers (federal)
• CPRA
• Louisiana Watershed Initiative
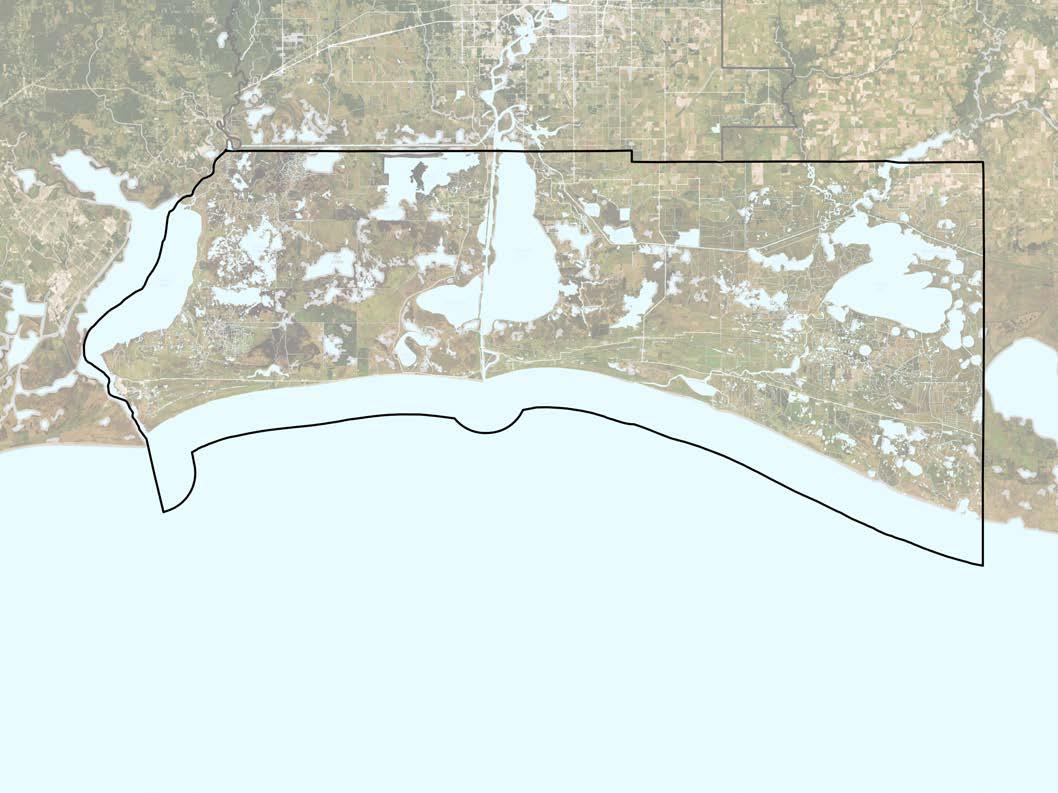
• HUD MIT
• Cameron Millage
• Non-Profit Foundations
• State Capital Outlay
• Federal Infrastructure Funding
With the project details such as cost and the benefits identified in the feasibility study, a cost benefit analysis will need to be performed. The importance of this analysis is to demonstrate that the proposed project benefits are greater than the project estimated cost and typically is a requirement of many funding sources.
Phase 1 Dune Protection: 20.1 miles
Phase 2 Dune Protection: 8.35 miles
There is an abundance of funding sources to progress these projects forward, such as local tax millage, state capital outlay, and federal grants. Successfully securing project funding of this magnitude will require partnerships with local, state, and federal agencies.
Phase 3 Dune Protection: 10.3 miles
Phase 4 Dune Protection: 6.2 miles
These partnerships will be very important when applying for capital funding due to the typical competitive nature in distribution of available funds. A strategy will be developed to apply and use local and state funds for feasibility and early design that can better position these projects for the larger federal dollars required for construction.
WHAT?
• Multi-layered structural and non-structural construction has been successful throughout Coastal Louisiana
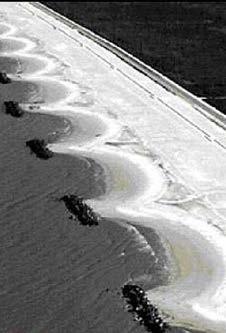
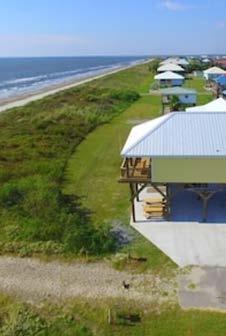
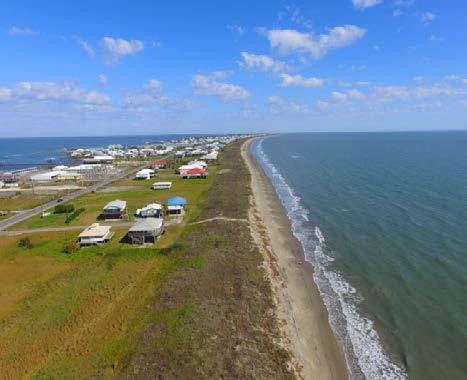
• Proven solutions that help reduce land loss and protect communities against surge WHERE?
• Grand Isle, Holly Beach, and Rockefeller Refuge
Implementing these large scale projects will require strong partnerships with local, state, and federal agencies with focus and commitment. Although the final construction timelines may appear lengthy, benefits from these projects will be evident in early phases of implementation.
A layered approach that incorporates the existing plan, including Southwest Louisiana coastal non-structural funding and played solutions from CPRA and USACE, and layers additional structural coastal protection is the key to a resilient community that can adapt and respond to sea level rise and increased intensity of tropical and rain storms. The first layer must take place in Cameron Parish, which is SWLA’s first line of defense. This acts as protection for Calcasieu Parish and Cameron Parish together, and is key to stopping the initial surge. Interventions, tailored to protecting the Cameron Parish coastline, are indicated to the right.
Dune creation and restoration, along with beach nourishment, provides a natural layer of risk reduction to inland infrastructure, in addition to ecological services and recreational opportunities. Dunes serve as a natural risk reduction feature that provides a sand buffer and protects the land from waves and flooding. Dune systems can be reinforced using a hybrid of rock revetments and dunes to strengthen them against erosion during storm events.
Additionally, plantings of native grasses help to stabilize dune soils, and these grasses capture wind-blown sediment, providing further protection against erosion. Beach nourishment involves depositing sand on the beach to increase durability of the protection system. Nourishment of the transition zone serves to reduce wave energy in addition to promoting accumulation of sand on the beach.
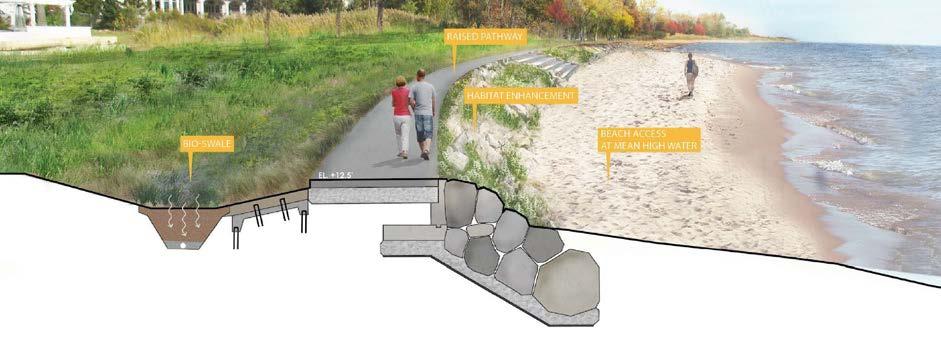
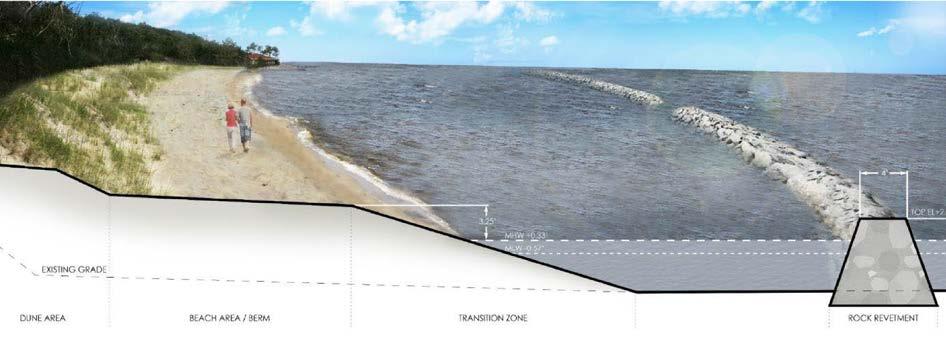
Living shoreline systems can be used in conjunction with beach-dune restoration and creation or alone in front of existing beach-dune systems. Living shorelines take advantage of natural processes to make shorelines more resilient to erosion and storm events. Typically, rock revetments are placed offshore to serve as a breakwater, attenuating wave energy before the wave reaches the shore. Inlets within the breakwaters allow for some hydraulic connectivity to the shoreline and allow sediments carried by the wave activity to be deposited on the beach or in the transition zone.
Bioswales, used on the inland side of a man-made revetment or other elevated flood risk reduction feature, serve as a method to capture rainwater from storm events. These bioswales are vegetated with native plans that aid in the filtration of pollutants from the stormwater, in addition to allowing a larger percentage of the stormwater to infiltrate into the soil rather than becoming runoff. These systems, used in conjunction with traditional, mechanical pumps, provide resilience to rainwater flooding, in addition to tropical events.
The impacts of storm surge can cause significant damage to coastal habitats, infrastructure, land loss, etc. This exposure can kill or hinder the growth of economics, industry, residential, and commercial development. The location of the gate system would stop the surge, providing the level of protection needed. The storm surge gate system will only be closed during periods of high-risk tropical storm events, while allowing navigation at all other times. The size of the gate opening will be determined by navigation needs, authorized channel width along with future needs, and environmental requirements.
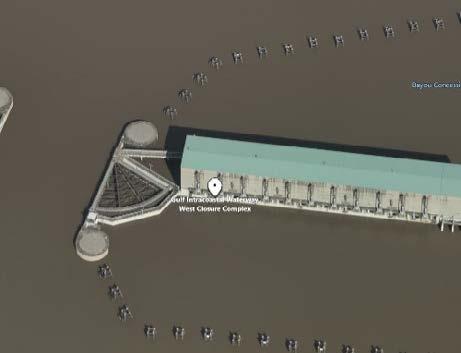
The first step in advancing these projects is to analyze and refine the proposed concepts. A feasibility study will provide the necessary assessment of the practicality of each conceptual design, along with analyzing the cost to achieve the proposed benefits.
A feasibility study, along with conceptual designs, will be invaluable information to progress the proposed projects. The study will provide the detailed assessment of many aspects of the projects such as location, size, materials, cost, and benefits. This information will be key when partnering and securing funding.
With the project details such as cost and the benefits identified in the feasibility study, a cost benefit analysis will need to be performed. The importance of this analysis is to demonstrate that the proposed project benefits are greater than the estimated project cost and typically is a requirement of many funding sources.
Action Steps
1 Feasibility study and conceptual design
2 Cost benefit analysis
3 Application for capital funding — includes partnering with USACE and CPRA to provide funds for design, construction, and long-term maintenance
4 Implement a layered approach (structural and non-structural) that builds on the work of CPRA
4a Levees along southern developed area; flood walls where there is no sufficient space; drainage pump stations at bayous
4b Sector gate at the Calcasieu River for surge protection during tropical events
4c Barge gates and pump Station to provide surge protection and drainage when the system is closed
Potential Partners
• Chenier Plain Coastal Restoration & Protection Authority
• Louisiana Coastal Protection and Restoration Authority (CPRA)
• US Army Corps of Engineers (USACE)
• Calcasieu Parish
• City of Lake Charles
• Louisiana Wildlife and Fisheries
• Port of Lake Charles
Potential Funding Sources
• FEMA BRIC (Building Resilient Infrastructure and Communities)
• FEMA PDM (Pre-Disaster Mitigation)
• FEMA HMGP (Hazard Mitigation Grant Program)
• FEMA STORM Act (Safeguarding Tomorrow Revolving Loan Program)
• US Army Corps of Engineers (federal)
• CPRA
• Louisiana Watershed Initiative
• HUD CDBG-MIT (Community Development Block Grant — Mitigation)
• HUD CDBG-DR (Community Development Block Grant — Disaster Recovery)
• Cameron Millage
• Non-Profit Foundations
• State Capital Outlay
• LA DOTD (Engineering Division) appropriations, including the State Flood Control Program
• Federal Infrastructure Funding
There are an abundance of funding sources to progress these projects forward, such as local tax millage, state capital outlay, and federal grants. Successfully securing project funding of this magnitude will require partnerships with local, state, and federal agencies.
3 Application for Capital Funding for Design, Construction, and Long-Term Maintenance
These partnerships will be very important when applying for capital funding due to the typical competitive natural in distribution of available funds. A strategy will be developed to apply and use local and state funds for feasibility and early design that can better position these projects for the larger federal dollars required for construction.
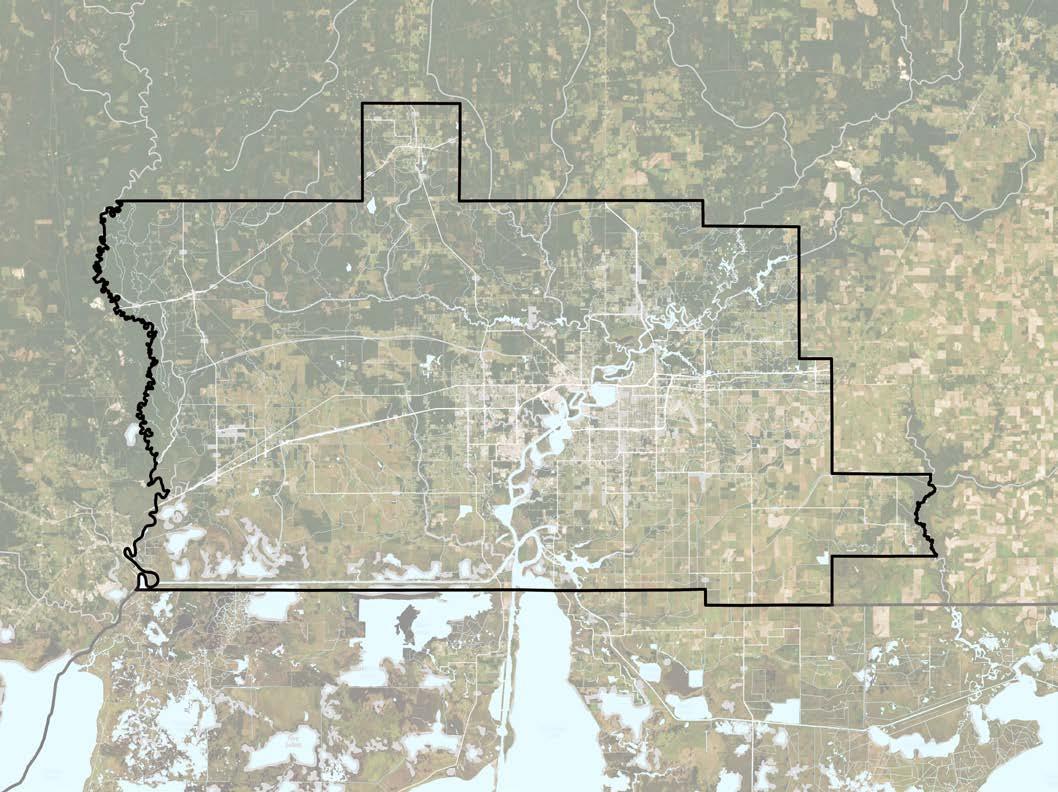
WHAT?
• $1.2 billion Coast Storm Risk Management System
• Provides protection for 100-year storm event, including projected 2070 sea level rise
HOW?
• Federally funded with local cost share
• Includes floodwalls, levees, sector gates, pump stations, drainage structures, and flood gates
Implementing these large scale projects will require strong partnerships with local, state, and federal agencies with focus and commitment. Although the final construction timelines may appear lengthy, benefits from these projects will be evident in early phases of implementation.
4 Implement a Structural and NonStructural, Layered Approach
With sea level rise and future higher intensity tropical storms being the largest threat to longterm viability and protection of assets in Calcasieu Parish, structural flood risk reduction projects would provide the most benefit to reducing loss of life and property, lowering flood insurance, and reducing the fear of future sea level rise and hurricanes.
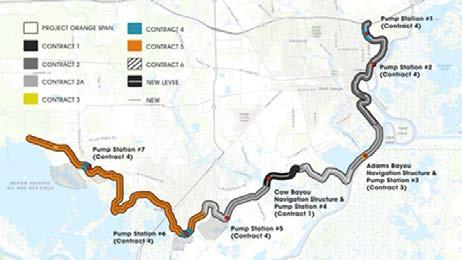
Earthen levees are proposed along the southern developed areas and would tie into higher elevations as they proceed northward. Concrete floodwalls would be placed where the width of the levee is too large for the space available. The overall alignment placement would be an iterative process when developed to account for maximum benefit relative to feasibility. Based on previous studies, the approximate height expected in the southern portions of the levee will be 22 ft NAVD.
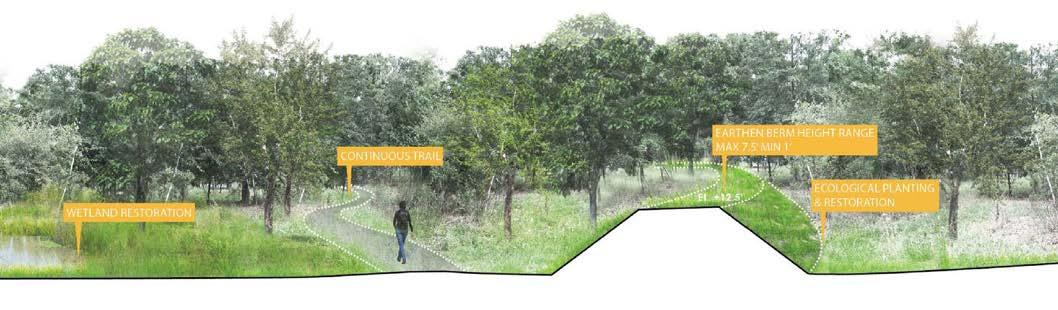
Where the earthen levees approach the Calcasieu River, a large steel sector gate will be constructed in the river, providing continuous alignment of surge protection during tropical events, while allowing navigation at all other times. The size of the gate opening will be determined by navigation needs, authorized channel width along with future needs, and environmental requirements.
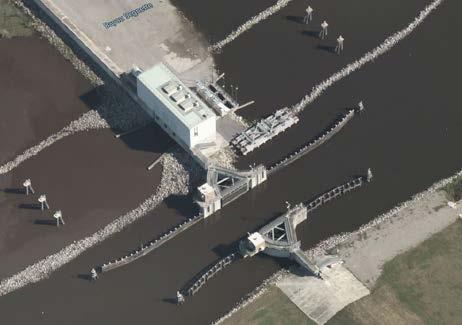
Barge gates and pump stations provide surge protection and drainage when the system is closed. barge gates will be proposed on smaller channels, as they usually require less project area than a sector gate. Also, pump stations will be required to manage the interior water levels during a rainstorm, while the system is closed. Previous studies have estimated approximately 6000 cfs pumping needs for the protection area.
• Structural Coastal Protection System constructed and strengthened after Hurricane Katrina has helped New Orleans during recent hurricanes, like Hurricane Ida HOW?
• Prove hurricane surge and sea level rise protection projects include sector gates, pump stations, barge gates, sluice gates, floodwalls, levees, and tidal lock structures
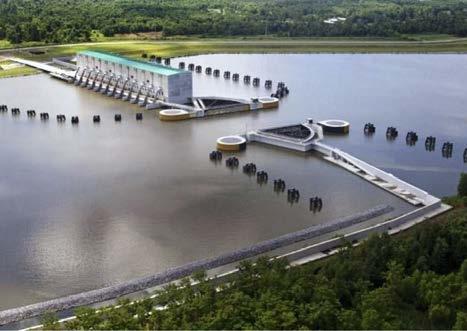
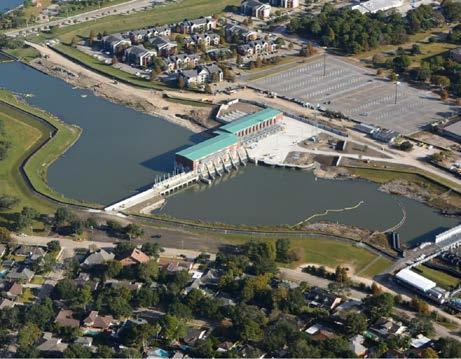
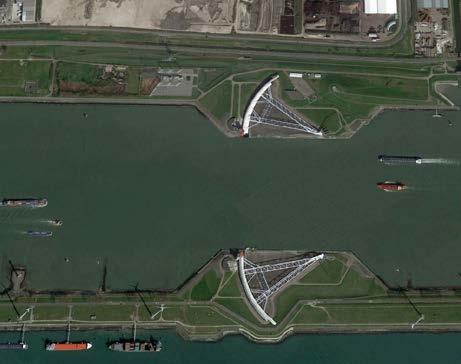
Protecting SWLA and being proactive instead of waiting for disaster to strike
I would visit a protected beach with amenities like parking, public restrooms, and accessible walking trails.
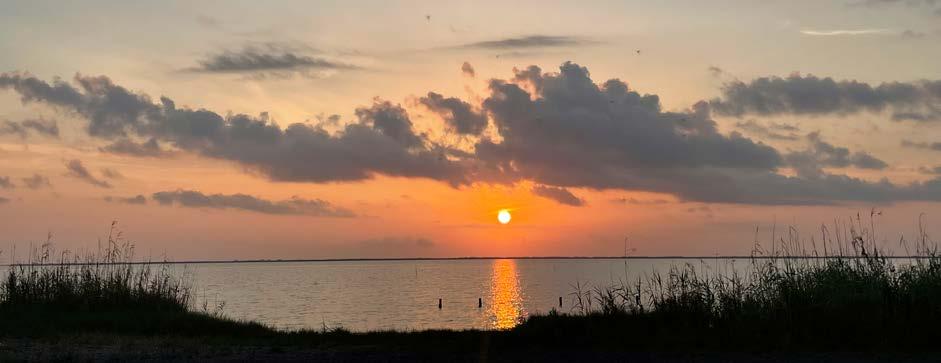
The road to get to a resilient future for coastal Louisiana will not be easy. We are on the front lines of a global sea level crisis, which requires that we must have vision and use proven techniques and innovative solutions to deal with this issue. It is important to our families, our community, our economic viability, and our future in Southwest Louisiana.
When considering the impact of Coastal Flood Risk Reduction, among the most important benefits is the protection of assets in both Calcasieu and Cameron parishes. As opportunities for economic investment and development are sought out, it is critical to focus not only on the construction of those opportunities, but on their longevity and long-term viability in the region.
To align with Federal and State funding programs, the community and its leaders must agree on the threat, the vision, and possibilities to position the community and take the necessary programming steps. Identification of a steward and maintenance entity and establishing a funding stream for this organization is one of the key steps of the process.
HOW? (ACTION STEPS)
Implement a layered approach with a combination of structural and non-structural elements:
• Cameron 1A — Structural beach protection with living shoreline, vegetated dunes, earthen berms, and eco-revetment
• Cameron 1B — living shoreline with rock revetment, backwater pump stations, and drainage
• Cameron 1C — Storm surge gate system
Feasibility study and conceptual design with benefit cost analysis
Application for capital funding (includes partnership with USACE and CPRA to provide funds for design, construction, and long-term maintenance funding)
Implement a layered approach with a combination of structural and non-structural elements:
• Calcasieu 1A – Levees along southern developed area; flood walls where there is not sufficient space
• Calcasieu 1B – Sector gate at the Calcasieu River, providing surge protection during tropical events while allowing navigation at all other times
• Calcasieu 1C – Barge gates and pump station to provide surge protection and drainage when system is closed
Feasibility study and conceptual design with benefit cost analysis $$ 3 to 5 years
Application for capital funding (includes partnership with USACE and CPRA to provide funds for design, construction, and long-term maintenance funding)
•
•
•
•
• State Capital Outlay (for construction)
$ 1 to 3 years
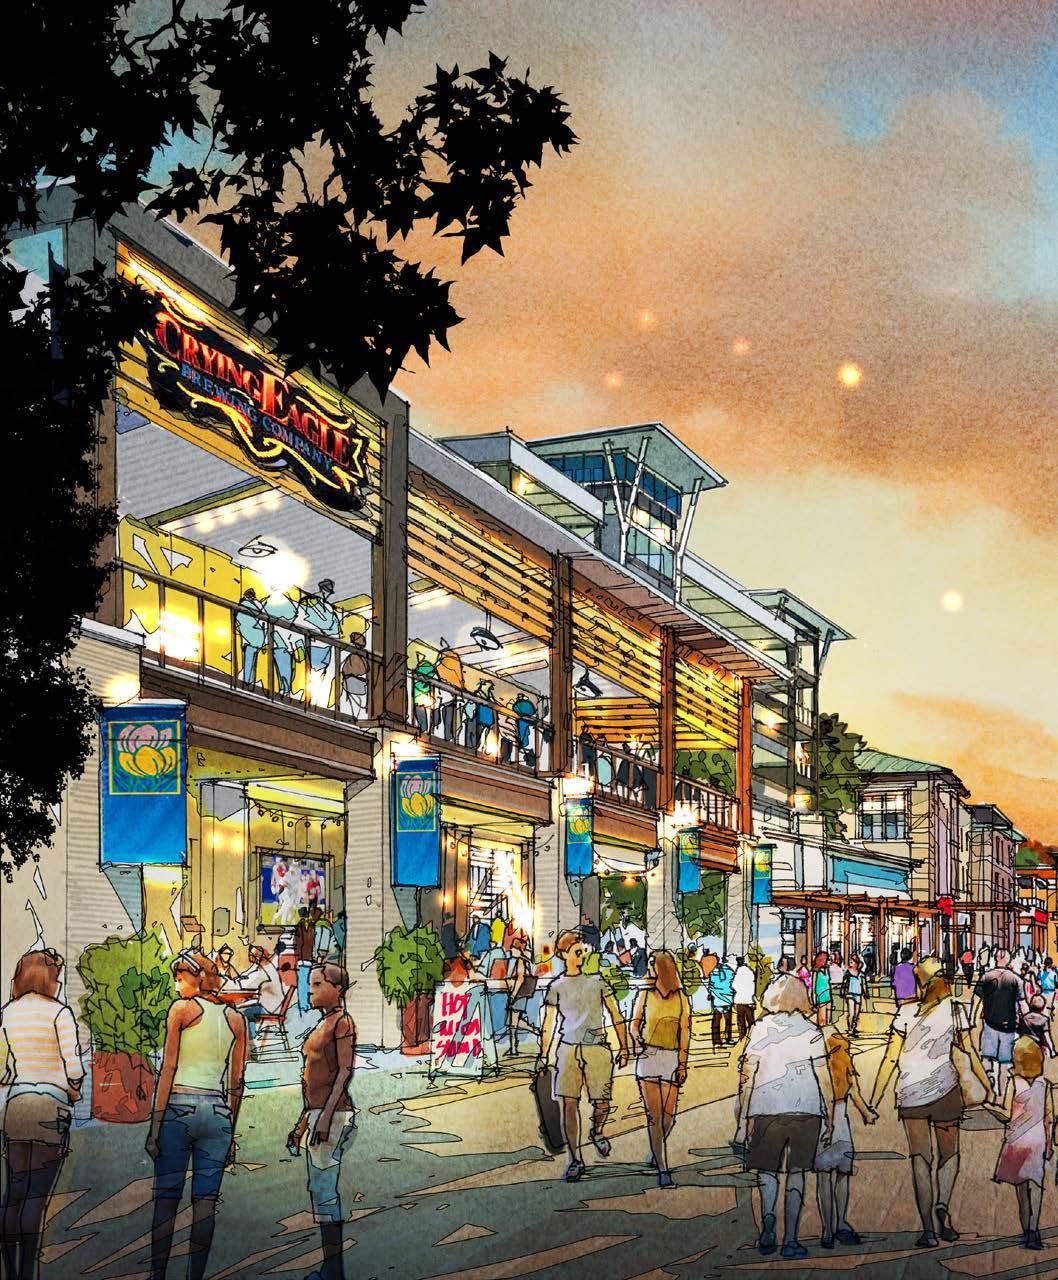
The Lake Charles Waterfront is the region’s largest, untapped asset for quality of life and economic development.
Project Description
The region’s waterfronts are an untapped asset for quality of life and economic development. Exciting new projects like the Port Wonder Children’s Museum and Nature Center, Lake Area Adventures, and a new Crying Eagle Brewery restaurant will activate the Lake Charles lakefront. The city of Lake Charles economic incentives help to make future investments attractive. Making a transformative, public investment in a continuous, public edge from the Lake Charles Civic Center, across the new I-10 bridge, to Westlake would connect over 5 miles of pedestrian promenades with vibrant restaurants, recreation, and entertainment activating the waterfront. A strong and activated waterfront can help contribute to additional organic growth along the I-10 corridor and North Lake Charles.
HIGH priority
5-10 years
$350 million
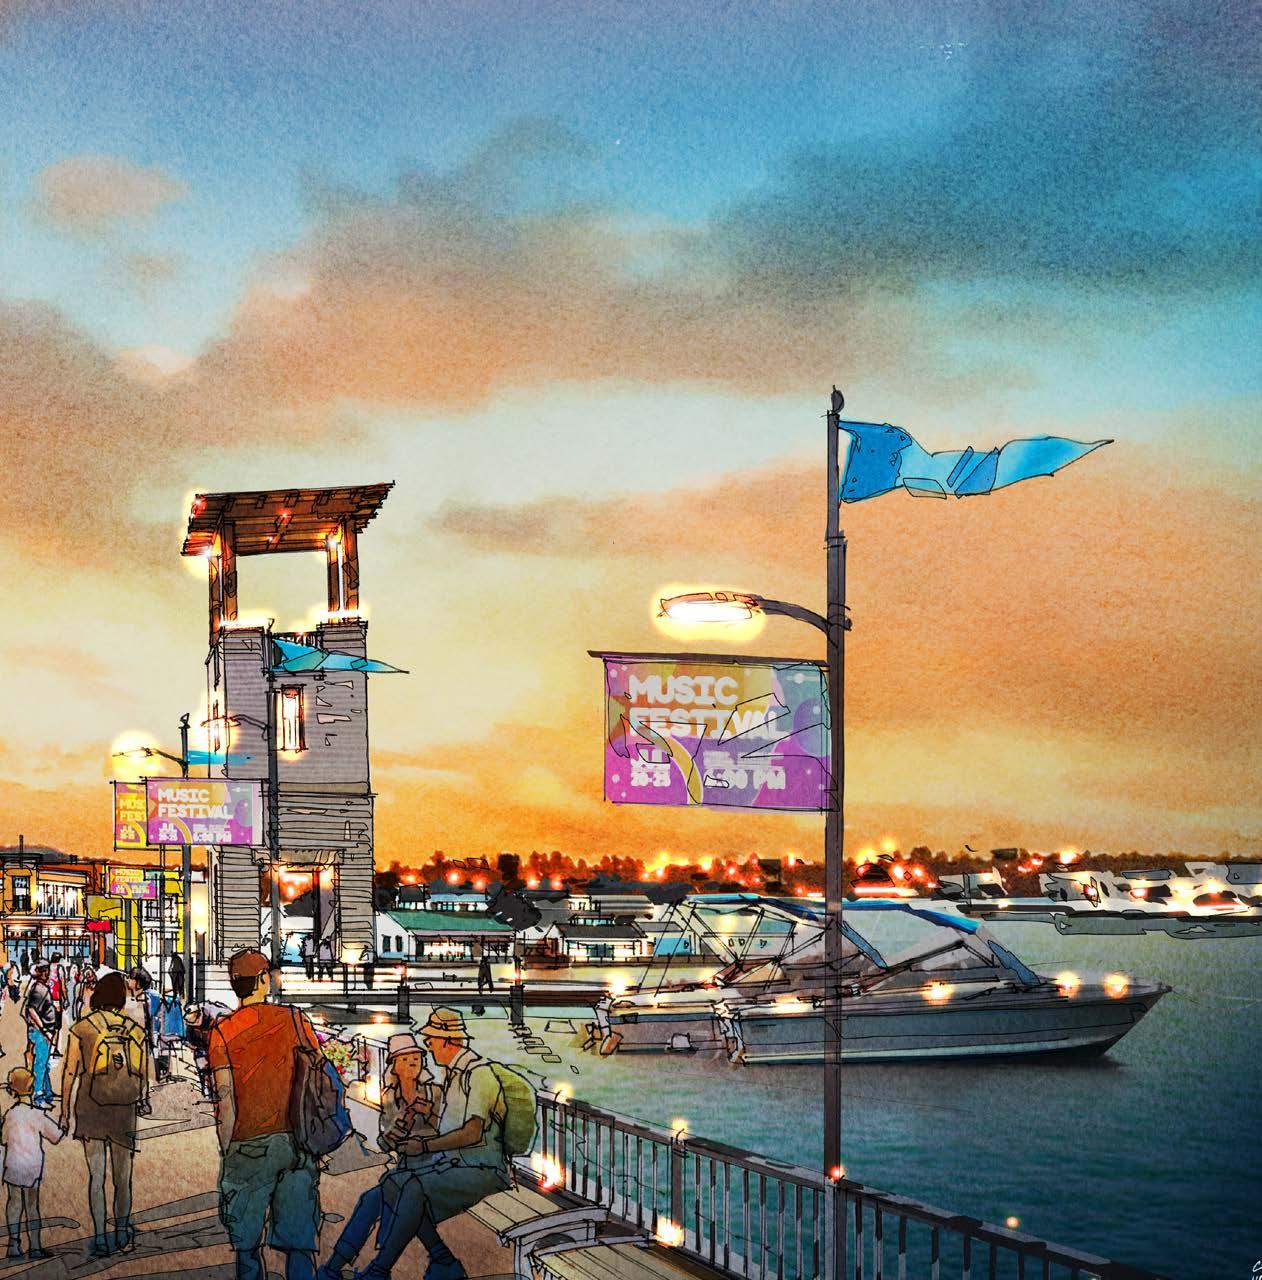
For years, the Lake Charles and Calcasieu River waterfronts have been discussed as opportunities for economic development and improving quality of life, but they remain underutilized. With the excitement around Port Wonder, Crying Eagle Brewery, Paul’s Rib Shack, Lake Area Adventures, and the new Calcasieu River Bridge, now is the time to invest. A new, pedestrian-friendly waterfront edge will attract new restaurants, shops, and recreation.
Cameron Parish is pursuing development along its bayous, lakes, and coastline that will enhance quality of life and economic development. Waterfront development in Calcasieu Parish will also encourage and lay the groundwork for increasing ecotourism in Cameron by creating a gateway to water-based recreation and transportation for the region.
• Additional waterfront development would build on the new and upcoming investments like Port Wonder and Crying Eagle.
• This project would bring back the tradition of waterfront recreation and water-based transportation and could connect over 5 miles of pedestrian and biking paths from Downtown Lake Charles to Westlake, Horseshoe Casino, and beyond.
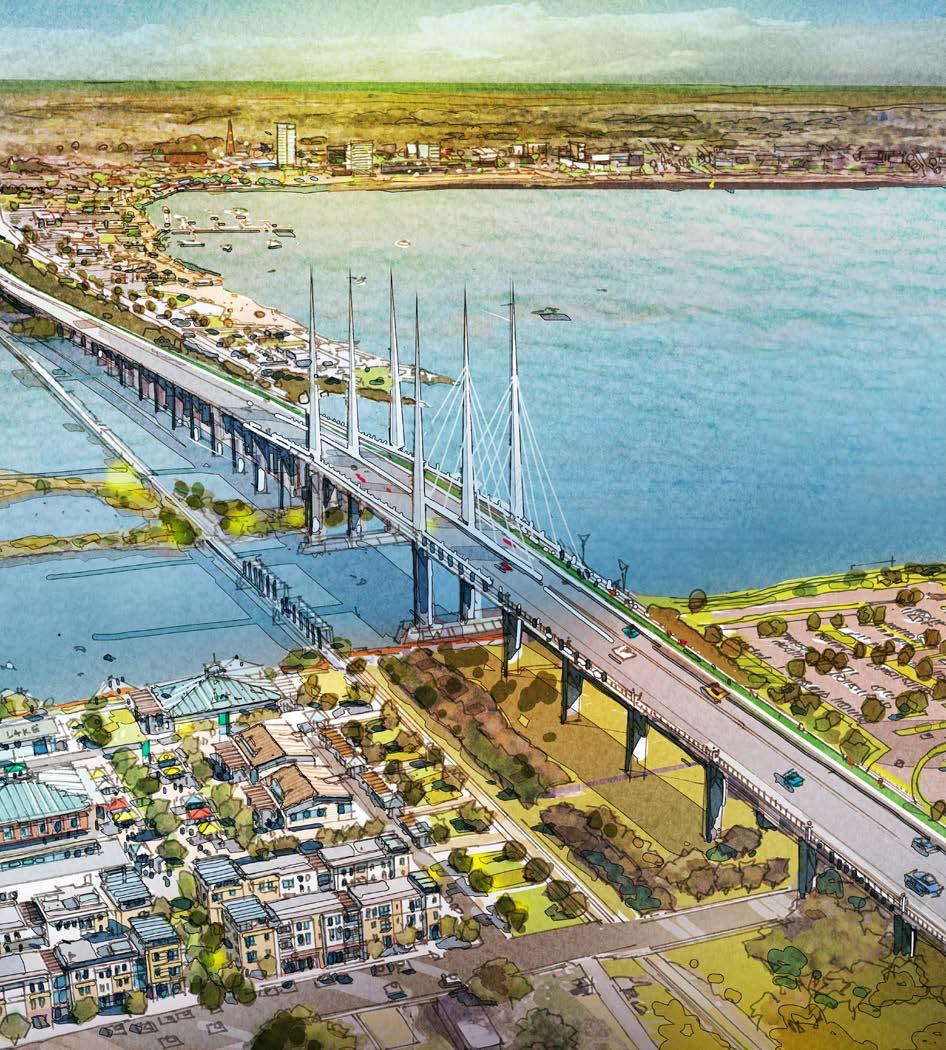
• Exploring other opportunities for development across the region’s waterfronts would promote economic development in both Calcasieu and Cameron parishes.
• Waterfront development has proven to be successful all over the country from a local and tourism standpoint, and can provide a longterm economic boost to all surrounding areas.
Waterfront Development focuses on growth in Community Planning, Housing, Economic Development, Infrastructure, and Natural and Cultural Resources. An enhanced Lake Charles waterfront would:
Community Planning
• Improve bike and pedestrian connectivity. Cities across the country with vibrant, activated waterfronts have thrived because of the
It’s exactly what the lakefront has needed for decades...it’s been wasted and vacant space that could be critical to revitalize Downtown Lake Charles.View of the new I-10 Calcasieu River Bridge and future development in Westlake during the day
presence of a continuous, public edge along the water. For Westlake and Lake Charles, this public investment is possible from the Lake Charles Civic Center, across the new I-10 bridge, to Westlake, which would connect over 5 miles of pedestrian promenades and bike trails.
• Offer more opportunities for family and youth. Providing diverse recreation and restaurant amenities is critical in activating the waterfront and making it accessible to all people. Current developments, including the Crying Eagle Brewery, Port Wonder Children’s Museum and Science Center, and Lake Area Adventures, along with future mixed-use development opportunities, will provide an abundance of amenities for families and children to engage with.
• Set the standard for waterfront development in the region. To have successful waterfront development, the first step is to create a continuous, public edge to the water where developments can plug and play into the existing public investment, such as Port Wonder and the rehabilitation of the City-owned parking garage. Detailed development standards will be outlined with aesthetic and programmatic requirements, while ensuring that the investment in the Lake Charles waterfront will set the stage for all future waterfront development in the area.
• Diversify housing types, while providing opportunities for residents interested in Downtown and lakefront living. One of the greatest needs of the region is a diversity in affordable housing options. Paired with the growing interest in Downtown living, the Lake Charles Waterfront is a great location to provide quality housing options, with access to the lake.
• Activate and connect the waterfront. Today, Lake Charles and Westlake remain largely disconnected because of the barrier created by two major bodies of water — Lake Charles and the Calcasieu River. In partnership with the design and construction of the new I-10 Calcasieu River Bridge, this gap could be bridged through the implementation of nearly 5 miles of walking and biking paths from the Horseshoe Casino, across the bridge, to the waterfront, and over to the Civic Center.
• Create an attraction with entertainment, shopping, and restaurant amenities. For decades, the Lake Charles Waterfront has been considered one of the region’s largest, untapped resources, primed for economic development. With the current development of Crying Eagle Brewery, Port Wonder, Lake Area Adventures, and Paul’s Rib Shack, momentum for economic investment on the waterfront is growing. Water taxis could provide a new form of connectivity to economic growth as well as a source of entertainment in themselves. The time is ideal to capitalize on these investments and expand opportunities to include new restaurants and entertainment that will continue to attract residents and tourists to Lake Charles.
• Improve the I-10 corridor, both through enhancements to the Calcasieu River Bridge and improved aesthetics along I-10 through the Downtown Lake Charles waterfront area.
• Strengthen and protect the shoreline and promote flood control to protect waterfront investment. With the current investments along the waterfront, and all proposed future development opportunities, it is vital that these assets are protected. Several of the flood reduction and prevention measures explored in the Coastal Flood Risk Reduction project can be explored here, including: living shorelines, beach protection, breakwaters, and rock revetment.
• Enhance outdoor recreational amenities and expand existing cultural assets and investments.
• Promote regional identity for accessible, activated waterfronts. The Lake Charles Waterfront is not only an amenity for current and future residents of SWLA, but also an ideal tourist stop along the I-10 corridor between Houston and New Orleans. With enhanced amenities, entertainment, and dining, the waterfront will encourage travelers to stop in Lake Charles and Westlake.
• Create a gateway to ecotourism in the region. Southwest Louisiana is already known for its beautiful nature and access to the outdoors; however, there are opportunities to further this identity and support an interconnected system of paths and natural areas to build a robust ecotourism network.
The Lake Charles Civic Center is located in the heart of Downtown Lake Charles and serves as the eastern anchor in waterfront development. With over 83,000 square feet of leaseable space and four major event spaces — James E. Sudduth Memorial Coliseum, Rosa Hart Theater, Exhibition Hall, and Arcade Amphitheater — the Lake Charles Civic Center is able to host a wide variety of events each year. These events attract tourists from all across the country, and therefore, put a demand on the local hotel market.
1 Create a Parcel Adjacent to the Civic Center for a Conference Hotel Convention centers are intended to provide economic development opportunities for local communities through ongoing public investment; however, they cannot do this work alone. Hotels located adjacent to convention center facilities serve as opportunities to bolster the work of the convention center, draw in additional local, regional, and national events, and thus generate greater revenue for the hosting community. The land surrounding the Lake Charles Civic Center is
1 Create a parcel ideally sited for the development of a conference hotel, adjacent to the Civic Center
2 Build structured parking to replace surface parking, or provide funding to developers to incorporate replacement parking into the development of adjacent blocks
3 Make a public investment in an enhanced, continuous public waterfront from the Lake Charles Civic Center, across the new I-10 bridge, to the Westlake waterfront
4 Subdivide the waterfront to create discrete development parcels, totaling ~50 acres of developable land
5 RFP development parcels with specific requirements for private developers to propose and build new restaurants, recreation, and entertainment uses, and mixed-use with housing
Pursue waterfront development in areas of Calcasieu Parish outside of Lake Charles and in Cameron Parish
a perfect opportunity to explore the development of a conference center hotel. Requiring approximately five acres of land, the proposed Conference Center Hotel could be attached to the existing civic center, or located on a property adjacent to it.
There is an abundance of parking available for visitors to Downtown Lake Charles and the waterfront today. However, much of that parking is taking up valuable land that could be used for the creation and development of an amenitized waterfront.
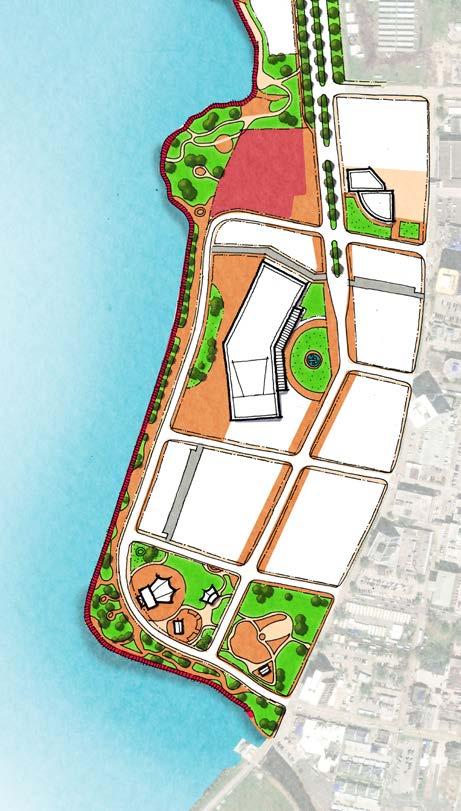
As development parcels along the Lake Charles Waterfront and around the Civic Center are identified, the existing parking that is available today will need to be reallocated and redistributed to accommodate for new development. The City of Lake Charles, in partnership with identified developers for waterfront development, can work together to develop parking strategies to adequately supply new amenities.
I would visit this project I
Having more local attractions would be fantastic.Potential Redevelopment Concept for the Lake Charles Civic Center Area
• The Riverfront Park was spearheaded by a non-profit, Detroit Riverfront Conservancy, in 2003
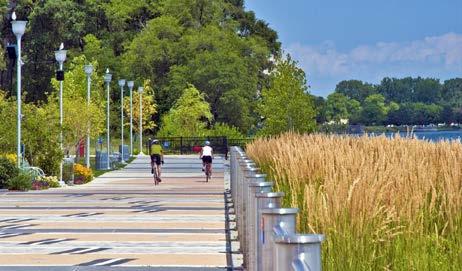
• Initially, $200 million was invested: $35M from GM, $50M from the Kresge Foundation, and $110M in philanthropic contributions
• This initial investment spurred $2 billion in public/private development
• Each year, $43.7M is spent by tourists, with $14.5M going back to the City of Detroit in tax revenues
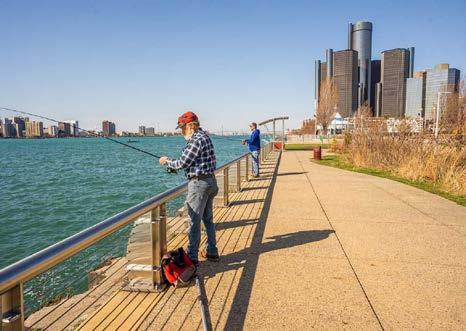
• Annually, there are over 3.5 million visitors
Currently, as waterfront development occurs in Westlake and Lake Charles, individual development entities are responsible for incorporating water’s edge access into their developments, if any. The result is a fragmented boardwalk that does not unify the waterfront.
3 Make a Public Investment in an Enhanced, Continuous Public Waterfront from Westlake to Lake Charles
Prior to identifying any further development of the Lake Charles waterfront, it is imperative that a public investment is made to create a connected public edge from the Lake Charles Civic Center, across the new I-10 bridge, and to the Westlake waterfront. Upon completion, a connected Lake Charles waterfront would provide residents and tourists with access to nearly 5 miles of connected pedestrian and bike trails.
The waterfront should connect to a future maritime training campus on the Calcasieu River at the end of Ryan Street. For more information, reference the Economic Development Plan Recommendations.
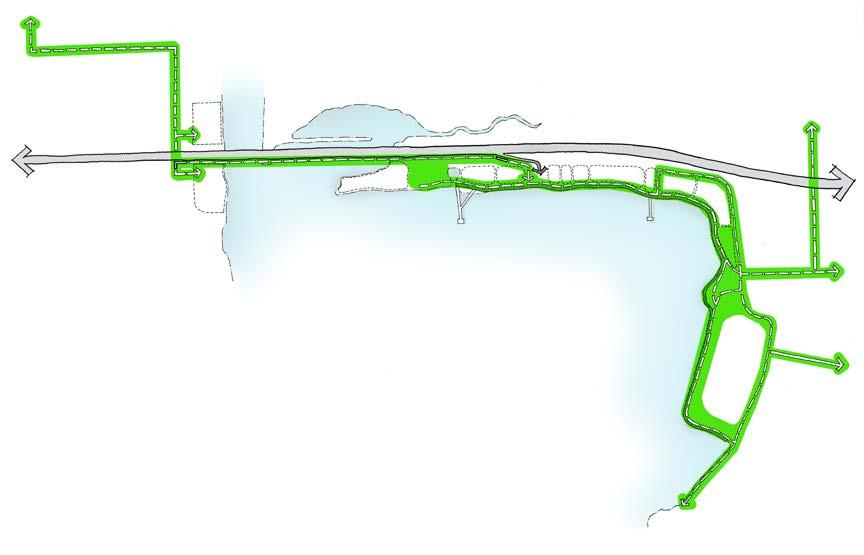
I like that this project brings life to the lake of “Lake Charles.”
Being that it can be seen from the interstate, it will create a tourist stop for many passing through, as well as a place for locals to enjoy our wonderful lake.
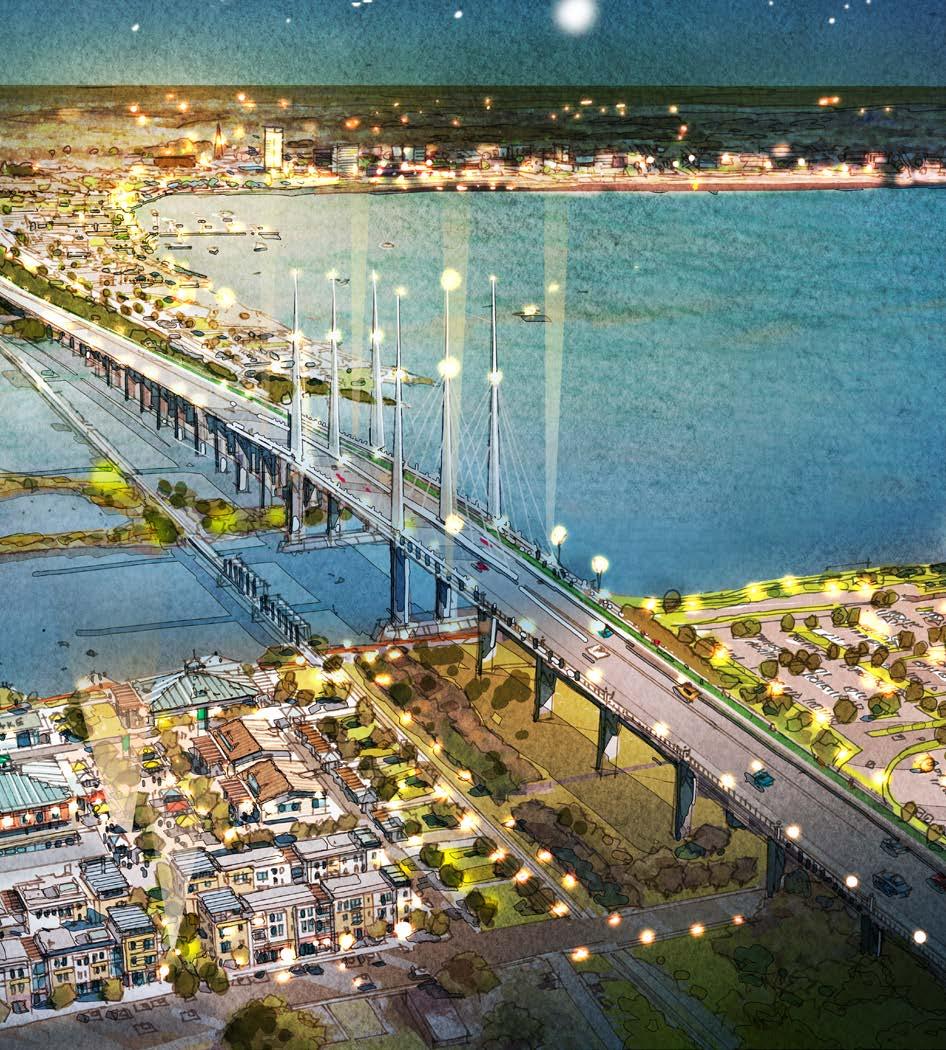
For the last several years, the Louisiana Department of Transportation (LADOTD) and the Federal Highway Administration (FHWA) in coordination with the City of Lake Charles, the Town of Westlake, Calcasieu Parish, and a local I-10 Task Force have been working to prepare for the demolition and replacement of the I-10 Calcasieu River Bridge. The construction of the New Calcasieu River Bridge, along with the associated realignment of I-10 from the I-10/I-210 west interchange to the Ryan Street exit ramp, will greatly impact the accessibility and activation of the Lake Charles Waterfront.
The Just Imagine SWLA Partners and members of the I-10 Task Force are working with LADOTD staff to ensure that the design and construction of the bridge can meet both FHWA standards, while also optimizing access to the waterfront and the businesses who will locate there as a part of the redevelopment.
Anticipated Timeline for the Design and Construction:
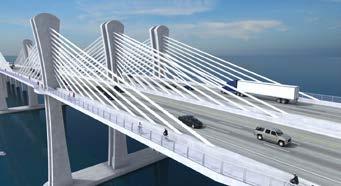
• Fall 2022: Public Hearing — DOTD will hold public hearings to gather feedback on the Alternative 5G Design
• Fall 2022 to Early Spring 2023: Selection Process — P3 team selection and negotiation
• Late Spring/Early Summer 2023: Final Design — Selected team will prepare final design
Potential Partners
• City of Lake Charles
• Visit Lake Charles
• Private developers and investors
• Cameron Parish
• City of Westlake
• Calcasieu Parish
Potential Funding Sources
• Federal Infrastructure Investment and Jobs Act (competitive grants)
• City of Lake Charles General Fund
• Grants that have planning as eligible uses
• Lakefront Economic Development District funds as projects are built
• Private developers and investors
• Restore LA Small Business Loan and Grant Program
• Louisiana Economic Development (LED) incentives for job creation
• USDA grants
• EDA grants
Previous proposals for the Lake Charles Waterfront have recommended that the area is developed in its entirety by one developer. Due to the size and complex nature of waterfront development, this type of single-developer approach has not been successful.
In order to create a more manageable scale of waterfront development, subdividing the Lake Charles waterfront would increase and potentially expedite development. Once subdivided, there would be approximately 50 acres of developable land across Westlake, the Lake Charles Waterfront, and the Civic Center that would be more attractive to all types of investors, both large and small.
As a public investment in the waterfront is underway and once the area has been replatted to account for the subdivided waterfront and new development sites, investment in the Lake Charles waterfront can begin.
An RFP is a Request for Proposal, which announces a project, describes the project parameters and expectations, and solicits bids from qualified designers, contractors, and professionals to compete for the project. With each RFP for waterfront development in Westlake and Lake Charles, there should be a series of guiding principles and requirements to determine what is and is not allowed, including: types of amenities, parking requirements, and development aesthetics. This will allow for a cohesive and visually pleasing waterfront development, while still promoting a diversity of amenities.
It would bring much needed development to not only a great waterfront area not many cities have access to, but a good picture of Lake Charles for anyone traveling over the I-10 bridge.
IDENTIFIED AND POTENTIAL WATERFRONT IMPROVEMENTS AND DEVELOPMENTS
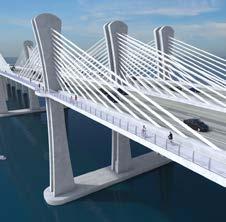
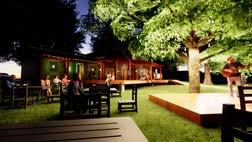
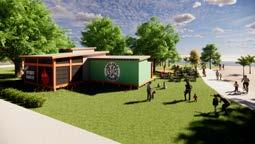
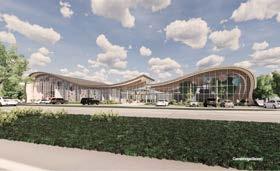
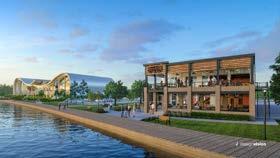
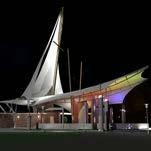
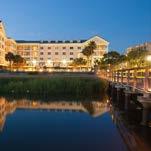
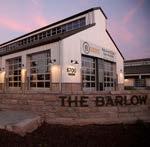
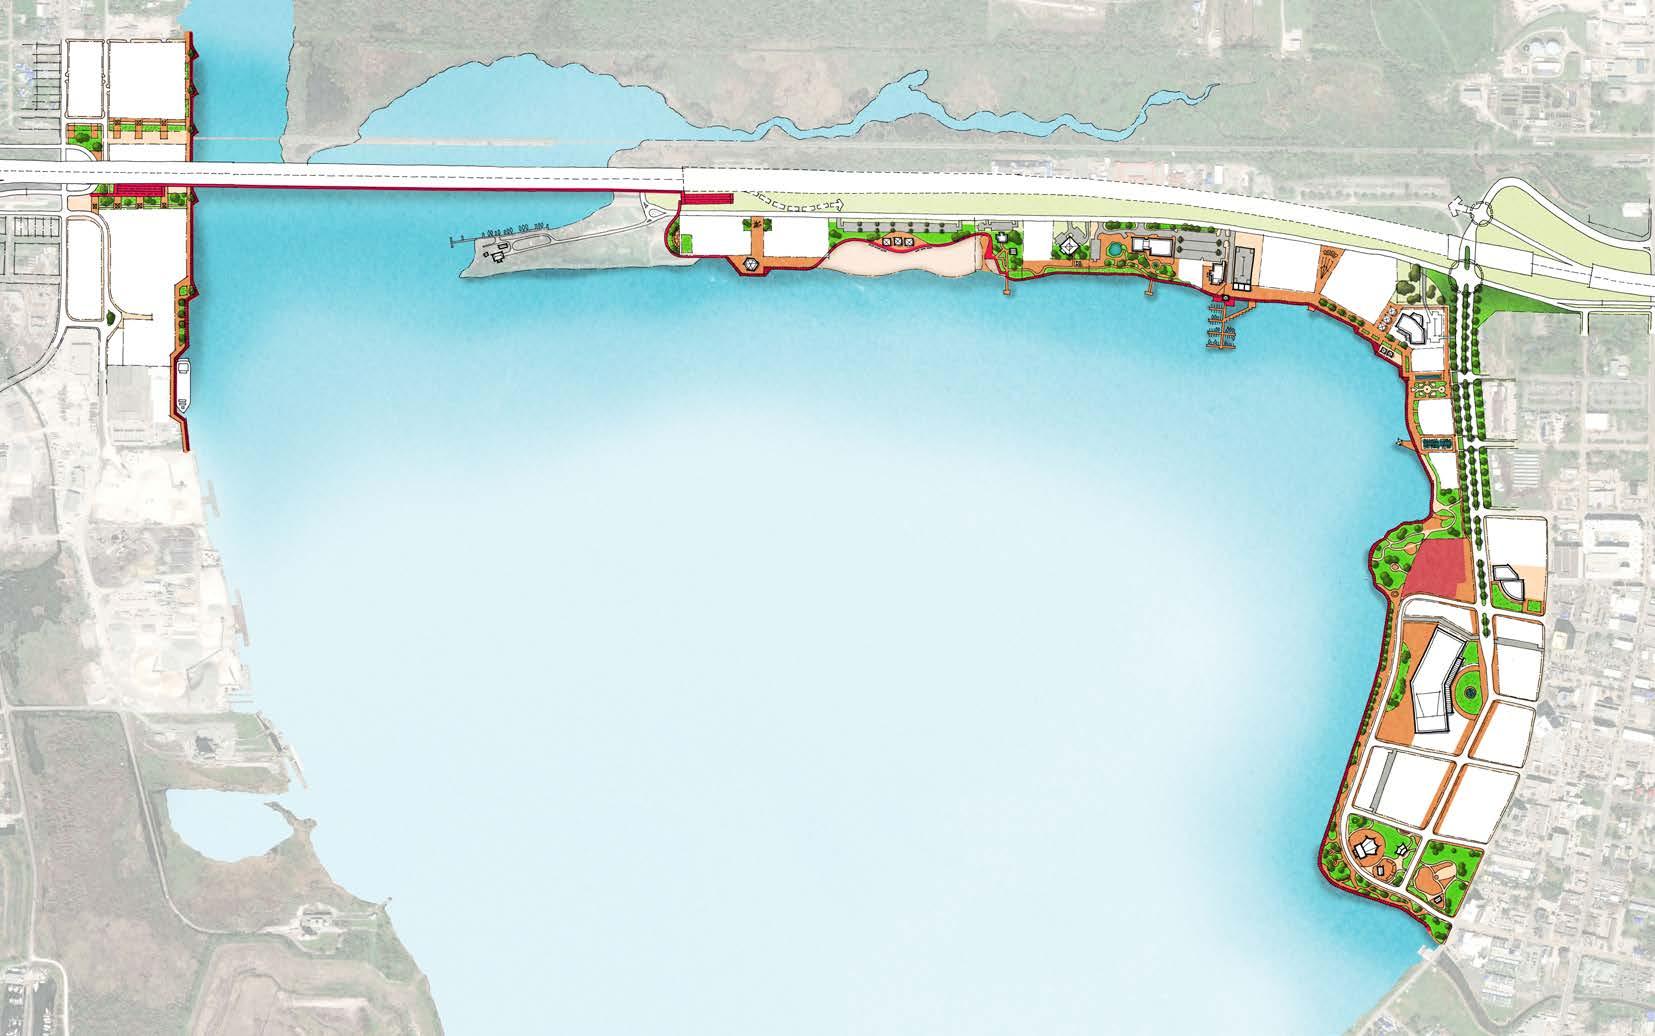
• The San Antonio Riverwalk is a 15-mile loop, with water access and activities, stormwater management features, and an activated public space with festive restaurants, bars, shops, and hotels
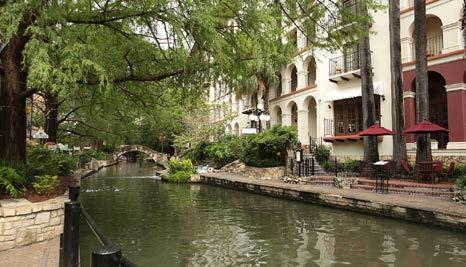
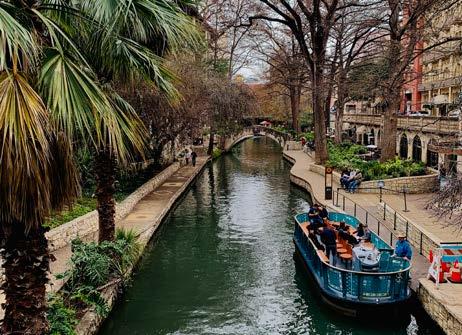
• With over 11.5 million visitors each year, the Riverwalk is a popular tourist destination
• In 1938, $430,000 was invested: $75,000 from the City of San Antonio and $355,000 from FDR’s Works Progress Administration
• Each year, the Riverwalk nets $1.3 billion, with an average of $315 million in hotel business annually
The Lake Charles Waterfront has been an underutilized, but well-revered community asset to Calcasieu Parish and the region for decades. Through its proximity both locally to Downtown Lake Charles and regionally along the I-10 corridor, this untapped water’s edge is prime for investment. As the first priority for maximizing long-run growth and economic diversification, seeing the completion of the I-10 corridor improvements and new construction of the Calcasieu River Bridge will propel forward the long-awaited desire for an activated Lake Charles Waterfront. By focusing on industries with significant potential for future job growth — hospitality, tourism, and water transportation — the Lake Charles Waterfront sets the stage for optimizing economic impact and catalyzing ideal development opportunities for Downtown Lake Charles and Westlake.
To implement cohesive and vibrant waterfront developments, it is important to begin with one, continuous public waterfront edge. Whether this be at the scale of the Lake Charles waterfront, from the Civic Center to Westlake, or along a smaller stretch of any water body in Cameron Parish, a consistent edge for development to plug into is vital. This establishes a framework with long-term benefits for thriving and active waterfronts. While the Lake Charles waterfront is the first use-case for this region, it will set a precedent and standard for any future waterfront development opportunities explored across all of Southwest Louisiana.
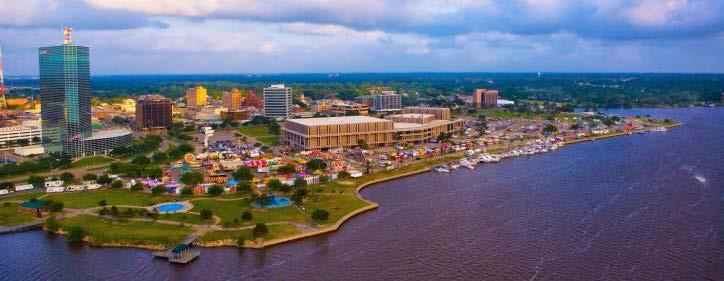
Subdivide to create discrete development parcels, totaling ~50 acres of developable land
engineering consultant fees, staff time
Build structured parking to replace surface parking or provide funding to developers to incorporate replacement parking into the development of adjacent blocks
Make a public investment in an enhanced, continuous public waterfront from the Lake Charles Civic Center, across the new I-10 bridge, to the Westlake Waterfront
Create a parcel ideally sited for the development of a conference hotel, adjacent to the Civic Center
Use a public, request for proposal (RFP) and selection process to identify developers for individual parcels and articulate requirements for new restaurants, recreation, and entertainment uses, and mixed-use with housing
Economic Development District funds as projects are built
• Private investors and developers
• Restore LA Small Business Loan and Grant Program
• Economic development component of the CDBG-DR
Pursue waterfront development in areas of Calcasieu Parish outside of Lake Charles, and in Cameron Parish
QUALITY HOUSING FOR ALL
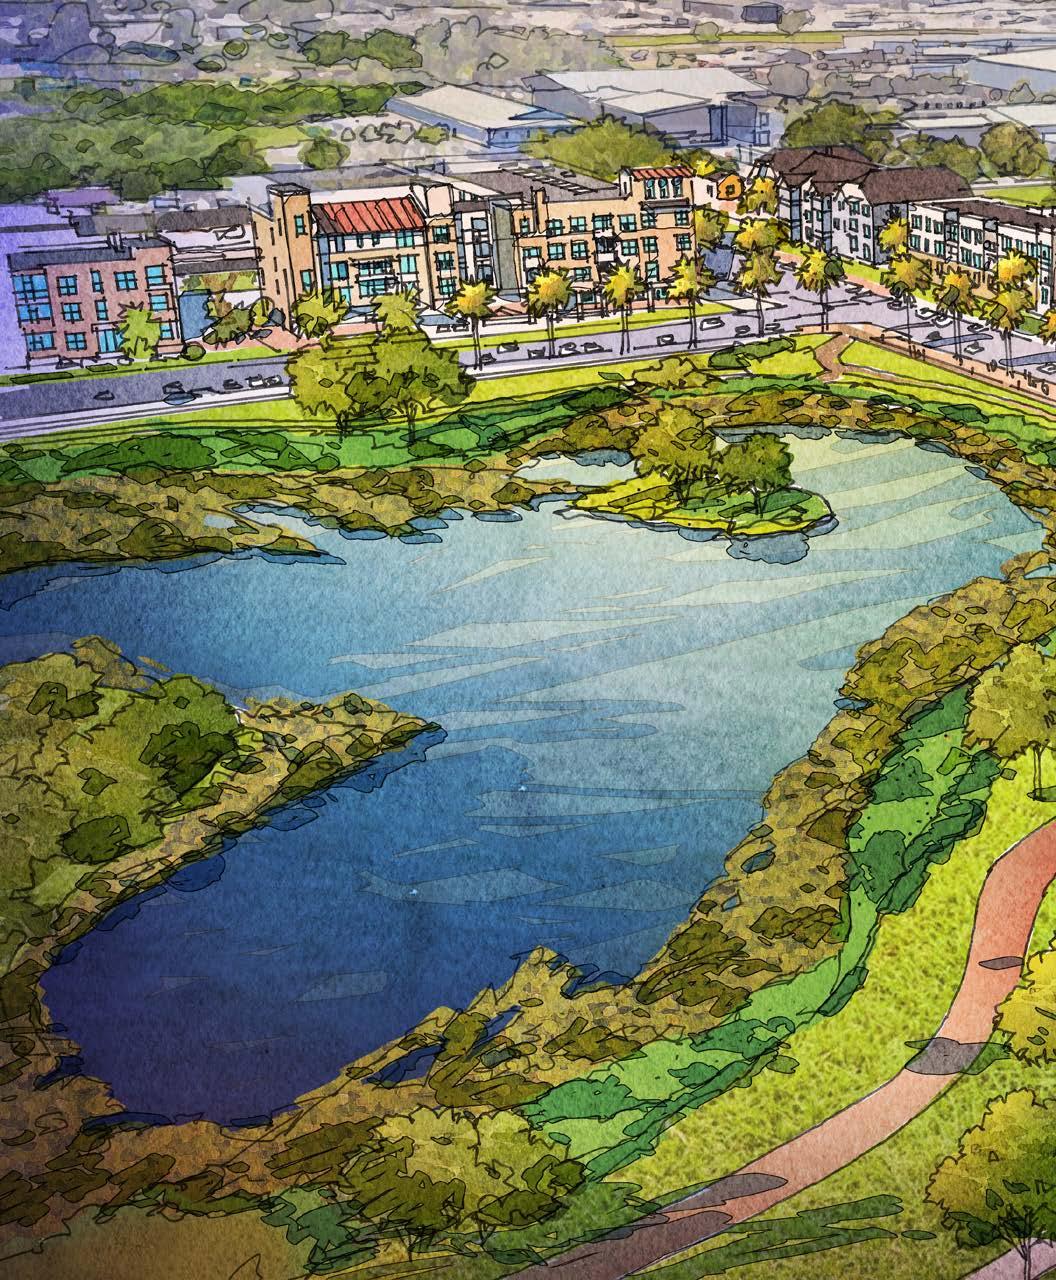
Mixed-income housing is the best practice for transforming neighborhoods and creating quality housing that increases choices for everyone. Older subsidized housing is redeveloped into high-quality housing to serve a mix of low-income, workforce, and market-rate individuals and families. All families live in identical high-quality homes and enjoy beautiful amenities. A Mid-City Neighborhood Transformation approach can help a neighborhood compete for HUD’s $40-$50 million Choice Neighborhoods Implementation Grant (HUD CNI Grant), leveraging over $200 million of additional investment to a neighborhood in five years. This approach is being explored for the Lake Street area between I-210 and W. Sallier
HIGH priority
0-7 years
$200 Million
A demonstration neighborhood transformation in the central city area of Lake Charles could bring hundreds of new mixed-income homes and millions of dollars of investment to the area north of Prien Lake Mall on Lake Street. The comprehensive transformation would provide quality housing for all families, improve quality of life in the neighborhood with new parks and streets, and support low-income families with services. The project can become a model for future neighborhood development in both parishes.
Ensuring affordability for families and individuals of all income levels is the best practice for both large and small projects. Cameron Parish can encourage a Mid-City Neighborhood Transformation model for new rental and homeownership developments by offering incentives and targeted funding sources.
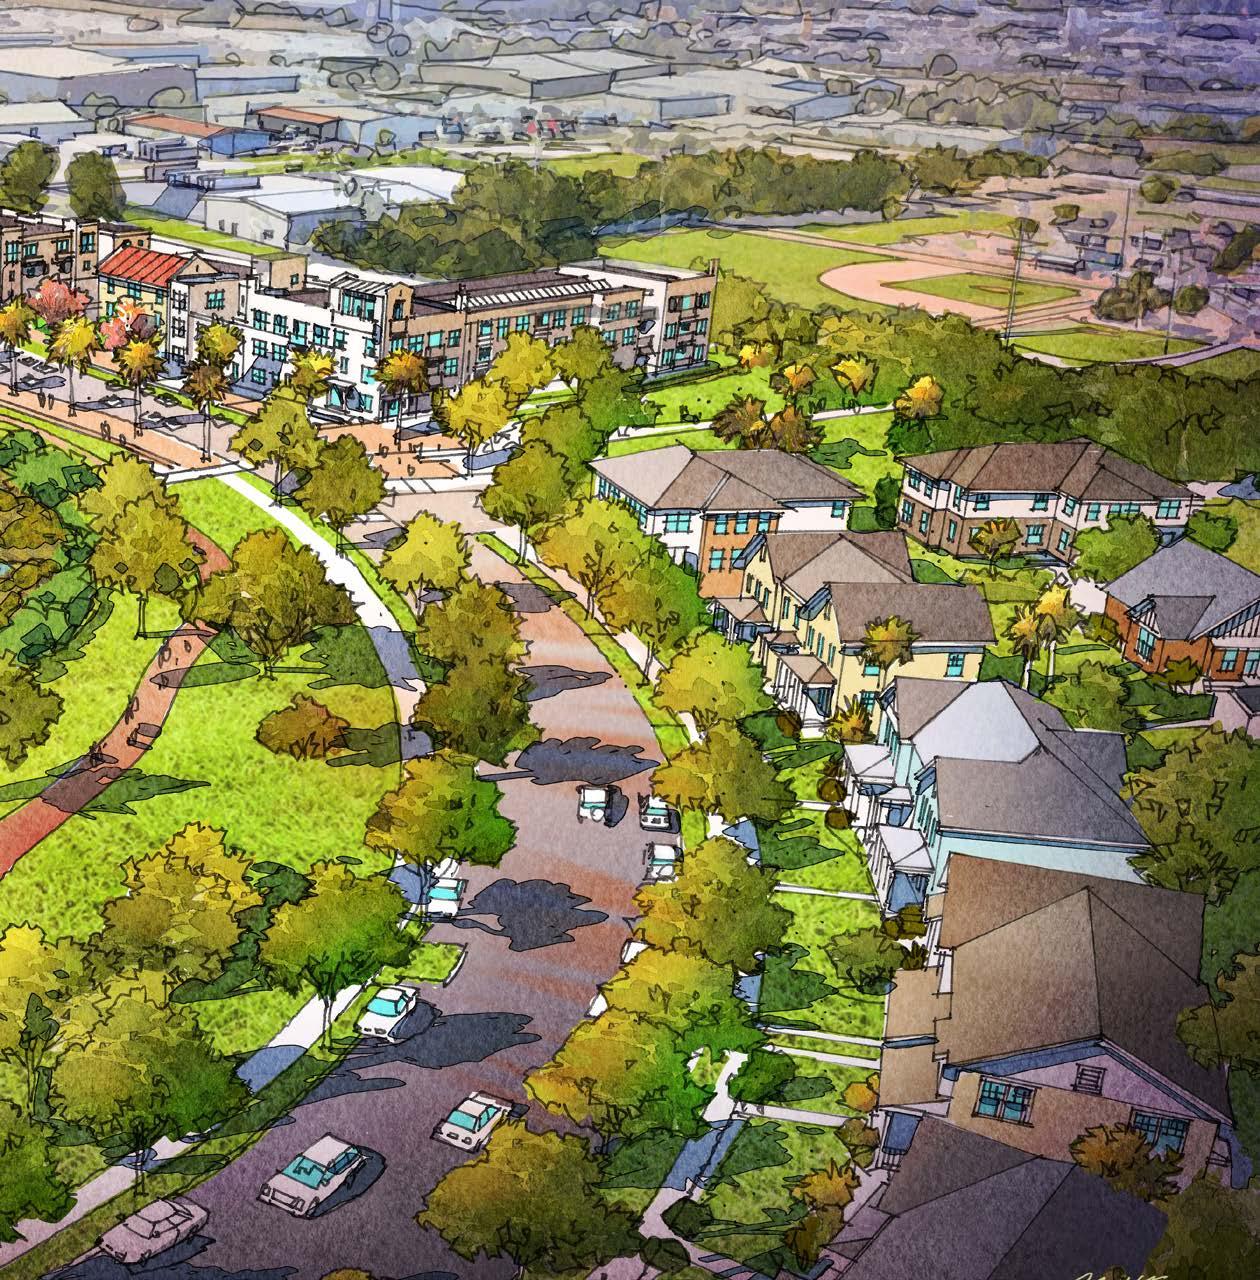
Street. Homes for the current residents would be replaced one for one to minimize concerns about displacement. The transformation would go far beyond building new housing. The HUD CNI Grant focuses on three areas, housing, which focuses on the design and implementation of new mixed-income housing units, neighborhood, which focuses on community growth, connectivity, and significant community projects, and people, which focuses on support and services for neighborhood families.
• Mid-City Neighborhood Transformation deconcentrates poverty while ensuring no one is displaced.
• It mixes low-income and market-rate families in identical units and buildings with housing for families, single people, seniors, and those with disabilities.
• A Mid-City Neighborhood Transformation approach can help an area qualify for the Department of Housing and Urban Development’s $40–$50 million Choice Neighborhoods Implementation Grant, which can bring over $200 million of investment into the neighborhood in 5 to 7 years.
• 500-800 new mixed-income homes
• Neighborhood parks, retail, and community amenities
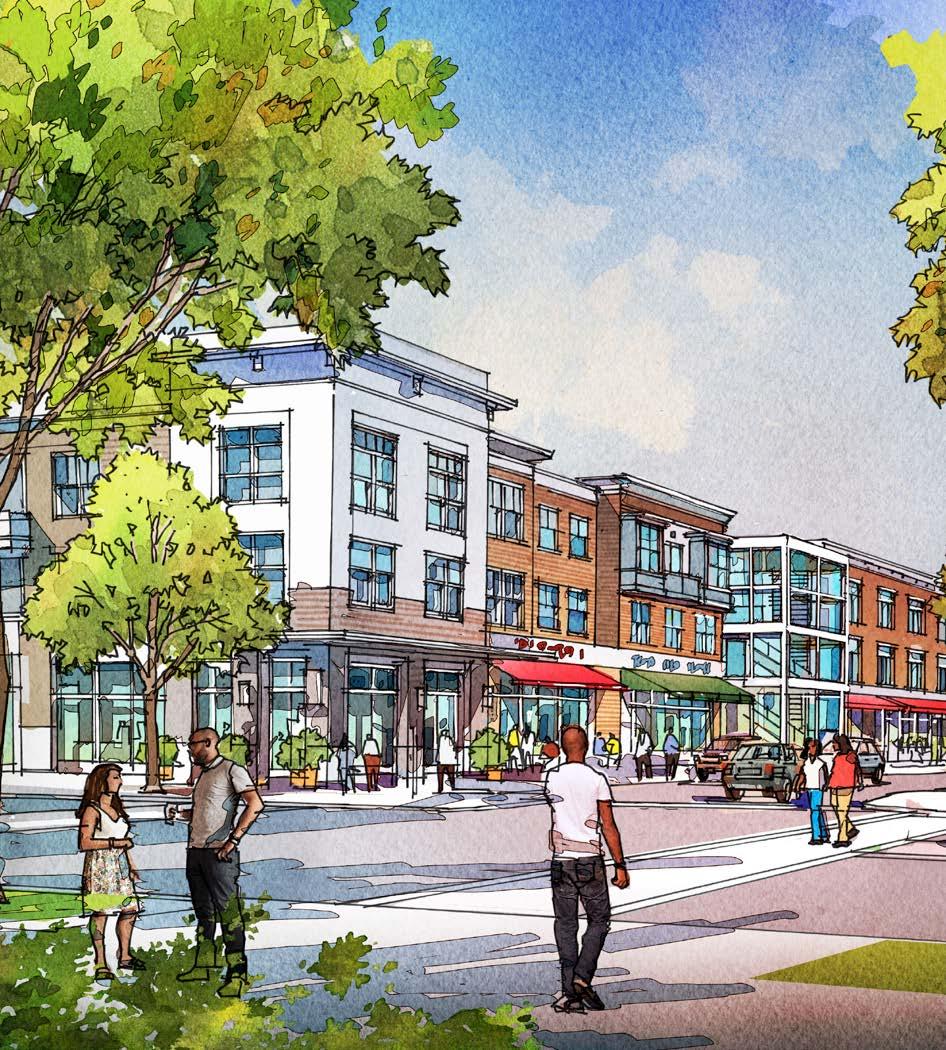
• Increased household incomes, health outcomes, and improved education for current and new families in the neighborhood
Mid-City Neighborhood Transformation is important in communities...Mixed-income housing makes neighborhoods more appealing to people of all income levels, not just one.
A Good Example FORT WORTH 2019 CNI IMPLEMENTATION GRANT WINNER
The Mid-City Neighborhood Transformation focuses on growth in Community Planning, Housing, Economic Development, and Infrastructure. A neighborhood transformation plan:
• Builds new streets and neighborhood parks, improving walkability, bikeability, and safety An action step to accomplishing the Mid-City Neighborhood Transformation is securing leverage; connecting funding and other resources to the transformation. Part of that leverage is provided by the City in the form of new streets, parks, and utilities.
• Provides housing for all family types New housing would provide choices for all family types, including single people, seniors, and those with disabilities while ensuring that low-income and market rate families live in identical, high-quality homes.
• Supports local businesses and entrepreneurship opportunities Programs, services, and sometimes physical infrastructure can support local businesses and entrepreneurs as part of the neighborhood transformation plan. The transformed neighborhood itself in turn can better support existing businesses and create opportunities for new ones to be created.
• Promotes workforce development and career readiness opportunities A people-focused non-profit is a key member of a successful CNI Implementation Grant partnership. This “people partner” works with existing partners, programs, and services to support workforce development and career readiness in the neighborhood.
• Leverages HUD’s funding to secure hundreds of millions in additional neighborhood investment The money from the CNI Implementation Grant is seed money. The $40–50 million investment can draw $200 million+ of additional funding.
• Builds new streets and improves drainage in the neighborhood The leverage provided by the City as a partner in the process could include streets, utilities, and other key infrastructure elements.
I think this project will benefit SWLA.
Affordable housing might be the single most important aspect of not only our area, but the whole state.
The Mid-City Neighborhood Transformation would require HUD’s Choice Neighborhoods Initiative Implementation Grant as a primary funding source. The grant is competitive and has a defined series of steps to follow to be successful.
Total neighborhood transformation requires a collaborative effort. The HUD CNI Implementation grant has three components, housing, neighborhood, and people. Housing focuses on the new mixed-income units to be built, Neighborhood focuses on connectivity and other physical projects to create a physically transformed neighborhood, and People focuses on programs and services to help the existing residents thrive. A Mid-City Neighborhood Transformation developer would partner with the City of Lake Charles and the Housing Authority of the City of Lake Charles to lead housing and neighborhood, while people-focused non-profits, community service providers, and the school district would support people. The partnership then begins to establish a neighborhood boundary based on the requirements of the CNI grant.
Action Steps
1 Partner with mixed income housing developer, people-focused non-profit, school districts, the City of Lake Charles, the housing authority, and community service providers
2 Develop a transformation plan with the community
3 Secure leverage for housing, neighborhood, and people
4 Prepare and apply for the HUD Choice Neighborhood Implementation Grant
5 Prepare for HUD site visit if successfully short-listed
6 Initialize the CNI Grant
7 Build new streets and infrastructure
8 Implement three neighborhood projects
9 Provide people case management, support, and partnerships
10 Build new housing in several phases
Transformation continues with ongoing support for residents
Once the partnerships are established, a plan is created with the residents and with the input of the wider neighborhood. The partnership team engages residents to understand the vision for the neighborhood through community meetings, workshops, virtual engagement, and other methods. The community members help refine the neighborhood boundary, express desires about neighborhood amenities and their locations, and provide input on building types. With this input, the plan is created and refined.
To create a total neighborhood transformation, funding from the CNI Implementation Grant is seed money to draw additional funding and partnerships over time. This funding and these partnerships are called leverage. The $40-50 million in funding from the CNI Implementation Grant can draw an additional $200 million+ in leverage, including new streets, utility infrastructure, amenities, and funding to support existing programs and establish new ones to serve neighborhood needs.
Once there is community consensus on a plan and leverage is secured, the partnership team prepares the grant application which shows the plan, demonstrates the leverage that has been secured, and lays out the financial path for the development of the housing, transformation of the neighborhood, and the support for the residents in the neighborhood.
If successfully shortlisted for the CNI Implementation Grant, a site visit is conducted by HUD to better understand the proposed transformation. The partners work together to demonstrate the leverage that has been secured throughout the process and present the plan as a community vision.
6 Initialize the CNI Grant
A powerful aspect of the CNI Implementation Grant is that it is time-bound. Once the grant is started, the housing must be built in 6 years. If selected by HUD following the site visit, the grant term would begin. By then excitement in the neighborhood could be high and aspects of transformation started ahead of selection because of the partnerships created during the process.
7 Build New Streets and Infrastructure
Part of the leverage brought to the table during the CNI process is new streets and infrastructure, provided by the City. This significant investment is key to supporting neighborhood transformation and growth into the future.
• The Iberville/Bienville Basin community was awarded a $30.5 million HUD Choice Neighborhood grant.
• 304 public housing units at Iberville were developed into over 680 mixed-income homes on-site and an additional 600+ units were added off-site.
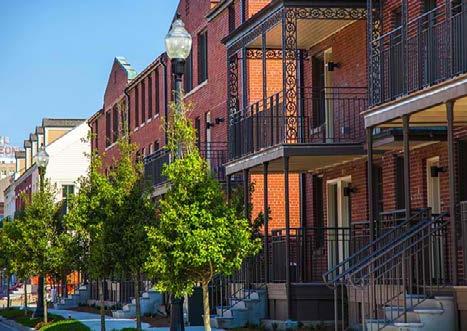
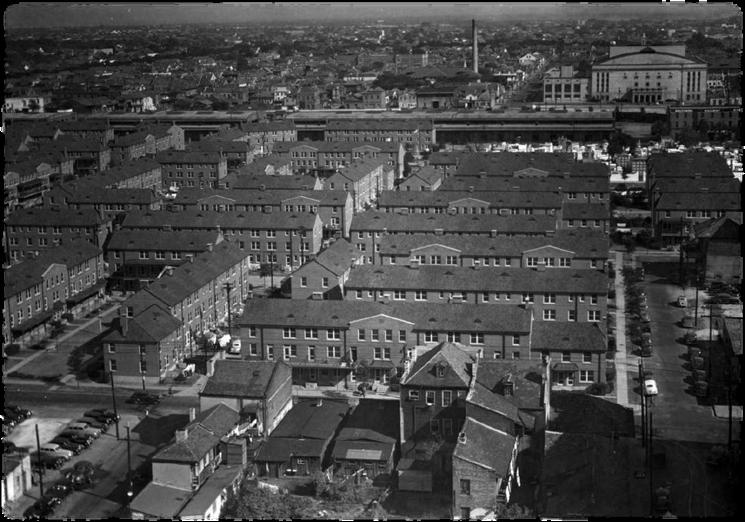
A Good Example A REVITALIZED COMMUNITY: BIENVILLE BASIN
A neighborhood plan helps to visually document what assets are existing in the neighborhood and how they could connect to the proposed housing site. This plan of the Mid-City neighborhood shows different neighborhood uses, transit access, and potential neighborhood amenities.
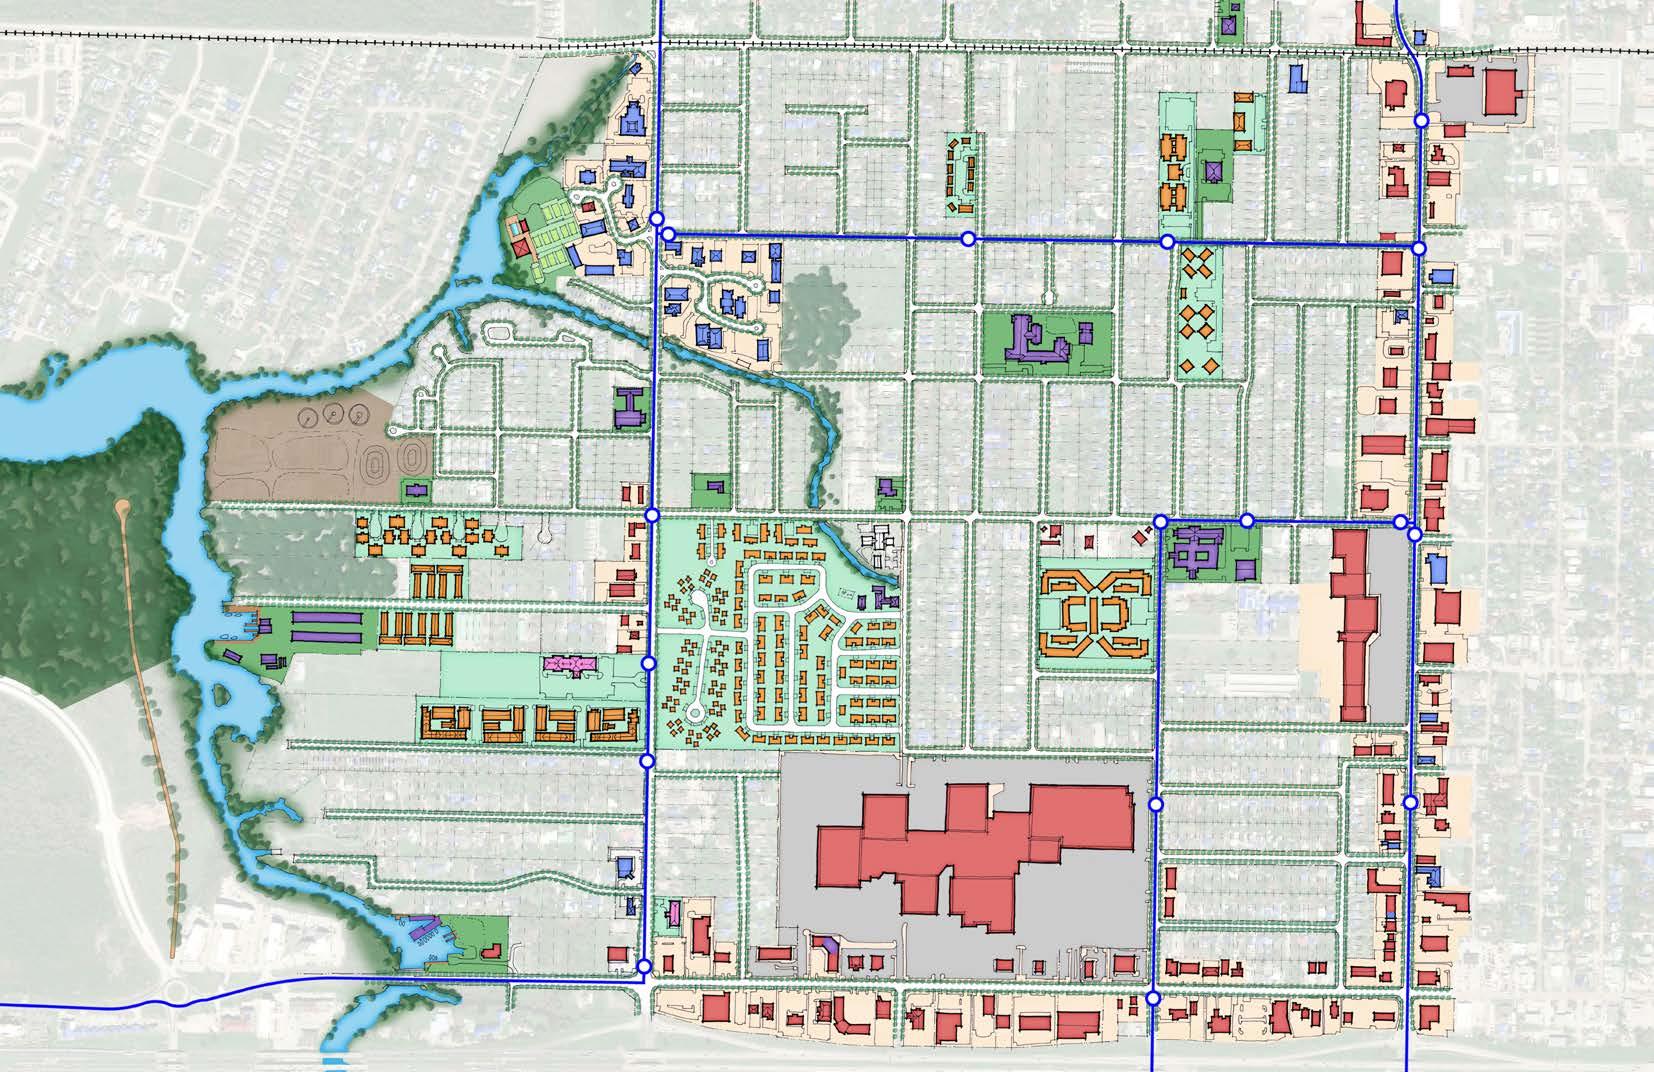
One of the aspects of the transformation plan is three neighborhood projects. These community improvements could range from specialty parks and gathering spaces to a focus on broadband access. The neighborhood projects would be supported and implemented by partnerships established while securing leverage.
A critical aspect of the CNI Implementation Grant is resident support. Families would have case management and support through each step of the process with a focus on anti-displacement strategies. Partnerships established while securing leverage would also provide additional supportive services to residents and other members of the community.
Finally, the dilapidated public housing at 661 Dixy Drive would be demolished and the new Mid-City Neighborhood Transformation would be built according to the community vision. The housing would be built in phases to minimize the relocation of residents during demolition and new construction. The partnership would establish the plan for long-term management of the property. Steps 7–10 would happen concurrently as the neighborhood transformation would continue during the grant term and beyond.
Potential Partners
• Lake Charles Housing Authority
• City of Lake Charles
• Calcasieu Parish
• National & Regional Mixed-Income Developer
• National People-Focused Non-Profit
• Calcasieu School District, Calcasieu Parish School Board
• Foundations and Non-Profits
• Service providers
• Calcasieu Parish Council on Aging
• Churches and other non-profits interested in developing housing
Potential Funding Sources
• HUD Choice Neighborhoods CNI Implementation Grant ($40 million)
• Restore LA PRIME (Piggyback) loan program
• City’s CDBG allocation
• Conventional loan debt
• LHC funding programs for rental affordable housing
• In-kind commitments
• City of Lake Charles CIP/General Fund
• Philanthropy
• Infrastructure Investment and Jobs Act (IIJA) competitive grants
• LA DOTD Safe Routes to Public Places grants
• 493 distressed public housing units were redeveloped into 685 mixed-income homes.
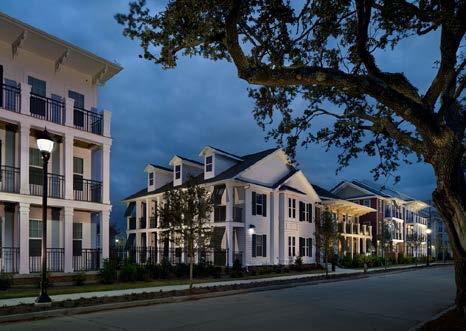
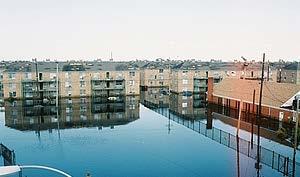
• 1/3 are occupied by families that qualify for public housing; 1/3 by low-income households, and 1/3 by market rate households. The units are identical and mixed in every building and block.
• There are parks, playgrounds, and a health clinic in the neighborhood.
• The community has a ‘cradle-to-college’ focus on education. Partners developed a new early childhood education center and a high school.
The economic impact of the Mid-City Neighborhood Transformation is over 10 times the investment from the partners. The focus of the transformation is securing leverage to turn the significant grant funding of $40 million into a much larger investment that impacts the entire neighborhood and beyond.
Partner with a developer that has national experience transforming neighborhoods with Mid-City Neighborhood Transformation n/a
Partner with a people-focused non-profit with CNI experience transforming families’ outcomes n/a
Partner with school districts and community service providers to improve education, health, and incomes n/a
Engage with residents and neighborhood stakeholders to put together a Mid-City Transformation Plan that addresses Housing, Neighborhood, and People
$600,000
Secure leverage and apply for the HUD Choice Neighborhoods Implementation Grant Minimum of :
• $15 million in Neighborhood Investment
• $56 million in Housing Leverage
• $9 million in People Leverage
Prepare application and submit included in $600,000
Upgrade infrastructure $15–20 million
Implement Neighborhood Critical Community Improvement (CCI) projects $10–50 million
Implement 6 years of People case management and partnerships
$25 million
Build Phases 1–5 of housing (minimum of 481 mixed-income housing units) $100 million
0–3 months
0–3 months
0–3 months
• HUD Choice Neighborhoods $40 million
• PRIME (piggyback) program — $356 million allocation)
• CDBG
0–6 months
• Lake Charles Housing Authority operations funds
• City of Lake Charles contribution from the general fund
Lake Charles Housing Authority & City of Lake Charles
Lake Charles Housing Authority
Calcasieu School District
National mixed-income developer Regional low-income housing development partners
National people-focused non-profit
• Visit Lake Charles
• Calcasieu Parish
• City of Westlake
0–6 months
• State funding sources (affordable housing trust fund, PRIME Piggyback loan program)
• Non-profit in-kind commitments
• Philanthropic contributions
Lake Charles Housing Authority City of Lake Charles
Lake Charles Housing Authority City of Lake Charles
Mid-City Neighborhood Transformation Implementation Committee (CNI Working Group)
Mid-City Neighborhood Transformation Implementation Committee (CNI Working Group)
6 months
• In-kind commitments
National mixed-income developer and national people-focused non-profit
National mixed-income developer and national people-focused non-profit
2–3 years
• City of Lake Charles CIP, State Capital Outlay funds, State Water/Sewer Commission funding
• IIJA competitive grant funding
• LA DOTD Safe Routes to Public Places grants
City of Lake Charles
1–6 years
• City capital funding
• Philanthropic funding
City of Lake Charles
1–6 years
1–6 years
• Philanthropy, in-kind commitments from service providers
• LHC — LIHTC 9% credits
• Conventional mortgage debt
• City contributions
National people-focused non-profit
National mixed-income CNI housing developer
Lake Charles Housing Authority, service providers and non-profits
Regional low-income housing development partners Lake Charles Housing Authority
New and existing dining, entertainment, and cultural uses will attract people traveling along I-10 and residents looking for a creative, vibrant district.
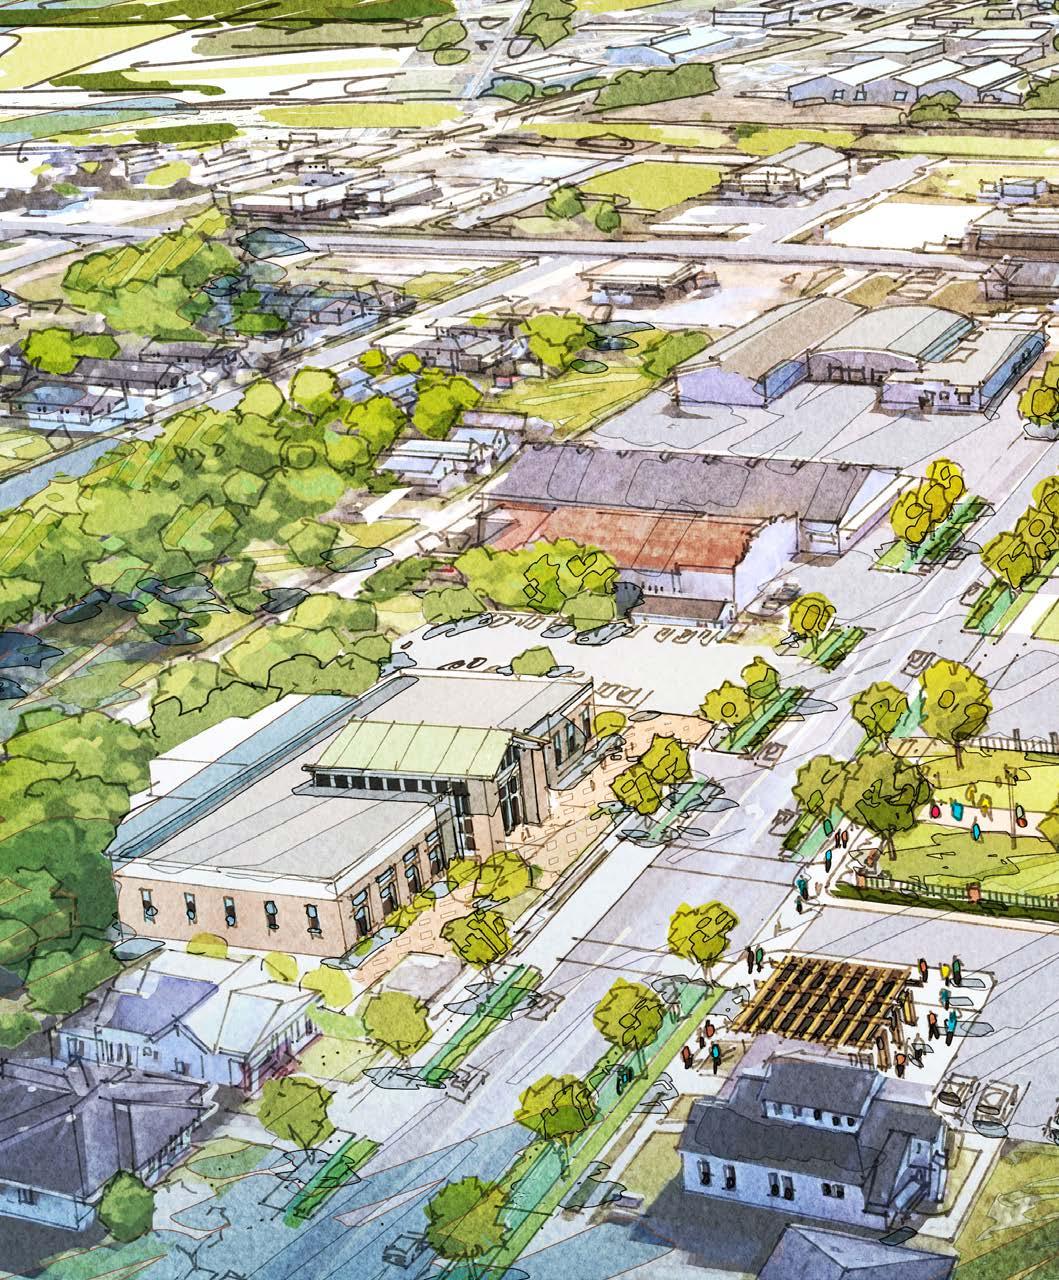
The Nellie Lutcher District is located in Lake Charles. It is currently recognized as a cultural district at the state level with a wide variety of existing buildings varying in style, age, and use. The district has been described as a microcosm of the City of Lake Charles as a whole, which is fitting given its location as a primary gateway on the I-10 corridor. The district contains Enterprise Boulevard and Broad Street; north of Broad was long a key commercial corridor for Black and immigrant communities in Lake Charles. Framing the district as a catalytic project focuses transforming Enterprise and Broad streets to be more walkable and connected, while incentivizing new development of dining, entertainment, and cultural uses. In the future, additional housing can be built and renovated in adjacent neighborhoods, filling out the district as a strong neighborhood.
HIGH priority 5-10 years
$20 Million
The Nellie Lutcher Cultural District was recognized as an official cultural district in 2016 with the intention of generating local community revitalization and economic growth. With its key location along the I-10 corridor, restaurants and venues on Enterprise Boulevard can become a destination for those traveling along the interstate. A vibrant arts and culture hub will draw people from within the city, region, and beyond.
The Nellie Lutcher District provides another gateway to attract people traveling along I-10 into the region. The new Mardi Gras Museum could also share information about ecotourism and the unique offerings of Cameron Parish as a natural and family-friendly destination.
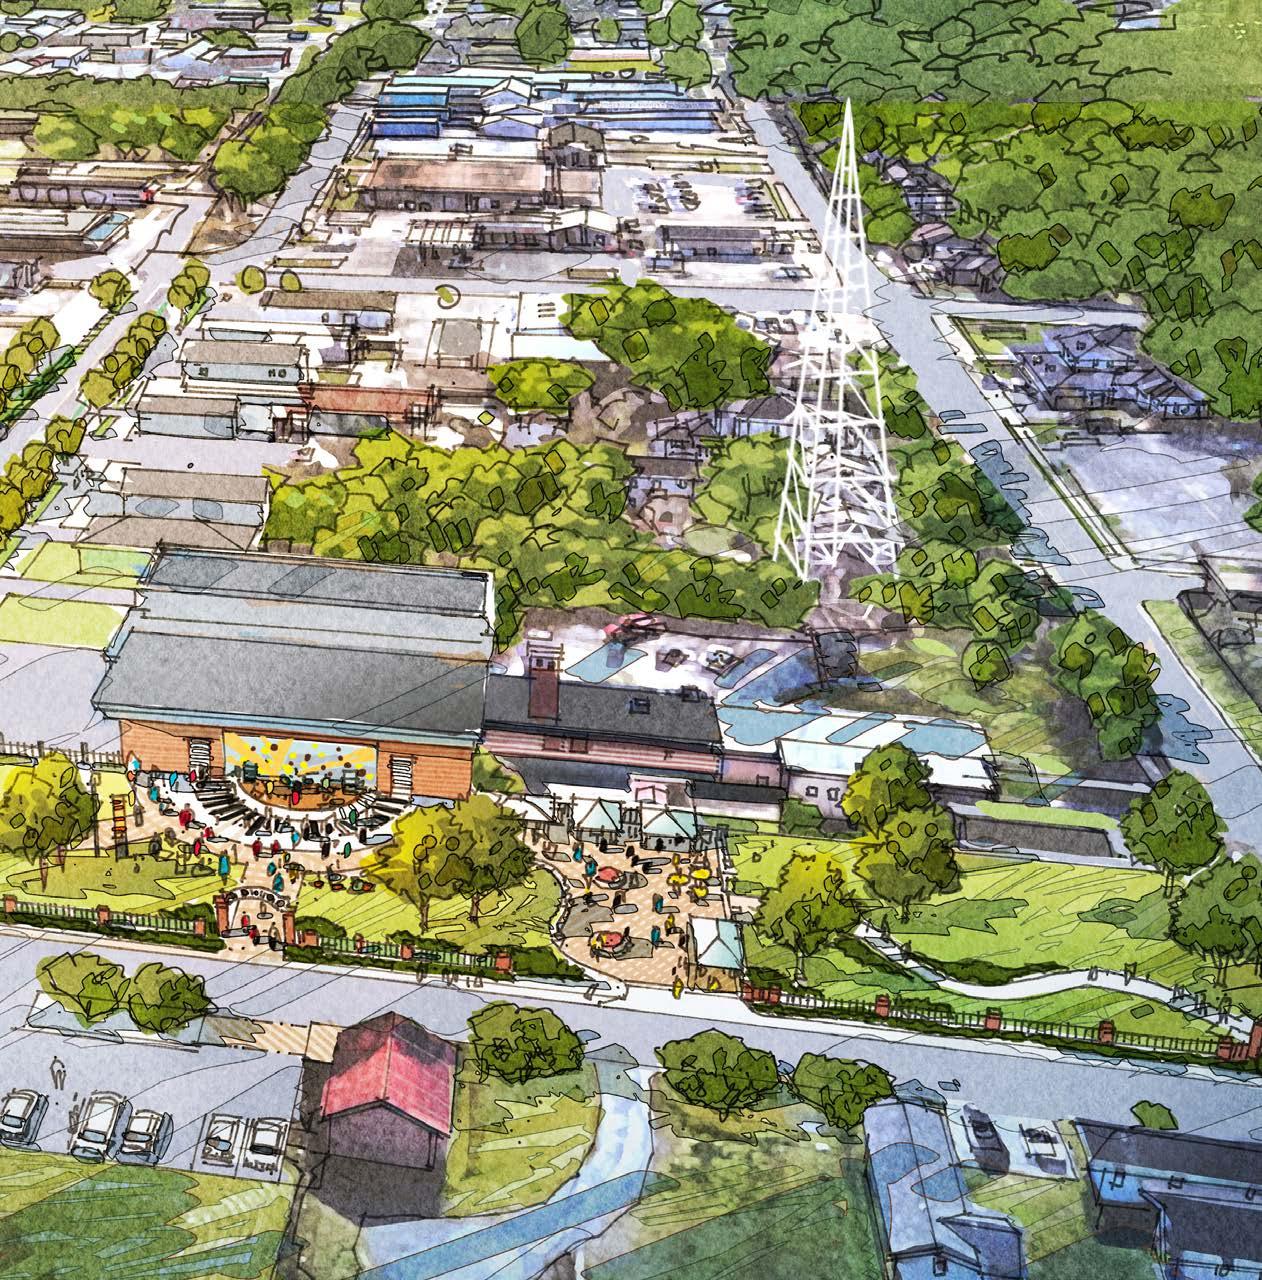
• Enterprise Boulevard can become a new destination district and gateway for economic development along the I-10 corridor.
• Enhancements would improve connections between Downtown, the lakefront, and North Lake Charles
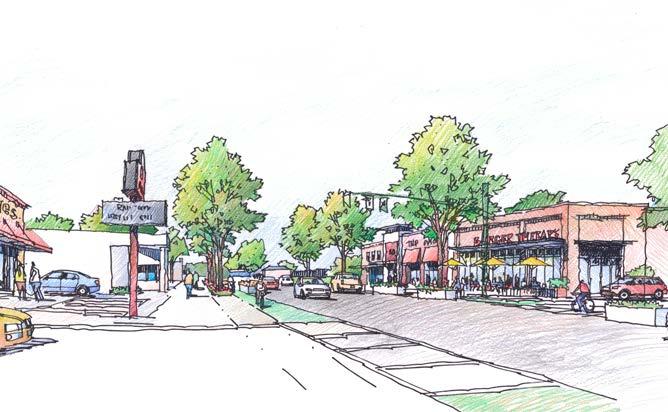
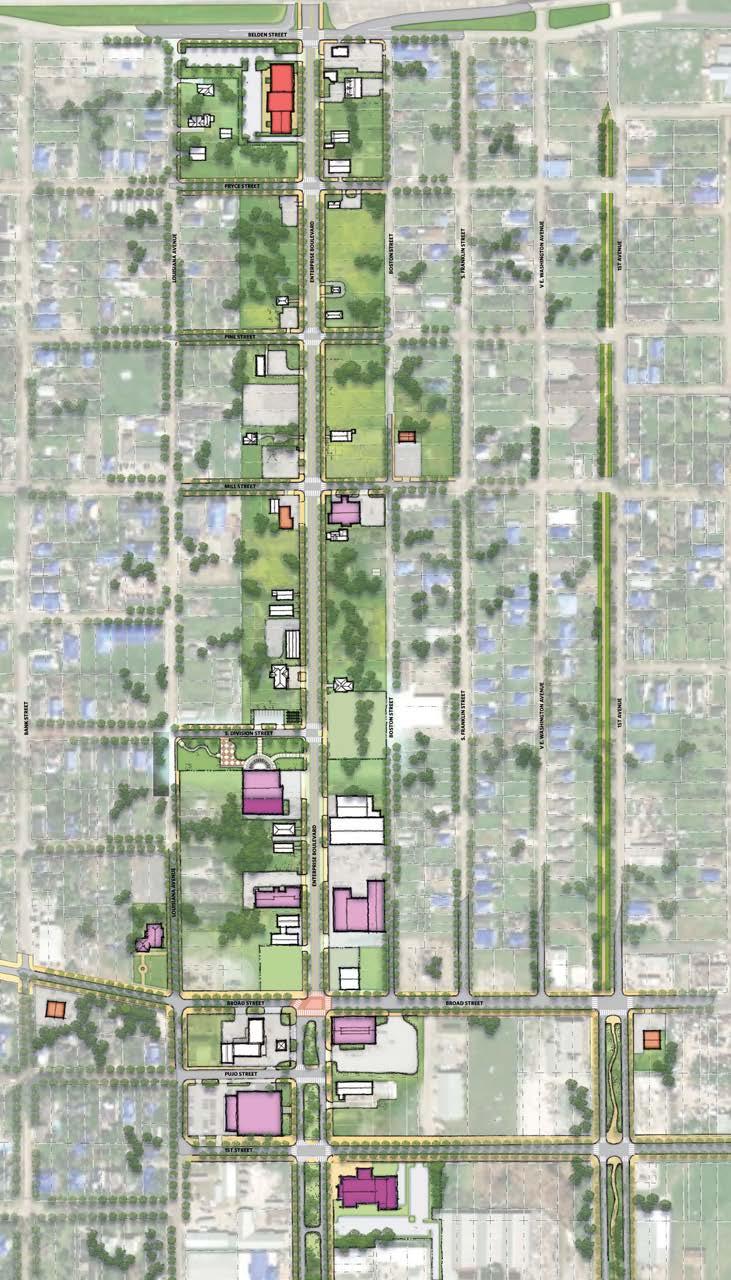
• Dining, entertainment, and cultural uses will attract people who are traveling along I-10 as well as local residents looking for a creative and vibrant district
• The district has a rich musical history, not only as the home of Nellie Lutcher, but as the location of Gold Band Records, the first studio where Dolly Parton recorded music.
It brings life to an area that needs a chance to revive.
We have a rich history that could and should be highlighted and embraced. Creating this district provides a home for that.Sonnier Sausauge &Boudin
The Nellie Lutcher Cultural District focuses on growth in Community Planning, Economic Development, Infrastructure, and Natural and Cultural Resources. A Nellie Lutcher Cultural District:
• Promotes walkability and bikeability by enhancing pedestrian infrastructure on Enterprise Boulevard Enterprise Boulevard is a primary street through the Nellie Lutcher District. Promoting walkability and bikeability on this key connection would help to better connect the district to other parts of the city, while making the district more enjoyable for art and cultural destinations, restaurants, businesses, and other visitor attractions.
• Stabilizes housing in adjacent neighborhoods
The neighborhoods east and west of the Nellie Lutcher Cultural District have housing stock that is important to the city, but needs investment. A coordinated strategy includes homeowner renovation grants and new construction infill housing.
• Supports growth of the creative industries through promotion and development of a vibrant, arts hub Creative industries are key to the future economic growth of SWLA. A cohesive district focused on arts and creative innovation is simpler to support while creating natural synergies between creatives.
• Attracts employers and businesses by increasing the number of restaurants and attractions in the area Development attracts more development. An increase in restaurants, entertainment, and the ability to walk and bike to those new entertainment options will attract additional employers and businesses.
• Promotes adaptive resuse of buildings to provide economic growth in close porximity to I-10 Current examples include the Cash & Carry Grocery which is now an event center and the former Dimmick Auto Parts that is now the regional training center of Acadian Ambulance. Economic development incentives by the City of Lake Charles make this area attractive for future development.
• Transforms Enterprise Boulevard and Broad Street The transformation of Enterprise Boulevard and Broad street help create a stronger pedestrian environment with wider sidewalks, pedestrian scaled street lighting, and on-street parking. Enterprise Boulevard would also see dedicated bike infrastructure.
• Improves drainage and stormwater infrastructure The new street infrastructure would also better manage stormwater, as would new development along the corridors.
• Celebrates the rich culture and history of the region and provides a central location for residents and tourists to gather around that history Art celebrates the history and culture of a region in the way that little else can. Supporting a cultural district with a focus on arts and entertainment can help celebrate the unique culture and history of the region.
I would visit a Nellie Lutcher District with food, gathering, and entertainment options.
I think this project will benefit SWLA.
of respondents said of respondents said of respondents said
NOT SURE
WHAT?
• Funky arts district with galleries, artist work/live spaces, brew pubs, restaurants, and shops
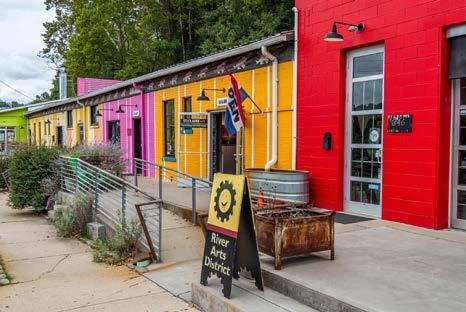
• Tourist destination
• Tied into trails and open space
HOW?
• Adaptive Reuse of Existing Industrial Building Stock
• Utilized federal funding and grants, hotel tax funds, and city contributions for improvements
• Constant activity enlivens the space with demonstrations, walking tours, live music, and workshops

The Nellie Lutcher Cultural District is a key gateway along the I-10 corridor. Visual cues could give travelers along the interstate a better understanding of what is available for them in Lake Charles and is a critical first impression.
The first step in defining the Nellie Lutcher Cultural District for the future is the transformation of Enterprise Boulevard and Broad Street. Emphasizing these streets as walkable corridors helps make the district more than just a place to pass through, but instead makes it a destination.
The transformation of these streets also helps connect the future of the district to what is already happening. Investments such as the Mardi Gras Museum and a community performing arts center theater will show support for and progress toward arts and culture within the district.
Highlighting those cultural icons and others such as the Clifton House help provide an anchor on which to hang the idea of additional investment from businesses, restaurants, and other creative industries.
Incentives must be provided to attract businesses and employers along the corridor, such as facade grants and other encouragement to renovate and expand existing buildings. Remaining parcels should be assembled and returned into productive use by a redevelopment entity or authority, focusing on RFPs, funding, or donation of the land that prioritizes arts and cultural forward uses.
Nellie Lutcher was an internationally known jazz and blues artist born in Lake Charles. Growing up, Nellie lived along Enterprise Boulevard (now named the “Nellie Lutcher Parkway”) and attended New Sunlight Baptist Church. The church is still in existence and located within the district on V.E. Washington Avenue.

Once upon a time this area was thriving...It can be and should be once again. Having a place where we can get cultural entertainment and dining and not have to leave Lake Charles is a great thing.
What’s already happening? MARDI GRAS MUSEUM
The EDA has granted $1.6 million in American Rescue Plan funds to build a new Mardi Gras Museum in the Nellie Lutcher District along Enterprise Boulevard. To maximize the economic impact and diversity of the project, the museum should include spaces for related small businesses that will increase the draw.
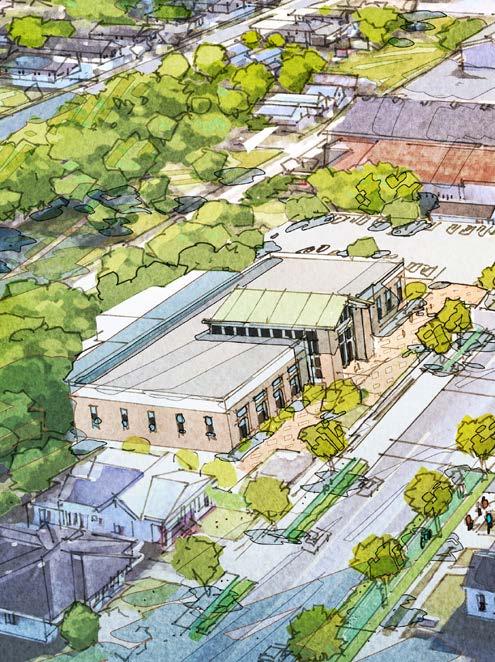
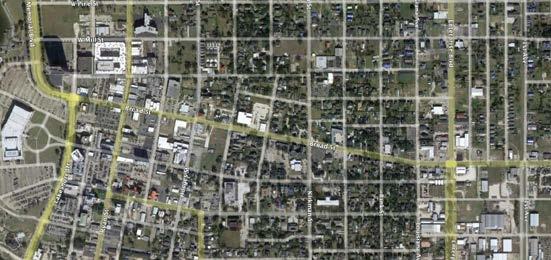
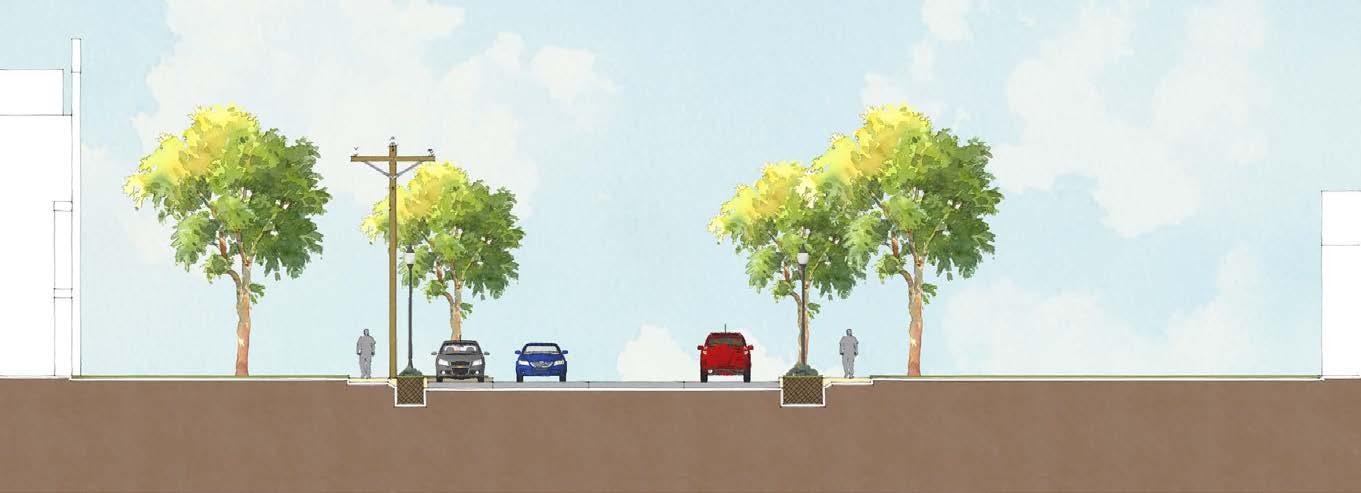
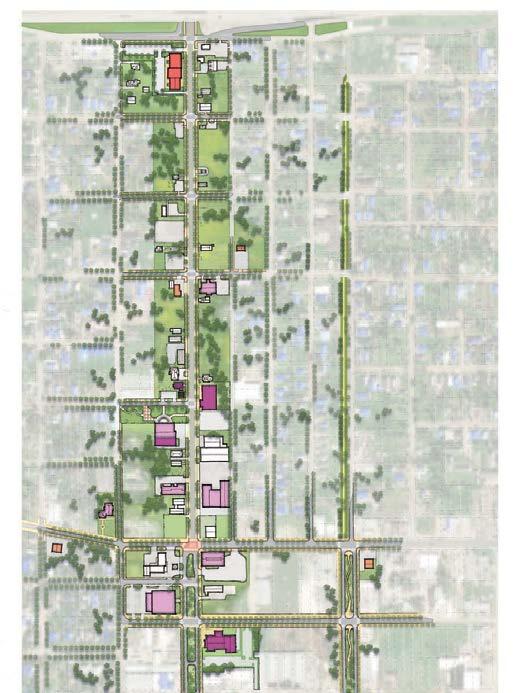
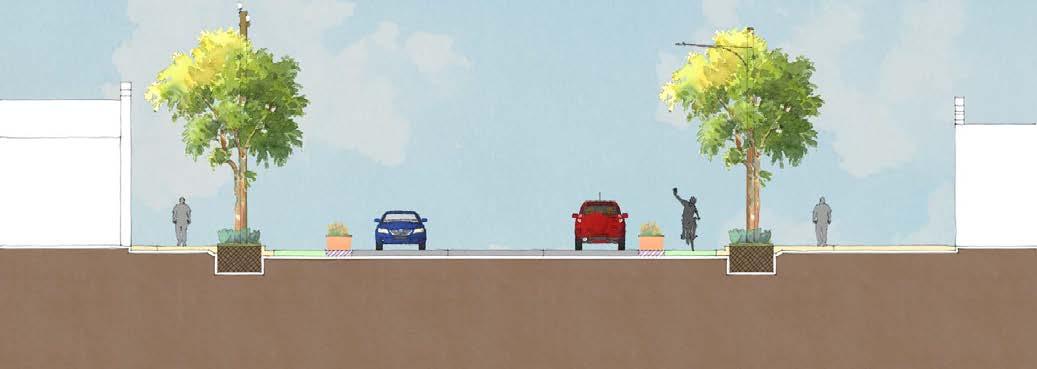
Enterprise Boulevard and Broad Street
1 Transform Enterprise Boulevard and Broad Street
Transformation of existing infrastructure is the most critical aspect of defining the cultural district. Focusing on key streets, Enterprise and Broad, allow for meaningful change along well used corridors focused on pedestrians and cyclists.
Culture on Enterprise Boulevard
2 Develop the new Mardi Gras Museum on Enterprise Boulevard/Nellie Lutcher Parkway
Planning for the new Mardi Gras Museum is already underway and implementation can continue while the infrastructure transformation gets started. Starting with an early, culture focused win allows the tone to be set for what new development can look like in the district.
3 Develop a community performing arts theater on Nellie Lutcher Parkway/ Enterprise Boulevard
Action Steps
1 Transform Enterprise Boulevard and Broad Street into streets that balance all modes of transportation, including cars, bikes, and pedestrians. Reduce these streets to one moving lane in each direction with a center turn lane, wider sidewalks, street trees, on-street parking, and possibly buffered bike lanes.
2 Develop the new Mardi Gras Museum on Enterprise Boulevard/Nellie Lutcher Parkway (to include a king cake bakery and small retail spaces)
3 Develop the new Louisiana Volunteers in Action performing and visual arts center on Nellie Lutcher Parkway/Enterprise Boulevard
4 Attract employers and new development along the Enterprise Boulevard corridor and in the Nellie Lutcher Cultural District
5 Work with public entities, like a redevelopment authority, to assemble and acquire parcels for the development of new restaurants and cultural destinations
6 Prioritize facade renovation grants for homes in the adjacent neighborhoods
7 Use the Resilient Housing Toolkit for SWLA to build infill housing in adjacent neighborhoods
The Nellie Lutcher District continues to grow and be an attractive view of Lake Charles from I-10
A community performing arts theater would create a shared amenity that would house multiple performance organizations. A community theater will require existing and new organizations to work together. Cultural and performing arts organizations should co-locate into the Nellie Lutcher District to leverage funding and to maximize visitors. The community theater should be planned in coordination with the Mardi Gras Museum to set the visual and cultural tone for the district.
4 Attract employers and new development along Enterprise Boulevard and in the District
Investment in new cultural and historic uses will help increase the attractiveness of the area to new investors, but other incentives such as facade grants for renovating existing properties, additional support for infill development, and other ideas should be explored, especially for arts and culture forward enterprises.
5 Work with public entities to assemble and acquire development parcels
While infill development and redevelopment of existing buildings should be encouraged, public entities should also work to acquire and assemble potential development parcels as additional incentive for redevelopment.
6 Prioritize facade renovation grants for homes in the adjacent neighborhoods
Much like facade improvement grants should be awarded to those looking to renovate commercial properties in the district, residential facade grants should also be given to those looking to renovate
residential properties in neighborhoods adjacent to the district. Additional housing will help support the businesses in the district and the wider city and region as a whole.
7 Use the Resilient Housing for SWLA to build infill housing in adjacent neighborhoods
New homes should be built in the most resilient way possible as the district continues to grow. New construction should utilize the Resilient Housing for SWLA when building and renovating property.
• City of Lake Charles
• Visit Lake Charles
• Calcasieu Parish (Natural & Cultural Resources RSF)
• Entrepreneurs and business owners
• Project Build-a-Future
• Churches and other non-profits interested in developing housing
• Private theater groups
• Mardi Gras Museum
What’s already happening?
The Nellie Lutcher Memorial Parkway Park is being built at the Central Fire Station at Enterprise Boulevard and South Division Street and will include a plaza, mural on the fire station wall, stage, and places to eat and gather
• McNeese SEED Center
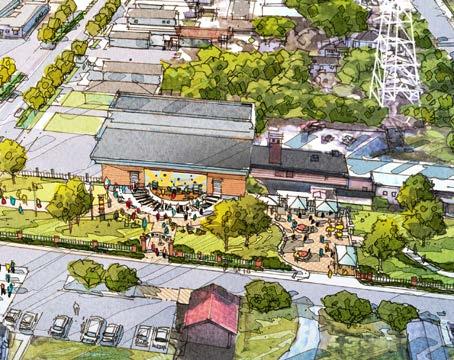
• State Capital Outlay (road budget)
• DOTD grants (state and federal)
• State Water and Sewer Commission (ARPA funds)
• Restore LA Small Business Loan and Grant Program
• CRT competitive grants
• North Lake Charles Economic Development District
• Restore LA — homeowner assistance
• CDBG and HOME
• LHC Weatherization program
• LHC Homeownership programs
• National Endowment for the Arts (NEA) Our Town (creative placemaking grants program)
• DOTD Safe Routes to Public Places grants
• First Horizon Foundation funding for arts and cultural districts
• EDA Public Works & Economic Assistance Program for broadband
• FEMA HMGP & Mitigation
• L Watershed Initiative
• IIJA grants for drainage, root protection, and pedestrian/bicycle-friendly infrastructure
• LA Office of Culture and Tourism SHPO
Historic Tax Credits
Attract employers and new development along the corridor
$150–$300 per linear foot of improved infrastructure
$3–5 million 1–3 years
Work with the entity designated to address vacant and underutilized property to assemble and acquire parcels for the development of new restaurants and cultural destinations
$15+ million 2–5 years
2–5
years
million (50 grants, up to $25,000 each)
years Use the Resilient Housing Toolkit to build
• State Capital Outlay budget for roads
• DOTD grants (state and federal)
• State Water and Sewer Commission (ARPA)
• Restore LA Small Business Loan and Grant Program
• CDBG-DR
• State Capital Outlay
• CRT competitive grants
• Restore LA recovery business grants
• NEA Our Town grants
• LA Office of Culture and Tourism grants
• Visit Lake Charles
• See Project 10
• Restore LA — Homeowner Assistance Program
• HUD CDBG and HOME funds
• LHC weatherization programs
• Restore LA — Affordable Homeownership programs
• LHC homeownership programs
Non-profits building affordable homeownership housing
Working with Better Block in Dallas, Texas, the Nellie Lutcher District was one of the first communities to try Block in a Box. Block in a Box includes elements to make a place more successful, including places for people to sit, string lights, shade, and places to play. The Block in a Box is a shipping container that allows easy delivery and unloading for events. Once the event is finished, the shipping container can be repacked and the elements shipped to the next community.
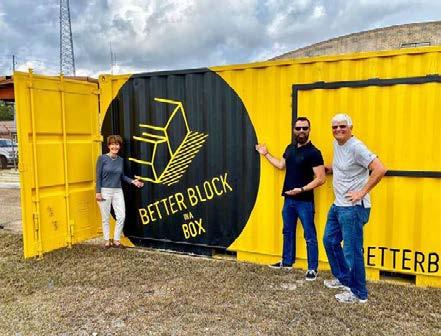
Volunteers from the community came together to set up the Block in a Box which gave an interactive view of what an outdoor venue could look and feel like.

5
McNeese is a valuable asset for both parishes — its students, faculty, programs, and campus investment anchor the region.
McNeese State University is a valuable anchor for SWLA. The Contraband Bayou project under construction will enhance resilience and provide access to the water as the first phase of the Bayou Greenbelt. The LNG Center of Excellence, retail center renovations, new student housing, and a road diet for Common Street would have economic development benefits while enlivening the edges of the campus. A Resilience District would tie multiple projects together and target available funding.
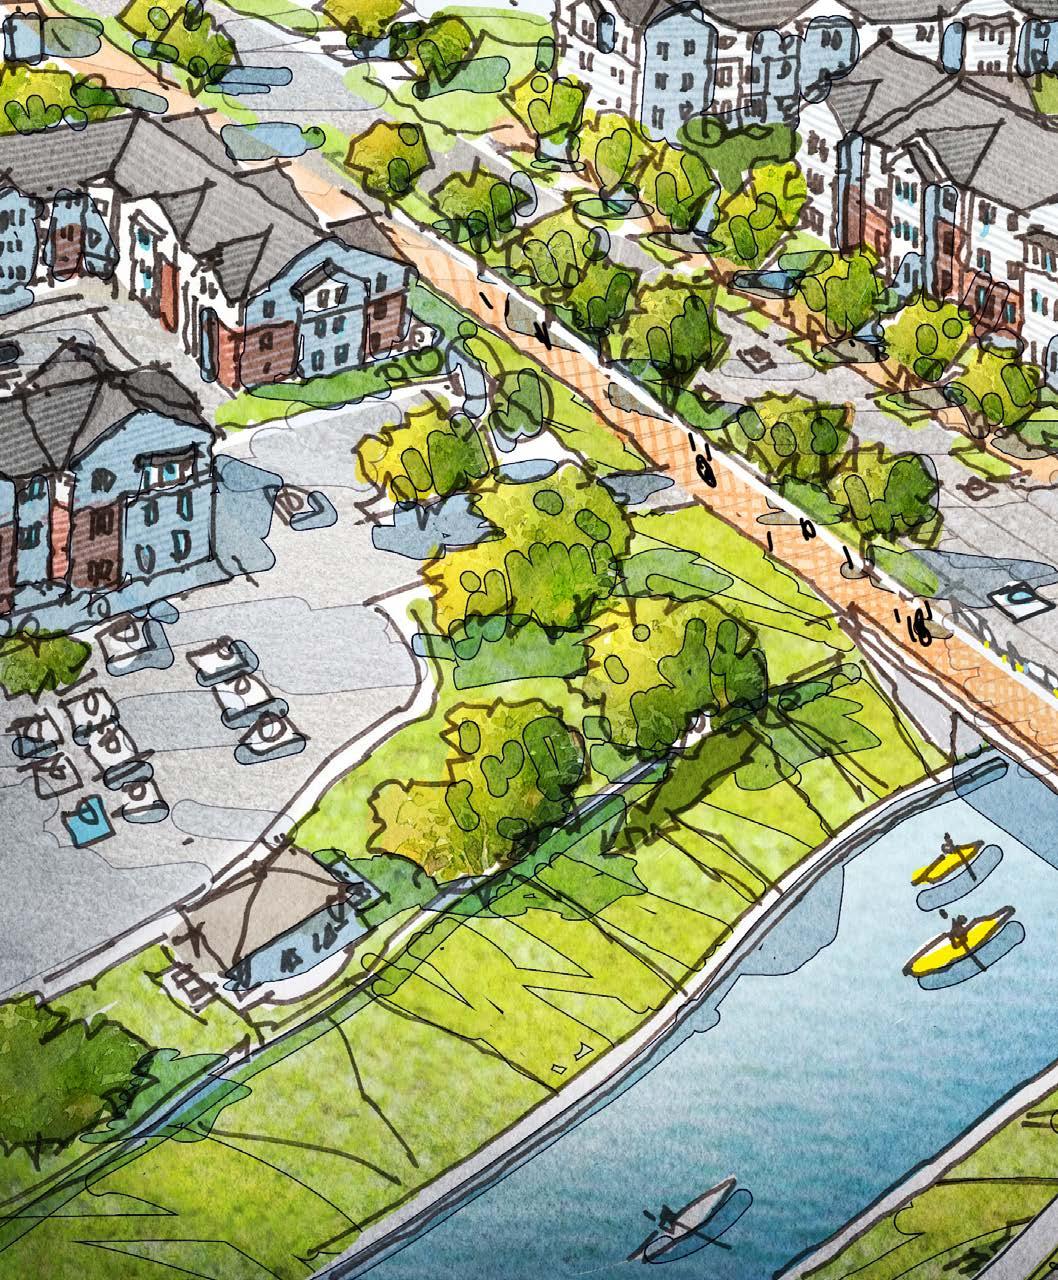
HIGH priority
2-10 years
TBD million
McNeese is a regional anchor institution, with potential to grow its presence and retain students for the local job market after they graduate. McNeese State University’s Contraband Bayou project will be one of the first phases of the Bayou Greenbelt project, which will catalyze opportunities and set precedent for accessing waterways across both parishes.
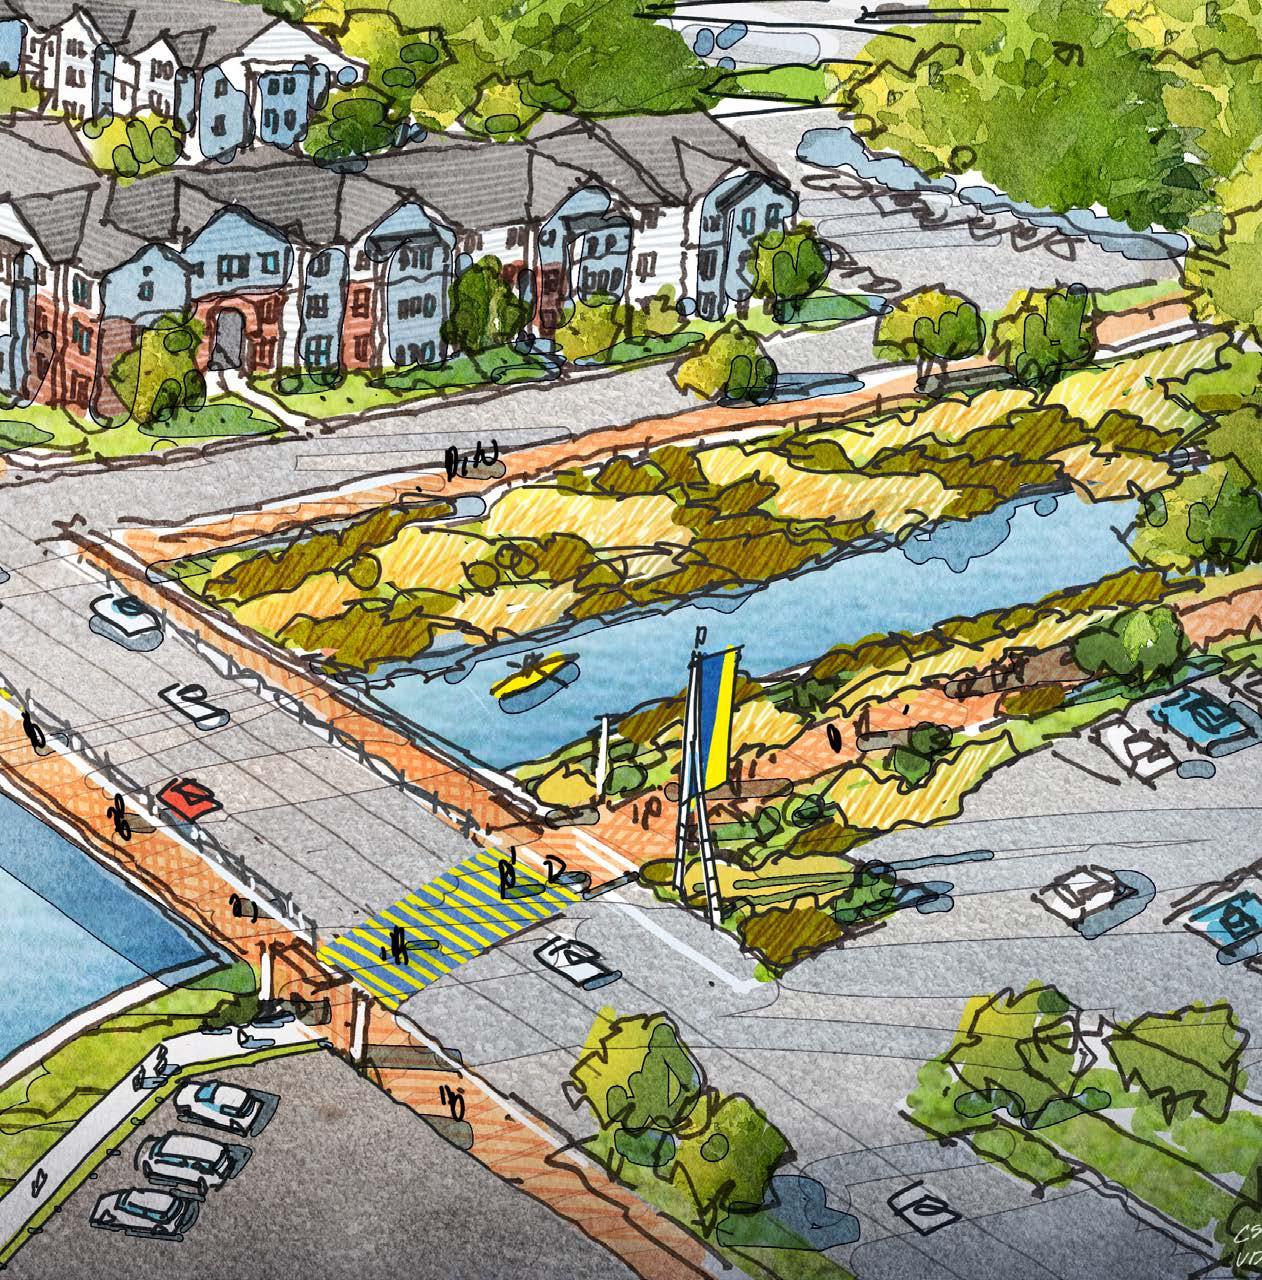
The new LNG Center of Excellence will provide opportunities for both McNeese students and LNG employees to operate process equipment in a safe, controlled environment. The LNG facilities in Cameron Parish and their employees will be a direct beneficiary of this investment.

As an alumna of McNeese I like that this focuses on improving the campus and making the campus feel like a more distinguishing factor of the community.
The McNeese Area Resilience District focuses on growth in Community Planning, Housing, Economic Development, Infrastructure, and Natural and Cultural Resources. A McNeese Area Resilience District would:
• Improve pedestrian safety and enhance walkability, especially at the edges of campus. Today, Ryan Street, Common Street, and E McNeese Street are not pedestrian friendly and make McNeese isolated from people living in the adjacent neighborhoods. Providing safer and friendlier pedestrian paths around the edges of campus will activate business and support a greater connection between McNeese and the surrounding community.
• Provide a safe walking path and crossing from the main campus to the athletic campus. Expanding Bayou Greenbelt to the east along Contraband Bayou from main campus behind the University Animal Clinic will provide additional, safe access for students, staff, and visitors across E McNeese Street to the athletic complex and university stadiums, while avoiding the intersection at E McNeese and Common streets.
• Create better connectivity for existing and future student housing.
• Elevate the visibility of McNeese within the region by exploring a presence in Downtown Lake Charles or along I-10. A satelite campus for McNeese, either Downtown Lake Charles or along the I-10 corridor, would increase student retention, enhance engagement, and strengthen relationships among Downtown businesses and the labor pipeline.
• Capitalize on world class investments and partnership with industry, such as the LNG Center of Excellence. The new LNG Center of Excellence will serve industry employees in both Cameron and Calcasieu parishes with training opportunities, controlled environments for new equipment, and networking with industry outside of Southwest Louisiana.
• Decrease flood risk for surrounding middle neighborhoods through green infrastructure. Green infrastructure practices, such as rain gardens, porous pavement, and underground storage cells can contribute to stormwater management, while improving the aesthetics and feel of the street corridors.
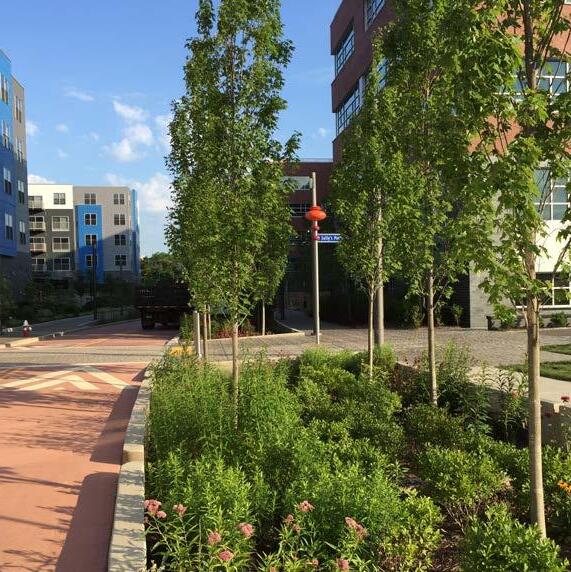
• Bundle various resilience and infrastructure projects together to target funding and increase community strength. Leverage recent hardening of utilities with future street and community development projects, such as Ryan Street and McNeese Street through LADOTD.
• Implement the first phase of Bayou Greenbelt on Contraband Bayou, and propose a new kayak and boat launch/trailhead. On the southern edge of McNeese’s campus, improvements to the Contraband Bayou will serve as the first phase of Bayou Greenbelt. This will provide university students, faculty, and residents of the surrounding neighborhood access to the water and future opportunities for a kayak and boat launch with a trailhead that would connect into the greater Bayou Greenbelt system.
• Expand Bayou Greenbelt to the east along Contraband Bayou, improving access to the water and walking paths.
A Resilience District bundles various resilience projects together to target potential funding sources, improve quality of life, and foster community strength. Potential funding sources for resilience districts can be at the federal and state level, including Building Resilient Infrastructure and Communities (BRIC) federal funding and the LA Restore Programs for Resilient Communities Infrastructure and Hometown Revitalization. The key to implementing the McNeese Area Resilience District is a combination of land development controls and funding for infrastructure projects.
1 Designate a Funding District
Establishing a special funding district will allow the City of Lake Charles and the University to combine funding sources, including green infrastructure grants, transportation funding, and tax increment funding (TIF). Similar to the Chennault/SOWELA Resilience District, the McNeese Area Resilience District can use a TIF district to fund infrastructure improvements that promote
Action Steps
1 Designate a funding district for the McNeese area
2 Complete the construction of Phase 1 of McNeese’s Contraband Bayou project, which will be one of the first portions of the Bayou Greenbelt loop
3 Design and construct Phases 2 and 3 of McNeese’s Contraband Bayou project, including a kayak launch and extended trails
4 Extend the Bayou Greenbelt to the east, with a pathway along the southern side of Contraband Bayou, from Common Street to Kirkman Street, and across E McNeese Street to safely connect to the athletic complex and parking lots
5 Perform a traffic study on Common Street
6 Transform Common Street into a pedestrian-friendly street that is easier to cross and encourages active uses
7 Establish a presence for McNeese State University in Downtown Lake Charles or along the I-10 corridor
sustainability and walkability. The district should be eligible for EPA grants that support green infrastructure, smart growth, and brownfield redevelopment. DOTD, the Louisiana Technical Assistance Program (LTAP), CDC, and other agencies have funding programs for complete streets that can help implement the district’s vision.
Extension
2 Complete Construction of Phase 1 of McNeese’s Contraband Bayou Project
Phase 1 of McNeese’s Contraband Bayou Project is currently under construction and is located on the southeastern corner of the main campus near E McNeese and Common streets. The project includes: cleaning up the bayou of any debris, building a pedestrian bridge, and enhancing the edges of the bayou so that it provides a beautiful front
door to the university and the student housing that border it on either side. Upon its completion, there will also be a kayak and boat launch with kayak rental for waterway access.
3 Design and Construct Phases 2 and 3 of McNeese’s Contraband Bayou Project Phases 2 and 3 of the Contraband Bayou Project will extend west to Ryan Street and south to E McNeese Street. Improvements will include: further debris removal and clean-up, the construction of an additional pedestrian bridge, upgraded landscaping and beautification, and waterside gathering space for students, faculty, and visitors to the university.
4 Extend Bayou Greenbelt to the East along Contraband Bayou from Common Street to Kirkman Street
As a continuation of the work being done on McNeese’s campus, Bayou Greenbelt can extend
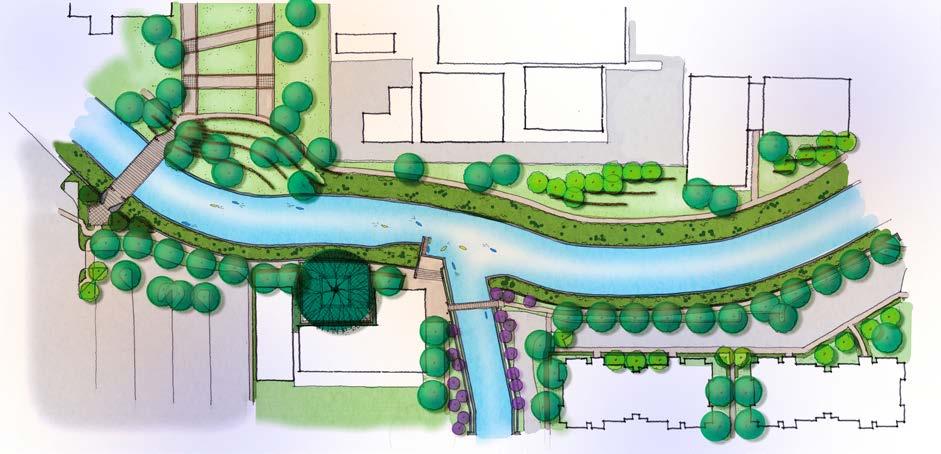
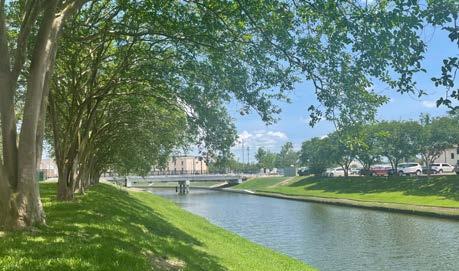
What’s already happening?
A community-led project for long-term recovery, Bayou Greenbelt seeks to improve the quality of life in Calcasieu Parish while promoting flood mitigation. The first phase of Bayou Greenbelt are the improvements to Contraband Bayou, located on the southern edge of McNeese State University. The Just Imagine SWLA Resilience Master Plan builds on this work through proposed extensions of Bayou Greenbelt to the east of McNeese’s campus along the Contraband Bayou. As Bayou Greenbelt grows throughout the region, McNeese will be anchored to blue and green trails across Lake Charles and will benefit from the long-term, positive economic impact of this investment in infrastructure and access to nature.
east along Contraband Bayou and then south to E McNeese Street. A partnership with the University Animal Clinic and other businesses just east of the university would make waterway access continuous off campus, and would also open up the opportunity for a boardwalk trail along the southern edge of the bayou.
What’s already happening?
Several projects are currently taking place in and around McNeese’s campus, which serve as anchors for the McNeese Area Resilience District. Those projects include:
ON-CAMPUS
• Contraband Bayou Phases 1–3
• New Farrar Hall, Police Building, Student Union, and student housing
• Renovation of existing facility for new bookstore
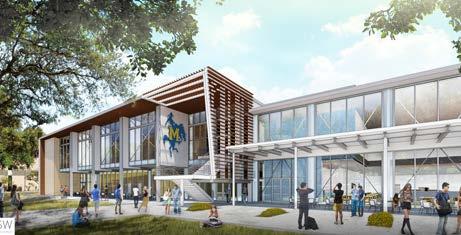
OFF-CAMPUS
• Student housing on east side of Common Street
• McNeese Autism Program at the former police station
• KMart Shopping Center Redevelopment
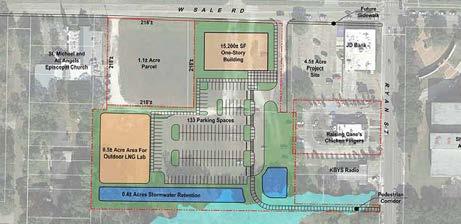
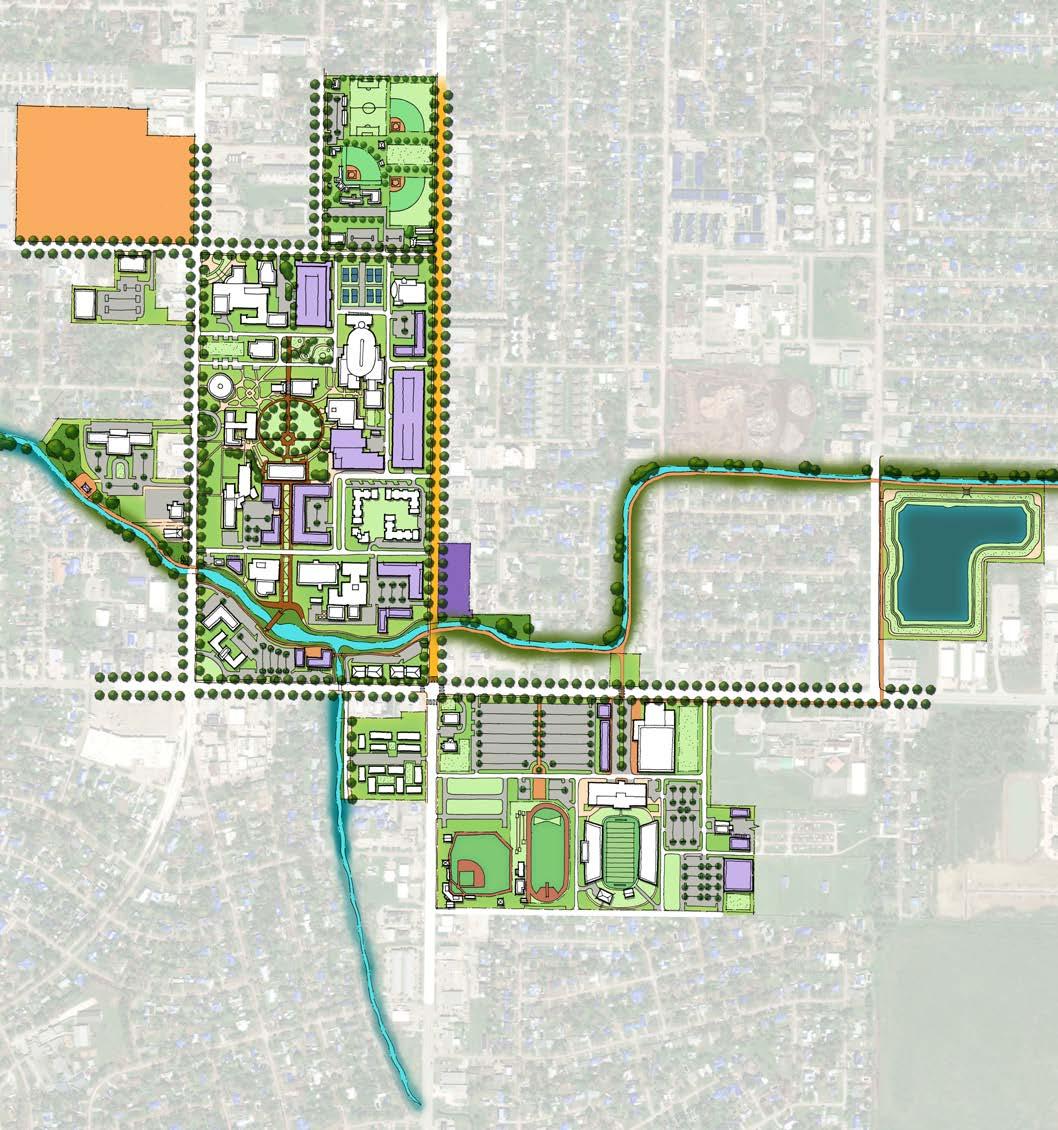
• New LNG Center of Excellence
• Construction of the Louisiana Avenue Detention Pond
Concept Plan for LNG Center of Excellence
This would give our students more things on campus to get involved in plus open up jobs.
Common Street is located on the eastern side of McNeese State’s main campus. Although a major thoroughfare for the City of Lake Charles, Common Street is vastly oversized and creates a huge barrier between the university and the neighborhoods to the east.
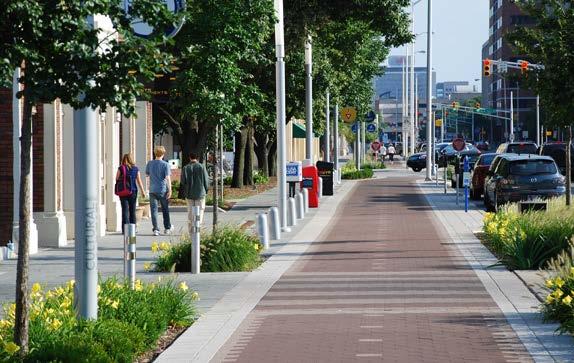
Common Street is currently a four-lane roadway that experiences a moderate amount of traffic annually. It is potentially underutilized due to its lack of direct interstate access and low-traffic generating development along the eastern side of the corridor. Due to the highly residential land
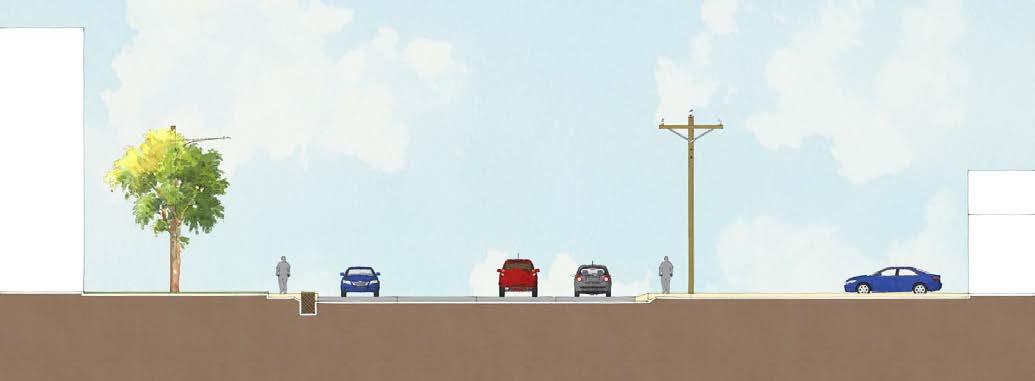
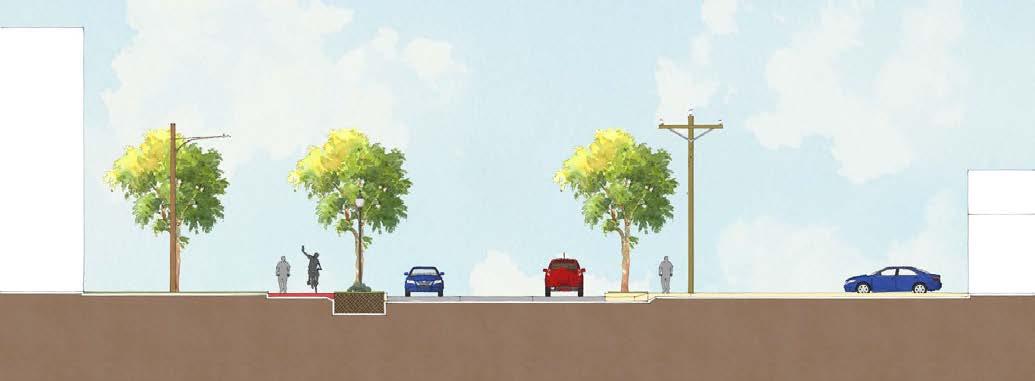
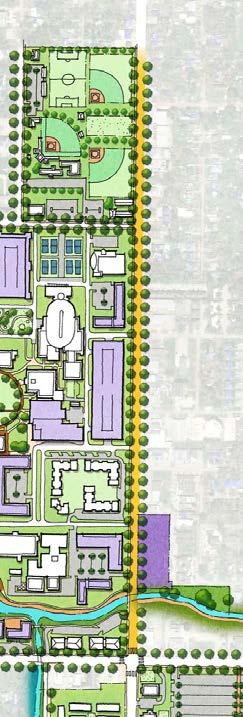
use on the east side of this road and the McNeese State campus to the west, we recommend that this corridor be studied between East Sale Road and McNeese Street to determine if the existing infrastructure provides more lanes than is truly needed in this area.
North of East Sale Road, a road diet treatment has already been implemented on Common Street. The existing road has been restriped to be one lane in each direction and a center turn lane is provided to accommodate access to the commercial development that fronts this roadway. This configuration could potentially be carried all the way to the McNeese Street intersection as well, creating opportunities to make access to and from campus more walkable and bikeable, while also providing a more community-friendly environment for the surrounding neighborhoods. Traffic calming and access management strategies could be implemented to better influence lower operating speeds, and wider sidewalks and/or trails could be implemented for all modes of transportation.
• City of New Orleans Gentilly Resilience District (GRD)
• A resilience district bundles various resilience projects together to target funding to improve quality of life and community strength
• GRD received a $141 million HUD National Disaster Grant to enhance resilience throughout Gentilly
• The GRD addresses social and environmental equity within a low middle income (LMI) community
McNeese State University is an important asset to the region. Its growth and prosperity anchors the region’s higher education identity and provides deep connections to the local job market. The continuation of this growth and prosperity is imperative both for the university’s success and drawing regional interest.
07 Establish a Presence for McNeese State University in Downtown Lake Charles or Along the I-10 Corridor
Currently, there is a disconnection between Downtown Lake Charles and McNeese State University. In the short-term, this gap could be resolved through providing a shuttle service that would take students and faculty between McNeese and Downtown Lake Charles. The increased presence of college students and faculty members in Downtown Lake Charles would result in the stimulation of Downtown activity, residential, retail, and entertainment. In addition, Port Wonder is offering a gallery space for McNeese students and faculty.
In the long-term, a Downtown or I-10 satellite campus for McNeese would greatly increase its visibility and standing as a regional institution. Partnerships between the university, the City of Lake Charles, Calcasieu Parish, and others should take place to establish what the right programs and opportunities are for promoting the growth both at McNeese and for the region.
Potential Partners
• City of Lake Charles
• McNeese State University
• Calcasieu Parish
• Community Foundation SWLA
• National Park Service
• LNG Center for Excellence
Potential Funding Sources
• McNeese Recovery Funds
• State Capital Outlay (road budget)
• State and Federal DOTD grants
• Restore LA funding
• Philanthropy
• CDBG Mitigation Funds (CDBG-MIT)
• FEMA Building Resilient Infrastructure and Communities (BRIC) grant program
• LA Watershed Initiative
• LA Office of Culture, Recreation, and Tourism CARES Act funding for quality of life open space improvements in low- and moderate income communities
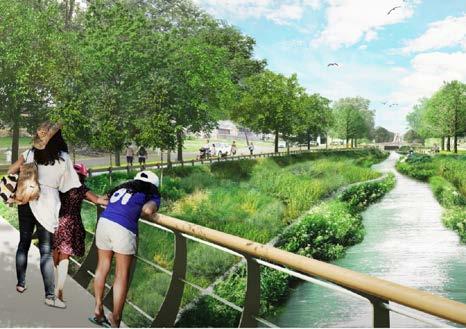
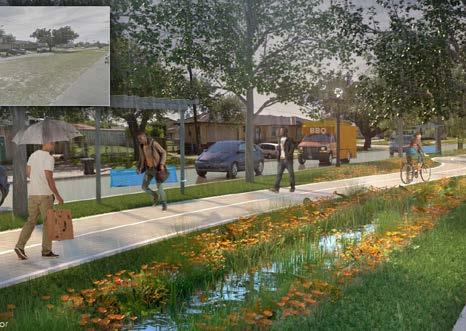
A Good Example HAGAN-LAFITTE
• Optimized drainage system with mix of grey and green infrastructure
• Strategic storage provided maximum flood reductions
• Reduced heat island, improved pedestrian safety, and beautifies the neighborhood
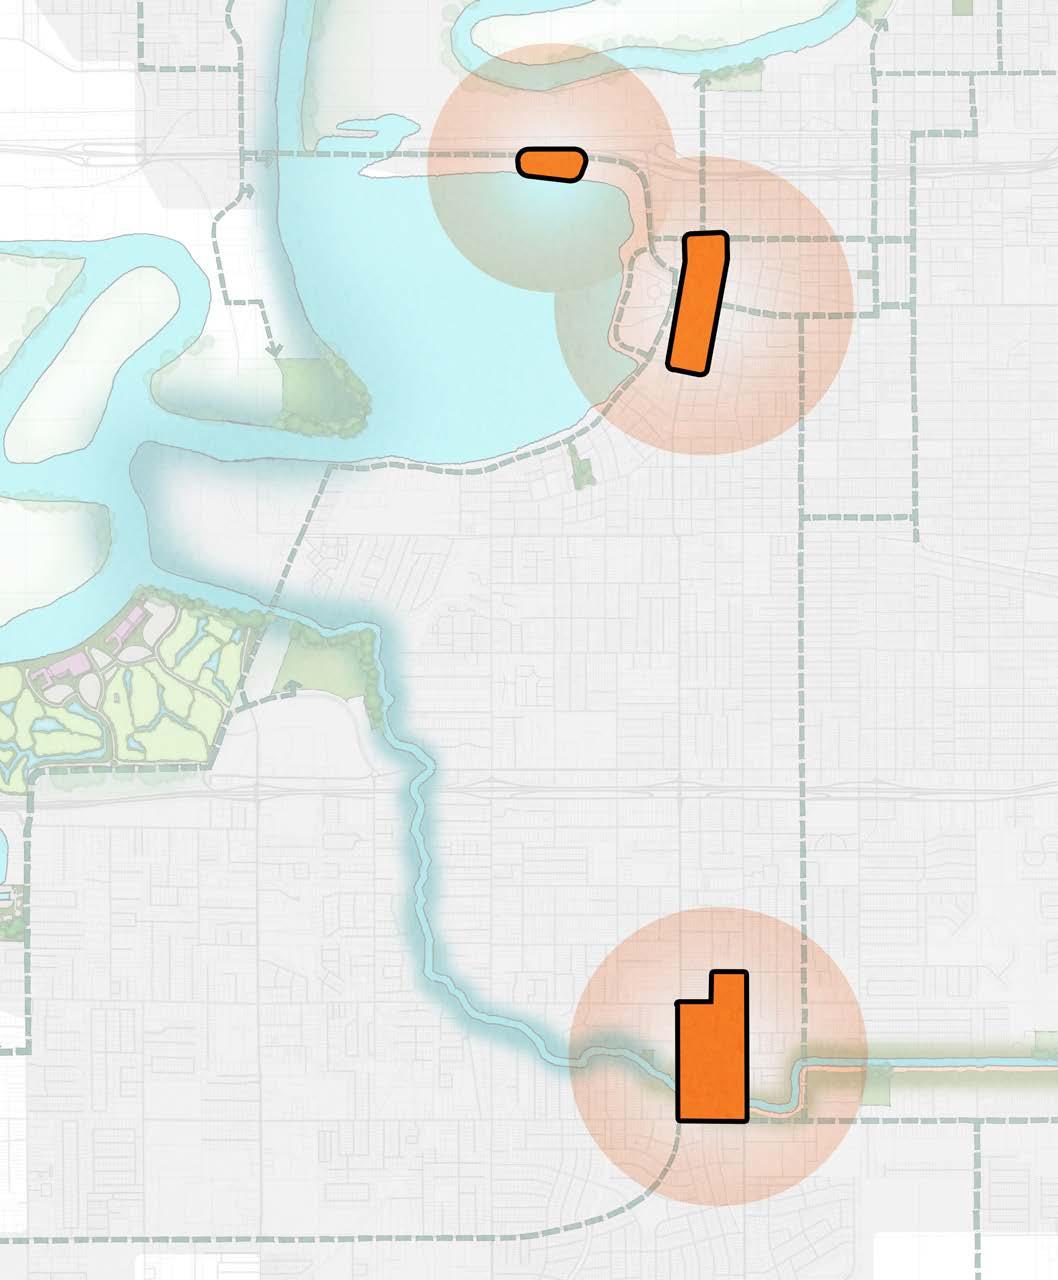
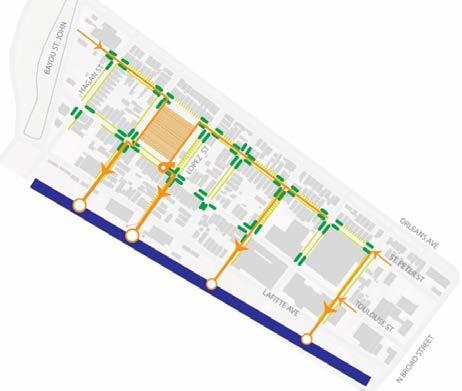
A completely optimized stormwater system — rain gardens, pervious sidewalks and parking, detention chambers, and a drainage collection system
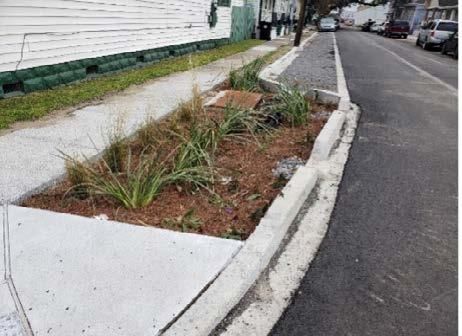
SWLA badly needs McNeese and SOWELA to keep young people here post-high school graduation and draw new residents to the areaDowntown Lake Charles McNeese State University Ryan Street
McNeese State University plays a critical role in attracting new businesses, expanding higher education opportunities, and increasing the region’s population through its offerings and partnerships within the community. When projecting for longrun growth and diversification of the economy, concrete priorities include:
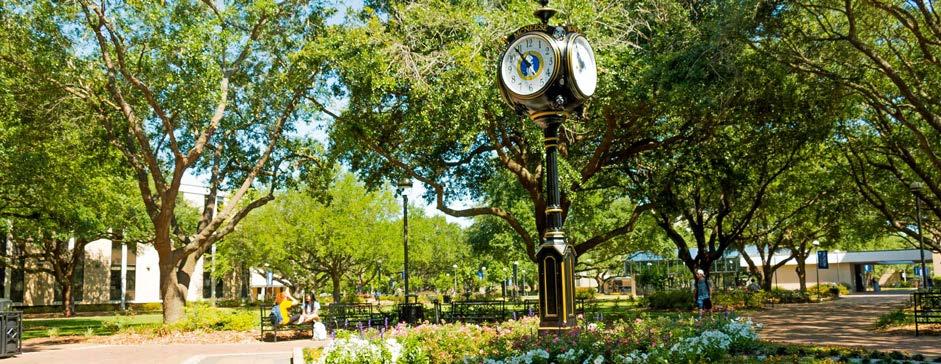
• Aligning programs, training, and opportunities with the highest potential job growth markets
– Right now, preliminary gap analyses reveal that post-secondary degrees for business, education, health, and personal/culinary services have the biggest gap when understanding those with degrees versus the jobs that need fulfilled
• Exploring opportunities in the technological sphere that would connect to the region’s industrial foothold
• Increasing awareness and workforce development training related to entrepreneurship, small business development, and technology
It makes us understand the importance of having McNeese here, while also taking action to become more resilient
Designate a funding district that bundles multiple projects together to target available funding
Rebuild Common Street to make it more pedestrian friendly and safer for students to cross
per linear foot of infrastructure
• DOTD grants at state and federal levels
Plan for the expansion of Bayou Greenbelt, building on the McNeese-led project — first piece heading to the east (new walkway and waterway improvements)
million for the expansion of the Contraband Bayou project
• LA Watershed Initiative capital funding
• LA Office of Culture, Recreation, and Tourism CARES Act funding
• Bayou Greenbelt Fund (SWLA)
Greenbelt Fund (Community Foundation SWLA)
of Lake Charles
a presence for McNeese in Downtown
Charles or along the I-10 corridor
Chennault and SOWELA are key institutions for both parishes and each have planned investments that will elevate the region
Chennault International Airport and SOWELA Technical Community College are located adjacent to each other on the eastern edge of Lake Charles. SOWELA is a regional educational anchor, providing degrees, programs, and certificates in a wide variety of career and occupational areas. The new culinary, gaming, and hospitality building (currently under construction on campus), trains students to enter some of the fastest growing sectors in southwest Louisiana. SOWELA’s student population continues to grow, prompting them to consider future needs and expansion. Chennault is a regional and beyond hub of aerospace activity, located close to the
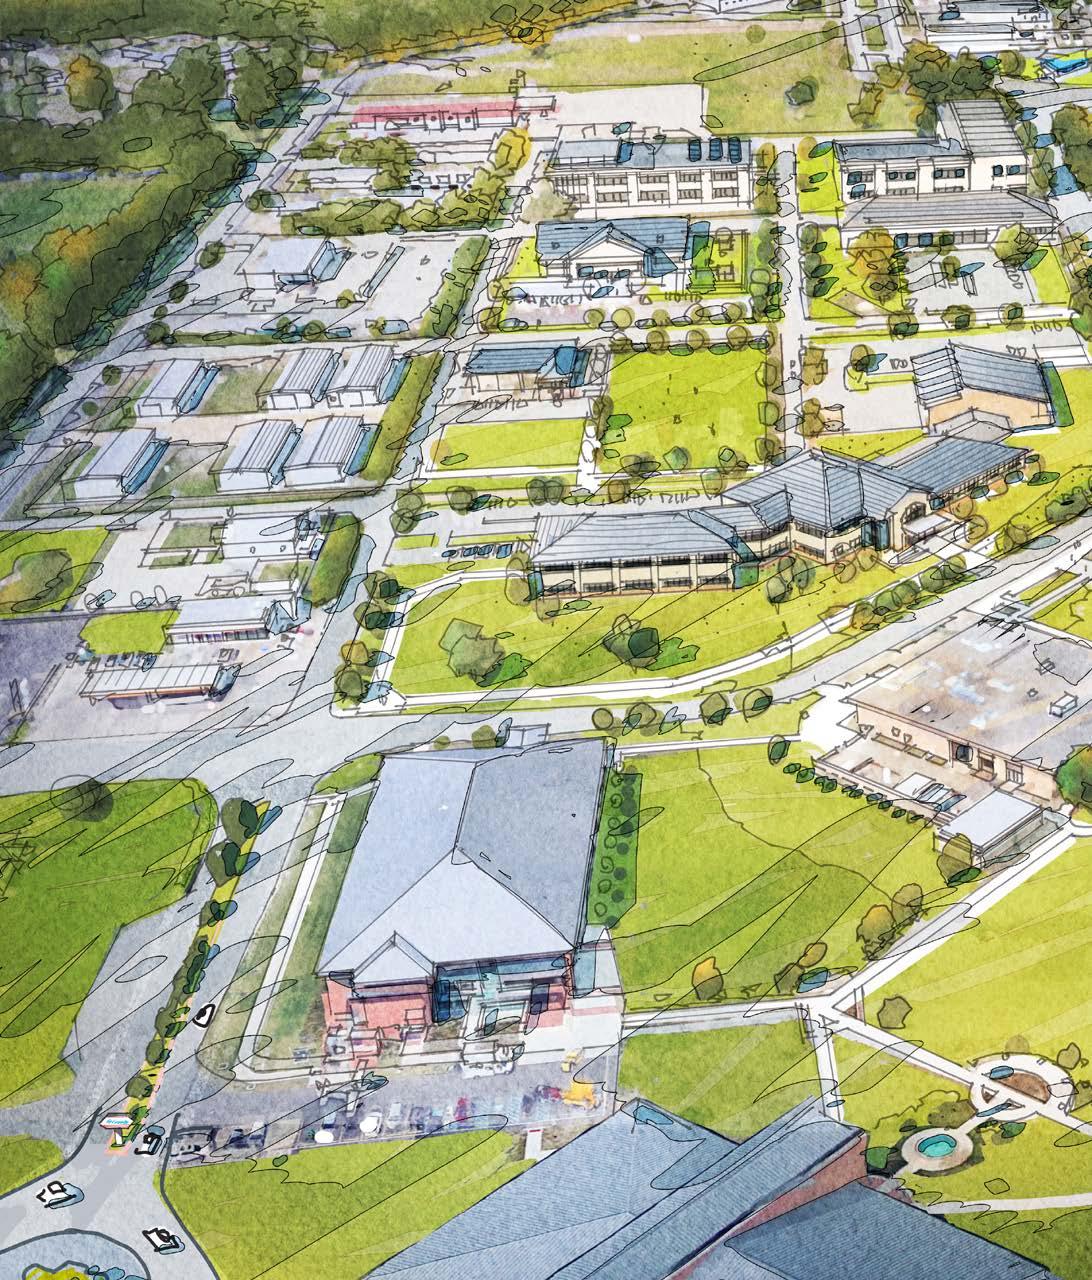
HIGH priority 1-10 years
$75 Million+
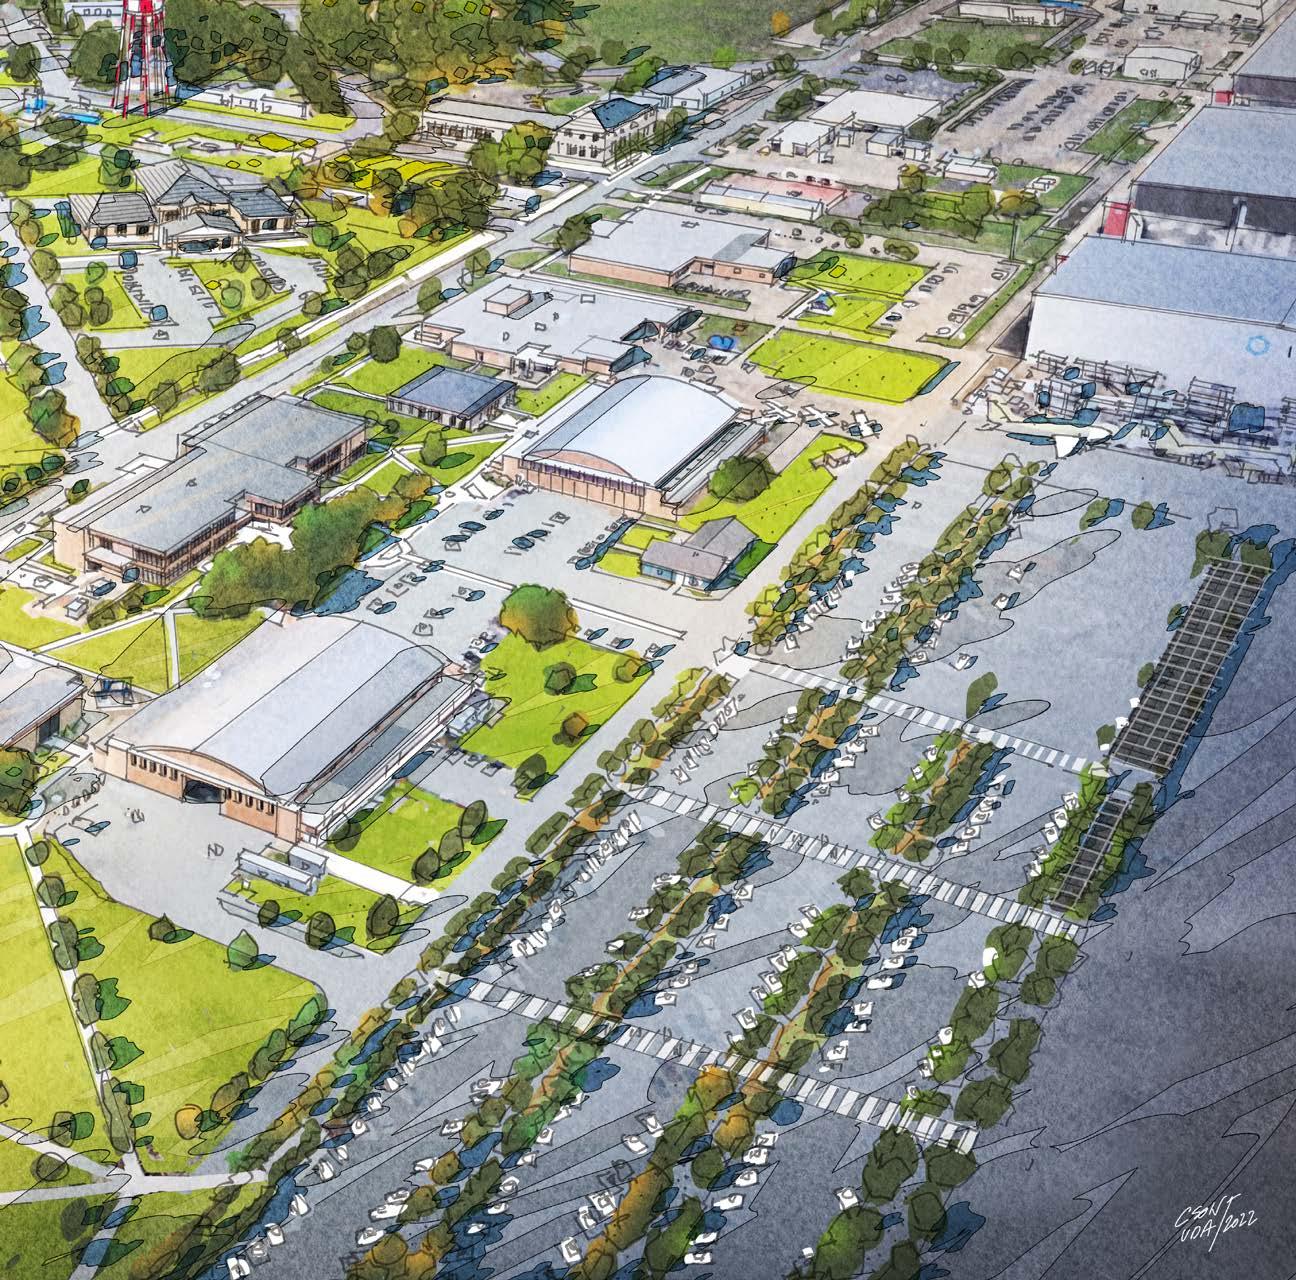
Chennault has national impact, including one of the longest runways on the Gulf Coast, and notable clients that support multiple international level aerospace companies who offer well paying jobs. Its continued growth would not only provide more jobs, but jumpstart development and investment in the area. SOWELA continues to grow in enrollment and offer more programs and transferable credits to students, enhancing options for graduates in high skill, high wage, and high demand sectors that directly impact Calcasieu, including hospitality and culinary arts.
SOWELA provides educational credentials that allow graduates to be directly employable in the industries in Cameron Parish, including technology, design, maintenance, and repair. Chennault provides jobs with clients with regional, national, and international impact for residents of Cameron Parish.
I-10 corridor. Chennault has the longest runways between Houston and Cape Canaveral, FL, which can service a large variety of aircraft. Industrial operations on site are ideal for multi-faceted tenants. Chennault has 900 acres of development sites and is poised for future growth, but lacks sufficient infrastructure to maximize potential developer interest.
The Port of Lake Charles owns over 300 acres of land and the rail that extends to Cameron Parish. There is an interest from the port in coordinating with Chennault and SOWELA on future development.
A Chennault and SOWELA Resilience District would focus on supporting long-term growth by designating a specific funding district to allocate funds, while prioritizing infrastructure improvements.
Why is this important?
• Chennault requires sewer, water, and road upgrades to make 14 additional sites, approximately 900+ acres, developable and more attractive to potential users.
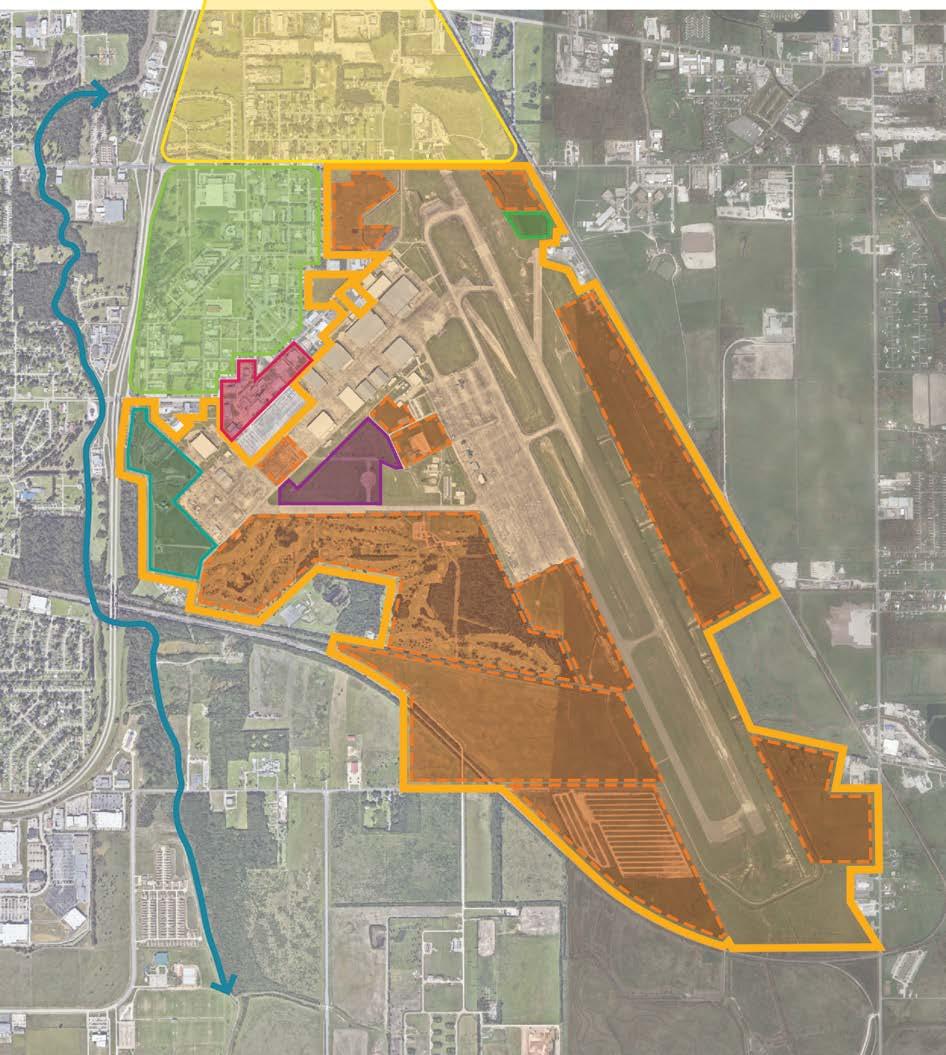
• SOWELA has planned investments, such as enhancing parking lots, building new educational buildings, and bringing more jobs to Chennault — tying these together into a district will create a cohesive place.
• There are limited places to eat, gather and interact for the daytime population. On a daily basis, this area sees approximately 5000 employees, students, and faculty.
• Partnering together will create more workforce development opportunities and jobs.
The Chennault and SOWELA Resilience District focuses on growth in Community Planning, Economic Development, and Infrastructure. The district:
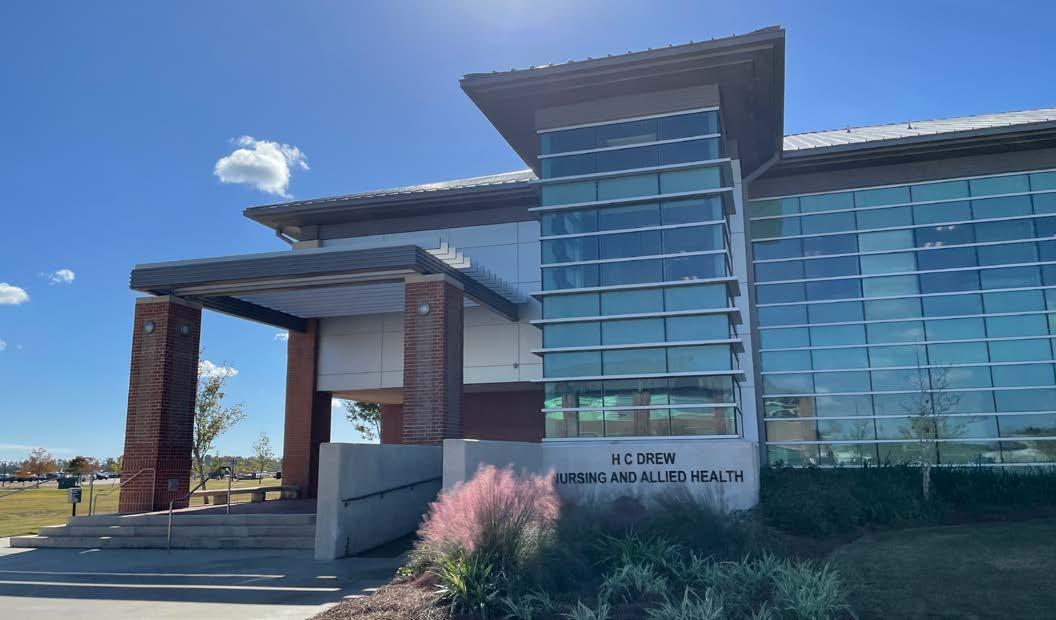
• Considers the needs of SOWELA as it grows north of Legion Street, focusing on an engaging and walkable campus. The area north of Legion Street is a mix of uses and vacant property with mixed ownership. SOWELA has already begun to grow, and care should be taken to focus on pedestrian connections for students in the area. SOWELA should consider partnerships to grow strategically to meet student and community members needs .
• Creates a gateway to Chennault by developing underutilized land. Focusing on a gateway to Chennault will help define the neighborhood anchor. Signage, landscape, and infrastructure improvements, including a proposed traffic circle, would give the area its missing front door.
• Makes Chennault’s development sites fully usable to attract large employers and jobs to the region. Chennault currently has seven+ successful tenants and 14 development sites for future growth identified, however, all 14 sites require significant infrastructure improvements to be viable. An additional companies
of similar caliber to the existing tenants at Chennault would bring many jobs to the region and could provide other opportunities.
• Focuses on additional amenities and needs for SOWELA such as childcare, parking, and enhanced campus life, to continue to grow the school’s workforce and training offerings. SOWELA has identified several needs for its student population, including childcare, parking, additional educational facilities, and enhanced campus life. The area north of Legion Street/ Sen. J Bennett Johnston Avenue could provide space for these additional amenities, while the amenities would also support the current student population growth and the new programs that will further enhance that growth.
• Unlocks Chennault’s development sites for future growth through infrastructure improvements. The economic development potential of Chennault cannot be fully realized without new infrastructure at the 14 proposed development sites.
• Promotes usability and attractiveness of available development parcels through improved and added road improvements, water, sewer, and power infrastructure. Existing sites with some level of infrastructure should get upgraded infrastructure to improve their attractiveness in the market.
I would visit a Chennault and SOWELA district that had new investment and places for people to gather and interact.
I’M NOT SURE
I think this project will benefit SWLA.
There are several roads around Chennault and SOWELA that are in dire need of improvement, both to support the expansion and growth currently being experienced in the area and projected future growth for the years to come. Key roads and their associated benefits include:
1. Sen. J Bennett Johnston Avenue
– Provides direct connections to I-210, Legion Street and Broad Street
– Would provide a connection to US 90 if extended
– Has been planned for improvement by Calcasieu Parish for years
2. Main Street
– Can provide a secondary point of ingress/egress for the Chennault and SOWELA Area Resilience District
– Would support access to future development and planned facilities within the Resilience District and beyond
– Provides direct connection to Broad Street, US 90, and Opelousas Street via Bunker Road, which are key east-west corridors through Lake Charles
3. East Prien Lake Road
– Can provide the primary access point for the southern end of the Chennault and SOWELA Area Resilience District
– Would open up the southern portion of the Resilience District to hotels and commercial development, here and along I-210
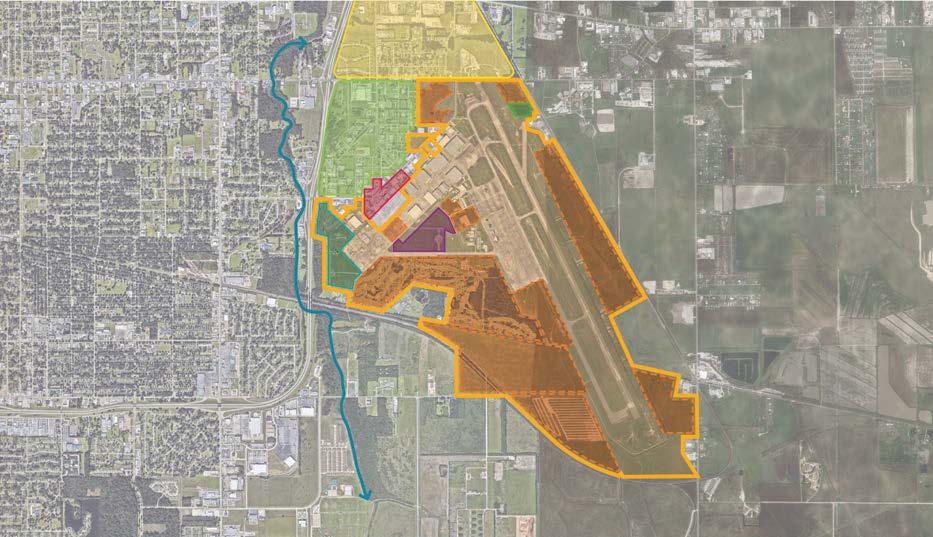
96% 4% YES
of respondents said of respondents said
I’M NOT SURE
Chennault International Airport has 10+ tenant companies already using space on the property. The airport has identified 14 sites for future growth. Most places have infrastructure needs to be successful. A key aspect of the action steps for the Chennault and SOWELA Resilience District is the prioritization of infrastructure needs to unlock and improve development sites. To the right, a conceptual roadway priority ranking outlines the most critical infrastructure needs for the greatest initial impact.
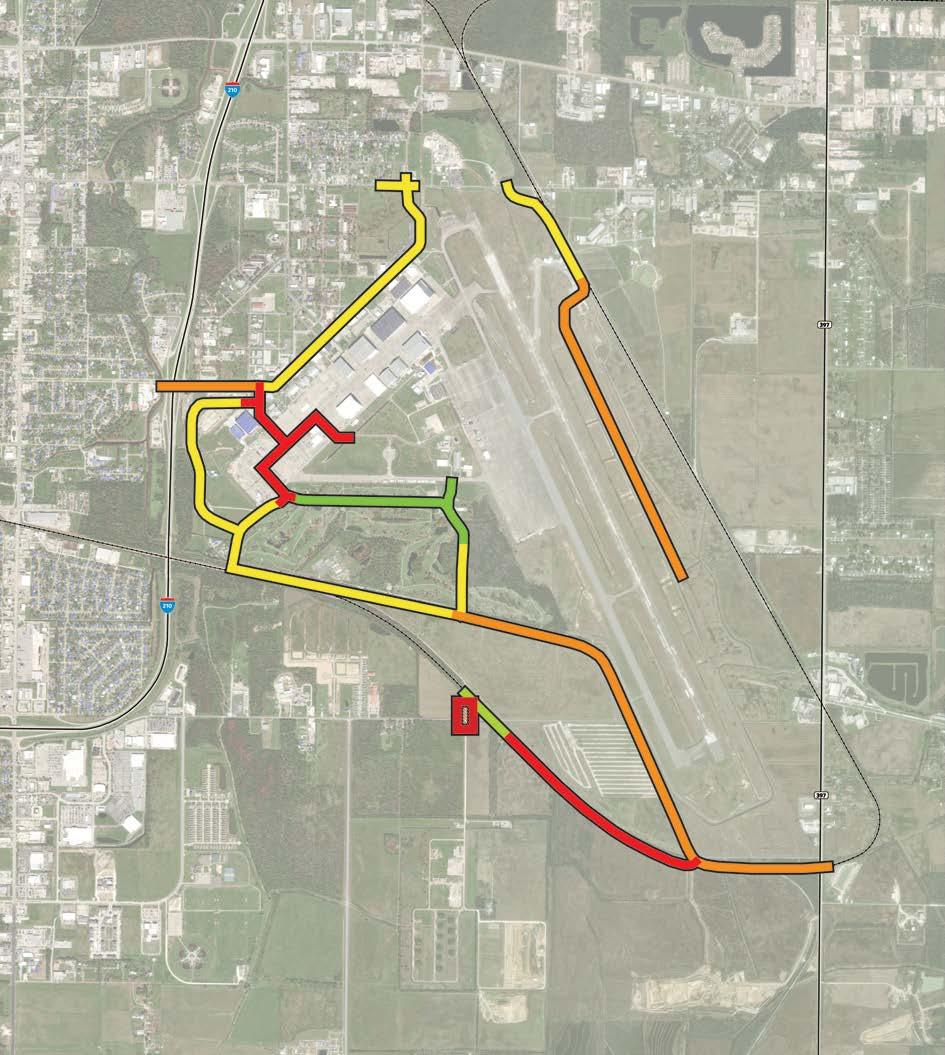
Unlocking a Strategic Anchor
Developing the 14 sites at Chennault would bring new employees, but a missing piece of the neighborhood are places to eat, gather, and shop. That’s where the district succeeds where one partner alone might fail.
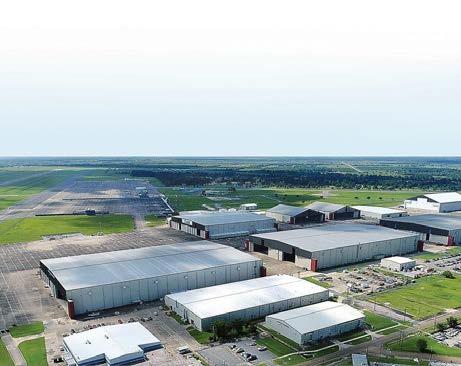
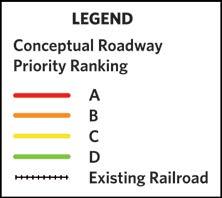
Chennault is another under-utilized resource for SWLA and has tremendous potential to drive growth.
As SOWELA’s student population grows and continues to return to the region following displacement from the recent storms, recent construction like the Culinary, Gaming, and Hospitality building provide new programs to serve the region, while partnerships with Chennault for mechanical trades and aviation support are ongoing. New programs and student services, such as pilot training, childcare, fitness, and athletic facilities, could help foster additional partnerships and promote growth of the school. An initial priority is improved parking walkable to campus with a focus on green infrastructure.
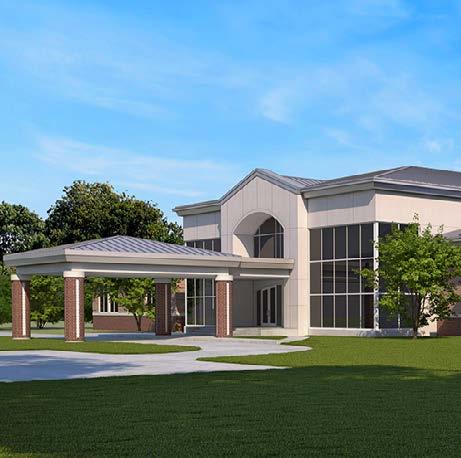
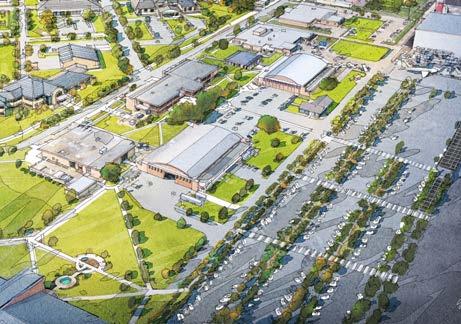
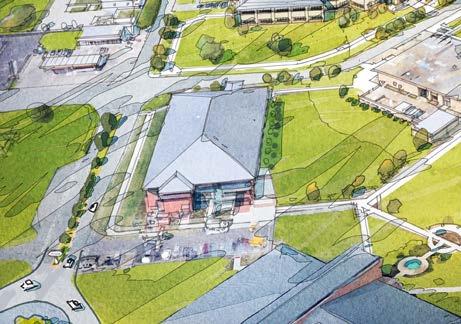
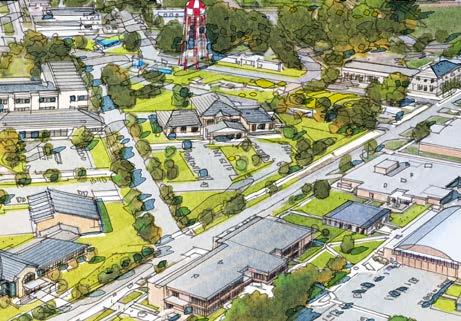
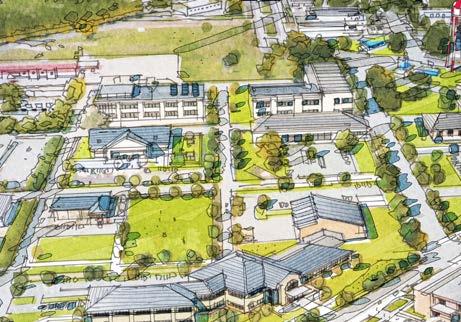
• Breathing life into a forgotten corner of Downtown Norfolk, TCC was the catalyst for creating a new “urban village”
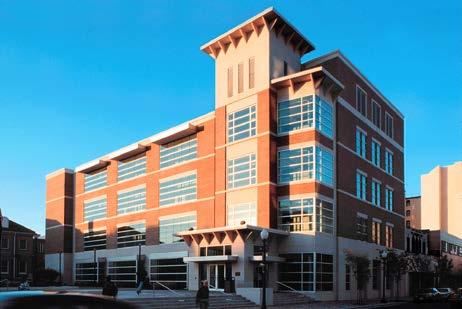
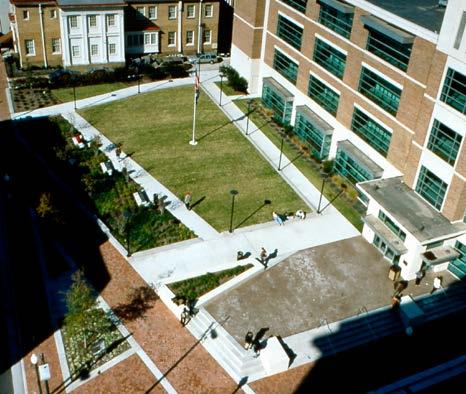
• The plan contains three existing structures, one new building, and two new public park spaces
D• The campus stimulated $140 million in new restaurants, entertainment venues, and 500 apartment and condominiums
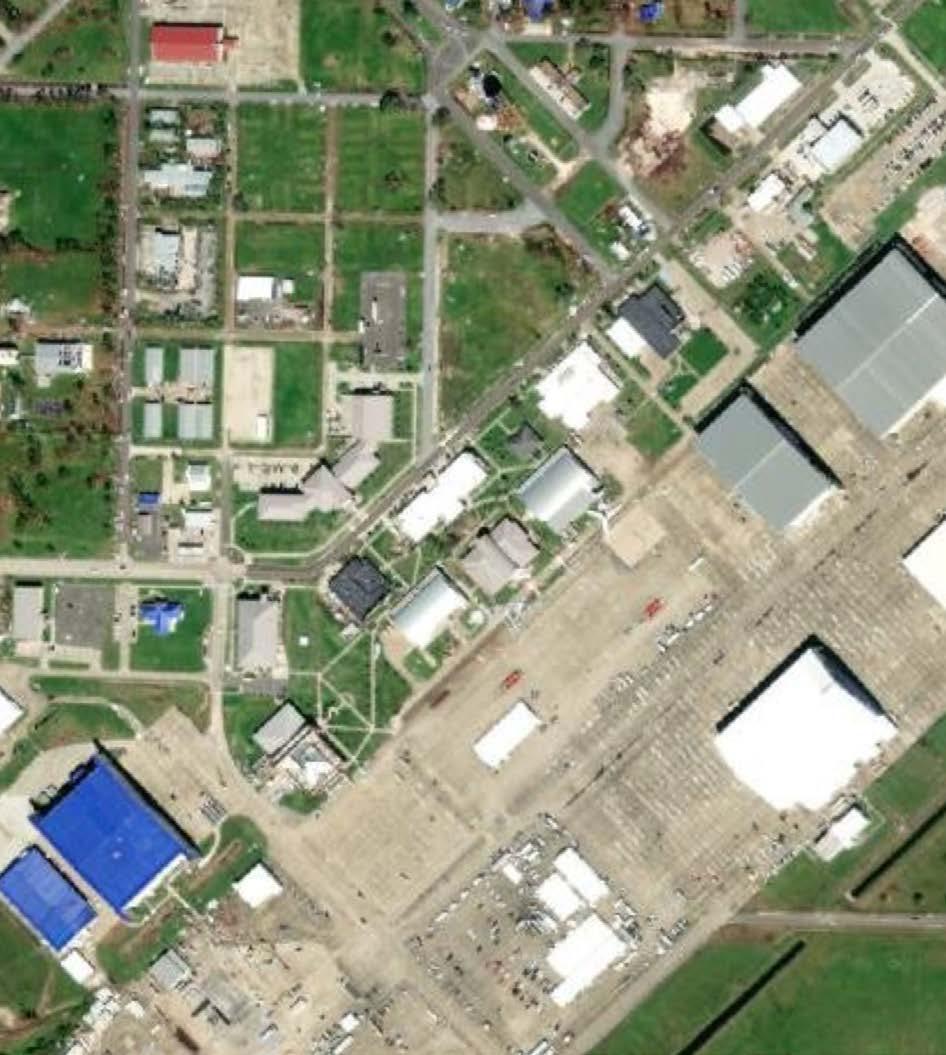
The key to implementation of the Chennault and SOWELA Resilience District is having a sustainable source of accessible funding and strategic partnerships.
Establishing a special funding district provides the structure and authority needed to secure funding and implement infrastructure improvement projects. The district could be a Tax Increment Finance (TIF) District and an entity that is eligible to receive federal grants and accept allocations from state and local governments.
Once a district has been identified and is operational, budget allocations and grant applications should be focused on infrastructure improvements. Identified sewer, water, and road upgrades should be prioritized by time, cost, and impact.
Action Steps
1 Establish a funding district that bundles multiple projects together
2 Prioritize funding for the identified sewer, water, and road upgrades
3 Work with the City of Lake Charles Water and Wastewater Divisions to secure right-of-way and to fund utility improvements
4 Fund and implement SOWELA projects such as: Industrial, Process, and Liquefied Natural Gas (LNG) Technology Center of Workforce Excellence, parking lot improvements with green infrastructure elements such as permeable paving, crosswalks, bioswales, trees, etc.
5 Work with public entities to assemble and acquire parcels for the development of job-generating development, restaurants, and destinations for students and employees
6 Implement infrastructure improvements, according to Chennault’s development sites and road prioritization
7 Invest in a green infrastructure park on the city-owned land (southeast of the water tower)
Sewer improvements are among the most necessary improvements needed for long-term growth on the development sites, and the City of Lake Charles owns property that can help in the strategic growth of the area. The land around the water tower between East and West Main Street could make an ideal park and community gathering space.
4 Fund and Implement SOWELA Campus Projects
Parking Lot Improvements One project already in design for SOWELA is additional improvements to the parking. Since SOWELA is a commuter campus, walkable access to well designed parking is key for growth. The SOWELA parking lot improvements could include green infrastructure and vehicular shading with solar panels. Focusing on these green improvements could both create example projects for elsewhere in the region, while also allowing for access to grant money for implementation.
The Industrial, Process, and LNG Technology Center will provide a simulated environment for training incumbent and future workers from local and regional employers utilizing the actual equipment and tools reflective of what workers will encounter in industry. Numerous craft areas such as machinists, millwrights, pipeline technicians, and welders would be focused on. Scale model Hands-on-Training (HOT) units would be utilized to focus on skill areas such as: Liquefaction and
refrigeration (LNG), closed loop heating and cooling with various control schema (separation techniques such as distillation, extraction, filtration), upstream petroleum separation and distribution (pipeline), and chemical reaction processes.
5 Work to Assemble and Acquire Parcels
Action step five is an ongoing step that continues at any time during implementation. Parcels north of Legion Street should be assembled for different uses, not only for SOWELA and Chennault, but for other businesses that can co-locate with and support these community anchors while providing spaces to eat, gather, and eventually housing.
6 Implement Infrastructure Improvements
The infrastructure improvements that were ranked and prioritized in action item two would be implemented over the next several years, opening up Chennault’s development sites and attracting new employers.
7 Invest in Green Infrastructure
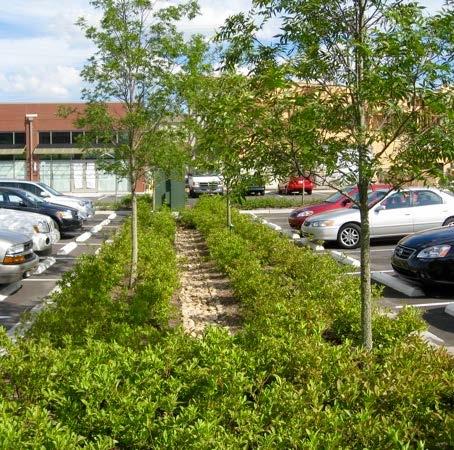
The Chennault and SOWELA Resilience District should be a place anchored in the future of greener infrastructure. New streets and utilities should focus on sustainability and utilizing new innovation. Such projects can be example projects for the region, teaching projects on SOWELA’s campus, and a selling point for companies attracted to the region who have an interest in sustainability.
Potential Partners
• Chennault
• SOWELA
• City of Lake Charles
• Calcasieu Parish
• Private developers
• Port of Lake Charles
• Union Pacific Rail
• Current Tenants at Chennault
Highlights and enhances a major hub for SWLA.
Visitors and students will have a welcoming, attractive area where businesses could thrive.
Potential Funding Sources
• LA DOTD Airport Improvement Program (CARES Act)
• US Department of Labor (DOL) Workforce Opportunity for Rural Communities (WORC) Initiative through the Delta Regional Authority (DRA)
• Renewed Chennault Millage
• Bonding
• Increase Chennault tenant payments and/or increase the number of tenants at Chennault
• Private developers and investors
• Economic Development District
• LED incentives
• SOWELA
• Infrastructure Investment and Jobs Act (IIJA) funding
• LA Watershed Initiative LA PRO program (trade certification program)
• OSHA & GOHSEP Emergency Management and Preparedness funding for logistics and staging areas
• EDA funding for solar advancements
Designate a funding district that bundles multiple projects together n/a Prioritize funding for the identified sewer, water, and road upgrades
Establish MOU or CEA with City of Lake Charles Water and Sewer to collaborate for securing right-of-way and cost sharing of local matches for funding sources
$75 million
Create a flight school at SOWELA
Invest in a green infrastructure park on the city-owned land southeast of the water tower
TBD
Use the Resilient Housing Toolkit to build infill housing in the Chennault/SOWELA Area See Project 9
Work with public entities to assemble and acquire parcels for the development of job-generating development, restaurants, and destinations for students and employees See Project 10
1–2 years
• Creation of an Economic Development District
City of Lake Charles
1–10 years
• Renewed millage
• Bonding
• Increased tenant payments
• Attraction of additional tenants
• Creation of an Economic Development District
City of Lake Charles
LA DOTD
Regional Planning and Development Commission
3–5 years
• Strengthening Community Colleges Training Grant
• US Department of Labor (DOL) Workforce Opportunity for Rural Communities (WORC) Initiative through the Delta Regional Authority (DRC)
2–5 years
• LA Watershed Initiative capital funding
• HMGP
• Infrastructure and Jobs Act (IIJA) competitive grants to improve walkability and green infrastructure
City of Lake Charles
Bayou Greenbelt Fund (Community Foundation SWLA)
1–10 years
• Restore LA — Affordable Homeownership programs
• LHC homeownership programs
Non-profits building affordable homeownership housing
1–10 years
• See Project 10
See Project 10
Walkable, active Downtowns are vibrant locations for co-locating retail businesses and services
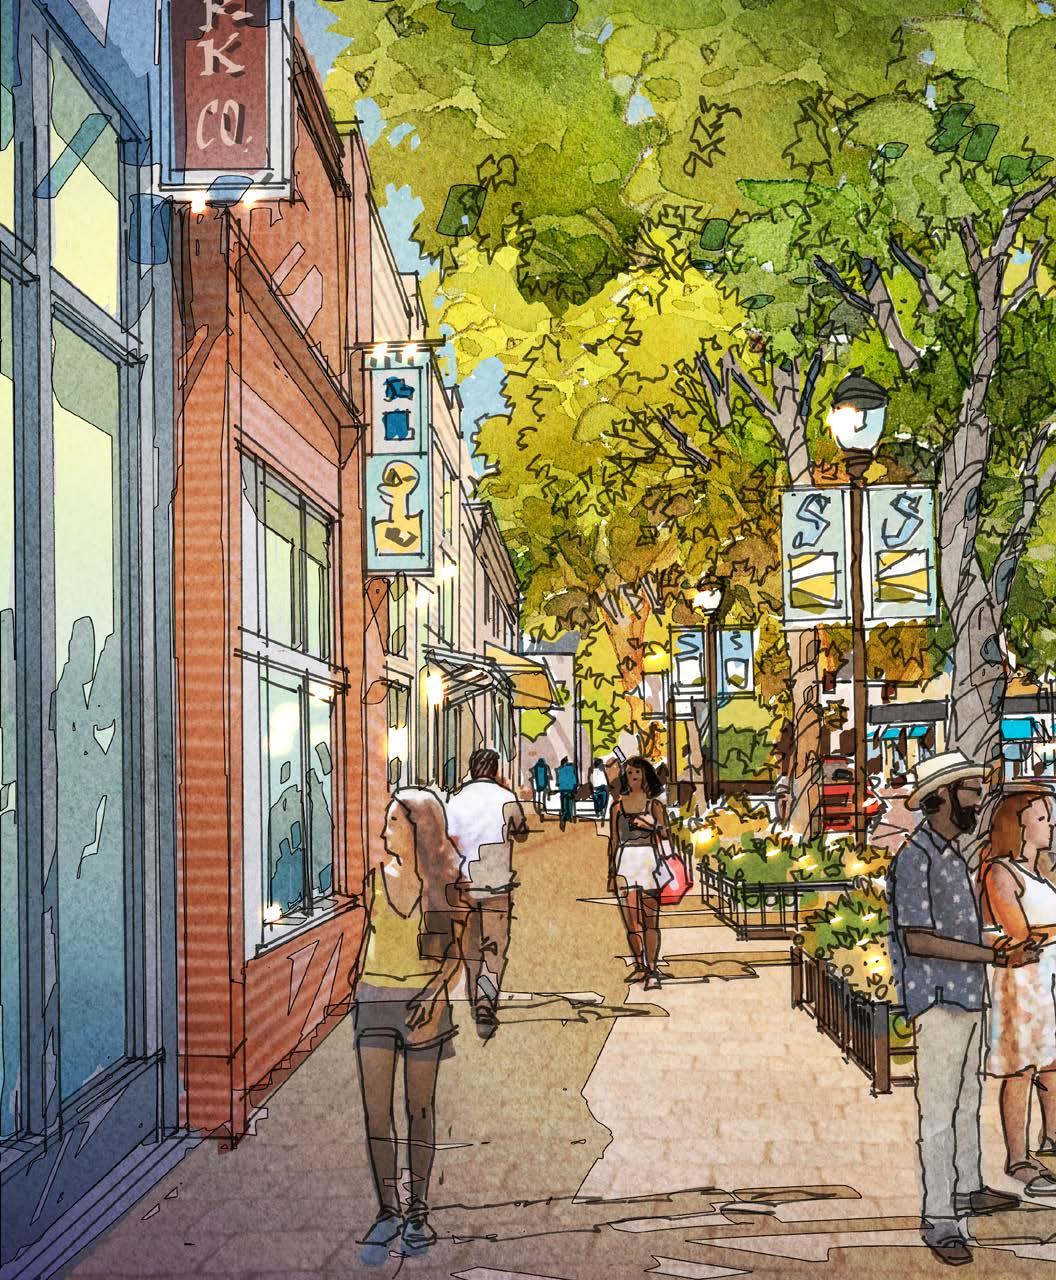
Strong Downtowns is about making an impact in communities all across SWLA by focusing on the streets and spaces that inspire people to walk and gather. This human scaled infrastructure helps support small businesses, community togetherness, and the idea of a Downtown hub that is unique to the scale and needs of each community in SWLA. The goal is to take the principles of walkable streets and fun, engaging festival parks and have them available as a best practices guide that is refined as each strong Downtown project is implemented. This also means streets that are not only walkable and engaging, but also use principles of good stormwater management; green infrastructure that can help support the area in case of flooding. While it starts with streets and parks,
HIGH priority 2-5 years
Varies by street
While Lake Charles serves as a regional Downtown between Houston and Baton Rouge, many of the smaller communities also have Downtowns that could attract economic and cultural investments. Strengthening these Downtowns by making them more walkable and adding places for people to gather and celebrate local food and culture will attract new businesses.
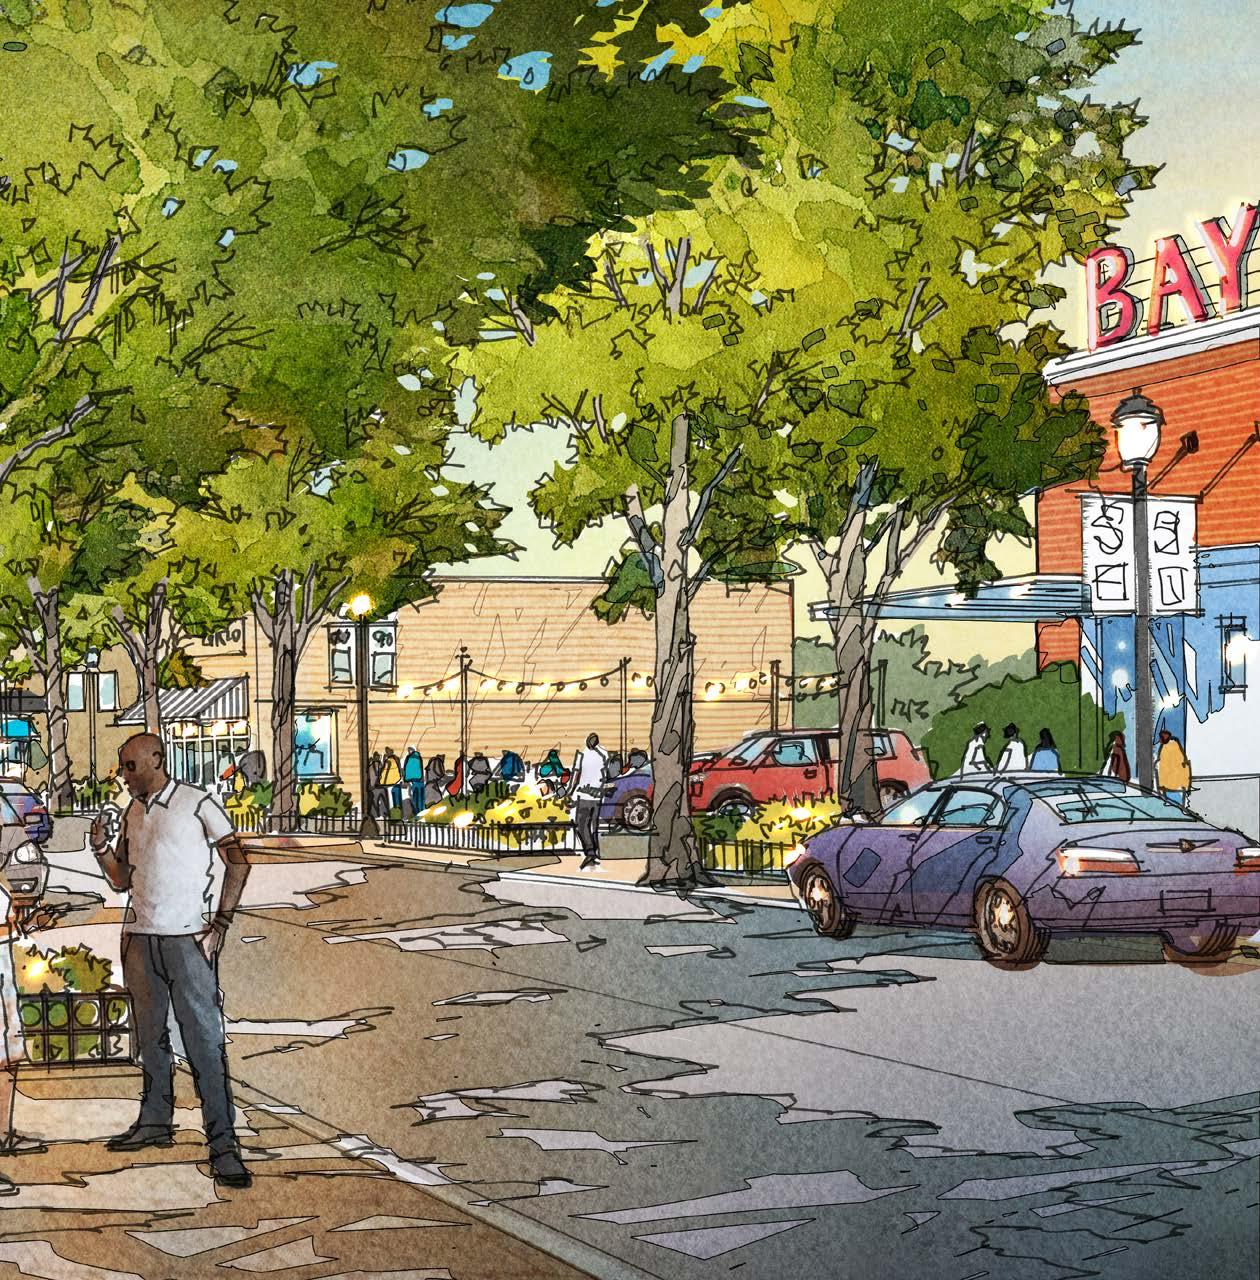
Strong Downtowns serve as central gathering spaces, where people and services can co-locate to create community cultural centers. By locating amenities and entertainment into central locations, strong Downtowns can serve residents throughout Cameron Parish in locations that are easily accessible and unique to each community.
the goal is for these investments to spark infill development for housing, businesses, and services, which will continue to support the strengthening Downtowns.
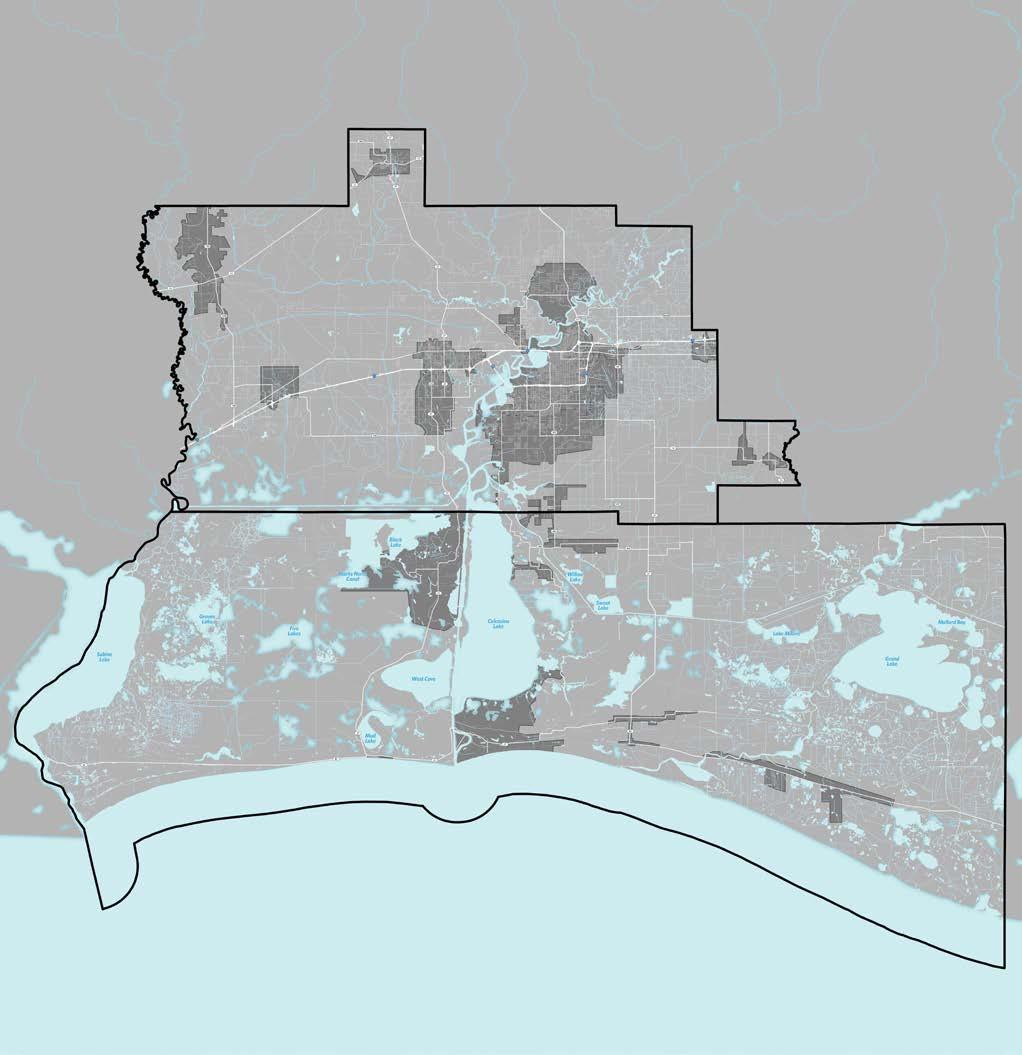
• Downtowns nurture new and existing small businesses, jobs, and services and offer people-centered places for cultural gatherings and festivals.
• Streetscapes and welcoming public space are a key ingredient to successful Downtowns.
• Stormwater management is a critical issue for the region, and improved streetscapes can more successfully assist in capturing and storing water.
Vibrant Downtowns are needed as the heart of the community. It needs to be a place where the community can come together to work and play.Westlake Sulphur Vinton Starks DeQuincy Iowa Hackberry Cameron
Strong Downtowns focuses on growth in Community Planning, Economic Development, Infrastructure, and Natural and Cultural Resources. Strong Downtown would:
• Promotes walkability and bikeability by providing enhanced pedestrian infrastructure on main streets in each community. This is not a one-size fits all approach, but allows the principles of walkable streets to be tailored to the available rights-of-way, budgets, and ultimate goals of each community. Some might be more focused on having more greenery, trees, and stormwater infrastructure, while others might have more right-of-way and would like to implement more outdoor dining opportunities. Regardless of secondary goals, a primary goal for each strong Downtown should be walkability on safe Downtown streets.
• Supports growth of the creative industries and small businesses by investing in the public realm to attract private investment and the customers to support businesses. The increased walkability improves visibility for the small businesses in existing buildings and hopefully in new development infill buildings as well. The principles of strong Downtowns focuses on creatives and small businesses, rather than large single employers.
• Improves drainage and stormwater infrastructure. New street infrastructure would focus on stormwater management, adding bioswales, catchment basins, and other methods for stormwater management. These best practices can be used in different ways depending on the needs of each strong Downtown project in each community.
• Celebrates the vibrancy of communities across both parishes by exploring what makes each unique and building on that in each Downtown. Each of the Downtowns in SWLA is unique, with its own history, traditions, and buildings. Walkable streets and beautiful gathering spaces help celebrate what is distinctive to each community. The spaces chosen for emphasis should celebrate that, especially historic buildings, special natural views or amenities, or other things that are special to each place.
• Offers spaces for cultural festivals, gatherings, and celebrations. Festival parks, no matter their size, should be scaled and programmed accordingly, considering the variety of festivals and events unique to each community in SWLA.
This will make the places we go every day beautiful and stimulating.
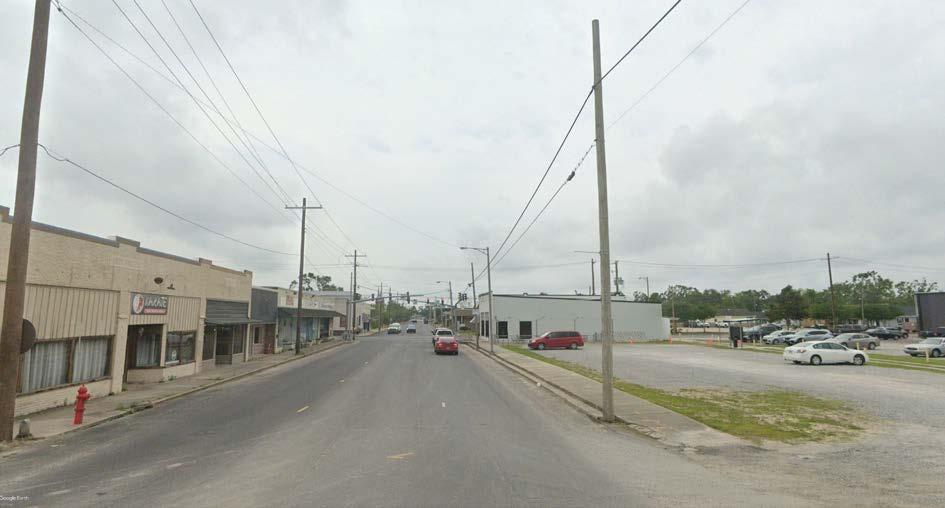
The framework for a strong Downtown starts with the streetscape. The street has the ability to accomplish many functions, from providing places for restaurants and vendors to spill out, to helping retain stormwater in tree wells, to providing safer places for people to bike, to allowing easy parking and access to small businesses. Each strong Downtown in SWLA will have different streets with different widths of the right-of-way, which will impact what elements of a complete street can safely be implemented. Some streets may be wide enough for parking on both sides and new bike lanes, while others might do better with parking on one side and new tree wells. To help make stronger streets, Strong Downtowns should focus on:
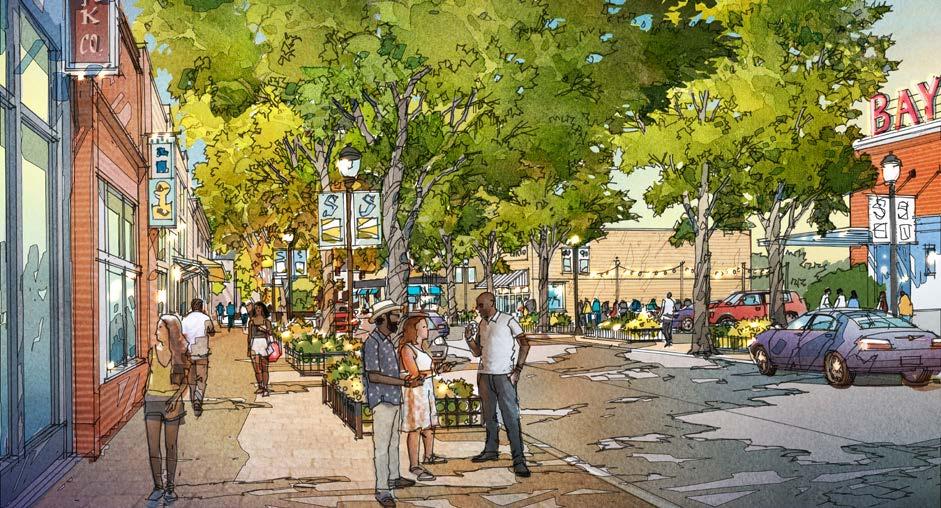
• Narrowing the lanes: changing the width of travel lanes from 12 or 13 feet to 10 to 11 feet can drastically change how quickly people move through Downtowns, making it safer for pedestrians to walk.
• Add green infrastructure: adding plantings, trees, and green infrastructure in tree wells can help manage stormwater and reduce flooding in streets
• Create layers to protect the pedestrian: additional trees and on-street parking can create layers that protect a pedestrian walking or a sidewalk cafe or vendor.
• The transformation of Greenville’s Downtown began in the 1970’s when four lanes of traffic were redesigned with green medians, angled parking, and wide sidewalks
• In 2010, Greenville completed their Downtown Streetscape Master Plan to incorporate Complete Street elements
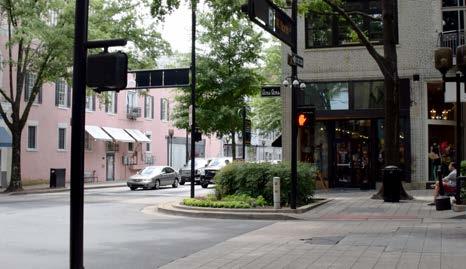
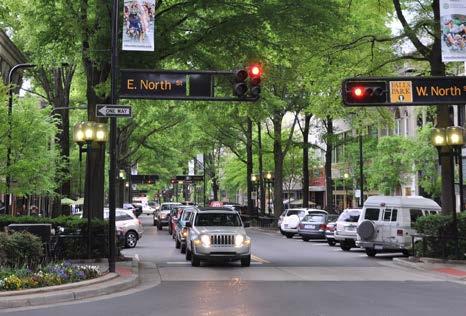
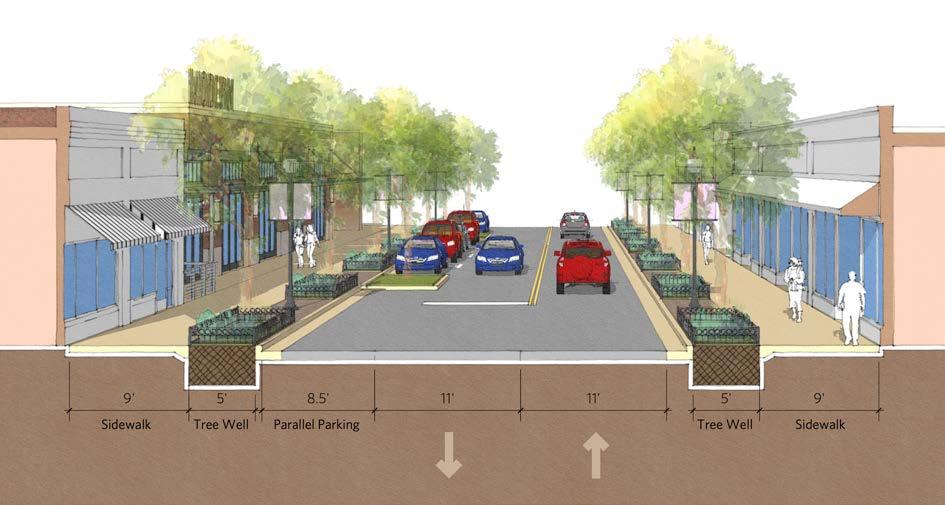
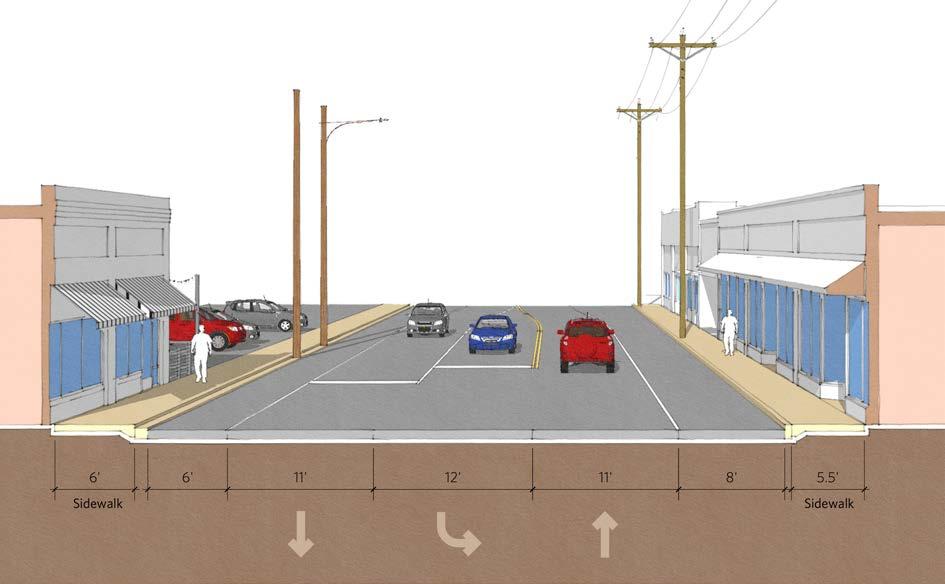
• Consistently listed as one of the “Best Downtowns” and travel destinations
• The most successful tool used for construction costs has been utilizing Tax Increment Financing (TIF), which allowed the City to utilize property tax revenue increases within a defined district for redevelopment and revitalization efforts
• 1.6 acre small urban park built on the site of a former parking lot adjacent to a power plant
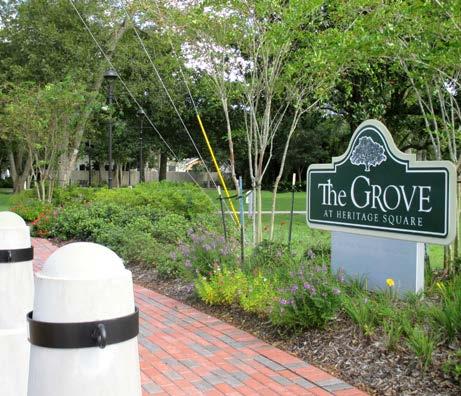
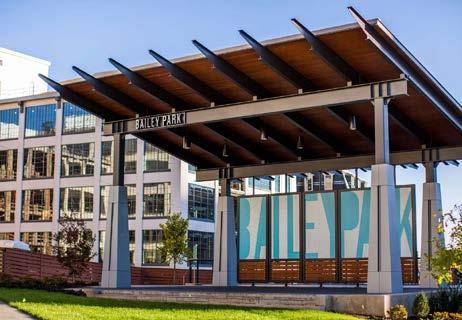
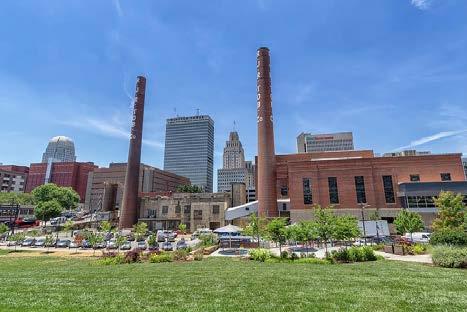
• The park is designed for multiple uses:
– A stage for concerts and movies in the evenings
– An open lawn for yoga and other recreational activities
– Areas of hardscape for food trucks during lunch and dinner
–
Instances of public art
– Lush planted areas
Festival parks can go by many names, but festival parks for strong Downtowns are intended to be community gathering spaces that are as unique and engaging as each of the communities that they inhabit. These spaces can be large with many different programming elements and spaces, or small and intimate for just a few people at a time. Each community should examine what sorts of gatherings they would like their festival parks to hold, be it local festivals, high school proms, farmers markets, food truck round-ups, or a host of other types of events. Each community should also consider what the park is like when it isn’t actively programmed; is it a place where people want to relax and gather, play and bring dogs, or have lunch on a pleasant weekday afternoon. Understanding the needs of the community helps create a festival park that fits in while meeting those needs.
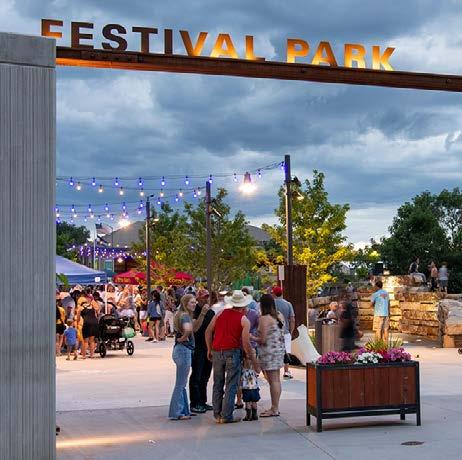
I appreciate the vision of creating a more active and vibrant Downtown for residents and visitors alike to enjoy.
Entry Signage
The components of a good festival park can be arranged and scaled to meet the needs of communities of all sizes in SWLA. Having a variety of these parks in different sizes can not only allow for good public space, but can allow communities to share ideas and best practices for getting the most out of their spaces.
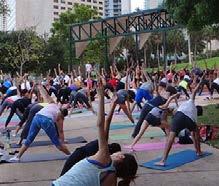
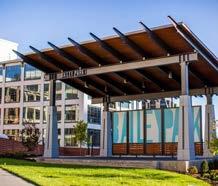
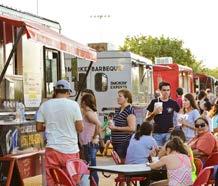
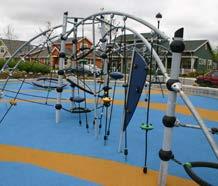
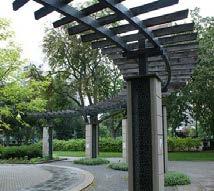
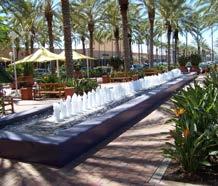
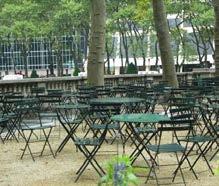
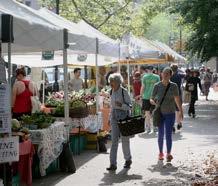
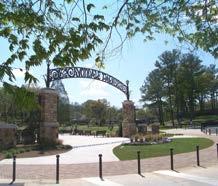
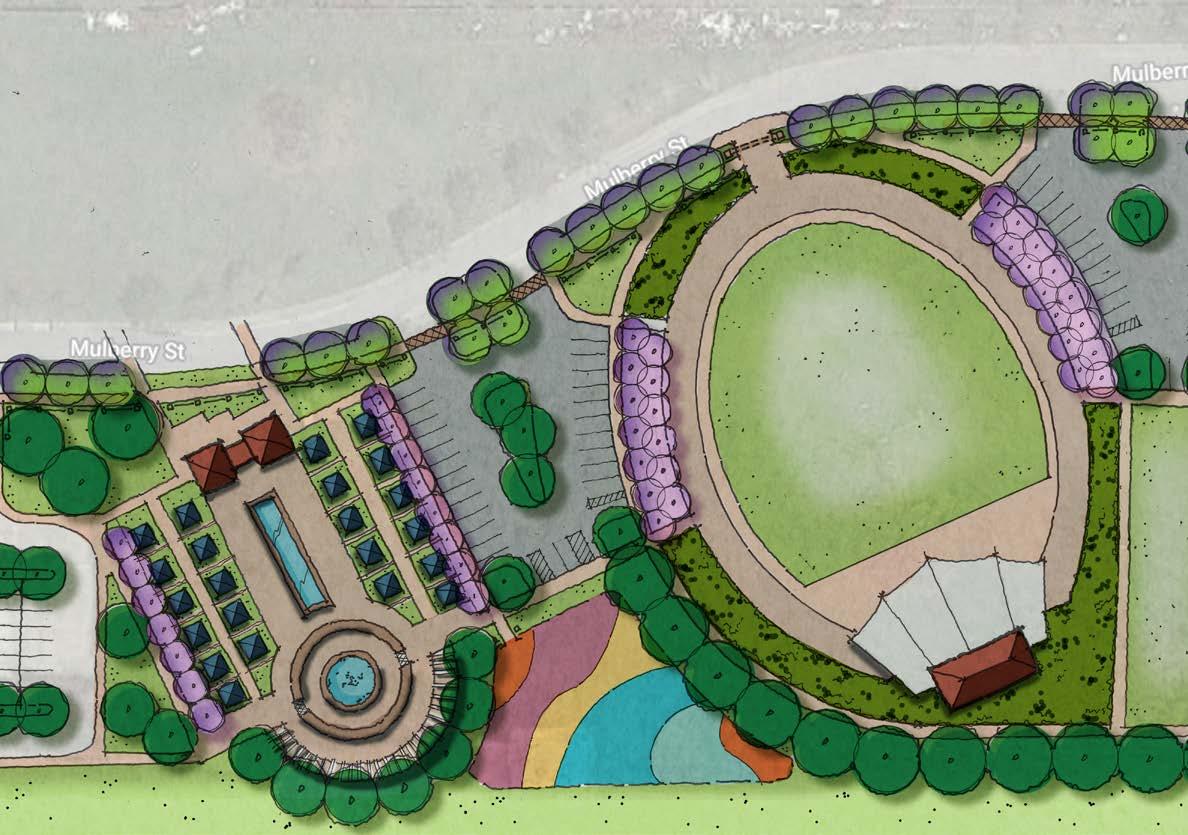
Restrooms
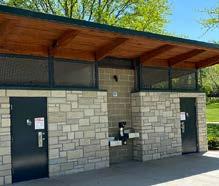
Implementation of strong Downtowns will be unique to each of the areas that take on the project, but they can all follow a similar format and rely on each other for best practices and lessons learned.
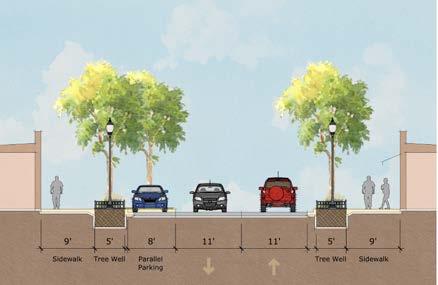
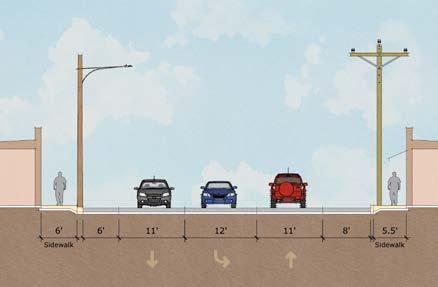
Staring with the streets, each strong Downtown can create a framework for other development to build from. Streetscape projects should be focused on walkability, the inclusion of green infrastructure, and creating space for businesses to actively engage with the street. Existing ordinances and codes should allow for sidewalk cafes and signage that engages with the street. Walkability goes beyond just having a sidewalk, but that sidewalk being wide, engaging, attractive, and protected. Adding elements like bike lanes, planters, and on-street parking can help enhance those feelings of walkability. As municipalities develop plans for complete streets, these should be studied at different scales so that they can be shared and implemented in other communities.
1 Fund and implement streetscape projects to make Downtowns more walkable, to improve drainage, and to encourage active uses
2 Build festival parks on publicly owned land that can double as green infrastructure and improved drainage
3 Identify locations for infill housing, retail, and community amenities in Downtowns
4 Attract and support small businesses, shops, and creative industries
Each Downtown in SWLA implements stronger streets and community space with new infill opportunities for local businesses and creatives
With more walkable streets in the design, communities can focus on the development of festival parks. These parks should go beyond current municipal parks because they should have a purpose, a space to hold the gatherings that are unique and specific to each community. This begins by identifying a space and potential uses for that space, focusing on linking the park with the walkable streetscape projects. Festival parks should act as a heart for each community.
With the framework of more walkable streets into implementation and with a new location to hold community festivals and events, strategic locations for building revitalization and infill development can become clear. Food trucks that set up in the festival park may look for a brick and mortar space, a vendor at a farmer’s market may open a shop. These opportunities for infill should be identified, focusing on what best connects to the new streetscape projects and festival park.
After identifying spaces for infill, the process of working to attract, retain, and support small businesses, shops and creatives begins. Connecting these small owners to potential funding sources, creating new streams of funding, and offering incentives for the redevelopment of existing Downtown buildings can help reinforce the work being done to make each Downtown stronger. Utilizing existing chambers of commerce to create a network for these small businesses and creatives is also critical to supporting them as they fill the storefronts of stronger Downtowns throughout the region.
• Municipal & Parish governments
• Small businesses
• Housing developers
• SWLA Economic Development Alliance
• Developers, businesses, and landowners
• West Calcasieu Chamber of Commerce
• North Lake Charles Chamber of Commerce
• Current economic development districts
• State Capital Outlay (road budgets)
• State and federal DOTD grants
• HMGP
• City/Parish general funds
• Restore LA Small Business Loan and Grant Program
• Infrastructure Investment and Jobs Act (IIJA) competitive grants
• EDA funding for small business attraction and minority-owned businesses
• LA DOTD Safe Routes to Public Places (LA Complete Streets Program)
• LA Culture, Recreation, and Tourism funding
• National Endowment for the Arts (NEA) Creative Placemaking grants
• USDA placemaking grants
•
•
•
•
•
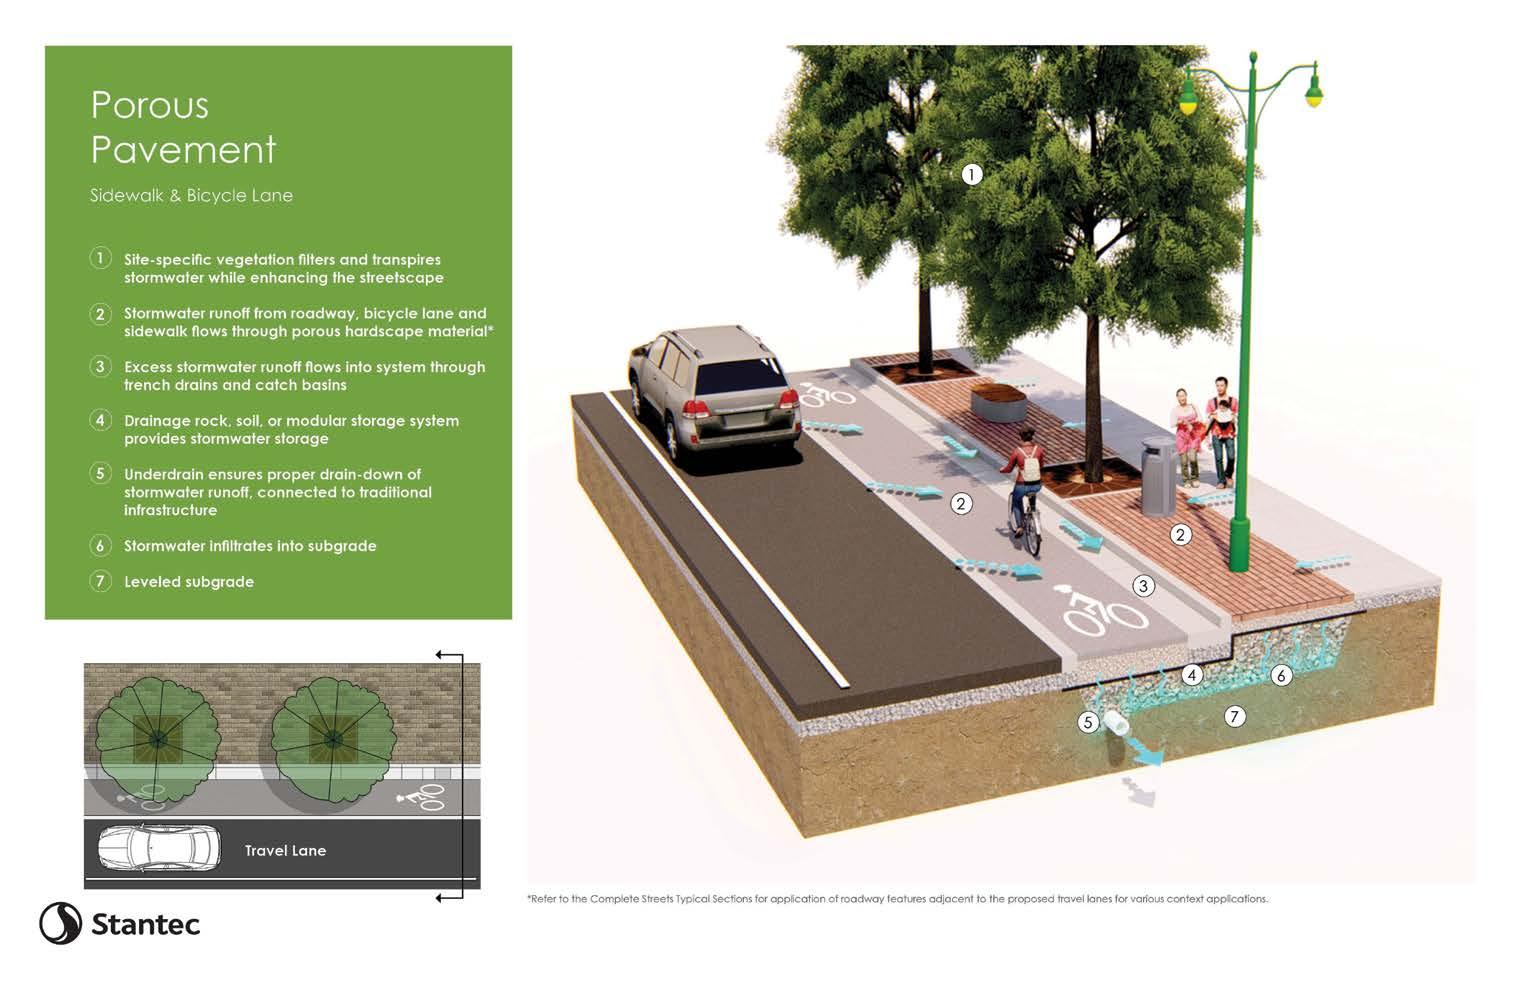
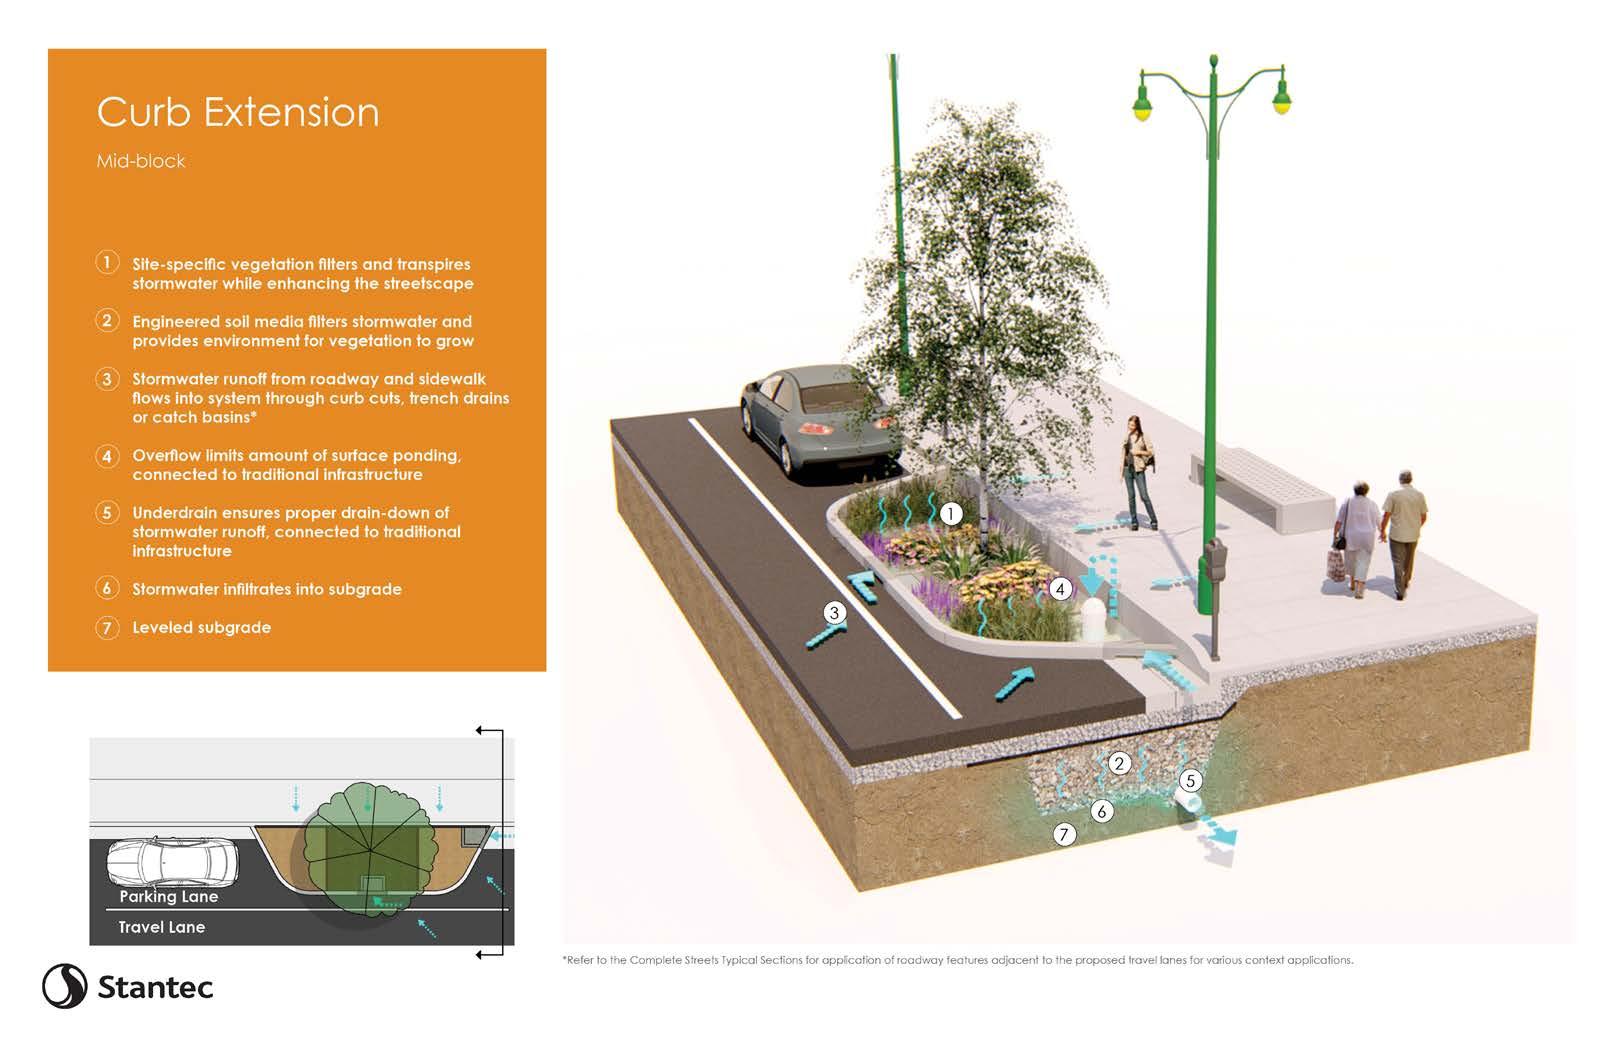
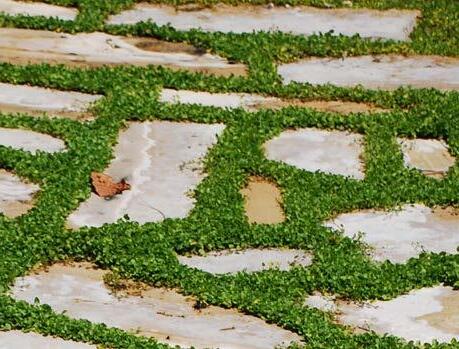
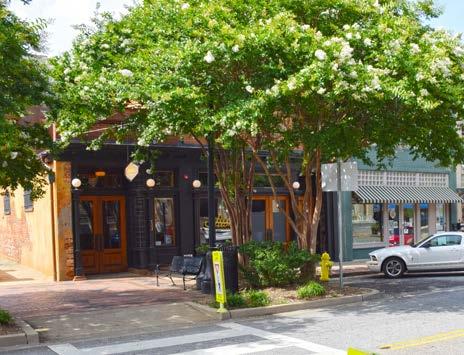
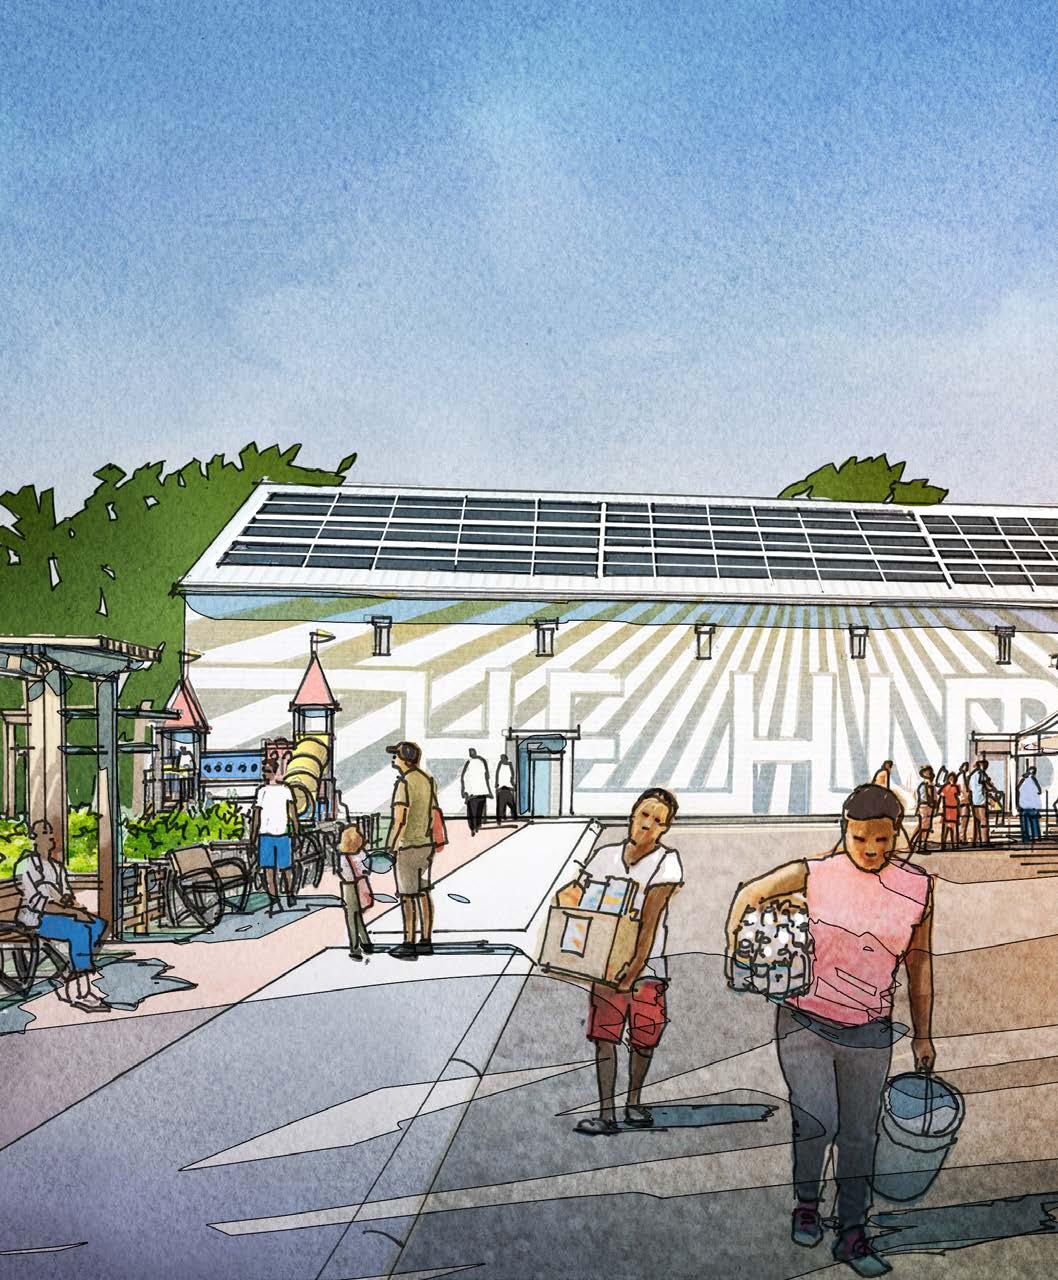
Various communities throughout SWLA lack well-constructed, public building spaces that promote community engagement and can serve as a critical facility during disasters. Resilience hubs are community-serving facilities that support residents, coordinate communication, distribute resources, and enhance quality of life. In emergencies, community resilience hubs would provide places for food and water distribution, shelter, charging, cooling, and disaster response coordination. During non-disaster times, these facilities can serve as community buildings for gatherings and recreation. Parishes can start by identifying existing facilities; strategically acquiring public, private, and vacant/underutilized land; and understanding each community’s specific needs to develop a customized strategy.
HIGH priority 1-5 years
$1-$5+ million
The safety of residents during and after disaster events continues to be a critical need for SWLA.
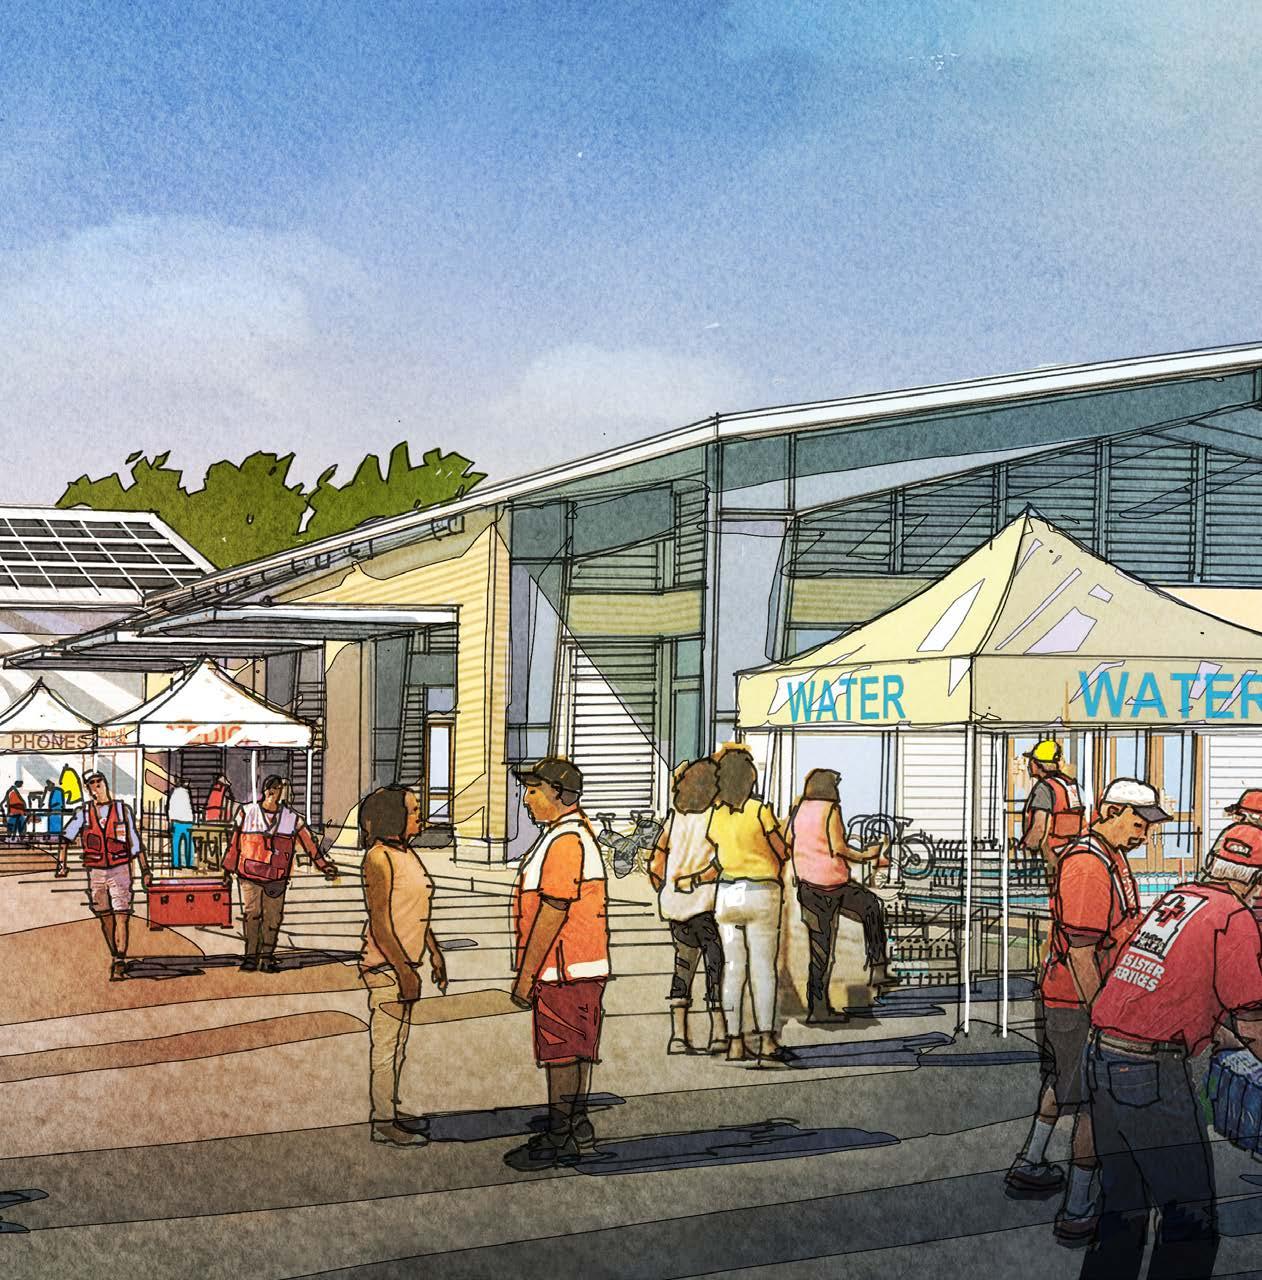
While communities centrally located in Calcasieu Parish and in proximity to Lake Charles have several options for easily accessible and safe facilities that can be used as resilience hubs, those living in the northern, western, and eastern edges of the parish struggle to have the same access. Targeting these communities with new resilience hubs would minimize the driving distance to a resource center and promote storm-prepared communities.
With the distance between communities in Cameron Parish, it is difficult for residents to access the resources they need during and after disasters. Strategically locating resilience hubs around Cameron Parish would not only provide necessary resources close to home, but also offer community places to gather on blue-sky days.
On blue-sky days, resilience hubs provide a community gathering space for enrichment activities that improve the quality of life for residents of all ages. From meetings to performances to youth summer camps, the resilience hub can serve many purposes for the residents who use the facility. The grounds of the resilience hubs can also serve as park and recreation space, provide outdoor space for pop-up farmers markets or become a music venue. Resilience hubs offer endless possibilities for blue-sky day programs and services, and make dreams a reality through the cooperation and partnership of a local champion, the parish, and the city.
During times of disaster, resilience hubs will act as a critical facility, meant to serve critical needs during response and recovery. Built to withstand hurricane force winds and located in areas of low flood risk, a resilience hub is meant to be a community constant and beacon of hope that can withstand the worst of storms. Resilience hubs can provide power and communications when the grid is down, serve as disaster resource centers, and temporary shelters following a disaster.
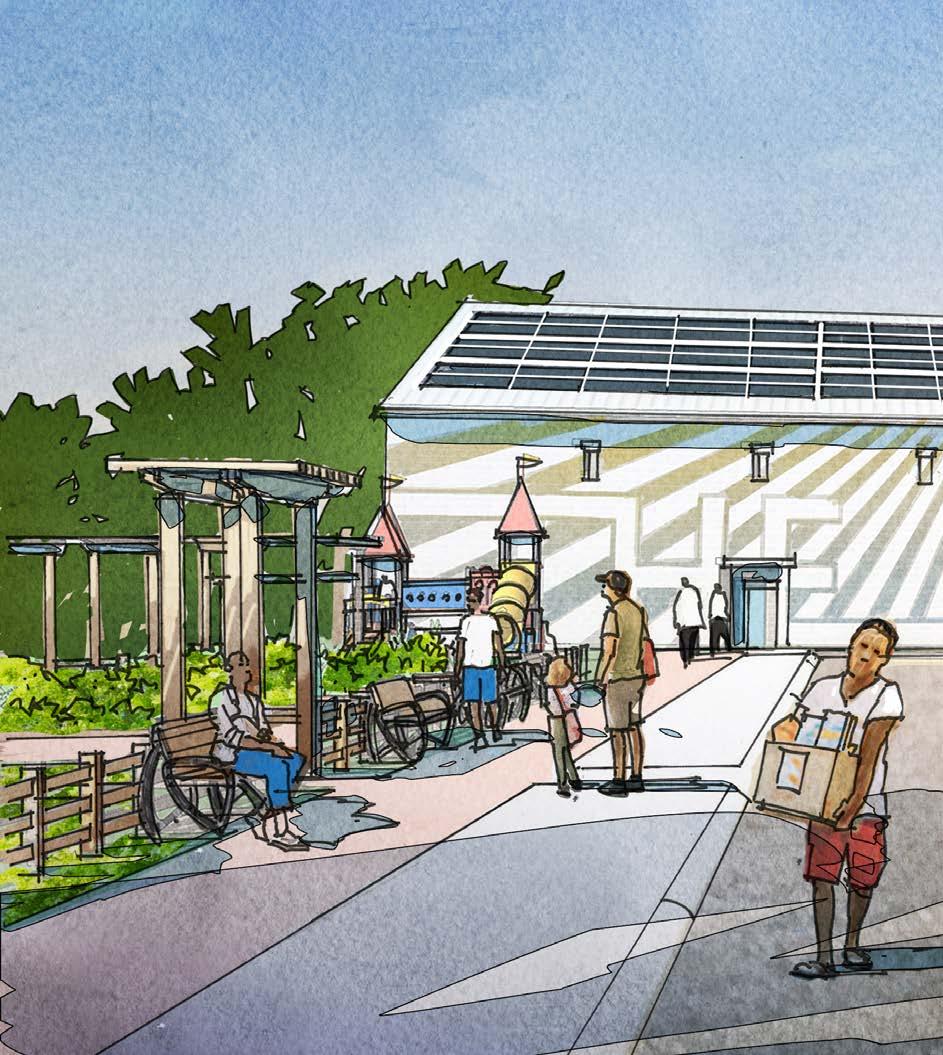
I love that communities would have a place to turn to after a disaster. There were so many people in need after Laura and to have one of these in the communities is the best idea ever.View of a potential community garden and playground space at a community resilience hub
Community resilience hubs focus on growth in Community Planning, Infrastructure, and Natural and Cultural Resources. A Community resilience hub would:
• Better connect people to public buildings with sidewalks and improved access. Resilience hubs must be easily accessible following a disaster, whether people arrive by foot, bike, car, or emergency vehicle. Improvements to sidewalks, trails, and roads begin at the resilience hubs, but should extend throughout the community and can coincide with the complete streets efforts that are a part of building Strong Downtowns.
• Provide necessary, critical, community facilities for support during disasters, especially if existing public facilities or other infrastructure are compromised during a storm event.
• Promote the necessity of resilient construction, both in building to withstand hurricane force winds and locating in areas of low flood risk. FEMA rated, community safe rooms are
designed to provide near-absolute protection in extreme-wind events. Resilience hubs will showcase the latest advances in building materials and disaster resistant, sustainable design and will be models for other community facilities.
• Demonstrate best practices in green infrastructure and sustainable design. Effectively and responsibly managing stormwater will be a requirement to keep resilience hubs accessible during an event. They will also require technology and equipment to provide emergency power and communication. These features will be models for community facilities across SWLA.
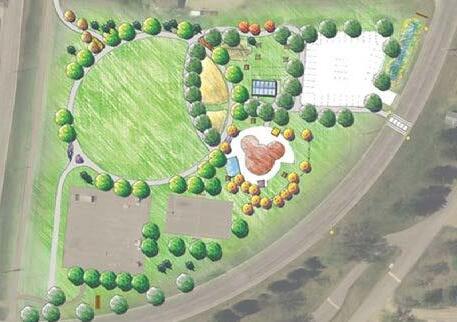
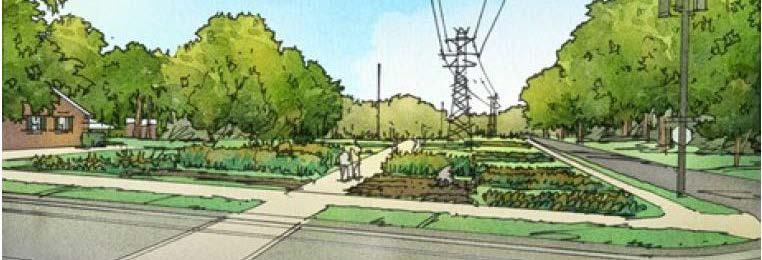
• Improve quality and reliability of public infrastructure. Resilience hubs must remain operational during and after a disaster. They will also require technology and equipment to provide emergency power and communication. These features will be models for community facilities across SWLA.
• Create opportunities for community gathering by providing public recreation space for youth and adults that improves social cohesion and continues local traditions. Public engagement results showed that SWLA residents lack family-friendly entertainment. Resilience hub sites can offer space for residents to play, gather, and celebrate culture.
– Resilience hubs can be designed specifically to host events unique to the community that can provide community enrichment and increase tourism.
– Outdoor spaces could be utilized as festival parks that can host live music, makers markets, and local art installations.
– Current playgrounds can be built to provide youth with a variety of play opportunities that may be lacking in the community. Walking and biking trails, as well as skate parks can be prioritized in areas that lack sidewalks. Small water parks can serve areas that lack a community pool. Innovative playground equipment can provide enrichment for children with disabilities.
– Interior spaces can be used for youth summer camps, senior citizen game nights, and Mardi Gras balls.
Identify Sites & Resources
Linking Community Lifelines
Resilience hubs should be strategically located throughout the region to connect with existing roadways and public buildings. If one public facility or geographic area is compromised during disaster, such as the government complex in the Town of Cameron, having Resilience hubs that are on higher ground and built to withstand hurricane force winds can offer a backup facility for public works or serve the residents during recovery.
The landscape and built environment of SWLA has changed over the past 20 years, due to storm migration and urban sprawl. Many rural communities and unincorporated areas have increased in population without expanding infrastructure and public resources. In older sections of the city limits, infrastructure and community services are often outdated and in need of repair, in order to support the existing population before and after a disaster.
Action Steps
1 Analyze, understand, and identify communities in need
2 Analyze existing conditions and resources
2a Identify what sources and facilities already exist and where publicly owned land exists outside of the Special Flood Hazard Area
2b Identify strategic locations for hubs in areas of minimal flood risk
3 Plan for customized, targeted community resilience hubs either by hardening and/or expanding existing facilities or building new buildings
4 Dedicate publicly owned sites for resilience hubs through a public process at the city, town, and/or parish levels of government
5 Retrofit and harden existing facilities to create community resilience hubs
6 Build new community resilience hubs
(years)
Even if a community would benefit from a resilience hub, ramifications of property operation and maintenance should be considered: Does the community want a resilience hub? Does the community have a need for additional facilities that can offer needed services and be the resilience hub? Can the community afford to maintain the facility?
There are several things to consider when analyzing existing conditions and resources in areas for potential resilience hubs, including:
– Is there enough population in the area to utilize the resilience hub on blue-sky days and after a disaster?
– Does the community already have a facility that is a resilience hub, but isn’t recognized as one?
– Is there an existing facility that needs upgrading and can be the resilience hub?

– Is the location easily accessible by foot, bike, car, and emergency vehicle or can upgrades be made to make it accessible?
– Is the location in the flood plain?
– Can the parish and utility service providers harden infrastructure sufficiently to maintain resilience hub operation?
Much of the land in SWLA is located within high risk flood zones that are subject to coastal, riverine, or drainage flooding. Since resilience hubs are meant to serve the public after disaster events, it is crucial that the building, roadways, and parking area are not vulnerable to flood damage. If the resilience hub is compromised during a hurricane or flood, the community will lose a lifeline that is intended to provide critical recovery services.
By locating resilience hubs outside of the Special Flood Hazard Area (SFHA) and verifying the probability of little to no flood risk using high-water mark data from historic flood events, communities can protect their investment from known risk and proactively account for future conditions, such as sea level rise and increased precipitation.
Once a flood risk analysis has identified non-flood prone areas, land use, existing building inventory, and property ownership should be investigated. While publicly owned facilities and land would be the most economical choice for a resilience hub site, it may not be the best long-term location. Low risk, privately or publicly owned vacant land should be considered for not only resilience hub sites, but other critical community facilities as well.
For instance, portions of Grand Lake and Sweet Lake, in northern Cameron Parish, contain the
only non-SFHA land in the entire Parish and have shown minimal flood vulnerability in past hurricane events. A land use analysis revealed that much of this land is vacant, but under private ownership. Communities that lack low-risk, developable public land should consider strategic acquisition of underutilized acreage or vacant land to site critical facilities, like resilience hubs.
Resilience hubs should be easily accessible to residents to promote usability. Siting must also consider the population it serves. For instance, low-income populations that lack reliable transportation may need a neighborhood resilience hub they can walk to, whereas rural communities sharing a large, community resilience hub may site the facility on a major highway that can be accessed from multiple directions.
Community Population: Fewer than 1,000 residents
Building Square Foot: Fewer than 5,000 SF
Approximate Building Cost: Less than $1 million
In order to plan for customized, targeted community resilience hubs, the following questions should be considered and answered:
– Can the resilience hub fill a gap in public facilities and services?
– How many residents will the facility likely serve? This will determine the size.
– How large is the lot size? Can it accommodate outdoor amenities?
– Is the site easy to access with ample parking and driveways that can be used for emergency services and distribution?
– What traditions make the community unique? Can the resilience hub be a place to continue and celebrate those traditions?
Community Population: 1,000–6,000 residents
Building Square Foot: 5,000–10,000 SF
Approximate Building Cost: $1 million–$5 million
Nine sites throughout Calcasieu and Cameron parishes have been identified as ideal candidates for resilience hub facilities. Some sites are currently vacant land, which will require a new structure to be built, while others have existing facilities that can be retrofitted to current wind mitigation standards. Identifying sites includes answering the following questions:
– Is there a publicly owned site that is accessible to community residents and outside the flood plain? Is there a property the Parish can purchase that is outside the flood plain and accessible?
– Is there a public facility that can be expanded to include the resilience hub?
Community Population: Greater than 6,000 residents
Building Square Foot: Greater than 10,000 SF
Approximate Building Cost: More than $5 million
5 Retrofit and Harden Existing Facilities to Create Community Resilience Hubs
Iowa and Hackberry have existing facilities located in low flood risk zones or that are elevated to current base flood elevation requirements. Existing facilities that will be used as resilience hubs must meet current wind mitigation building standards. Buildings may require structural reinforcement that promote continuous load path for increased strength and wind hardening of the building envelope, which includes the roof covering and window and door openings.
6 Build New Community Resilience Hubs
New constructed resilience hubs are being proposed for DeQuincy, Vinton, Sulphur, Goosport, Hayes, Hackberry, Sweetlake, and Moss Bluff. While each facility should be built to withstand hurricane force winds, the size of the facility will be dependent upon the population it serves, as well as the lot size.
Programming Ideas for Community Resilience Hubs
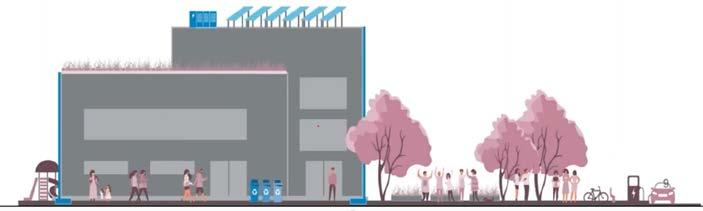
Community Center
Youth Adult
Summer Camps
Rental Space: Wedding Receptions, Parties, etc.
4-H Meetings/Events Community Meetings
Boy Scouts/Girl Scouts Voting Facility
Dance Class
A Good Example
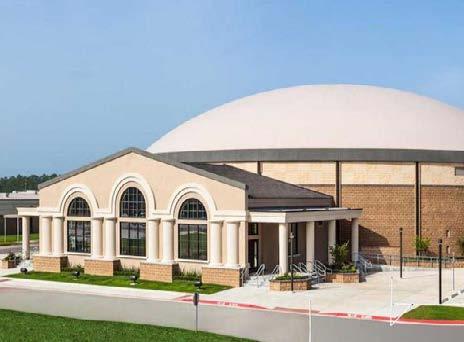
WHAT?
• 200 mph-rated safe room with 1,145 occupant capacity
• Dual purpose resilience and community center
• Used an average of four times per week for community events during blue-sky days
HOW?
• Funded through FEMA grant and community match
Emergency Services
Hurricane/Tornado Resistant Community Storm Shelter or Safe Room
Municipal Services Annex (Law Enforcement, Building Department, Public Works, etc.)
Evacuation Site for Public Works Vehicle Fleet
Public Emergency Back-Up Power (ClimateControlled Recovery Shelter)
LSU Ag Master Gardener Community Garden Public Communications and Charging Hub
Home School Meetings Food Drive Site
Playground Training and Workshops
Disaster Recovery Center and Resource Site (FEMA, Insurance, Contractors)
Food/Supply Distribution Center (Red Cross, VOADs)
Splash Pad and/or Pool Gym Facility Medical Clinic (Temporary or Permanent)
Skate Park Walking Trail Livestock/Pet Evacuation Space
Bike Trail Stocked Fishing Pond
Learning/Training (Construction Rebuilding, Tool Loan Out, etc.)
25,447 sf Monolithic Concrete Dome
Trade Shows/Conference Space
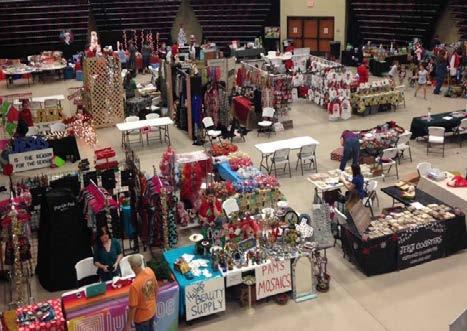
Innovative ways to connect citizens in a disaster.
Construction of New Facility
Use of Existing Facility
Special Flood Hazard Area
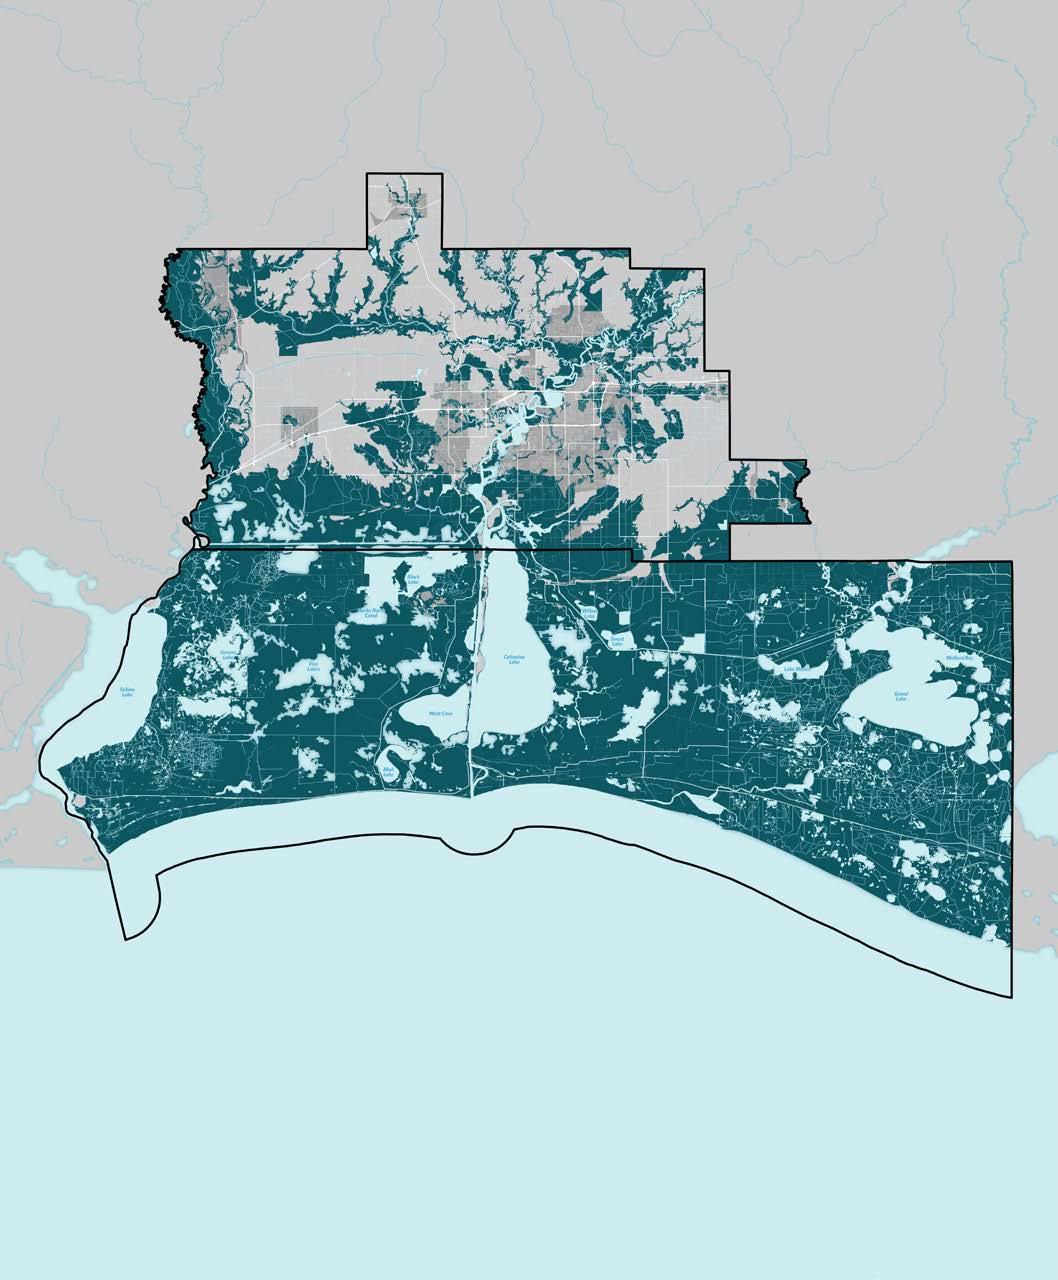
Retrofit and harden an existing facility
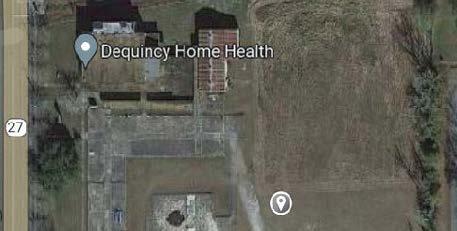
Location: S. Grand Avenue at Old School Site
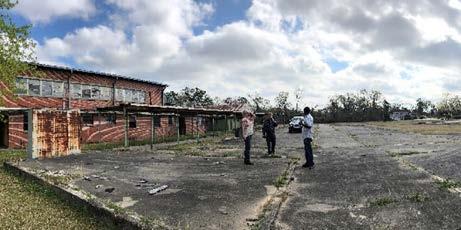
Approx. Address: 510 LA-27
Property Type: Vacant Lot
Ownership: Public
This vacant site is located within walking distance of residential homes. It is large enough to house a small to medium size facility suitable for drive-thru distribution lines. The facility can be a storm shelter for residents who cannot evacuate during hurricane events and long-term sheltering. Playgrounds, sports facilities, community gardens, and the incorporation of the areas logging history are all recommended.
There are two options for creating a Community Resilience Hub Build a new facilityIowa Lake Charles Moss Bluff Starks Vinton Carlyss Sulphur Westlake Hackberry Cameron Grand Chenier Creole Grand Lake/Big Lake Holly Beach Bell City Hayes DeQuincy Goosport Sweetlake
Location: West Street & I-10 Off Ramp
Approx. Address: 1905 West Street
Property Type: Vacant Lot
Ownership: Unknown
This vacant site is located next to Vinton High School and near a major roadway that connects to the interstate. A small to medium facility could be used as a storm shelter for the school and would be ideal as a distribution site during disasters, due to its proximity to I-10.
Location: Beglis Parkway & Carr Lane at WW Lewis Middle School
Approx. Address: 1600 Carr Lane
Property Type: Vacant Lot
Ownership: Public
This vacant site is located next to WW Louis Middle School, residential homes, and a former grocery store that was recently acquired for local emergency services. A medium to large facility could be used as a school and neighborhood storm shelter and could serve as a public facility during disasters. The facility could also coordinate with the recently required emergency services building.
Location: Corner of Park Road & Moss Bluff
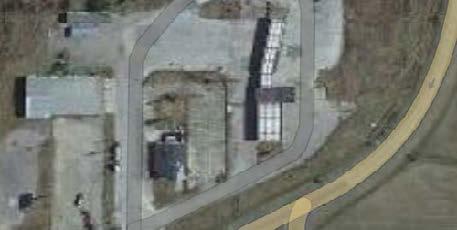
Middle School entrance
Approx. Address: 470 Park Road
Property Type: Vacant Lot North of Moss Bluff Middle School
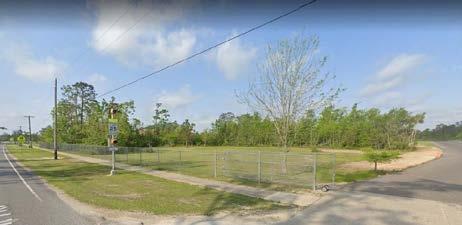
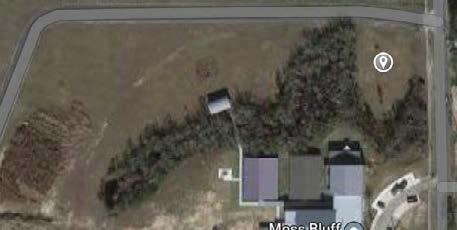
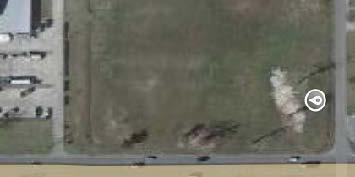
Ownership: Public
This vacant site is located next to Moss Bluff Middle School, residential homes, and an outdoor sports complex. A medium to large facility could be used as a school and neighborhood storm shelter and could serve as a public facility during disasters. The facility could be used for indoor sports use for the school or sports complex.
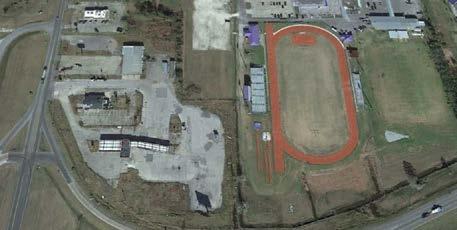
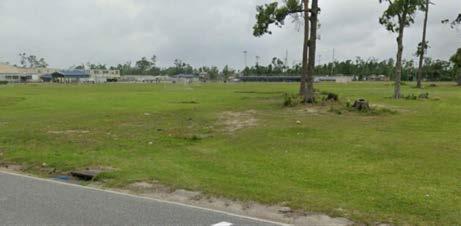
Location: Opelousas & N. Cherry Street
Approx. Address: 380 N. Cherry Street
Property Type: Vacant Lot
Ownership: Unknown
This vacant site is located within walking distance to residential homes, a health clinic, community garden, and elementary school, and is large enough to house a medium size facility that is suitable for drive-thru distribution lines. The facility can be used as a storm shelter for the school and for residents who cannot evacuate during hurricane events, and long-term sheltering.
Location: Building
Approx. Address: 800 Calcasieu Road
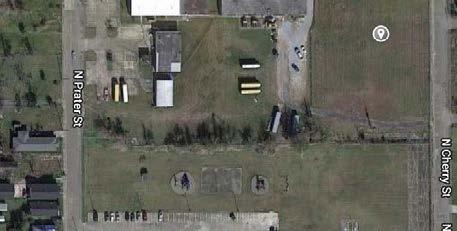
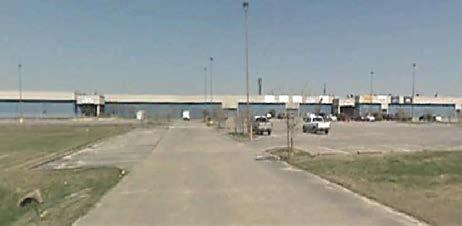
Property Type: Existing Structure
Ownership: Public
This existing facility may be wind hardened to ensure continuous operation of the building during and after storm events. The facility and driveway is large enough for public food and supply distribution and ideal to host disaster recovery resources, such as FEMA, Red Cross, and VOAD services.
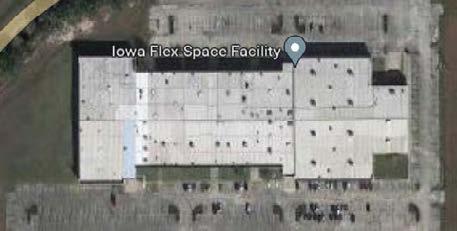
Location: Highway 14 & Alabama Avenue next to the Library
Approx. Address: 7712 Perier Street
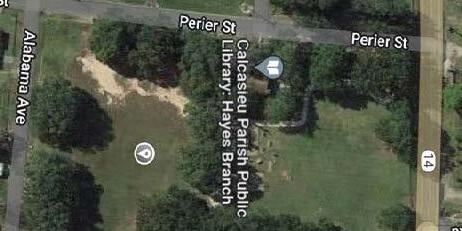
Property Type: Vacant Lot
Ownership: Public
This vacant site is located next to the community library and park, and is within walking distance to residential homes. A small facility could be used for sheltering and disaster use, as well as a recreation/ community center that connects to the local park and library.
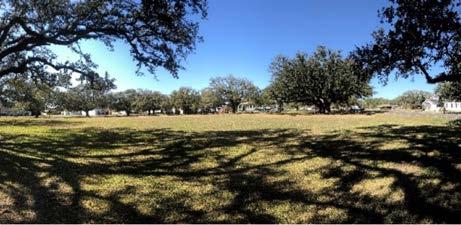
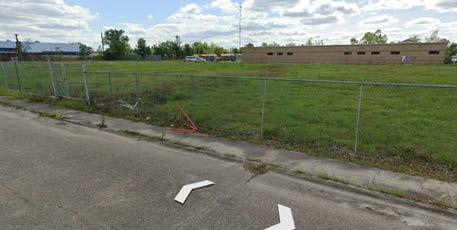
Location: Hackberry Community Center
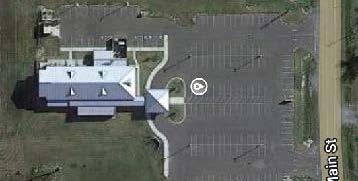
Approx. Address: 986 Main Street
Property Type: Existing Structure
Ownership: Public
This existing facility is ideal to serve the west side of Cameron Parish. While this facility performed well during Hurricane Laura, it is only recommended as a shortterm solution for a resilience hub until a new facility elevated above Category 5 storm surge can be complete.
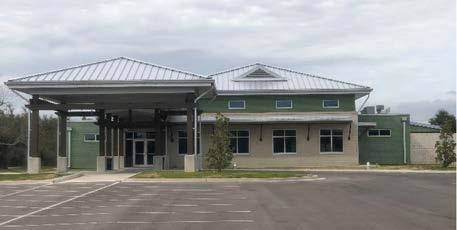
Location: Corner of LeBoeuf Road & Fournerat Road
Approx. Address: 191 LeBoeuf Road
Property Type: Vacant Lot
Ownership: Private, Sweet Lake Land & Oil
This vacant site is ideal for a medium to large facility to serve the eastern side of Cameron Parish. Since this facility is in a coastal area, it is not recommended for residents to shelter during hurricanes, but can be used for other evacuation and disaster uses. Playground and bike paths could replace damaged community recreation assets and no sidewalk.
Potential Partners
• Calcasieu and Cameron parishes
• Cities and towns
• Service providers, non-profits, and foundations
• Calcasieu and Cameron Councils on Aging
• Existing recreational districts
Potential Funding Sources
• FEMA Grant Funding
– Hazard Mitigation Grant Funding
– Building Resilient Infrastructure and Communities (BRIC)
• Other Grant Funding
– USDA Community Facilities Direct Loan and Grant Program
– Land and Water Commission Fund
– Recreation Economy for Rural Communities
• State Funding — LA Restore Program
– Resilient Communities Infrastructure Program ($50 million)
– Hometown Revitalization Program ($75 million)
• Local Funding
– Industry donations
– Taxpayer approved bonds
I would use a resilience hub during and after a disaster.
I would use a resilience hub in my area as a community center during non-disaster times.
Economic Impact and Return on Investment
Resilience hub facilities have great potential to generate revenue for the community.
There are many examples throughout the United States. Resilience hub spaces can provide shortterm rentals for various uses, such as weddings, social gatherings, summer camps, youth dance classes, and conferences or meetings. Portions of the building can also be used to house long-term community services, such as health clinics or a police annex.
It is important to mention that some grant funding sources may restrict the types of blue-sky day uses and the revenue it generates. Typically, the revenue and services must benefit the local entity that owns the building, which can be used to cover operating costs and facility maintenance.
To increase a community’s chances of receiving grant funding, Resilience hubs should be designed to encompass multiple uses that are not currently being met. This should include both emergency and non-emergency uses.
Several of the Resilience hub sites are located next to schools and could be utilized by the school district. During extreme weather events, the facility could be used for sheltering students and residents in the area. The facility could be designed as a theater or athletic arena to host school functions.
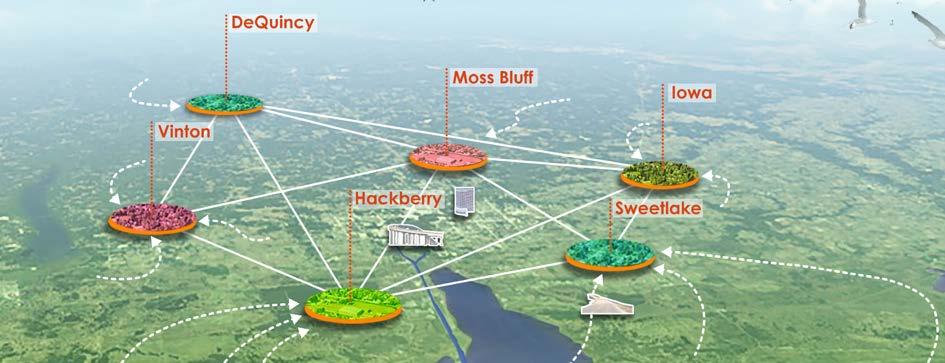
More storms are inevitable — let’s get prepared and have a plan!
Identify what resources and facilities already exist, where publicly owned land exists outside of the Special Flood Hazard Area, and plan for customized, targeted hubs
Identify strategic locations for hubs in areas of minimal flood risk and particularly in areas of need. Identified communities include: Sweetlake, Hackberry, Hayes, Goosport,
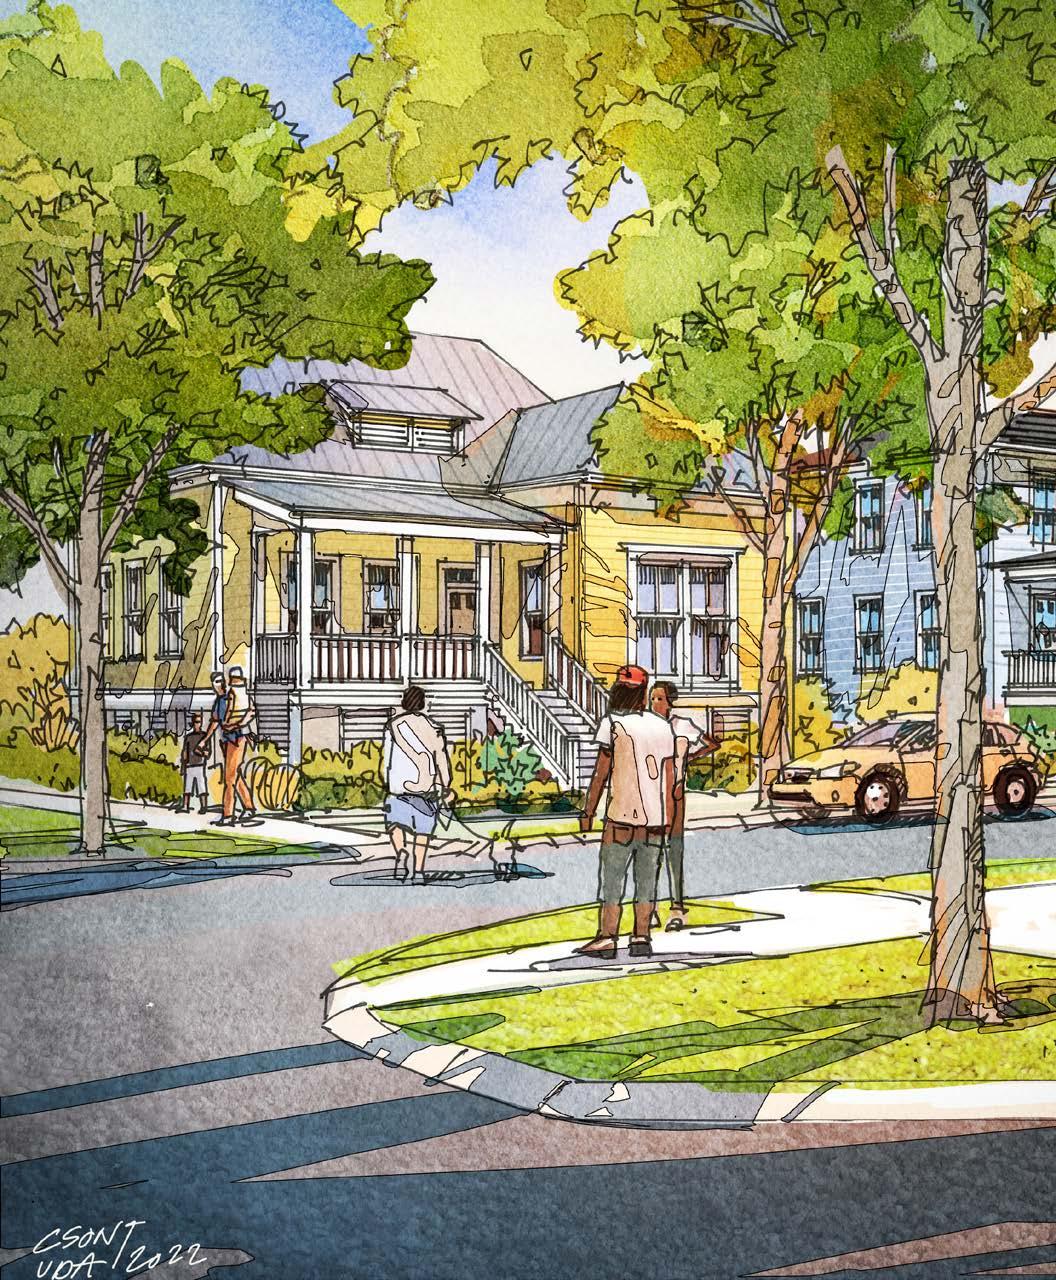
Safer housing is a critical issue for this region. An easy to use guide can help.
The Resilient Housing for SWLA project seeks to expand resilient and affordable housing for the region. One element of the project is a toolkit with practical strategies to help homeowners, builders, and organizations build new homes and retrofit existing homes that are stronger and safer against future storms. There are many resources for builders and homeowners who are building or rebuilding in the region, but they are often long and technical, requiring a high level of understanding about building and retrofitting. The Resilient Housing toolkit focuses on being accessible, while directing people to more detailed resources to learn more. The toolkit also includes a wider look at regional housing challenges, including strategies to mitigate flood insurance costs, the idea of middle neighborhoods and how to support neighborhoods before they begin to decline, and different types of housing to provide more choic-
HIGH priority
1–10 years
$200K Per House
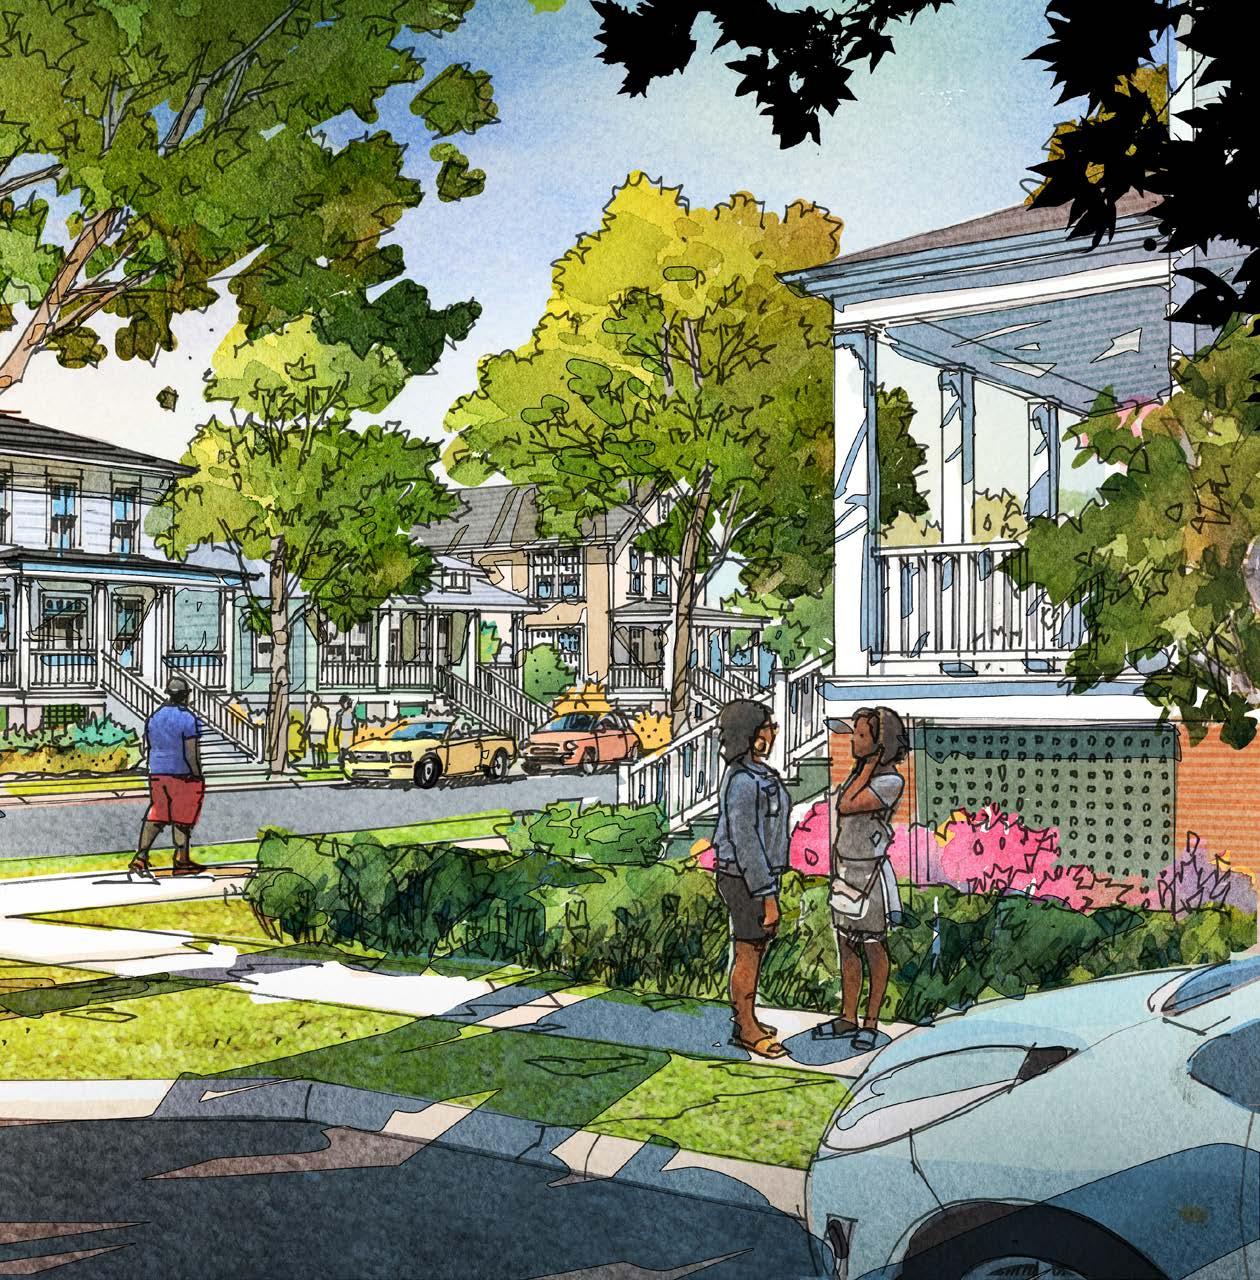
Securing flood insurance and sometimes even homeowners insurance is getting more and more challenging and premiums are rising. Some of the tools in the Resilient Housing for SWLA toolkit may help save money on flood insurance premiums, but all the techniques can be used to help make homes safer.
In Cameron Parish, homes may need to be raised up higher and built with even stronger wind resistance. Resilient Housing for SWLA can help people understand why certain foundation types can help keep their home and the whole community safer and how to use these tools together to make homes stronger and safer against future storms.
es than larger single family detached homes on individual lots.
The Resilient Housing for SWLA project has three parts, the printing and distribution of the guide; the idea of a demonstration project, a neighborhood where people can see strategies from the toolkit in action; and long-term uptake and use of the toolkit. A potential demonstration site is located at Fitzenreiter Road and Pear Street, owned by the affordable housing non-profit Project Build A Future.
• Residents are facing the high cost of flood insurance, rising sale prices and rents, and insufficient practices in rebuilding post-disaster.
• Flood insurance is a significant cost to homeowners, a significant barrier to home ownership, and homeowners need to understand which decisions can impact flood insurance premiums under FEMA’s Risk Rating 2.0.
• How we repair our homes and how we build can make a significant impact on the health of the region.
The toolkit is broken into three parts, New Construction, Retrofitting, and Resources.
New construction starts with how to select the best site for a new home, focusing on the base flood elevation , design flood elevation , how far a home may be from a flooding source, and the development rules in place around the home. It then goes into different ways to get housing, including a list of common questions to ask your contrac-
Manufactured Housing
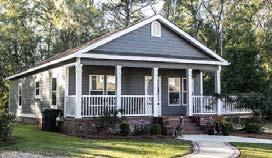
Manufactured houses are also built in a factory away from the site, but they are not regulated by the IRC like traditional site built construction or modular construction. They have to be at least 320 square feet with a permanent chassis to make sure they can be transported when they’re first built,
hire sub-contractors on the project?
• What sort of written warranty will the contractor give?
• How will the project be supervised?
• What will the payment schedule be?
• Will the contractor get all the needed building permits?
• Who will coordinate the required inspections as part of the building permit process?
• Will the contractor provide a written lien waiver at the end of the project?
Modular Construction
Modular construction means that pieces of a building are built away from your building site, then delivered to the site and put together. The rules to build it are set by the International Residential Code (IRC), just like traditional site built construction.
• Why modular?: It can provide more certainty. The schedule and how the parts fit together can be easily predicted. This makes modular a great choice for someone building a lot of houses.
tor, and a primer on modular and manufactured housing. Beyond that, it talks about the design of the housing itself, from the massing to the details to other types of housing beyond detached single family homes. The retrofitting section focuses on existing homes, what to do immediately after a storm, and measures that people can take to strengthen their homes before the next storm. Resources begin to look at housing challenges through a wider lens, including how to pay less for flood insurance, supporting middle neighborhoods, and sections on understanding affordability and policy.


A flood has a 1% chance of getting to this height each year. It is indicated on a community’s Flood Insurance Rate Map (FIRM).
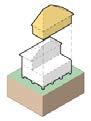
Communities choose this height in feet for themselves based on past floods, or expecting more frequent or higher levels of flooding in the future.
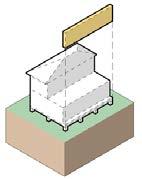
This will help residents feel prepared and have a path forward.
The Resilient Housing for SWLA project has elements that focus on community planning, housing, and economic development. It is a guide that:
• Considers community-wide strategies that make new and renovated housing safer. Some community-wide techniques in the toolkit include each of the communities choosing design flood elevations based on previous storms, understanding proximity of new development to a source of flooding, and analyzing how some foundation techniques can contribute to flooding on other properties.
• Includes tools to help support middle neighborhoods. Middle neighborhoods are where families who make median incomes with average priced homes live. They require support from a policy level in order to keep them stable and strong.
• Provides tools to make new and existing housing stronger and safer. The toolkit includes a retrofit section, specifically focused on existing houses, both right after a storm, and beyond to prepare for the next one.
• Describes types of housing that can increase the number of homes for families in new and existing neighborhoods. Increasing housing
supply is critical in the region. Providing that housing in a wide variety of scales ensures choices for families of different sizes, incomes, and preferences, while providing more access to everyone.
• Supports the development of the housing supply that is critical for local jobs, businesses, and economic development opportunities to thrive . Without a substantial increase in housing stock, new industries and employers don’t have access to top talent, and the region is unable to benefit from people living, shopping, dining, and paying taxes in the local area.
The Resilient Housing for SWLA toolkit helps make existing information more accessible in an informal and easy to understand way. One of the goals of the Resilient Housing for SWLA catalytic project is adoption by homeowners, builders, and organizations, not only to use the techniques described in the kit but to recommend it to others and share it.
The toolkit is written with property owners in mind, especially the sections on retrofitting and resources. The retrofitting section focuses on small steps that can be taken before the next storm or during clean-up. It gives homeowners a starting line so they can feel empowered with access to information that is often overwhelming in the face of recent disaster.
One of the most important sections for homeowners includes a checklist of questions to ask a builder or contractor. Having an easy checklist of what to ask helps an owner take control of the resilient future of their home.
Another critical spread is in the resources section and it lays out the recent changes to the National Flood Insurance Program (NFIP). The changes in the program focus on a property’s unique flood risks, but there are actions that homeowners can take called mitigation credits that could reduce flood insurance premiums.
WHAT SHOULD BE DONE?
• Many houses in middle neighborhoods have one bathroom, making the homes less desirable to families in the market. Fund a half bath program (hire local architects to create standard renovation plans for the typical floor plans/house types in the neighborhood to show how 1/2 baths can be added)
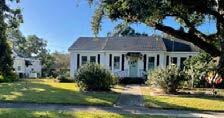
• Increase the level of city services to these neighborhoods (street maintenance & improvements, garbage pick-up, replace broken street lights, repair broken sidewalks, etc.)
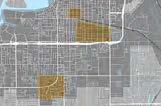
• Improve and building new highly desirable neighborhood amenities (parks, play structures, community centers, gathering spaces, neighborhoodserving retail in walking distances, access to bike and walking trails, etc.)
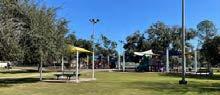
• Provide grants to neighborhood organizations to create branding and marketing to promote the neighborhoods
• Increase the number of move-in ready homes by offering grants to homeowners or developing a “rehab and ready program” through a land bank or redevelopment authority
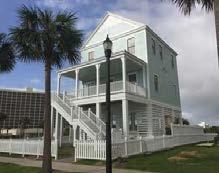
• Support organizations & program events in these neighborhoods that will both serve existing residents and attract people from outside the neighborhood
ADDRESS THREE THINGS TO HELP INCREASE HOME SALES IN MIDDLE NEIGHBORHOODS
1. Property conditions
2. School conditions
3. Safety
MIDDLE NEIGHBORHOODS IN LAKE CHARLES
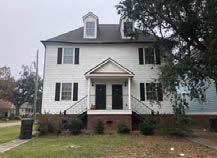
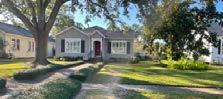
• Oak Park Neighborhood
• Edgemont Neighborhood
• University Neighborhood
The National Flood Insurance Program (NFIP) changed significantly in 2022. An important topic for the region is how to pay less for flood insurance. A resource in the toolkit breaks down what is changing and mitigation credits to pay as low a premium as possible under the new regulations.
BUILDING ON A STRONG FOUNDATION
The kind of foundation that you choose for your home can help lessen flood impact, but it can also help make flood insurance less expensive, help protect your neighbors houses, and help future building sites stay buildable. Foundations can be shallow which means that they are built on soil at the surface, or deep which means they are supported by deeper soil or rock. There are two types of foundations:
1. Open Foundations: Open foundations have piles, piers, or columns. Like the name says, they are open and allow water and smaller pieces of debris to flow through them during a flood.
2. Closed Foundations: Closed foundations have a slab on grade or walls all the way around soil or crawlspaces. During a flood, water and debris can get trapped against the walls, creating pressure that is dangerous to the house, and giving water time to wash the dirt away from the foundation.
WHAT CAN I DO?
Choose open foundations. Some closed foundations can have flood openings which can help ease the pressure of water, but debris can still get trapped, and water can wash the dirt out from under the foundation.
What’s Wrong with Slab on Grade Foundations?
When a flood happens, water goes around the mound created to protect your home, but then it impacts other homes and future building sites, making them more likely to flood.
THE DIRT DOESN’T WORK
When a flood happens, slab on grade foundations can have the ground washed out from under them. This is called undermining and can permanently damage your home.
Slab-on-Grade foundation types have become more common in southwest Louisiana. Builders and homeowners will often create a mound of earth to create a concrete slab that is above the base flood elevation. This practice has many consequences that are illustrated in the toolkit to encourage builders to use pier and beam construction.
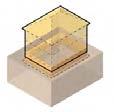
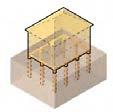
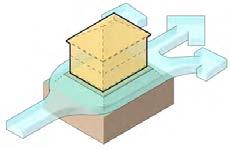
Many of the techniques in the toolkit would be executed by builders for new construction and retrofitting. The toolkit helps emphasize better techniques for building a more resilient home, from the foundation to the roof.
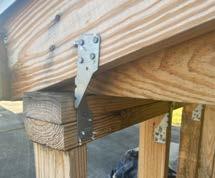
The toolkit also includes elements that look at housing in the region more broadly, beyond modifications to a single home.
• Other Types of Homes: Other types of homes focuses on choices in housing types beyond single-family detached homes on large lots. Cottage courts, small apartments made to look like a larger home, and attached townhouses are ways to create more housing in new and existing neighborhoods.
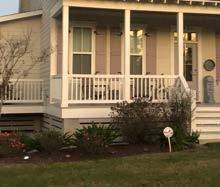
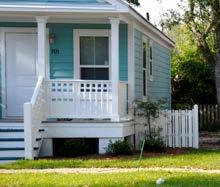
• Supporting Middle Neighborhoods: Middle neighborhoods are neighborhoods where people of middle income live. They are neighborhoods that are often strongly contextual to the area, holding much of the history and memories, but they are also often overlooked in terms of policy support. These neighborhoods often need additional support to avoid decline.
• Affordability: The affordability section helps explain what is affordable for housing in the region.
• Why Should I Care? (Policy): This section focuses on what sorts of policies individuals may want to support to help implement techniques in the toolkit.
It is approximately $18-40+/SF more expensive to construct a more resilient home. For a 1,400 SF home, that’s a $25,000-$55,000 increase over conventional construction.
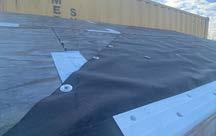
*Numbers are estimates from July 2022 and subject to change
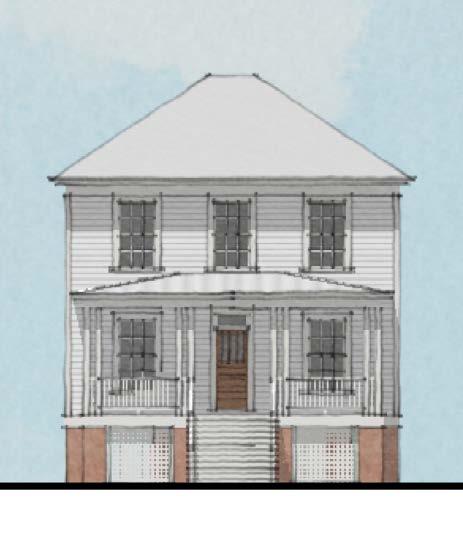
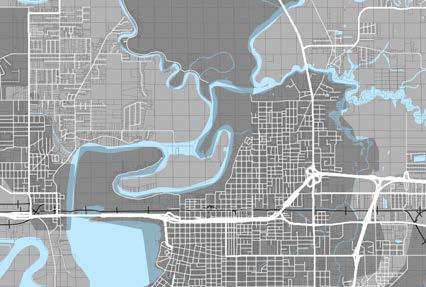
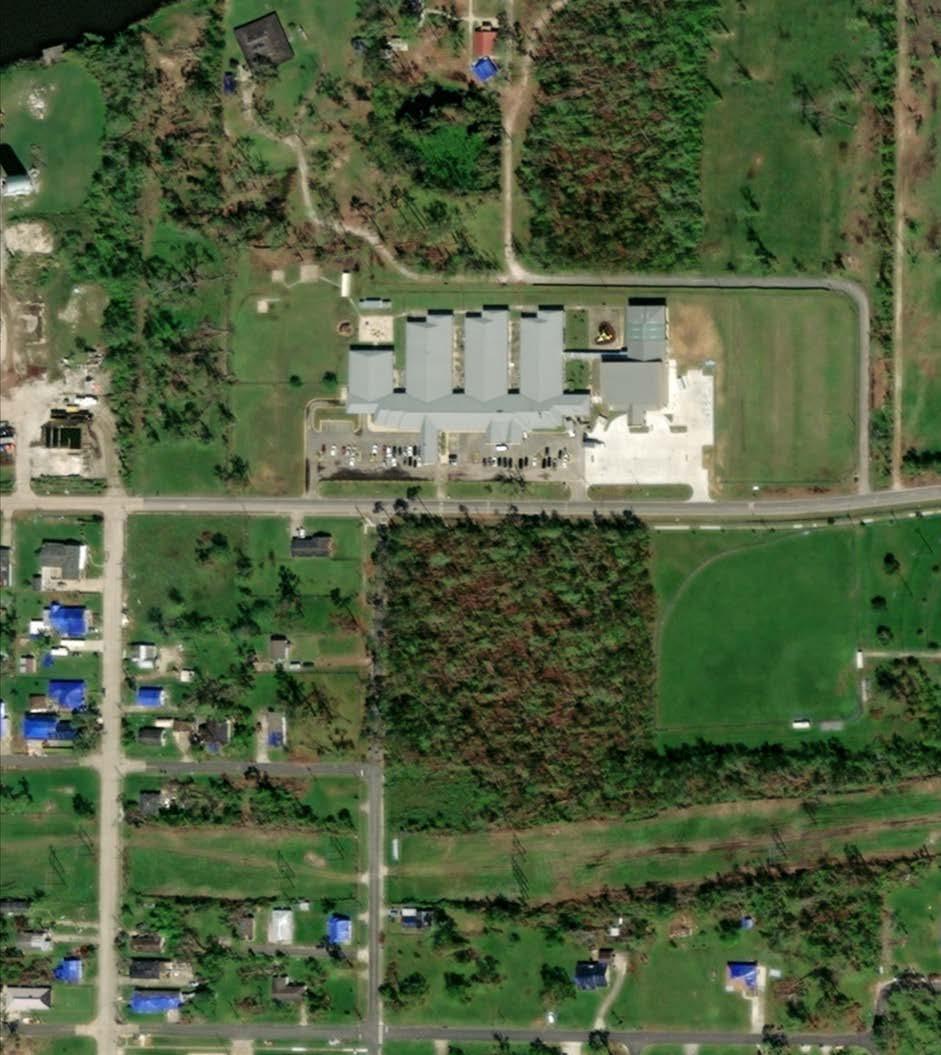
Project Build a Future owns an approximately 4.4 acre piece of property at the corner of Fitzenreiter Road and Pear Street. The site has great access to Combre-Fondel Elementary School, the Martin Luther King Junior Center, and is close to Riverside Park and Wal-Mart. While many of the lots in the surrounding neighborhood have encumbrances and may be tied up in the adjudication process, this parcel is developable and could increase the number of affordable homeowners in the area. In order to make the development viable and to maximize the number of homes, new roads and utilities would need to be extended into the site. Partnership and gap funding are necessary to subsidize the infrastructure costs as well as increased costs to build the houses to a higher standard of resiliency.
One potential idea for the property would be a demonstration project. Approximately 21 new homes would be built using strategies from the Resilient Housing for SWLA toolkit. This would include elevating the homes using pier and beam foundations, using flood damage resistant materials, and securing the roof to the studs for maximum resistance against high winds. While these improvements increase the resilience of the homes, they also increase construction costs. Partners and sources of subsidies will be needed to keep the homes affordable, while ensuring they are flood damage and wind-resistant.
WHAT?
• 120 new resilient rental homes in Galveston, TX
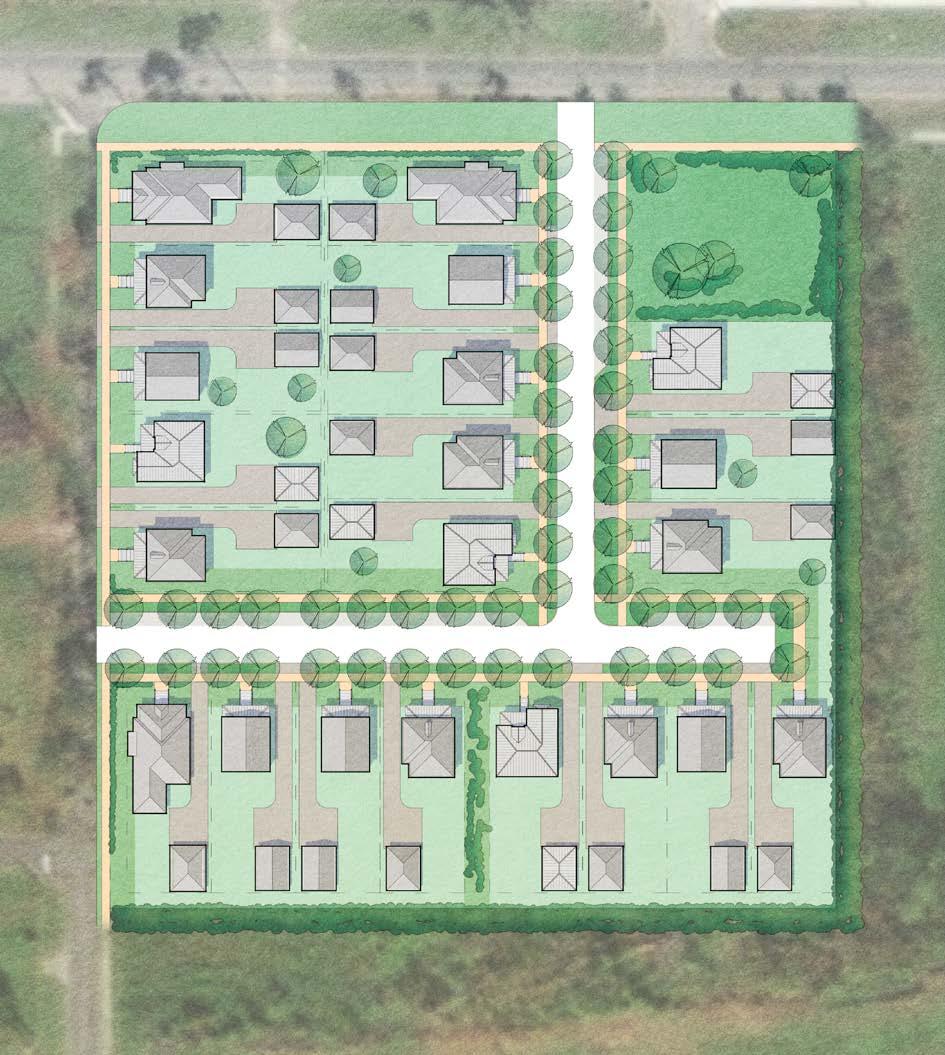
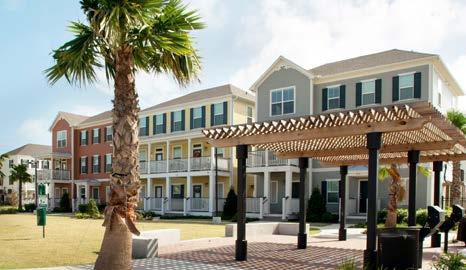
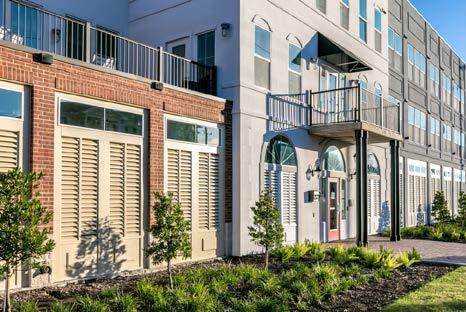
• Different kinds of homes to fit into the surrounding neighborhood
• All homes are raised a full story with parking and access on the ground floor
HOW?
• Funded through state recovery funding, FEMA funding, and Low Income Housing Tax Credits (LIHTC).
• 51% of the homes are affordable to a range of incomes, and 49% are at market rate rent.
WHAT?
• 160 new resilient rental homes in Galveston, TX
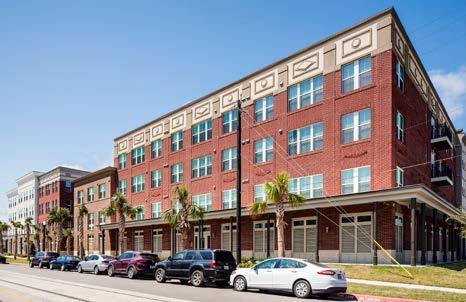
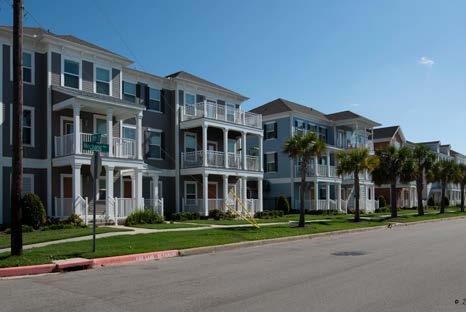
• Different kinds of homes to fit into Downtown Galveston
• All homes are raised a full story with parking and access on the ground floor
HOW?
• Funded through state recovery funding, FEMA funding, and Low Income Housing Tax Credits (LIHTC).
• 51% of the homes are affordable to a range of incomes, and 49% are at market rate rent.
The cost of housing of any kind is increasing all over the region. Affordable housing non-profits like Project Build a Future struggle with gaps in funding to provide quality housing. Adding additional resiliency measures to the construction increases that gap.
• +/- $205,000 is the cost to build a Project Build a Future 3-bedroom, 2-bath home with no profit margin.
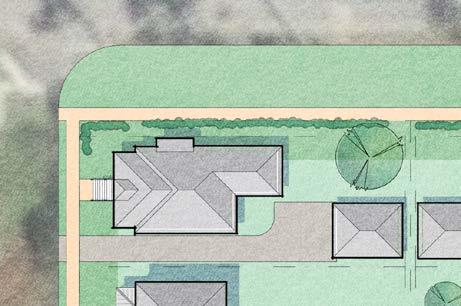
• +/- $150,000 is the target cost to sell the home as a first home purchase for a family.
• +/- $55,000 is the typical gap between the cost to build the home and the price that a family is able to pay.
Additional resiliency measures including:
• Pier and beam foundations
• Flood damage resistant materials
• Secondary water barrier
• Roof to foundation connections for wind resistance
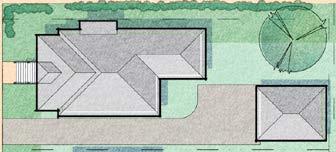
And other factors, like additional windows and front porches to encourage a neighborly streetscape, will further increase construction costs by another $55,000. That would mean that for each home, the support of partners would be needed to close a gap of $110,000 per home. This does not include the cost of infrastructure improvements to develop the site and each lot.
The proposed plan diverges from the existing Residential District zoning related to front and rear setbacks. Rather than pursue variances, a project of this scale could go through the Planned Unit Development (PUD) to create a specific neighborhood plan and subdivide the lots for these 20+ houses. The planned unit development should include neighborly streets, urban setbacks with space for front porches, and rear yards. The recommended dimensions include:
• Front Setback: 15’ A 15-foot setback that allows for encroachment of a porch and access stair helps create a consistent street wall and provides ample space in the backyard for families.
• Rear Setback: 5’ Reducing the rear setback to 5 feet (for garages or carports only) helps maintain usable backyard space.
The Fitzenreiter Road site would require infrastructure for development, including new streets, water, and sewer lines. Beyond the basic infrastructure needs, the demonstration project could show best practices for better stormwater management techniques in the street, like tree trenches with subsurface drainage rock, and in a small stormwater management pocket park.
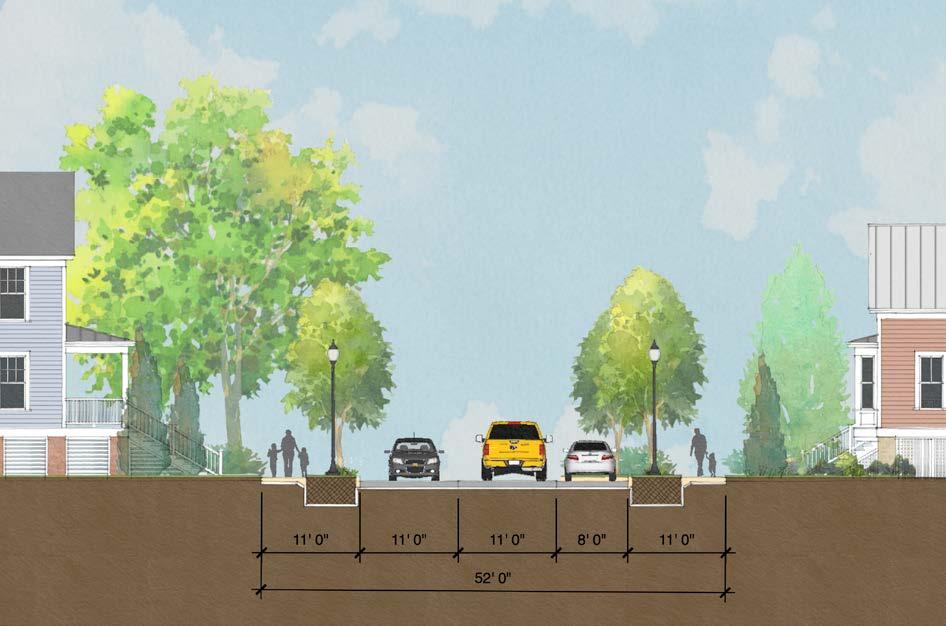
An important future infrastructure consideration for the Fitzenreiter Road site is a potential extension of Enterprise Boulevard. Because Enterprise Boulevard has a larger Right-of-Way than Fitzenreiter Road, it is likely that the site would be impacted. A larger street would also necessitate modifying the conceptual site plan to address the new character of the proposed street.
The Fitzenreiter Road site was tested as a potential demonstration project, but other or multiple locations in the region could also fill the role of a demonstration site. While each area may have unique constraints regarding zoning and infrastructure needs, the gap remains between the cost of building a home and what a first-time homebuyer can afford to pay.
*Numbers are estimates from May 2022 and subject to change
The Resilient Housing for SWLA project has three goals, printing and distributing the toolkit in the short term, funding and implementing a demonstration project at Fitzenreiter Road and Pear Street, and using the toolkit to build new and repair existing homes over the long term.
The Resilient Housing for SWLA toolkit is currently available online. The digital resource is the easiest to share broadly, and sharing it through as many channels as possible is critical to its longterm use. Individuals, builders, and non-profit organizations may also benefit from having a printed copy. Establishing partnerships for printing copies, especially immediately following storms, would help support use and wider adoption.
Action Steps
1 Distribute and share the Resilient Housing for SWLA toolkit
2 Fund infrastructure for a demonstration pocket neighborhood on Fitzenreiter Road
3 Provide subsidy for enhanced resilience features in the demonstration neighborhood
4 Build a pocket neighborhood of ~20 single family houses that demonstrate the principles in the Resilient Housing for SWLA toolkit
5 Use the Resilient Housing for SWLA project to build infill houses, repair homes, and make housing more resilient
Individuals, builders, and organizations will use the techniques in the toolkit to build more housing that is stronger and safer. A demonstration neighborhood helps inspire new projects.
would be a huge plus to help.
Many people are at a loss when it comes to these things: how they work, what’s offered, and how to navigate in general. Having this I feel
It could be adopted into building codes as a requirement to minimize damage in future storms.
2 Fund the Infrastructure for a Demonstration Project
The first step for a viable demonstration project at Fitzenreiter Road would be infrastructure. Building the new streets and having sewer and water infrastructure in place allows for sitework to begin on the lots themselves. The funding gap for each house does not include infrastructure costs, so having the infrastructure in place is crucial to the success of the project.
3 Subsidize Enhanced Resilience Features for the Demonstration Project
The demonstration project would require the support of partners to close the gap between the cost of construction and what would be affordable for homeowners to pay. The cost of construction would increase from the typical baseline with additional resilient features, but the increased resilient features would be essential to the successful demonstration.
4 Build a Pocket Neighborhood Demonstration Project
The next step would be constructing the houses with the techniques in the Toolkit. The construction itself could be used as a learning lab for area builders to come and see the resilient construction in action.
5 Use the Resilient Housing for SWLA project to build infill houses, repair homes, and make housing more resilient
As uptake of the toolkit continues to grow, people could be encouraged to use the techniques for retrofitting their homes to be stronger and safer. Following storms, it could be a priority to send the toolkit around, digitally and printed, to give access to as many people as possible.
than 50% are considered severely housing burdened.
• To qualify for subsidized affordable housing a family of four would need to make $38,820 or less.
WHAT CAN AN AVERAGE FAMILY IN SWLA AFFORD TO RENT?
THE AVERAGE RENTS IN CALCASIEU & CAMERON PARISHES ARE:
• $702 for a studio apartment
• $732 for a 1-bedroom apartment
• $941 for a 2-bedroom apartment
• $1,178 for a 3-bedroom apartment
• $1,321 for a 4-bedroom apartment
MAKING A PLAN
WHAT CAN AN AVERAGE FAMILY IN SWLA AFFORD TO BUY?
1. The average family makes $51,547 and can afford to spend $1,200/mo. in total housing costs.
2. The median home listed for sale in January 2022 is $225,000 in Calcasieu Parish and $325,000 in Cameron Parish.
3. The average family that lives in Calcasieu & Cameron parishes cannot afford to purchase the average home, unless they can make 25% (or greater) down payment
A HOME THAT COSTS $128,000-$170,000.
It costs $XXX,XXX to build a new 3- bedroom house. Families with children might have a hard time affording rent.
After listening to over 2,000 people, the #1 thing that people wanted for housing was to see more affordable housing for families of all incomes. That doesn’t just happen. A policy is a course of action; a plan saying how we get to the things we imagine. For more houses to be available, affordable, and accessible, you can support policies that:
• Allow More Housing to be Built
Make it faster and easier to build with faster permit review
Allow for more housing in existing neighborhoods like duplexes and small apartment buildings.
• Stabilize Existing Neighborhoods
– Improve public services in neighborhoods that need investment
– Limit how much rent goes up each year
• Subsidize Housing Cost for Those Who Need It
– Prevent discrimination against people with housing vouchers
– Require that some affordable housing be built in projects of a certain size, or that are in a good location.
• Build Safer, Longer
– Have each community look at a Design Flood Elevation regularly on what floods have done in the past, and how things are changing.
Enforce building codes
There are many more policy ideas in the Just Imagine SWLA Policy Guide.
WHY WOULD I SUPPORT STRICTER RULES FOR BUILDING HIGHER AND STRONGER?
1. Building a house that can stand up against storms can be less expensive in the future.
2. If your house is damaged in the future, insurance will cover things required by codes. If more resilient standards aren’t required, homeowners would have to pick up the cost themselves.
SO, WHAT CAN I DO?
• Support rules to help everyone build safer like
– Design Flood Elevation
– Wind Rating – Building Codes
– Stormwater retention
– Limits on building mounds to build slab-on-grade
The Resilient Housing for SWLA toolkit includes strategies for preserving middle neighborhoods, those where middle and workingclass families live that are not currently growing, but need support so to prevent decline.
Potential Partners
• State of Louisiana OCD
• Louisiana Housing Corporation (LHC)
• City of Lake Charles
• Project Build a Future
• Churches and non-profits that build housing
• Homebuilders of SWLA
• Calcasieu and Cameron parishes
• Associated Builders and Contractors Southwest Training Center
• Mortgage lenders
• Insurance industry
• Center for Planning Excellence (CPEX)
• SBP USA (formerly St. Bernard Project)
Potential Funding Sources
• City of Lake Charles CDBG and HOME allocations
• LHC — CHDO Annual Awards Program (CHAAP)
• LHC — CHDO Single Acquisition Rehabilitation (CSAR) Program
• LHC — Homeownership assistance
• Philanthropy
• Bank CRA & CDFI funding
• Restore LA — Homeowner Assistance Program
• State Capital Outlay budget
• LA DOTD Safe Routes to Public Places (LA Complete Streets Program)
• Infrastructure Investment and Jobs Act (IIJA) competitive grants
• NEA Creative Placemaking grants
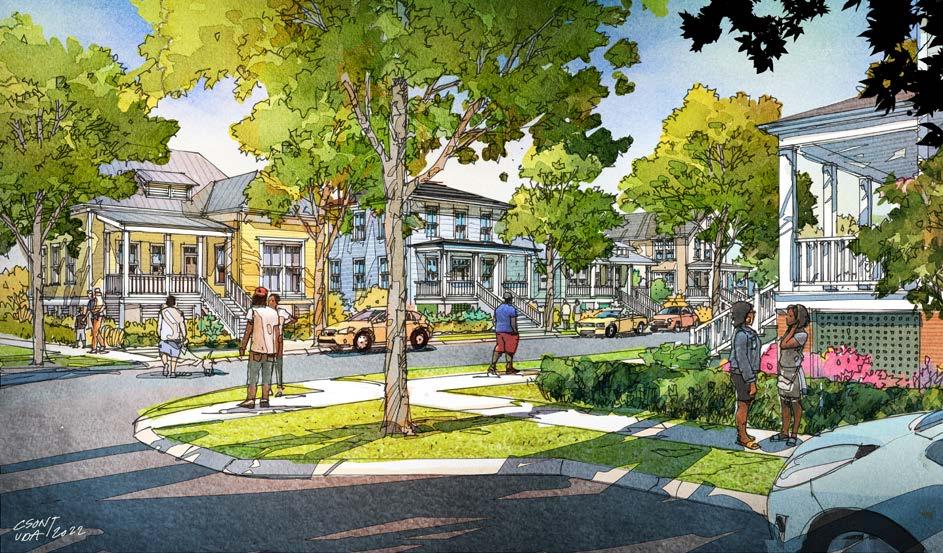
Printing and distribution of the Resilient Housing Toolkit
•
Fund and build sustainable infrastructure where needed for demonstration projects and resilient, affordable infill housing
$150 to $300 per linear foot of new or improved infrastructure (streets, utilities, drainage, etc.)
1–5 years
• State Capital Outlay budget
• LA DOTD Safe Routes to Public Places (LA Complete Streets Program)
• Infrastructure Investment and Jobs Act (IIJA) competitive grants
• NEA Creative Placemaking grants
Approving body (municipality or parish) for the infill housing location identified
Visit Lake Charles
LA DOTD Regional Planning and Development Commission
Build a pocket neighborhood of ~20 single family houses that demonstrate the principles in the Resilient Housing Toolkit, provide subsidy for enhanced resilience features
$200,000+ per house (structure only, assuming finished lots delivered to builders)
1–5 years
• LHC — CHAAP and CSAR programs
• HOME
• CDBG
Non-profits building affordable homeownership
Market rate builders and developers
Community Foundation SWLA OCD/LHA Municipalities and parishes
Vacant and underutilized property is an issue in both Cameron and Calcasieu parishes that can be addressed with several strategies.
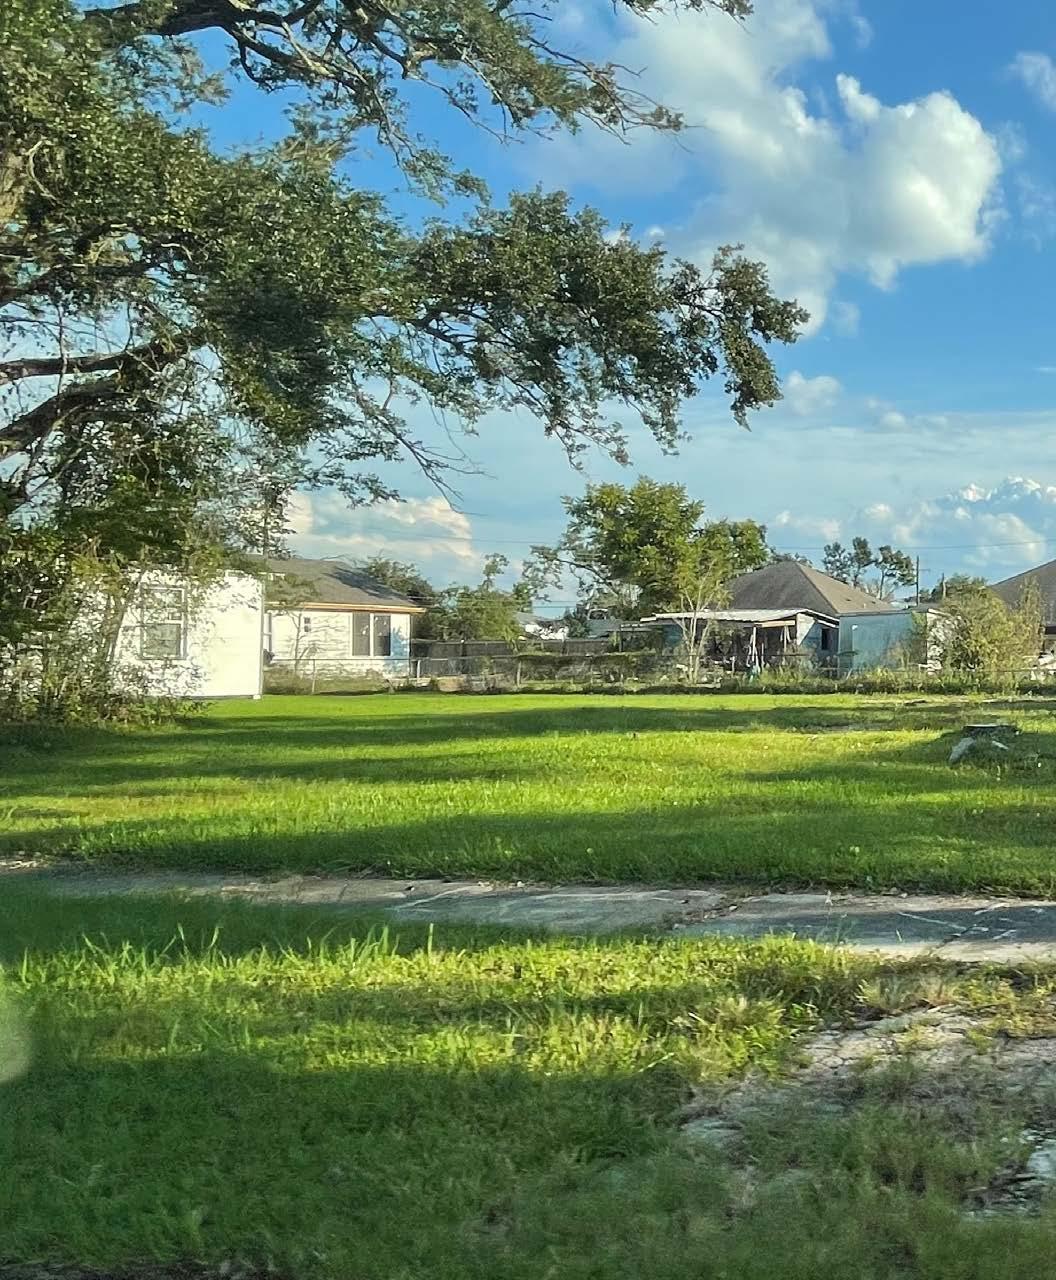
Southwest Louisiana has been having an extended conversation about how to best address vacant, underutilized, and adjudicated property. There is a concentration of 670+ adjudicated and vacant properties in the North Lake Charles area and along the I-10 corridor.
Beyond those 670 adjudicated properties, other properties are vacant, underutilized, or not contributing to community stability.
The priority of the City of Lake Charles is to prevent properties from becoming abandoned, adjudicated, or underutilized in the first place and to facilitate the redemption of adjudicated property and lots by the heirs and owners when possible. It should be important that individuals and families in North Lake Charles be provided the tools and support to facilitate that transfer
HIGH priority 10 Years
$2 Million / Year
I like the idea of there being someone assigned to focus on improving the many abandoned, vacant and dilapidated buildings, lots and properties.
There are 670+ adjudicated properties in the North Lake Charles area alone on the I-10 corridor, in addition to others throughout the parish. These properties require maintenance at an annual expense to Lake Charles and the rest of the parish.
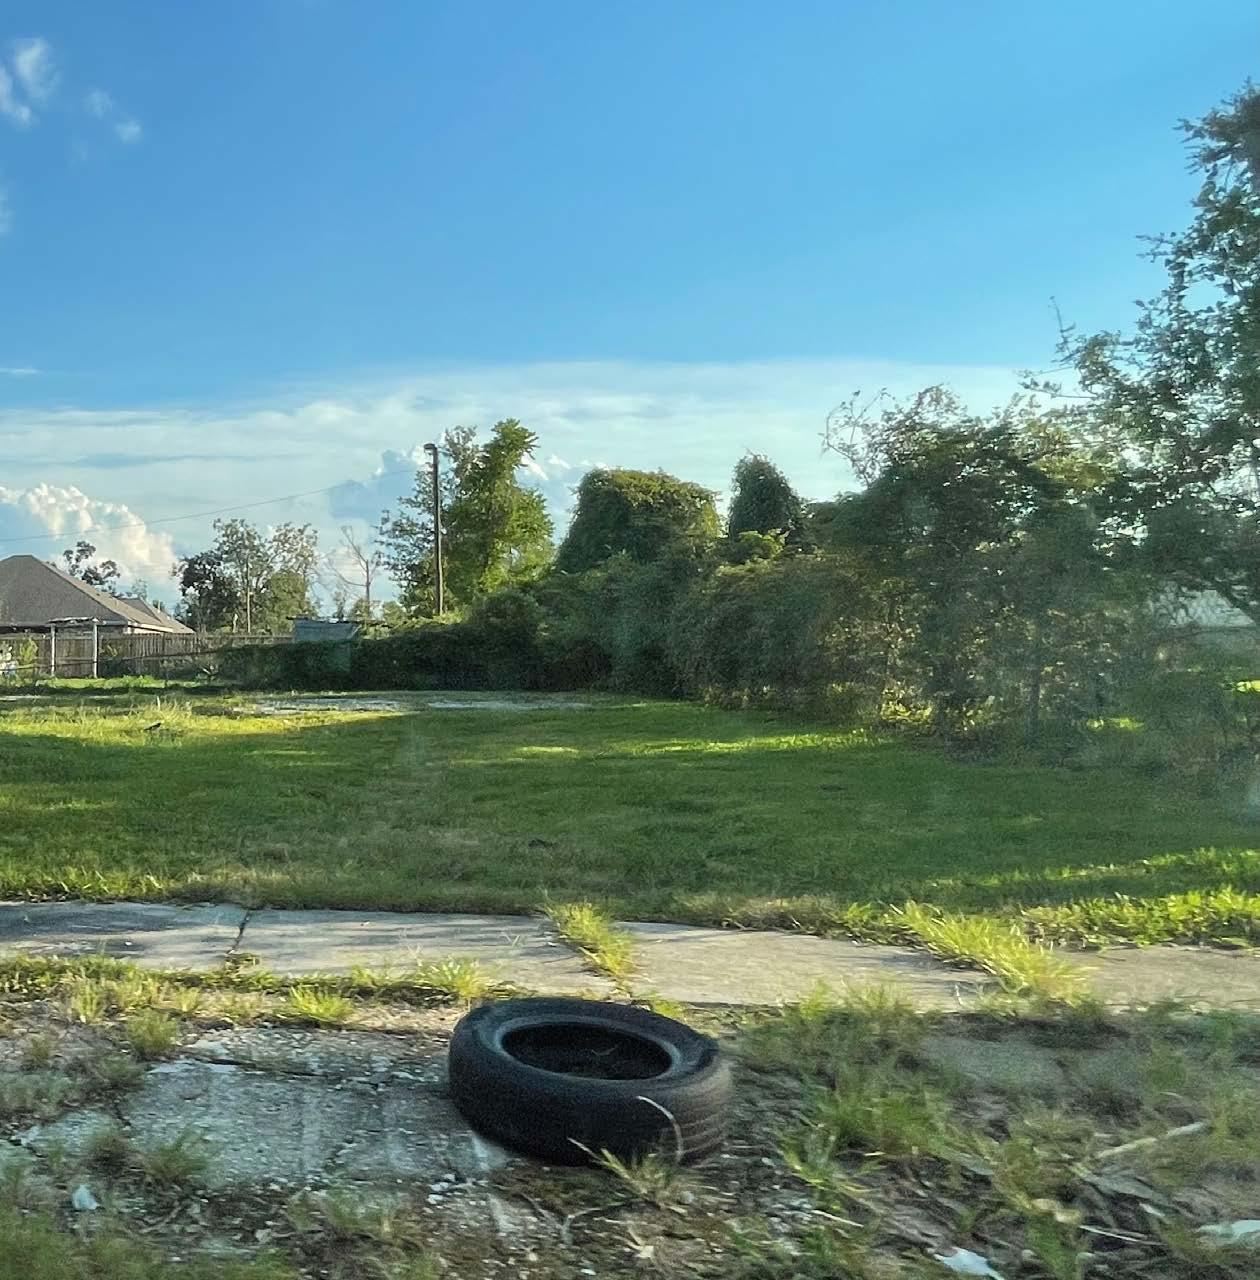
Migration away from Cameron Parish following storm events means that properties are often left vacant and/or underutilized. Strategies for addressing these properties is critical to giving Camerson Parish tools to use land strategically into the future.
1. To move vacant and underutilized property into productive uses (such as housing, community-serving retail, green space, etc.)
2. To prevent at-risk properties from becoming adjudicated through private sales, estate planning, and working closely with current owners
3. To create a strategic approach that
– Addresses the “low-hanging fruit” of adjudicated properties to obtain warranty or non-warranty deeds
– Categorizes properties by the risk level (based on the year the property was adjudicated, the number of potential owners/interested parties, and redevelopment potential)
– Considers strategic locations, adjacencies, and potential for redevelopment
4. To explore creative solutions for properties that have more encumbrances and may not be able to achieve a clear title (see possible solutions listed under #6 in the list of functions below)
of property between generations. The first effort must be to create a standing estate planning and succession program made up of volunteer and pro-bono attorneys that can educate the public on the importance of estate planning and assist in proceedings after the owner(s) have passed away. Ideally, this will ensure more family properties have clear title and are owned by rightful, responsible heirs. Direct discussions with heirs may result in possible solutions such as curing the liens or identifying owners who are interested in selling their properties. Only after employing these preventative strategies should the City and Parish pursue strategies to address property that is still adjudicated or underutilized.
Dedicated staff is needed to keep detailed records of these properties, follow due process in the adjudication process, and move the issue forward with measurable progress.
An entity is needed to strategically hold and assemble land, clear title issues on adjudicated (tax delinquent) properties and help implement redevelopment projects that contribute to community needs (such as housing).
Citizens and stakeholders verified that this is a critical issue for the economic health of SWLA.
• Addressing vacant and underutilized property is a high priority project in the Just Imagine plan.
• Over 90% of people indicated that this project would benefit SWLA.
• There is widespread support across both parishes. Adjudicated property and the condition of the I-10 corridor were identified as a top challenge by people who live across Calcasieu and Cameron parishes because it affects the willingness of new residents and businesses to invest in the region.
I think this project will benefit SWLA.
1. Overturn federal precedent (Mennonite Bd. of Missions v. Adams : 462 US 791 (1983)) to lessen the due process requirements for notices.
2. Change Louisiana state law to limit the number of generations or years that relatives qualify as interested parties (currently unlimited).
3. Work within the current legal framework and precedents to employ creative strategies and address as many properties as possible.
The following options assume working within the current legal context.
I like that the area is going to be cleaned up and the old, broken down buildings would be cleared and something useful put in its place.
1 Create and maintain a robust database of vacant or adjudicated properties, their tax status, liens, current owners, parties with interest in the property, contact information, records of notices and correspondence, and status within the legal process.
• Organize the database by the year adjudicated:
– Pre-1983 properties that don’t require due process
– Properties that became adjudicated between 1983 and 2009
– Properties that became adjudicated after 2009 up until 5 years before the current date. Case by case review is needed; a policy should be adopted prohibiting consideration of properties adjudicated within 5 years of the current date.
• Assign a risk ranking to each property (high, medium, and low)
• Create strategic bundles of properties, based on blended risks, locations, and attractiveness
2 Follow and pursue the process for obtaining clear titles and deeds.
• Adjudicated property process (especially the pre-1983 Mennonite properties)
• Final legal curative process to obtain warranty deeds for properties (where possible)
3 Strategically plan for and assemble properties for development (vacant, underutilized, and adjudicated).
• This requires staff with a strategic understanding of planning and development to explore
adjudicated properties with the most potential and pursue private acquisition real estate purchases for adjacent/strategic properties.
• Focus on one area at a time to maximize impact.
• Understand that banking certain properties is key to clearing many title issues.
4 Build relationships with local stakeholders to facilitate a smooth process.
5 Keep properties clean and green by mowing and clearing debris.
6 Establish partnerships with banks looking for CRA credits/projects and explore creative solutions.
• Negotiate with banks to finance construction of new homes and write off a certain amount of financial risk. For instance, bundle 3-4 lowrisk properties with 1-2 high-risk properties and work with banks to take on risk up to a maximum amount, while providing an exemption for the tax sale in the title.
• Explore other tools (affordable rental housing, rent-to-own, and soft second mortgages to reduce risk).
• Explore options for title companies to issue special warranty deeds. In this case, the title company becomes the lender. After 2-4 years, the title company bundles the mortgages and sells them to a mortgage company without a discount.
• Offer other, cost-efficient uses for property, such as parking, community gardens, dog parks, etc. that allow a transfer of ownership without a high risk of loss to the bank and owner.
7 Sell, donate, lease, or RFP land for development.
Build Baton Rouge was established in 2007 as the East Baton Rouge Redevelopment Authority. It was funded out of the general budget and had broad-based political support. The Authority developed a process of distributing projects and funds to council districts.
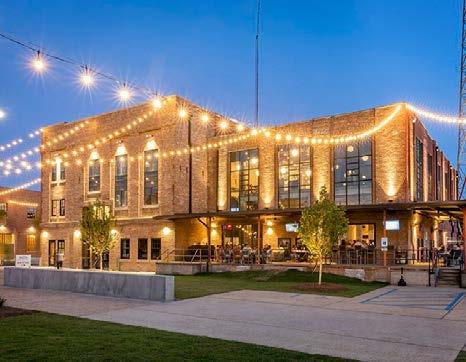
• For several years, Build Baton Rouge also housed the administration of HOPWA, HOME, CDBG, and other grant programs, which provided entitlement/funding for salaries. These programs are no longer being administered by BBR and have been moved back to the City’s Office of Community Development.
• The system for distributing the projects and funding across council districts helps to maintain political support, but conversely, it spreads the impact thinly and makes it difficult to have a visible impact in one area of the city and region.
• BBR has undergone several leadership changes in recent years and has been without a CEO since December 2021.
The Just Imagine SWLA process explored different options to address these issues. The plan lays out three possible approaches and the reasons for and against each approach. The decision on an approach must be made collaboratively by the City of Lake Charles and the other project partners based on the most effective approach that will accomplish the objectives and lessons learned from other cities in the state.
1. House these functions with dedicated staff at the City of Lake Charles
Given that most of the properties are within the City limits, and that the Lake Charles North Redevelopment Authority currently has jurisdiction over addressing these properties, the City should play a lead role in addressing vacant and underutilized properties.
• This will require a sustained funding source to fund the salaries of 1-2 experienced staff people who can devote their full-time attention to vacant and underutilized property.
• Ability to put a system in place quickly, without having to establish a new entity in the state legislation.
• Alignment and close coordination with the administration and the staff carrying out the functions.
• Cost-effective solution for short term.
Target areas where there is a concentration of adjudicated, abandoned, or underutilized properties
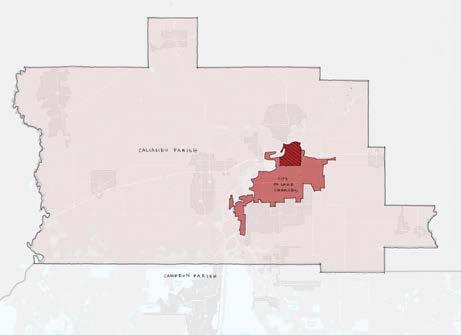
• There is currently a staff position at Calcasieu Parish that is responsible for tracking and addressing all adjudicated property in the parish, except for properties in the Lake Charles North Redevelopment Authority boundary. The Parish’s purview overlaps with the City’s jurisdiction outside of the Lake Charles North Redevelopment Authority boundary. City and Parish administrations should coordinate to determine whether all positions are needed and to ensure there is no duplication and that roles are clear and complementary. Once all staff positions are filled, the experts at the City and Parish will need to work closely together in a coordinated manner.
• The City should ramp up code enforcement as a tool to get the attention of owners of at-risk properties, by adding the liens assessed to maintain properties to tax bills. The fines and fees generated through code enforcement should be allocated back to funding the general operations.
• This works well as a short-term structure, but support may change with a change in mayoral administration and council terms.
• The staff positions could be subject to budget restrictions and re-structuring within City departments.
• Because the land would remain in public ownership, it would not be eligible for acquisitive prescription and would remain encumbered (without a warranty deed) without additional legal curative actions.
• This does not directly benefit the Parish or other cities in the Parish, where there are vacant, underutilized and adjudicated properties although fewer than in Lake Charles.
2. Establish or repurpose a Louisiana Tax-Exempt Non-Profit (such as a land bank, community development corporation, etc.). In this approach, a 501c3 entity would be established or repurposed to be able to hold land and perform actions according to its purpose. The non-profit can develop cooperative agreements with the City and Parish to act as the land-owning entity dedicated to addressing adjudicated, vacant, and underutilized land.
• State and local government agencies cannot acquire through acquisitive prescription, which is a cleaner route to clear title for adjudicated properties. Because the land would be in non-profit ownership, it would be eligible for acquisitive prescription. The non-profit could start the clock on the 10 year period sooner, which would bring a property closer to receiving a warranty deed and making it a fully transferable and leverageable asset.
The New Orleans Redevelopment Authority (NORA) has been highly effective in developing affordable housing, commercial revitalization, land stewardship, and resilience planning. The entity was established in 1968 – it has been in existence for over 50 years and has resources, political support, and experienced staff. NORA’s successes can be contextualized by the following background.
HOW?
• NORA has political support that has persisted across many administrations.
• The non-profit must be an independent organization, distinct from the City, with a distinct board free from conflicts of interest. This is a drawback if the City wishes to have more control over this process.
• The non-profit would not qualify for Title 33 expedited Quiet Title process. However, the acquisitive prescription process would provide the alternate route to clear title.
• Some effort is needed to establish a new entity or modify an existing organization.
• People and property owners can donate property (or money) directly to the non-profit, which will grow the assets and the likelihood of assembling meaningful properties for development.
• The non-profit could apply for grants issued through OCD.
• The non-profit can serve, to varying degrees, all the Cities and the Parish.
• At some point, the non-profit could create other income streams through training programs, outsourcing, etc.
• This non-profit entity could work in collaboration with dedicated staff within the City of Lake Charles.
• Post-Katrina legislation supported NORA’s control with additional resources. This led to 15% of the properties coming under NORA’s control. Having a larger portfolio made it easier to put together meaningful assemblages of property for redevelopment.
• NORA has several arms (non-profit arm to hold assets, etc.), which is important in the acquisitive prescription process.
• The Louisiana Land Trust is the entity initially formed to manage the properties that were purchased by the State under the Road Home Program. LLT and NORA have been able to partner to strategically assemble properties.
The former Bohn Motor Company automobile dealership: NORA is providing $500K in commercial corridor gap funding for the project
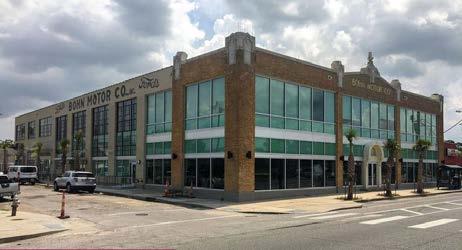
• A redevelopment authority would have the ability to use taxing and millage authority and powers of expropriation (enacting a tax would require a vote, but the right to tax would be enabled with the district)
• Title 33 offers an expedited Quiet Title process to redevelopment authorities (which reduced the redemptive period from 3 years to 18 months) for a public entity acquiring property.
• This approach will take the longest time and has the most political hurdles to overcome.
• Funding the authority in perpetuity is a challenge — code enforcement fines and fees can help, but the operating budget would need to be allocated from the General Fund.
• Susceptible to political pressures and changes in elected officials.
• Because the land would remain in public ownership, it would not be eligible for acquisitive prescription and would remain encumbered (without a warranty deed) without additional legal curative actions.
Successful strategies to employ in all three approaches:
• Increase code enforcement as a tool to get the attention of owners of at-risk properties, with the fines and fees generated through code enforcement allocated back to funding the salaries of staff.
• Pursue a “blighted” designation for the property through the administrative court prior to the tax sale (which reduces the redemptive period timeline from 3 years to 18 months).
• Hire consultants who have developed a streamlined and cost-effective process to outsource some component of the process, such as title research, heirship, and efforts to facilitate the redemption of adjudicated property by the heir(s) and owner(s).
Challenges in all three approaches:
• All three require dedicated, reoccurring funding sources that are eligible for operations. Typically, CDBG-DR funds cannot be used for operations. The City of Lake Charles and Calcasieu Parish are exploring options with OCD that would afford more flexibility and allow CDBG-DR to fund a staff person for these purposes.
• Recruiting staff with expertise in the adjudication process and who can pursue the strategic and creative solutions described in this project.
The Louisiana Land Trust is a state-created land trust that supports buyouts of properties located in floodprone areas and helps communities relocate to safer, higher ground. The Land Trust utilizes funds from the Community Development Block Grant disaster funds administered by the Office of Community Development.
An agreement between the Land Trust and the Office of Community Development enables the Trust to acquire, renovate, and improve housing stock in compliance with CDBG-DR requirements. Public-private partnerships such as this can unlock funds that are oftentimes unavailable to government agencies.
The Louisiana Land Trust bought all 40 properties in the Pecan Acres subdivision — an area that was built on former wetlands and dumping grounds and notorious for flooding issues — and has supported the relocation on a new 23-acre site. Residents of the subdivision worked with the Office of Community Development to select the relocation site and to design and name the new community, which has been dubbed ‘Audubon Estates.’ 16 homes are planned to be complete by summer 2021.
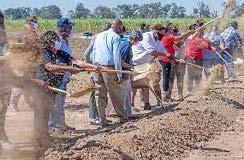
• Act of Sale — a document that guarantees a clear title to the buyer of real property
• Quitclaim Deed — a deed that transfers whatever rights the seller has but makes no guarantees about those rights (such as the possibility that there may be other owners or parties with interest in the property)
• Acquisitive Prescription — a method of acquiring property by meeting requirements for continuous possession. In Louisiana, the requirements for an acquisitive prescription for real property are:
– Possession for 10 years (or as few as three years in some circumstances)
– Good faith, and
– Just title
PROJECTED COSTS:
• $100,000+ yearly for staff salaries
• $1.2 million+ for property maintenance (based on the City of Lake Charles’s current costs)
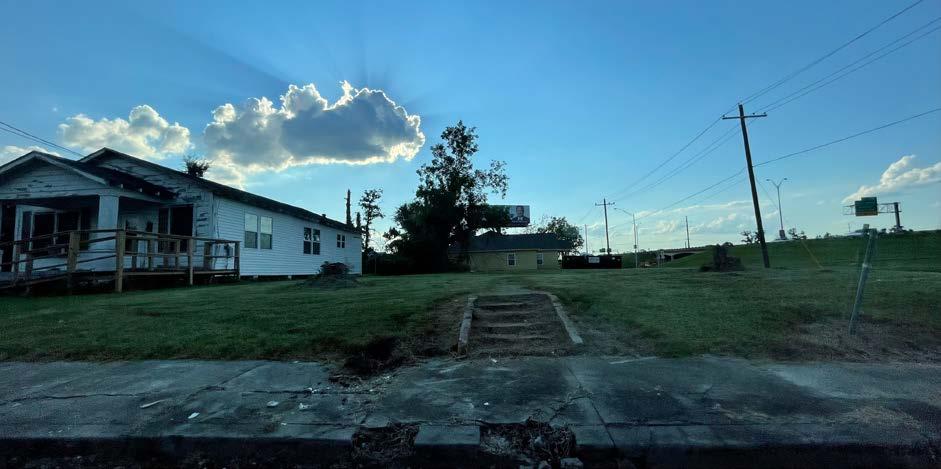
• $1,000-6,000/property legal costs for adjudication due process, notifications, and legal curative process
Potential Funding Sources
• City and Parish General Funds
• Percentage increases on permit fees
• Funds generated by selling/leasing land
• CDBG-DR funding
• American Rescue Plan Act (ARPA)
• Private/Philanthropic Grants
• Tax revenue sharing
Federal and Louisiana law and precedent create a complex environment for addressing adjudicated property. Other states place a limit on the number of generations entitled to receive an ancestor’s property, and who is therefore required to receive notices for the purpose of due process before taking the property. However, Louisiana’s civil law does not limit the number of generations that count as heirs, making the identification of interested parties more time-consuming, and often prohibitive. However, there is some relief on this due process for properties that became adjudicated before the 1983 Supreme Court Case Mennonite Board. of Missions v. Adams.
• This case established the requirement that notice must be provided under the Due Process Clause of the Fourteenth Amendment.
• It requires that property owner(s) and interested parties are entitled to notice by certified mail to the last known address at specific points in the tax sale and redemptive periods.
• This, combined with Louisiana’s broad understanding of which descendants have an “interest” in property, can create expansive notice requirements.
• Properties that became adjudicated prior to 1983 are not held to this precedent and can be pursued in a more straightforward and less encumbered process.
If done right, this project could put a dent in the chronic problem of abandoned properties.

This plan acknowledges the effects that structural racism, de jure segregation, and other forces have caused and reinforced the concentration of vacant and adjudicated property in North Lake Charles. The word “blight” etymology dated to the 1500s when farmers used it to describe agrarian diseases. In the first few decades of the 20th century, urban reformers started using the term to refer to a wide range of problems in cities. The term was transferred from referencing diseases that affect plants and crops to an urban context. The term “blight” was heavily used during urban renewal as a vague term and a rhetorical device to make a case for removing Black people and other minorities from neighborhoods by building highways and the taking of land through eminent domain and condemnation, which robbed the original owners of value that would have translated to generational wealth. Urban blight has never been clearly defined. Sometimes it referred to a concentration of abandoned buildings or vacant land, sometimes as a euphemism for talking about who lives in a neighborhood and why there has been disinvestment. Because the word initially meant “diseased,” there are racial undertones and implications that the term refers to the people who live in a place, not only the property conditions.
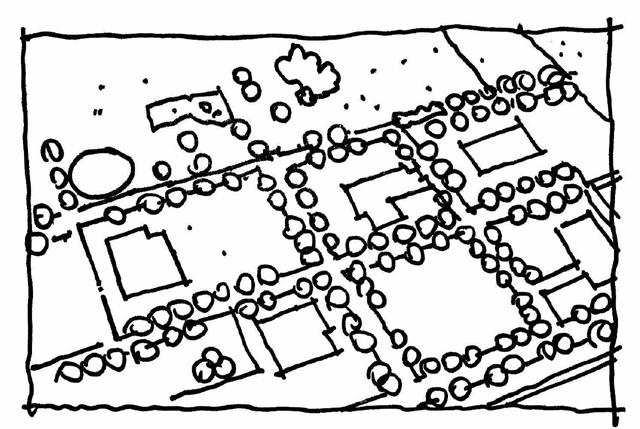
Additionally, the term’s modern-day usage has become closely associated with crime and tied to the disproven “broken windows theory.” Historically and today, “blight” has been used as a seemingly “neutral” term underpinned by racial and ethnic prejudice. While experts now agree that blight is fraught, it remains the commonly used word for which there is no clear replacement. This challenge also has legal implications, given that the Louisiana state law related to adjudicated property requires administrative courts to declare a property as “blighted” before the tax sale to reduce the redemptive period for a public municipality or entity from 3 years to 18 months. Because this term holds legal significance in Louisiana, we will use it only in reference to that process. In other cases, this plan uses specific terms to describe the conditions (vacant land, buildings, underutilized property, code enforcement challenges, etc.).
Reference: https://www.bloomberg.com/news/articles/2017-02-16/ why-we-talk-about-urban-blight
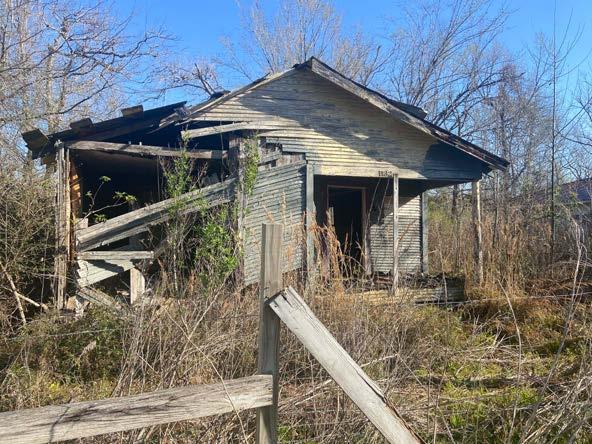
Determine the most effective and appropriate of the three approaches for SWLA:
• Establish any legal entities required
• Allocate operations funding
• Hire staff
Create and maintain a robust database of vacant or adjudicated properties, their tax status, liens, current owners, parties with interest in the property, contact information, records of notices and correspondence, and status within the legal process.
Follow and pursue the process for obtaining clear titles and deeds
Strategically plan for and assemble properties for development (vacant, underutilized, and adjudicated).
Build relationships with local stakeholders to facilitate a smooth process.
Keep properties clean and green by mowing and clearing debris.
Establish partnerships with banks looking for CRA credits/ projects and explore creative solutions:
Sell, donate, lease, or RFP land for development.
Each of the 10 catalytic projects addresses the five plan topic areas. In addition to the specific recommendations, additional policy recommendations and actions in each of the five topics will be critical to help the region reach its resiliency goals.
The plan recommendations are based on:
• Analysis of the existing conditions, including physical infrastructure and development patterns, market and economic factors, and the state of infrastructure
• Guiding Group meetings and input
• Public input throughout the process
The plan recommendations include projects that are less visible, more limited in influence, or longer term than the 10 catalytic projects. However, they are still critically important to the advancement of the region. The topical plan recommendations will
be implemented by partnership of public, private, and non-profit partners. Elected and appointed officials should support and advance these recommendations based on the thousands of points of public input that led to their inclusion in the Just Imagine SWLA 50-Year Resilience Master Plan.
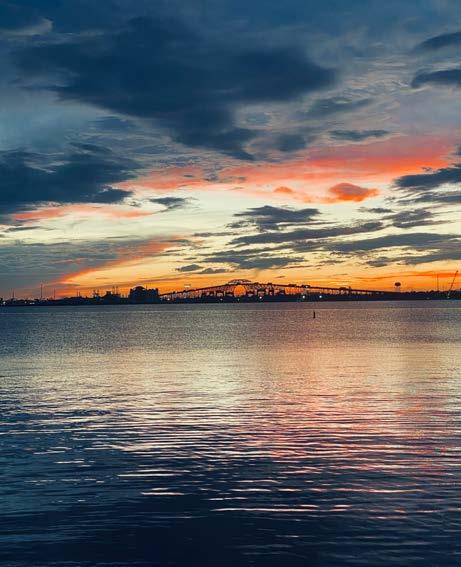
Plan recommendations in each of the topic areas are tied to outcomes in other areas. For example, reinvesting in the quality of commercial development along key arterials not only affects the health of those stores, but it also impacts the aesthetics of the region, especially when outside developers or potential residents consider investing in SWLA.
These plan recommendations should be strategically sequenced to maximize investment and quality of life, beyond just what funding is available and what projects have immediate political support.
Just Imagine...a dynamic region, with an enviable quality of life, that allows all existing and future residents and businesses to thrive.
Just Imagine...collaborative community planning that focuses on implementing a better quality of life.
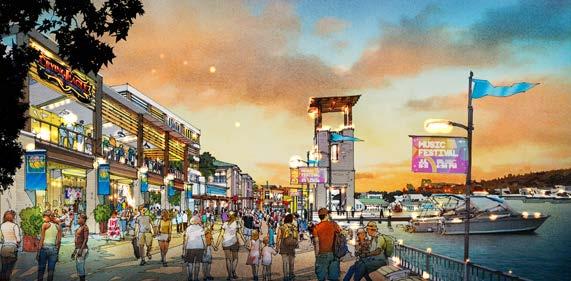
The Community Planning topic broadly encompasses quality of life, public-private coordination and partnership, city and parish approval processes, and the quality and outcomes of development in the region.
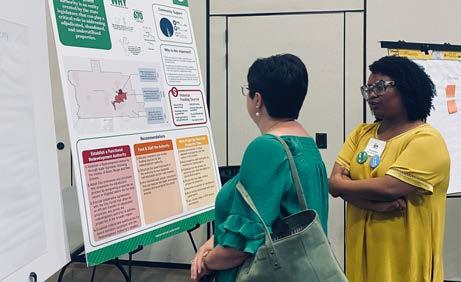
The Community Planning recommendations are based on:
1. Assessment of existing development approval processes, policies, and outcomes
2. Community Planning Guiding Group meetings and input
3. Public input throughout the process
4. Technical meetings with the cities’ and parishes’ planning
The tables list the full set of recommendations with estimated costs and time frames, and key recommendations are described in more detail below.
Calcasieu Parish and the City of Lake Charles are working collaboratively on development codes for the areas where the parish-city line creates inconsistencies. A joint fringe development ordinance would address consistent sidewalks, access management, setbacks, drainage, and other development requirements. Additional funding would need to be dedicated to support staffing capacity at the Parish and City to move this recommendation forward quickly.
Corridor overlay districts are an important tool to continue discussing and using. Some past overlay districts have become controversial and political in Southwest Louisiana. However, the aesthetics of commercial corridors can negatively impact the region’s ability to attract investment and residents. Corridor overlay standards must be thoughtfully
• People desire quality of life improvements in the region — places to shop, dine, recreate, and enjoy themselves.
• Sidewalks, bike trails, and pedestrian paths in both developed and natural areas are high priorities for the residents of SWLA.
• Some policies and regulations will need to change to help implement the 10 catalytic projects.
Zoning and Regulatory Updates
1 Adopt zoning and approval changes to make the 10 catalytic projects implementable
2 Utilize local knowledge and expertise through developer stakeholder groups to review zoning and draining ordinances as they are being drafted
3 Consider adopting the Design Flood Elevation and resiliency standards above the minimum requirements: conduct a cost-benefit analysis first to demonstrate the reasons for building to a Design Flood Elevation above BFE
4 Adopt mixed-use zoning for key areas to encourage active uses and housing
5 Adopt enhanced standards for new development (underground utilities, sidewalks, etc.)
6 Adopt consistent Fringe Development codes between the cities and parishes
7 Adopt corridor overlay standards in areas where the cities or parishes are also transforming streets to be more walkable
8 Establish requirements for outparcel design along corridors where larger commercial properties may subdivide
9 Update sign and landscape ordinance
Walkability and Bikeability
10 Develop the public edge of the Lake Charles and Calcasieu River waterfront to connect over 4 miles of walking and biking paths
11 Reconnect Old Highway 171 N. as a bike path and greenway over English Bayou and Calcasieu River to connect to Moss Bluff
12 Implement the Bayou Greenbelt with an early phase project, extending McNeese’s Contraband Bayou project to the east of Common Street.
13 Develop walking and biking paths in Entergy’s utility rights-of-way, working in partnership with existing land owners, especially where connections to the Bayou Greenbelt are possible
designed and there must be political support for staff to enforce them consistently. One benefit to adopting higher standards is that insurance will cover upgrades after a future disaster if they are required by code. In the Nelson Overlay District, development being built back after Laura and Delta is higher in quality than what was there previously. The City of Lake Charles recently adopted the Nellie Lutcher Overlay district for Enterprise between I-10 and Broad Street. This overlay district will require elevated materials for new buildings in the Nellie Lutcher District. In addition to materials, overlay standards can also regulate site plan and building orientation. Corridor overlays should be pursued in locations where the city and/ or parish is also making improvements to walkability in the public right-of-way.
Outparcel design standards can function as an important component of corridor overlay standards or an independent set of standards. Lake Charles and Calcasieu Parish have a number of retail corridors with strip centers (Ryan Street, Prien Lake Road, Sam Houston Jones Parkway). As property owners of strip centers redevelop, the national trend is to maximize the built square footage by subdividing high value outparcels. Standards for frontages, openings, transparency, building elements, and publicly accessible space drastically improve the appearance of the area.
Outparcel standards improve building frontages, scale, and publicly accessible space along key regional corridors
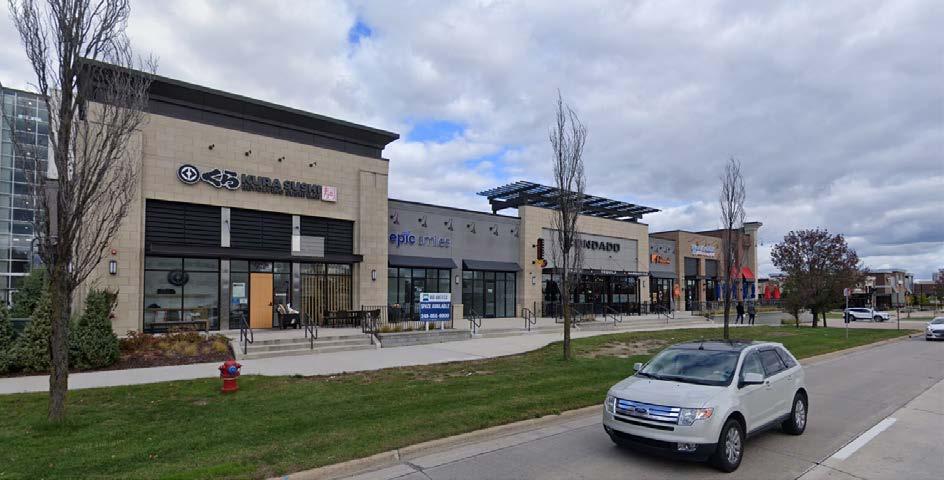
Recommended Zoning & Approval Changes
• Improved standards for infill development in existing neighborhoods to prevent inconsistent setbacks, street frontages, and poor site plan utilization of parcels.
• Recalibrate the Downtown Smart Code to account for the Waterfront Development and Strong Downtowns projects.
• Update the Planned Unit Development standards to require minimum usable and total open space per unit and other community amenities (such as play structures, gardens, bicycle facilities, etc.).
• Reduce the minimum lot sizes in neighborhoods to allow for townhouses and narrow lot development.
• Require garages to be set back from the primary facade of the house at least 20 feet.
Moderate to low risk areas
• X (shaded) — Areas of moderate flood hazard
• B (shaded) — Base floodplains of lesser hazards (such as areas protected by levees from 100-year flood)
• C (unshaded) — Areas of minimal flood hazard; may have ponding and local drainage programs that don’t warrant designation as base floodplain
• X (unshaded) — Areas of minimal flood hazard; outside the 500-year flood and protected by levee from 100-year flood
High risk areas (mandatory flood insurance)
• A — Areas with a 1% annual chance of flooding and 26% chance of flooding over the course of a 30-year mortgage
• AE — Base floodplain where BFEs are provided
• A1–30 — Numbered A Zones (old format)
• AH — Areas with a 1% annual chance of shallow flooding, usually in the form of a pond (1–3 feet)
• AO —River or stream flood hazard areas, and areas with a 1% or greater chance of shallow flooding each year
• AR — Areas with a temporarily increased flood risk due to building or restoration of a flood control system
• A99 — Areas with a 1% annual chance of flooding that will be protected by a federal flood control system
High risk — coastal areas (Mandatory Flood Insurance)
• V — Coastal areas with a 1% or greater chance of flooding and an additional hazard due to storm waves (no BFEs shown)
• VE, V1–30 — Coastal areas with 1% annual chance of flooding and additional hazards due to storm waves, where BFEs are derived from detailed analysis
Undetermined Risk Areas
• D — Areas with possible but undetermined flood hazards
Freeboard refers to additional height above a minimum level of protection, typically expressed in feet above the base flood elevation (BFE). Flood zones are regulated through the FEMA Flood Insurance Rate Map (FIRM). As of 2022, the local requirements were as follows.
If you’re building a new house, the most important part is picking where to build it. Choosing where to build isn’t just about neighbors or great schools, but about how your house can hold up against hurricanes and floods. WHAT CAN I DO?
Calcasieu Parish requires equipment and finished floor elevations to be built to a minimum of the following (whichever is lowest):
• One-foot freeboard above FIRM BFE for FIRM zones A, AE, and VE;
• One-foot freeboard above the nearest BFE for FIRM zones XS and X;
• One-foot freeboard above the highest recorded or modeled 100-year inundation elevation;
Continued changes in climate, sea levels, and the intensity and frequency of storms suggests that building to a standard above BFE could lead to less property damage during future disasters. A regional benefit-cost analysis should be conducted to demonstrate the safety and property repair cost benefits to optionally building above the standard or for approving municipalities and parishes to adopt higher standards.
1. Go Beyond the Minimum Standard: The National Flood Insurance Program (NFIP) has changed how it determines insurance costs. The BFE won’t be the only thing that tells the NFIP what you should pay for flood insurance, but it does give you a good idea for how high you should build your house. It’s important to remember that BFE is a minimum; building higher is allowed and encouraged for additional safety. Some communities that have chosen higher standards like DFE and Freeboard to help make all homes in the community safer.
HOW DO YOU CHOOSE HOW HIGH TO BUILD?
To choose how high to build, communities should look at:
1. How high have floods been in the past?
2. Has more land been built on since the last flood? Does the water have somewhere to go?
• One-foot freeboard above the nearest Sanitary Sewer Manhole; or
2. Think about how far you are from a flooding source: Living near the water makes it more likely your house could flood, which will make flood insurance more expensive.
For something to be resilient it needs to prepare for threats, absorb impacts, recover, and adapt. Homes in southwest Louisiana go through a lot with floods, hurricanes, and more. Making your home tougher can help you better adapt to future risk and save time and money in the long run by avoiding expensive storm repairs. Using some of the ideas in this toolkit might even help your lower what you pay for flood insurance.
BASE FLOOD ELEVATION (BFE)
• One-foot freeboard above the street centerline.
WHAT’S IN THE KIT?
This toolkit is a guide for:
3. Think about the development rules around you: If it isn’t planned out, new development can make existing neighborhoods more likely to flood. Look around to see if new construction around you is built responsibly so that water doesn’t run off one property and impact others.
The City of Lake Charles has requirements in special flood hazard areas (SHFA) where base flood elevation data has been provided. In these areas, the top of a structure’s lowest floor must be:
1. Building New Homes: New Construction has information about choosing where to build, the basics of how to build, and how many different kinds of homes can make up resilient neighborhoods.
• Built to 10 feet Mean Sea Level (MSL) in all areas with a BFE of nine feet or less MSL
2. Retrofitting Homes: Retrofit focuses on homes that already exist, and how they can be made stronger against high winds and floods.
A height in feet on a community’s Flood Insurance Rate Map (FIRM). A flood has a 1% chance of getting to that height each year. Sometimes, it happens more often.
DESIGN FLOOD ELEVATION (DFE)
• Built at or above BFE in all A Zones (A and AE)
Cameron Parish requires:
3. Resources: Resources has information about flood insurance, supporting middle neighborhoods, and affordability. It wraps up with why you should care, and where you can go to learn more.
• All development to be built to BFE.
There is much more information than can be covered in a short toolkit, but there are many more resources to learn more at the end.
A height in feet that communities choose for themselves based on past floods, or expecting more or higher floods in the future.
FREEBOARD
A buffer over a flood elevation, usually BFE. Communities can choose a buffer for additional flood safety.
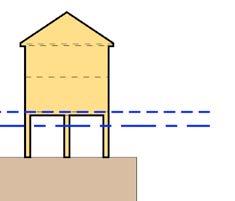
Creating a greenway along Old Highway 171 would be a transformational investment for North Lake Charles and Moss Bluff. The right-of-way currently dead ends at English Bayou and the Calcasieu River. If connected with bridges over the waterways, the greenway could provide 3.7 miles of walking and bike trails that would connect Riverside Park to River Bluff Park. The Green Bypass would directly connect Moss Bluff to the Bayou Greenbelt system.
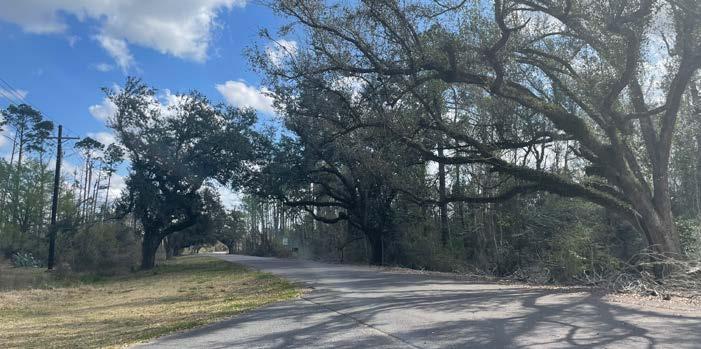
Areas adjacent to the Bayou Greenbelt will have the opportunity to connect trails to the new greenway system. Access to Bayou Greenbelt will raise the value and the quality of life in adjacent neighborhoods, making these neighborhoods highly desirable. A comprehensive planning effort should be launched to develop a plan for lateral connections of walking and bicycle infrastructure to access points to ensure people can safely get to the Greenbelt.
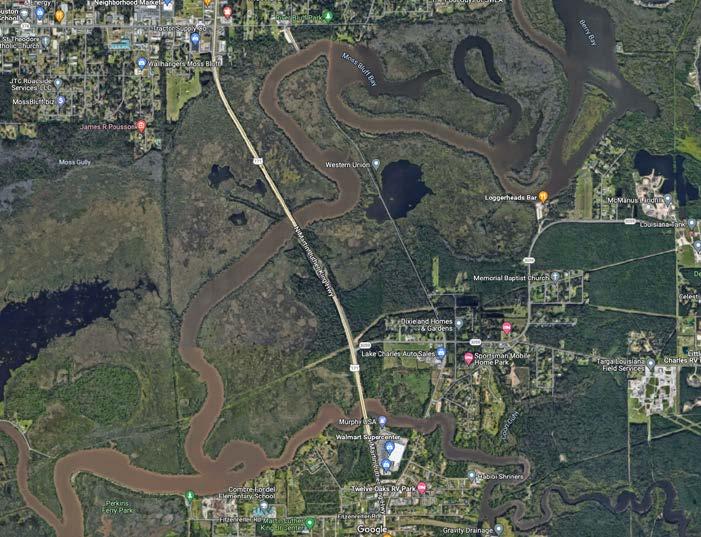
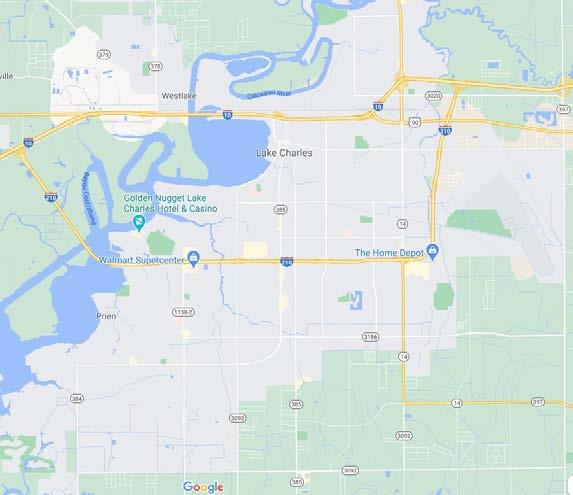
A bike lane is defined as a portion of the roadway that has been designated by striping, signage, and pavement markings for the preferential or exclusive use of bicyclists. A bike lane does not have physical barriers (bollards, medians, raised curbs, etc.) that restrict the encroachment of motorized traffic. Types of bike lanes include:
– Conventional Bike Lanes
– Buffered Bike Lanes
– Protected Bike Lanes
– Contra-Flow Bike Lanes
– Left-Side Bike Lanes
A cycle track is bicycle infrastructure that is physically separated from motor traffic and distinct from the sidewalk. Cycle tracks may be one-way, two-way, at street level, sidewalk level, or at an intermediate level. Cycle tracks include:
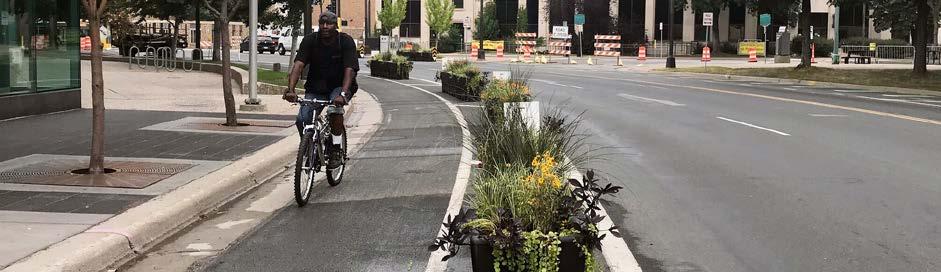
– One-Way Protected Cycle Tracks
– Raised Cycle Tracks
– Two-Way Cycle Tracks
Multi-use or shared-use trails and paths provide continuous corridors for walkers, runners, and bicyclists, and they are an important part of an All Ages and Abilities network. Paths and trails are completely separated from road infrastructure. These paths are highly desired, but they work best when connected to an on-street network that meets the same high
Lake Charles has been advancing a proposed bicycle network and incorporating some initial bicycle infrastructure into recent roadway projects. The Proposed Bicycle Network to the right should be used as the foundation for a more robust and detailed bicycle infrastructure plan that takes into account the types of facilities and develops an All Ages and Abilities network. The Urban Bikeway Design Guide published by the National Association of City Transportation Associates (NACTO) should be used as the definitive guide.
Many portions of Southwest Louisiana could benefit from increased trail connections and options for walking and bicycling. Entergy has expressed an interest in working with property owners to identify where interconnected walking paths could be created within their rights-of-way.
benchmark of rider comfort so that people can get to the regional or local trail. Multi-use trails include:
– Paths/trails with separate space for pedestrians and designated space for faster-moving bicycles (and skateboards, roller bladers, etc.)
– Multi-use paths (where walking, running, and bicycling occur in the same space — use only where space is limited).
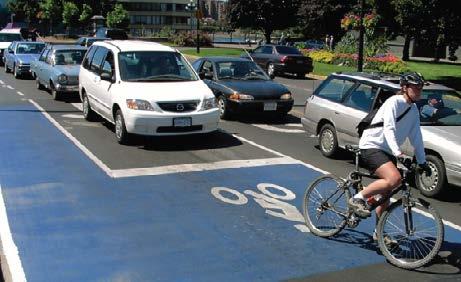
4
Intersection Treatments
2 3
Two-Way Protected Cycle Track Cycle tracks are physically separated from motor traffic and often have two-way bicycle traffic on one side of a roadway. Cycle tracks often incorporate specific intersection treatments to improve safety and clear right-of-way for cyclists.
Designing intersections properly reduces conflict between bicyclists (and other vulnerable road users) and vehicles by heightening the level of visibility, denoting a clear right-of-way, and facilitating eye contact and awareness with competing modes. Intersection treatments can include:
– Bike Boxes
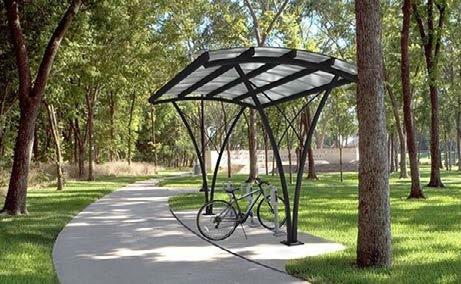
– Intersection Crossing Markings
– Two-Stage Turn Queue Boxes
– Median Refuge Island
4 Bike Box Intersection Treatment Intersection treatments make cyclists more visible and facilitate a clear right-of-way. The bike box in this photo allows the cyclist turning left to queue in front of the motor vehicles, allowing it the right-of-way.
Multi-Use Path Multi-use and shared-use paths are one of the most accessible forms of bicycle infrastructure. In the top example, there are defined spaces for faster-moving bicycles and pedestrians. In the lower photograph, the path is shared.
– Through Bike Lanes

– Combined Bike Lane/Turn Lane
– Cycle Track Intersection Approach
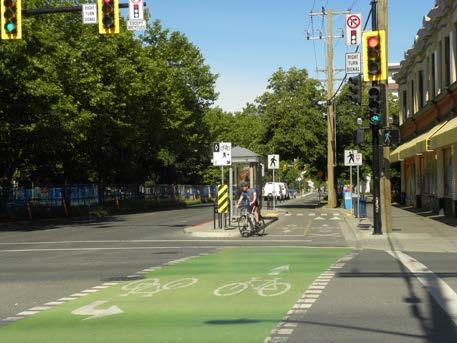
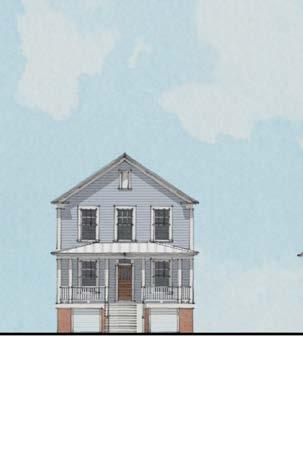
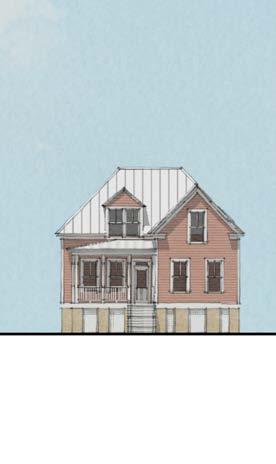
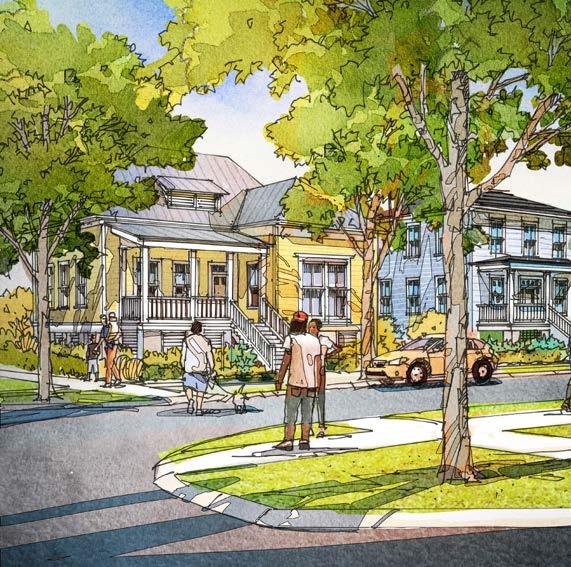
Housing policy directly impacts the availability, affordability, and accessibility of housing. Throughout the Just Imagine process, housing rose to the top of the region’s priorities. Quality housing that families and individuals can afford is critical for the economic growth of the region. The following housing recommendations are based on:
1. Assessment of existing housing supply, affordability, and delivery models
2. Housing Guiding Group meetings and input
3. Public input throughout the process
4. Technical meetings with developers, general contractors, and non-profits
The tables list the full set of recommendations with estimated costs and time frames, and key recommendations are described in more detail.
Southwest Louisiana has a deficit of housing units that are affordable to each income range and this deters people from moving to the area. Cities and parishes should use the levers of zoning to incentivize additional housing to be built. These changes may include upzoning districts across the whole jurisdiction or allowing additional density along corridors, in high-opportunity neighborhoods, and in walking distance to amenities like downtown, the waterfront, McNeese State University, and others. Cities and parishes can reduce the cost of building housing by eliminating parking minimums and letting the market determine the necessary parking ratio, and allowing housing to be built in commercial districts.
1 Adopt zoning ordinance updates that will help to increase the supply of housing in the region (mixed-use zoning, reduced parking requirements, upzoning, etc.)
2 Reform the entitlements and approvals process to make housing development faster and more predictable
3 Adopt criteria for cities and parishes to use when evaluating whether to support LIHTC applications to the state (such as a requirement to deconcentrate poverty and to engage neighbors in a community process)
TBD 1–2 years
TBD 1–2 years
TBD 0–1 year
4 Allocate HOME/CDBG funds to non-profits building affordable homeownership TBD 1–5 years
5 Provide funding and technical assistance to help housing non-profits apply for state-certified CHDO status
TBD 1 year
6 Fund infrastructure for sites/projects that assure a level of affordability and resilient design TBD 0–1 year
7 Offer grants to provide gap funding for affordable and resilient housing projects
8 Adopt policy recommendations for areas with high concentrations of subsidized housing
9 Support and build the capacity of non-profits who are interested in developing affordable housing in the region
10 Create a regional Affordable Housing Trust Fund for SWLA (funded through property/ sales tax or a widely distributed transfer tax)
Training and Partnerships in Advance Resilient Building Practices
11 Organize builder workshops throughout the region to share resilient building practices and benefit-cost information to demonstrate the advantages post-disaster
12 Partner with the Homebuilders of SWLA and the Associated Builders and Contractors Southwest Training Center to recruit and train a larger workforce for the homebuilding and construction industries; focus on the importance of resilient building practices
13 Support contractors in getting certified as fortified roof installers and inspectors; establish small business support systems for those interested in starting specialized contracting companies for resilient building practices, such as fortified roofing.
TBD 0–1 year
TBD 1–2 years
TBD 0–1 year
TBD 5–15 years
• Quality, resilient, and affordable housing is one of the region’s greatest needs.
• The cost of housing is going up and many households are being priced out.
n/a 0–1 year
n/a 0–1 year
• If families and individuals can’t find housing they can afford, it will limit the growth of SWLA.
• Storms will continue to increase in severity, and homes need to be built to higher standards.
• Stable, safe housing is essential for families and people to thrive.
n/a 0–1 year
1. Buildings Front Public Areas: If a development does not include public streets, parking drive aisles should be designed with enhancements to make them “street-like” (shade trees, non-circuitous sidewalks, street furniture such as benches, trash receptacles, and street lights).
2. Access: Convenient access to public transit, walking and bicycling trails, and other amenities enhances access to opportunities for employment, education, and cultural experiences.
3. Neighborhood-Scale Blocks: Development should be organized into blocks that are less than 3 acres each to create a walkable community.
4. Fronts and Backs: Buildings should have discernible fronts and backs. Front facades should face other front facades and rears of buildings should face other rear facades.
5. Perimeter Frontage: Fronts of buildings should face publicly accessible streets (or parking lot drive aisles designed to be “street-like”) or greenways. Service areas, off-street parking, and semi-private outdoor space should be located in the center of blocks.
6. Diverse Building Types: The objective is to build new homes in new or extended neighborhoods. A range of building types and architectural designs are required to move from building a development or apartment complex (typically with one or two repeating building designs) to a neighborhood.
7. Mixed-Income: LIHTC projects should aim to serve a range of incomes.
8. Human-Scale Building Elements: Porches, stoops, awnings, balconies, and other elements are necessary to create places where people can interact and enjoy outdoor space.
9. Accessible Amenities: The development has a diverse range of indoor and outdoor amenities, including small parks for children, indoor community gathering space, fitness amenities, etc.
Streamlining approval processes and entitlement times has proven to translate to cost savings that can lower rents and keep housing affordable. Zoning ordinances should be updated to have the desired regulations and the majority of approvals should occur by-right, without additional review required. The cities and parishes in Southwest Louisiana have intentionally focused on speeding up review and approval times. Additional funding for staff capacity would allow the departments to improve further and facilitate the production of more housing in the region.
One funding mechanism that for-profit and non-profit developers use are Low Income Housing Tax Credits (LIHTC), issued through Louisiana Housing Corporation (LHC). LIHTC is an indirect federal subsidy that helps to finance the construction and rehabilitation of rental housing for low-income individuals. The tax credit is a commodity that developers can use to generate capital for projects, and in exchange, they agree to income-qualify tenants, maintain affordable rents for a 15-year period, and follow leasing and property management requirements.
The most valuable credits are competitive at the state level and applicants often approach cities and parishes for letters of support for their applications. This can put elected officials in a difficult position of having to judge one application against another, prior to the state’s evaluation. As part of
the Just Imagine process, the checklist to the right was developed as a tool for municipal and parish staff to use in evaluating support for projects.
A LIHTC project should meet at least five of the nine criteria before a letter of support is considered and/or recommended.
Concentrating low-income households not only limits the possibilities for families and individuals to thrive, but also can concentrate social challenges and impact the value of one part of a city or region. The issues and property values can spiral downward as more subsidized housing is built in the same area (often for the reason that there is less public opposition to building more of what’s already located in an area than to integrating subsidized housing into high-opportunity areas). The best practice is to offer housing that serves a mix of incomes in all neighborhoods. Low-income families experience more upward economic mobility when living in closer proximity to higherincome families and when given access to the same amenities and resources that others benefit from. All municipal and parish approving bodies should adopt a policy not to approve subsidized housing for areas that are already saturated with very low- and low-income households.
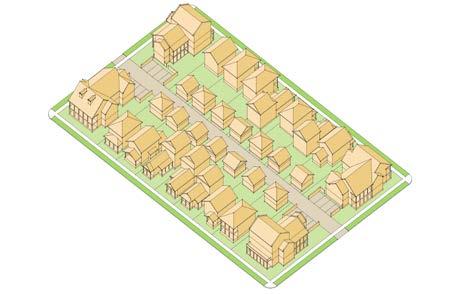
The Southwest Louisiana region has valuable but limited partners on the ground building affordable rental and home ownership. These organizations could benefit from collaboration, capacity support, and additional funding. Additionally, organizations from other parts of Louisiana are willing and interested in supporting SWLA. A network should be established for best practice sharing.
Most affordable and subsidized housing projects have gaps in their financing and funding stacks. As labor and material prices climb, these gaps have become hard to close. When publicly funded, infrastructure improvements such as public streets, utilities, drainage, parking, etc. can incentivize development that would not have been feasible before those improvements. The Regional Planning Commission (RPC), parishes, and cities should compete for new sources of infrastructure funding (such as the Infrastructure Investment and Jobs Act (IIJA)) and use the capital dollars to incentivize and offer leverage for affordable housing development.
Similarly, philanthropic grants should be set aside for gap funding for projects that guarantee affordability up to a maximum area median income. Philanthropic funding should also be tied to ensuring that new or renovated housing is built to resilient standards and can withstand flooding, strong winds, and other hazards.
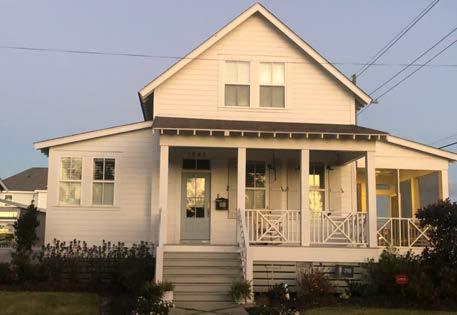
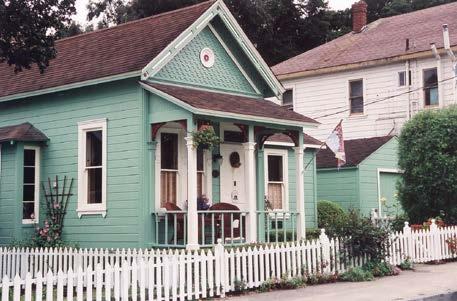
Housing trust funds are a flexible source of funding that can be used to support a variety of affordable housing activities. When they are created and administered at the city or parish level, housing trust funds can be designed to address specific local priorities and needs. Several action steps for establishing a SWLA Housing Trust Fund include:
1. Determine whether the fund will be administered by an existing public office or non-profit organization, or whether a new entity will be enabled and established.
2. Dedicate a revenue funding stream. Common funding for regional housing trust funds include real estate transfer taxes, document recording fees, developer fees such as linkage fees, demolition taxes, permit fees, hotel taxes, taxes on legalized medicinal or retail marijuana, taxes or fees on luxury housing, or taxes on short-term rentals.
3. Identify the activities that the trust fund will support (i.e., What range of median household income level should projects receiving funds serve? Should the funds support rental, homeownership, shared-equity housing, etc.? Can the fund support rental assistance subsidies or just development?).
• What’s Affordable? The Resilient Housing Toolkit provides a primer on housing affordability, using 2021-2022 demographics and metrics. Housing is generally considered affordable if a household pays 30% or less of their gross monthly income for housing costs (including mortgage or rent, utilities, homeowners insurance, and property taxes). As of 2022, the average family in Southwest Louisiana cannot afford to purchase the average home for sale, unless they can afford to make a 25% or greater down payment. Rents are steadily rising and many median or below-median income families are severely housing burdened.
• Why Should I Care? Citizen opposition to the construction of new housing in high opportunity areas is one of the most detrimental obstacles to the production of more affordable housing. Southwest Louisiana is experiencing a housing crisis that will continue to get worse until available housing stock for all income brackets increases. The Resilient Housing Toolkit explains reasons why every person should care and support the construction of more housing, affordable housing, and resilient housing in simple terms.
• Supporting Middle Neighborhoods: Middle neighborhoods are older or more established neighborhoods where middle-class and working class families live. These neighborhoods are stable and desirable, but they require continued investment in the homes, public infrastructure, and services to ensure that they do not decline. In SWLA, many of the middle neighborhoods are in the northern half of the city and may have reduced flooding risks. A series of seven policy recommendations for supporting middle neighborhoods are included in the Resilient Housing Toolkit.
WHAT IS CONSIDERED “AFFORDABLE” FOR HOUSING?
• Housing is generally considered as affordable if a household pays 30% or less of their monthly gross income for housing costs (including mortgage or rent, utilities, homeowners insurance, and property taxes).
• Households that pay more than 50% are considered severely housing burdened.
• To qualify for subsidized affordable housing a family of four would need to make $38,820 or less.
WHAT CAN AN AVERAGE FAMILY IN SWLA AFFORD TO RENT?
THE AVERAGE RENTS IN CALCASIEU & CAMERON PARISHES ARE:
• $702 for a studio apartment
• $732 for a 1-bedroom apartment
• $941 for a 2-bedroom apartment
• $1,178 for a 3-bedroom apartment
• $1,321 for a 4-bedroom apartment
Families with children might have a hard time affording rent.
WHAT CAN AN AVERAGE FAMILY IN SWLA AFFORD TO BUY?
1. The average family makes $51,547 and can afford to spend $1,200/mo. in total housing costs. With those costs, they may be able to afford a home that costs
$150,000
2. The median home listed for sale in January 2022 is $225,000 in Calcasieu Parish and $325,000 in Cameron Parish.
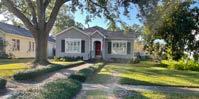
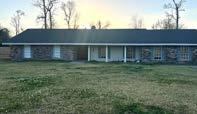
3. The average family that lives in Calcasieu & Cameron parishes cannot afford to purchase the average home, unless they can make 25% (or greater) down payment
It costs about $360,000 to build a 3- bedroom, 2400 sf house, but can cost more.
MIDDLE NEIGHBORHOODS
There are many neighborhoods throughout the region where middle-class and working-class families live. These are called middle neighborhoods They are often established neighborhoods that have a long history in the area. Sometimes, these neighborhoods can be left out of conversations about how they can best be supported. How you can describe a middle neighborhood:
• Middle neighborhoods are where middle-class and working-class families live.
• In these neighborhoods, incomes and house prices are typically pretty close to the middle for a city or region.
• Middle neighborhoods are the backbone of a region and important to building equity for Black and other communities of color.
• They require continued investment in the homes, public infrastructure, and services to ensure that they do not decline.
In SWLA, there is not much land that is outside of places with high flooding risks. Keeping established neighborhood strong can be an alternative to building new houses in areas more likely to flood.
The houses that were built in middle neighborhoods are often smaller and have fewer bedrooms and bathrooms than people look for when buying a new house. This can make it hard to sell a house in a middle neighborhood
MAKING A PLAN
After listening to over 2,000 of your neighbors, the #1 thing that people wanted for housing was to see more affordable housing for families of all incomes. That doesn’t just happen. A policy is a course of action; a plan saying how we get to the things we imagine. For more houses to be available, affordable, and accessible, you can support policies that:
• Allow More Housing to be Built
– Make it faster and easier to build with faster permit review
– Allow for more housing in existing neighborhoods like duplexes and small apartment buildings.
• Stabilize Existing Neighborhoods
– Improve public services in neighborhoods that need investment
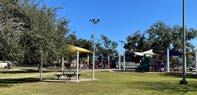
– Limit how much rent goes up each year
• Subsidize Housing Cost for Those Who Need It
– Prevent discrimination against people with housing vouchers
– Require that some affordable housing be built in projects of a certain size, or that are in a good location.
• Build Safer, Longer
– Have each community look at a Design Flood Elevation regularly on what floods have done in the past, and how things are changing.
– Enforce building codes
There are many more policy ideas in the
Just Imagine SWLA Policy Guide.
1. Building a house that can stand up against storms can be less expensive in the future.
2. If your house is damaged in the future, insurance will cover things required by codes. If more resilient standards aren’t required, homeowners would have to pick up the cost themselves.
SO, WHAT CAN DO?
• Support rules to help everyone build safer like: –
Implementing Design Flood Elevation – Wind Mitigation Requirements – Adoption of Stronger Building Codes
– Stormwater retention – Limits on building dirt mounds to build slab-on-grade
justimagineswla.org
for top value, which makes it hard for the neighborhood to grow and thrive. Sometimes, these established neighborhoods
WHAT SHOULD BE DONE?
• Many houses in middle neighborhoods have one bathroom, making the homes less desirable to families in the market. Fund a half bath program (hire local architects to create standard renovation plans for the typical floor plans/house types in the neighborhood to show how 1/2 baths can be added)
• Increase the level of city services to these neighborhoods (street maintenance & improvements, garbage pick-up, replace broken street lights, repair broken sidewalks, etc.)
• Improve and build new highly desirable neighborhood amenities (parks, play structures, community centers, gathering spaces, neighborhood-serving retail in walking distances, access to bike and walking trails, etc.)
• Provide grants to neighborhood organizations to create branding and marketing to promote the neighborhoods
• Increase the number of move-in ready homes by offering grants to homeowners
• Develop a “rehab and ready program” through a land bank or redevelopment authority
• Support organizations & program events in these neighborhoods that will both serve existing residents and attract people from outside the neighborhood
1. Property conditions
2. School conditions
3. Safety
Area Median Income (AMI) is the metric used to allocate housing subsidies. The table to the right shows the Lake Charles MSA low-income housing tax credit (LIHTC) limits. Typically, households making up to 60% AMI can qualify for subsidized rental housing, and sometimes households making up to 80% AMI can qualify. Area median income is also the metric that most housing trust funds and some foundations use to determine what kinds of projects should receive funds (for example, for sale homes for households making up to 80% AMI may qualify for grants).
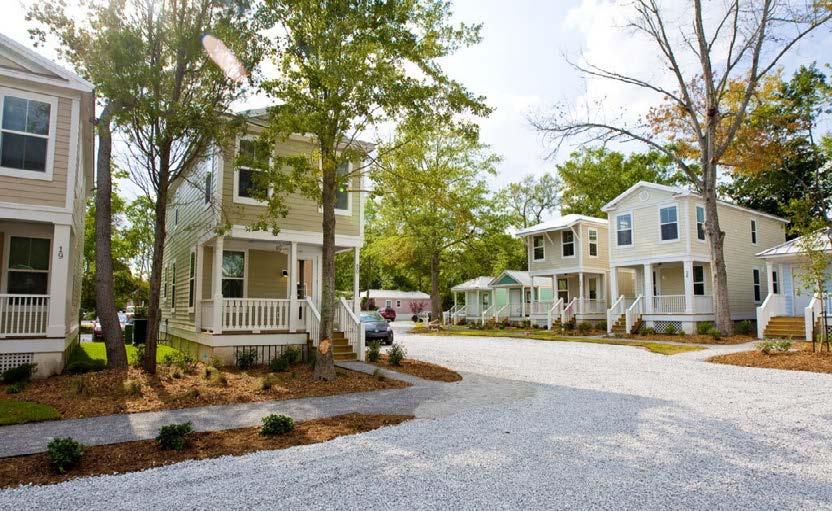
Just Imagine...a diverse and strong economy that adapts to stresses and provides all residents and businesses with the opportunity to thrive.
Economic development and growth is the ultimate objective for the Just Imagine SWLA 50-year Resilience Master Plan. Each of the 10 catalytic projects has economic development benefits and action steps. In addition to those specific actions, economic policies and actions will be necessary to maximize Southwest Louisiana’s future growth.
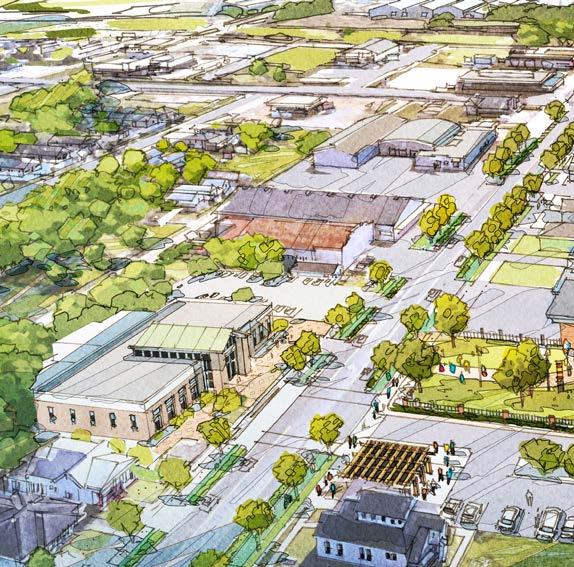
The Economic Development recommendations are based on:
1. Analysis of the existing and potential economic and demographic growth indicators
2. Economic Development Guiding Group meetings and input
3. Public input throughout the process
The tables list the full set of recommendations with estimated costs and time frames, and key recommendations are described in more detail below.
Build on Progress along the Waterfront to Strengthen Downtown
Projects that are moving forward along the lakefront will be early wins — Port Wonder, Crying Eagle, the Lake Area Adventures, and Paul’s Rib Shack will set the tone for future waterfront development. These attractions will be visible from I-10 and will serve as economic generators by attracting both visitors and residents. The momentum generated by vertical development must be harnessed to leverage the next round of projects. Project 2 Waterfront Development outlines the action steps. Additionally, an academic presence for McNeese State University or SOWELA downtown would have a multiplied economic benefit. Other cities have successfully partnered with universities and technical colleges to incentivize development of downtown campuses and buildings, creating more diverse offerings for students, as well attracting visiting professionals, students, staff, and faculty to help revitalize downtown.
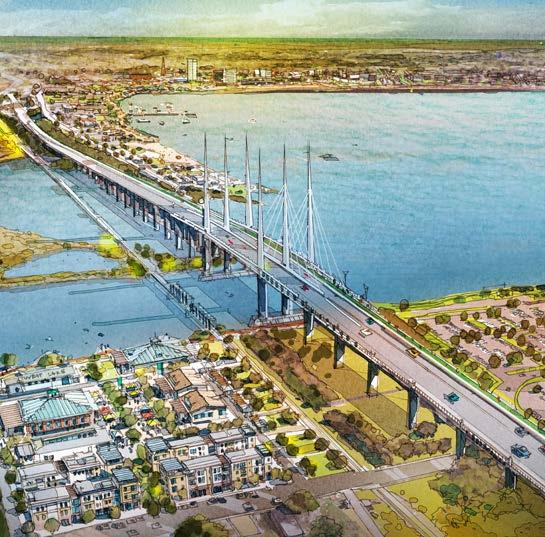
Downtown Lake Charles
1 Champion Project Underway — Port Wonder, Crying Eagle, Lake Area Adventures, Paul’s Rib Shack
2 Build the public waterfront — focus on developing active uses and increasing access to the water
3 Establish a presence for McNeese State University and/or SOWELA in downtown to stimulate economic development
I-10 Corridor
$25–30 million 2–5 years
TBD 2–5 years
$10–15 million 3–10 years
4 Encourage arts and entertainment uses, including the LAVA theater $15+ million 2–5 years
5 Redevelop the vacant service plaza parcel north of I-10 between S. Shattuck Street and S. Prater Street
6 Identify an entity and a funding source for dedicated staffing to address adjudicated property along the I-10 corridor, between Downtown and I-210
Economic Diversification
7 Encourage ecotourism connectivity between Calcasieu and Cameron parishes (hunting, fishing, and nature tours)
8 Expand creative industries and creative manufacturing
9 Increase the services and technology sectors
TBD 2–5 years
TBD 2–10 years
$250,000 1–3 years
TBD 3–10 years
TBD 5–20 years
• Diversifying the types of job opportunities and economic drivers for the region will help SWLA continue to grow and attract young people and families.
• There is a positive relationship between increasing the quality of life for residents of the region, attracting new residents and businesses, and increasing tax revenue.
• The service sector is driving population growth in other states — service industries can help drive job growth and diversification in SWLA.
• Population growth and expanded tourism will support small businesses.
The Port of Lake Charles owns land on the Calcasieu River, at the northern terminus of Ryan Street. This land is an ideal location for a maritime workforce development training center. A partnership between the Port of Lake Charles and SOWELA would enhance job training opportunities in the region.
Commercial Real Estate Development
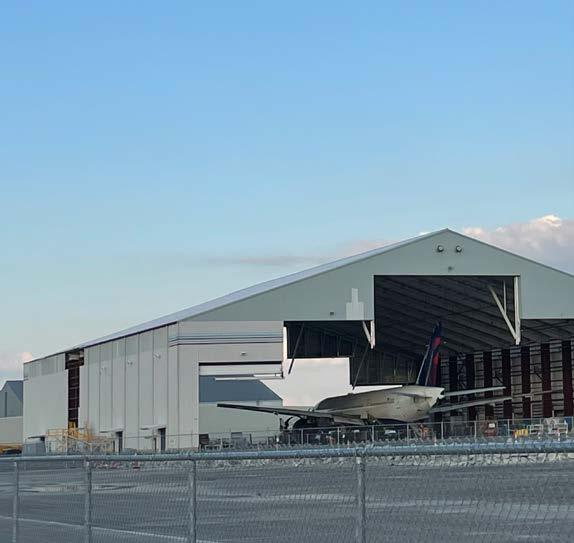
10 Reinvest in commercial and retail property along Ryan Street, Lake Street, Prien Lake Road TBD 1–3 years
11 Establish economic incentives to re-stimulate commercial investment TBD 3–10 years
Workforce & Small Business Development
12 Increase engagement with local public officials and non-profits to coordinate efforts (CPPJ, Cities, APG, CFSWLA, etc.) n/a 0–2 years
13 Increase small business and entrepreneurship assistance TBD 0–5 years
14 Establish a quarterly Solutions Roundtable that includes the region’s major employers (convened by the SWLA Economic Development Alliance) to address investments targeted at attracting and retaining talent
n/a 0–5 years
15 Coordinate and enhance business attraction efforts through the SWLA Economic Development Alliance TBD 0–5 years
16 Educate on workforce development opportunities, job openings, and resume/ interviewing techniques n/a 1–5 years
17 Increase coordination among workforce development entities through the Alliance n/a 1–10 years
Destination Retail in West Calcasieu
18 Secure state and local incentives to attract a destination retailer to the Sulphur area, easily visible and accessible from I-10 TBD 1–2 years
19 Pursue destination retailers that cater to the ecotourism opportunities in Cameron Parish and sell equipment and supplies $20 million 2 years
20 Market a destination retailer to attract visitors from Southeast Texas and other parts of Louisiana n/a 2 years
Community Education
21 Educate on insurance coverages and claim processes $100,000 0–2 years
22 Educate the community on topics related to increasing quality of life (health and wellness, etc.) $100,000 0–2 years
The second priority after the Waterfront and Downtown is the I-10 corridor. The first aspect of the challenge is aesthetic — for some people passing through I-10 between Houston and Baton Rouge, their only impression of Lake Charles and Southwest Louisiana is what is visible from the highway. For those considering investing in or moving to the region, their approach is impacted by views of vacant land and buildings, undeveloped sites, houses with roof tarps, and underutilized commercial property. This undermines confidence to invest in Southwest Louisiana. The second economic impact relates to lost potential. Vast areas of undeveloped or underdeveloped land in the I-10 corridor highlights opportunities that are not currently positively contributing to the region’s economic value. Solutions include targeted subsidies for community-benefit and retail projects with gaps, strategic site acquisition, and development of key sites, such as the vacant service plaza north of I-10. An effective entity that is addressing vacant and blighted property (Project 10) is essential in order to advance these solutions.
While there are many organizations offering workforce development training opportunities, these efforts are not well coordinated and could be expanded. Identifying a lead entity and estab -
lishing a quarterly round table between employers and programs would help to promote collaboration, align programs and training, minimize overlap, and maximize outreach.
The SWLA Economic Development Alliance can play a central role in expanding small business and entrepreneurship assistance. Removing barriers for start-ups and small businesses will help strengthen an often overlooked part of the economy.
West Calcasieu is well positioned to attract a destination retailer — developable land has been assembled into singular ownership and adjacency to I-10 would offer visibility for up to 100,000 vehicles per day. Extensive local incentives would be required to attract a large-scale national retailer with a regional draw; however, a destination retailer can have exponential economic benefits, attracting other businesses to co-locate, increasing ecotourism opportunities, and drawing from a multi-state catchment area.
The petrochemical industry continues to be the major artery of Southwest Louisiana’s economy. Growing investment by LNG ideally positions Southwest Louisiana to diversify the economy with services that support these industries.
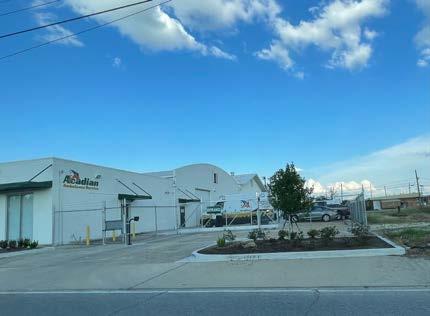
Vacant and underutilized land and buildings not only represent assets that are not contributing to the region’s economic value, but they may be deterring potential investors and residents from coming to Southwest Louisiana. A thoughtful and proactive strategy is needed with a designated entity and funding to implement the strategy (see Project 10).
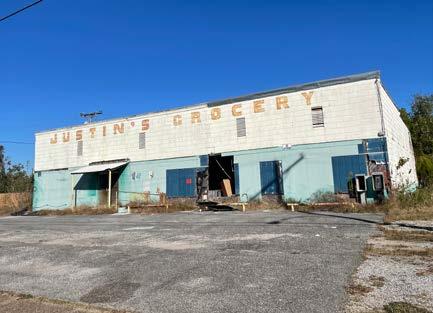
Just imagine...reliable and resilient infrastructure that improves the quality of life and makes the region safer.
Infrastructure improvements are needed to ensure a more resilient SWLA, including bridges, new road connections, improved road standards, drainage, and utilities. These recommendations add to those specific infrastructure improvements included in the 10 Catalytic Projects.
Infrastructure recommendations are based on:
1. Analysis of the existing infrastructure conditions and connectivity
2. Infrastructure Guiding Group meetings and input
3. Public input throughout the process
The tables list the full set of recommendations with estimated costs and timeframes, and key recommendations are described in more detail below.
Bridge Upgrades in Cameron Parish
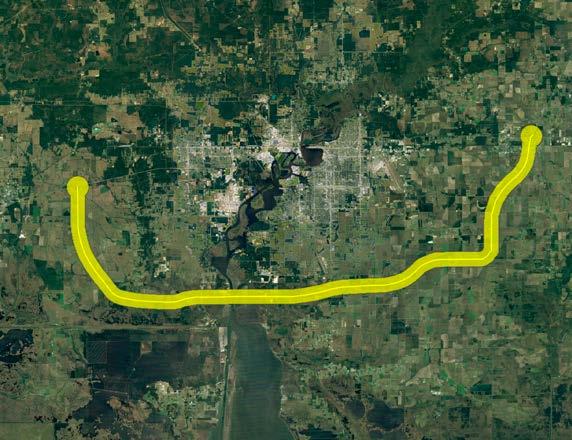
Bridges are necessary transportation infrastructure and many key bridges in Cameron Parish are in need of maintenance and upgrades. Bridge investments should be a high priority to ensure residents, visitors, and industry can safely access destinations along the coast and throughout the Parish.
Public docks democratize access to the water for recreation and enhance the economic viability of small fisheries. Currently, there are a handful of public docks in Calcasieu and Cameron parishes. New docks should include public slips that allow overnight stays, adjacent parking, and could be located near seafood processing facilities.
Improve Access & Connectivity (New Connections)
1 New Cameron Parish ferries (2 ferries funded, construction starting late 2022)
2 Rehabilitate and provide additional pontoon bridges in Cameron Parish
3 Replace Black Bayou Bridge (Calcasieu Parish)
4 Replace Kelso Bridge (Cameron Parish)
5 Public docks for waterway access (Calcasieu and Cameron parishes, in addition to the proposed dock in the Waterfront Development project)
6 Enterprise Boulevard Extension to Highway 171
7 Extend rail from Chennault to Cameron
8 High speed rail from NOLA to Houston
9 North I-210 Loop
million 1–2 years
years
10 Southern Industrial Loop — Create a second crossing of the Intercoastal Waterway $2 billion 25+ years
Improve Standards of Existing Roads
11 Update ordinances to require detention for 25 year events and implement low-impact development incentives
12 Establish a traffic impact mitigation process in larger cities poised for continued growth that creates requirements for future developers to address impacts that new development imposes on the existing roadway network
13 Drainage improvements along LA 27 (fully funded)
14 Upgrade existing drainage network to meet current requirements/standards in areas with known flood history
15 LA 171 Redevelopment corridor (add sidewalks and bike facilities similar to the Prien Lake Road project)
16 Upgrade rural roads to current LADOTD standards (travel lanes, shoulder widths, drainage, etc.)
million 2–5 years
million 5–10 years
million 5–10 years
million 10–30 years
17 Elevate roadways in current flood prone areas and those susceptible to sea level rise in lower Cameron Parish (similar to Port Fouchon) TBD 10–30 years
• Infrastructure was identified as the most pressing problem for the region to address — drainage, inadequate road conditions, missing connections, and utilities that need investment.
• Infrastructure is often not visible, but is critical to allowing residents and businesses to thrive, access functional utilities, and move around efficiently.
• Future storms and disasters will threaten the region’s infrastructure. Hardening and upgrades will help SWLA be prepared and lessen future risks.
Resilient Utilities
18 E-Vehicle charging stations
19 Calcasieu Parish-wide ordinances for underground distribution of utilities for all new or modified developments
$2,000/ station 1–5 years
$50,000 2 years
20 Calcasieu Parish Water & Sewer — Step 1: Begin to consolidate districts $0 2–5 years
21 Calcasieu Parish Water & Sewer — Step 2: Create a single district for solid waster, water, and sewer to maximize economy of scale and cost savings
$0 10+ years
22 Calcasieu Parish Water & Sewer — Step 3: Extend sewers parish-wide $1 billion 5–30 years
23 Expand renewable and resilient energy sources in SWLA TBD 5–15 years
24 Enhance Broadband beyond state initiatives TBD 1–5 years
Other
25 Reduce flood and wind insurance through community measures (FEMA’s Community Rating System and FORTIFIED wind mitigation program through the Louisiana Department of Insurance
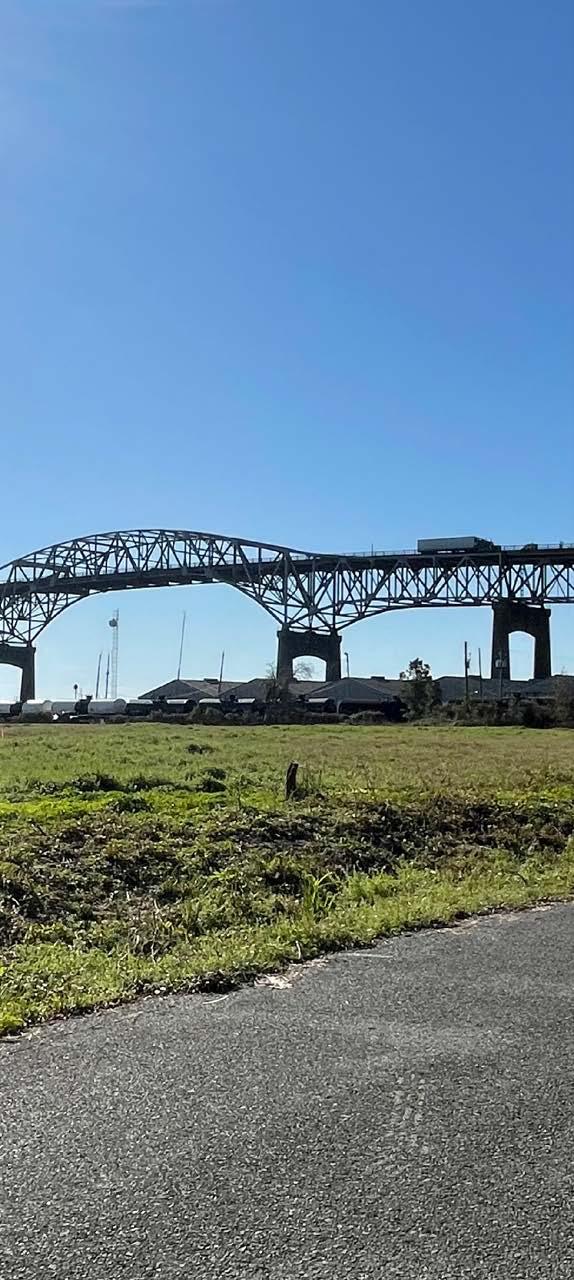
26 Explore a bike-share pilot program at the waterfront once the initial 4 miles of trails are established
Enterprise Boulevard Extension
Phase 1 of the Enterprise Boulevard extends from I-10 to Katherine Street in North Lake Charles. A possible future extension of Enterprise Boulevard could connect to N Goos Boulevard, Fitzenreiter Road, and Highway 171. The Enterprise Boulevard Extension should be designed as a two-lane community boulevard with pedestrian and bicycle paths that would enhance the experience and encourage connectivity from the Nellie Lutcher District to Riverside Park. The boulevard should be in
$250,000 2 years
scale with the neighborhood and should not create a high-volume or high-speed barrier between important community assets, such as Combre-Fondel Elementary School and the residential neighborhood. The Enterprise Boulevard Extension could enhance economic opportunities adjacent to the Calcasieu River as well as improve quality-of-life and access, as long as it is designed in a compatible with the existing neighborhood scale and uses.
A North I-210 Loop would provide enhanced access to development and neighborhoods in Westlake and Moss Bluff. This would benefit the region by opening new lands for residential development further from the coast and potentially at higher elevations. The process to explore a north loop would entail extensive analysis of environmental impacts and coordination with USDOT, LADOTD, and other federal, state, and local agencies.
A new regional high speed road closer to southern Calcasieu and northern Cameron parishes would improve hurricane evacuation, provide a second crossing of the Intercoastal Waterway, provide access to new and planned industrial development, and accommodate future population growth. Residents of Cameron Parish could access I-10
without having to travel through the City of Lake Charles or Carlyss. Any new connection over the ship channel and the Calcasieu River will require environmental assessment and coordination with DOTD and other approving agencies.
Many of the rural roads in both parishes are below LADOTD standards, lacking adequate shoulders, drainage, and lane widths. In Cameron Parish, LA27 is a critical evacuation route and should be prioritized for safety and functionality upgrades, including raising the road elevation.
Under Connect LA, Calcasieu and Cameron parishes and the municipalities are responsible for taking the lead to convince providers to apply for grants to expand access. The focus should be on expanding access to un- and under-served populations, improving affordability, and promoting digital literacy.
Drainage system upgrades are currently underway in both Calcasieu and Cameron parishes. 24 drainagement improvement projects totaling $189 million in Calcasieu Parish will increase stormwater capacity by:
• Clearing existing drainage laterals
• Widening channels
• Constructing new detention basins
• Increasing pump station capacity
Broadband expansion in Louisiana is managed by Connect LA, officially known as the Office of Broadband Development & Connectivity. ConnectLA is charged with expanding broadband access, improving affordability, and promoting digital literacy. Expanding broadband access involves addressing the un- and under-served populations. ConnectLA defines broadband as connections with minimum speeds of 25 megabits per second (Mbps) download and 3 Mbps (≥ 25/3 Mbps) uploads.
To accomplish their goal of 100% broadband access by 2029, ConnectLA issues grants to broadband providers who have partnered with municipalities to subsidize the cost of expansion and system upgrades. The broadband grants are funded by a variety of state and federal funding programs including the Infrastructure bill, American Rescue Plan Act, the Federal Communication Commission’s (FCC) Rural Digital Opportunity Fund, and the Word Digital Opportunities Fund.
An important aspect of the program is that providers are not required to expand access. In many cases, the municipality must take the lead and convince the provider to apply for the grants. In some cases, even with the grants, expansion may not make business sense for the provider, because of the small number or lack of concentration of customers. The FCC maintains the Fixed Broadband Deployment map to share the current providers and the level of services they offer. The map depicts the number of providers, by census block, that offer broadband (≥ 25/3 Mbps).
• The Community Rating System (CRS) is a voluntary incentive program.
• It recognizes and encourages community floodplain management practices that exceed the minimum requirements of the National Flood Insurance Program (NFIP).
• Over 1,500 communities participate nationwide.
• In CRS communities, flood insurance premium rates are discounted to reflect the reduced flood risk resulting from the community’s efforts that address the three goals of the program:
– Reduce and avoid flood damage to insurable property
– Strengthen and support the insurance aspects of the National Flood Insurance Program (NFIP)
– Foster comprehensive floodplain management
These improvements will relieve flooding problems, reduce flood damage and costs of damage, overtopping of roads with drain water, and will keep roadways free of water during periods of high precipitation.
Both parishes should write and adopt ordinances requiring underground distribution of utilities for all new development. Calcasieu and Cameron parishes should work with DOTD to underground utilities along roads as improvements are made in the public rights-of-way, especially along LA27 and evacuation routes.
In Calcasieu Parish, in the future, there are strategic opportunities to consolidate some existing water and sewer districts to facilitate efficiencies and expand capacity.
State building code requirements in Louisiana fall below the national standard for flood protection and require the minimum standard for wind protection. The adoption and enforcement of higher standards can and should be used to mitigate against future hurricane and flood events. Higher standards that result in meaningful mitigation actions will reduce insurance premiums, and if properly executed during construction, will resist damaging effects caused by extreme wind and flood events. By constructing the built environ-
ment to anticipate historic flood depths and windspeeds is a proactive way to protect the homes and business of SWLA.
More robust participation in FEMA’s Community Rating System (CRS) could reduce flood insurance rates. Cameron Parish could adopt or update floodplain management ordinances; implement programs, plans, and activities to maximize CRS points; and update building codes. The use of imported dirt fill to achieve freeboard requirements should be restricted or comprehensively studied in the Special Flood Hazard Area, as it has been shown to adversely impact neighboring structures, existing drainage, and natural hydrology. Pier and beam construction, which was the traditional style foundation in SWLA prior to the 1960s, should be encouraged for new construction.
FORTIFIED wind mitigation program can reduce homeowners insurance. FORTIFIED Roof program, which is being supported through a grant pilot program by the Louisiana Dept. of Insurance to provide insurance discounts up to 25–25%, aims to strengthen the roof system and minimizes the chances of water getting in homes. The FORTIFIED Silver program can provide discounts up to 35–45%, by strengthening the roof, windows, door and other vulnerable areas of your home to prevent wind and rain from causing serious damage.
FORTIFIED Gold provides a 45–55% discount by combining the FORTIFIED Roof and Silver, plus a continuous load path to provide maximum protection from wind.
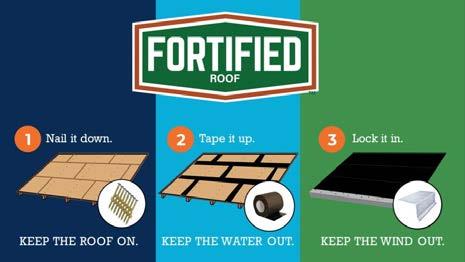
• A voluntary construction and re-roofing program designed to strengthen homes and commercial buildings against specific types of severe weather such as high winds, hail, hurricanes, and tornadoes
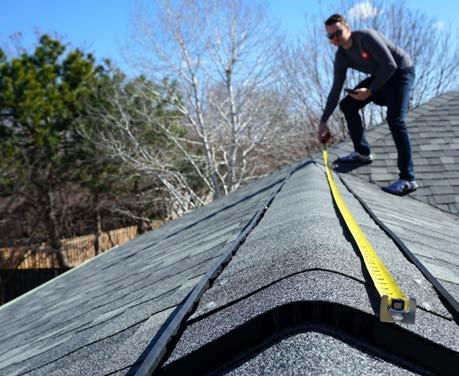
• A standard that goes above minimum building codes to make a home or building stronger and more protected in the case of disasters
• A system that can provide discounts of up to 55% on homeowners insurance

The Natural and Cultural Resource recommendations in this section build on those already described within the 10 Catalytic Projects.
Natural and Cultural Resources Recommendations are based on:
1. Assessment of the existing network of resources
2. Natural and Cultural Resources Guiding Group meetings and input
3. Public input throughout the process
Plan recommendations are listed in the tables along with the estimated costs and time frames. Several key recommendations are described in more detail.
Southwest Louisiana’s unique food and culinary

traditions form the basis of a cultural identity that attract tourists and new residents interested in participating in the culinary economy. Establishing a constellation of unique experiences, such as catch-and-cook opportunities, kitchen incubators, food truck infrastructure, and enhanced festivals will bring new jobs and people to the region, while enhancing quality of life and cultural experiences for existing residents.
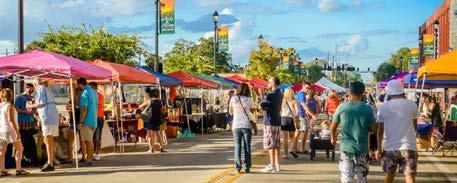
The EDA has granted $1.6 million in American Rescue Plan funds to build a new Mardi Gras Museum in the Nellie Lutcher District along Enterprise Boulevard. In addition to the museum, the redevelopment of Enterprise Boulevard is anticipated to attract related small businesses, including a king cake bakery, decoration and bead shop, and spaces for costume makers and artisans.
The City of Lake Charles has plans to enhance the existing Arcade Amphitheater. Upgrading the facility would allow for indoor and outdoor ticketed performances, enhanced food and beverage service, and the ability to host a wider range of activities and events.
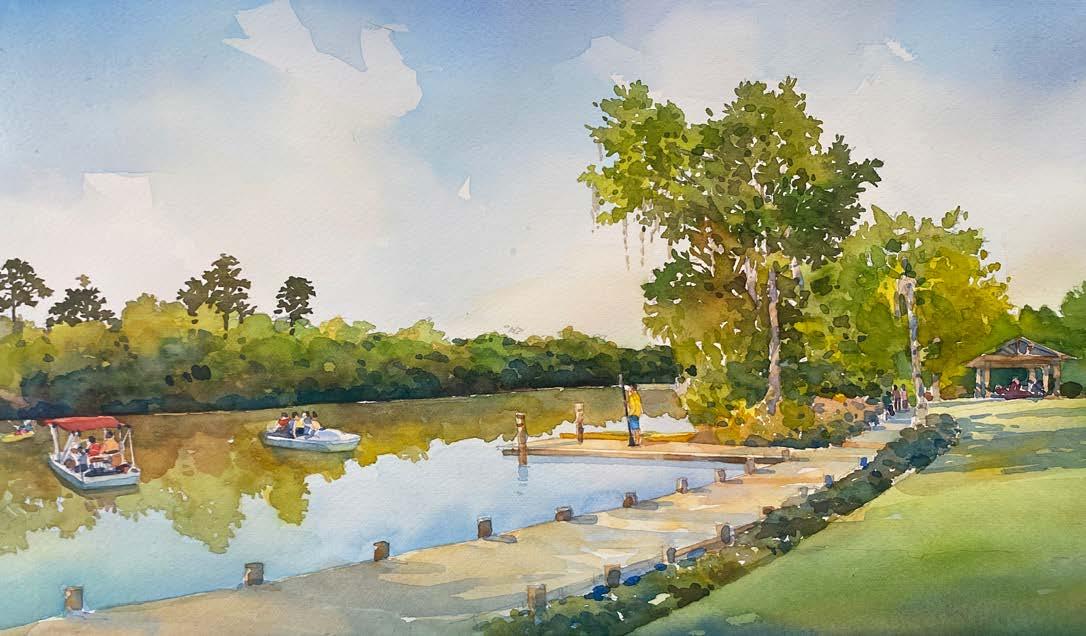
In order to retain and attract employees with families, Calcasieu and Cameron parishes must create more family-friendly destinations, entertainment, and environments. These uses include sports and recreation, shopping, indoor and outdoor entertainment options, parks and trail networks, spaces and attractions for teens, arts and creative spaces,
and enhanced educational amenities and opportunities.
Green infrastructure is applicable to many of the catalytic projects and beyond as a cost-effective way to mitigate flooding and improve water quality. Green infrastructure can also create amenity spaces for residents. To learn more about Green Infrastructure, please reference the following information in appendices:
• Green Infrastructure Center ordinance recommendations related to tree canopy, rain gardens, and chenier restoration
• Best Practice Management (BMP) Library
Natural & Cultural Resources
• Southwest Louisiana’s spectacular natural resources are a unique draw — access needs to be improved, while also protecting and enhancing the natural resources themselves.
• Calcasieu and Cameron parishes have rich cultures with festivals, cuisines, and music that are unique to the region.
Food & Culinary Culture
1 Develop a cultural food hub or incubator kitchen for Cajun, Creole, and Acadian food with food truck hook-ups
$8–14 million 2–5 years
2 Establish a Catch & Cook program throughout SWLA TBD 2–5 years
Cultural Venues & Events
3 Lease empty spaces at the Central School Arts & Humanities Center to creative entrepreneurs, artists, and makers n/a 0–2 years
4 Develop the Mardi Gras museum in the Nellie Lutcher Cultural District, including a bakery, shop, and space for costume makers and artisans
$3–5 million 1–3 years
5 Develop the LAVA performing arts center in the Nellie Lutcher Cultural District $15+ million 2–5 years
6 Build an enhanced amphitheater and music venue on the Lakefront TBD 2–5 years
7 Develop music and food-focused entertainment along waterfronts TBD 2–5 years
8 Develop a SWLA Sportsman Festival TBD 2–5 years
9 Enhance Meet Me at the Market TBD 1–2 years
10 Build new spaces for local musicians to rehearse and record, dedicated to the celebration of Zydeco and Cajun music TBD 5–10 years
Family-Friendly Entertainment
11 Expand family-friendly events and programs offered in the region, including arts, recreation, education
TBD 1–5 years
12 Enhance the amenities at the Lake Charles beach to make it more family-friendly (such as restrooms, changing areas, umbrella and chair rentals, etc.) TBD 1–2 years
13 Enhance beach and lake access in Cameron Parish at Big Lake, Hackberry (lake access), Rutherford Beach, and Holly Beach
Protection & Enhancement of Natural Resources
14 Create a common co-working or incubator space for environmental non-profits (explore locating an environmental hub in a Community Resilience Hub in or near Cameron Parish)
TBD 5–10 years
15 Adopt ordinance changes and best practices recommended by the Green Infrastructure Center related to tree canopy, rain gardens, and chenier restoration TBD 1 year
16 Use the Keep Louisiana Beautiful storm drain art project and other Keep America Beautiful best practices to expand awareness of the impact on natural waterways and wildlife habitats
17 Establish long-term curbside municipal and parish recycling programs
18 Increase the number of trash receptacles in urban areas
19 Install litter and debris catchment systems to protect bayous and coulees
19 Fund and support a robust litter management program to keep natural areas clean and beautiful as the number of visitors increases, including the use of incentives
TBD 1
Community members identified litter and trash management as one of the top challenges facing the region and the Natural and Cultural Resources Guiding Group focused many of its discussions on addressing this issue.
Litter not only harms and detracts from the natural environment, but it also deters investment and future residents from investing in Southwest Louisiana. In the waterways and lateral systems, litter adds to other debris, impeding drainage, and exacerbating flooding.
Solutions must focus on systemic approaches, not only personal responsibility campaigns — establishing curbside municipal and parish recycling programs, installing litter and debris catchment systems to protect bayous and coulees, increasing the number of trash receptacles in urban areas, and funding a robust litter management program in natural areas.
From its conception, the Community Foundation Southwest Louisiana established the expectation that the Just Imagine SWLA 50-Year Resilience Master Plan recommendations and the 10 catalytic projects be implementable. This informed the selection criteria for the projects, the vetting and development of action steps, and the intentional involvement of partners early in the process. Concern from the participants of the plan was built on public desire for improvements to quality of life and it balances the community’s aspirations with what is achievable in the 10-, 20-, and 50-year time frames. The implementation strategy laid out in this chapter addresses the partnerships roles, implementation structure, and funding and financing mechanisms. In addition to this Implementation chapter, there is also an implementation table for each of the 10 Catalytic Projects, in each respective section of the plan.
Each of the projects lay out the action steps in sequence, along a timeline. The project teams, as described in this section, are responsible for making progress through the action steps. The Community Foundation’s role as continued convener of the public and private partners, the champions, and other implementers will build accountability. Each project team will use a tracking spreadsheet to record progress and will create incremental progress reports and updates at regular intervals to document what has been accomplished and changing targets. Yearly, five-year, and 10-year progress plans should recorded as addendums to this master plan document.
Implementation
• Public-private partnerships (PPPs)
• Publicly funded and led projects within rights-ofway and on publicly owned land
• Incentives and improved economic environment for private investment
• Ordinance and policy updates
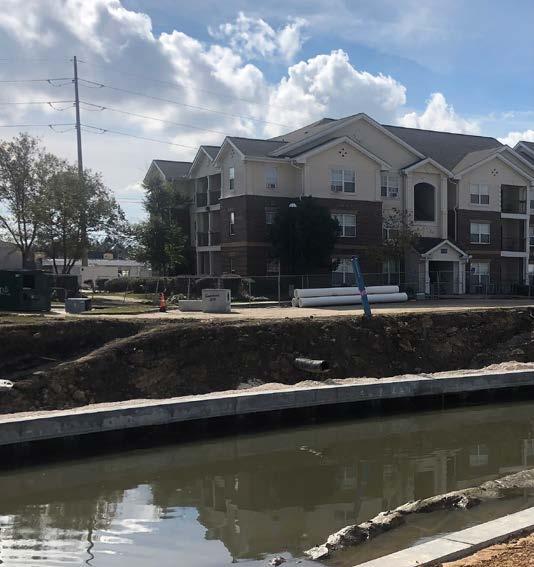
• Public support for taxes and millages
• Rezoning and entitlement of strategic parcels
• Leveraging of the region’s disaster recovery funds and once-in-a-generation federal appropriations
• Incremental improvements to quality of life
The Lake Charles Waterfront will show signs of early progress and investment. The parking garage is being renovated to support the Crying Eagle brewery and restaurant and Port Wonder. The beach will be activated by Lake Area Adventures and Paul’s Rib Shack.
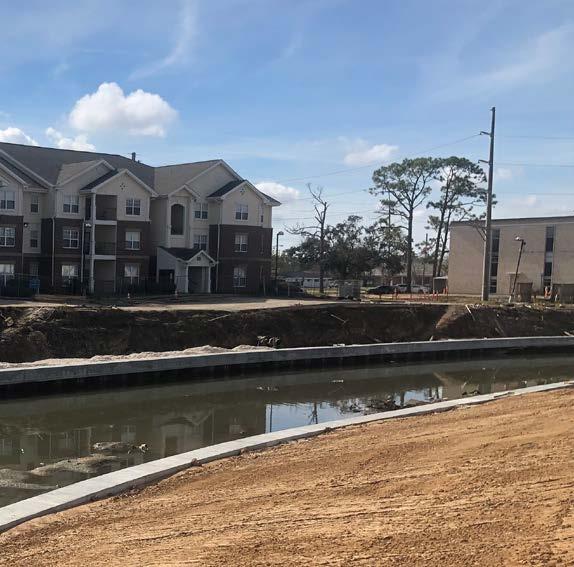
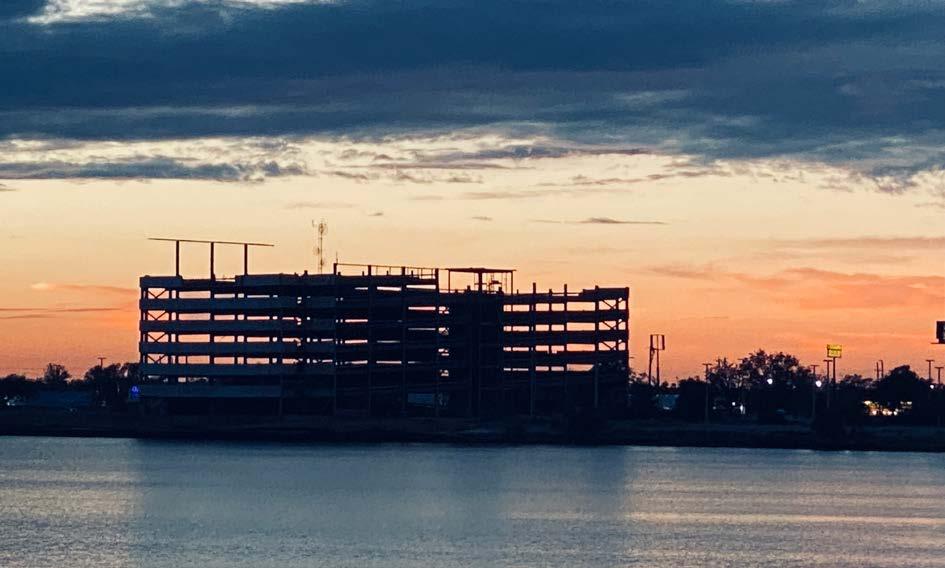
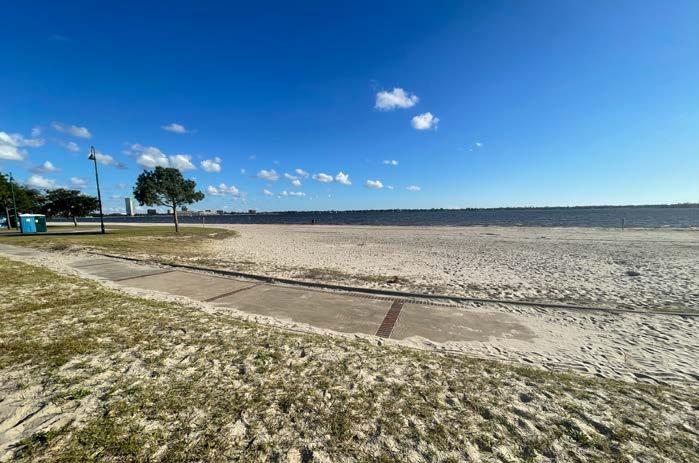
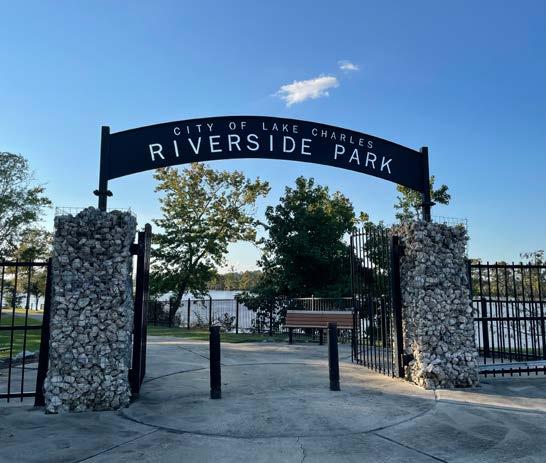
At the Implementors Working Dinner in the final step of the Just Imagine process, lead and supporting partners and project champions worked through a project
Implementation of the catalytic projects and policy recommendations require public and private partners to collaborate on action steps and sub-projects.
The Just Imagine process brought public, private, and non-profit partners to the table to collaborate as co-implementors. New partnerships are being formed between individuals and organizations who recognize the value of working to reinvest in Southwest Louisiana for everyone’s benefit.
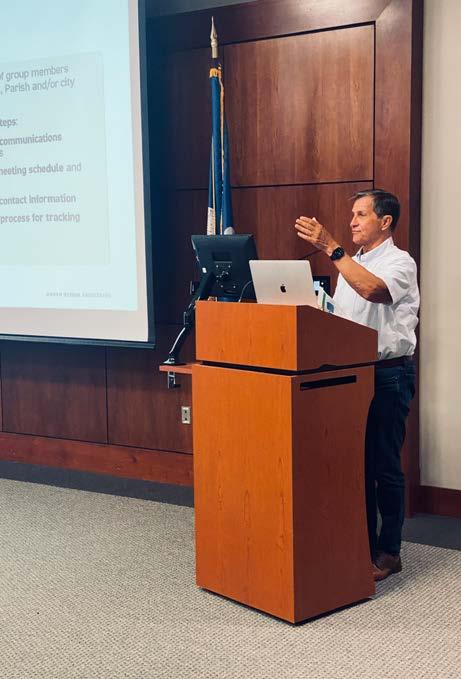
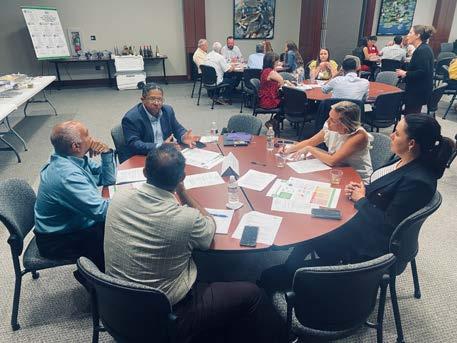
Each project’s implementation matrix lays out a public, private, or non-profit sector lead entity and supporting organizations. These responsibilities will be determined with the key stakeholders’ involvement. This process builds accountability into the plan and can be used to track progress through the early years of implementation.
A lead entity partner has been identified for each project. The Project Lead role entails:
• Acting as the overall project manager to ensure tasks are moving forward
• Coordinating regular meetings for the Project Implementors and Champions
• Aligning political support for the project at all levels (federal, state, regional, and local)
• Applying for funding (grants, financing, etc.)
• Leading property acquisitions, entitlements, approvals, and construction, where applicable
Parish Partners
• Calcasieu Parish Police Jury
• Calcasieu Parish Administration
• Cameron Parish Police Jury
• Cameron Parish Administration
Regional Partners
• SWLA Economic Development Alliance
• Chamber SWLA
• Regional Planning Commission
• Visit Lake Charles
• Entergy
Municipal Partners
• City of Lake Charles
• City of Westlake
• City of Sulphur
• City of DeQuincy
• Town of Iowa
• Town of Vinton
Foundations and Funding Partners
• Community Foundation Southwest Louisiana
• Bayou Greenbelt Fund
Authority & Quasi-Governmental Partners
• Lake Charles Housing Authority (LCHA)
• Chennault International Airport
• Chenier Plain Coastal Restoration and Protection Authority (CPCRPA)
• Cameron Parish Port, Harbor & Terminal District
• Port of Lake Charles
Advocacy Partners
• Alliance for Positive Growth
Non-Profit and Community Partners
• Arts and Humanities Council SWLA
• Project Build a Future
Education Partners
• Calcasieu Parish School Board
• Cameron Parish School Board
• McNeese State University
• SOWELA
Businesses and Employers
• Phillips 66
• Chenier Energy
• Sasol
• Stine Lumber
Media Partners
• KPLC
• American Press
• The Advocate
• Thrive Magazine
State Partners
• Coastal Protection and Restoration Authority (CPRA)
• Lousiana Office of Community Development
• Louisiana Housing Corporation
• LADOTD Federal Partners
• FEMA
• National Parks Service
Two Project Champions have volunteered for each project. The Champions will play a critical role in advancing and supporting the projects. The role of the Project Champions include:
• Maintaining regular communication with the Project Lead and Supporting Partners
• Supporting and making connections between implementers and others could have a positive influence on the project
• Advocating to and building relationships with elected officials and funders
• Educating others in the community about the benefits of the project (such as presenting about the project’s impact and progress to civic organizations or similar groups)
Supporting Partners will lead and execute sub-projects and components of the larger project. They will support the Project Lead with communications, marketing, recruitment, financing, regulatory changes, and political support.
Just Imagine SWLA established an implementation structure to provide the foundation and working relationships for the partners to move immediately into implementing early action steps.
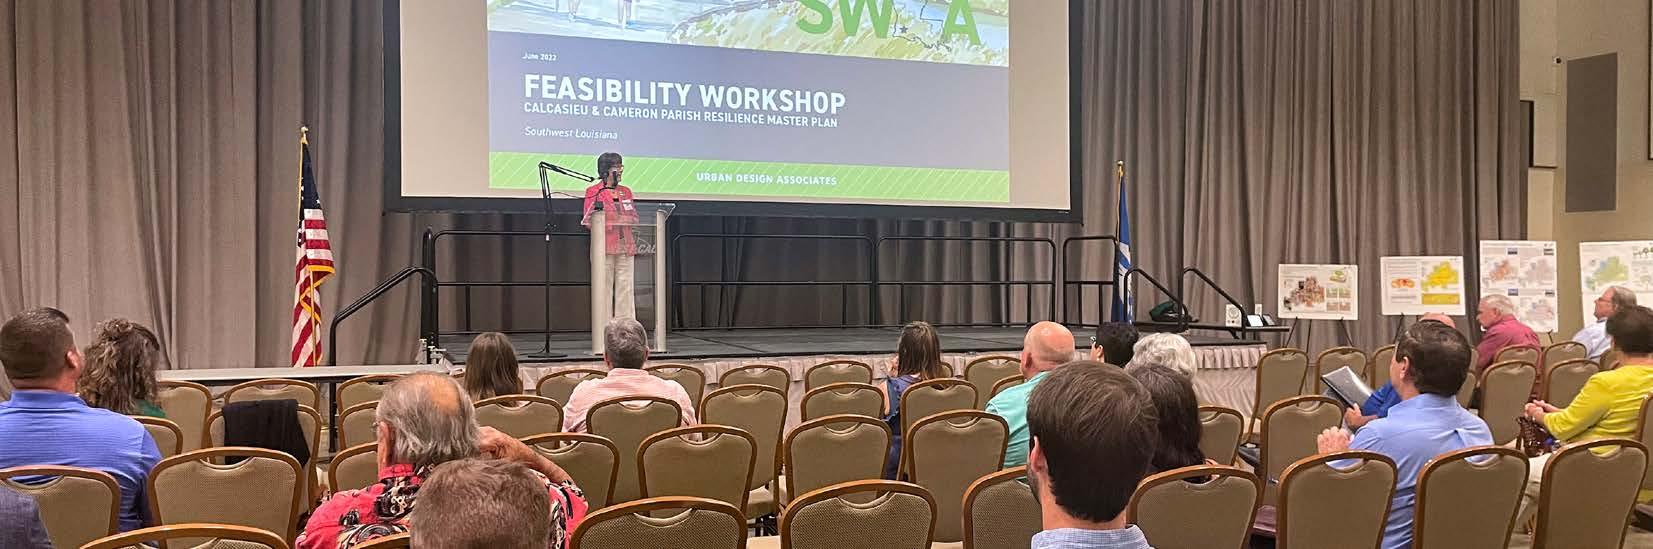
Project teams will meet every 4-6 weeks. The teams scheduled their initial meetings at the July 12, 2022 Implementor’s Dinner. The purpose of these monthly meetings will be to track progress,
address roadblocks, and to keep the project moving through the action steps along the projected timeline.
The Community Foundation will convene the Project Champions quarterly meeting with monthly electronic communication. This will provide opportunities for cross-project learning and problem-solving. The Project Champions will report on strategies that are working well within their project teams, lift up any needed support from other champions or the Foundation, and compare progress.
Implementation EARLY WINS
Project 3: Mid-City Neighborhood Transformation
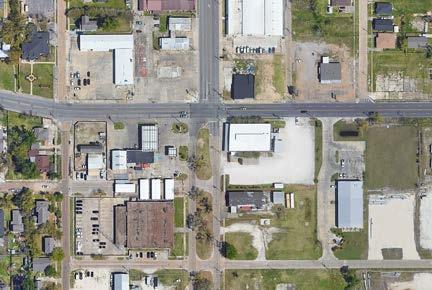
Project Lead(s)
Community Foundation SWLA
The Community Foundation
Public Supporting Partners
Project Champions
SWLA will continue to play the role of convening and supporting the 10 projects. The Foundation will also provide oversight and will monitor progress.
The Mid-City Neighborhood Transformation project team signed a contract with national non-profit Urban Strategies to begin putting together a transformation plan to prepare to apply for the HUD Choice Neighborhoods Implementation Grant.
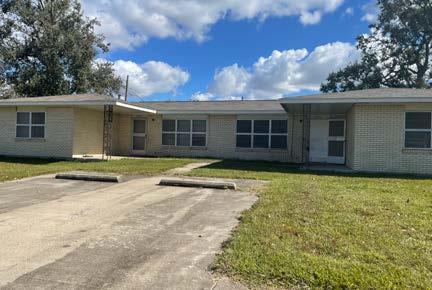
Private Supporting Partners
Community & Non-profit Supporting Partners
Project 4: Nellie Lutcher District
The 2022 Leadership Southwest Class selected the art crosswalks at Enterprise Boulevard and Broad Street as their capstone project. The Leadership Class is in the process of selecting and working with a local artist to design the crosswalk and they will be completed before the end of 2022.
Each of the 10 Catalytic Project sections identifies the potential funding sources for the public sub-projects and components. Funders and partners worked with the Just Imagine SWLA team to identify and verify the appropriateness of these sources, including FEMA, Louisiana Office of Community Development, and the Louisiana Housing Corporation. It is important to recognize that the 10 Catalytic Projects are actually combinations of smaller private and public projects. For example, the Nellie Lutcher District Catalytic Project includes the following sub-projects:
• Broad Street and Enterprise Boulevard road diets and street transformations
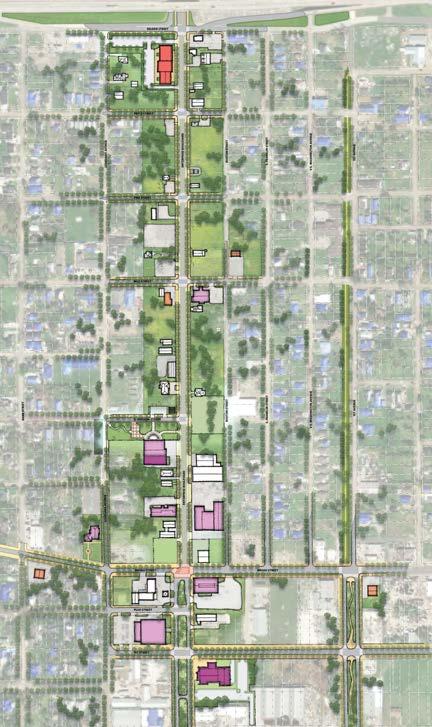
• Nellie Lutcher Memorial Park
• Mardi Gras Museum
• Development of vacant and underutilized parcels and buildings into food and beverage businesses, places of employment, entertainment destinations, and neighborhood service uses
• Development of a community performing arts theater
Catalytic projects will entail multiple sub-projects, funded through public, private, and philanthropic funding sources.
Public funding sources form the base of the capital stack for projects with public benefit. Public funding sources are appropriate for projects such as:
• Creation of public gathering space and parks
• Street transformations and public right-of-way projects
Implementation
HOW WILL THESE PROJECTS BE FUNDED?
• Federal grants and funding sources that pass through the state
• City and Parish matches for the federal and state grants
• Private investments adjacent to new streets, public spaces, and other public investments
Public funding sources that leverage private investment — sources that complement one another, maximizing impact and minimizing gaps.
• Improvements to walking and bicycling networks
• Utility extensions
• Green infrastructure and drainage improvements
• Public-use buildings (community centers, community resilience hubs, museums, schools, libraries, government facilities, etc.)
• Financial incentives for private development projects that are not yet market feasible (such as low- or no-interest financing, bonds, 99-year land leases on public land, tax credits, small grants, etc.)
The majority of funding sources identified in the 10 Catalytic Projects and the Funding Inventory are public funding sources.
Private funding sources typically fund the majority of private development (for-profit buildings and uses on privately owned land). Private funding sources typically include:
• Conventional bank debt
• Subordinated debt
• Private capital and equity
Philanthropic grants should act primarily as the gap equity for both public and private projects. The intent is to ensure that grants from donors and foundations are leveraging the maximum public and private sources first. Grant requirements will be defined to ensure the desired impact.
• 30 years ago, Oklahoma City’s downtown lacked livability and beauty — United Airlines turned down the City’s bid for a new facility because of the poor quality-of-life.
• In 1993, MAPs was adopted. It included a 1% sales tax with a seven-year sunset. Residents voted on the tax and the bundled projects.
• Projects must be visionary and transformative.
• The first MAPs totaled $350 million and included connected waterways, trails, and recreation; mixeduse districts, performing arts venues, and enhancements to the visitor experience.
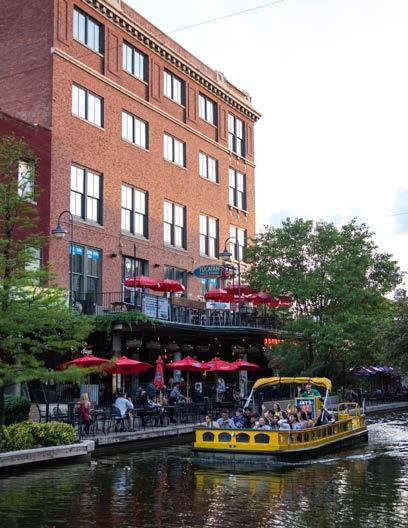
• There have been four rounds of MAPs funding, totaling $2.5 billion. All projects were self-funded.
25 Years of Change Through Public and Private Investment
Funding Inventory
Federal HUD Choice Neighborhoods Implementation Grant Funding for revitalization of public housing and surrounding neighborhoods
Federal HUD Choice Neighborhoods Planning Grant Funding for housing authorities to complete planning processes to transform public housing and neighborhoods up to $450,000
Federal HUD Choice Neighborhoods Planning + Action Grant Planning grant + funding to complete early action implementation activities up to $1.5 million Federal/State Restore Louisiana — CDBG-DR Congress allocates billions in funding to HUD for necessary expenses related to natural disasters relief, long-term recovery, restoration of infrastructure and housing, and economic revitalization following a presidentially declared disaster
Housing
Federal/State Louisiana Housing Coalition FEMA’s Multi-Family Lease and Repair Program (MLRP)
Eligible participants may qualify to receive financial assistance to repair rental housing. At a minimum, the property and the property owner must meet the following requirements to participate:
• Have previously been used as multi-family rental housing; be located in an area impacted by a major disaster or designated for IA under a major disaster declaration
• Be located within reasonable access to community and wrap-around services such as accessible public transportation, schools, fire and emergency services, grocery stores, etc.
• Be available to be leased for FEMA’s exclusive use as temporary housing for eligible applicants for a term of no less than 18 months from the date of declaration
• Agree to allow FEMA to make reasonable accommodation and/or modification repairs or improvements during the term of the lease agreement without requiring FEMA to remove the improvements at the end of the lease agreement
• Provide all property management services, including building maintenance, except where the property is leased or contracted from another government entity, in which case FEMA may directly provide such services
National USDA Rural Energy Savings Program
Provides loans to entities that agree to make affordable loans to help consumers implement cost-effective, energy efficiency measures
State Louisiana Housing Coalition HOME I MRB Program
Home buyer assistance — down payment and closing cost assistance for buyers at 80% or less (5-9%)
State Louisiana Housing Coalition Mortgage Revenue Bond Assisted Program Home buyer assistance — down payment and closing costs (soft second that is equal to 4% of the mortgage amount)
State Louisiana Housing Coalition Market Rate GNMA Program Home buyer assistance — 30-year fixed rate FHA, VA, or USDA loans with favorable interest rates
Housing
State Louisiana Housing Coalition Market Rate Conventional Program
State Louisiana Housing Coalition Premier Program
State Louisiana Housing Coalition Mortgage Credit Certificate (MCC) Program
Home buyer assistance — up to 80% AMI, max loan amount of $484k — 4% assistance for down payment, closing costs, and prepaid items
Home buyer assistance — Conventional mortgage for incomes up to $99k — 5% assistance for down payment, closing costs, and prepaid items
Home buyer assistance — federal tax credit of up to 40% of annual mortgage interest payments for the life of the loan (capped at $2,000 per year) — low and moderate income first time home buyers
State Louisiana Housing Coalition Resilience Soft Second Mortgages
Home buyer assistance — covers the affordability gap between what homeowners can afford and price of the house — for those 80% AMI and below (properties cannot be in a flood zone) — soft second loan for 20% of the purchase price up to $55k, up to $5k closing costs for a total of up to $60k
State Louisiana Housing Coalition
State Louisiana Housing Coalition
9% LIHTC
4% LIHTC
State Louisiana Housing Coalition CHDO Single Acquisition Rehabilitation (CSAR) Program
Tax credits to cover 70% of the cost to build/renovate new housing for households making up to 60–80% AMI
Non-competitive tax credits to cover 30% of the cost to build/renovate new housing for households making up to 60–80% AMI
Non-competitive grants through the HOME Investment Partnership Program to develop home ownership for households making up to 80% AMI
State Louisiana Housing Coalition Multi-family Revenue Bonds Financing for developers to acquire, construct, and/or rehab affordable housing for low to moderate income — paired with 4% LIHTC
State Louisiana Housing Coalition Non-profit Open-Cycle Affordable Housing Program (NOAH)
HOME funds to non-profit housing development organizations (for acquisition, construction, or rehab) — rental units can’t exceed 30% of adjusted income or is less than 65% AMI — ties to PBV
typically $10–$20 million per award
$200,000 maximum award
State Louisiana Housing Coalition CHAAP (CHDO Annual Awards Program)
25% of the HOME allocations are set aside for funding eligible programs proposed by state certified CHDOs — pays for development costs
LEVEL SOURCE/ENTITY PROGRAM
Housing
State Louisiana Housing Coalition
Multi-family HOME Loans to affordable housing developers to buy, build, or rehab as well as direct assistance to low-income individuals — builds in affordability for 20 years (NC) and 5–15 years for homeownership and rental rehab (“participating jurisdictions using HOME funds must reserve at least 15% of allocations to fund”)
State Louisiana Housing Coalition Weatherization Assistance Program
State Louisiana Housing Coalition LIHEAP (Low-Income Home Energy Assistance Program)
Infrastructure
Federal FEMA Emergency Management Performance Grant Program (EMPG)
Federal FEMA Flood Mitigation Assistance Program (FMA)
Federal FEMA Hazard Mitigation Grant Program (HMGP)
Federal FEMA Port Security Grant Program (PSGP) Port recovery
Federal FEMA Building Resilient Infrastructure and Communities Grant Program (BRIC)
Supports states, local communities, tribes and territories as they undertake hazard mitigation projects, reducing the risks they face from disasters and natural hazards. BRIC is a new FEMA pre-disaster hazard mitigation program that replaces the existing Pre-Disaster Mitigation (PDM) program
Federal FEMA Individual State Earthquake Assistance (ISEA): Region 6
Federal FEMA Multi-State National Earthquake Assistance (MSNEA)
Federal US Department of Energy
Bipartisan Infrastructure Law (BIL) — Electric Drive Vehicle Battery Recycling and Second-Life Applications
Support the establishment of earthquake hazards reduction programming and the implementation of earthquake safety, mitigation, and resilience activities at the state and local level
Mitigate earthquake losses in the United States through basic and directed research and implementation activities in the fields of earthquake science and engineering
Focus on Electric Drive Vehicle Battery Recycling and Second-Life Program which includes second-life applications for electric drive vehicle batteries that have been used to power electric drive vehicles; and technologies and processes
$59,772
$450,000
Federal American Rescue Plan Act (ARPA) and Office of Community Development (OCD)
State Office of Community Development (OCD)
State Office of Community Development (OCD)
FEMA Match programs — Non-federal Share Match Program
HMGP Global Match Program
Funds for sewer/water
$12 million
$150 million
$35,232,774
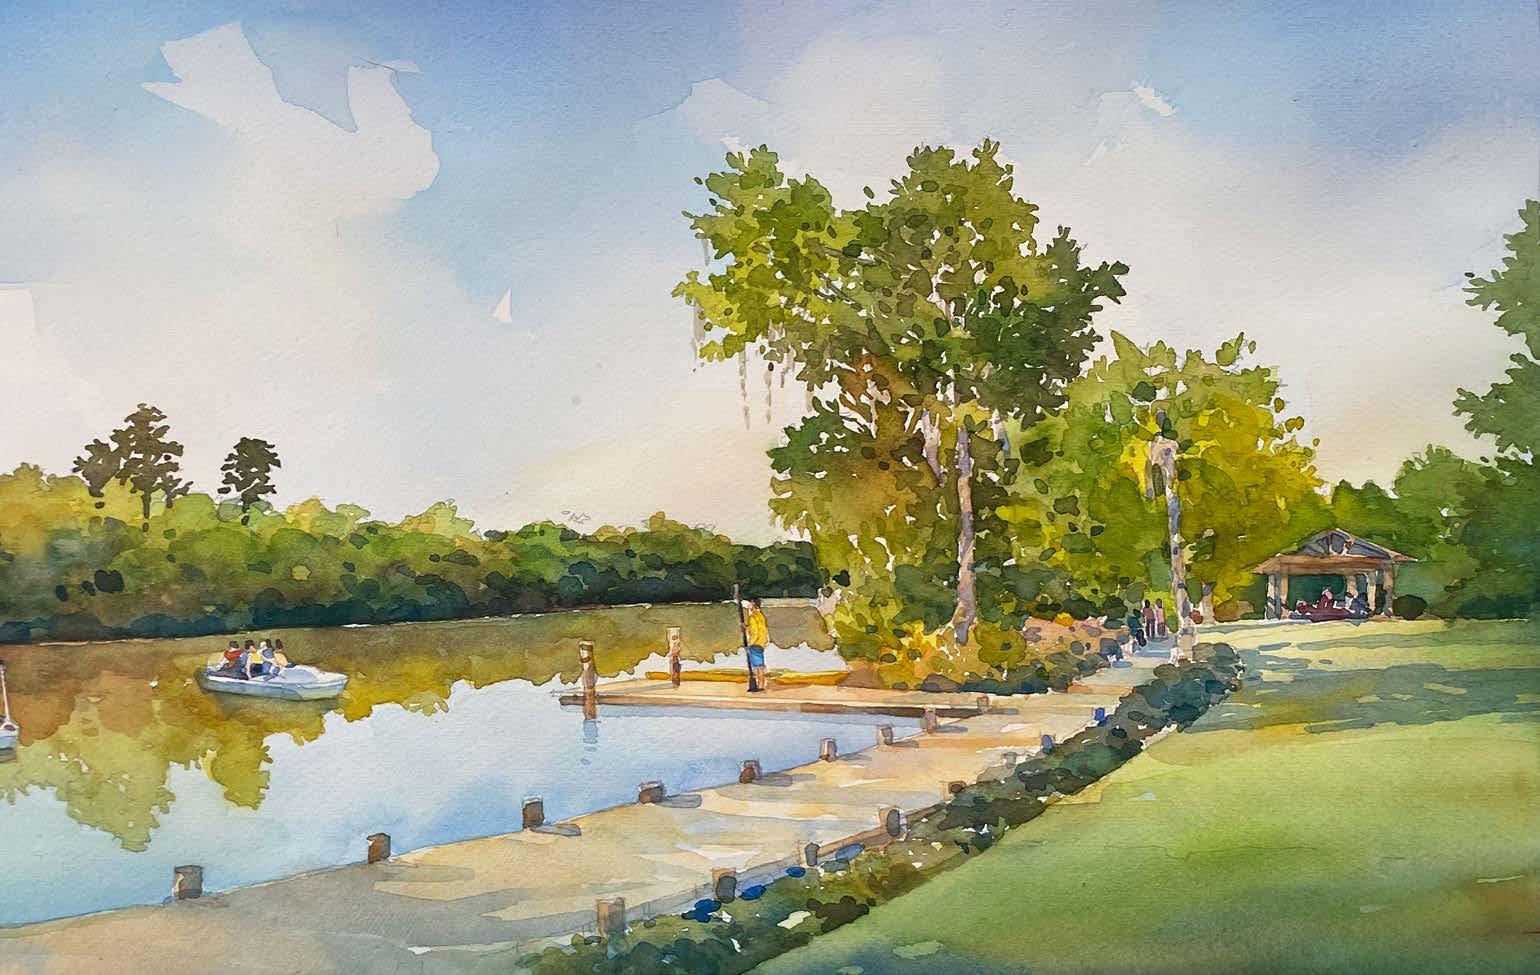
Economic Development
Federal USDA Distance Learning & Telemedicine (DLT) Grants Program
Federal SBA SBA Program for Investment in Mircoentrepreneurs (PRIME)
Federal US Department of Labor Work Opportunity Tax Credit Funding Allotments (WOTC): Formula Grants
Helps rural communities acquire the technology and training necessary to connect educational and medical professionals with students, teachers, and patients in rural areas
Funding to qualified organizations for the purposes of providing training and technical assistance to disadvantaged entrepreneurs
State allotments (via formula grants) to State Workforce Development Agencies to conduct Work Opportunity Tax Credit (WOTC) activities
Federal IRS Low Income Taxpayer Clinic (LITC) Provide representation, education, and advocacy for low income and ESL taxpayers
Federal IRS Volunteer Income Tax Assistance (VITA) Matching Grant Program
Federal FAA FAA Aircraft Pilots Workforce Development Grant Program
IRS initiative designed to support free tax preparation service for the underserved through various partner organizations
Support the education of future aircraft pilots and the development of the aircraft pilot workforce by preparing high school students to fill the US aviation industry’s anticipated demand for aircraft pilots, aerospace engineers, and teachers
$1 million
$250,000
$1,453,015
$100,000
$2 million
$500,000
Federal US Department of Labor Workforce Innovation & Opportunity Act (WIOA): Leadership for Employment & Economic Advancement of People with Disabilities — Policy Development Center
Federal US Department of Labor Workforce Opportunity for Rural Communities (WORC): Grant Initiative for the Appalachian & Delta Regions
Work across the full range of workforce systems to develop policies and provide technical expertise that increases competitive integrated employment (CIE) services, opportunities, and outcomes for individuals with disabilities
$2 million
Assists eligible communities in diversifying their economies by investing in developing a skilled workforce through training and other approaches that align with local strategies developed by regional partners
Federal/Tribal IRS Tax Counseling for the Elderly (TCE) Free tax help for individuals who are 60 years and older
$1.5 million
LEVEL SOURCE/ENTITY PROGRAM DESCRIPTION
Economic Development
National MIT Solve MIT Solve Truist Foundation Inspiration Awards
The Truist Foundation Inspire Awards, administered by MIT Solve, aim to identify innovative non-profit-driven solutions that provide support to develop and sustain racially diverse and/or women-led small businesses in the United States
$250,000 (1st)
$150,000 (2nd)
$75,000 (Audience Favorite)
National Amazon Web Services, Inc. (AWS) IMAGINE Grant Program
Provides resources to non-profit organizations looking to deploy cloud technology to achieve their mission goals. AWS is seeking proposals for pilot projects, proofs of concept, or existing programs that utilize technology in a new or expanded way
$30,000 (Momentum to Modernize)
$150,000 (Go Further, Faster)
National Comast RISE Comcast RISE Investment Fund (Representation, Investment, Strength, & Empowerment) and Marketing & Tech Services Awards
Parish, Municipal Local/Parish bonding Local/Parish bonding
State Office of Community Development (OCD) Restore Louisiana, Economic Development Programs — Small Business Loan and Grant Program
Comcast RISE aims to create sustainable impact and give meaningful support to the small businesses who are shaping our communities
$10,000 + technical assistance
$100,319,482
Natural and Cultural Resources
Parish Property tax
Federal EPA
Federal NOA Coastal Resilience Grant Program
Federal Fish and Wildlife Service (FWS)
National Coastal Wetlands Conservation Grant Program
20-year property tax to fund wetland restoration
Use stormwater fees to fund mitigation projects
Federal DOD Strategic Environmental Research and Development Program (SERDP)
The National Coastal Wetlands Conservation Grant Program funds projects to protect, restore, and enhance coastal wetland ecosystems and associated uplands. The grants are funded through the Sport Fish Restoration and Boating Trust Fund, which is supported by excise taxes on fishing equipment and motorboat fuel.
Partnership program between the DOD’s environmental science and technology program, DOE, EPA, numerous other federal and non-federal organizations. The program invests across a broad spectrum of basic and applied environmental research, as well as advanced development.
Federal National Fish and Wildlife Foundation (NFWF)
Five Star and Urban Waters Restoration Grant Program Gulf Coast Conservation Grants Program
National Coastal Resilience Fund Resilient Communities Program
Federal Sea Grant and the US Coastal Research Program (USCRP)
Integrate research, its application, and community engagement in thematic areas of long-term coastal evolution, extreme storms, and human and ecosystem health. Proposals should address the needs or gaps that have been identified by or are evident from USCRP-funded projects (PDF list), to move research project findings toward application through service delivery and decision support for coastal community decision-makers, planners, and other coastal stakeholders.
Approximately 10–20 projects may be funded at up to $150,000 over two years (Tier 1) or up to $500,000 over four years (Tier 2). Matching funds will not be required for this competition.
Federal USDA State Conservation Innovation Grants (CIG): Louisiana
Stimulate the development and adoption of innovative conservation approaches and technologies in conjunction with agricultural production
$150,000
Natural and Cultural Resources
Federal US Department of the Interior | Bureau of Land Management
State Youth Conservation Opportunities on Public Lands: Eastern States Headquarters
Federal USGS USGS Water Use Data & Research (WUDR) Round 2
Young people are recruited from local communities to assist with conservation projects that protect and promote multiple-use on public lands. Emphasizing on-the-ground projects, training, and mentorship opportunities for participants
Opportunity to State water resource agencies that collect water-use data to participate in the Water Use Data and Research (WUDR) program. To support State Water Resource agencies in the collection and reporting of wateruse data
$60,000
Federal Fish and Wildlife Service (FWS)
Preventing the Introduction & Spread of Invasive Species through Strategic Landscape-Level Approaches
Strategic, ecologically based landscape-level invasive species prevention measures that benefit multiple bureaus and geographic areas; smaller scale projects requesting under $200,000 will not be considered
$125,000
Federal Fish and Wildlife Service (FWS)
Federal National Endowment for the Humanities
North American Wetlands Conservation Act (NAWCA): US Standard Grants
Media Projects — Aug 10 deadline
National Can'd Aid Crush it Crusade
Funding may only be used for long-term protection, restoration, enhancement, and/or establishment of wetland and associated upland habitats to benefit migratory birds
The Media Projects program supports film, television, and radio projects that engage general audiences with humanities ideas in creative and appealing ways
Crush it Crusade grants provide recycling bins, training on how to launch and manage a recycling program, and seed funding
$1,852,550
$1 million
National Schmidt Marine Technology Partners
Schmidt Marine Global Fisheries Tech Initiative
Funding to support development of new technologies that increase fisheries sustainability. Focus will be on new or improved methods and tools for fisheries data collection, especially those enabling fisheries stock assessments
$1 million
$5,000–$10,000
$100,000–$400,000 (annual)
• We need to look at opportunities in the “Creative Economy” (sometimes called “Cultural Economy”)
– There are many ways to define the industries and occupations that should be included
• Look at Creative Vitality (CV), Americans for the Arts (AFTA)
– Some industries were also added to CV (but not shown)
• Cultural Economy makes up a small amount of employment in the area, depending on definition
– CV : 2% - 9%
– AFTA: 1% – 1.5%
• Cultural Economy makes up a small percentage of area GDP (expected – 0.6% - 3.1%
Some of the amounts may be surprising at first glance (Independents, Fine Arts, Photography, etc.), but the LQ’s are relatively low.
The top growing creative industries from 2001-2019 are projected to fall from 2021-2032. Civic and Social Organizations, Promtoers, Fine Arts Schools, Software Publeishers are projected to grow the most.
Some of the fastest growing occupations over the past 20 years are projected to fall over the next 10. The projected growth is concentrated in general workers.
The biggest gaps occur for teachers, performers, and general workers. In terms of jobs requiring a bachelor’s degree, many designers are needed.
1. Regional Coastal Flood Protection
a. Economic development essential for maintaining and growing current industries and recruiting new industries
b. Long-term perspective but must begin
c. Federal support will be required
2. Waterfront Vision Plan
a. Enhanced tourism opportunities
b. Improved community activities
c. Economic development from attracting visitors and providing information about quality of life in the Lake Charles MSA
3. Affordable and attractive Housing Transformation
a. Affordable housing for families in all income categories
b. Housing spread around the MSA
c. Housing to support increases in employment and population growth
c. Housing construction is ongoing economic development process
3. Affordable and Attractive Housing Transformation
Example
4. Nellie Lutcher & Enterprise Blvd. Cultural District
a. Economic development project for attracting visitors
4. Nellie Lutcher & Enterprise Blvd. Cultural District
Example
b. Improvement in active part of largest city
c. Enhancing diversity
5. McNeese State University Resiliency District
a. Economic development and growth over next 30 plus years will be driven by increases in professional, financial, healthcare, and other personnel-dominated industries
b. Universities are growth magnets around the country and, in fact, internationally
c. Working with LED to attract and retain companies
5. McNeese State University Resiliency District
6. Chennault & SOWELA Resiliency District
a. Economic development and growth related to attracting additional clients to Chennault such as additional aerospace companies
- Help diversify clientele from alternative industries
b. Connect SOWELA to Chennault’s recruitment efforts
c. Upgrade around Chennault and SOWELA
Examples:
Athens, GA
Austin, TX
Maybe even San Marcos (Texas State, water, outlet malls, etc.)
Iowa City
6. Chennault & SOWELA Resiliency District
• Preliminary results show
– The areas projected to grow the most in absolute terms are local industries with low supply chain needs met in region
• Focus on meeting those needs in Lake Charles
• Clusters with the highest potential for job growth and local supply chain deficits include
– Hospitality and tourism
– Water transportation
– Aerospace
• Occupations projected to grow most in terms of jobs and openings generally do not require post-secondary education
– Makes immediate focus on quality of life to attract residents in general
• Openings forecasts show that more bachelor’s degrees will be required to meet annual openings
– Preliminary gap analyses for post-secondary degrees show the most needed degrees will be in the fields of
• Business
• Education
• Health
• Personal and Culinary Services
– Any improvements to McNeese and/or SOWELA will have to follow this
Two of the top employing clusters are projected to lose jobs over the next 10 years. Both related to construction.
•
– Goods and services are traded outside the region where they are produced
• Tend to be geographically concentrated
• Historically, output per job higher
• Workers tend to be more educated, work more hours, and earn higher average wages
• Largely thought of as manufacturing, but includes other industries where products can be exported
– Technology in recent decades has changed some definitions to account for tradability of services
Currently, over half of the tradable sector jobs are concentrated in manufacturing.
Tradable vs. Nontradable (Local)
• Nontradable (Local) Sector
– Mainly services that can be only be consumed in the economy in which they are produced
• Plays an important role in affecting regional economic capacity utilization, and the health of the traded sector
• HAVING A WEAK LOCAL SECTOR LOWERS REGIONAL TRADED SECTOR COMPETITIVENESS
– Poor local construction conditions
– Subpar schooling and healthcare systems affecting local workforce
– Low quality of life results in higher wages to attract workers
• Calcasieu and Cameron parishes need to
– Change the mix in Tradable Sector jobs
• Increasing the jobs in high skilled tradable sector jobs has larger multiplier effects than non high skilled tradable jobs
• Very focused in Manufacturing
– Make environment more conducive to Nontradable sector growth
• Help increase competitiveness of current tradable sector and recruitment possibilities for new tradable businesses
• Increase the number and quality of nontradable businesses
• Champion Projects Underway
– Waterfront Development - Port Wonder, Crying Eagle, Lake Area Adventures, Paul's Rib
– Refurbish I-10 Beach
• Focus on letting people know the safety of the water
– Encourage Arts &Entertainment
• New theater plans from LAVA
– Encourage connectivity between Calcasieu and Cameron (tours, planned trips for hunting/fishing/nature, increase eco tourism opportunities)
• Downtown location/presence for McNeese
• Chamber of Commerce
– Increase Small Business Assistance Focus
– Increase student retention
– Enhance engagement in downtown
– Strengthen relationships among downtown businesses and labor pipeline
• Replace Capital One Building
– Enhance Lead Development Efforts
– Increase engagement with local public officials and nonprofits to coordinate efforts
• CPPJ, Cities, APG, CFSWLA, etc.
– Chamber needs to help increase coordination efforts among workforce development entities
– Two pages of organizations in Workforce Development document on Alliance’s website
» Adult Literacy, LWIA51, etc.
• Pursue state and local incentives to attract a “destination retailer” in Sulphur
– Attract visitors from other parts of the state
– Attract visitors from Southeast Texas
• As opposed to going to Houston area
– E.g. – Bass Pro Shop
• Provide equipment, supplies for ecotourism activities occurring in Cameron Parish
• Community Education Efforts
– Educate through easily accessible materials (online videos, pamphlets, etc.) on important topics related to increasing quality of life
• Health and wellness efforts
– Encourage primary care
• Educational importance –
Reference: Calcasieu Parish Police Jury Transportation Projects
c. Estimated cost: $251,281
Tasks 1.2.5 - Create a compilation map of ongoing plans, projects, and efforts (development, resilience, hazard mitigation, etc.)
Below is a summary of Calcasieu Parish Police Jury projects as noted in their 2022 budget report KMZ files of projects are included unless otherwise noted with the symbol ⊙ Projects listed exclude maintence type projects i.e. mill & overlay, bridge replacements).
637740531376730000 (calcasieuparish.gov)
Tasks 1.2.5 - Create a compilation map of ongoing plans, projects, and efforts (development, resilience, hazard mitigation, etc.)
Below is a summary of the City of Lake Charles Bike & Pedestrian projects as listed on the Capital Improvement list. Projects located on roads in LADOTD Roadway Transfer Program have been noted. KMZ files of project are included unless otherwise noted with the symbol ⊙ https://www.cityoflakecharles.com/egov/documents/1499894447_28961.pdf
February 9, 2022
Mary Page of 15
Reference: Future Roadway Projects
18. Sallier Street a. Lake Street to Riverside Street b. Sidewalk Project c. CIP Category (2017-2023): A (1st or 2nd year)
19. Canal Street
a. Sale Road to W. McNeese Street b. Sidewalk Project c. CIP Category (2017-2023): A (1st or 2nd year)
20. Pear St. East Side a. Knapp St to Harless b. Sidewalk Project c. CIP Category (2017-2023): B (3rd to 5th year)
21. Sale Road a. Lake Street to Ryan Street
b. Sidewalk Project c. CIP Category (2017-2023): B (3rd to 5th year)
22. Lisle Peters Rd. a. Big Lake Road to E. Saint Charles
b. Sidewalk Project c. CIP
Sidewalk Project
CIP
(2017-2023): B (3rd to 5th year)
(2017-2023): B (3rd to 5th year)
(3rd to 5th year)
17. E. McNeese Street (North Side)
a. Corbina Rd to Lake Crest Blvd
b. Sidewalk Project
c. CIP Category (2017-2023): A (1st or 2nd year)
CIP
(2017-2023): BD (3rd to 5 year contingent on external funding)
15 Reference: Future Roadway Projects
38. N. Simmons St. West Side
a. Moeling to Opelousas
b. Sidewalk Project
c. CIP Category (2017-2023): C (6th or later year)
39. N. Simmons St. East Side
a. Moeling to Opelousas
b. Sidewalk Project
c. CIP Category (2017-2023): C (6th or later year)
40. Griffin St. South Side
a.
8 of 15 Reference: Future Roadway Projects
67. 6th Ave East Side 2 a. Legion St to 12th St
b. Sidewalk Project
c. CIP Category (2017-2023): C (6th or later year)
68. 3rd St. North Side
a. 6th Ave to Gerstner Memorial
b. Sidewalk Project
c. CIP Category (2017-2023): C (6th or later year)
69. 3rd St. South Side 2 a. 6th Ave to Gerstner Memorial
b. Sidewalk Project
c. CIP Category (2017-2023): C (6th or later year)
70. 3rd St. South Side 3
a. Gerstner Memorial Dr to McNabb St
b. Sidewalk Project
c. CIP Category (2017-2023): C (6th or later year)
71. 5th Ave West Side
a. College St to E. McNeese
b. Sidewalk Project
c. CIP Category (2017-2023): C (6th or later
75. HWY 14 West Side
a. Coolidge to McNeese St
b. Sidewalk Project
(6th or later year)
c. CIP Category (2017-2023): C (6th or later year)
76. Gerstner Memorial Dr. East Side
a. Broad St to 4th St
b. Sidewalk Project
c. CIP Category (2017-2023): C (6th or later year)
February 9, 2022
Mary Page of 15
Reference: Future Roadway Projects
77. Gerstner Memorial Dr. West Side a. Broad St to Existing Sidewalk b.
Enterprise Blvd. West Side 2
Broad St to Existing Sidewalk b. Sidewalk Project
CIP Category (2017-2023): C (6th or later year)
Enterprise Blvd to be a part of the LADOTD Roadway Transfer Program
Hazel St West Side
W. 18th St to Penn St
Reference: Future Roadway Projects
126. Kirkman St West Side a. Prien Lake to Walters St
b. Sidewalk Project
c. CIP Category (2017-2023): C (6th or later year)
127. Illinois St. South Side
a. Brentwood to Walton
b. Sidewalk Project
c. CIP Category (2017-2023): C (6th or later year)
128. E Prien Lake Rd North Side 3
a. Bu ton to 2nd Ave
b. Sidewalk Project
c. CIP Category (2017-2023): C (6th or later year)
129. Kirkman St East Side 2
a. Walters to McCall St
b. Sidewalk Project
c. CIP Category (2017-2023): C (6th or later year)
130. Kirkman St West Side 2
a. Gayle to McCall St
b. Sidewalk Project
c. CIP Category (2017-2023): C (6th or later year)
131. E. McNeese St. South Side
a.
134.
a. Central Pkwy to Existing Sidewalk
b. Sidewalk Project
c. CIP Category (2017-2023): C (6th or later year)
135. Overhill Dr. South Side
a. Central Pkwy to Existing Sidewalk
b. Sidewalk Project
c. CIP Category (2017-2023): C (6th or later year)
February 9, 2022
Mary Page 15 of 15
Reference: Future Roadway Projects
136. Jefferson Dr North Side
a. Existing Sidewalk to Nelson to University Dr b. Sidewalk Project
c. CIP Category (2017-2023): C (6th or later year)
d. University Dr to be a part of the LADOTD Roadway Transfer Program
137. University Dr. West Side a. McNeese St to Existing Sidewalk b. Sidewalk Project c. CIP Category (2017-2023): C (6th or later year)
138. University Dr. South Side a. Lake St to Jefferson Dr b. Sidewalk Project
c. CIP Category (2017-2023): C (6th or later year)
d. University Dr to be a part of the LADOTD
February 9, 2022 Mary Page 2 of 9 Reference: Future Roadway Projects
8. 6th Avenue (Broad Street to 3rd street)
a. Rebuild and Drainage Project
b. CIP Category (2017-2023): Ongoing
9. Sally Mae (Medora Street to Dead End)
a. Asphalt and Drainage Project
b. CIP Category (2017-2023): Ongoing
10. Lake Street at McNeese Street (Intersection) a. Drainage and Intersection Project
b. CIP Category (2017-2023): Ongoing
11. Kirkman Street at Opelousas Street (Intersection)
a. Rebuild and Intersection Project
b. CIP Category (2017-2023): Ongoing
12. 2nd Street (6th Avenue to 8th Avenue)
a. Asphalt and Drainage Project
b. CIP Category (2017-2023): A (1st or 2nd year)
13. Highway Street (Highway 171/MLK to N. Grace Street) a. Asphalt and Drainage Project b. CIP Category (2017-2023): A (1st or 2nd year)
14. Enterprise Boulevard (12th Street to Broad Street)
a. Rebuild and Asphalt Project
b. CIP Category (2017-2023): A (1st or 2nd year)
c. Already included under LADOTD Projects
15. Broad Street (East of -210 to City Line)
a. Asphalt Project
b. CIP Category (2017-2023): A (1st or 2nd year)
16. 6th Avenue (6th Street to 3rd Street)
a. Reconstruction Project b. CIP Category (2017-2023): A (1st or 2nd year)
17. Blackwell Street (N. Grace Street to Highway 171/MLK)
a. Asphalt and Drainage Project
b. CIP Category
a. Widening, Drainage, and Water & Sewer Lines Project
b. CIP Category (2017-2023): AD (1st or 2nd year contingent on external funding)
February 9, 2022
Mary Page of
Reference: Future Roadway Projects
21. Sallier Street (Lake Street to Marine Street) a. Rebuild, Drainage, Intersection, and Water & Sewer Lines Project b. CIP Category (2017-2023): B (3rd to 5th year)
22. 12th Street (Ryan Street to 1st Avenue)
a. Rebuild and Asphalt Project b. CIP Category (2017-2023): B (3rd to 5th year)
23. N. Adams Street (Moeling Street to Commercial Street a. Asphalt and Drainage Project b. CIP Category (2017-2023): B (3rd to 5th year)
24. N. Adams Street (Opelousas Street to Dead End) a. Asphalt and Drainage Project b. CIP Category (2017-2023): B (3rd to 5th year)
25. N. Grace Street (Medora Street to Poe Street)
a. Asphalt and Drainage Project
5 of 9 Reference: Future Roadway Projects
47. Prien Lake Road (Kirkman Street to 5th Avenue)
a. Rebuild Project-
b. CIP Category (2017-2023): B (3rd to 5th year)
48. Sale Road (Ryan Street to Common Street)
a. Rebuild, Drainage, and Sidewalks/Bike Lanes Project
b. CIP Category (2017-2023): B (3rd to 5th year)
49. Lake Street (McNeese Street to Waverly)
a. Widening, Drainage, Sidewalks/Bike Lanes Project
b. CIP Category (2017-2023): BD (3rd to 5th year contingent on external funding)
50. Goos Blvd (Harless Street to Fitzenreiter Road)
a. New, Sidewalks/Bike Lanes, and Water & Sewer Line Project
b. CIP Category (2017-2023): BD (3rd to 5th year contingent on external funding)
51. Ryan Street at Sallier/12th Street (Intersection)
a. Intersection Project
b. CIP Category (2017-2023): BD (3rd to 5th year contingent on external funding)
52. Orrin Street (Opelousas Street south to Dead End)
a. Rebuild and Drainage Project b. CIP Category (2017-2023): C (6th or later year)
53. 13th Street (2nd Avenue to 3rd Avenue)
a. Rebuild Project
b. CIP Category (2017-2023): C (6th or later year)
9, 2022
Mary Page of Reference: Future Roadway Projects
60. Commercial Street (Booker Street to Lincoln Street) a. Asphalt and Drainage Project b. CIP Category (2017-2023): C (6th or later year)
61. Commercial Street (Prater Street to Booker Street)
a. Asphalt and Drainage Project b. CIP Category (2017-2023): C (6th or later year)
62. Fitzenreiter Road (Highway 171/MLK East to Dead End) a. Asphalt and Drainage Project b. CIP Category (2017-2023): C (6th or later year)
63. Hagan Street (N. Goos Blvd to Prater Street)
Asphalt and Drainage Project b. CIP Category (2017-2023): C (6th or later year)
64. Ernest Street (Glen Street to W. 18th Street)
Rebuild Project
CIP Category (2017-2023): C (6th or later year)
65. Woodard Street (N. Goos Blvd to Pear St.) a. Asphalt and Drainage Project b. CIP Category (2017-2023):
a part of the LADOTD Roadway Transfer Program
February 9, 2022
Mary Page 8 of 9
Reference: Future Roadway Projects
86. Enterprise Boulevard (Katherine Street to Goos Blvd) ⊙
a. New, Sidewalks/Bike Lanes Project b. CIP Category (2017-2023): C (6th or later year contingent on external funding)
87. Elliot Road (Country Club Road to Ham Reid Road)
a. Widening, Drainage, Sidewalks/Bike Lanes Project
b. CIP Category (2017-2023): C (6th or later year contingent on external funding)
88. Lake Street (Country Club Road to Ham Reid Road)
a. Widening, Drainage, Sidewalks/Bike Lanes, and Water & Sewer Line Project
b. CIP Category (2017-2023): C (6th or later year contingent on external funding)
c. Lake Street (LA-3092) to be a part of the LADOTD Roadway Transfer Program
89. E. Prien Lake St. (Ryan St. to HWY 14)
a. Rebuild, Drainage, Intersection, Sidewalk/Bike Lanes Project
b. CIP Category (2017-2023): C (6th or later year contingent on external funding)
90. LA 385 Pedestrian & Bike Trail (TEP Funds)(Ryan to Clarence)(Lakeshore to Broad Street)
a. Road and Pedestrian Project
b. CIP Category (2017-2023): Ongoing
91. Clarence StreetUtilities and Landscaping Augment LA 385 Project (Lakeshore Drive to Ryan Street)
a. Road and Pedestrian Project
b. CIP Category (2017-2023): Ongoing
92. Lakeshore Drive Traffic Calming (Phase 1)
a. Restriping, signals Road and Pedestrian Project
b. CIP Category (2017-2023): B (3rd to 5th year)
93. Gill Street (Ryan Street to Lakeshore Drive)
a. Road and Pedestrian Projects
b. CIP Category (2017-2023): B (3rd to 5th year)
94. Lakeshore Drive Calming (Phase 2) – Beautification – medians, turn lanes, lights (Clarence Street to Broad Street)
a. Road and Pedestrian projects
b. CIP Category (2017-2023): B (3rd to 5th year)
95. East Civic Center Dr.-Connector (Lakeshore Drive to Bord du Lac) ⊙
a. Road and Pedestrian Project
b. CIP Category (2017-2023): C (6th or later year)
96. North Civic Center Dr.-Connector (Lakeshore Drive to Bord du Lac) ⊙
a. Road and Pedestrian Project
b. CIP Category (2017-2023): C (6th or later year)
97. Tract One A: South Civic Center Dr./Kirby St. Connector (Kirby St. to Civic Center) ⊙
a. Road and Pedestrian Project
b. CIP Category (2017-2023): C (6th or later year)
February 9, 2022
Mary Page of
Reference: Future Roadway Projects
98. Pine St. and Pryce St. connector including storm drainage (Veteran’s Memorial to Lakefront) ⊙
a. Road and Pedestrian Project
b. CIP Category (2017-2023): C (6th or later year)
99. Pithon Coulee Walking Trail (Common Street to Ryan Street) ⊙
a. Road and Pedestrian Project
b. CIP Category (2017-2023): C (6th or later year)
100. North Bord du Lac Dr. reconfigure ⊙ a. Road and Pedestrian Project
b. CIP Category (2017-2023): C (6th or later year)
101. Install Bike Lanes on Kirkman Street (McNeese Street to Railroad Avenue)
a. Bike Path Project b. CIP Category (2017-2023): Ongoing
102. Pujo Street-restripe, install bike lanes (Kirkman Street to Bilbo Street)
a. Bike Path Project b. CIP Category (2017-2023): Ongoing
103. Install Bike Lanes on Mill Street (Veteran’s Memorial Dr to Highway 171/MLK)
a. Bike Path Project b. CIP Category (2017-2023): A (1st or 2nd year)
104. Install Bike Lanes on Hodges Street (Alamo Street to Belden Street) a. Bike Path Project b. CIP Category (2017-2023): B (3rd to 5th year)
105. Install Bike Lanes on Kirby Street (Ryan Street to Louisiana Avenue)
a. Bike Path Project
b. CIP Category (2017-2023): B (3rd to 5th year)
106. Install Bike Lanes on 7th Street (Ryan Street to 4th Avenue) a. Bike Path Project b. CIP Category (2017-2023): B (3rd to 5th year)
107. Install Bike Lanes on 11th Street (Ryan Street to 4th Avenue)
a. Bike Path Project b. CIP Category (2017-2023): B (3rd to 5th year)
108. Install Bike Lanes on 18th Street (Common Street to Highway 14)
a. Bike Path Project b. CIP Category (2017-2023): B (3rd to 5th year)
To: UDA From: Mary Frances O’Rourke PE Stantec, Baton Rouge Office
Tasks 1.2.5 - Create a compilation map of ongoing plans, projects, and efforts (development, resilience, hazard mitigation, etc.)
Below is a summary of projects listed in the TIP that were not included in LADOTD’s current STIP. The Imperial Calcasieu Regional Planning and Development Commission (IMCAL) being designated as the Lake Charles Urbanized Area’s Metropolitan Planning Organization (LCMPO) prepared the Transportation Improvement Program for fiscal years 2019-2022 (TIP FY 19-22) in cooperation with The LCMPO Technical Advisory Committee (TAC) and the Transportation Policy Committee (TPC) as well as in cooperation with, and with funding provided by Louisiana Department of Transportation & Development (LADOTD), Federal Highway Administration (FHWA) and Federal Transit Administration (FTA).KMZ files of projects are included unless noted with the symbol ⊙ Projects listed exclude small line item projects & maintenance type projects (i.e., milling and overlay).
Deliverable line item 1.2.5: Create a compilation map of ongoing plans, projects, and efforts (development, resilience, transportation, hazard mitigation, etc.) – Broadband Information
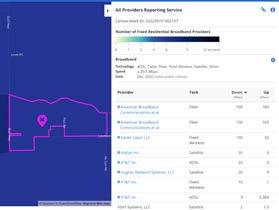
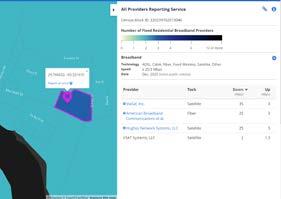
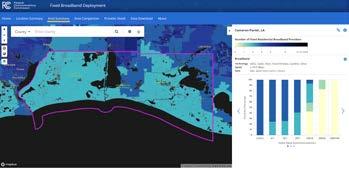
SWLA Broadband
Key Takeaways
• Goal of 100% broadband access by 2029 (ConnectLA)
• Local providers can apply for ConnectLA grants to expand service but this does not always happen (e.g., limited customer base in area)
• In Cameron Parish:
o Majority of the Parish has only two providers offering broadband but none offer better than 35 Mbps.
o Only 53% of the Cameron Parish population has access to speeds ≥ 100/10 Mbps.
o Grand Lake has better service with multiple broadband providers
• In Calcasieu Parish:
o 93.5% of the Calcasieu Parish population has access to ≥ 100/10 Mbps
o Rural areas, particularly in southeast areas are underserved
Broadband expansion in Louisiana is managed by Connect LA, officially known as he Office of Broadband Development & Connectivity ConnectLA is charged with expanding broadband access, improving affordability, and promoting digital literacy. Expanding broadband access involves addressing the un- and under-served populations. ConnectLA defines broadband as connections with minimum speeds of 25 megabits per second (Mbps) download and 3 Mbps ≥ 25/3 Mbps . To accomplish their goal of 100% broadband access by 2029, ConnectLA issues grants to broadband providers who have partnered with municipalities to subsidize the cost of expansion and system upgrades. The broadband grants are funded by a variety of state and federal funding programs including the Infrastructure bill, American Rescue Plan Act, the Federal Communication Commission’s (FCC) Rural Digital Opportunity Fund, and the Word Digital Opportunities Fund.
An important aspect of the program is that providers are not required to expand access. In many cases, the municipality must take the lead and convince the provider to apply for the grants. In some cases, even with the grants, expansion may not make business sense for the provider because of the small number or lack of concentration of customers. The FCC maintains the Fixed Broadband Deployment map to share the current providers and the level of services they offer The map depicts the number of providers, by census block, that offer broadband (≥ 25/3 Mbps). https://broadbandmap.fcc.gov/#/
Cameron Parish Broadband
Internet service providers n Cameron Parish utilize a variety of technologies including cable, fiber, ixed wireless, satellite and digital subscriber line (DSL). Overall, broadband service and access in Cameron Parish is inadequate.
• Most of Cameron Parish is served by only four providers, two of which offer broadband, but none offer better than 35 Mbps.
• Only 53% of the Cameron Parish population has access to ≥ 100/10 Mbps.
• In the more populated area of “downtown” Cameron four providers offer internet service, but only three offer broadband and none offer better than 35 Mbps.
• Service is better in the Grand Lake area with several providers offering broadband and a few offering better than 100 Mbps
Calcasieu Parish Broadband
Internet service providers in Calcasieu Parish utilize a variety of technologies including cable, fiber, ixed wireless, satellite and digital subscriber line (DSL). Broadband service and access in the urbanized areas is generally good, with most having access to ≥ 100/10 Mbps Rural areas, particularly in the southeast area of the Parish are underserved.
• 93.5% of the Calcasieu Parish population has access to ≥ 100/10 Mbps.
• Lake Charles is served by several providers. Most census blocks have access to ≥ 100/10 Mbps broadband and all census blocks have access to ≥ 25 Mbps
• Service in the southeast area of Calcasieu is inconsistent, with many census blocks only having access to 35 Mbps.
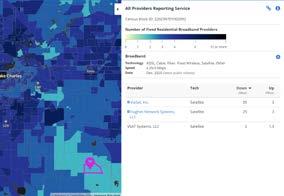
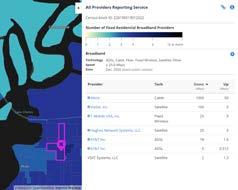
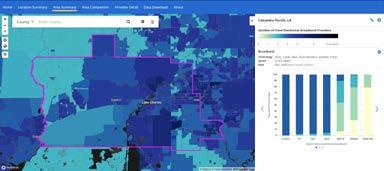
Calcasieu Parish Broadband Overview
References
FCC Fixed Broadband Deployment map: https://broadbandmap.fcc.gov/#/
ConnectLA: https://connect.la.gov/
Deliverable line item 1.2.6: Compile and review existing Hazard Mitigation Plan (HMP) and other related plans
The Parish hazard mitigation plans and the Calcasieu Long-Term Community Recovery plan offer support to the 10 Just
Imagine SWLA projects. Key areas where the plans complement the projects include:
• Cameron Parish mitigation action Coastline Restoration Projects opens the possibility for FEMA hazard mitigation assistance for Regional Coastal Flood Protection
• Calcasieu Parish mitigation actions and projects addressing drainage support Chennault & SOWELA Resiliency District and Strong Downtowns with projects identified near the Sulphur and Westlake downtowns.
• The Calcasieu Long-Term Community Recovery plan and both mitigation plans offer direct support for the Community Resilience Hubs with mitigation actions and recovery priorities for safe rooms and shelters
• The Calcasieu Long-Term Community Recovery plan supports Redevelopment Authority with the recommendation to evaluate the creation of a recovery authority with broad ability to receive and quickly implement programs with federal and state funding.
Calcasieu Parish has identified 59 hazard mitigation projects to advance for FEMA hazard mitigation assistance grants. At this time, they have not been funded, however the Parish is confident most, if not all, will be funded.1
• 34 drainage improvement projects totaling $189million
o This will include increasing stormwater capacity through projects that increase capacity of existing drainage laterals, widen of channels, construct detention basins, and increase existing pump station capacity. Improving overall stormwater capacity and drainage will relieve flooding problems, reduce flood damage and costs of damage, overtopping of roads with drain water, while also keeping open roadways during periods of high precipitation.
• 7 saferoom projects totaling $31million
o Construction of a safe room(s) for first responders and critical employees to remain in the parish during an event.
• 25 building retrofit/hardening projects for public infrastructure and facilities totaling $203million o Harden critical facilities to maintain use during and after storm events. Hardening will reduce damage from high winds and other hazard to ensure the critical infrastructure can be used and operable during or after storms.
• 31 generator and communications projects totaling $11million
o Purchase generators and install at critical facilities to continue essential operations parish wide during events. Develop an interoperability/communications plan identifying resources and equipment needed to establish a single, interagency, mobile incident and communications command post.
Cameron Parish is using their current $9million HMGP allotment for elevation and reconstruction of damaged facilities.
Deliverable line item 1.3.11 Create a library of resiliency best practices aimed at adapting to and living with water; land use; incentives
Stantec reviewed the Catalytic Project Criteria for aptness to all projects. We offer the following suggestions in red
CATALYTIC PROJECT CRITERIA
Benefits:
• Provides measurable benefit to greatest needs:
o Affordable housing, quality of life, and drainage
• Regional impact: Beneficial to both Parishes and beyond
• Attracts future investment by public and private sectors
• Generates positive economic growth for the future
• Improves Quality of Life – Health, Culture, Public Education, Access to nature and water, public safety
• Provides Co-benefits including Social and Environmental
Implementation:
• Ability to move forward within a 10-year project horizon
• Available funding sources
• Proven concept or solution
• Constructable within existing public property and ROW
Resiliency:
• Addresses Future Conditions - sea level rise and higher intensity storms (could broaden to heat)
• Includes blue/green infrastructure and/or low-impact design
• Improves heat island and adds tree canopy
• Able to withstand both frequent stresses and major disaster events
• Reduces risk beyond the site boundary itself
Additional comments:
• Some of the more structural projects, such as a tide gate, may not meet the criteria for the first bullet (i.e., low impact design). However, if the intent is that projects meet more or more, it works. If not, perhaps use “considers” instead of “includes”
• We could consider assigning broad scoring (e.g., 25 points per category) if there is desire to prioritize projects.
• Consider a 4th bullet for Community and Stakeholder and Engagement/Buy-In (especially if scoring is added)
Deliverable Line Item 1.5.16: Identify hazards and risk with special consideration of recent events and projected climate change impacts
Deliverable Line Item 1.5.17: Identify hazard exposure of people, critical buildings and infrastructure, natural resources, and critical habitats
Cameron Parish Hazards and Risk
1. Cameron Parish HMP identified critical and prevalent hazards:
• Flooding from rivers and waterways, rainstorms, tropical cyclones, and hurricanes in the following forms:
o Riverine
o Stormwater
o Surge
o Backwater flooding (as the result of river flooding and surge)
o Coastal
• High wind damage most commonly resulting from hurricanes, thunderstorms, and tornadoes
There are numerous other hazards of concerns like land loss, power outages, and extreme temperatures.
2. Cameron Parish HMP prevalent hazard exposure:
• Flooding:
o 89% of Cameron Parish population lives in the regulatory (1%) floodplain.
411 residential and 25 commercial are repetitive loss properties (2+ flood impacts in a 10 year period with insurance claims of $10,000+)
o 100% of Cameron Parish essential facilities are in the regulatory (1%) floodplain and all are at risk to storm surge or a category 2 or higher hurricane. Six are repetitive loss properties.
§ Fire and rescue
§ Government
§ Law Enforcement
§ Public health
§ Schools
• Wind:
o All populations and structures are vulnerable to wind from hurricanes thunderstorm winds and tornadoes
o All essential facilities are vulnerable to wind from hurricanes.
o Wind also causes land loss due to coastal erosion including impacts on critical wetland, marsh, and mangrove ecosystems. These areas not only provide protection against hurricanes, they offer critical habitat for fish, birds, and other species.
3. Key mitigation actions from the HMP and activities to address those hazards
• Flooding
o Identified mitigation actions from the HMP
§ Drainage improvements
• Wind
• Improvements to ensure usability of roads and buildings that serve a public purpose such as government, healthcare, and school districts by retrofitting and improving drainage structures to reduce flood risk
§ Acquisitions and elevations - $9million in HMGP dedicated to these projects
• Continue to mitigate flood damage by acquiring properties in the parish. Mitigate parish flood damage by elevating homes and buildings throughout the parish.
§ Coastline restoration – See CPRA information
• Identify and implement coastline preservation and restoration projects that continue to protect the parish coastline from coastal hazards.
o Additional mitigation measures (generalized) for flooding:
§ Elevate, acquire, floodproof, floodgates, floodwalls, green infrastructure, bluegreen infrastructure, nature-based solutions (e.g., stream restoration) increased storage and conveyance (culverts, drainage system improvements)
o Identified mitigation actions from the HMP
§ Saferooms:
• Construction of a safe room for first responders located in Cameron Parish.
§ Building retrofits
• Improvements to reduce damage from high winds and help assure that the public buildings can be used, occupied, and operable during or after storms.
o Additional mitigation measures (generalized) for wind: Maintain vegetation (trim large trees) install pressure-rated windows or storm shutters manage loose roof shingles add additional roof clips or hurricane straps to roofs; saferooms
4. Key climate change impacts
• Sea level rise leads to coastal erosion, subsidence land loss, and more frequent coastal flooding, which has significant impacts on transportation and other infrastructure, as well as critical wildlife habitat and coastal recreation areas.
• Increased intensity and frequency of tropical cyclones leads to coastal erosion, wetland degradation, and significant impacts to people and their homes as well as damage to critical wildlife habitat and coastal recreation areas.
• Increased frequency and intensity of thunderstorms and rainfall events leads to more frequent and less predictable flooding
• Other Information o Sea level around Louisiana is up to 24 inches higher than it was in 1950 (NOAA)
o In the worse emissions scenarios, Louisiana could see a 7-foot rise in water levels, which when combined with subsidence, would likely result in the loss of another 2,250 to 4,150 square miles of coastal wetland Master Plan)
Calcasieu Parish Hazards and Risk
1. Calcasieu Parish HMP identified critical and prevalent hazards:
• Flooding from rivers and waterways, rainstorms, tropical cyclones, and hurricanes in the following forms:
o Riverine
o Stormwater
o Surge
o Backwater flooding (as the result of river flooding and surge)
• High wind damage most commonly resulting from hurricanes, thunderstorms, and tornadoes
• Drought, extreme heat, and wildfires (noted to cause property and crop damage)
There are numerous other hazards of concerns like land loss and power outages
2. Calcasieu Parish HMP prevalent hazard exposure:
• Flood o 52% of Calcasieu Parish population lives in the regulatory (1%) floodplain.
§ 883 residential and 2 commercial repetitive loss properties.
o Many Calcasieu Parish essential facilities are in the regulatory (1%) floodplain. 21 are repetitive loss properties
§ Fire and rescue – 14 in floodplain
§ Government – 18 in floodplain
§ Law enforcement – 9 in floodplain
§ Public health & nursing homes- 3 in floodplain
§ Schools – 22 in floodplain
• Wind
o All populations and structures are vulnerable to wind from hurricanes.
o All essential facilities are vulnerable to wind from hurricanes.
o Wind also causes land loss due to coastal erosion including impacts on critical wetland, marsh, and mangrove ecosystems. These areas not only provide protection against hurricanes, they offer critical habitat for fish, birds, and other species.
3. Key mitigation actions to address those hazards:
• Flood actions (from the HMP)
o Building retrofits – 25 HMGP projects totaling $203million Harden critical facilities to maintain use during and after storm events. Hardening will reduce damage from high winds and other hazard to ensure the critical infrastructure can be used and operable during or after storms.
o Drainage improvements – 34 HMGP projects totaling $189+ million
§ This will include increasing stormwater capacity through projects that increase capacity of existing drainage laterals, widen of channels, construct detention basins, and increase existing pump station capacity. Improving overall stormwater capacity and drainage will relieve flooding problems, reduce flood
damage and costs of damage, overtopping of roads with drain water, while also keeping open roadways during periods of high precipitation.
o Acquisitions and elevations
§ Elevation, acquisition-demolition, acquisition- relocations, and reconstruction of repetitive loss, severe repetitive loss, substantially damaged, and/or other hazard-prone properties.
• Wind (from the HMP)
o Saferooms – 7 HMGP projects totaling $31million
§ Construction of a safe room(s) for first responders and critical employees to remain in the parish during an event.
o Generators & Communications – 31 HMGP projects totaling $11million
§ Purchase generators and install at critical facilities to continue essential operations parish wide during events. Develop an interoperability/communications plan identifying resources and equipment needed to establish a single, interagency, mobile incident and communications command post.
• Wildfire
o Ordinances
§ Strengthen penalties and improve enforcement capabilities of burn ban ordinance.
4. Key climate change impacts:
• Increased intensity and frequency of tropical cyclones leads to wetland degradation, and significant impacts to people and their homes as well as bayous and natural areas that include critical habitat and recreation areas.
•
To: UDA From: Mary Frances O’Rourke, PE Baton Rouge
Project/File: SWLA Resiliency Master Plan Calcasieu Parish Police Jury LADOTD Road Transfer Program
Date: February 24 2022
Tasks 2.1.1- Provide input related to topics for catalytic project that UDA is leading.
(LADOTD Road Transfer Program description and roads to be transferred within our Catalytic Project locations)
Below is a summary of LADOTD road transfer program.
District 07- Lake Charles Maps
District 07 - Lake Charles
*See KMZ file for all roads included in the transfer program within District 07 (Calcasieu Parish and Cameron Parish)
• The Road Transfer Program has been established as the means to right-size the State Highway System to achieve the national average of 19 percent state ownership of public road mileage.
DOTD has identified approximately 5000 miles of state roads that do not fit the state's role in the highway network. The Program involves transferring these roads, with the money, to local governments.
• Participation in the Program is voluntary. Roads will be repaired prior to transfer and the receiving local governments will be credited for 40 years of routine and capital maintenance which can be applied to any highway capital project(s). The Program may be appealing to those parishes and municipalities that have the capacity for additional day-to-day road maintenance but lack the resources for capital improvements.
Transfer Process
The procedures governing the Road Transfer Program have been documented in DOTD Engineering
Directives and Standards (EDSM) Number I.1.1.27 (see Appendix D). The first step in the process is for an interested local government to work with the appropriate DOTD District Administrator in identifying eligible State roads that the local government is willing to accept ownership of and determining the 40-year maintenance value associated with those roads. DOTD District an individual parish maps illustrating exactly which routes are eligible for transfer are available to aid in this process. The local government will also need to identify the capital project(s) to which the 40-year maintenance credits will be applied.
Local Government Resolution
February 11, 2022
Andre Page 2 of 5
Reference: Calcasieu Parish Police Jury Transportation Projects
DOTD will draft a resolution for consideration of adoption by the local governing authority. The resolution will specify which State roads the local government will accept ownership of subject to needed improvements, if any, and their associated 40-year maintenance value. The resolution will also specify the capital project(s) to which the 40-year maintenance credits are to be applied.
Cooperative Endeavor Agreement
A cooperative endeavor agreement (CEA) will also be required. A CEA is a form of contract between the State and local governments. DOTD will draft the needed CEA and it will accompany the aforementioned draft resolution for consideration by the local governing authority. The CEA will also specify which State roads the local government will accept ownership of subject to needed improvements, if any, the 40-year maintenance value associated with the transfer roads, and the capital project(s) to which the 40-year maintenance credits are to be applied. The local government resolution will include a provision authorizing a specified individual (Parish President, Mayor, etc.) to sign the CEA on behalf of the local government.
Transfer Road Repairs and Use of Credits
Following the adoption of a resolution and execution of a CEA, needed repairs to the transfer routes will be implemented. As the repairs on each route are completed, the ownership of that road will transfer from the State to the receiving local government. Concurrently, DOTD will initiate work on the capital project(s) specified in the agreement. The 40-year maintenance credits may be applied to capital projects on any public road or bridge as determined by the local government. DOTD will implement the project(s) in accordance with applicable design standards and public bid laws.
Recording the Transfer
DOTD will prepare and execute an Act of Transfer and Acceptance between the State and local government for the transfer of ownership of the State roads specified in the adopted resolution and cooperative endeavor agreement. DOTD will then record the Act of Transfer and acceptance in the Office of the Clerk of Court in the appropriate parish.
February 11, 2022
Andre Page of
Reference: Calcasieu Parish Police Jury Transportation Projects
Roads to be transferred within our Catalytic Project locations
McNeese Resilience District Project
• W. McNeese St on the east side of the project site is planned to be transferred.
• University Dr leading up to the project site is planned to be transferred.
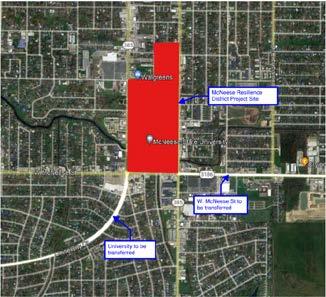
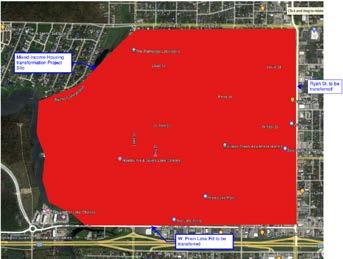
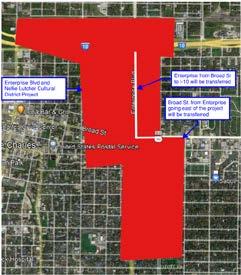
March 1, 2022
UDA Page 2 of 5
Reference: Other Projects
on any of the future project lists from the local and state municipalities
2. Gauthier Rd Extension (from LA 27 to LA 384)
1. Answers concerns to comment fra-1 infrastructure- transportation i. New Calcasieu River crossing
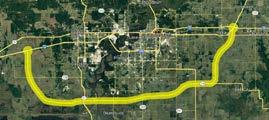
2. This proposed project is listed in the MTP project list (N-09) as a new 4 lane roadway and bridge i. Project listed as beyond MTP 2045 because it could not be funded through traditional sources (perhaps Public-Private-Par nership could be used).
3. New Drainage Pump Stations at Enterprise/Louisiana Ave (South of 12th St), East Prien Lake Rd, and Ryan St.
1. Answers concerns to comment fra-3 drainage i. Force drainage/improved drainage
2. This proposed project is not included on any of the future project list from the local and state municipalities
4. Drainage Improvements Along LA 27 (Cameron Parish C.S. 193-01)
1. Answers concerns to comment Ifra-3 drainage i. Force drainage/improved drainage
2. This project proposes upgraded drainage and 2 drainage pump stations near the ferry crossing on the east side of Calcasieu River Ship Channel.
3. This project is currently in design and the construction is fully funded
5. Update ordinances to require detention for 25 yr storm event & implement LID incentives (Low Impact Development)
1. LID description LID is a stormwater management strategy designed to maintain site hydrology and mitigate the adverse impacts of stormwater runoff and nonpoint source pollution. LID actively manages stormwater runoff by mimicking a project site’s pre-development hydrology using design techniques that infiltrate, store, and evaporate runoff close to its source of origin. LID strategies provide decentralized hydrologic source control for stormwater runoff. In short, LID seeks to manage the rain, beginning at the point where it falls. The LID features are distributed small scale controls that closely mimic hydrological behavior of the pre-project sites for a design storm event.
2. Answers concerns to comment fra-3 drainage i. Detention/retention
ii. Upgrade drainage ordinances
March 1, 2022
UDA
Page of
Reference: Other Projects
3. This proposed project is not included on any of the future project list from the local and state municipalities
6. Add a 2nd Ferry Boat
1. Answers concerns to comment Ifra-4 bridges/tunnel/ferry
i. New Cameron Ferry
2. This proposed project is not included on any of the future project list from the local and state municipalities
3. An additional ferry is recommended over replacing with a bridge to this location due to the tight geometry of LA 27 and approaches to ramp over channel/river is not feasible without major environmental impacts
4. An additional ferry is recommended over replacing with a tunnel to this location due to proximity to coast and potential for submersion from storm surge. Tight geometry of LA 27 also makes approaches to tunnel not feasible without major environmental impacts
7. Implement Parish wide ordinances for underground distribution of utilities for all new or modified developments
1. Answers concerns to comment fra-6 inground utilities
i. Underground utilities ii. Ordinance for new development and roads to implement underground distribution/service lines
iii. Ordinance would also apply to modifications of existing developments and roads
2. This proposed project is not included on any of the future project list from the local and state municipalities
3. Cons to underground utilities is potential corrosion, water intrusion at-grade access equipment/cabinets (larger obstructions than overhead systems)
8. Increase solar farm connectivity
1. Answers concerns to comment Ifra- 8 Alternative Energy
i. Solar power
2. Entergy is currently proposing to utilize Elizabeth solar farm 125-megawatt resource in Allen Parish)
9. Upgrade rural roads to current LADOTD standards (travel lane & shoulder widths, drainage etc)
1. Answers concerns to comment Ifra- 9 General infrastructure improvements
i. Improved infrastructure
2. When LADOTD works on a roadway they bring the road up to current standards unless it’s a rehabilitation project. There are not many projects in the rural areas so there is a great need to upgrade these roads.
10. Implement bikeshare program (strategic locations within city)
1. Answers concerns to comment Ifra- 10 Public Transportation
i. Multi-modal transit, McNeese transportation for students without vehicle
11. E-Vehicle charging stations
1. Answers concerns to comment Ifra- 10 Public Transportation
2. This will become increasingly important as the demand for electric vehicles grows
12. LA 171 Redevelopment corridor
1. Answers concerns to comment Ifra- 13 for LA 171 corridor
i. Beautify Highway 171
March 1, 2022
UDA Page 5 of 5
Reference: Other Projects
iii. Implement programs, plans, and activities to maximize CRS points
2. Increase wind construction requirements, comparable to IBHS FORTIFIED standards, to include actions eligible for state tax deduction or insurance premium discounts
i. Secondary water barrier on roof
ii. Architectural shingles
iii. Impact rated windows
iv. Hurricane connectors for structural framing
v. Hipped roof design
3. Create a Disaster Operations Plan to assist with post-disaster code enforcement and floodplain administration
i. Substantial Damage Estimates
ii. Building Safety Assessments
iii. Permitting & Enforcement
22. Ecotourism and Boondocking
a. Develop campgrounds and other sites for short and long-term camper and RV stays
b. Maintain and develop new land and water trails
c. Upgrade beach access areas to include parking, restrooms, recreation pavilions, boardwalks, and educational amenities
d. Support Bayou Greenbelt expansion and assist with funding required studies and implementation
e. Expand ecotourism marketing campaign
f. Repair saltwater levee from Big Lake to Cameron to be used ATV/bike trail
23. Public Docks for Waterway Access
1. Cameron i. Public slips and dry dock for local fisherman that allows overnight stays
ii. Adjacent parking
iii. Near seafood processing facility
2. Bayou Greenbelt (Kayouche Coulee at Opelousas St.)
i. Public slips and dry dock for local fisherman that allows overnight stay
ii. Adjacent parking
to partner with providers to apply for grant to subsidize expansion
21. Reduce Flood and Wind
February 11, 2022
Andre Page 2 of 7
Reference: Calcasieu Parish Police Jury Transportation Projects
To: UDA
Project/File: SWLA Resiliency Master Plan Utility-Sewer Investigation
From: Mary Frances O’Rourke, PE Baton Rouge
Date: February 24 2022
Tasks 1.2.5 - Create a compilation map of ongoing plans, projects, and efforts (development, resilience, hazard mitigation, etc.)
Calcasieu Parish
Calcasieu Parish Police Jury
The Calcasieu Parish Police Jury (CCPJ) has a Sewerage Inspection program of individual home mechanical sewer systems throughout all unincorporated areas of the parish.
637740531376730000 (calcasieuparish.gov)
CPPJ’s goal for 2022:
• initiate wastewater collection and treatment consolidation study for Ward 1 and a corridor study for South Ward 4 wastewater collection.
• Operate and manage sewer district #11, and wastewater treatment systems accepted by the Police Jury and located in Parish owned parks
CPPJ’s accomplishment for 2021 – concluded negotiations with the City of Lake Charles to coordinate efforts in wastewater collection and transport in South Lake Charles.
Future projects 1. Sewer District 11 pond rehab/upgrade a. The sewer pond has a maximum permit discharge of 300,000 gallons per day, which limits t he district’s ability to expand. This project will upgrade the existing pond system with newer technology, thus increasing o ur ability to meet water quality requirements.
b. Estimated cost - $5,000,000
City of Lake Charles:
*KMZ file shows location of sewer lines near the catalytic project locations. Lake Charles’s treatment plants are also noted.
• The Wastewater Division operates three major wastewater treatment plants. Plant A is located on West Railroad Ave. and has a treatment capacity of 6.7 MGD. Plant B/C is located on West 18th St. and has a treatment capacity of 6.2 MGD. Plant D is located on Tank Farm Rd. and has a treatment capacity of 4.95 MGD.
• The Wastewater Division also maintains and operates four package plants servicing recently incorporated areas of the City of Lake Charles.
• Also, this division maintains approximately 600 miles of sewer collection lines throughout the City, along with 130 lift stations with associated pumping equipment and controls.
2. Departments within the Wastewater Division includes: Operations, Maintenance, Collection, Laboratory and Pre-Treatment.
City of Lake Charles Future projects https://www.cityoflakecharles.com/egov/apps/map/viewer.egov?view=map;id=1
1. Esplanade Lift Station & Forcemain Improvement Cost estimate: $1,210,000 Scope of work: Expand the wet well to handle additional peak flows to the station. Installation of a new 10 inch forcemain to discharge the proposed flow at an acceptable velocity.
February 11, 2022
Andre Page of
Reference: Calcasieu Parish Police Jury Transportation Projects
2. W. Prien Lake Rd. Widening Cove Lane to Ihles Rd.
Cost Estimate: $22,250,000.00 Scope of Work: Prien Lake Rd. from Cove Ln. South to Ihles Rd. Sale Rd. from Prien Lake Rd. east to Rue Chann Ann Henderson Bayou Rd. from Prien Lake Rd. west to Indian Bay Dr. All will be reconstructed with enclosed ditches with a new underground drainage system. 2 new sanitary lift stations will be installed along with gravity sewer lines. Water lines will remain in place where possible, portions will be replaced. 10" thick reinforced concrete pavement with curb and gutter.
February 11, 2022
Andre Page 5 of 7
Reference: Calcasieu Parish Police Jury Transportation Projects
City of Sulphur
*See KMZ file of limits of Sulphur’s sewer system & the location of the treatment plant
• Based on calls to the City the limits of the sewer system reach to the extents of the city
• The City of Sulphur Regional Wastewater Treatment Facility is located at 3400 Bayou D'Inde Road, Westlake La 70669. The system serves regional areas including Sulphur, Westlake, Carlyss, Mossville o In March 2008 a new wastewater system was put into operation The new process utilizes a SBR (Sequencing Batch Reactor) 4 Basin System with a design flow of 9.0 MGD with the capability and capacity to handle a maximum of 27 MGD. o The City Wastewate Treatment Department maintains and operates 29 pumping liftstations located throughout the City to collect and deliver the wastewater into the wastewater plant.
February 25, 2022
Mary Page 2 of 6
Reference: Calcasieu Parish Police Jury Transportation Projects
To: UDA
Project/File: SWLA Resiliency Master Plan Long Range Transportation Plan for Lake Charles MPO
From: Mary Frances O’Rourke, PE Baton Rouge
Date: February 25, 2022
Tasks 1.2.7 - Leverage information and data from Long Range Transportation Plan for the Lake Charles MPO
A review of the transportation (including ped and bikes) projects from the Lake Charles Urbanized Area 2045 Metropolitan Transportation Plan (MTP) has been completed.
• A spreadsheet & GIS file was provided with this submittal that shows every project from the 2019
MTP Transportation plan.
• Several amendments have been made to the MTP since the conception of it in 2019. (See appendix C for a list of the amendments.
• Many projects listed in the MPT have been accounted for on future project list by either LADOTD, City of Lake Charles, or Calcasieu Parish. We have included a list of these projects. (See appendix
A) There are still a significant number of projects the did not make the other municipality’s list. We have complied a list of these outstanding projects as well. (See Appendix B)
Noted below are the MPT projects that fall within he Catalytic project locations, most of which are not included on another municipality’s list.
o Including these additional projects within the areas of the catalytic projects could be of great benefit to our proposed projects. These roadway & ped/bike projects will likely have a better chance of gaining traction with the local municipality’s since they are already included on the MPO list
Projects noted with ∆ are already included on another municipality’s project list.
Waterfront Development (Project 02)
• (C-30) I-10 Bridge over Calcasieu River ∆
o Capacity improvement & new bridge
• (BP-454) I-10 Pedestrian Bridge
o Type of ped/bike project: Trail
• (BP- 407) Kirby St 2: Louisiana Ave. to Ryan St.
o Type of ped/bike project: Bike Lane
Mixed-Income Housing Transformation (Project 03)
• (C-106) W. Prien Lake Rd Bridge over Contraband Bayou
o Capacity Improvement and bridge replacement
• (C-87) W. Prien Lake Rd (Lake St to Ryan St)
o Capacity Improvement with new center turn lane
• (C-90) W. Sallier St. RR crossing ∆
o Capacity Improvement with grade separation
• (BP-359) Lake Charles-Bike Lane needed: W. Prien Lake Rd North side
o Type of ped/bike project: Bike Lane
• (BP-411) Lake St: Shell Beach Dr. to Country Club Rd
o Type of ped/bike project: Bike Lane
• (BP- 412) Nelson Rd: W. Prien Lake Rd to Country Club Rd
o Type of ped/bike project: Bike Lane Enterprise Boulevard & Nellie Lutcher Cultural District (Project 04)
• (C-36) Kirkman St. from McNeese St to Jackson St.
o Capacity Improvement with Widening to 4 lanes
• (BP-058) 5th St. (North Side)
o Type of ped/bike project: Sidewalk
• (BP-337) Lake Charles- Bike Lane Suggested 2nd St.
o Type of ped/bike project: Bike Lane
• (BP-338) Lake Charles- Bike Lane Suggested E. Sale Rd
o Type of ped/bike project: Bike Lane
• (BP-340) Lake Charles- Bike Lane Suggested 7th St.
o Type of ped/bike project: Bike Lane
• (BP-343) Lake Charles- Bike Lane Suggested Louisiana Ave.
o Type of ped/bike project: Bike Lane
• (BP-344) Lake Charles- Bike Lane Suggested (Road Diet) Kirby St.
o Type of ped/bike project: Bike Lane (BP-421) Broad Street: Lakeshore Dr to US 90 ∆
o Type of ped/bike project: Bike Lane
McNeese State Resilience District (Project 05)
• (C-10) Common St from Sale Rd to Prien Lake Rd.
o Capacity Improvement with widening to 5 lanes
• (BP-413) McNeese St: Nelson Rd to 5th Ave
o Type of ped/bike project: Bike Lane
• (BP-414) Ryan St: W Sale Rd to W. McNeese St
o Type of ped/bike project: Bike Lane
• (BP-415) Common St: E. Sale Rd to McNeese St
February 25, 2022
Mary Page of
Reference: Calcasieu Parish Police Jury Transportation Projects
o Type of ped/bike project: Bike Lane
Chennault/SOWELA Resilience District (Project 06)
• (C-14) E. Prien Lake Rd from LA 14 to Ward Line Rd.
o Capacity Improvement project with widening to 4 lanes
• (C-95) E Prien Lake Rd Realignment from LA 397 (E Ward Line Rd) to Corbina Blvd
o Capacity Improvement project with realignment of new 2 lane road
• (C-33) J Bennett Johnston Ave from Broad St to Merganser St
o Capacity Improvement project with new center turn ane
• (C-31) I-210 from W I-10 to E I-10
o Capacity Improvement project with Widening to 6 lanes
• (BP-393) Calcasieu Parish- Possible Bike Lane (needs markings) State Route 397 West side
o Type of ped/bike project: Bike Lane
February 15, 2022
UDA Page 2 of 4
Reference: n
To: UDA From: Mary Frances O’Rourke PE Stantec, Baton Rouge Office
Project/File: SWLA Master Resiliency Plan Task 1.5.19 – Task 1.5.22
Date: February 28 2022
Tasks 1.5.19 - Assess nfrastructure Needs Prior to Hurricanes
Infrastructure needs prior to Hurricanes
• Calcasieu Parish Transportation
o New I-10 Bridge over Calcasieu River
o Provide infrastructure for walkability and bikeability
o Replace outdated bridges throughout the parish
o Improved commuter routes across Calcasieu River
o Improved access for growing industrial development
o The Long Range MTP was developed prior to the major hurricanes in 2020. Projects listed and ranked in this report give a good over all understanding of the transportation needs prior to the hurricanes. See memo from Task 1.2.7 for assessment of the Long Range MPO
• Cameron Parish Transportation
o A more resilient crossing of Calcasieu Lake other than the Ferry (ie bridges
o An additional east-west connections
o Improved access for growing industrial development
• For Calcasieu Parish Utilities
o Water/Sewer-
§ There are many different districts. Consolidating the different entities could help streamline the process of expanding the system and coordinating needs throughout the parish
§ Improve on public information system (website mapping, contacts, general information/FAQ)
o Electrical
§ Overhead power lines are primarily wooden poles
o Drainage
§ Outdated/undersized/ poorly maintained drainage systems have resulted in localized flooding issues in various locations
• For Cameron Parish Utilities
o Water/Sewer-
§ There is very little sewer provided throughout the parish. There are more waterlines but it is still sparse. An effort to expand these systems could assist with developing these communities further.
§ There are also several different districts in the parish. Consolidating the different entities could help to streamline the process of expanding.
o ElectricalThere are large gaps of area that do not have access to power
§ Overhead power lines are primarily wooden poles
Tasks 1.5.20 – Assess deficiency in power telecommunications, water and wastewater
• Power
o Much of lower Cameron still running off of generator plant – power Communication grid improvements are needed
o Exposed above ground utilities are a vulnerability throughout both parishes
o See Utility Electrical Investigation memo for a map of the electrical grid.
• Telecommunications o Broadband – Unreliable service; price gouging because no competition
§ Relies on Entergy to fix utility poles when service interrupted
o AT&T Fiber network still being developed
§ DSL network well established
o CenturyLink
§ Coverage in northeastern neighborhoods like Hayes & Hipple
o Suddenlink Communications
o CamTel
• Water
§ weak points are cabinets/panels
§ storm is not detrimental to their system; it is response by other utilities that damage lines by installing new poles
o Areas relying on well water/towers – exposed infrastructure
o During storms, water lines may be pulled up by trees
o Calcasieu Water Districts aren’t same as Calcasieu Police Jury Wards
§ Gaps of service – No water lines; these areas mostly rely on well water
• District 10 of Ward 7 Vinton Area
• District 1 of Ward 1 Moss Bluff/Gills
• District 12E of Ward 3 South Lake Charles
• Bell City Area
• City of Lake Charles
o Cameron Parish Districts 1, 7 & 9 will be consolidating
• Sewer
o Community treatment plants/package plants becoming unsustainable & unsafe
§ Issues with raw sewage especially when there are flooding events
February 15, 2022
UDA Page of
Reference: n
§ North Calcasieu (Moss Bluff) has substantial population but mostly operating on individual treatment systems
§ In Cameron Parish there is very little sewer line continuity. Many residents use septic tanks
February 15, 2022
UDA
Page 4 of
Reference: n
Tasks 1.5.21 – Assess current and planned infrastructure projects
Current and planned projects are focused on improving existing infrastructure or providing new infrastructure in currently developed areas. There does not seem to be any consideration for access to planned development beyond incorporated areas. There also is a severe lack of planned transportation projects in Cameron Parish compared to Calcasieu Parish, and there are no planned new routes in Cameron Parish.
For additional information see the following memos previously submitted
• LADOTD Future Projects memo
• Calcasieu parish Transportation projects memo
• City of Lake Charles Future Projects memo
• City of Lake Charles Future Ped and Bike Projects memo
• IMCAL TIP Future Projects memo
• Sewer Investigation memo
• Water Infrastructure Capital Improvement memo
• Utility electrical Investigation memo
Tasks 1.5.22 Assess history of infrastructure impact area
Interstate 10 crosses through Vinton, Sulphur, Westlake, Lake Charles, and Iowa. However, Lake Charles has experienced the most growth over time compared to the other cities regardless of hurricane events and major disasters. Westlake and Sulphur historically have experienced economic development from an industrial perspective. This has resulted in a need for east west connectivity across the Calcasieu River, which is why -210 was constructed. However, -210 spurred growth on the east side of the river more than it did the west side. As a result there was a higher need for infrastructure to accommodate the growing population in Lake Charles on a more consistent basis. As Lake Charles continues to grow, Sulphur has recently experienced an increase in attractiveness because Lake Charles is reaching saturation as development moves further south and east of I-210.
Cameron Parish has historically experienced very minimal growth and need for significant infrastructure due to its topography and proximity to the Gulf coast, which leaves it highly vulnerable to extreme weather events such as hurricanes, coastal erosion, and storm surge. Generally speaking, there is only one true east-west route in Cameron Parish, which is LA 27/82. There is also one true north-south route in Cameron Parish, which is LA 27. Due to its lack of growth and development, there has been a lack of prioritization for infrastructure improvements in this parish.
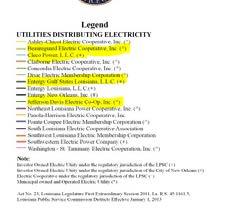
February 11, 2022
Andre Page 2 of 6
To: UDA
Project/File: SWLA Resiliency Master Plan Utility-Electrical Investigation
From: Mary Frances O’Rourke, PE Baton Rouge
Date: February 24 2022
Tasks 1.2.5 - Create a compilation map of ongoing plans, projects, and efforts (development, resilience, hazard mitigation, etc.)
ELECTRICAL INVESTIGATION
Power Service Areas
Calcasieu Parish is powered by the following companies (See map & legend below):
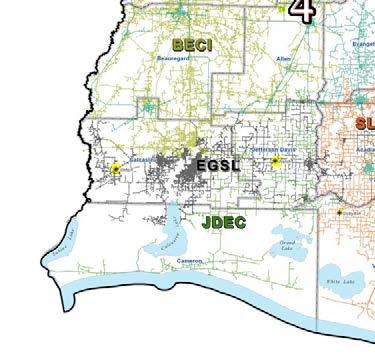
• Entergy Gulf South Louisiana
• Beauregard Electrical Cooperative
• Cleco
• City of Vinton Cameron Parish is powered by the following companies (See map & legend below):
• Entergy Gulf South Louisiana
• Jefferson Davis Electric Co-Op
Reference: Calcasieu Parish Police Jury Transportation Projects electric_map_districts_2013.jpg (2100×2100) (louisiana.gov)
February 11, 2022
Andre
Page of
Reference: Calcasieu Parish Police Jury Transportation Projects
February 11, 2022
Andre Page 4 of
Reference: Calcasieu Parish Police Jury Transportation Projects
Entergy: https://www.etrviewoutage.com/map?state=LA
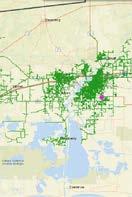
February 11, 2022
Andre Page 5 of 6
Reference: Calcasieu Parish Police Jury Transportation Projects Beauregard Electric Co-Op: http://www.becioutage.org/
February 11, 2022
Andre Page 6 of
Reference: Calcasieu Parish Police Jury Transportation Projects
City of Vinton: https://www.google.com/maps/place/Vinton,+LA+70668/@30.1912964,93.5842936,13.5z/data=!4m5!3m4!1s0x863bf755e47f593f:0xd9f858947906d3a8!8m2!3d30.1911244!4d93.5813576
Cleco: Cleco covers the city of Dequincy and a small portion in the NW corner of Calcasieu Parish as circled in Red
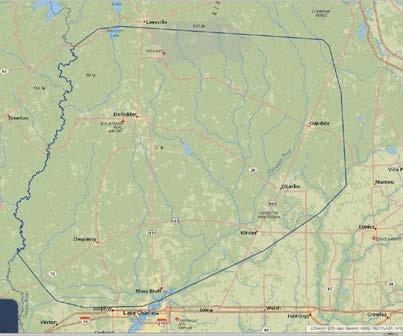
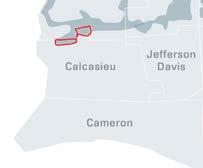
Jefferson Davis Electric Co-Op
• Jeff Davis Electric CO-OP JDEC is an electric cooperative serving the rural areas of Allen, Calcasieu, Cameron, Jefferson Davis, and Vermillion parishes
• There are 8 550 residential customer accounts, 1 471 commercial accounts and 164 industrial customer accounts receiving electricity from the supplier.
Centerpoint Energy: Only services gas in the Calcasieu/Cameron Parish areas
To: UDA From: Mary O’Rourke Stantec, Baton Rouge Office
Date: February 25, 2022
Project/File: SWLA Resiliency Master Plan Water Infrastructure Capital Improvement Plan
Tasks 1.2.5 - Create a compilation map of ongoing plans, projects, and efforts (development, resilience, hazard mitigation, etc.)
Below is a summary of the Water Infrastructure Capital Improvement Plan List for the water districts in Calcasieu Parish. GIS files were previously provided for all water districts in Calcasieu Parish. A KMZ file was previously provided for Cameron Parish.
A summary of the Waterline projects in Lake Charles is also included. AKMZ file is included with this submittal which shows the waterlines located in Lake Charles near the Catalytic Project locations. The treatment plans located in Lake Charles are also included in this KMZ file.
Calcasieu Parish
Water District 5 of Ward 3 (Mallard Junction)
• Currently under $8.5M Upgrade Project. Part of this project is to increase capacity from 1.15 GPD to 2.13 GPD.
• No assets at risk to sea level rise
• Projects: 1. Phase 1 – Remaining water Treatment plant (currently under construction) a. This project will increase the capacity of the existing water plant. We received a loan from the LDH.
b. Estimate Cost - $6 million (remaining balance $4 million) c. Under revolving fund with state 2. Calcasieu
to function under normal under emergency conditions.
b.
c.
b.
River Road, down Smith Cutoff to Hwy 109 North. It will then travel South to 206 Highway 109 South, the location of our water tower.
• They also plan to replace main lines in town. They’ve completed much of the work but have a couple of short runs left to complete. The lines were laid prior to the blacktopping of roads.
• Projects:
1. Replacement of Old Starks System a. The water lines in the middle of Starks are the old lines that were installed by the private Starks Water System. WW14 purchased this little system and integrated its piping into the current distribution system. They have been gradually replacing the old piping for several years. WW14 currently has $500,000 in Priority 2 in this year’s capital outlay bill. Assuming the $500k obtains bond commission approval, this should be enough to finish the line replacement project.
b. Estimated Cost = $1 million ($300,000)
c. Local allocation to ARP
2. Transmission Line a. As you may know, the WW14 water plant is at the far north end of their system. It pumps through a 12” main to the elevated tank in Starks. With the addition of WW10, it is more important now than ever to have a backup line whereby we could provide water from the water plant to Starks and the areas south. We have proposed running an 8” “backup transmission” line along LA 109 from the water plant to Starks. WW14 currently has $500,000 in Priority 2 in this year’s capital outlay bill. The total project cost is estimated at $1.2M
b. Estimated Cost = $1.5 million
c. Local allocation to ARP ($700k)
3. Second Ground Storage Tank a. The WW14 water plant only has one ground storage tank. A second tank would be very beneficial for providing additional storage for servicing WW10 and for providing redundancy allowing the tanks to be taken out of service for maintenance while maintaining operation at the plant.
b. Estimated Cost = $500,000.
c. Local allocation to ARP
Water District 10 of Ward 7
• Projects:
1. Phase 2 Distribution system install a. This project will consist of installing the remainder of the distribution system and constructing an elevated tank.
damage would not be enough to fortify this area. There are additional improvements that are needed (i.e. generators for power outages) since more people are coming into the area & this area is frequently used as a staging area during hurricanes as well
• There are buildings with chlorine injection units that need to be elevated. They are currently at ground level. District 16 • No known information
• No water or sewer
between Big Lake Highway and Elliot Road, and the installation of various sewer line crossings along the Ham Reid Road Extension Route.
• SE WTP Distribution System - South Park Drive Waterline Extension (E.Gauthier Rd. to Red David McCollister Rd.)
n
Cost Estimate: $980,000 Scope of Work: Design of approximately 5000 ft of 24" inch water main on South Parrk Drive from E. Gauthier to Red Davis McCollister Rd.
• SE WTP Distribution System - Gauthier Rd. Waterline Extension (Nelson
stone base. Replace and repair existing 4-foot wide plain concrete sidewalk on the east side of the street. Approximate project length is about 1300 in. The existing right of way of 6th Avenue is 60 foot wide and the existing pavement is concrete with a sidewalk on the east side. 2. Water: Replace the existing 6" cast iron water line with new 8" DR-18 AWWA C900 PVC water pipe including valves and fire hydrants as required. Tie into the existing water lines on 4th, 5th and 6th Streets.
Tie the new 8" water line to meters with new service lines. The existing 6" water line is to be abandoned or removed. 3. Drainage: Install new underground drainage system that will extend the existing system at 3rd Street down to 6th Street. The existing drainage system on 6th Avenue will be removed and replaced with the new upgraded system. 4. Sewer: The existing 8" diameter lines will be reconstructed as required.
• Enterprise Blvd. From 12th St. to Broad St.
Cost Estimate: $4,125,000 Scope of Work: This project will consist of a partial reconstruction and full overlay of Enterprise Blvd. from 12th Street to Broad Street. Occasional drainage improvements, new 8 inch water main, and new sewer manholes.
The Just Imagine SWLA Best Management Practices (BMP) Library is based on proven practices that are used in communities facing many of the same challenges as SWLA. These practices protect residents and property and increase the community’s resilience. The library is a living document that will be updated with additional BMPs for other areas as they are identified. The purpose of the library is to understand the tools in the toolbox and apply the right BMP into specific projects. Not all the of the BMPs are applicable to every catalytic project but there are concepts and approaches to flood mitigation and mobility that can be adapted to every project.
The library is broken out into three main sections
• Coastal
• Green Infrastructure (GI)
• Complete Streets
The Coastal BMPs are applicable to Project 1 Regional Coastal Flood Protection. It can also be utilized as concepts for the Waterfront Vision Plan.
The GI BMPs are applicable to many of the community redevelopment projects. They provide flood mitigation, water quality benefits, and improve overall quality of life. Complete Streets BMPs make the pedestrian and bikers the main priority and create safe connections throughout the community.
Both GI and Complete Streets can be applied to Mixed-Income Housing Transformation, Enterprise Boulevard & Nellie Lutcher Parkway Plan, McNeese State Universities, Chennault/Sowella Resiliency District and Strong Downtowns.
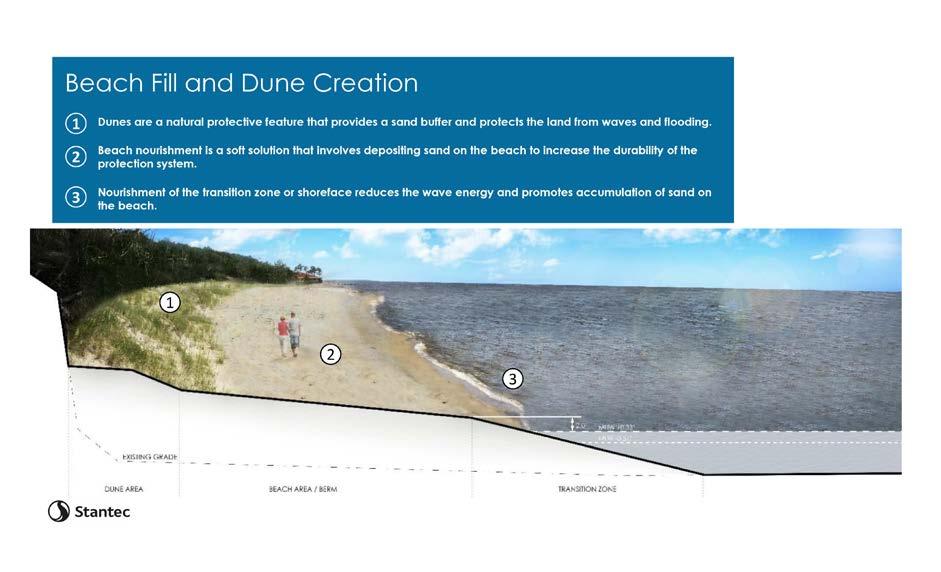
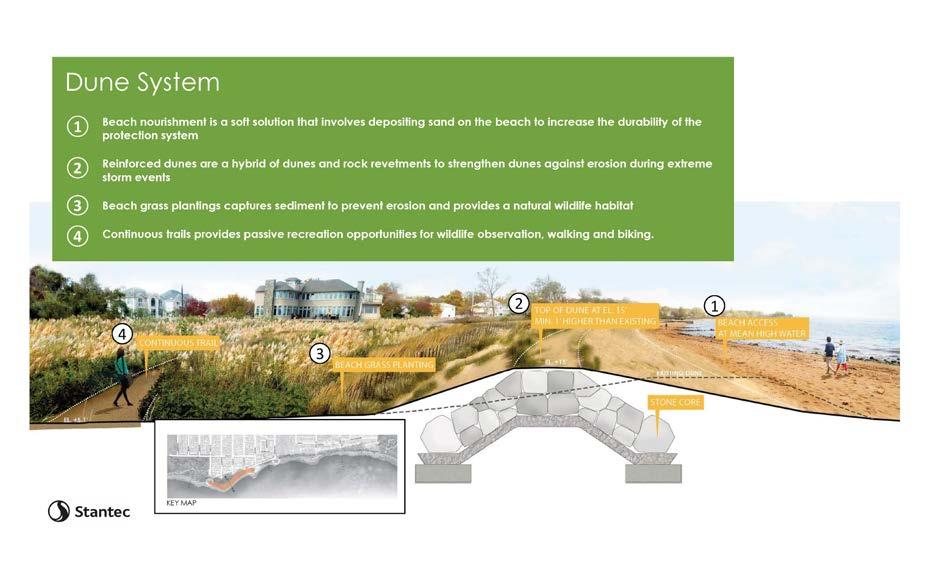
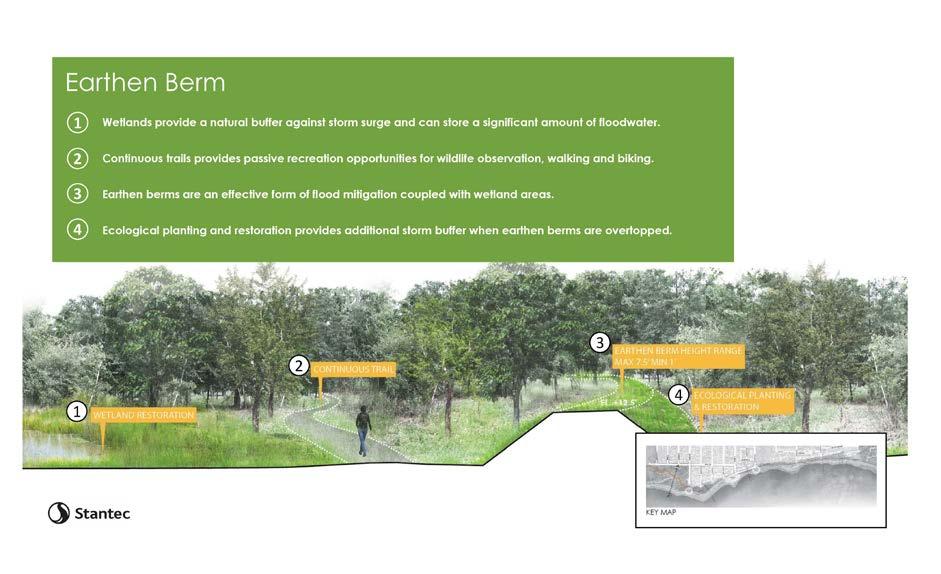
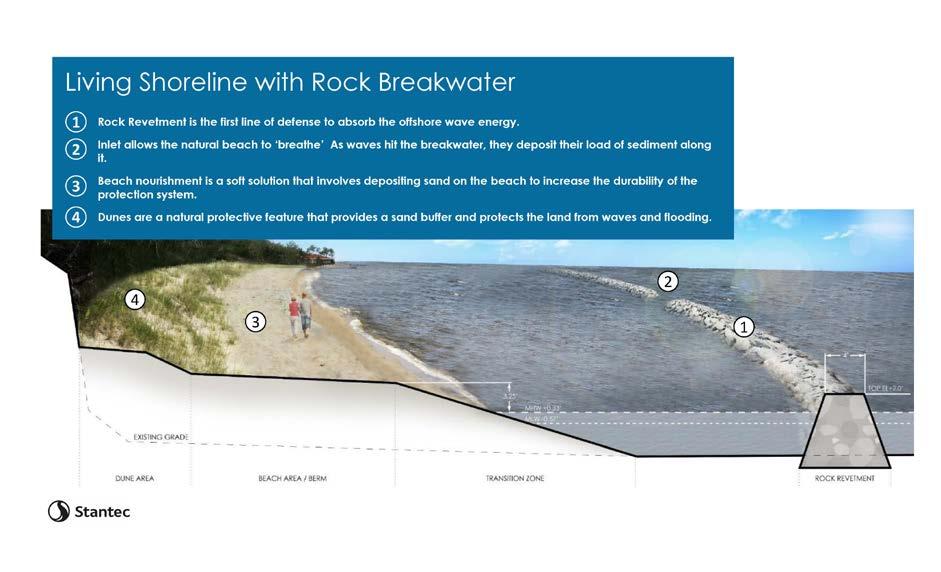
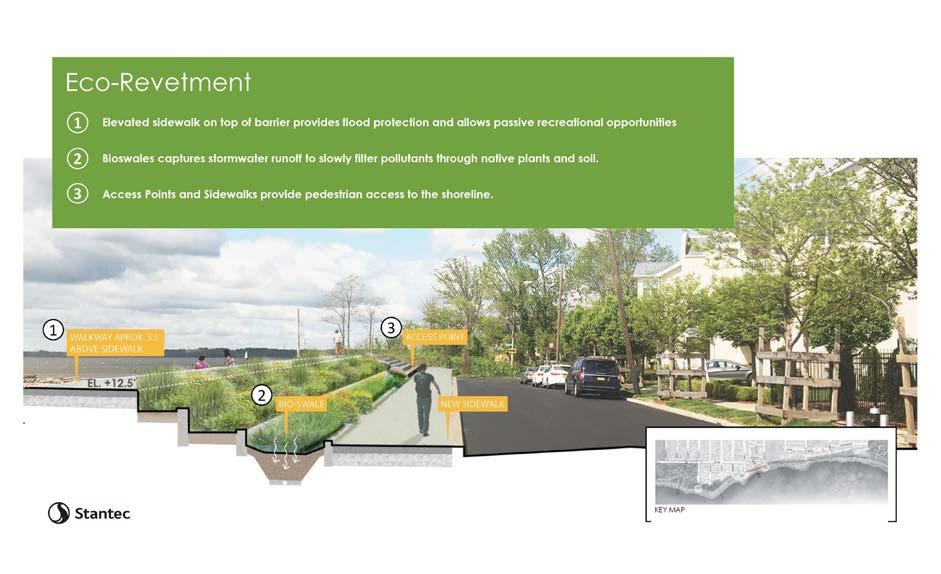
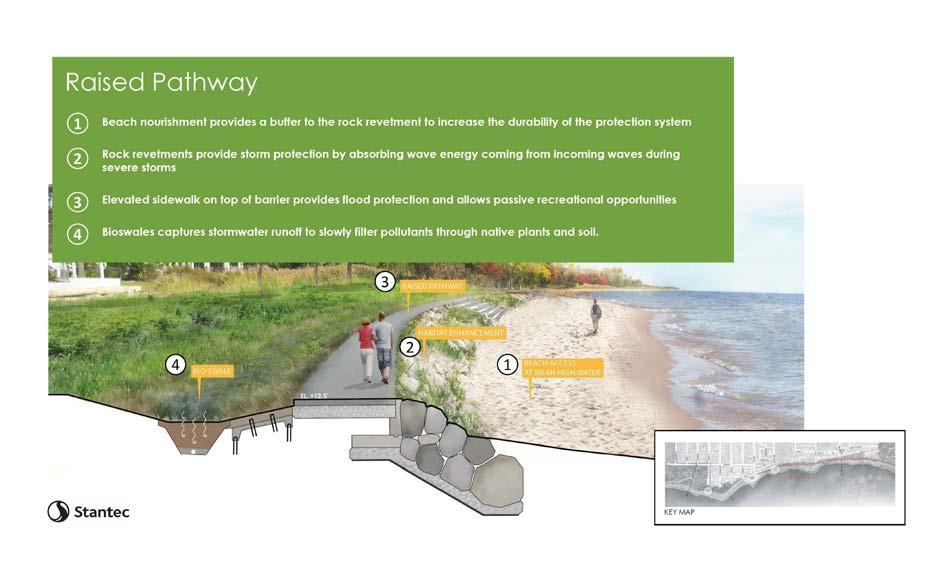
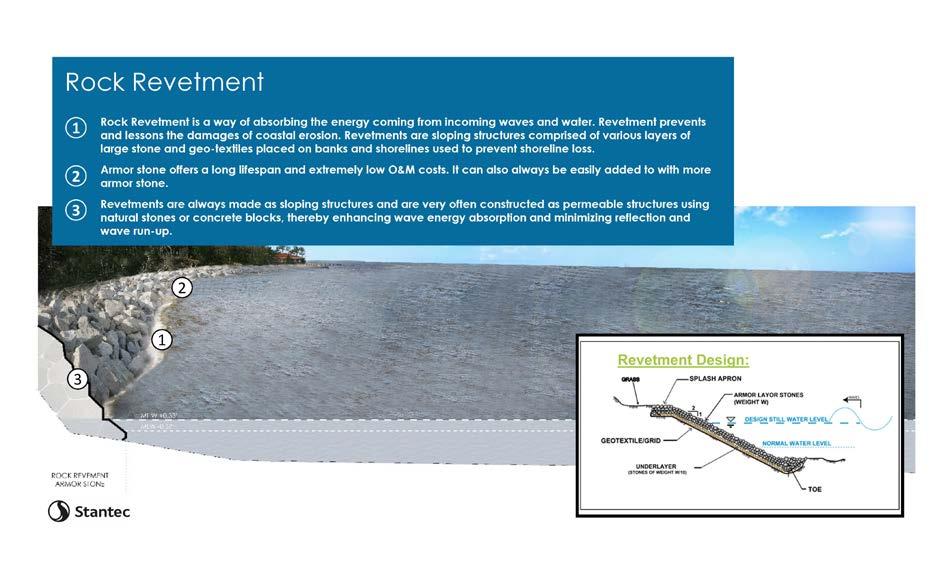

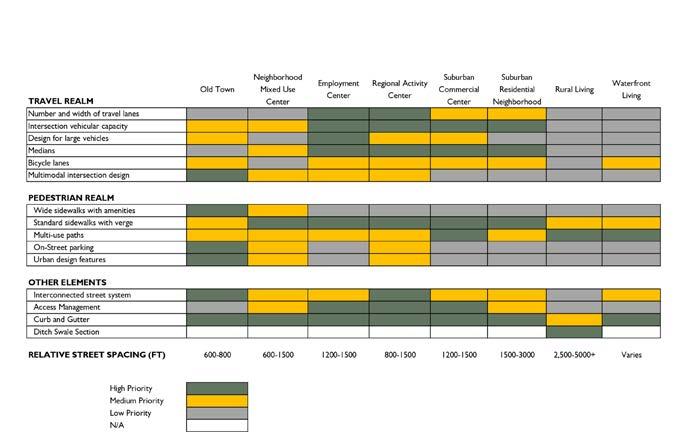
Is this street safe, secure, & supporting the local economy?
Does it do this for every user of the street?
While there is no single, universally accepted street audit tool, much less one that can fit on a single page, this Complete Street Audit Worksheet will help the average person or professional evaluate walking, biking, and transit conditions that support a complete street.
how to use it
ONE
TWO
Read this introduction, and check out some of the (re-) sources at the bottom-left for more information, time permitting.
Look at the street/study area on a map (Google helps but is not substitute for first-hand walkthroughs) to get familiar with it.
THREE
Audit: Be Safe! Wear bright clothing and reflective vests; take / drink water; don’t go alone, ever. Make copies of the second page, one for each street segment.
Once you complete the audit, discuss and writeup what you’ve learned before you forget the details. Add in how to make the street better –how do “Ns” get to “Ys” In your checklist?
“If we can develop and design streets so that they are wonderful, fulfilling places to becommunity-building places, attractive for all people - then we will have successfully designed about one-third of the city directly and will have had an immense impact on the rest.”
- Allan Jacobs
Toolkit for the Assessment of Bus Stop Accessibility and Safety
Pedestrian Road Safety Audits
Guidelines and Prompt Lists (FHWA)
Bicycle Road Safety Audit
Guidelines and Prompt Lists (FHWA)
Using Crime Prevention Through Environmental Design in Problem-Solving (USDOJ)
Urban Street Design Guide (NACTO)
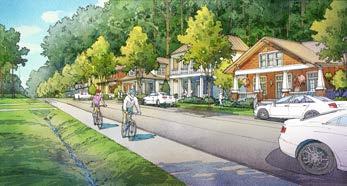
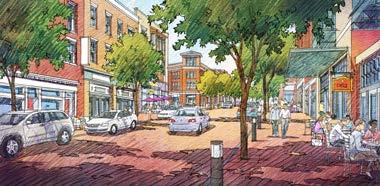
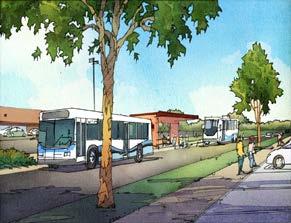
The technical evaluation of any street requires a lot of people with different backgrounds, as well as the detailed involvement of residents, travelers, and business owners that depend on that street to guide the process successfully. This tool is just an initial review, designed to help people think consistently and across the different fields to better relate to the diverse needs of people that want great streets.
The current conditions, coupled with the (potential) users of the street from the Context Section above, provide both the starting point and vector for making improvements.
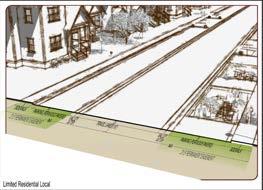


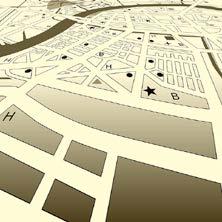
The National Complete Streets Coalition, a program of Smart Growth America, is a nonprofit, non-partisan alliance of public interest organizations and transportation professionals committed to the development and implementation of Complete Streets policies and practices. A nationwide movement launched by the Coalition in 2004, Complete Streets is the integration of people and place in the planning, design, construction, operation, and maintenance of transportation networks.
All images shown on this page:
complete street audit starts on next page
Additional Notes (Partners? Programs? Physical Improvements? Challenges? Opportunities for Pilot or Tactical Urbanism? Data / Information Needed?)
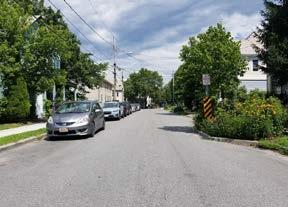
BMP: Traffic Calming Methods & Treatments
Description
A chicane is a series of alternating curves or lane shifts that are located in a position to force a motorist to steer back and forth out of a straight travel path. The chicane curves can be created with a curb extension that alternates from one side of the street to the other. A chicane-like effect can also be achieved by alternating on-street parking from one side of the street to the other.
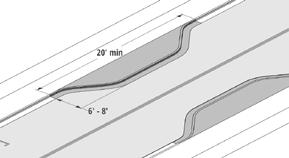
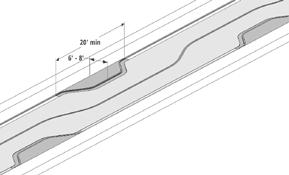
Typical Conditions
Speed: Generally appropriate for roads with posted speed limits of up to 35 miles per hour.
Traffic & Volume: Generally appropriate for roads with low traffic volumes and for all vehicle types, including emergency response vehicles and transit routes.
Cost
Range from $5,000 to $10,000 per chicane dependent upon:
• Materials used (temporary or permanent)
• Drainage considerations
• Utilities relocation
• Size/length of the chicane
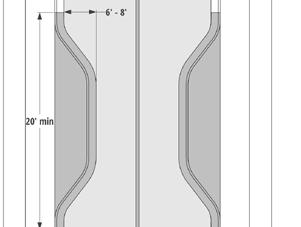
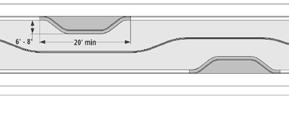
Advantages and Disadvantages
Advantages
• Appropriate in both urban and suburban settings
• Landscaping the areas of deflection can create green space
• Slows traffic by encouraging motorists to moderate vehicle speed through the horizontal deflection
Disadvantages
• Bicyclists and motor vehicles share the lane
• Drivers may cut straight paths across center line (striping, without median)
Built Example - Source: Dan Burden, Walkable Communities
BMP: Traffic Calming Methods & Treatments
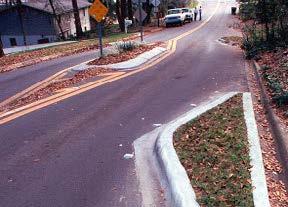
Description
A choker is the narrowing of a roadway through the use of curb extensions or roadside islands. It can be created by a pair of curb extensions at a midblock location that narrows the street by widening the sidewalk or planting strip at that location. A choker can also be created through the use of roadside islands or through a curb extension with parking on the opposite side.
Typical Conditions
Speed: Generally appropriate for all common urban speed limits, provided adequate distance is provided between travel lane and curb.
Traffic & Volume: Generally appropriate for roadways with low to moderate traffic volumes, and are appropriate for all vehicle types, including primary emergency vehicles and transit.
Cost
Between $10,000 and $25,000 per extension, dependent upon:
• Drainage considerations
• Utilities relocation
• Size of the extension
Advantages and Disadvantages
Advantages
• Opportunities for landscaping and amenities can significantly increase neighborhood and streetscape beautification
• Provides opportunity for a mid-block crosswalk
• Provides protection for on-street parking
• Applicable with or without dedicated bicycle facilities
Disadvantages
• May require relocation of drainage features and utilities
• May require some parking removal
• Potential for higher costs due to drainage considerations
BMP: Traffic Calming Methods & Treatments
Description
A curb extension (or bulb out) is a horizontal extension of the sidewalk into the street at an intersection effectively narrowing the roadway.
Typical Conditions
Speed: Generally appropriate for all common urban speed limits, provided adequate distance is provided between travel lane and curb.
Traffic & Volume: Generally appropriate for roadways with low to moderate traffic volumes, and are appropriate for all vehicle types, including primary emergency vehicles and transit.
Cost Ranges between $10,000 and $25,000, dependent upon:
• Drainage considerations
• Utilities relocation
• Size of the extension
Advantages & Disadvantages
Advantages
• Slows automobile turning speeds and increases sight triangles for motorists, increasing pedestrian visibility
• Shortens pedestrian crossing distance and improves pedestrian visibility
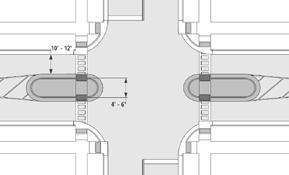
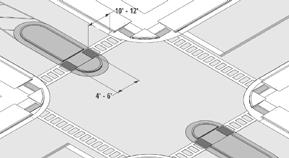
• Provides protected parking bays
• Creates opportunities for landscaping and amenities at extensions, enhancing beautification
Disadvantages
• May require relocation of above- and below-ground utilities, drainage features
• May require some parking removal adjacent to intersections
• Potential for higher costs due to drainage considerations
• Potential to cause vehicle damage to drivers with larger class vehicles who are lost
BMP: Traffic Calming Methods & Treatments
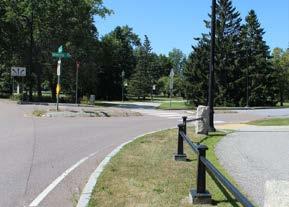
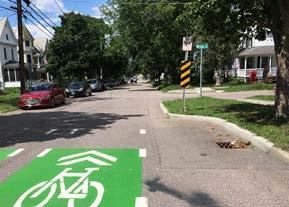
Description
A median island (intersection) is also called a median refuge island and is a median located at an intersection along the centerline that narrows the travel lanes. A median island may be a painted area or a raised curb, with or without landscaping. A central cutout can create a pedestrian refuge. At intersections, a median island may also be called a pedestrian or splitter island.
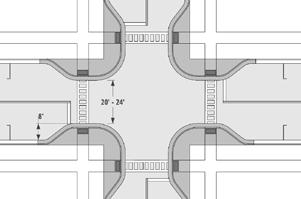
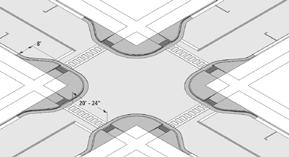
Typical Conditions
Speed: Generally appropriate for roads with posted speed limits of up to 35 miles per hour.
Traffic & Volume: Appropriate for all traffic volumes and vehicle types.
Cost
Ranges between $10,000 to $15,000 are expected for installation of the median island, dependent upon size, material, landscaping and drainage considerations.
Advantages and Disadvantages
Advantages
• Reduces pedestrian crossing distance and increases visibility,
• With a variety of materials, medians can greatly enhance neighborhood aesthetics
• Raised curbing increases visibility and nighttime safety
• Reduces vehicle conflict points
• 46 to 56% reduction in pedestrian crashes observed
Disadvantages
• Landscaping maintenance costs can increase depending on vegetation used
• Potential for higher costs depending upon drainage and utilities considerations
• Turning radius may be impacted for larger vehicles
Description
A median island (midblock) is a raised island located along the street centerline that narrows the travel lanes. Unlike the median refuge island, the median island is located at midblock locations. A median island may be a painted area or a raised curb (preferred), with or without landscaping, to further reduce the open feel of a street.
Typical Conditions
Speed: Generally appropriate for roads with posted speed limits of up to 35 miles per hour.
Traffic & Volume: Appropriate for all traffic volumes and vehicle types.
Cost
Ranges between $10,000 to $15,000 are expected for installation of the median island, dependent upon size, material, landscaping and drainage considerations.
Advantages and Disadvantages
Advantages
• Can function as a midblock pedestrian refuge island
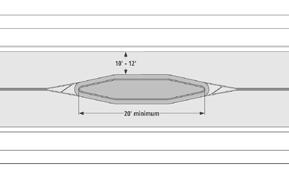
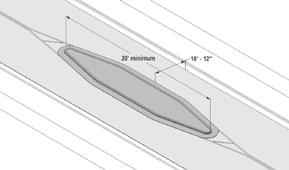
• With a variety of materials, medians can greatly enhance neighborhood aesthetics
• Light crowning increases visibility and nighttime safety
• Reduces vehicle conflict points
Disadvantages
• Bicyclist and motor vehicles share the lane
• Landscaping maintenance costs
• Potential for higher costs depending upon drainage and utilities considerations
• Can restrict driveway access where driveways are located within the limits of the island
• Damage to snow plows, damage from snow plows
BMP: Traffic Calming Methods & Treatments Built
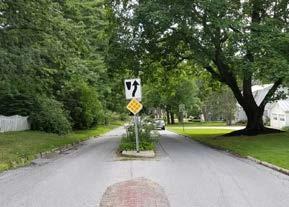
Once staff have determined that installation of traffic calming measures is warranted, the next step that they will take will be to evaluate the various traffic calming methods and treatments appropriate for the street typolog y This section describes which traffic calming methods/treatments are appropriate for the various street typologies, and includes cut sheets for each method/treatment to assist staff in deciding which methods/treatments to install.
Not all traffic calming treatments are appropriate for all street typologies, and engineering judgment should be incorporated into the consideration of potential context-sensitive design.
Parking Conversion
modification of parking space)
1 Street Typology represents the priority mode for the specific street. This does not suggest that other modes are not in use.
2 Parking Conversion is context dependent, but may refer to widening of on-street parking to restrict the travel lane or conversion of angled- to parallel-parking.
3 See PlanBTV WalkBike Corridor, Neighborhood and Downtown Slow Zones.
BMP: Traffic Calming Methods & Treatments
Description
A traffic circle is a raised island, placed within an unsignalized intersection, around which traffic circulates. The circle may have Stop signs or Yield signs on the intersection approaches. The island forces a motorist to use reduced speed when entering and passing through an intersection. Though similar to a roundabout, traffic circles do not follow modern design roundabout principles, as there is no horizontal deflection on the approach.
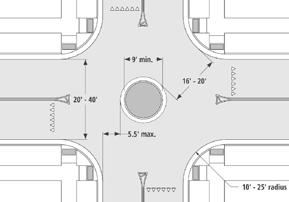
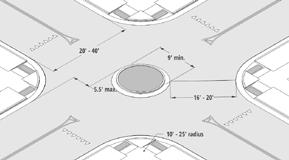
Typical Conditions
Speed: Generally appropriate only for streets with low posted speed limits of up to 30 miles per hour.
Traffic & Volume: Generally appropriate for streets with less than 2,000 vehicles per day, and are not appropriate for trucks with more than two axles, emergency vehicles, or transit routes.
Cost Ranges between $10,000 to $25,000, dependent upon drainage considerations, utilities, landscaping, and circle diameter.
Advantages and Disadvantages
Advantages
• Observed speed reductions of four miles per hour are typical at the traffic circle; reduced speeds continue beyond the intersection
• Greater speed reductions achieved with installation of splitter islands
• Reduction in number of angle and turning crashes
Disadvantages
• Not appropriate where transit routes must make left turns
• Emergency vehicles and large trucks typically may turn left in front of the circle in order to navigate the intersection
BMP: Traffic Calming Methods & Treatments
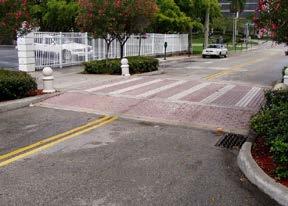
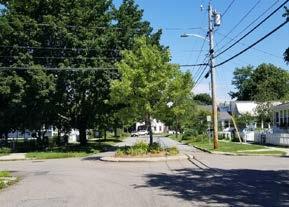
Description
A raised crosswalk is a raised area extending perpendicular to the roadway, accompanied by a pedestrian crosswalk on the raised surface, designed to physically limit the speed at which a vehicle can traverse it. Raised crosswalks may be installed at both midblock and intersections and ranges in height based on the roadway type. Refer to Burlington Crosswalk Guidelines. Crosswalks should not be installed solely for the purpose of traffic calming, they must also meet the warrants for a marked crosswalk or an enhanced crosswalk.
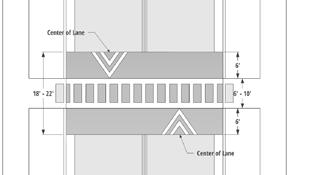
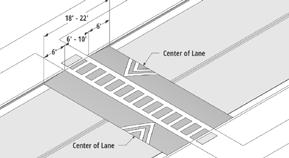
Typical Conditions
Speed: Generally appropriate for roadways with posted speed limits up to 35 miles per hour.
Traffic & Volume: Not appropriate for primary emergency vehicle response routes, or roadways providing access to medical facilities.
Cost
Ranges between $2,500 to $8,000 for asphalt table. Higher costs may be incurred for brickwork, stamped asphalt, concrete ramps, and other pedestrian crossing enhancements.
Advantages and Disadvantages
Advantages
• Increased pedestrian connectivity creates a more walkable community
• Reduces speeds to between 25 to 35mph at the crosswalk
• Bicycle safety relatively unaffected
• When used in a series, traffic volume reductions of up to 20% observed
Disadvantages
• Should not be located within 50-75 feet of bus stops
• Not appropriate for primary emergency vehicle routes or streets providing access to a hospital or medical services
• Snow plow damage to raised crosswalk
• Potential increase in noise and in traffic on adjacent streets
Built
BMP: Traffic Calming Methods & Treatments
Description
A raised intersection is a flat, raised area covering an entire intersection, including the crosswalks, with ramps on all approaches. A raised intersection typically rises no more than 3 inches. They often have brick or other decorative materials or textures applied.
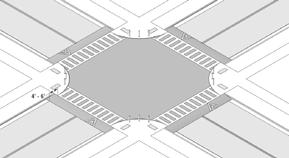
Typical Conditions
Speed: Generally appropriate for posted speed limits of up to 30 miles per hour.
Traffic & Volume: Generally appropriate in lower volume conditions and are suitable for transit and emergency response vehicle routes.
Cost
Ranges between $25,000 to $70,000 dependent upon several factors, including road size, drainage conditions, materials, and pedestrian enhancements.
Advantages and Disadvantages
Advantages
• Versatile in both residential and commercial settings, and can enhance intersection aesthetics
• Large trucks are slowed and/or delayed between two to six seconds crossing the intersection
• Works well with curb extensions and textured crosswalks
• Improves accessibility
• Detectable warnings and/or color contrasts must be incorporated to differentiate the roadway and the sidewalk
Disadvantages
• Reduction in mid-block speeds typically less than 10 percent
• May require bollards to define edge of roadway
• Storm drainage/underground utility modifications are likely necessary
• Potential for higher costs depending upon width of intersecting roads and drainage considerations
• Maintenance of materials used (brick, striping)
BMP: Traffic Calming Methods & Treatments
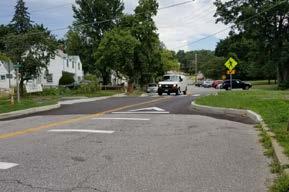
Description
Reallocation of pavement space can include removing and/or reconfiguring existing travel lanes or replacing lanes with other facilities such as bicycle lanes, on-street parking or transit uses for example.
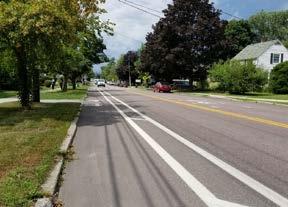
Typical Conditions
Speed: Generally appropriate for roadways with lanes in excess of 12 feet wide.
Traffic & Volume: Generally appropriate for all types of urban roadways and have been applied to roadways with daily maximum volumes from 15,000 - 25,000.
Cost
Can be designed internally and implemented with scheduled resurfacing making costs minimal.
Advantages & Disadvantages
Advantages
• Lane removal can reduce higher speeds achieved through passing
• Can reduce crashes by 19-47%
• Retains sufficient flow despite lane removal
Disadvantages
• No significant disadvantages
Plan View Detail (Roadway striping as lane diet)
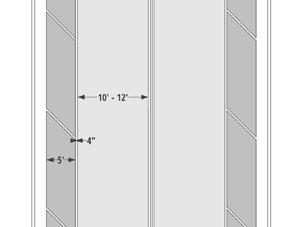
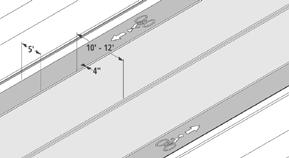
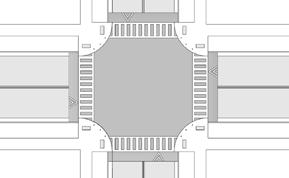
Oblique Angle Detail (Conventional bike lanes as lane diet)
Built Example (Buffered bike lanes as a road/lane diet)
BMP: Traffic Calming Methods & Treatments
Description
A full street closure is a physical barrier, whether at an intersection or midblock, that is placed across a street to close the street completely to through vehicle traffic. A full closure can be designed to allow bicyclists and pedestrians to pass through. An operational analysis shall be completed prior considering this treatment.
Typical Conditions
Speed: Generally appropriate for all common urban posted speed limits, with adequate advance warning given to road users.
Traffic & Volume: Generally appropriate for roadways with low traffic volume, and are not appropriate for primary emergency vehicle response, truck, or transit routes.
Cost
Ranges from as little as $1,500 to $10,000 depending upon method of closure chosen. Costs vary substantially dependent on treatment, and include potential considerations for drainage, construction, and restriping.
Advantages and Disadvantages
Advantages
• Highest degree of traffic volume reduction
• Increased pedestrian and bicyclist safety
• Eliminates vehicle conflict points
Disadvantages
• Without design considerations (e.g., mountable curbs, removable delineators) restricts emergency response vehicles and thereby affects access and response time
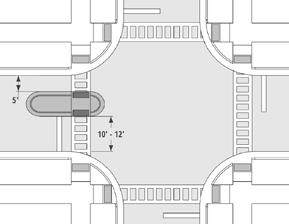
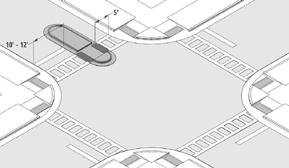
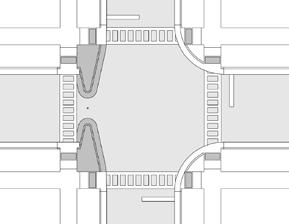
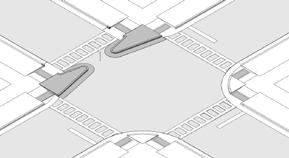
• Reduces overall network connectivity
• Adverse effects to property accessibility
• Diverts traffic to other streets and may increase volume elsewhere
• Potential for high costs dependent upon degree of integration with streetscape, drainage considerations
BMP: Traffic Calming Methods & Treatments
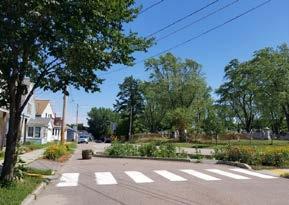
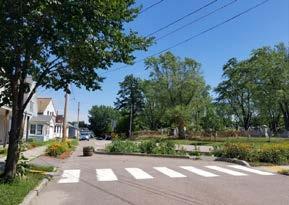
Description
A partial closure is a physical barrier that blocks vehicle travel in one direction for a short distance on an otherwise two-way street. A partial closure can block either traffic entering the side or exiting the side street, depending on its placement. The traffic movement that is obstructed by the half closure is rerouted along an alternative path.
Typical Conditions
Speed: Generally appropriate for all common urban posted speed limits, with adequate advance warning given to road users.
Traffic & Volume: Generally appropriate for roadways with low traffic volume, and are not appropriate for primary emergency vehicle response, truck, or transit routes.
Cost
Costs range from as little as $3,000 to $10,000 depending upon the complexity of the closure. They vary substantially dependent on treatment, and include potential considerations for drainage, construction, and restriping.
Advantages and Disadvantages
Advantages
• Speed and volume reductions for the closed travel lane
• Increased pedestrian and bicyclist safety
Disadvantages
• Not appropriate for emergency vehicle response routes
• Reduces overall network connectivity
• Adverse effects to property accessibility
• Diverts traffic and increases volume elsewhere
BMP: Traffic Calming Methods & Treatments
Description
Rumble strips are patterned sections of rough pavement or topical applications of raised material, perpendicular to the direction of travel, that cause vibration and noise when driven over by the operator of a motor vehicle. This noise and vibration is intended to direct the motorist’s attention back to the roadway. FHWA-approved treatments include white- and black-painted stripes. Avoid conflicts with driveways. Typical spacing is 50 - 100 feet apart.
Typical Conditions
Speed: Generally appropriate for roadways with higher posted speed limits, such as transitions from freeways to lower class roadways.
Traffic & Volume: Generally appropriate for any traffic volumes and do not impair truck access, transit, or primary emergency response routes, not appropriate on bicycle routes.
Cost
Ranges between $0.10 to $0.60 per linear foot dependent on:
• Project length
• Availability and selection of materials
• Roadway surface
Advantages and Disadvantages
Advantages
• FHWA studies show 34% reduction in crashes on urban and suburban roads
• Relatively low cost
• Relatively quick installation
Disadvantages
• Not effective on roadways with lower posted speeds
• High noise levels generated by traffic
BMP: Traffic Calming Methods & Treatments
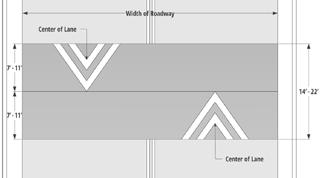
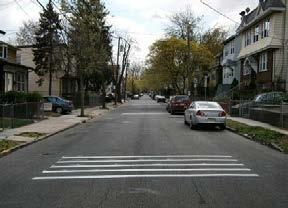
Description
A speed hump is an elongated mound in the roadway surface extending across the travel way at a right angle to the traffic flow. It uses vertical deflection to create motorist discomfort and thereby reduces speed. Burlington DPW offers two sizes of speed humps, 14 feet or 22 feet wide, the larger size being more appropriate for higher volume streets. Typical placement is midblock and spaced 300 - 500 feet apart. Avoid conflicts with driveways.
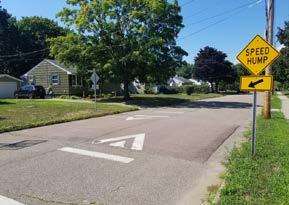
Typical Conditions
Speed: Generally not appropriate for roadways with a posted speed of 45 miles per hour or above.
Traffic & Volume: Not appropriate for truck access routes, transit routes, or primary emergency response routes; Appropriate for roads with grades below eight percent.
Variation: Speed Cushions can be used as a variation along primary emergency routes or transit routes.
Cost
Between $2,000 - $4,000 dependent on drainage design
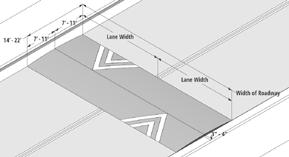
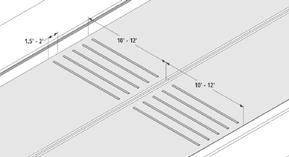
Advantages and Disadvantages
Advantages
• Bicyclist safety is relatively unaffected
• Typical traffic volume reductions of 20% (series of humps)
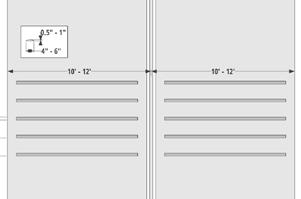
• Crash rate reductions of approximately 40% are typical Disadvantages
• When applied as a single treatment, little to no traffic volume reduction or diversion should be expected
• Increased noise levels from vehicles impacting the hump
• Not appropriate for primary emergency vehicle routes or streets providing access to a hospital or emergency medical services
• Not appropriate for transit routes or primary access routes for industrial or commercial sites
• Adequate stopping sight distance or warning signs provided
• Snow plow damage to speed hump
BMP: Traffic Calming Methods & Treatments
Description
A full street closure is a physical barrier, whether at an intersection or midblock, that is placed across a street to close the street completely to through vehicle traffic. A full closure can be designed to allow bicyclists and pedestrians to pass through. An operational analysis shall be completed prior considering this treatment.
Typical Conditions
Speed: Generally appropriate for all common urban posted speed limits, with adequate advance warning given to road users.
Traffic & Volume: Generally appropriate for roadways with low traffic volume, and are not appropriate for primary emergency vehicle response, truck, or transit routes.
Cost
Ranges from as little as $1,500 to $10,000 depending upon method of closure chosen. Costs vary substantially dependent on treatment, and include potential considerations for drainage, construction, and restriping.
Advantages and Disadvantages
Advantages
• Highest degree of traffic volume reduction
• Increased pedestrian and bicyclist safety
• Eliminates vehicle conflict points
Disadvantages
• Without design considerations (e.g., mountable curbs, removable delineators) restricts emergency response vehicles and thereby affects access and response time
• Reduces overall network connectivity
• Adverse effects to property accessibility
• Diverts traffic to other streets and may increase volume elsewhere
• Potential for high costs dependent upon degree of integration with streetscape, drainage considerations
BMP: Traffic Calming Methods & Treatments
Description
A partial closure is a physical barrier that blocks vehicle travel in one direction for a short distance on an otherwise two-way street. A partial closure can block either traffic entering the side or exiting the side street, depending on its placement. The traffic movement that is obstructed by the half closure is rerouted along an alternative path.
Typical Conditions
Speed: Generally appropriate for all common urban posted speed limits, with adequate advance warning given to road users.
Traffic & Volume: Generally appropriate for roadways with low traffic volume, and are not appropriate for primary emergency vehicle response, truck, or transit routes.
Cost
Costs range from as little as $3,000 to $10,000 depending upon the complexity of the closure. They vary substantially dependent on treatment, and include potential considerations for drainage, construction, and restriping.
Advantages and Disadvantages
Advantages
• Speed and volume reductions for the closed travel lane
• Increased pedestrian and bicyclist safety
Disadvantages
• Not appropriate for emergency vehicle response routes
• Reduces overall network connectivity
• Adverse effects to property accessibility
• Diverts traffic and increases volume elsewhere
BMP: Traffic Calming Methods & Treatments
Description
Rumble strips are patterned sections of rough pavement or topical applications of raised material, perpendicular to the direction of travel, that cause vibration and noise when driven over by the operator of a motor vehicle. This noise and vibration is intended to direct the motorist’s attention back to the roadway. FHWA-approved treatments include white- and black-painted stripes. Avoid conflicts with driveways. Typical spacing is 50 - 100 feet apart.
Typical Conditions
Speed: Generally appropriate for roadways with higher posted speed limits, such as transitions from freeways to lower class roadways.
Traffic & Volume: Generally appropriate for any traffic volumes and do not impair truck access, transit, or primary emergency response routes, not appropriate on bicycle routes.
Cost
Ranges between $0.10 to $0.60 per linear foot dependent on:
• Project length
• Availability and selection of materials
• Roadway surface
Advantages and Disadvantages
Advantages
• FHWA studies show 34% reduction in crashes on urban and suburban roads
• Relatively low cost
• Relatively quick installation
Disadvantages
• Not effective on roadways with lower posted speeds
• High noise levels generated by traffic
BMP: Traffic Calming Methods & Treatments
Description
A speed hump is an elongated mound in the roadway surface extending across the travel way at a right angle to the traffic flow. It uses vertical deflection to create motorist discomfort and thereby reduces speed. Burlington DPW offers two sizes of speed humps, 14 feet or 22 feet wide, the larger size being more appropriate for higher volume streets. Typical placement is midblock and spaced 300 - 500 feet apart. Avoid conflicts with driveways.
Typical Conditions
Speed: Generally not appropriate for roadways with a posted speed of 45 miles per hour or above.
Traffic & Volume: Not appropriate for truck access routes, transit routes, or primary emergency response routes; Appropriate for roads with grades below eight percent.
Variation: Speed Cushions can be used as a variation along primary emergency routes or transit routes.
Cost
Between $2,000 - $4,000 dependent on drainage design
Advantages and Disadvantages
Advantages
• Bicyclist safety is relatively unaffected
• Typical traffic volume reductions of 20% (series of humps)
• Crash rate reductions of approximately 40% are typical Disadvantages
• When applied as a single treatment, little to no traffic volume reduction or diversion should be expected
• Increased noise levels from vehicles impacting the hump
• Not appropriate for primary emergency vehicle routes or streets providing access to a hospital or emergency medical services
• Not appropriate for transit routes or primary access routes for industrial or commercial sites
• Adequate stopping sight distance or warning signs provided
• Snow plow damage to speed hump