Lake Calumet Bicycle Network Study - State of Biking Report
Vision Statement
To weave the bicycle network, especially low stress facilities, through the Lake Calumet area to better connect people with destinations and recreational opportunities.
A means to improve bicycle safety and to reconnect neighborhoods separated by industrial uses, highways, and rail yards to improve mobility and access.
To connect the Lake Calumet area bicycle network to the rest of Cook County and the region in alignment with the County Bicycle Plan.
Advancing County Wide Efforts
The Lake Calumet Bicycle Network Study leverages the momentum of the Cook County Bicycle Plan*, which identified critical needs and opportunities to improve existing and future bicycle infrastructure within Cook County. This effort also coordinates with ongoing fundraising, planning, design, and construction activities around Lake Calumet to reinforce active transportation programs and infrastructure.
This study focuses on communities in southern Cook County, with emphasis on opportunities to improve active transportation options in historically underserved and under-resourced communities. This effort evaluates the existing infrastructure and identifies opportunities to create a more connected bicycleway network through enhancements to existing and future (planned) onand off-street facilities.
To overcome physical barriers to walking and cycling, this study focuses on a series of recommendations that include: the potential for additional bicycle lanes, off-street trails, and shared streets. These recommendations are intended to create a complete bicycle network that promotes safe, comfortable, accessible, connected, and equitable biking opportunities to major community destinations.
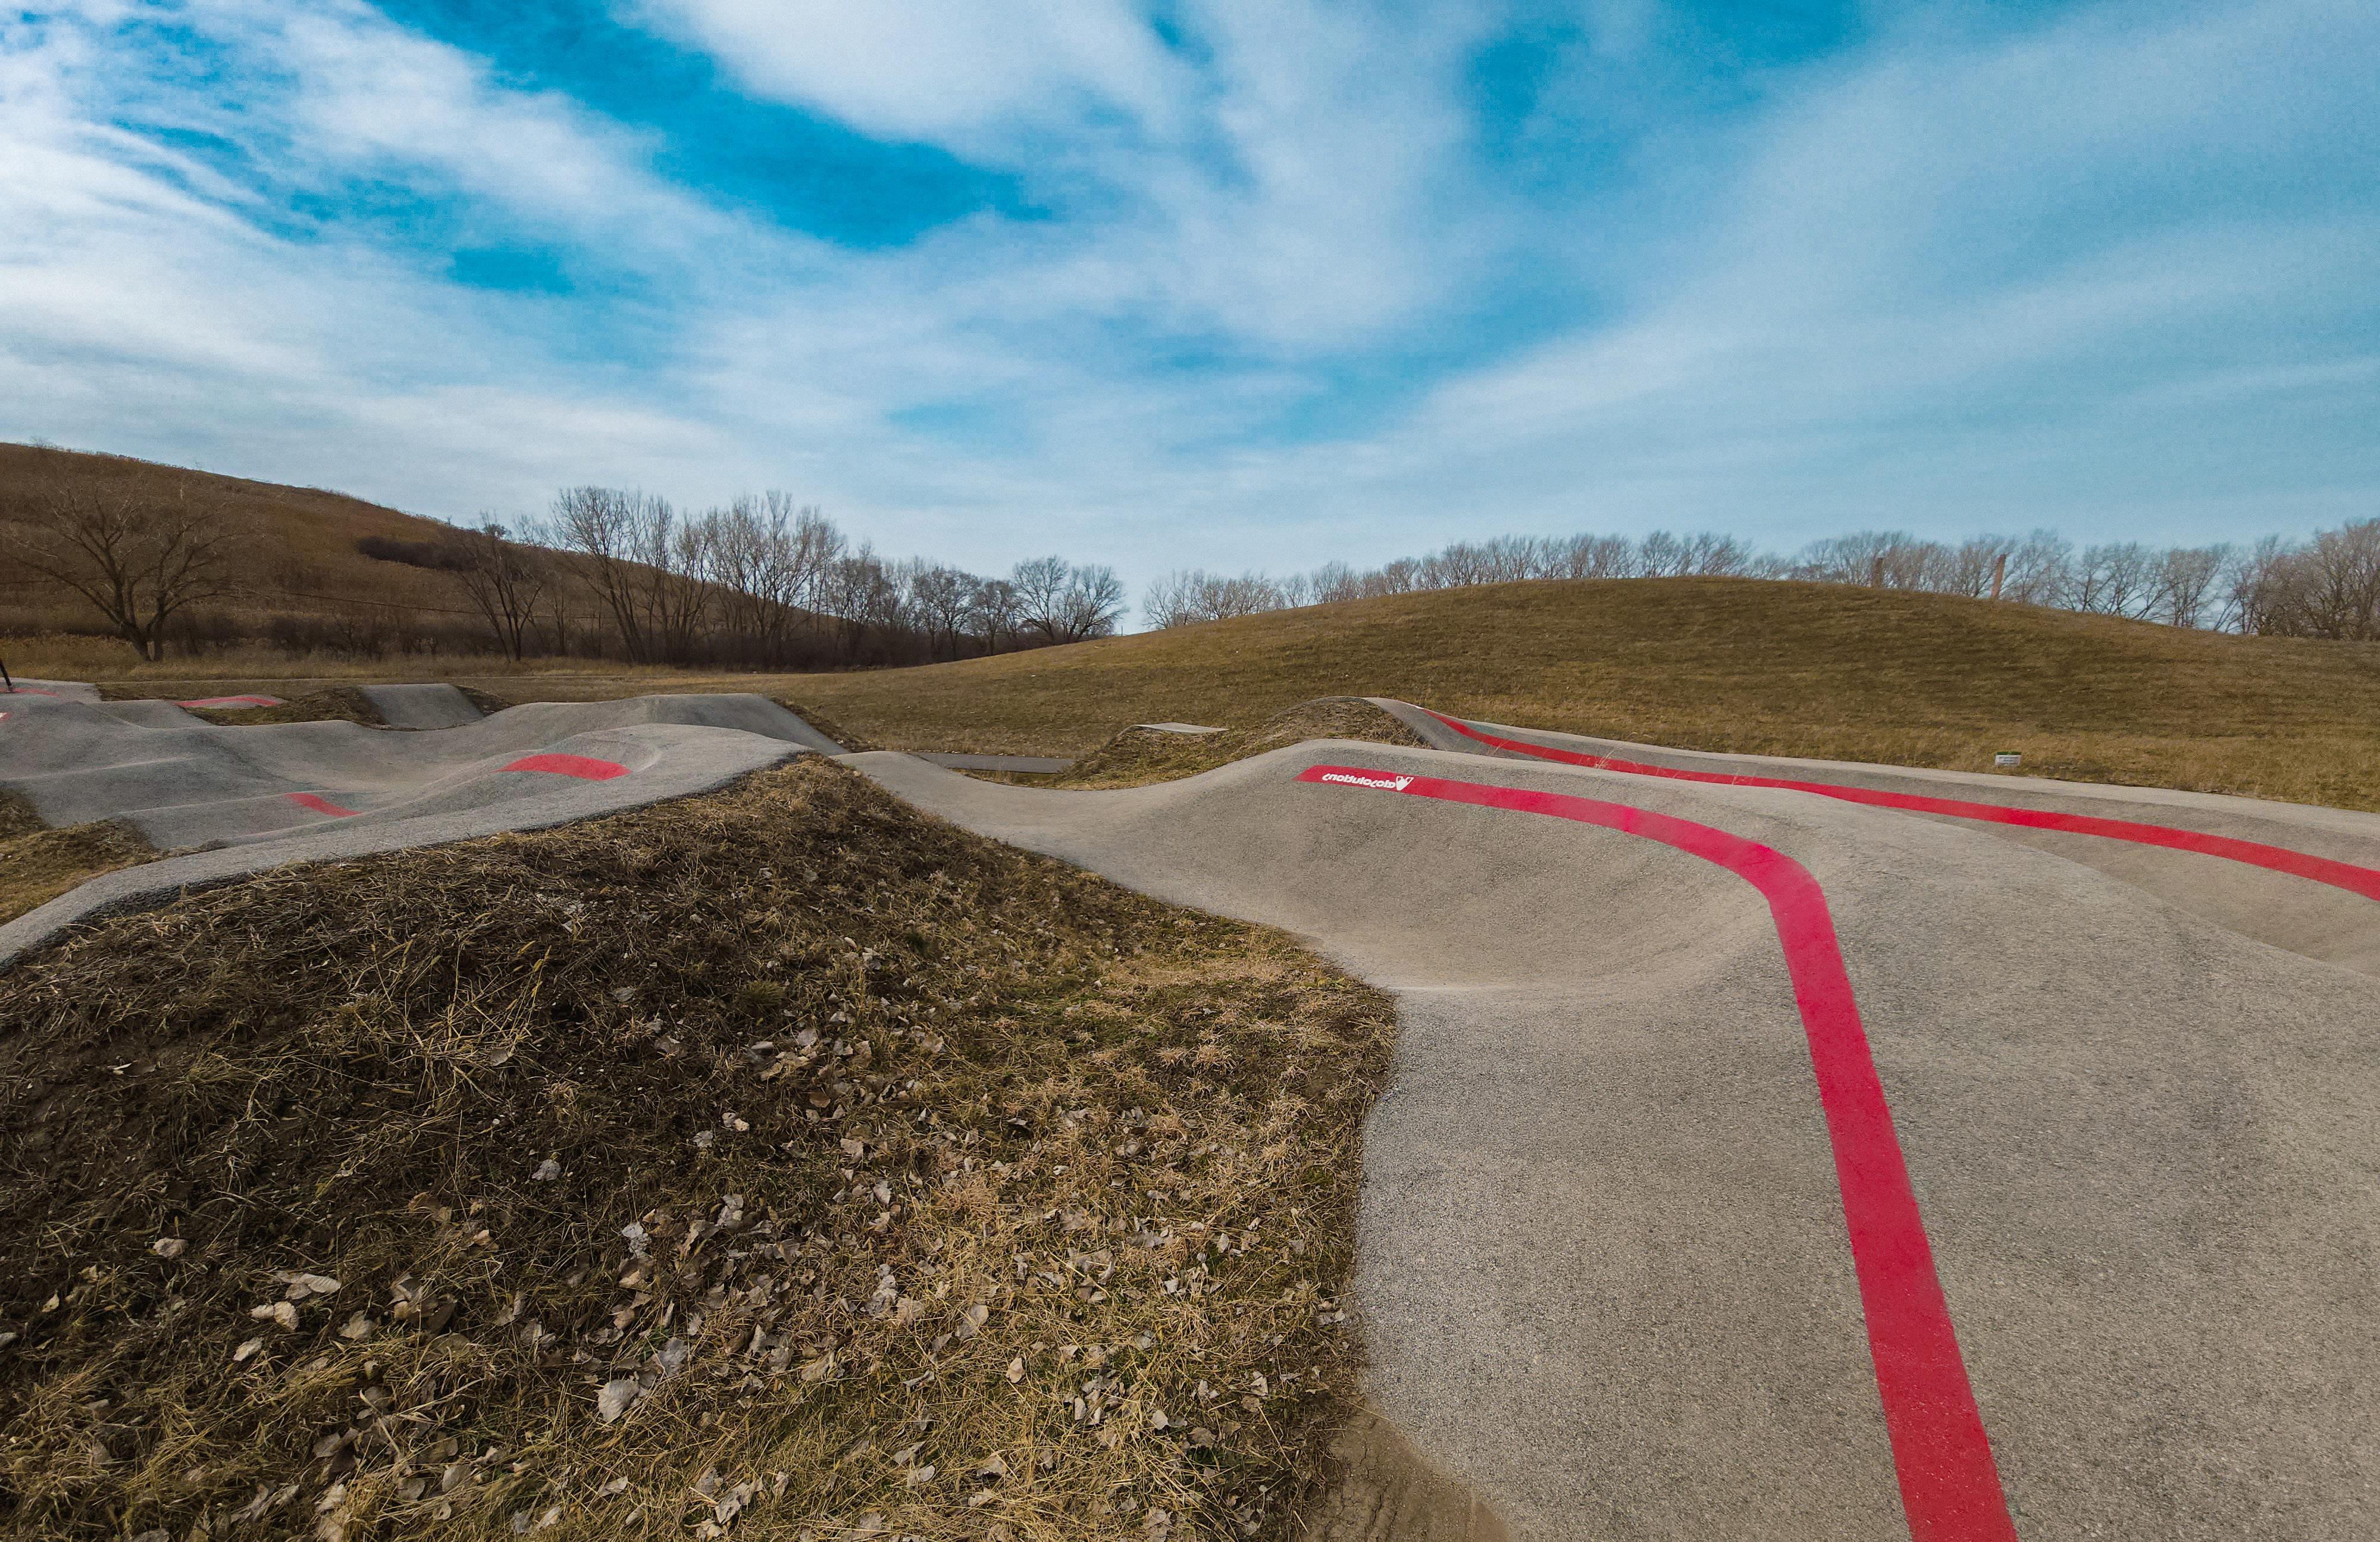
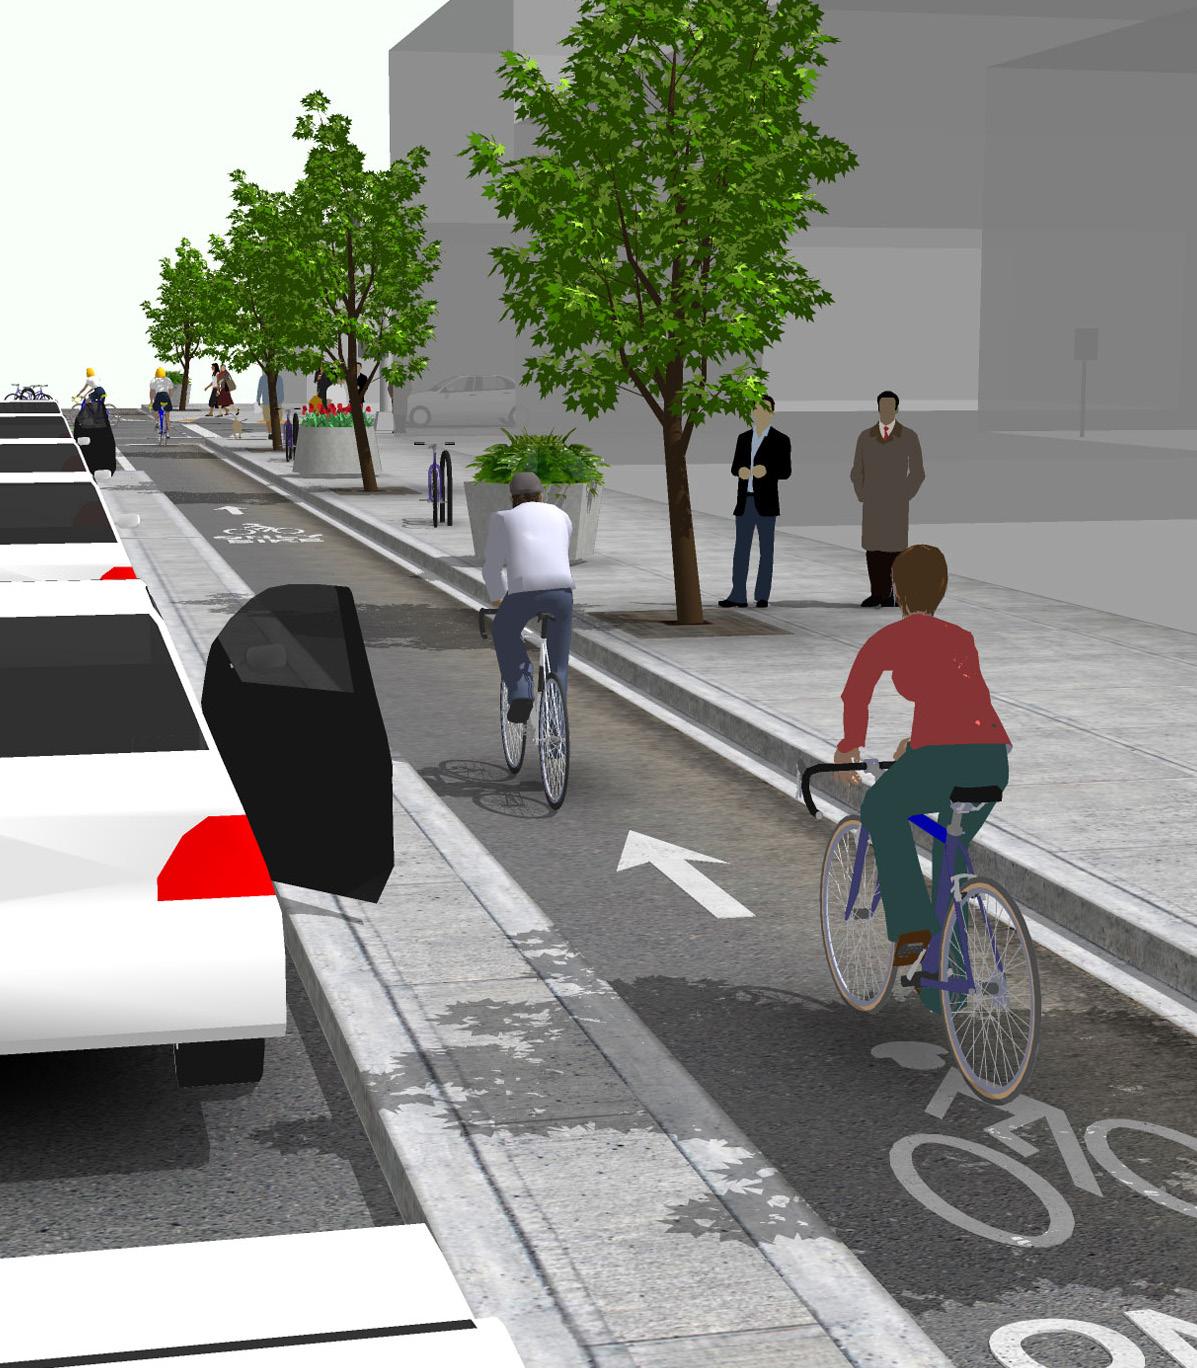
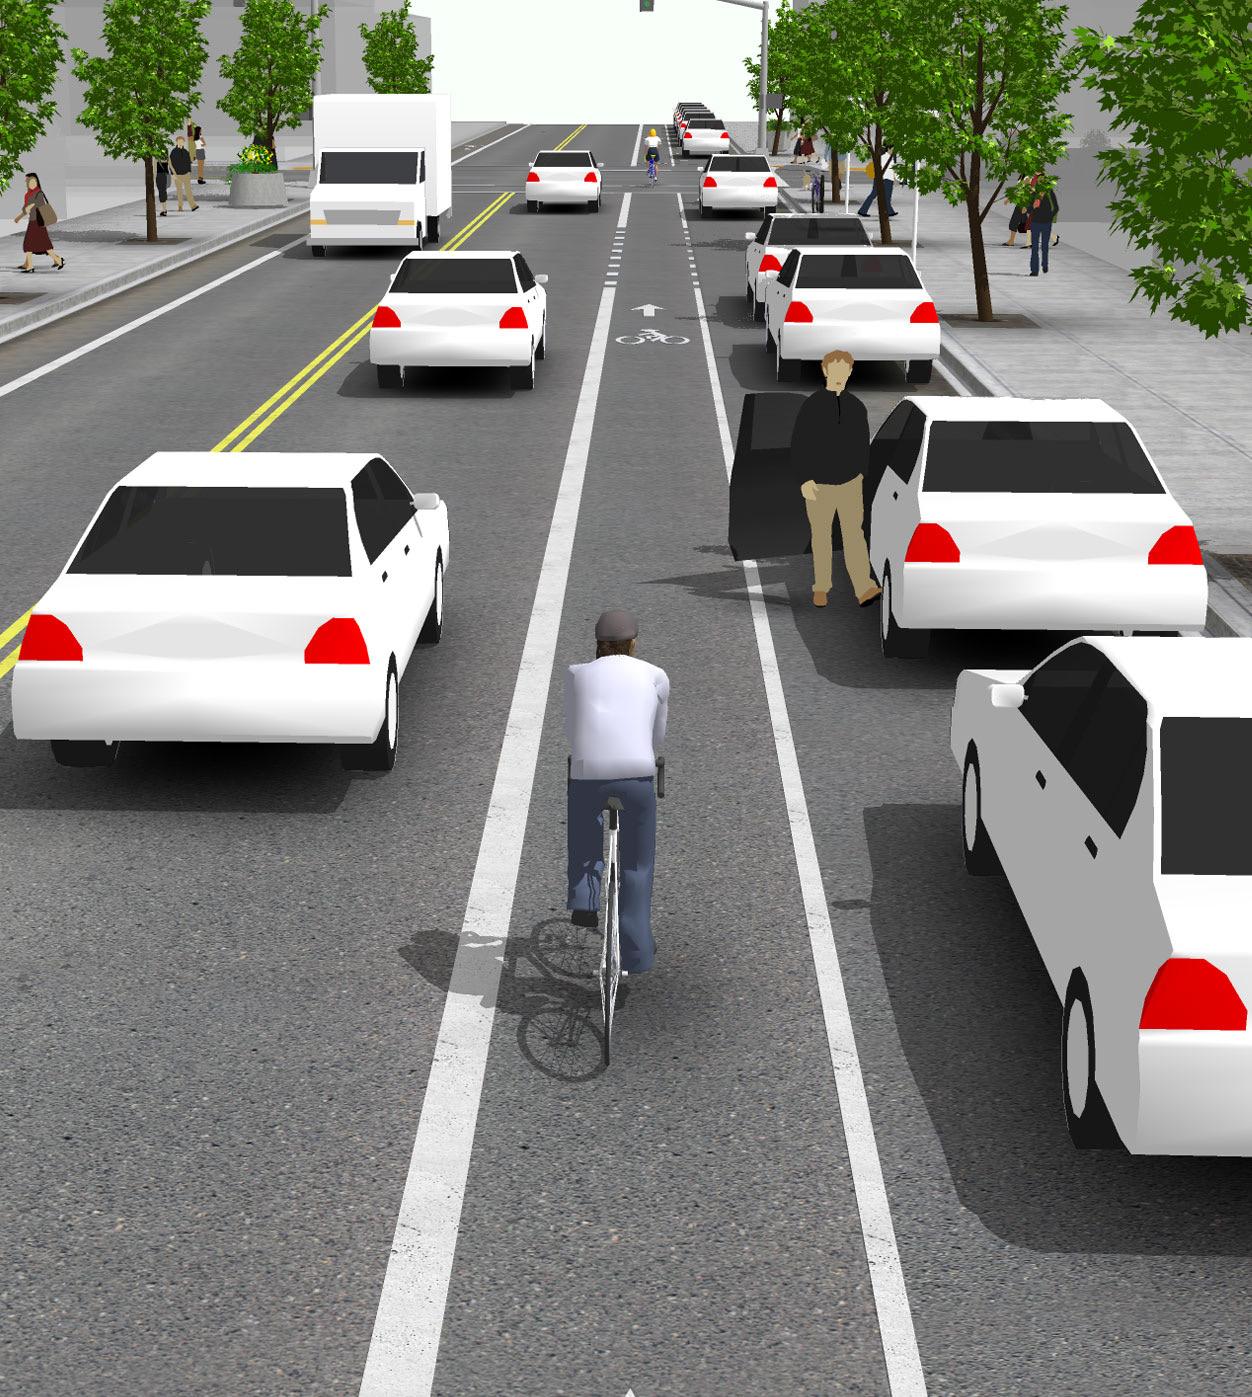
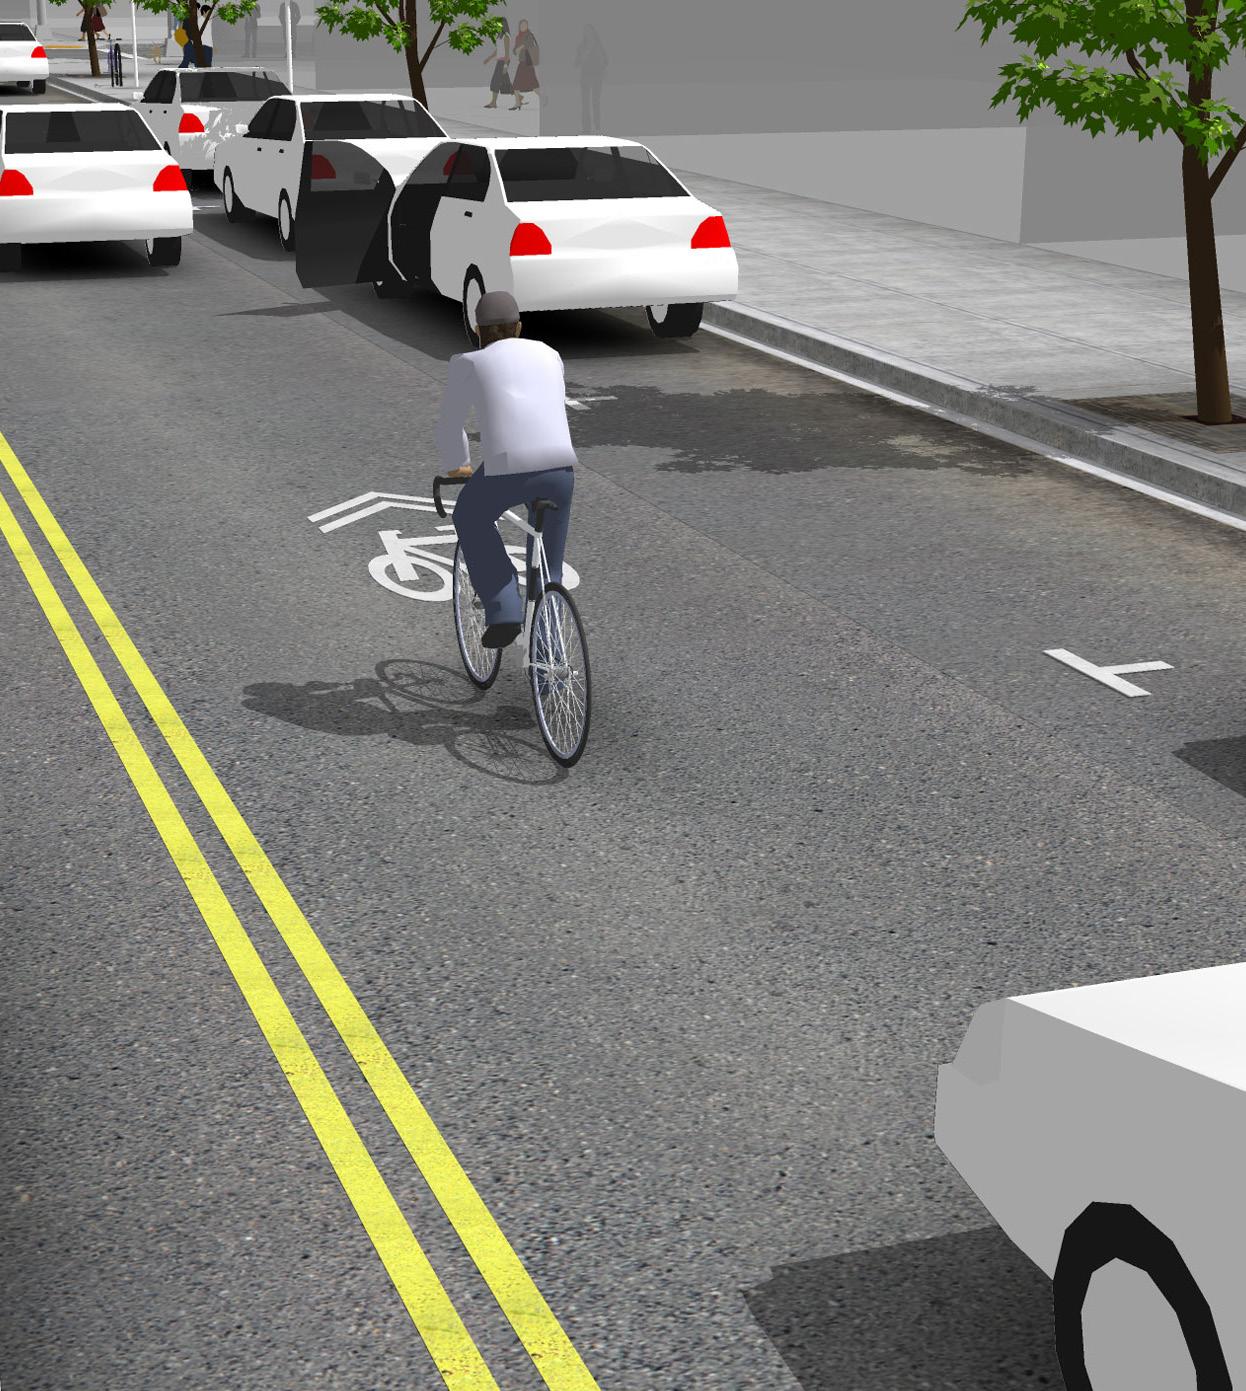
The study emphasizes the need for more “lowstress” bicycleways throughout the study area. Separation from traffic, intersection crossings, speed of traffic, and width of the bicycle lanes, play an important role in the bicycle rider’s experience.
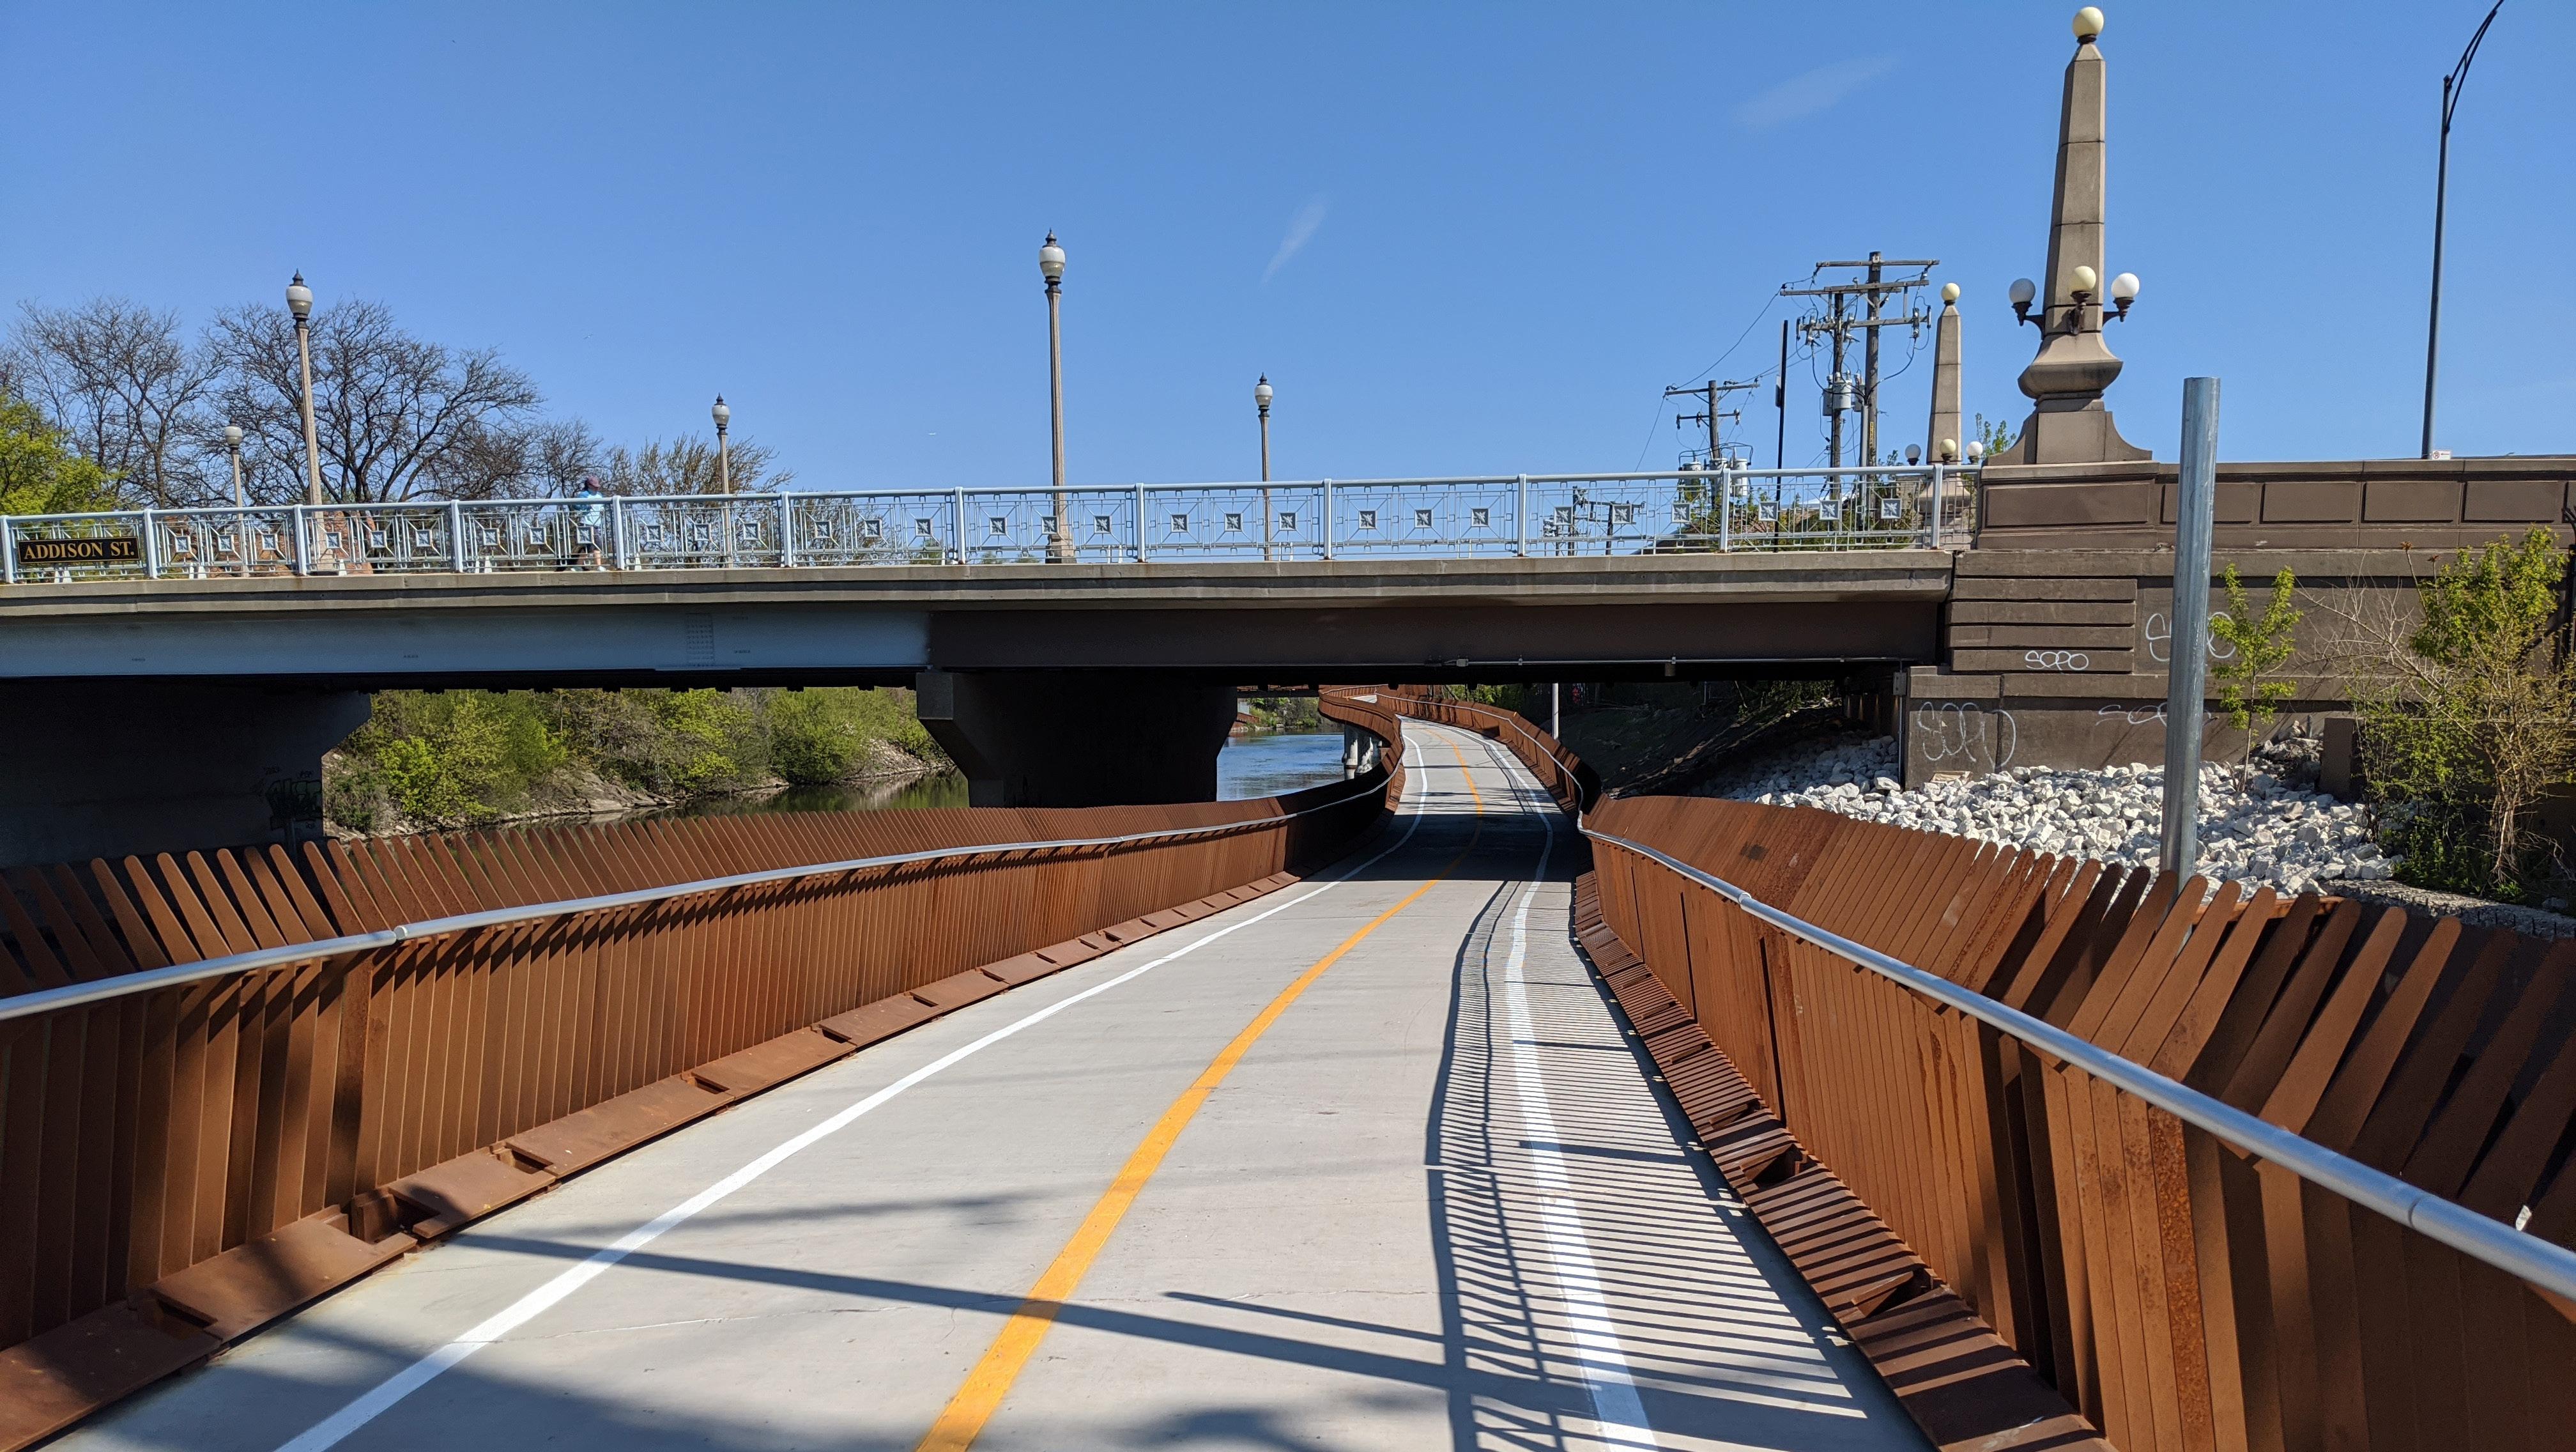
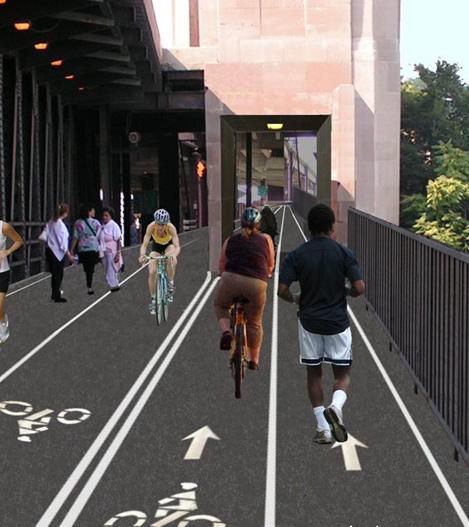
What are “Low-Stress” Bicycle Facilities?
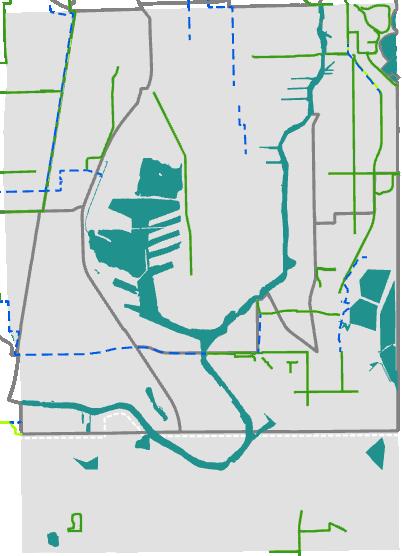
Connections in and around Lake Calumet are proposed to allow cyclists to travel safely between the communities which surround Lake Calumet and enable access to existing and planned regional bicycle trails. These recommendation are also intended to connect with other neighborhoods beyond the study area.
The study prioritizes various street improvements based on ease of construction, consistency with other planning efforts, and availability of funds. The report proposes an overall build-out of the complete low-stress bicycle network over the next 10 to 15 years.
*For more information about the Cook County Bicycle Plan please visit: https://www.cookcountyil.gov/sites/g/ files/ywwepo161/files/documents/2023-04/Cook%20 County%20Bike%20Plan%202023%20Final.pdf
Graphic Source: National Association of City Transportation Officials (NACTO)
Bikeway Visual Separation (Bike Lane)
for Most Users
for Most Users
Low Stress High Stress
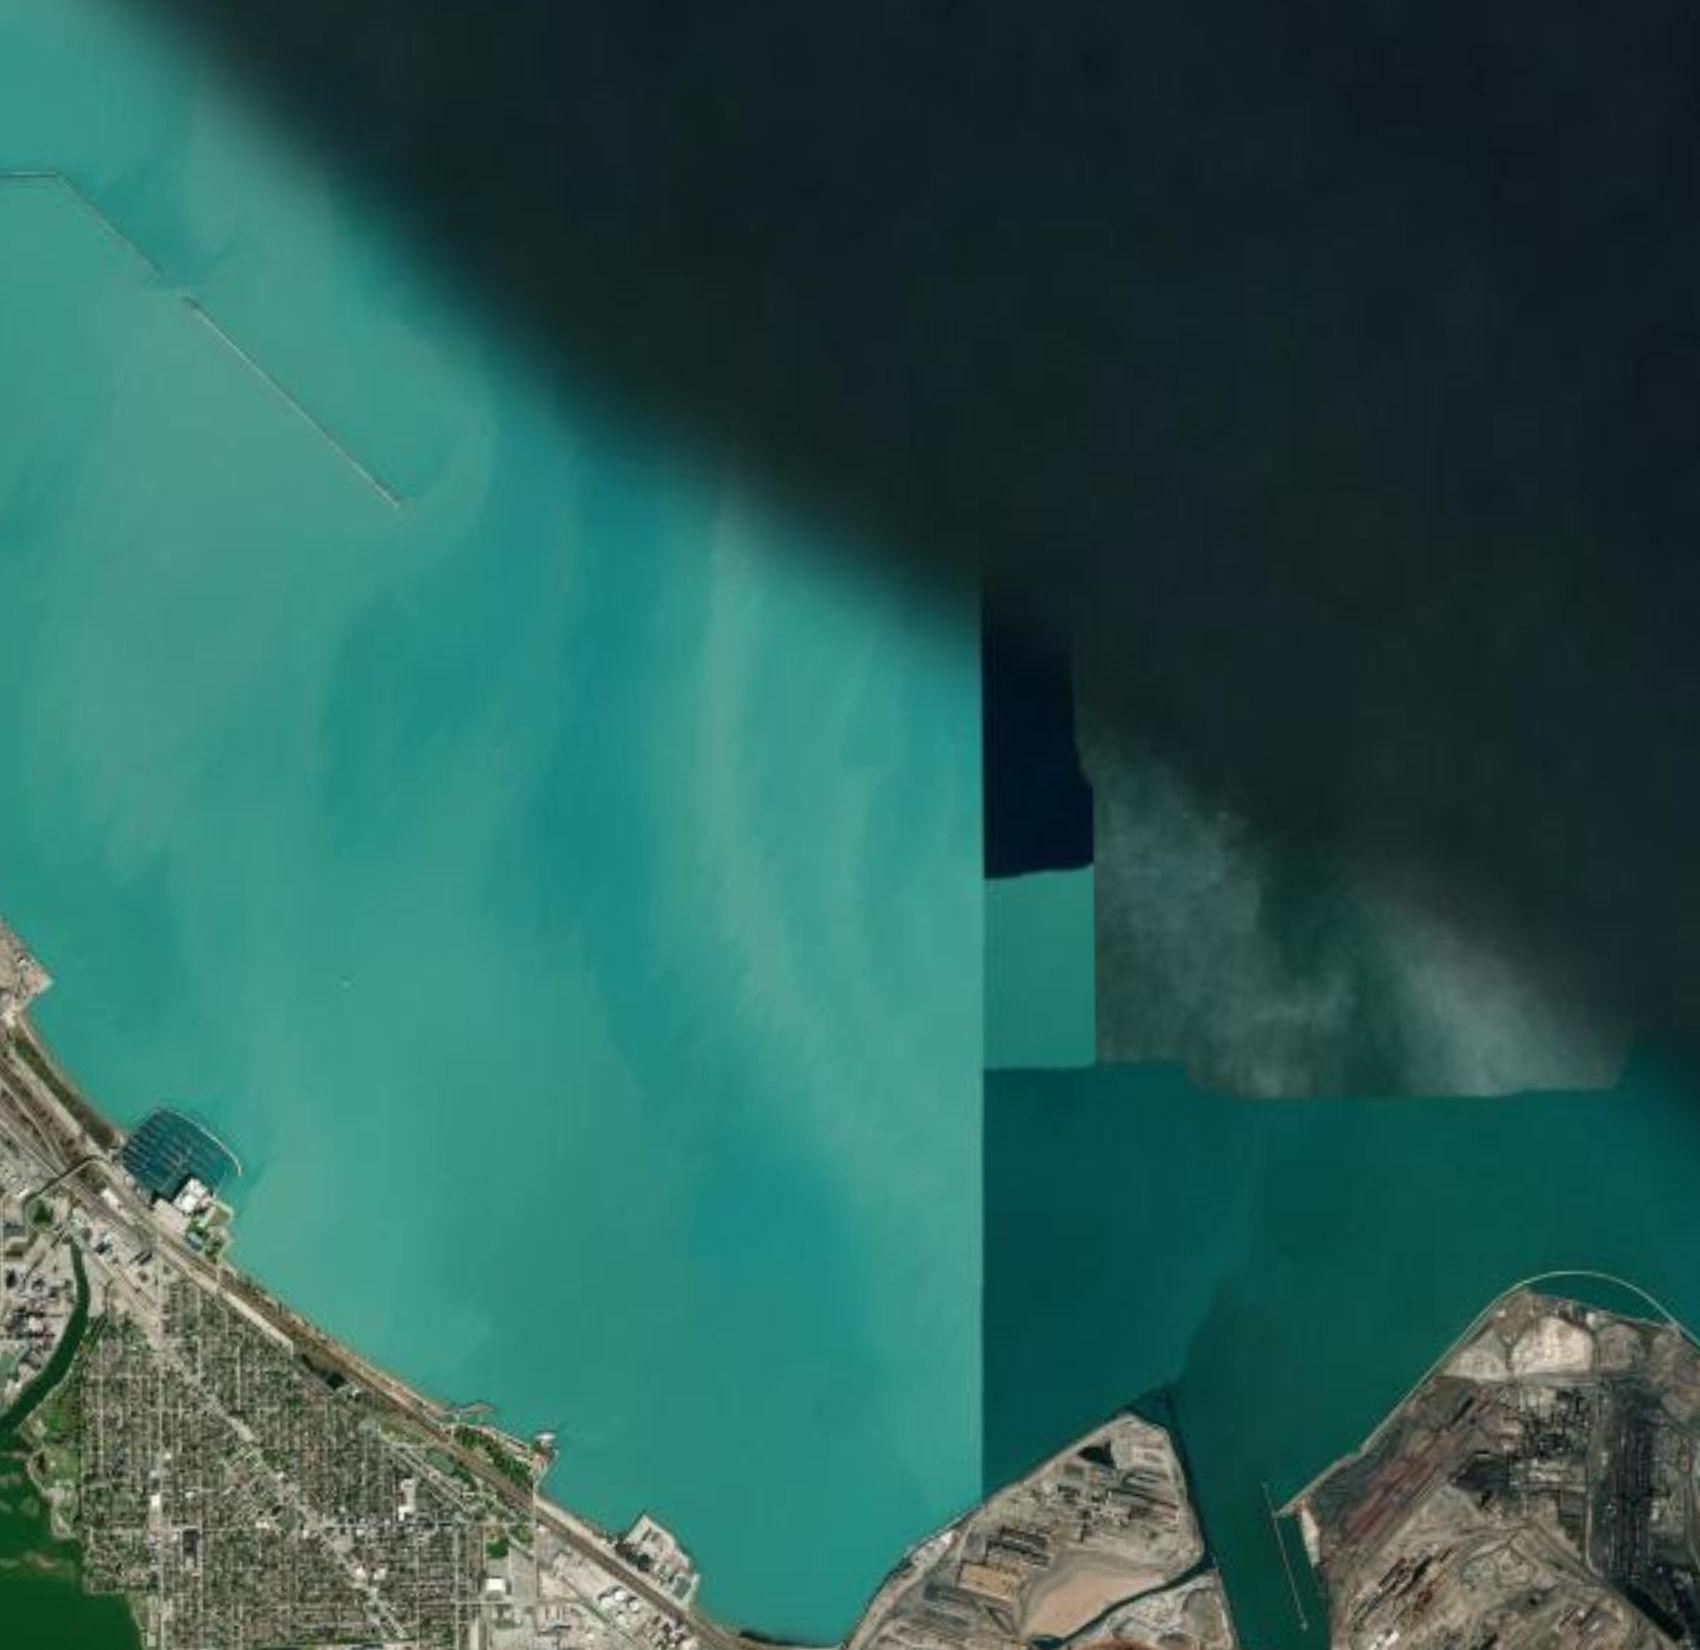
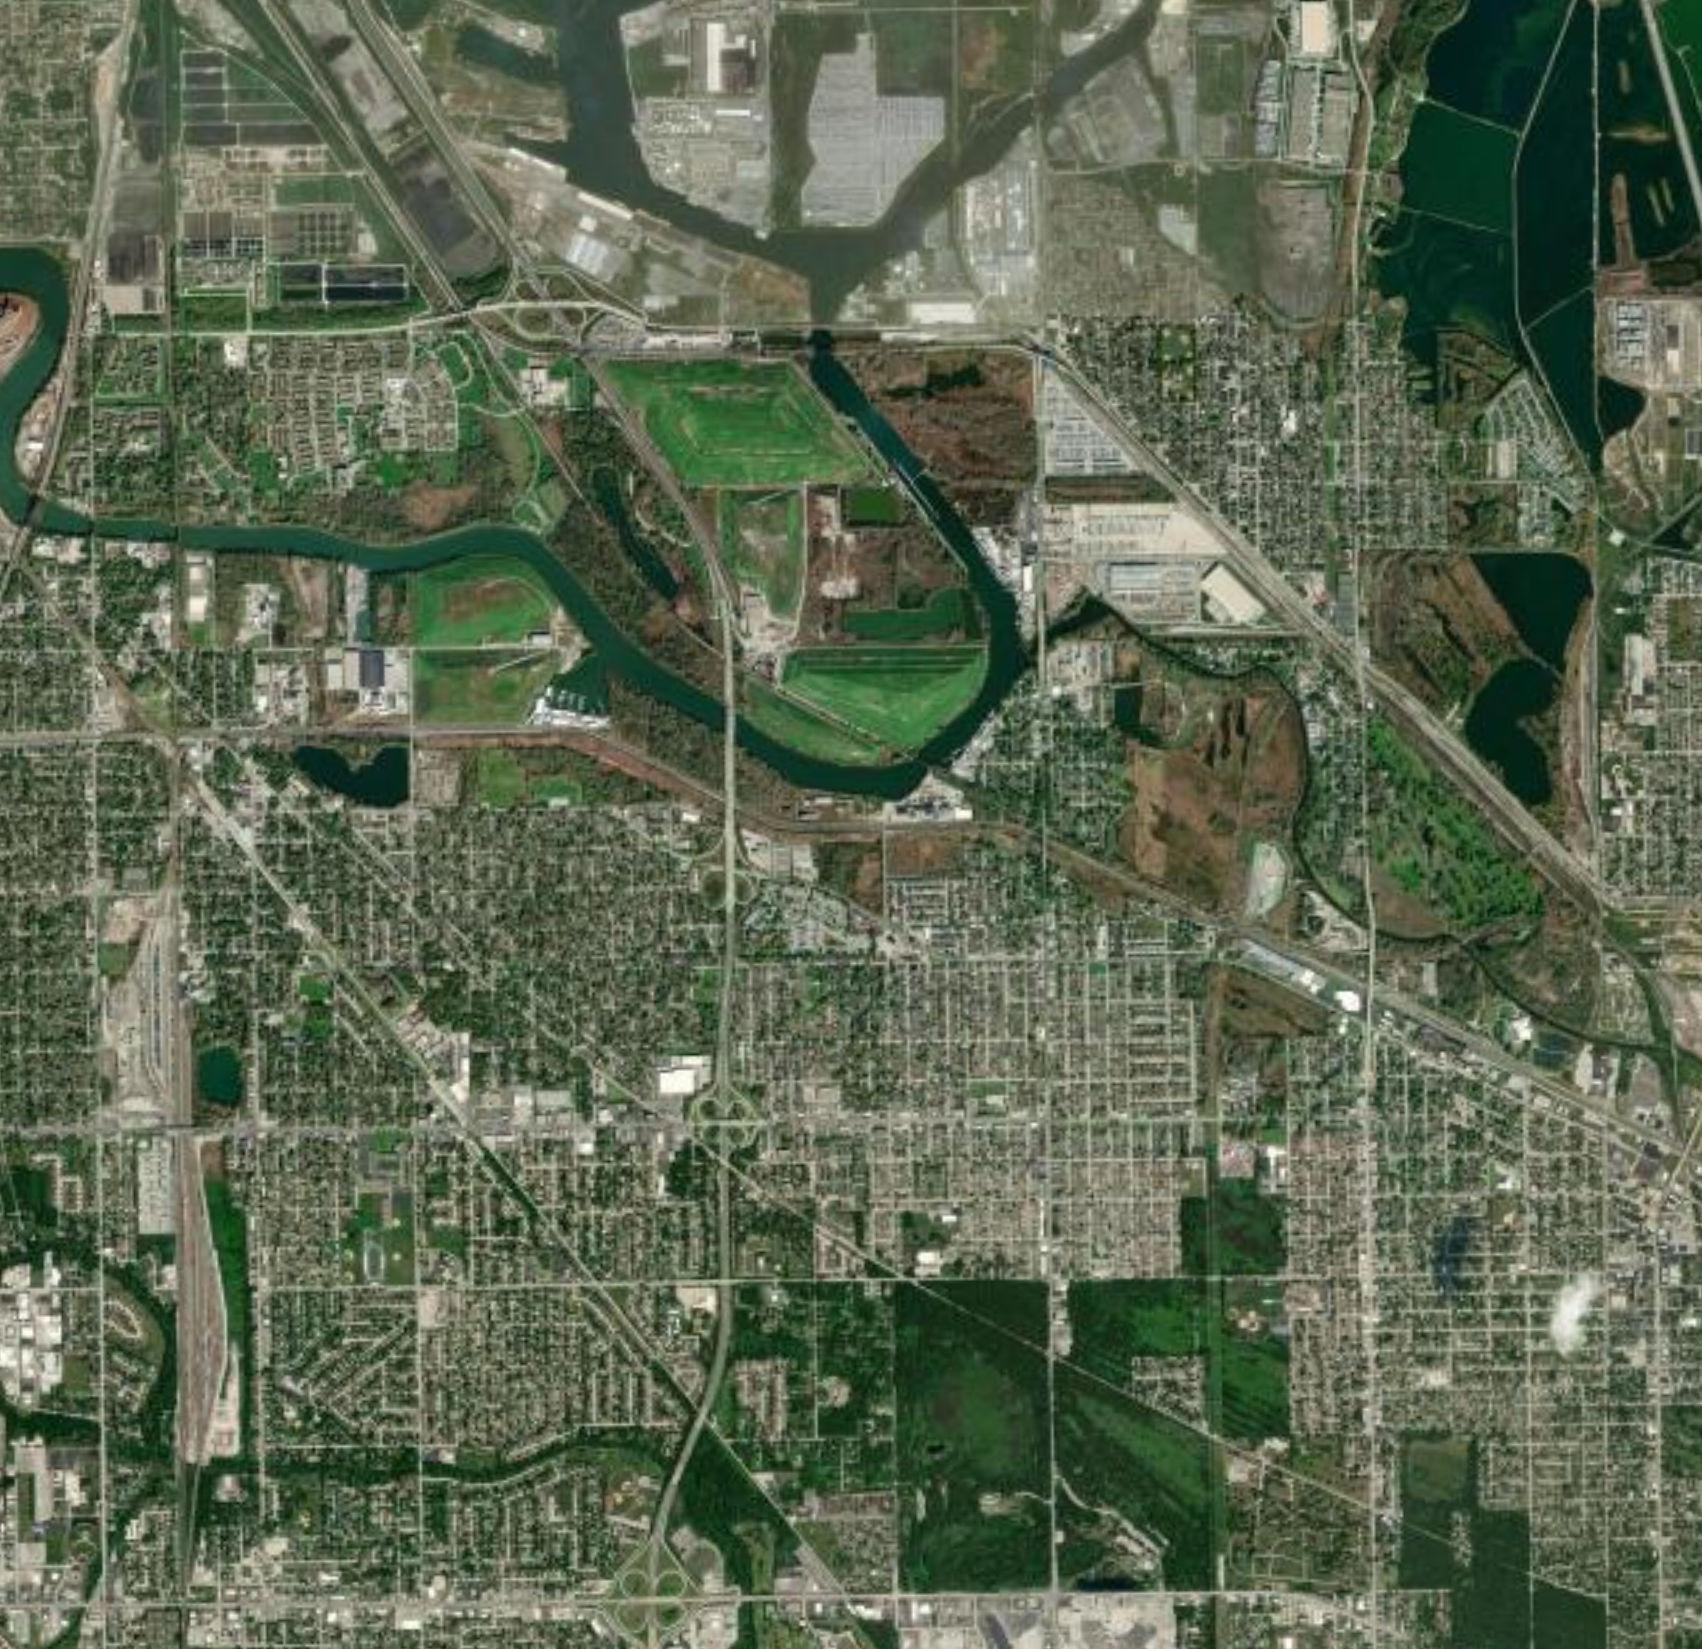
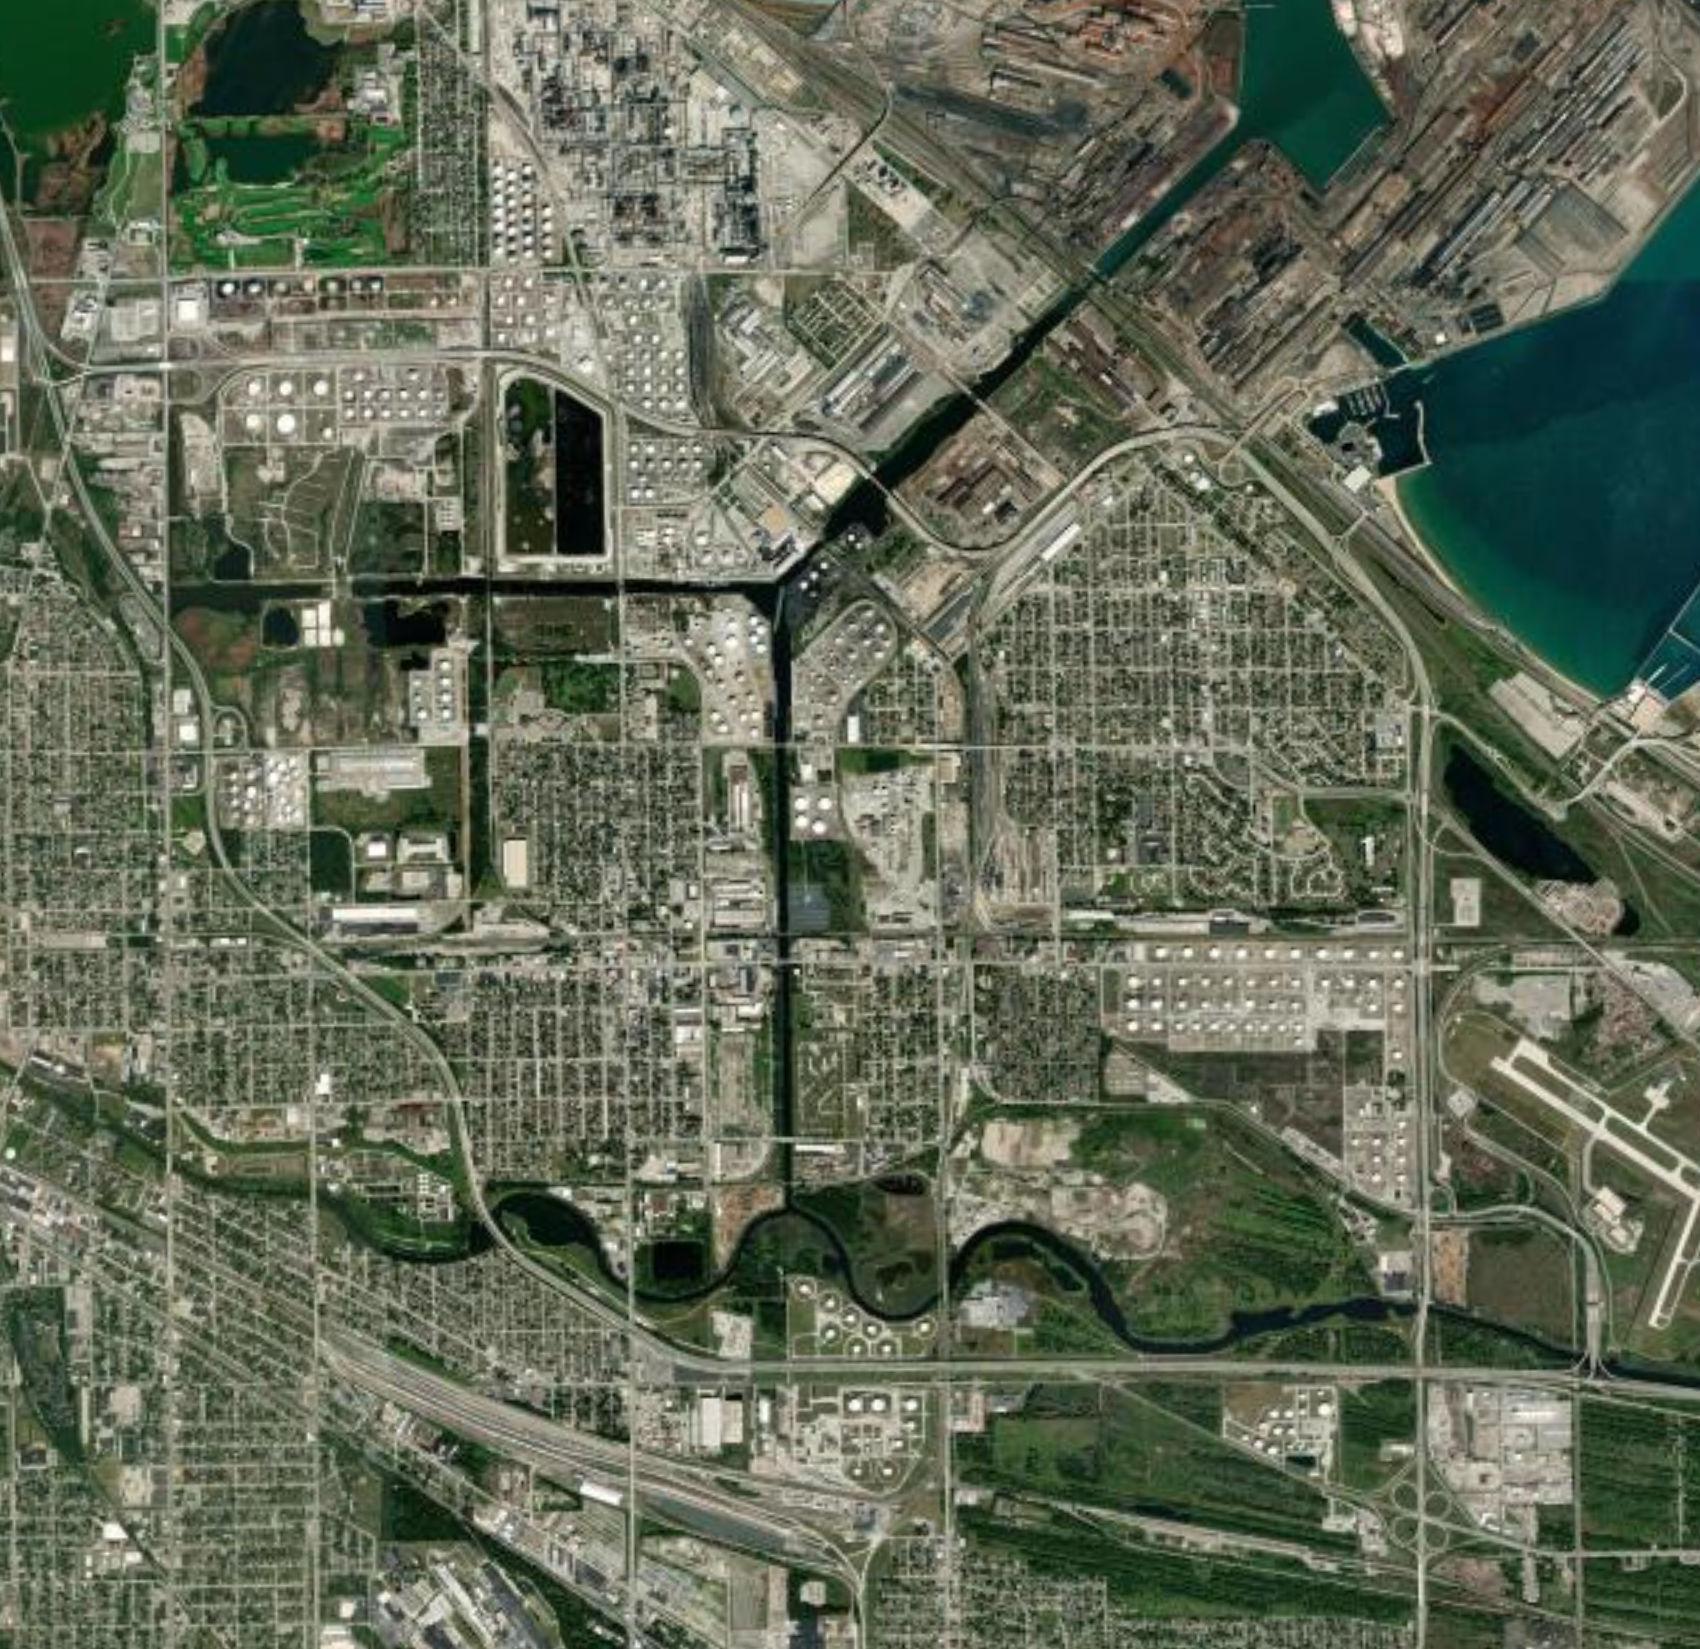
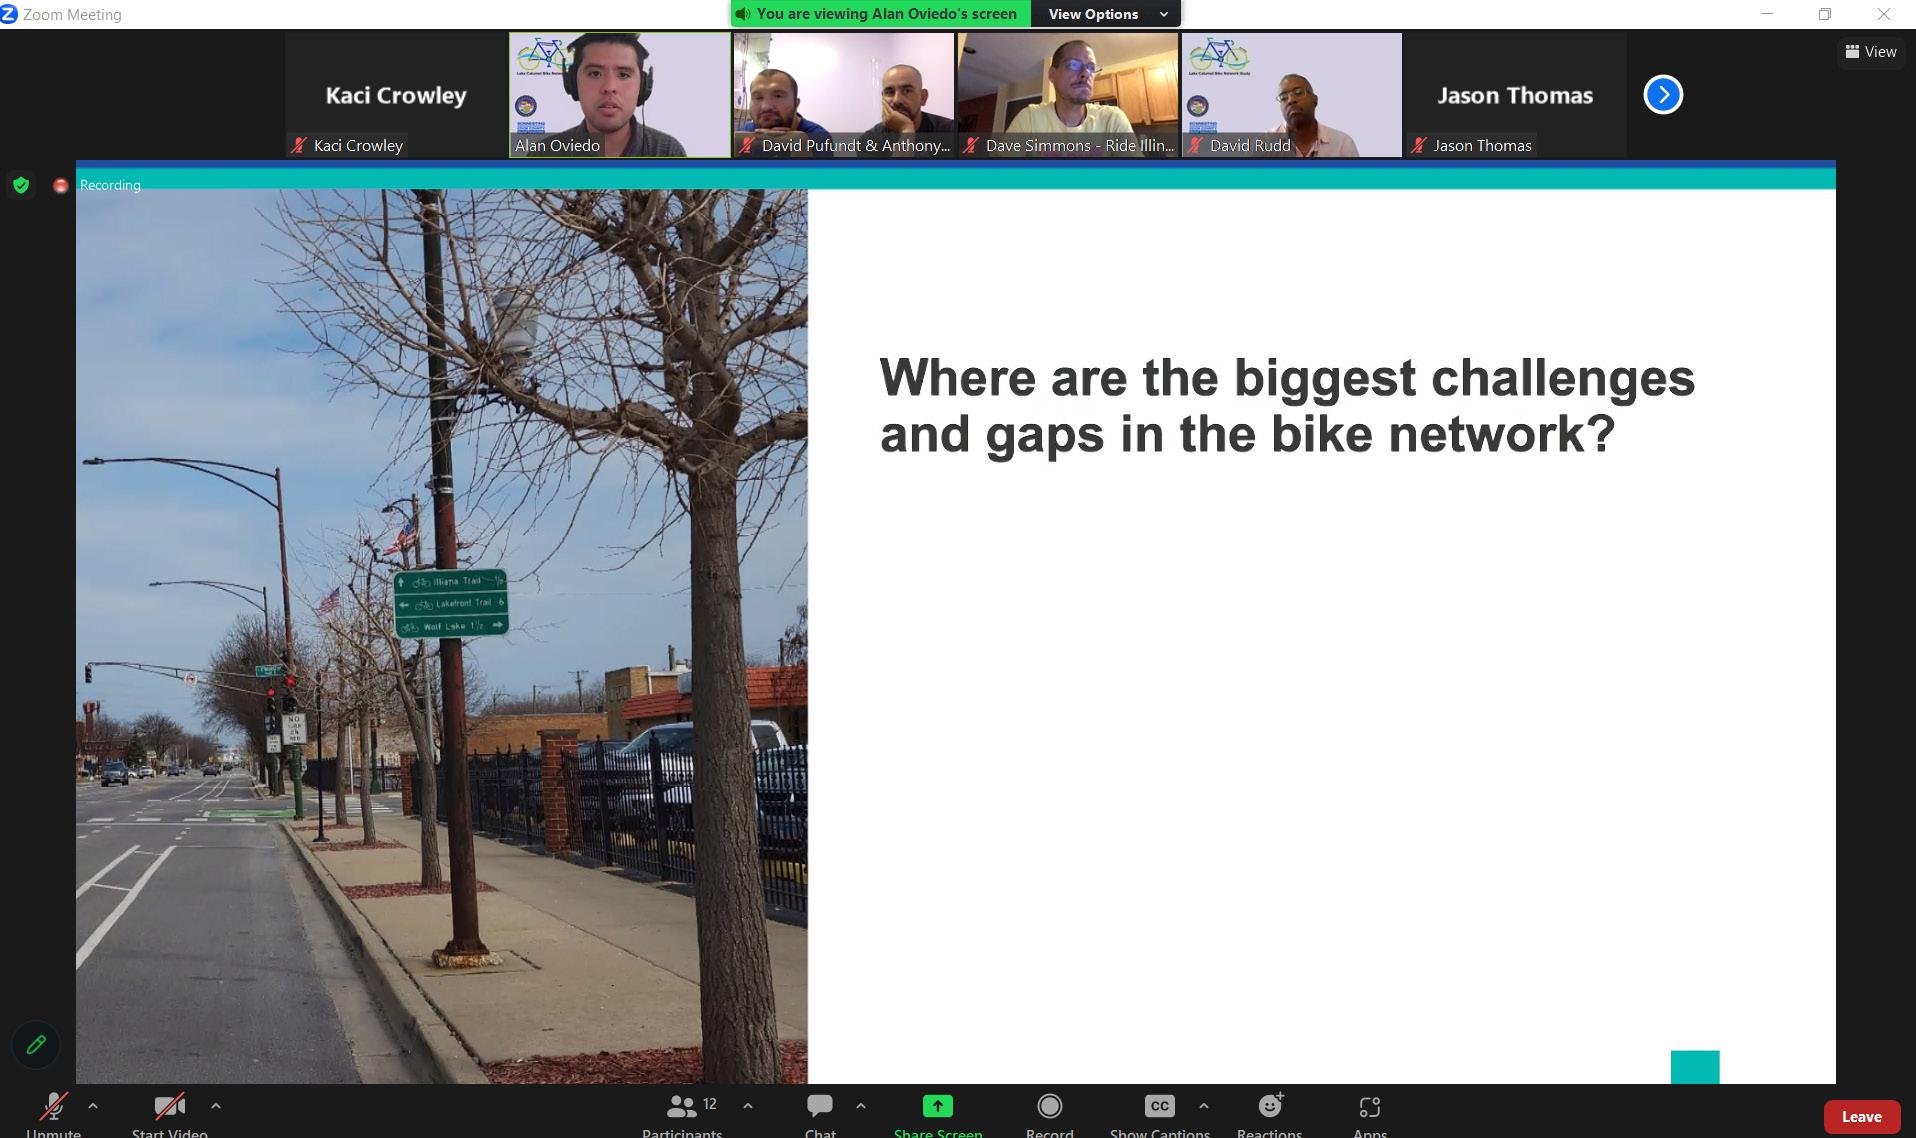
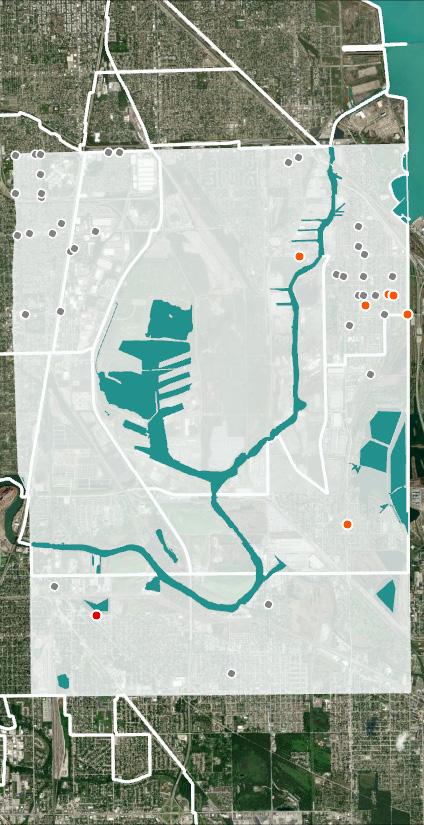
What are the Challenges?
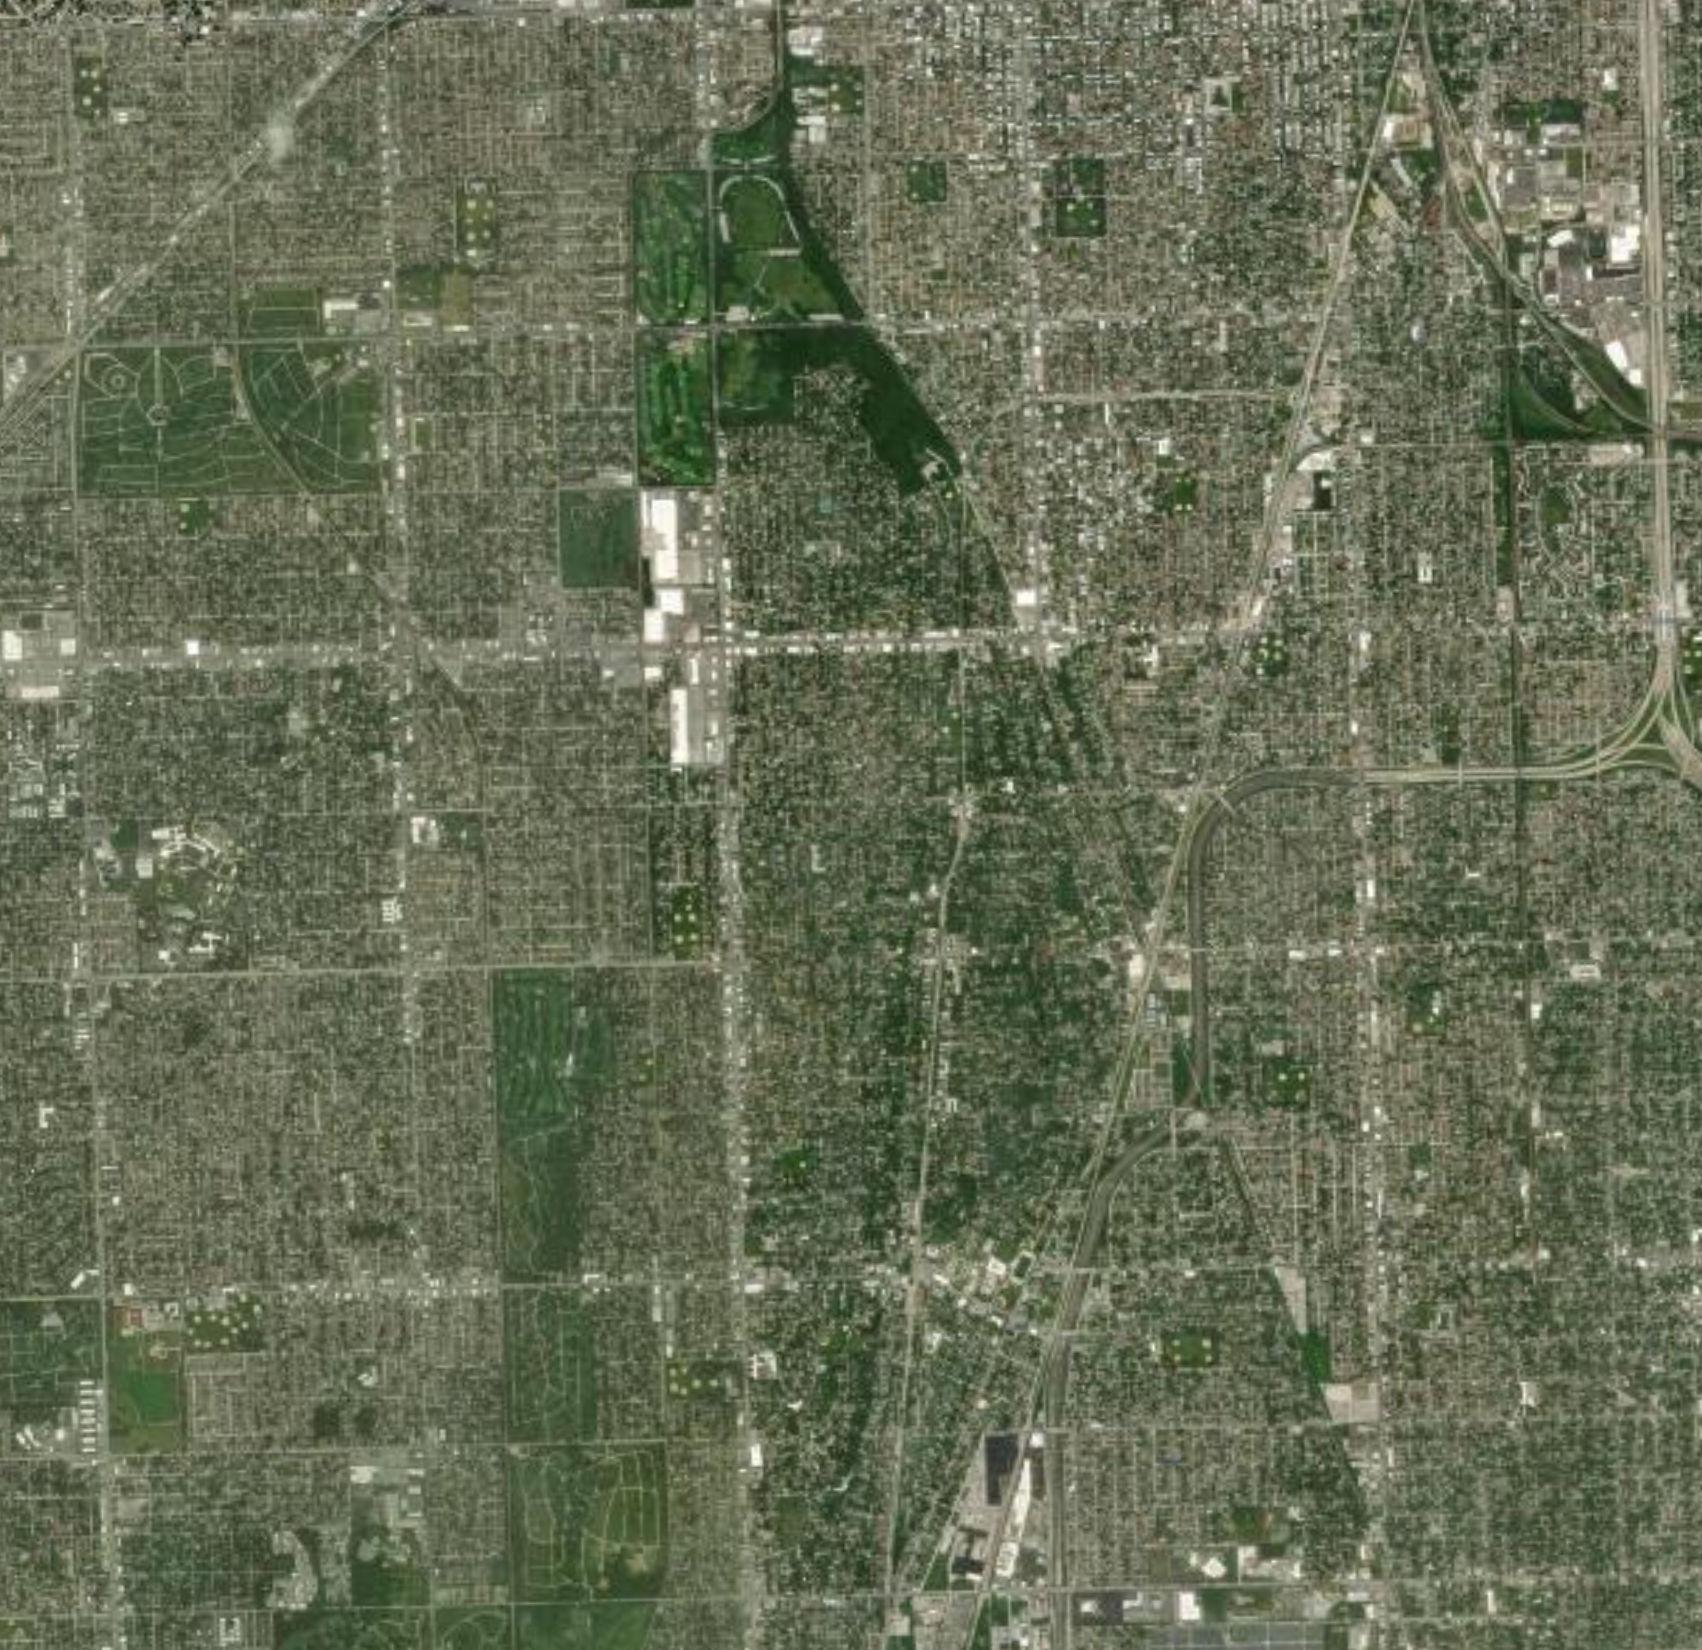
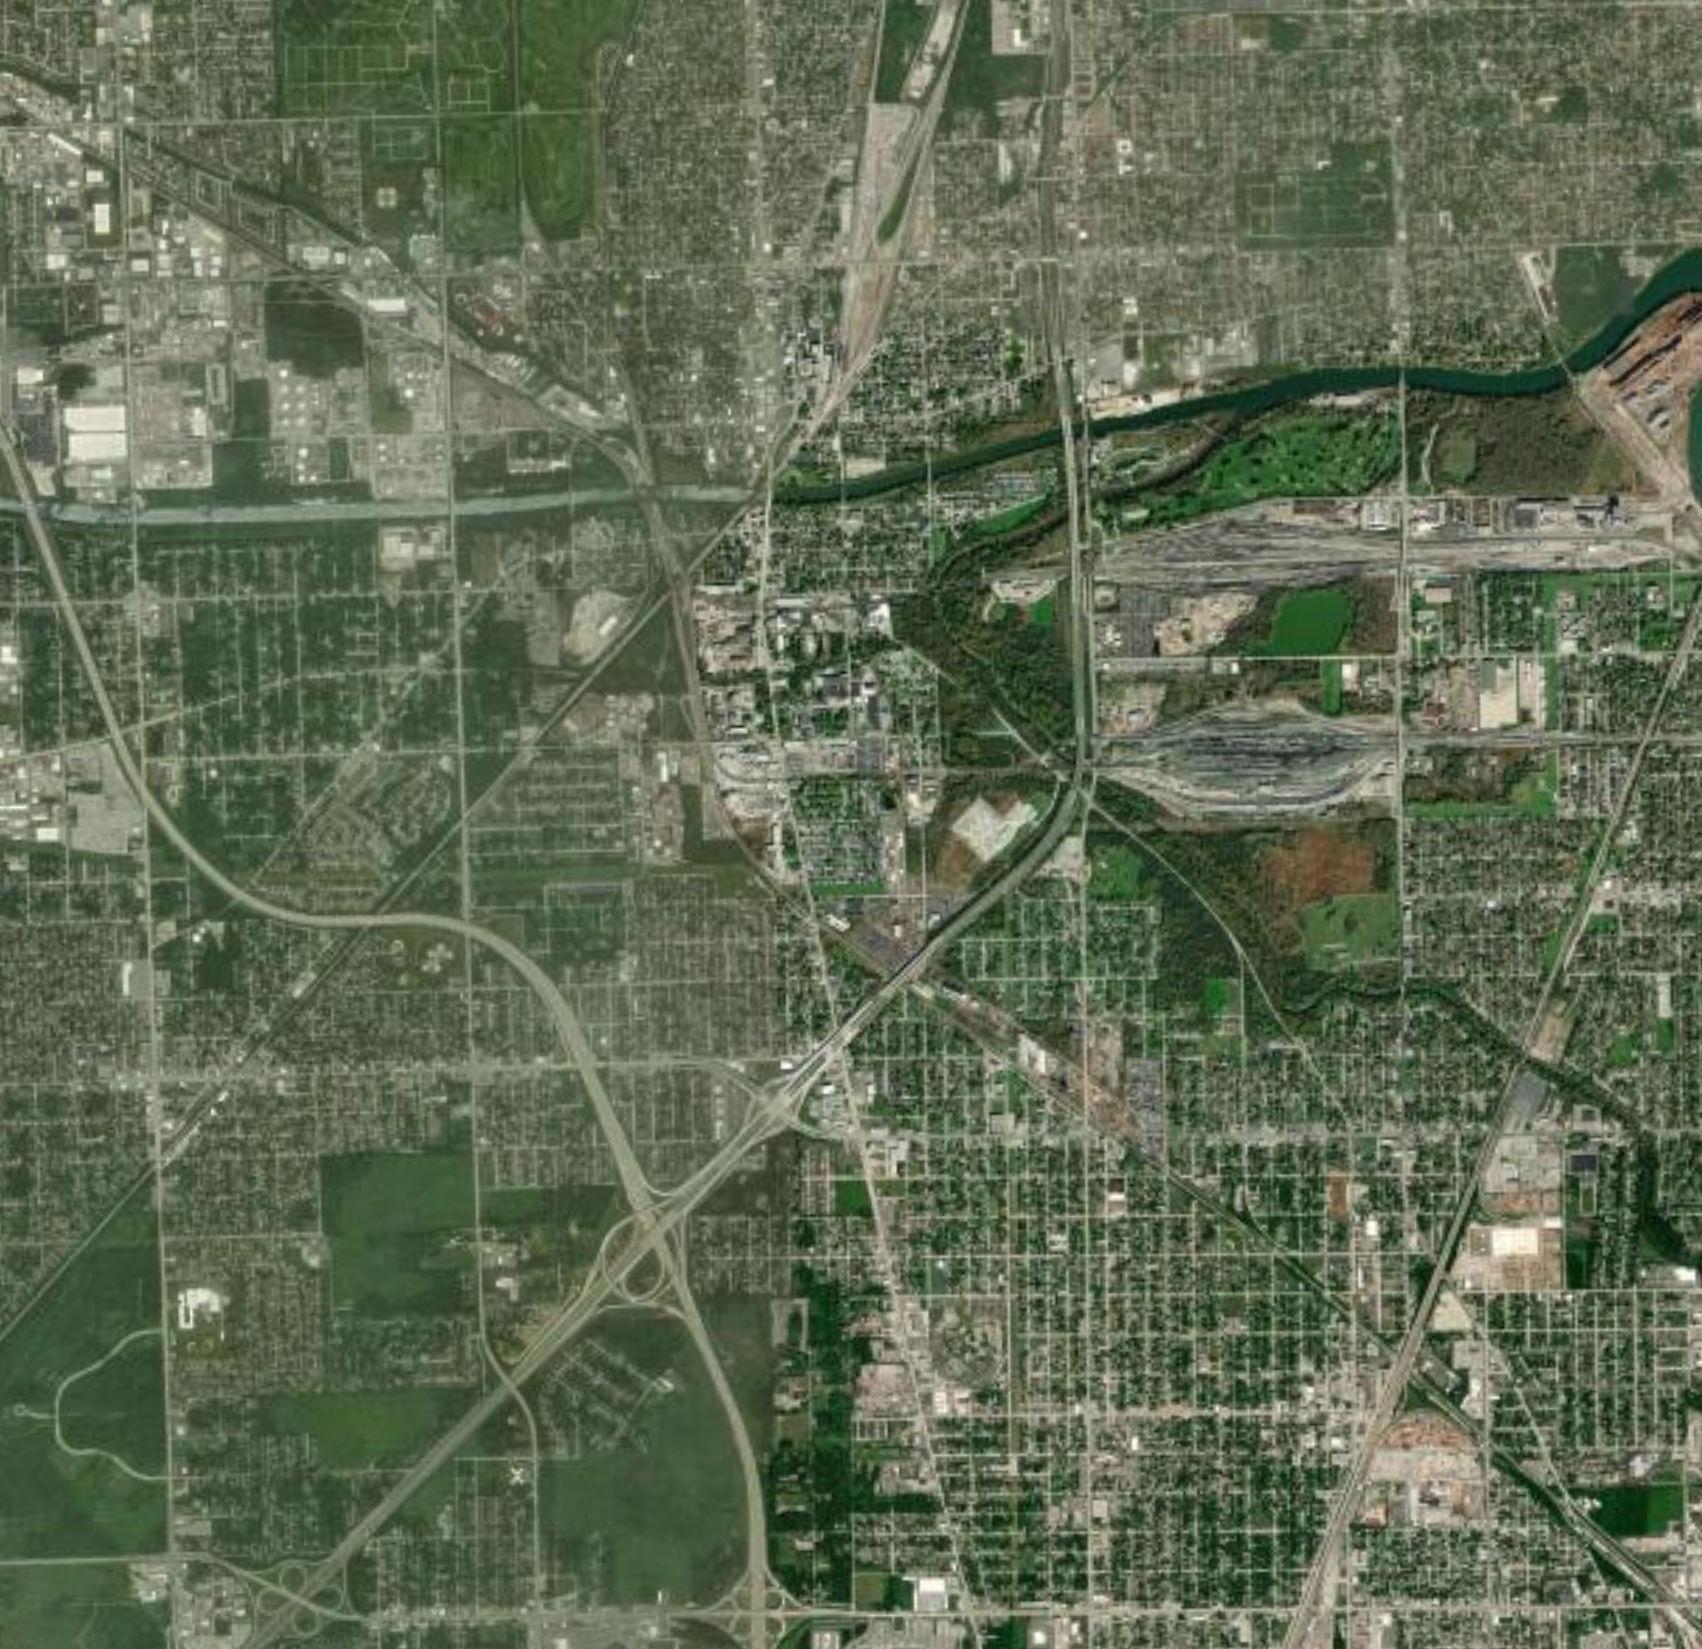
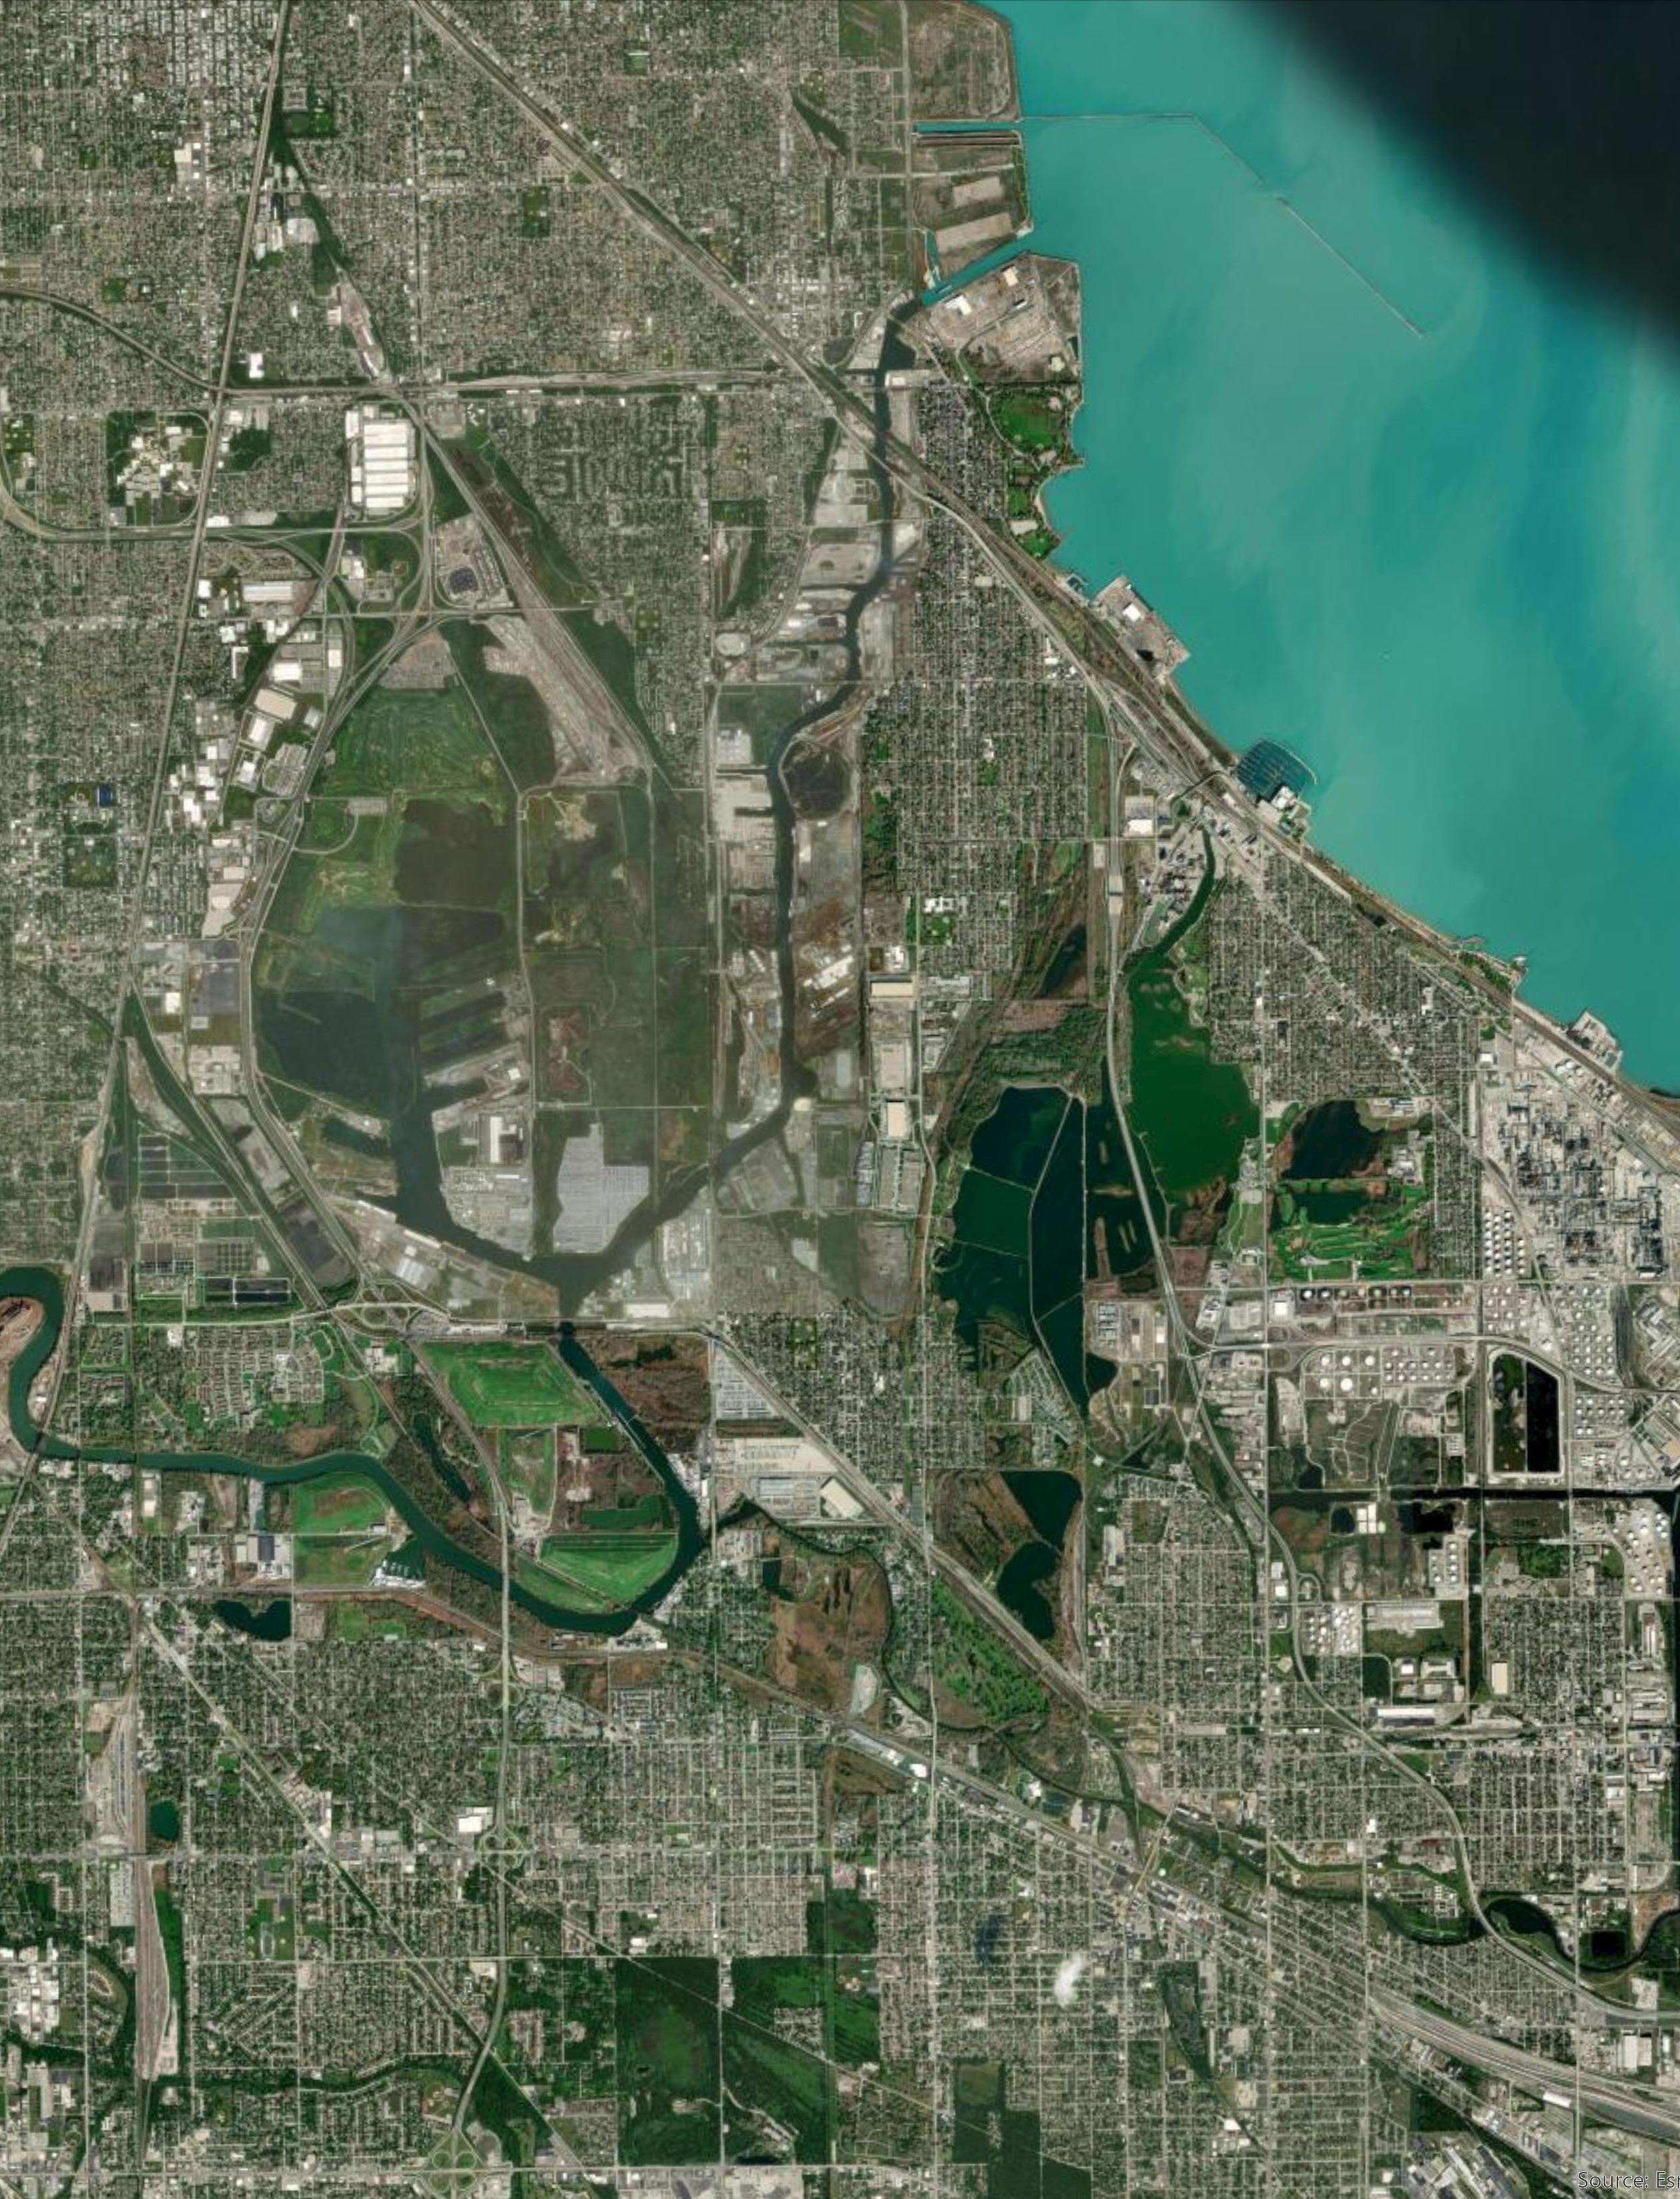
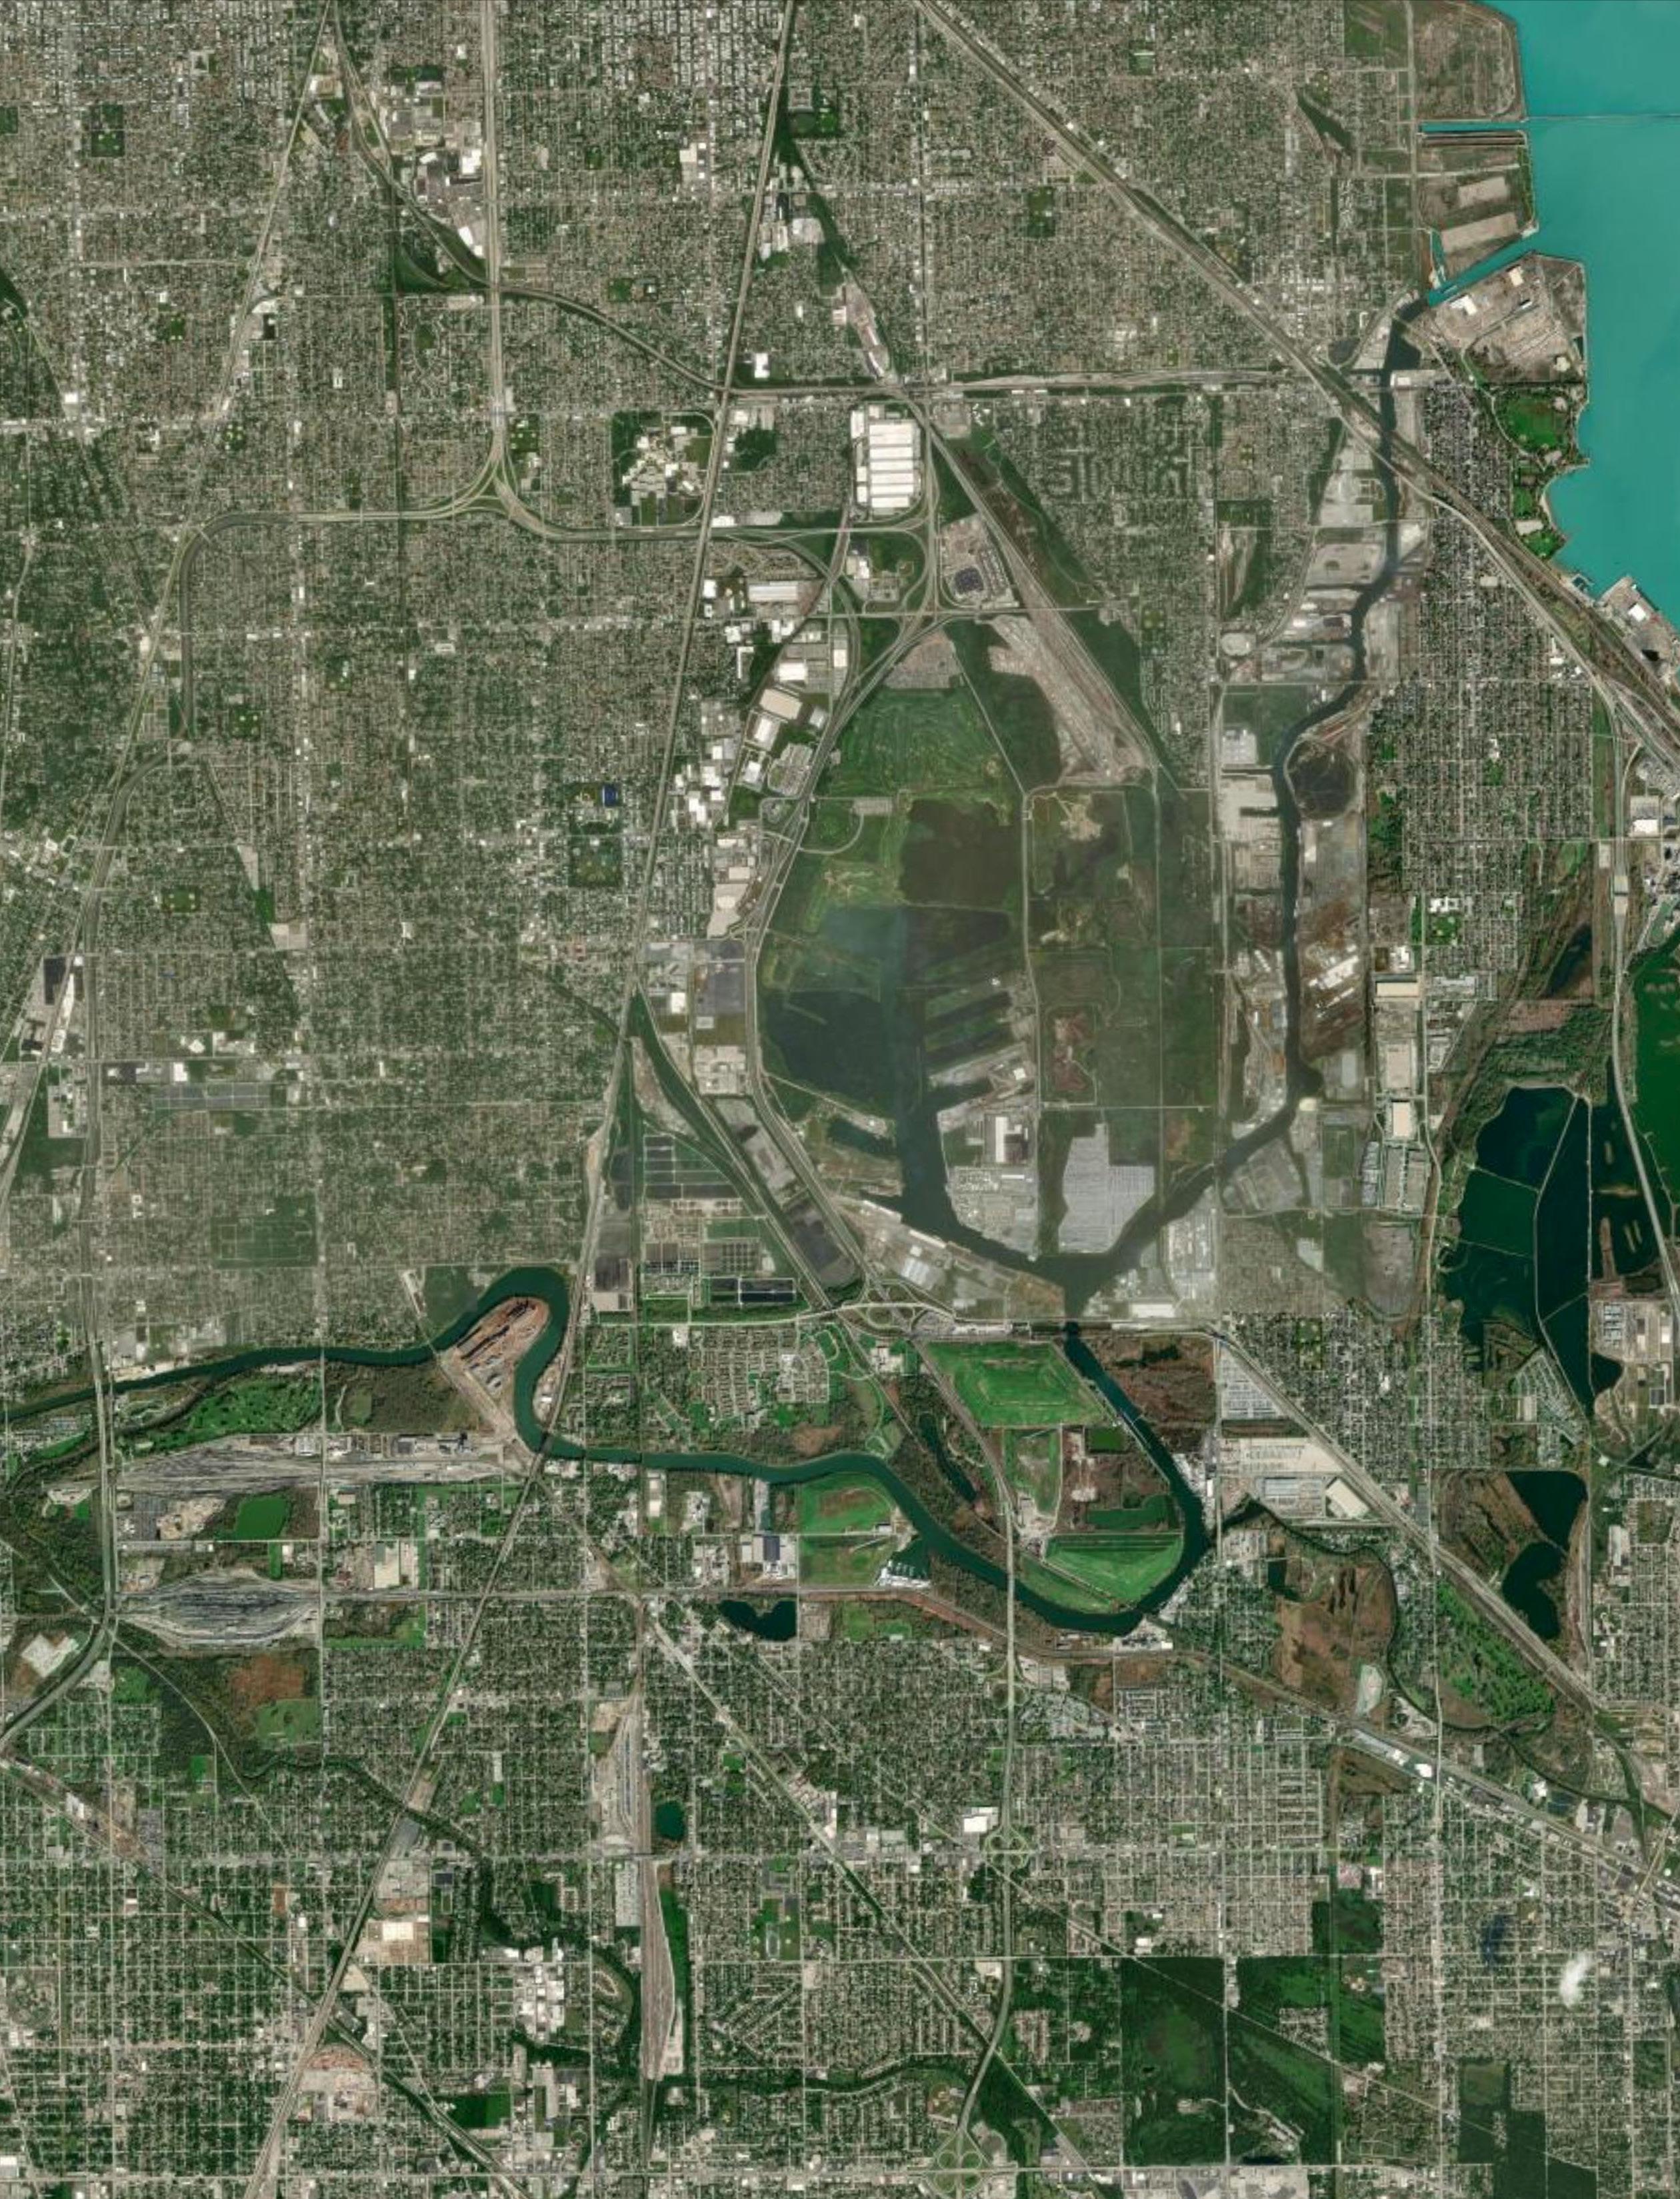
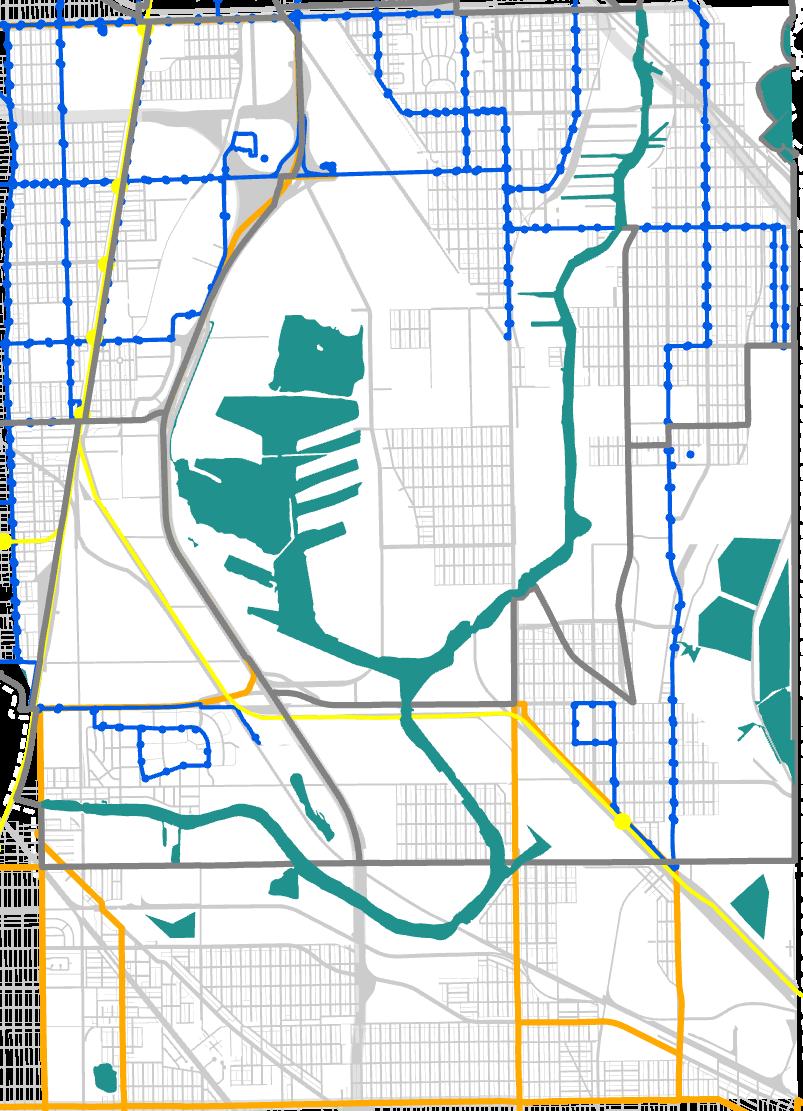
One of the largest gaps in the southern Cook County and Chicago bicycle network is located near Lake Calumet. This is mostly attributed to the significant urban and industrial land uses and water features, including Lake Calumet, Calumet River, and Square Marsh. Railroads bisect the area creating conflicts for vulnerable roadways users including pedestrians, bicyclists, and the disabled. Heavy-trafficked streets, a high degree of freight truck activity, sensitive environmental habitats, and disconnected street network are also major challenges to biking in the Lake Calumet area.
The spatial mismatch between residents, area destinations, and existing access to bikeways in the area is significant. These conditions are exacerbated by the high rate of racial, ethnic, and socioeconomic disparity of residents.
improvements based on ease of construction,
EAST SIDE
INDIANA
WEST PULLMAN
RIVERDALE
BURNHAM
CALUMET CITY
SOUTH HOLLAND
HARVEY
DOLTON
SOUTH DEERING
HEGEWISCH
PULLMAN
LAKE MICHIGAN
What is the State of Biking Report?
This report documents existing conditions in the study area as it relates to current active transportation infrastructure, how and where people move by various modes, and a snapshot of demographic and socioeconomic status of community members. This document includes a detailed characterization of how streets are used, existing and future bicycle network (i.e., under construction, planned and funded), level of access to area destinations, and a thorough review of bicycle access and “level of stress” analysis through an equity lens.
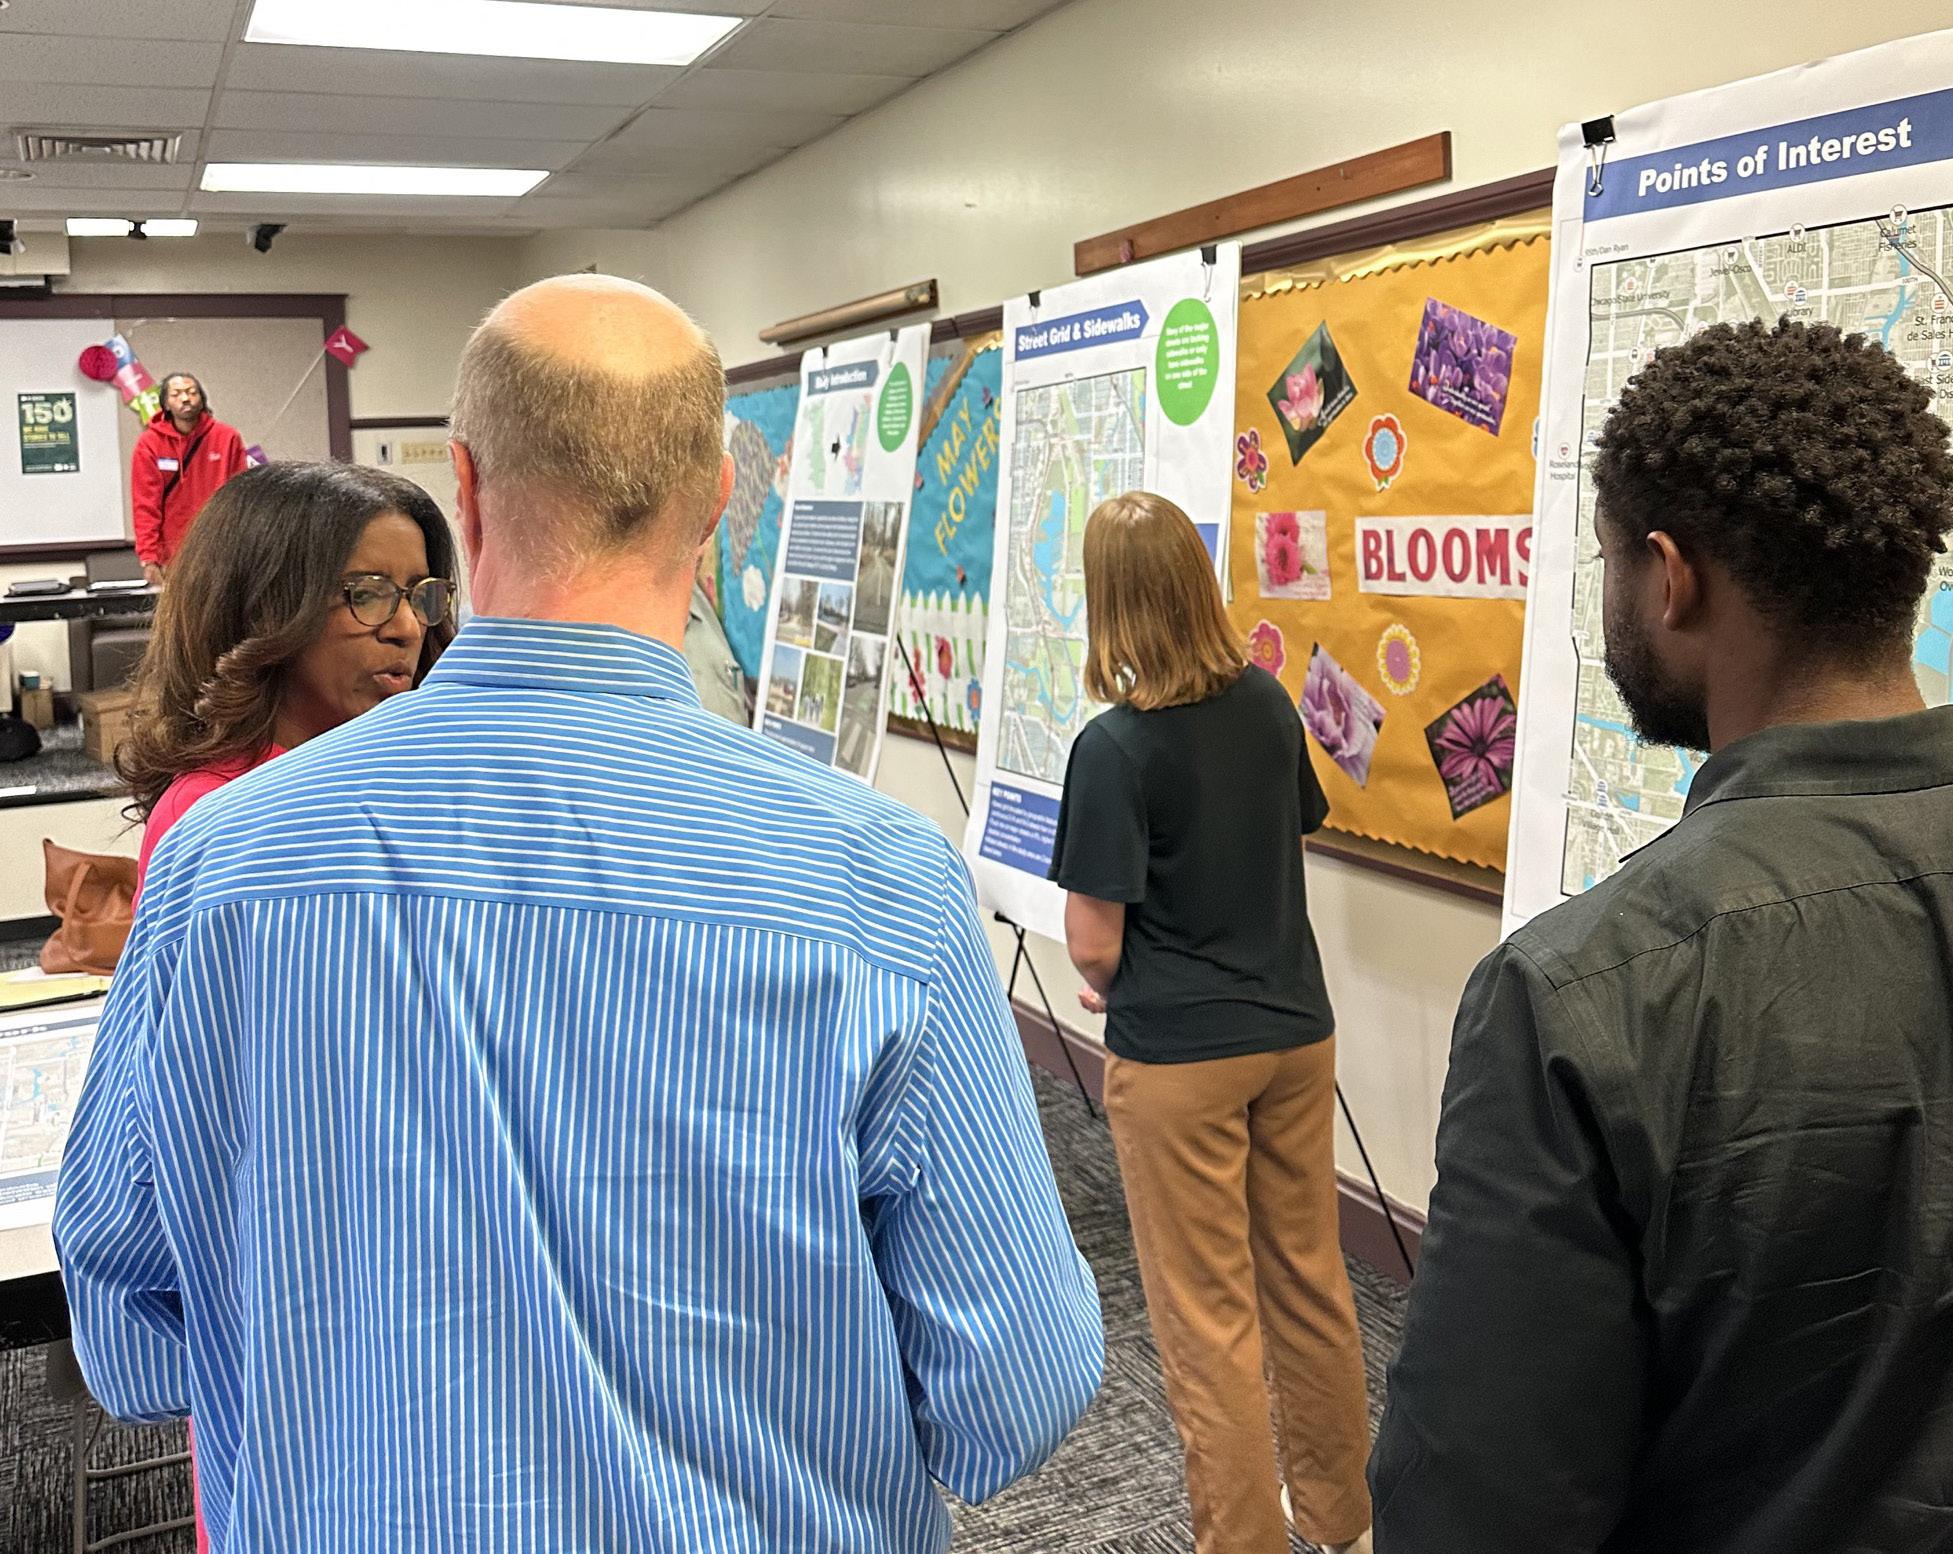
This report presents ongoing engagement activities as part of this effort. Detailed description of the communications and engagement process is included as well as key insights from the community from open house events, bicycle tours, online presentations, and advisory committee meetings.
The findings in this report provide a framework to incorporate input from engagement activities and support identification of potential improvements to the active transportation network.
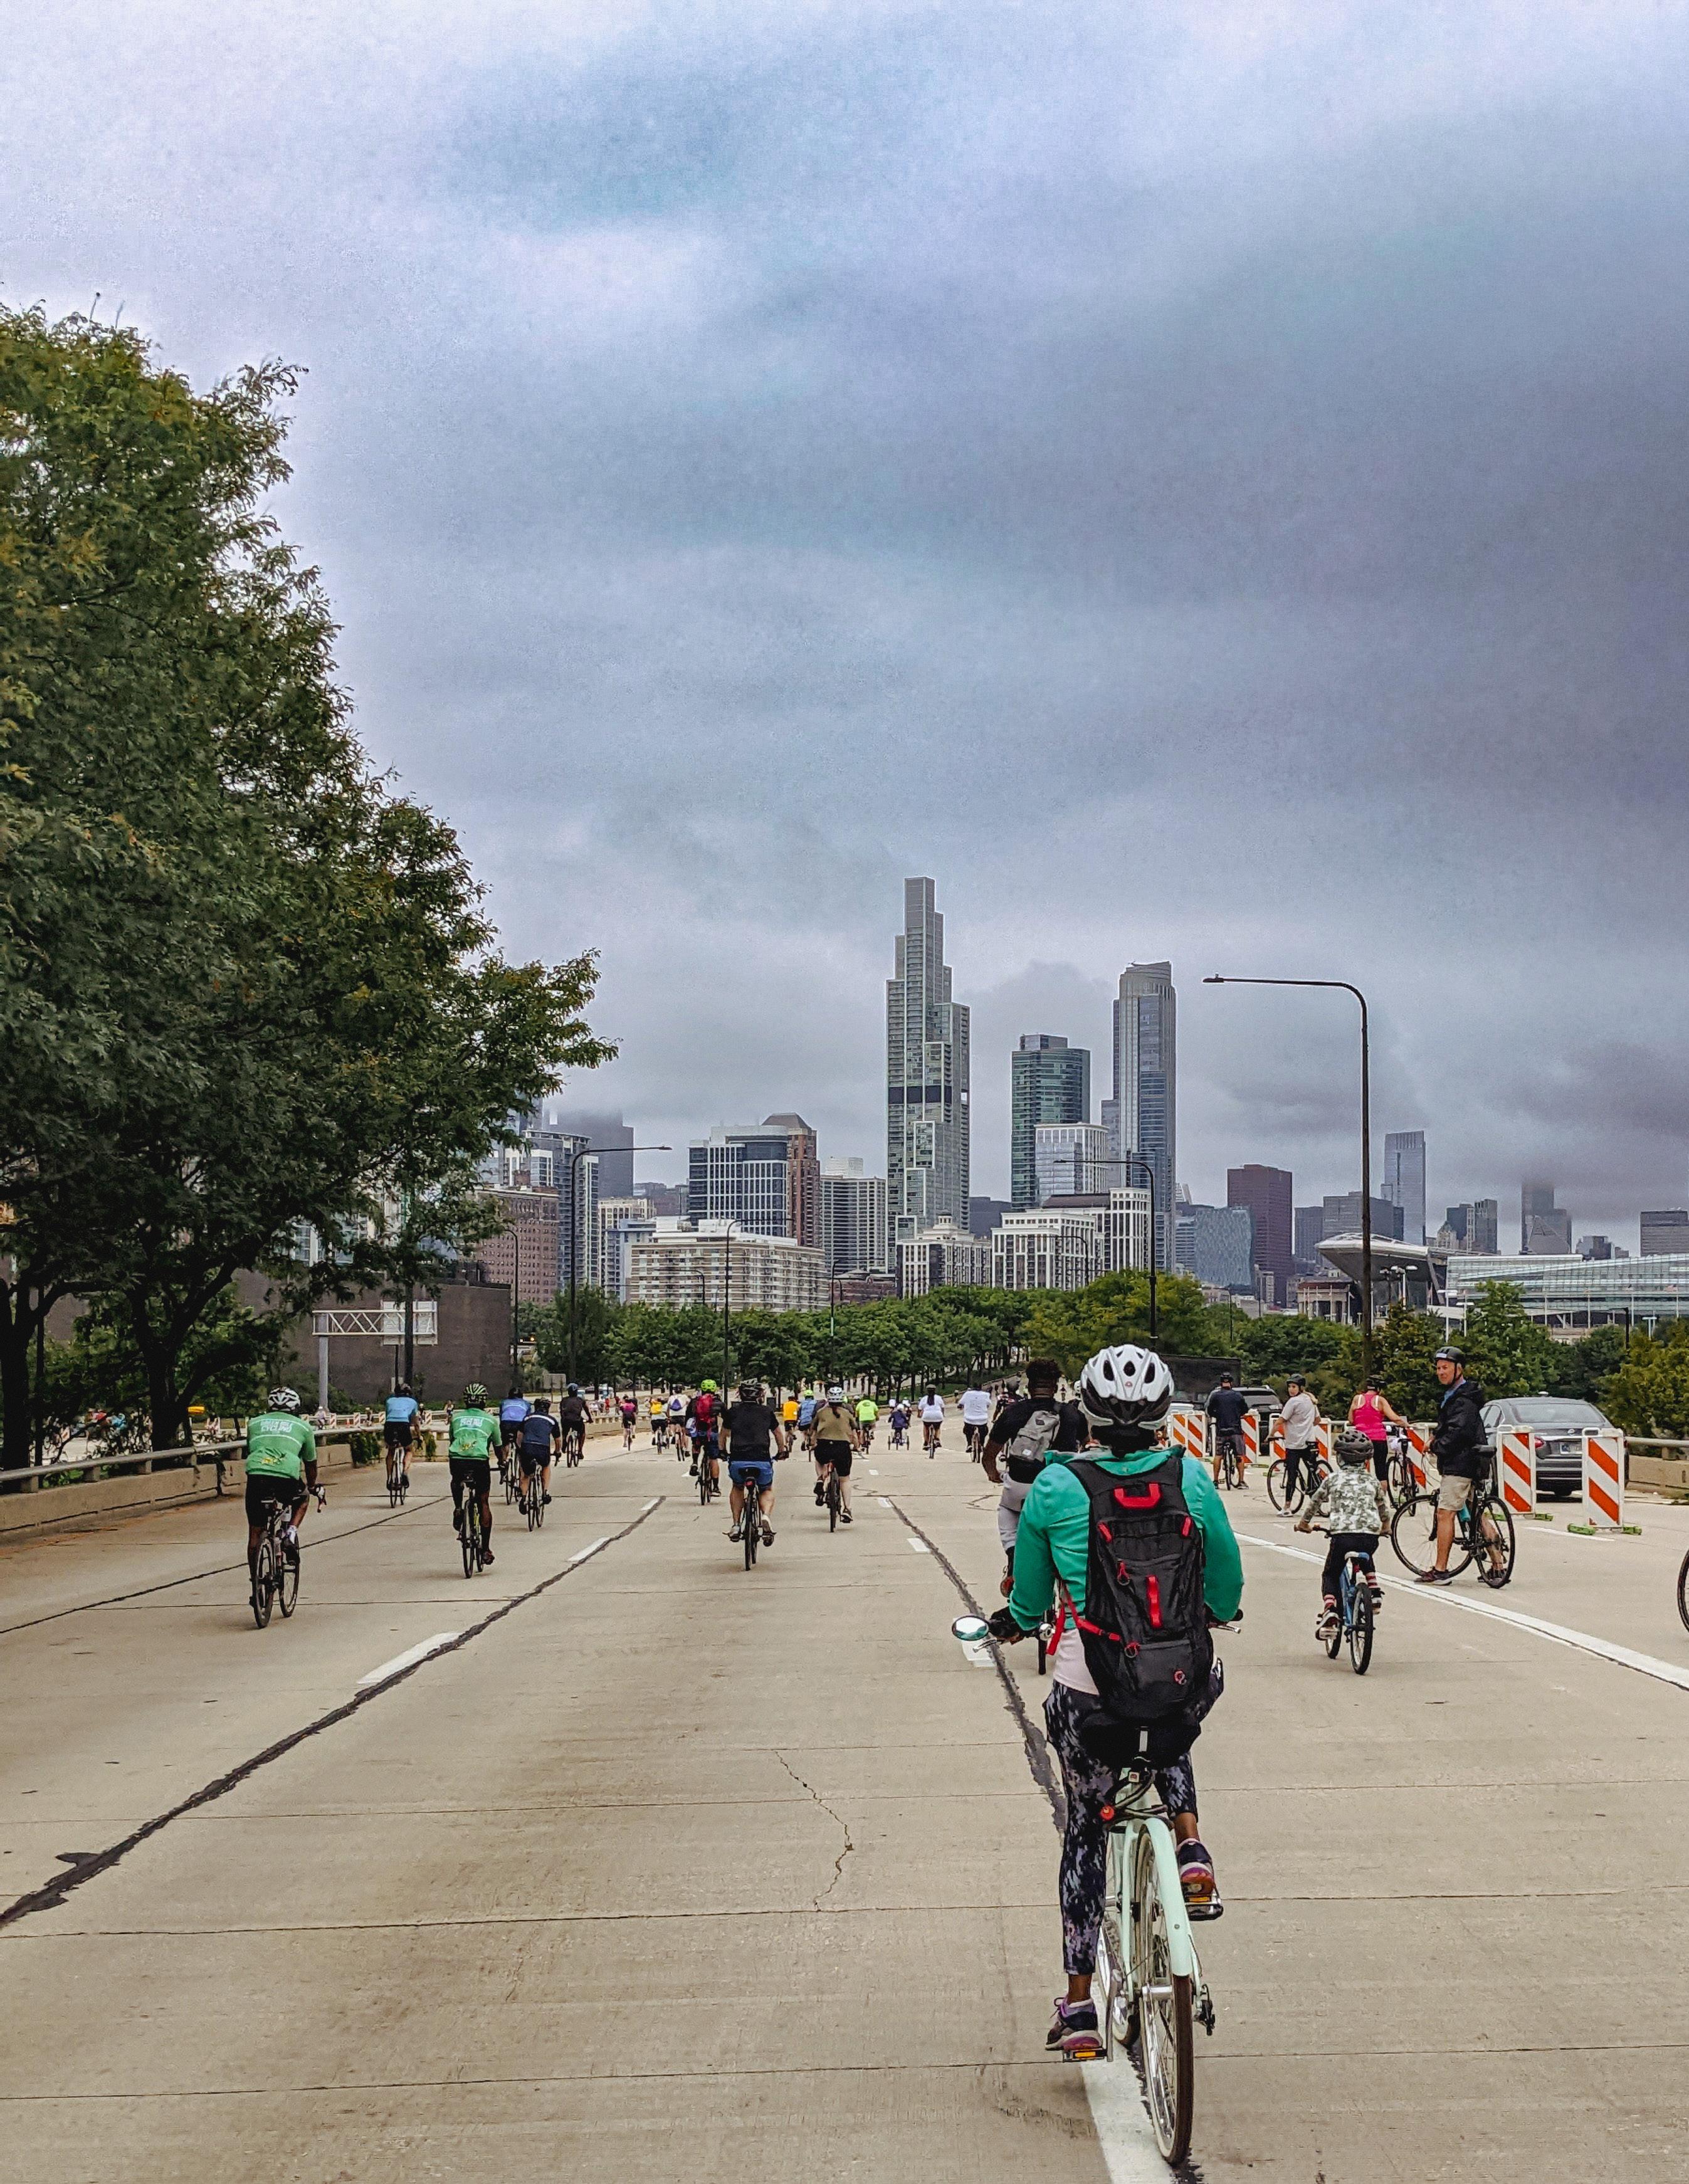
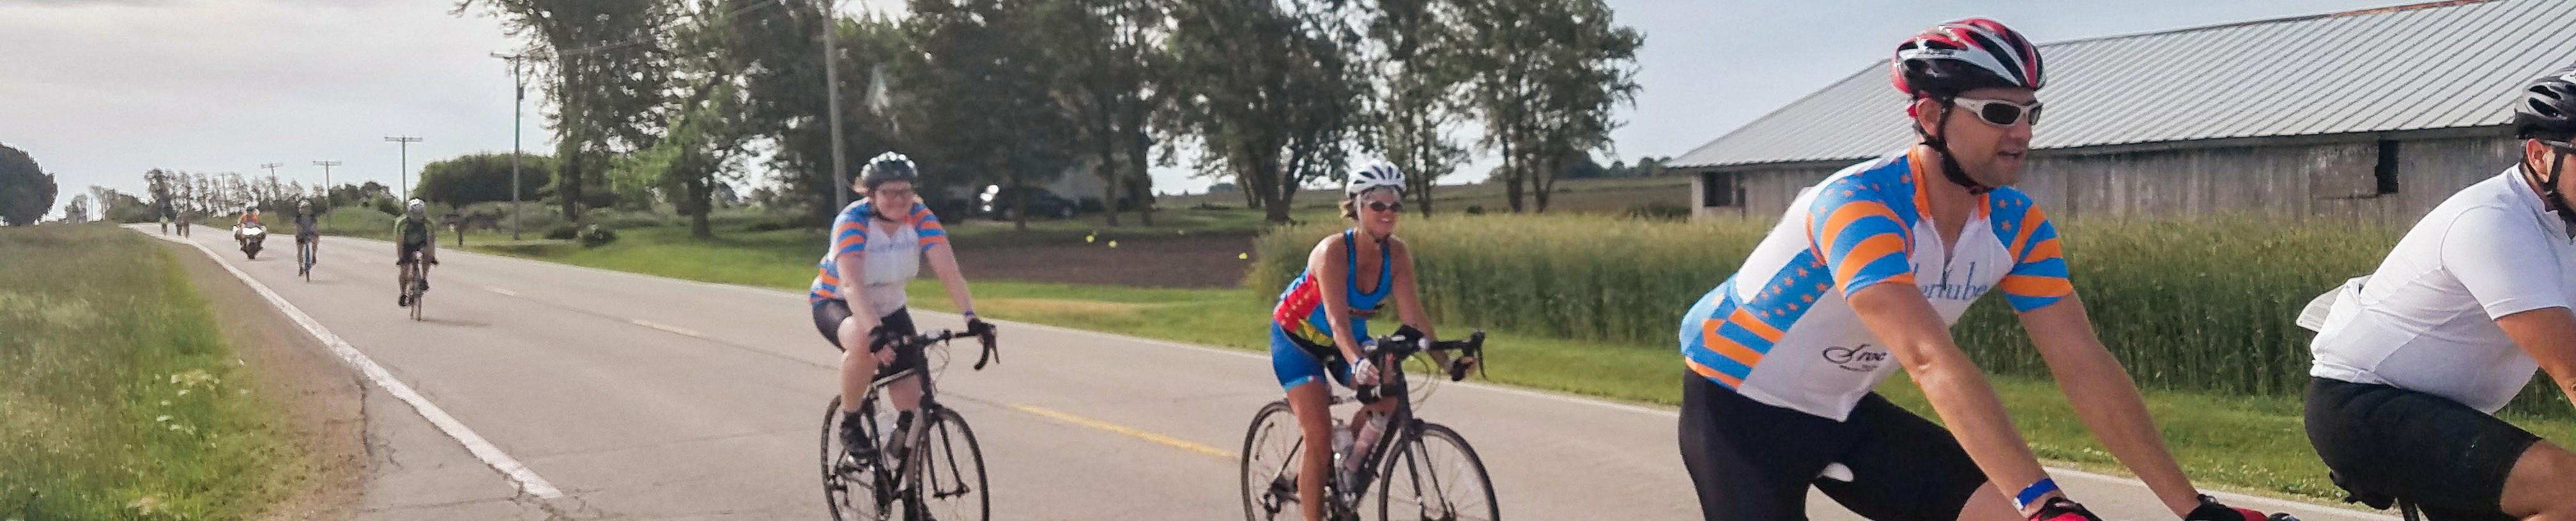
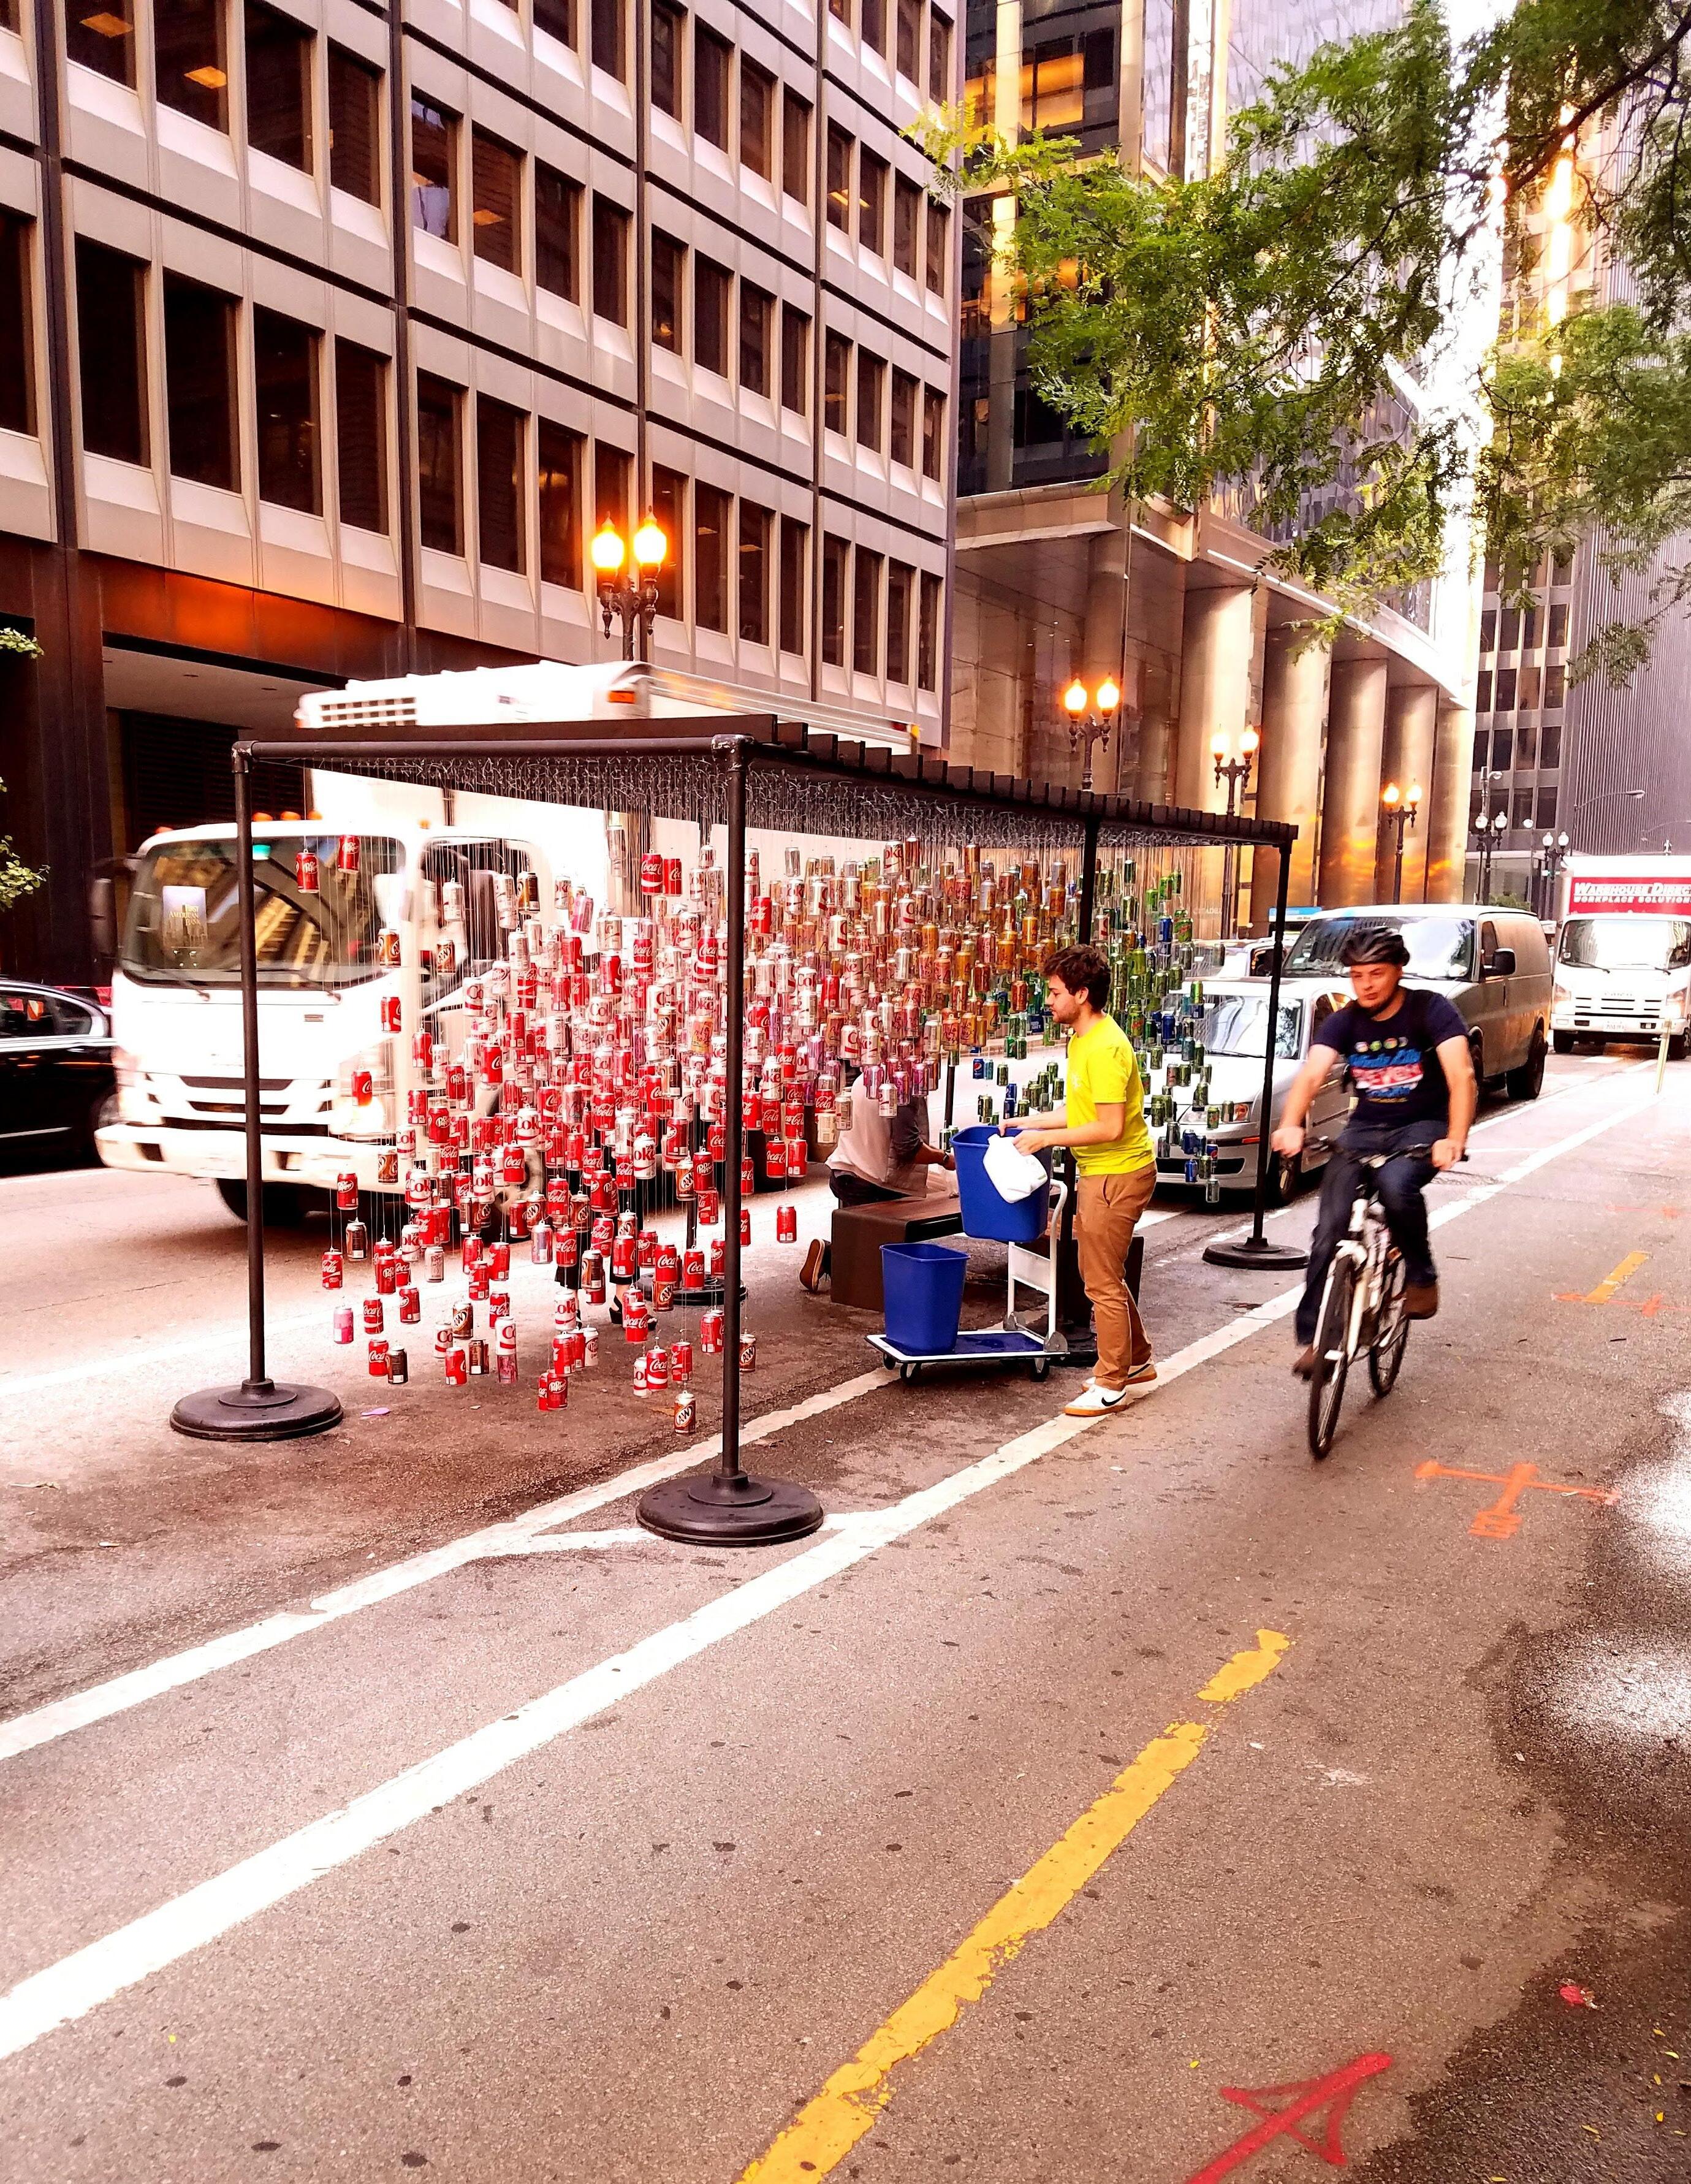
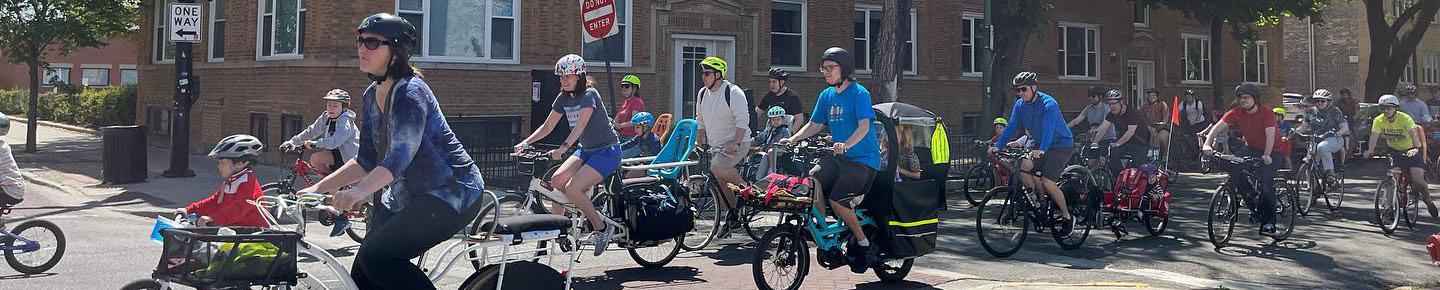
Bike The Drive 2022, bicycle enthusiasts North bound on Du Sable Lake Shore Drive Image Source: LJC
02 Setting The Stage
Past Efforts
The Lake Calumet Bicycle Network Study expands on previous and ongoing planning efforts within the study area, surrounding neighborhoods, and throughout the Chicagoland and Northwest Indiana regions. These planning efforts include feasibility studies, greenways and trails plans, complete streets recommendations, neighborhood corridor studies, and comprehensive plans. Each publication contributes to a common goal of improving connectivity to create safe and accessible places for everyone.
2017 2018 2018 2021 2023
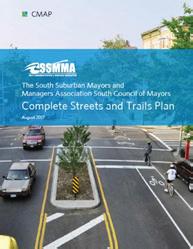
South Suburban Mayor and Managers Association and South Council of Mayors: Complete Streets and Trails Plan
Identifies priority regional corridors and planning-level recommendations for improving pedestrian conditions and access to public transit along them. The Plan also identifies several communities where a Complete Streets policy is desirable and conducted outreach activities to help them move toward adoption of a Complete Streets policy.
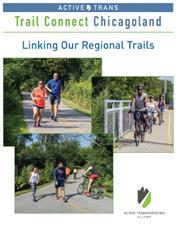
Plans for closing 142 miles of trail gaps in the suburbs and 45 miles of gaps in the City of Chicago, by building the grassroots support, political will, and technical assistance knowledge. The plan highlights ways residents and officials can work together to overcome obstacles and build a regional trail network that works for everyone in Northeast Illinois.
Northeastern Illinois Regional Greenways and Trails Plan
Adopted as part of ON TO 2050, is a long-range plan which envisions a network of continuous greenway and trail corridors, linked across jurisdictions, providing scenic beauty, natural habitat, and recreational and transportation opportunities. The plan includes conceptual alignments for the planned trail network. The regional trails plan assists implementers and funding agencies in proposals that relate to the plan can be more attractive to funding agencies.
Lake Calumet Trail Feasibility Study
The study evaluates alternatives for a proposed shared-use path across Lake Calumet to better connect neighborhoods of the south side of Chicago to Big Marsh Park and connect with the regional system. An addendum to the original study is underway.
Cook County Bicycle Plan
Recommends enhancements to include 90 miles of new off-street paved trails, 150 miles of new sidepaths and at least 230 miles of new on-street bicycle routes. Once fully implemented, the plan ensures that 96% of County residents will live less than a mile from a bicycle path or lane suitable for any rider or ability level.
Chicago Cycling Strategy
Represents an equitable and efficient approach to implementing a cycling system that better serves everyone. The strategy will guide the vision of the next 150 miles of bikeways for the Chicago Department of Transportation; focusing on an equitable transportation system. 2023
Regional Trail Plans & Specific Trail Studies
Chicago Neighborhood & Sub Area Plans
West Pullman - 119th Street Corridor Plan
Describes goals, objectives recommendations, and implementation actions for seven topic areas along the corridor: economic development, job training and adult education, transportation, youth and family development, housing, cultural identity and design, and land use.
Seeks to improve access to the Pullman historic district by various modes for both visitors and residents by: examining previous planning efforts and an analysis of existing conditions; developing recommendations and outreach to community stakeholders; and by creating short-, midand long-term strategies for the National Monument and surrounding neighborhoods. 2015 2016 2016 2016 2017
Calumet River Communities Planning Framework
Provides a framework for future planning efforts in Southeast Chicago and focuses on a study area adjacent to the Calumet River from its mouth at Lake Michigan (at approximately 89th Street) south to 106th Street. The Plan focuses on public health and the environment, social equity, and economic development.
South Chicago’s Commercial Avenue Revitalization Plan
Creates a framework for future developments along the corridor, focused on producing a thriving, vibrant corridor that draws people from all over the region to shop, dine, and stroll in the South Chicago neighborhood. The result will be a stronger economy, more jobs, and access to the goods and services that neighborhood residents need.
Washington Heights/ 95th Street Planning Priorities Report
Prioritizes the main issues of Washington Heights and the 95th Street corridor, formulated a plan of action to improve economic vitality, quality of life for residents, and community collaboration.
Pullman Transportation Plan
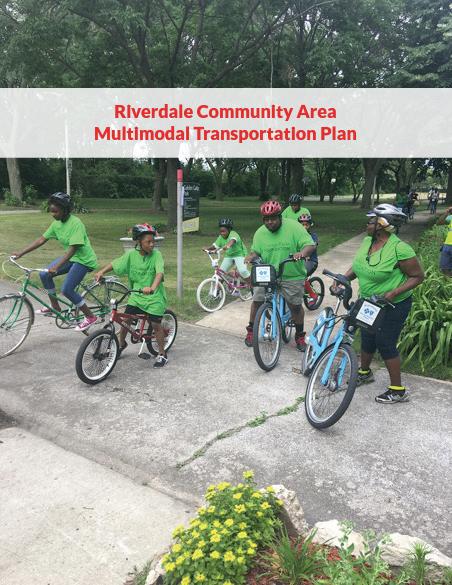
Riverdale Community Area
Multimodal Transportation Plan
Develop recommendations for improving non-motorized access to existing transit services, recreation, and job opportunities while also implementing Pedestrian First modal hierarchy.
Image Source: LJC
Image Source: LJC
Chicago Neighborhood & Sub Area Plans
2019 2020 2023
2024 2023
Roseland Medical District:
Exisiting Conditions Report & Market Analysis
Prioritizes the main issues of the corridor and surrounding community, formulating a plan of action including assessments of mobility, land use, and development potential, as well as community engagement and visioning.
Invest South/West
City-led, coordinated sub-area planning, redevelopment, and infrastructure improvement program on the City’s south and west sides. Sub areas include South Chicago and the Greater Roseland areas
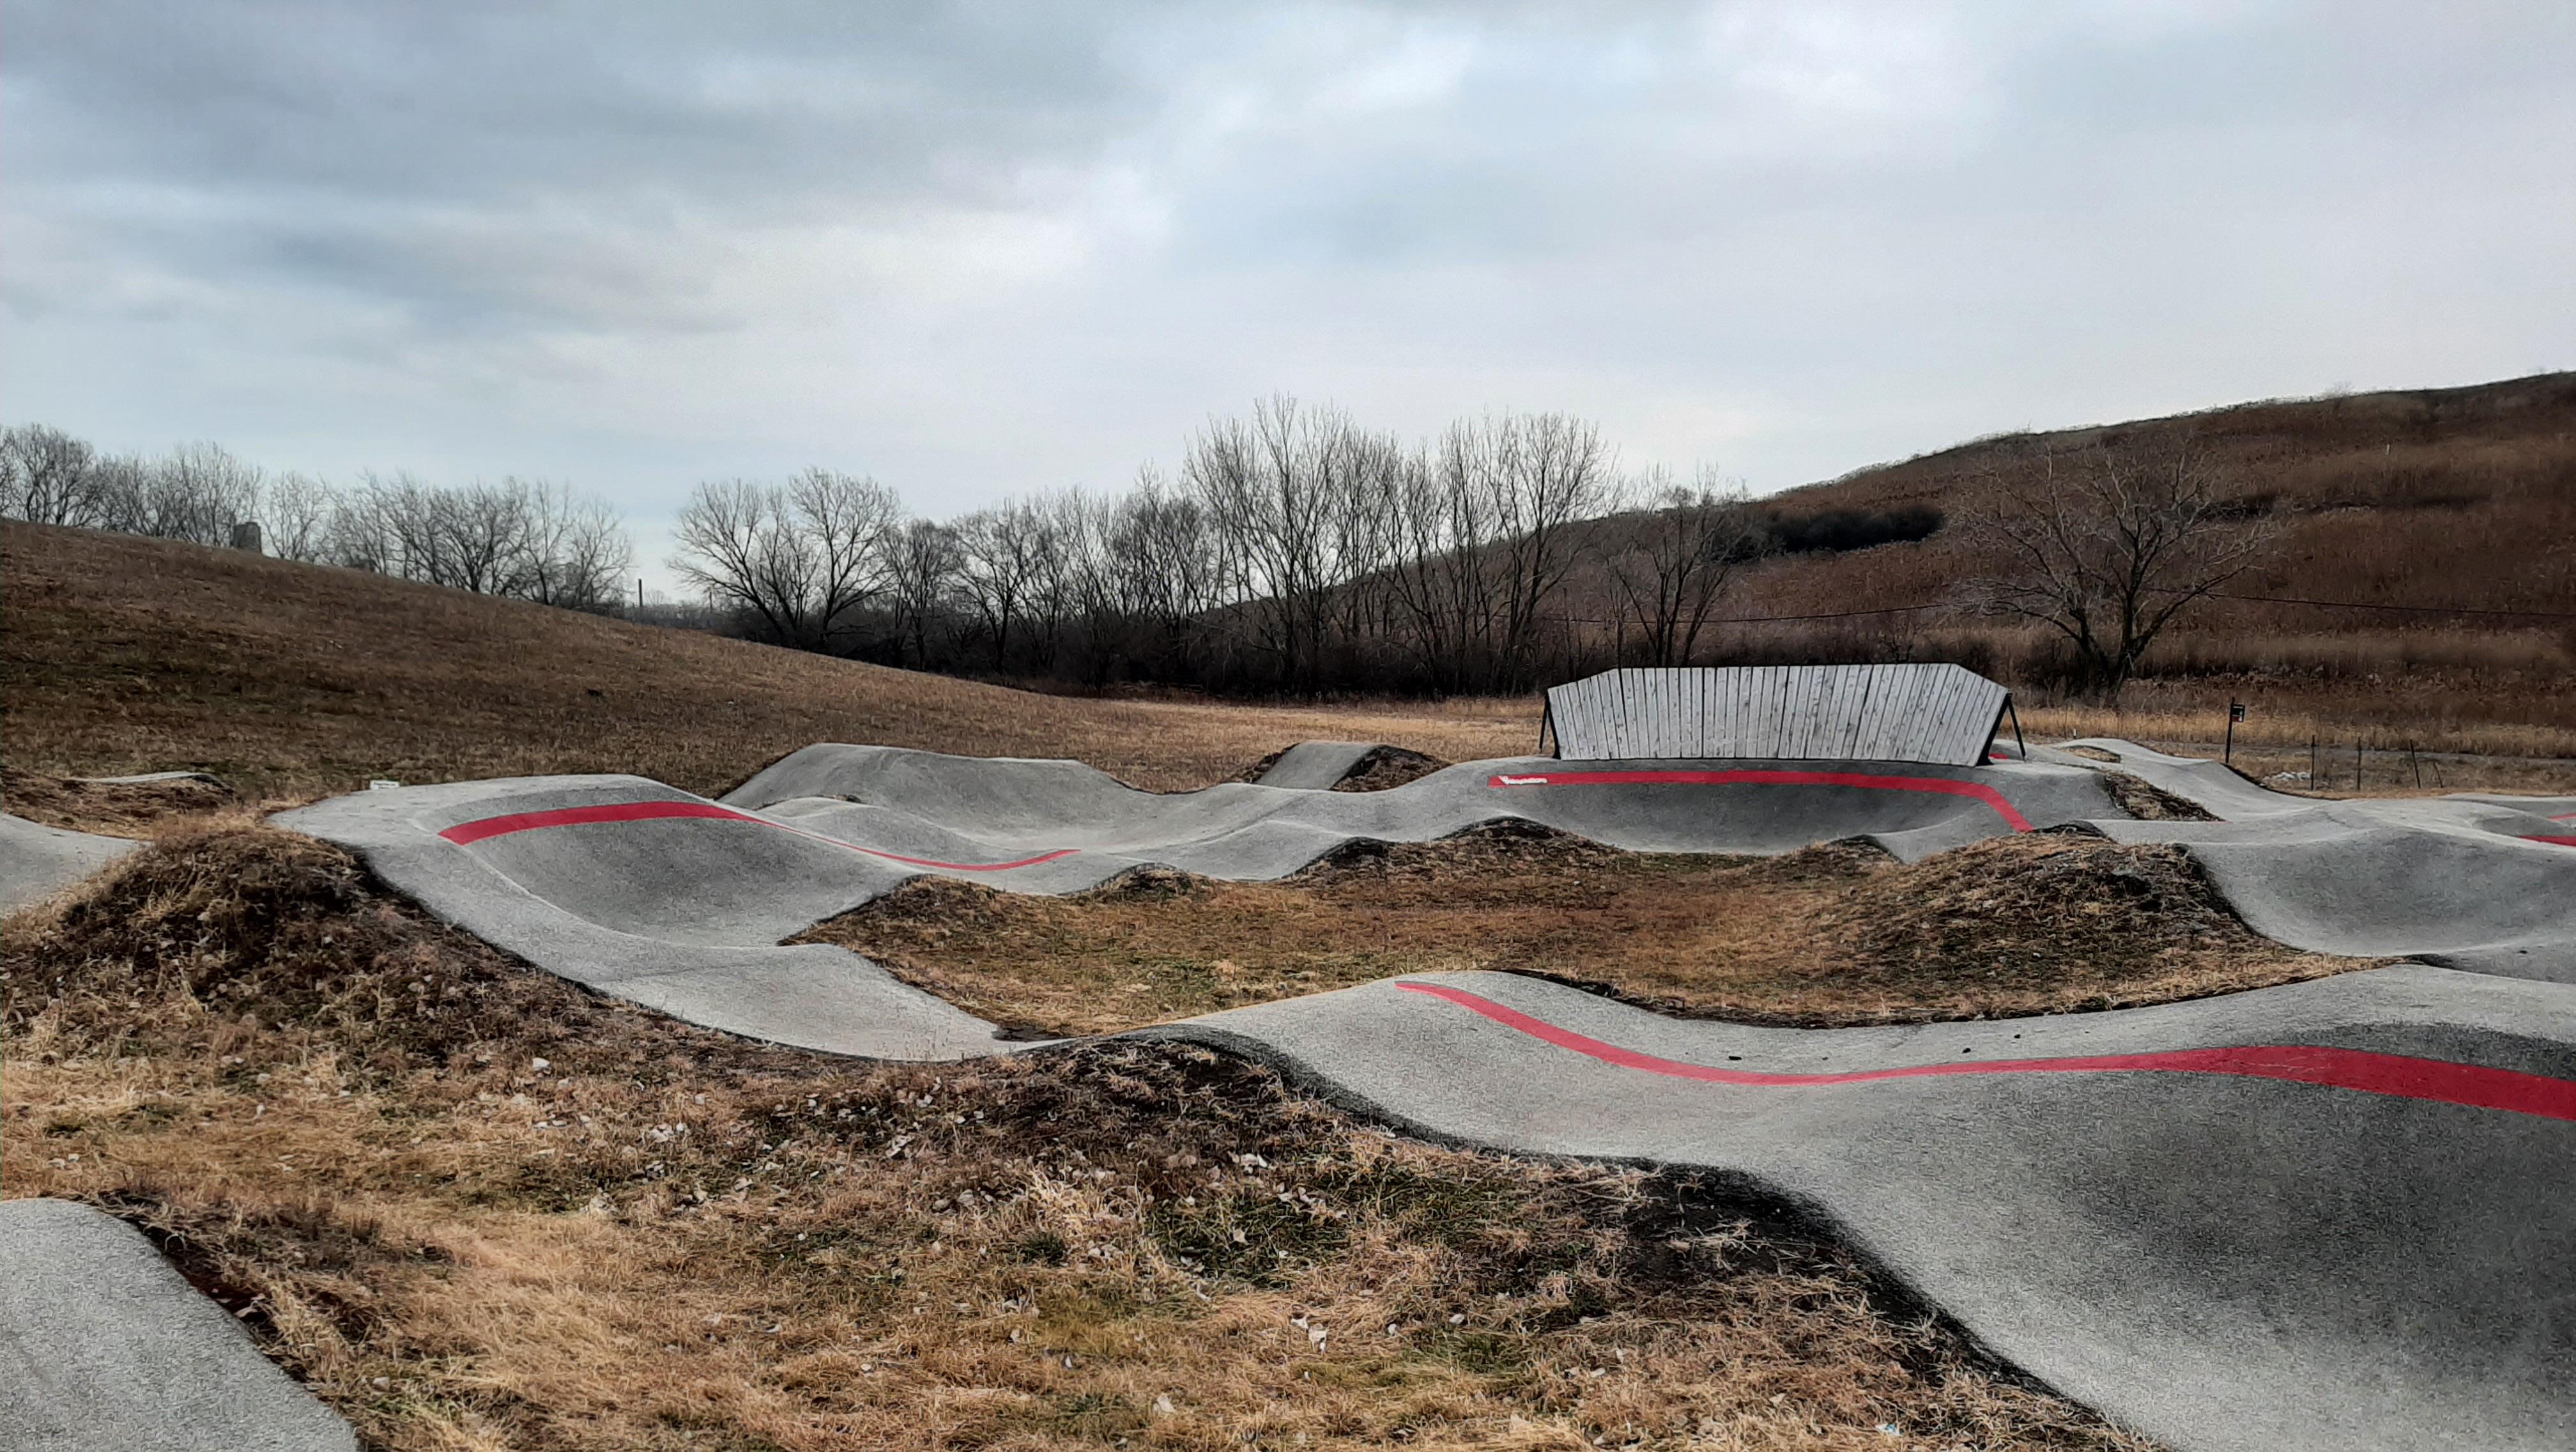
Big Marsh: East Side Neighborhood Connectivity Plan
Presents a vision to creating an interconnected, high-quality network of low-stress transportation facilities. These will enable people to walk, bicycle, and enjoy improved access to nature and the scenic beauty of Big Marsh Park.
Increasing Physical Activity in South Suburban Cook County Communities
As a Illinois State Physical Activity & Nutrition Program Success Story, this report correlates the health benefits warranted by investment in wayfinding signage to walking and biking to local services in Suburban Cook County.
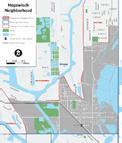
Hegewisch Neighborhood Plan
This ongoing effort will focus on improving the quality and vibrancy of Baltimore Avenue. It will identify feasible economic development opportunities, as well as smart streetscape and placemaking strategies. The plan will also focus on improving transit access, and bike/pedestrian improvements, like strengthening the connection between Baltimore Avenue and Wolf Lake.
Image Source: LJC
Comprehensive Plans and Master Plans
2014 2018 2022
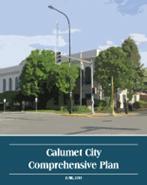
City Comprehensive Plan
Integrates land use and transportation by addressing gaps and inconsistencies in the existing transportation network, identifies links for the City’s parks and forest preserve lands, offers a downtown concept for Pulaski Road near City Hall, and provides redevelopment strategies for the City’s vacant lots and other abandoned properties.
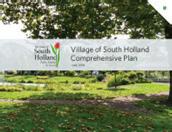
A Comprehensive Plan for South Holland
Evaluates current challenges and opportunities—within its boundaries and in the context of the South Suburbs and the metropolitan Chicago region— and identifies viable strategies to guide future growth and drive economic prosperity.
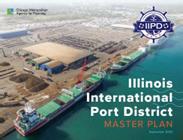
Illinois International Port District Master Plan
The plan provides the IIPD with a clear vision of how the port should develop through 2050 with input from the communities and stakeholders. The plan will identify strategies to better utilize existing facilities and position the port to realize its full economic potential, while also providing workforce, community, recreational and environmental benefits.
Calumet
Ongoing, Future Projects, Plans, and Programs
The Lake Calumet Bike Network Study utilitzes bicycle infrastructure recommendations included in the City of Chicago Cycling Strategy and the Cook County Bike Plan. A partnership between City of Chicago and Cook County Department of Transportation and Highways (DoTH) created a framework for collaboration in planning for future bicycle connections. The following projects are currently ongoing and proposed in the study area:
118th Street Sidepath: New sidepath between Avenue O and South Burley Avenue recently was constructed by CDOT.
Burnham Greenway Extension: Comprises of three separate projects which will close an approximately 2.5-mile gap in the Burnham Greenway between the 12300 block of Avenue O in Chicago to State Street near Alice Avenue in the Village of Burnham.
• Burnham Multimodal Connector (BMC): A Cook County-led project that is soon to enter phase 2 engineering to construct a pedestrian and bicycle bridge over Brainard Avenue and adjacent railroad tracks to the west of Burnham Avenue continuing as an off-street trail to 138th Place with a short on street segment on 138th Place and Green Bay Avenue to connect to the Village of Burnham Segment.
• Utility Corridor: West of Burnham Avenue north from Brainard Avenue to 12300 block of Avenue O, likely a two-phase project with the segment south from 130th and Avenue O preceding the northern segment.
• Village of Burnham Segment: A Village of Burnham-led project that will connect to the BMC at Green Bay Avenue near 138th Place to the existing Burnham Greenway south of State
Street as well as the planned extension of the Cal-Sag Trail at Alice Avenue near State Street.
Burley Avenue Projects:
• Sidepath north of 126th and west of Avenue O as part of new industrial development. Sidepath between 106th and 126th Streets (planned construction 2024)
• Carondolet Avenue Sidepath: new sidepath between 122nd St and 126th Street
• 122nd Street Sidepath: new sidepath between South Carondolet and South Burley Avenues
Cal-Sag Trail Extension: This project will extend the Cal-Sag trail east from 138th and Indiana in Dolton to connect to the Burnham Greenway at State Street near Alice Avenue in the Village of Burnham. While mostly off-street, there will be some short on-street segments in Dolton.
Calumet River Trail: Proposes constructing a 10’ paved trail and 2’ path shoulders/clearance on both sides of the trail along the north bank of the Calumet River between Stony Island Avenue and Torrence Avenue.
Lake Calumet & Big Marsh Trails: DoTH has funded two separate studies which explore the feasibility of adding trails to connect to the Chicago Park District’s Big Marsh Park. Preliminary recommendations include a Big Marsh Connector - Stony Island Ave to Torrence Ave and 110th Street and a Lake Calumet Trail - Doty Ave to Stony Island Ave.
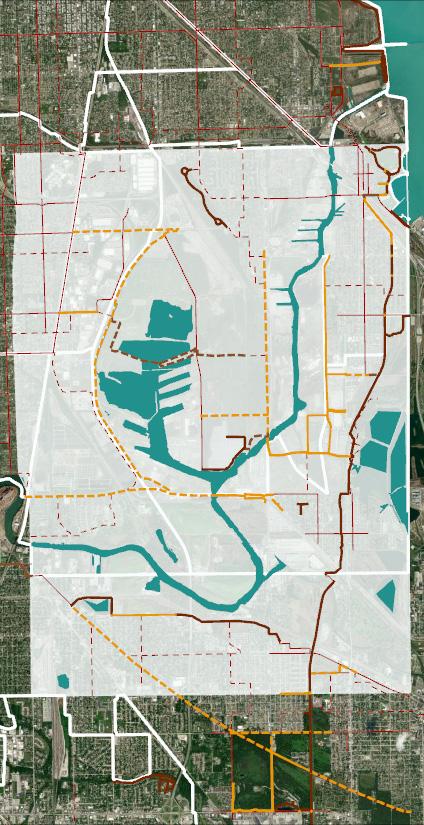
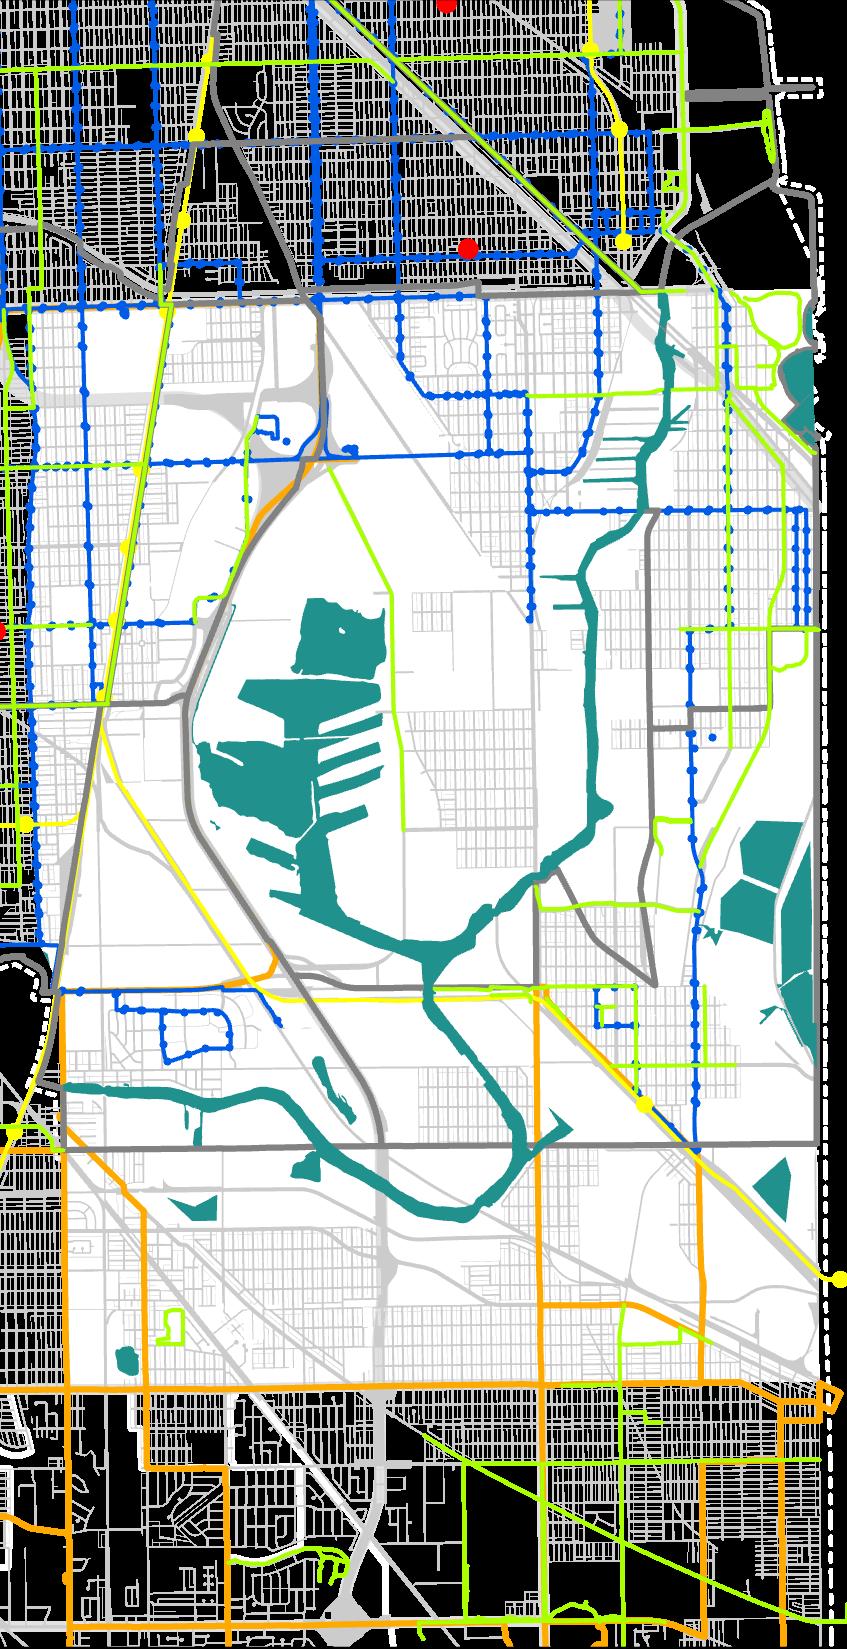
Bicycle Network
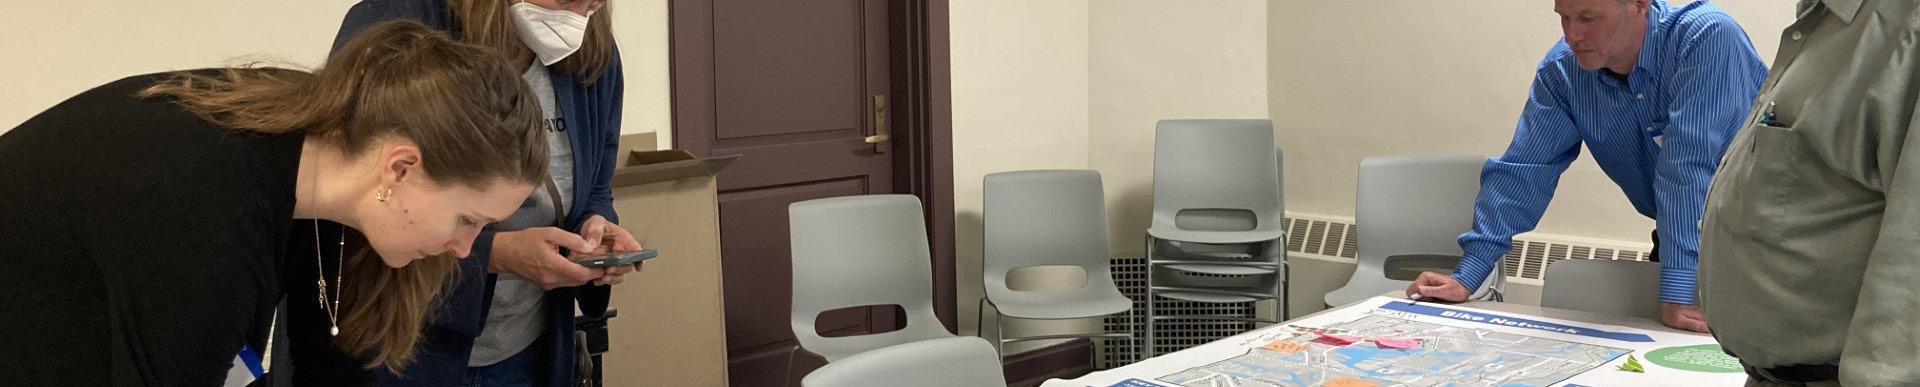
Image Source: Rudd Resources
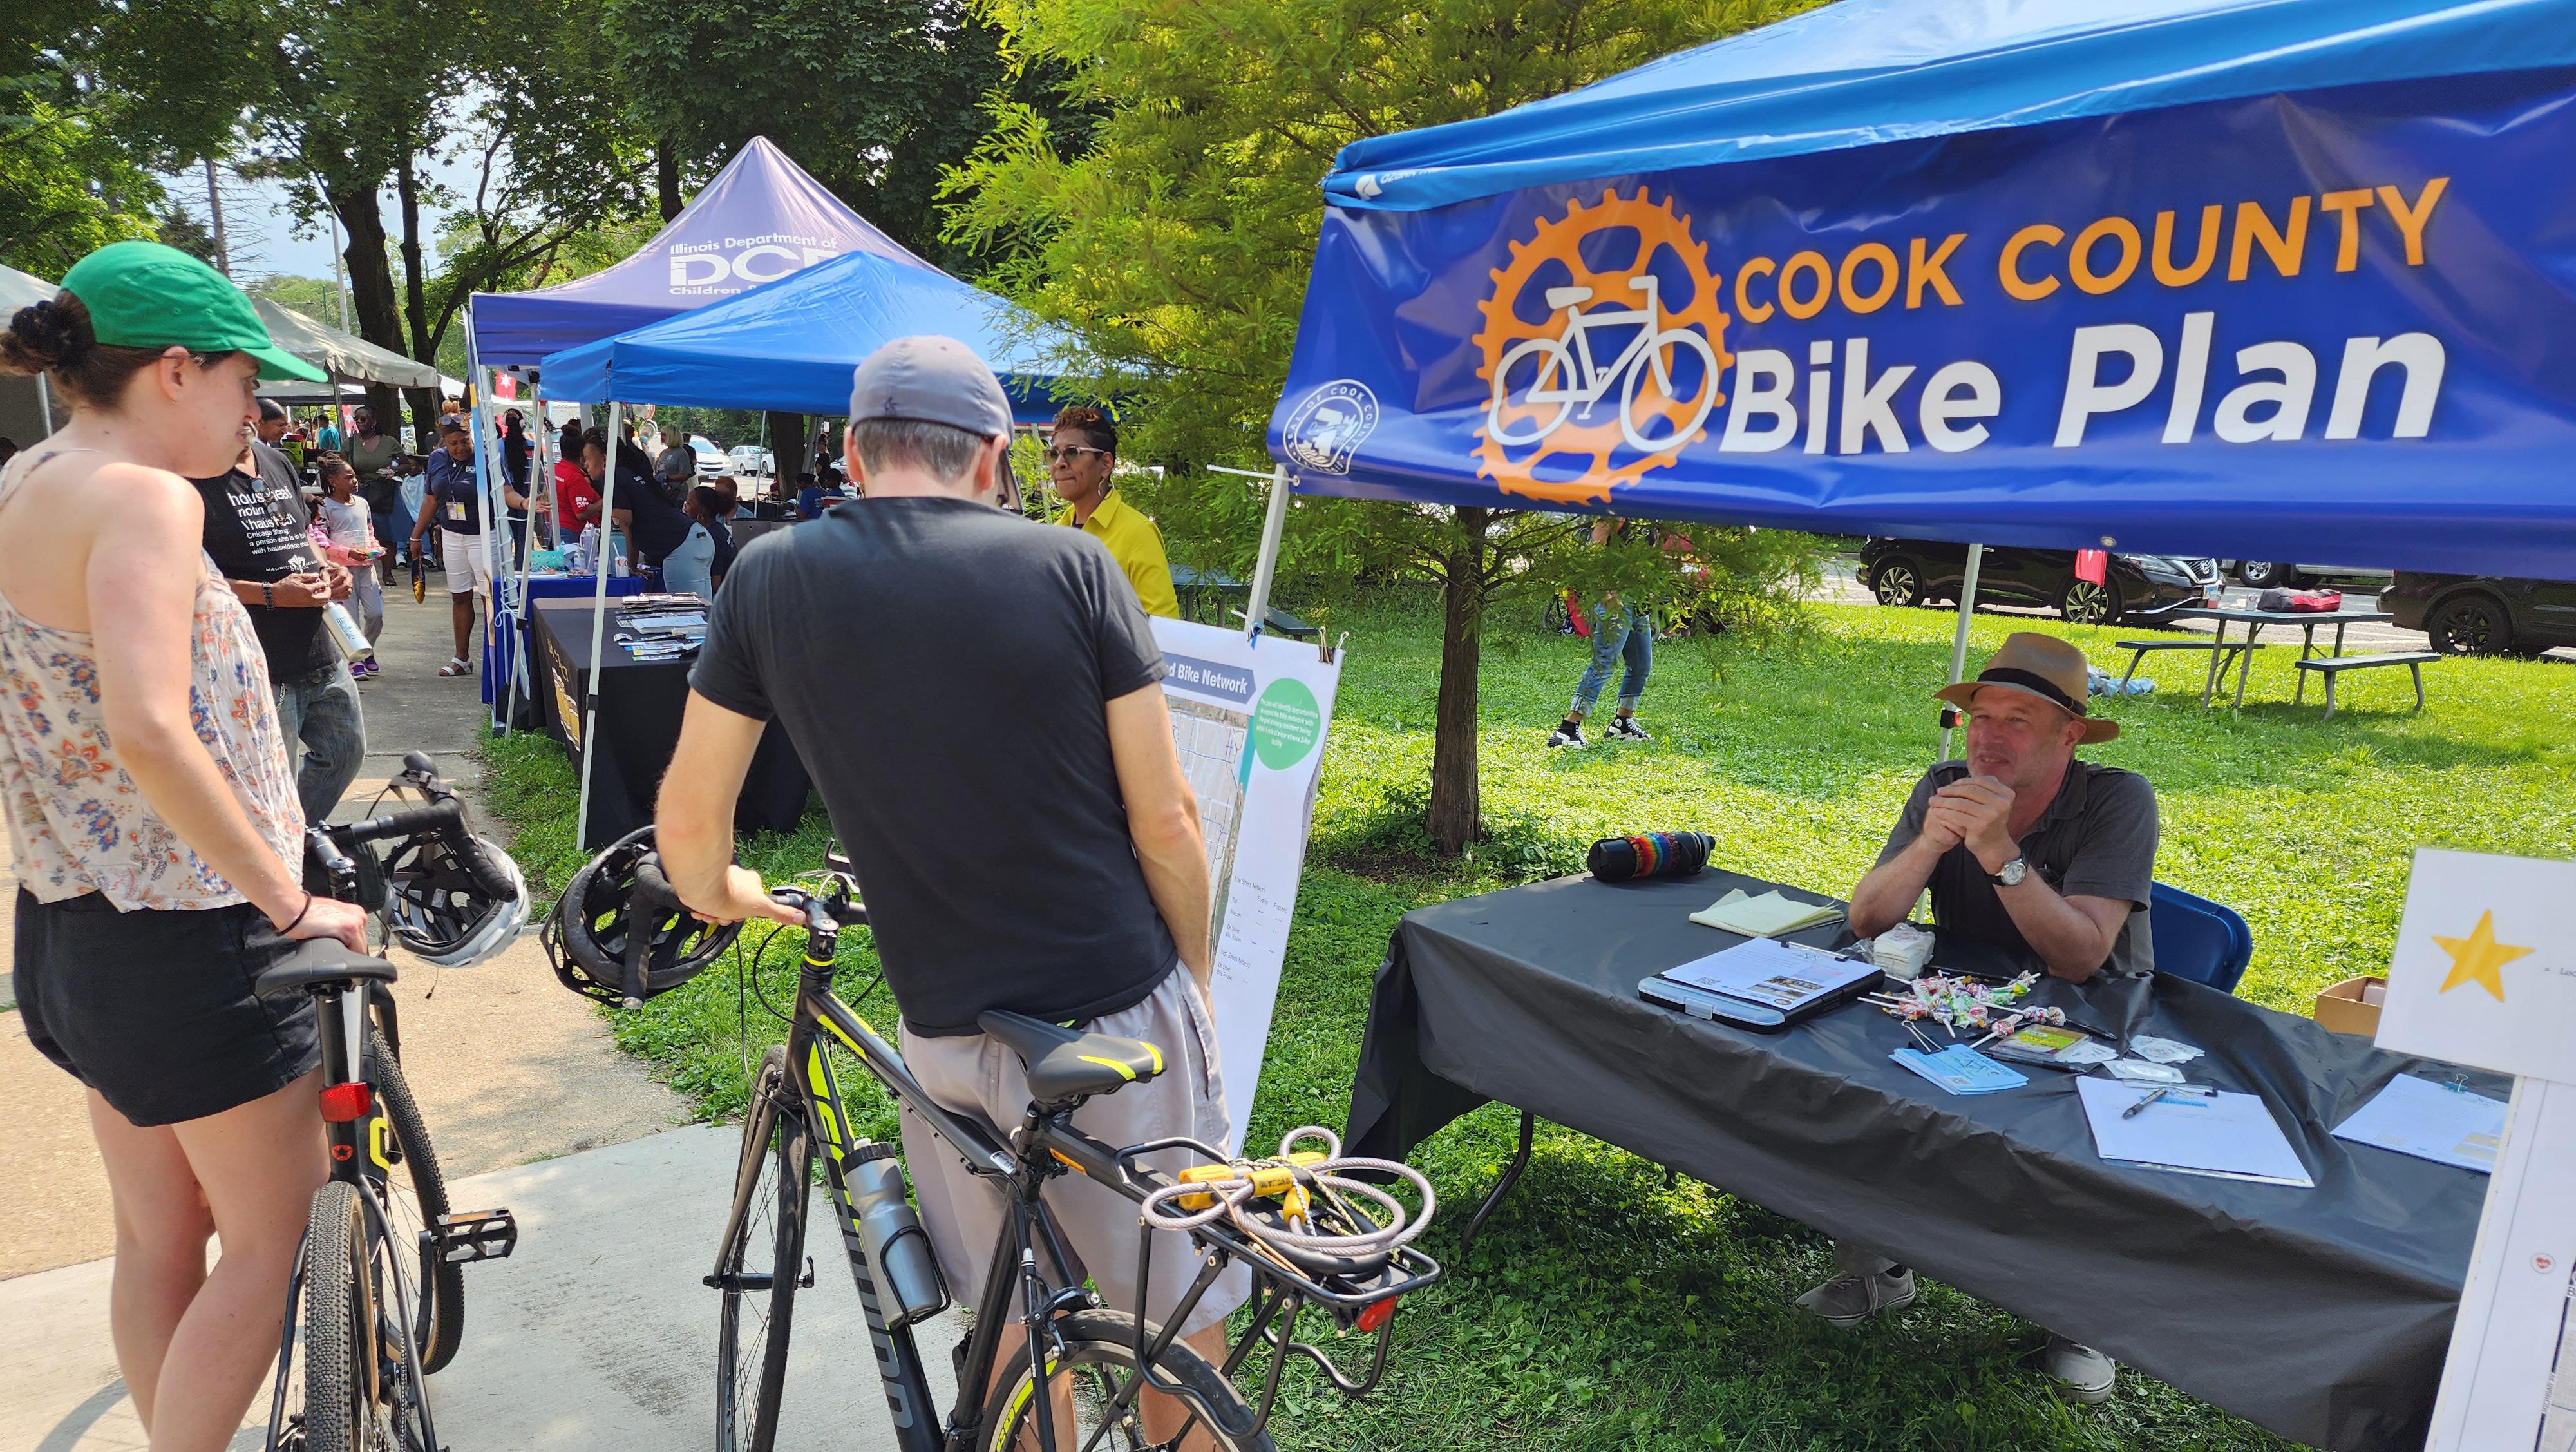
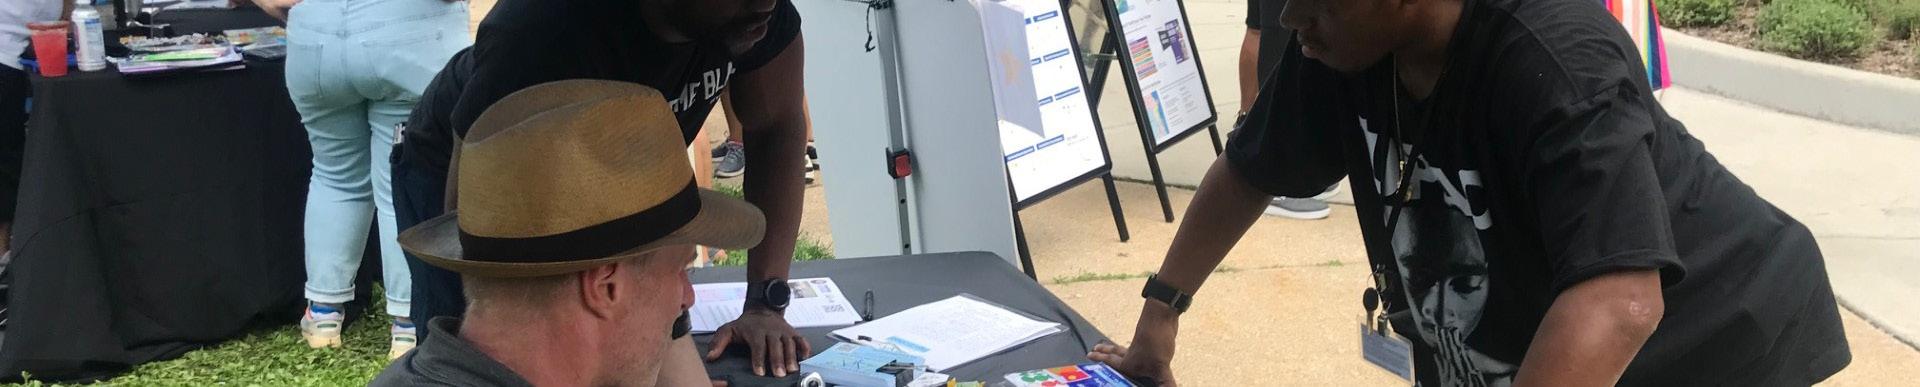
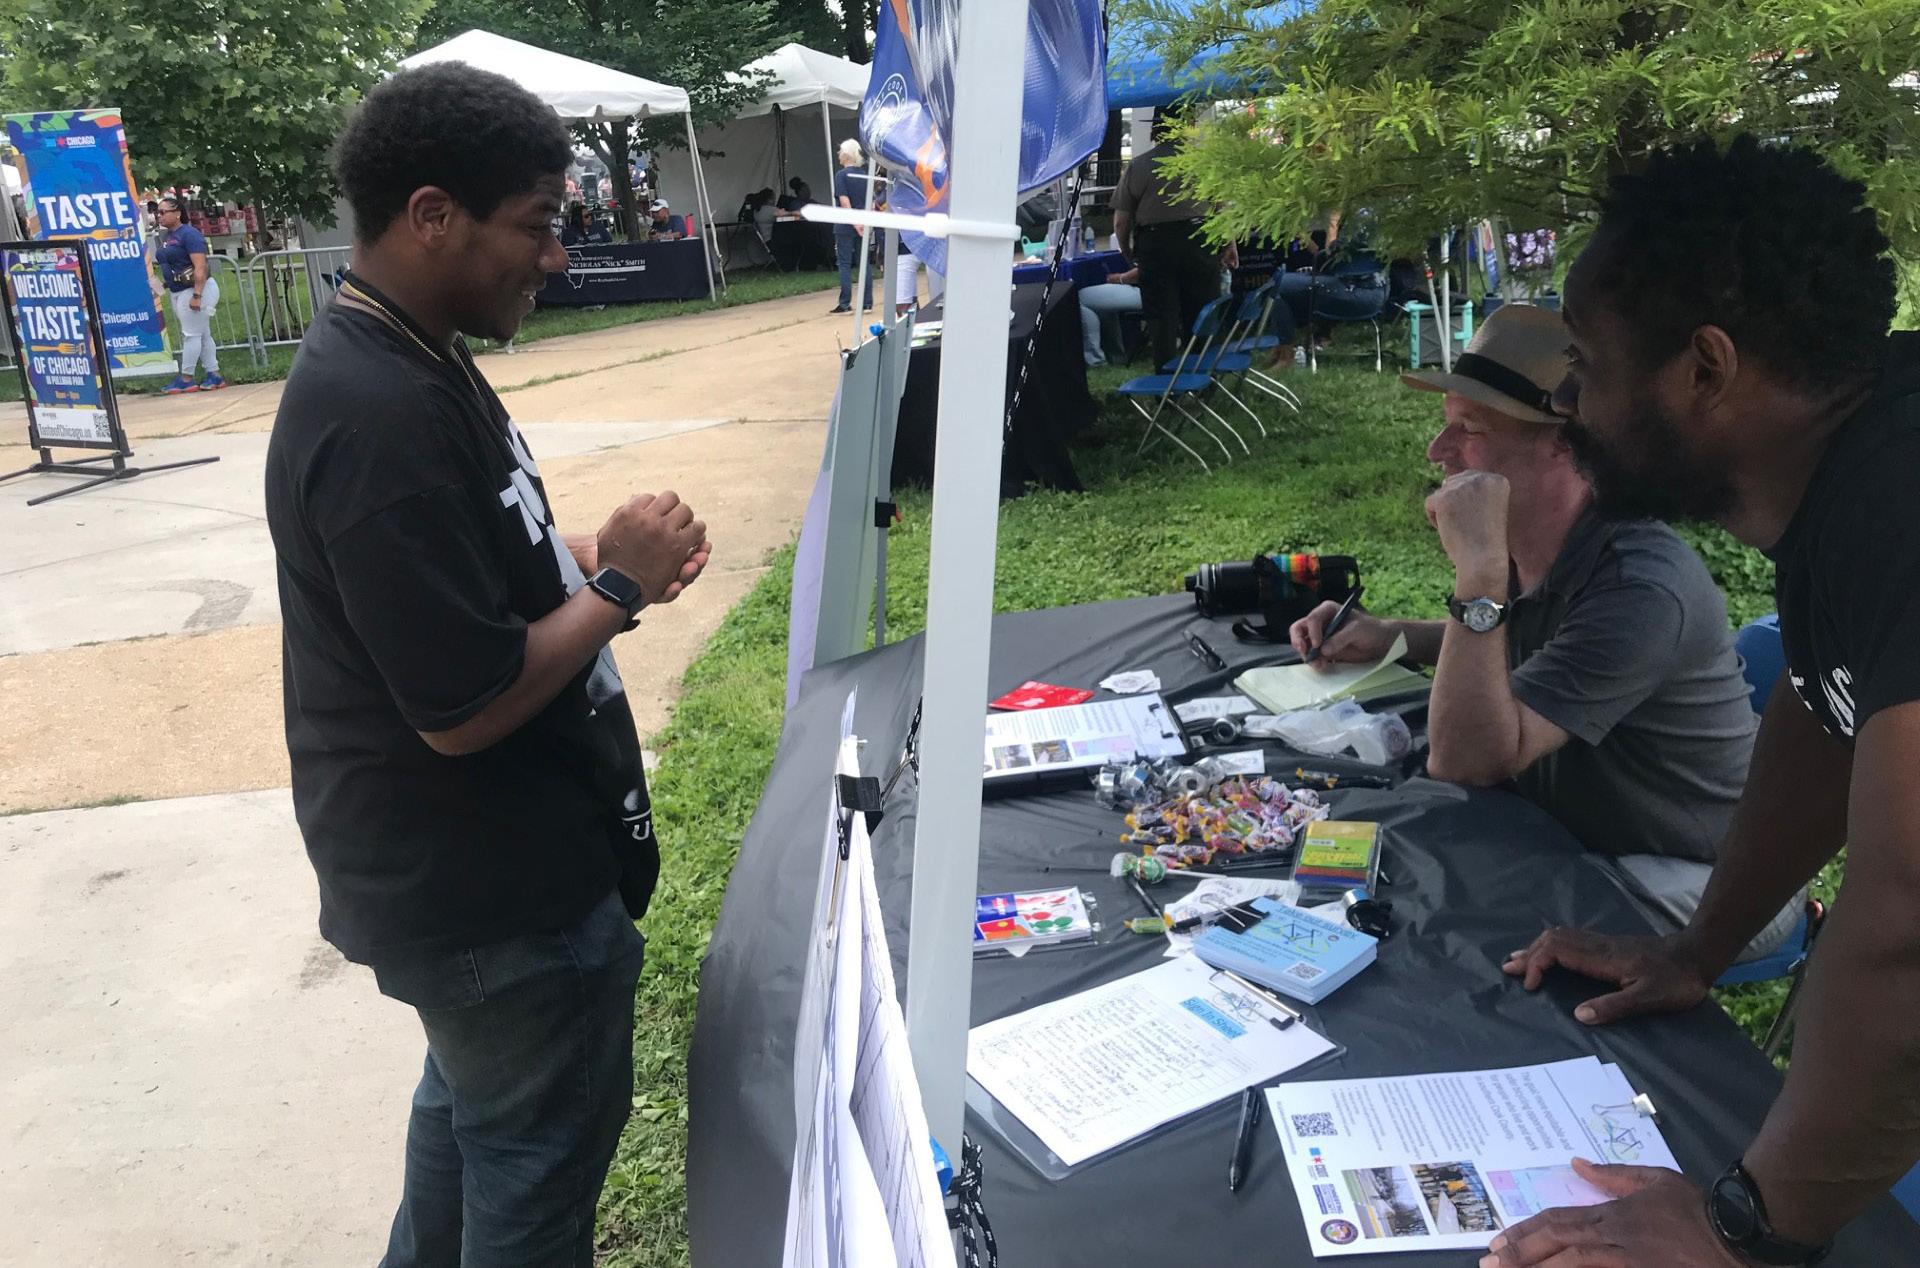
CCDOTH booth at the Taste of Chicago Festival in Pullman Park
Getting the Word Out Digital Connections
The Lake Calumet Bicycle Network Study is a community-led process that brings together neighborhood residents, businesses, community groups, and public agencies. Community input and perspectives, such as their travel experiences when biking and knowledge of the study area environment, provide invaluable information to understanding systemic challenges to active mobility and identifying potential opportunities to improve the bicycle network.
This report captures recent communications and public engagement activities to date. It provides an overview of outreach efforts that resulted in a robust dialogue between Cook County, the project team, and local community members. Given the expanse of the study area, this comprehensive effort applied various methods to communicate and engage a diverse set of organizations, political officials, advocates, and other members of the public about the study.
Importantly, the combination of in-person, virtual, website and social media activities enabled Cook County and the project team to collect invaluable input on existing and potential challenges and opportunities to active living and mobility in and around the study area.
Social Media
Various news and social media platforms were contacted prior to, and during the engagement activities. This allowed for larger exposure and marketing to the larger community. These efforts helped get the word out about the project as well as informed social media followers and subscribers about upcoming events.
Digital Toolkit
A digital toolkit was developed and distributed to stakeholder members and general public via the project website.
This toolkit helped promote the Lake Calumet Bike Network Study through proposed web content and social media. The toolkit provided both ready-to-go content as well as tips for creating individual content.
Public and stakeholder members can use these tips and resources on both personal and organizational social media accounts. This also enabled people to share this toolkit with other partner organizations and advocates of active transportation.
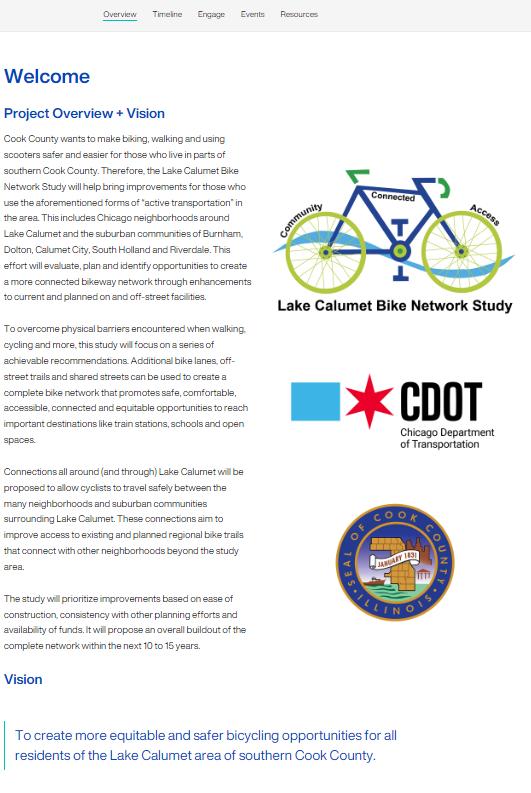
Project Website
A project website was developed for the general public to receive project information and status updates, timeline of events, related documents and studies, and project team contact information. The website also contained an interactive map to enable comments and suggestions on potential improvements within the study and a survey to gather information from those who live, work, and play in the study area.
Website
A website built on the ESRI StoryMap platform was developed to house all project-related information to the general public. The website is made available on its own dedicated web page and linked to the Cook County website. The website link was also made available to other social media sources and partner agencies.
The website included the following:
• Project Overview (Purpose)
• Vision and Mission Statement
• Timeline
• Survey
• Interactive Comment Map
• Event Information
• Subcription Opportunity
• Contact Information
• Available Resources and Related Documentation (e.g., Cook County Bike Plan, Digital Toolkit)
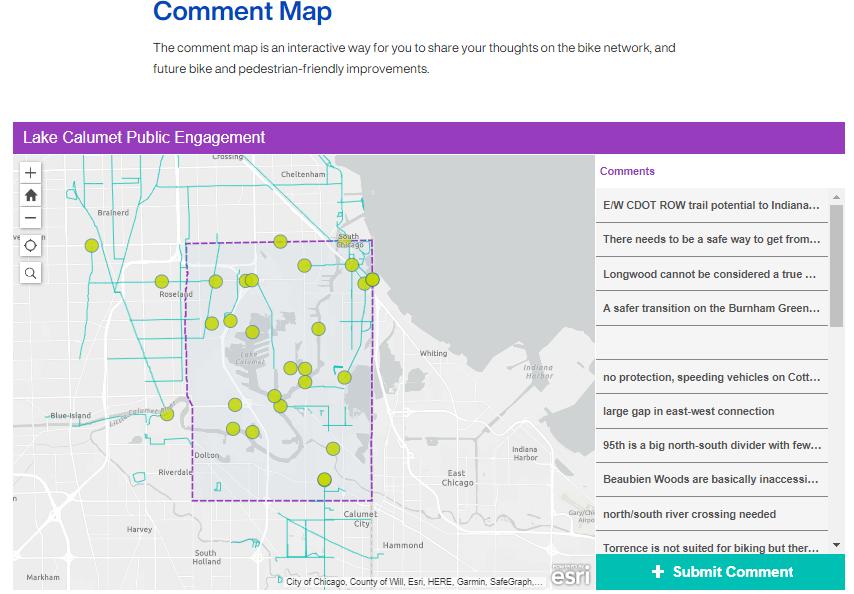
Interactive Comment Map
To complement the survey, an interactive comment map was created to allow community members to identify specific geographic areas of concern or improvement.
The input from the community allows the Cook County and project team members will support the development of potential infrastructure improvements to address notable barriers and opportunities.
Some key takeaways include the overarching need for infrastructure along key streets and intersections to create safer, priority space for vulnerable roadways, essentially for those not in a car or bus. Other comments included the strong desire for more east-west connectivity in the study, which essentially does not exist to an adequate degree of safety, connectivity, and accessibility for people of all abilities.
Flyers
The project team compiled a comprehensive list of community groups and organizations, public agencies and departments, political officials, and media outlets. Those on the listserv were contacted via email with digital flyers for all community inperson and virtual open house events. These flyers were distributed prior to each meeting and included all the detailed information on the location, timing, meeting purpose, and links to the website.
Image Source: Rudd Resources
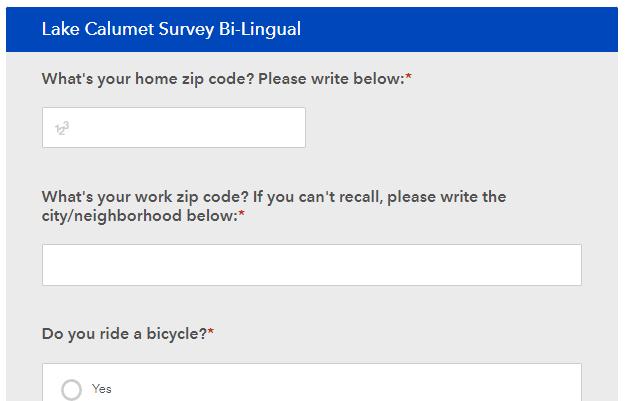
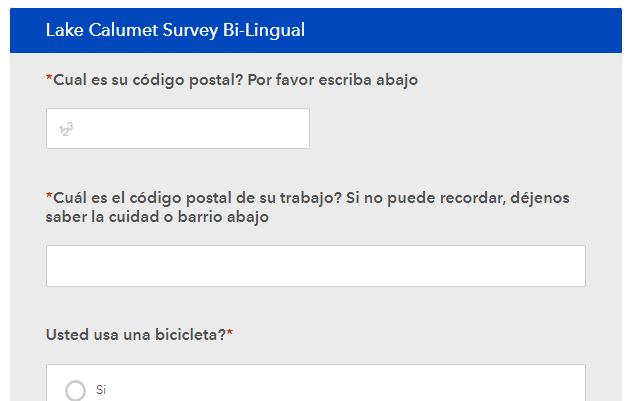
Survey
A bilingual survey (English and Spanish) was developed to gain insight into community member’s experience traveling in and around the Lake Calumet area. The survey also inquired about their mobility interests, key destinations, evident barriers, and their general thoughts about ways to improve biking and active transportation in the area. At the time of publication, 52 people completed the survey.
Of the 52 respondents who answered questions about whether they ride a bicycle, 49 (94%) stated they ride a bicycle and 3 (6%) do not. Of those who do ride a bicycle, nearly all ride their bicycle for recreation (92%).
Do You Ride a Bicycle?
Why Do You Ride a Bicycle?
When asked what would encourage people to ride a bicycle more, respondents were allowed to select all answers that were applicable. Most common responses were to travel on routes separated from automobile traffic (82%) or ride on designated routes (76%). Remaining responses included reducing feelings of danger (53%), slower traffic (49%), and having more secure places to ride (43%).
Survey respondents were asked about their current modes of transportation and their preferred modes of transportation. If provided with better options, 37% of respondents would prefer to drive less, 17% would prefer to bicycle more, and 13% would walk more. Bus ridership would stay close to existing levels (2% of respondents would use the bus), and 6% of respondents would ride the train less often.
What Encourages You to Bike More?
Barriers to Bicycling
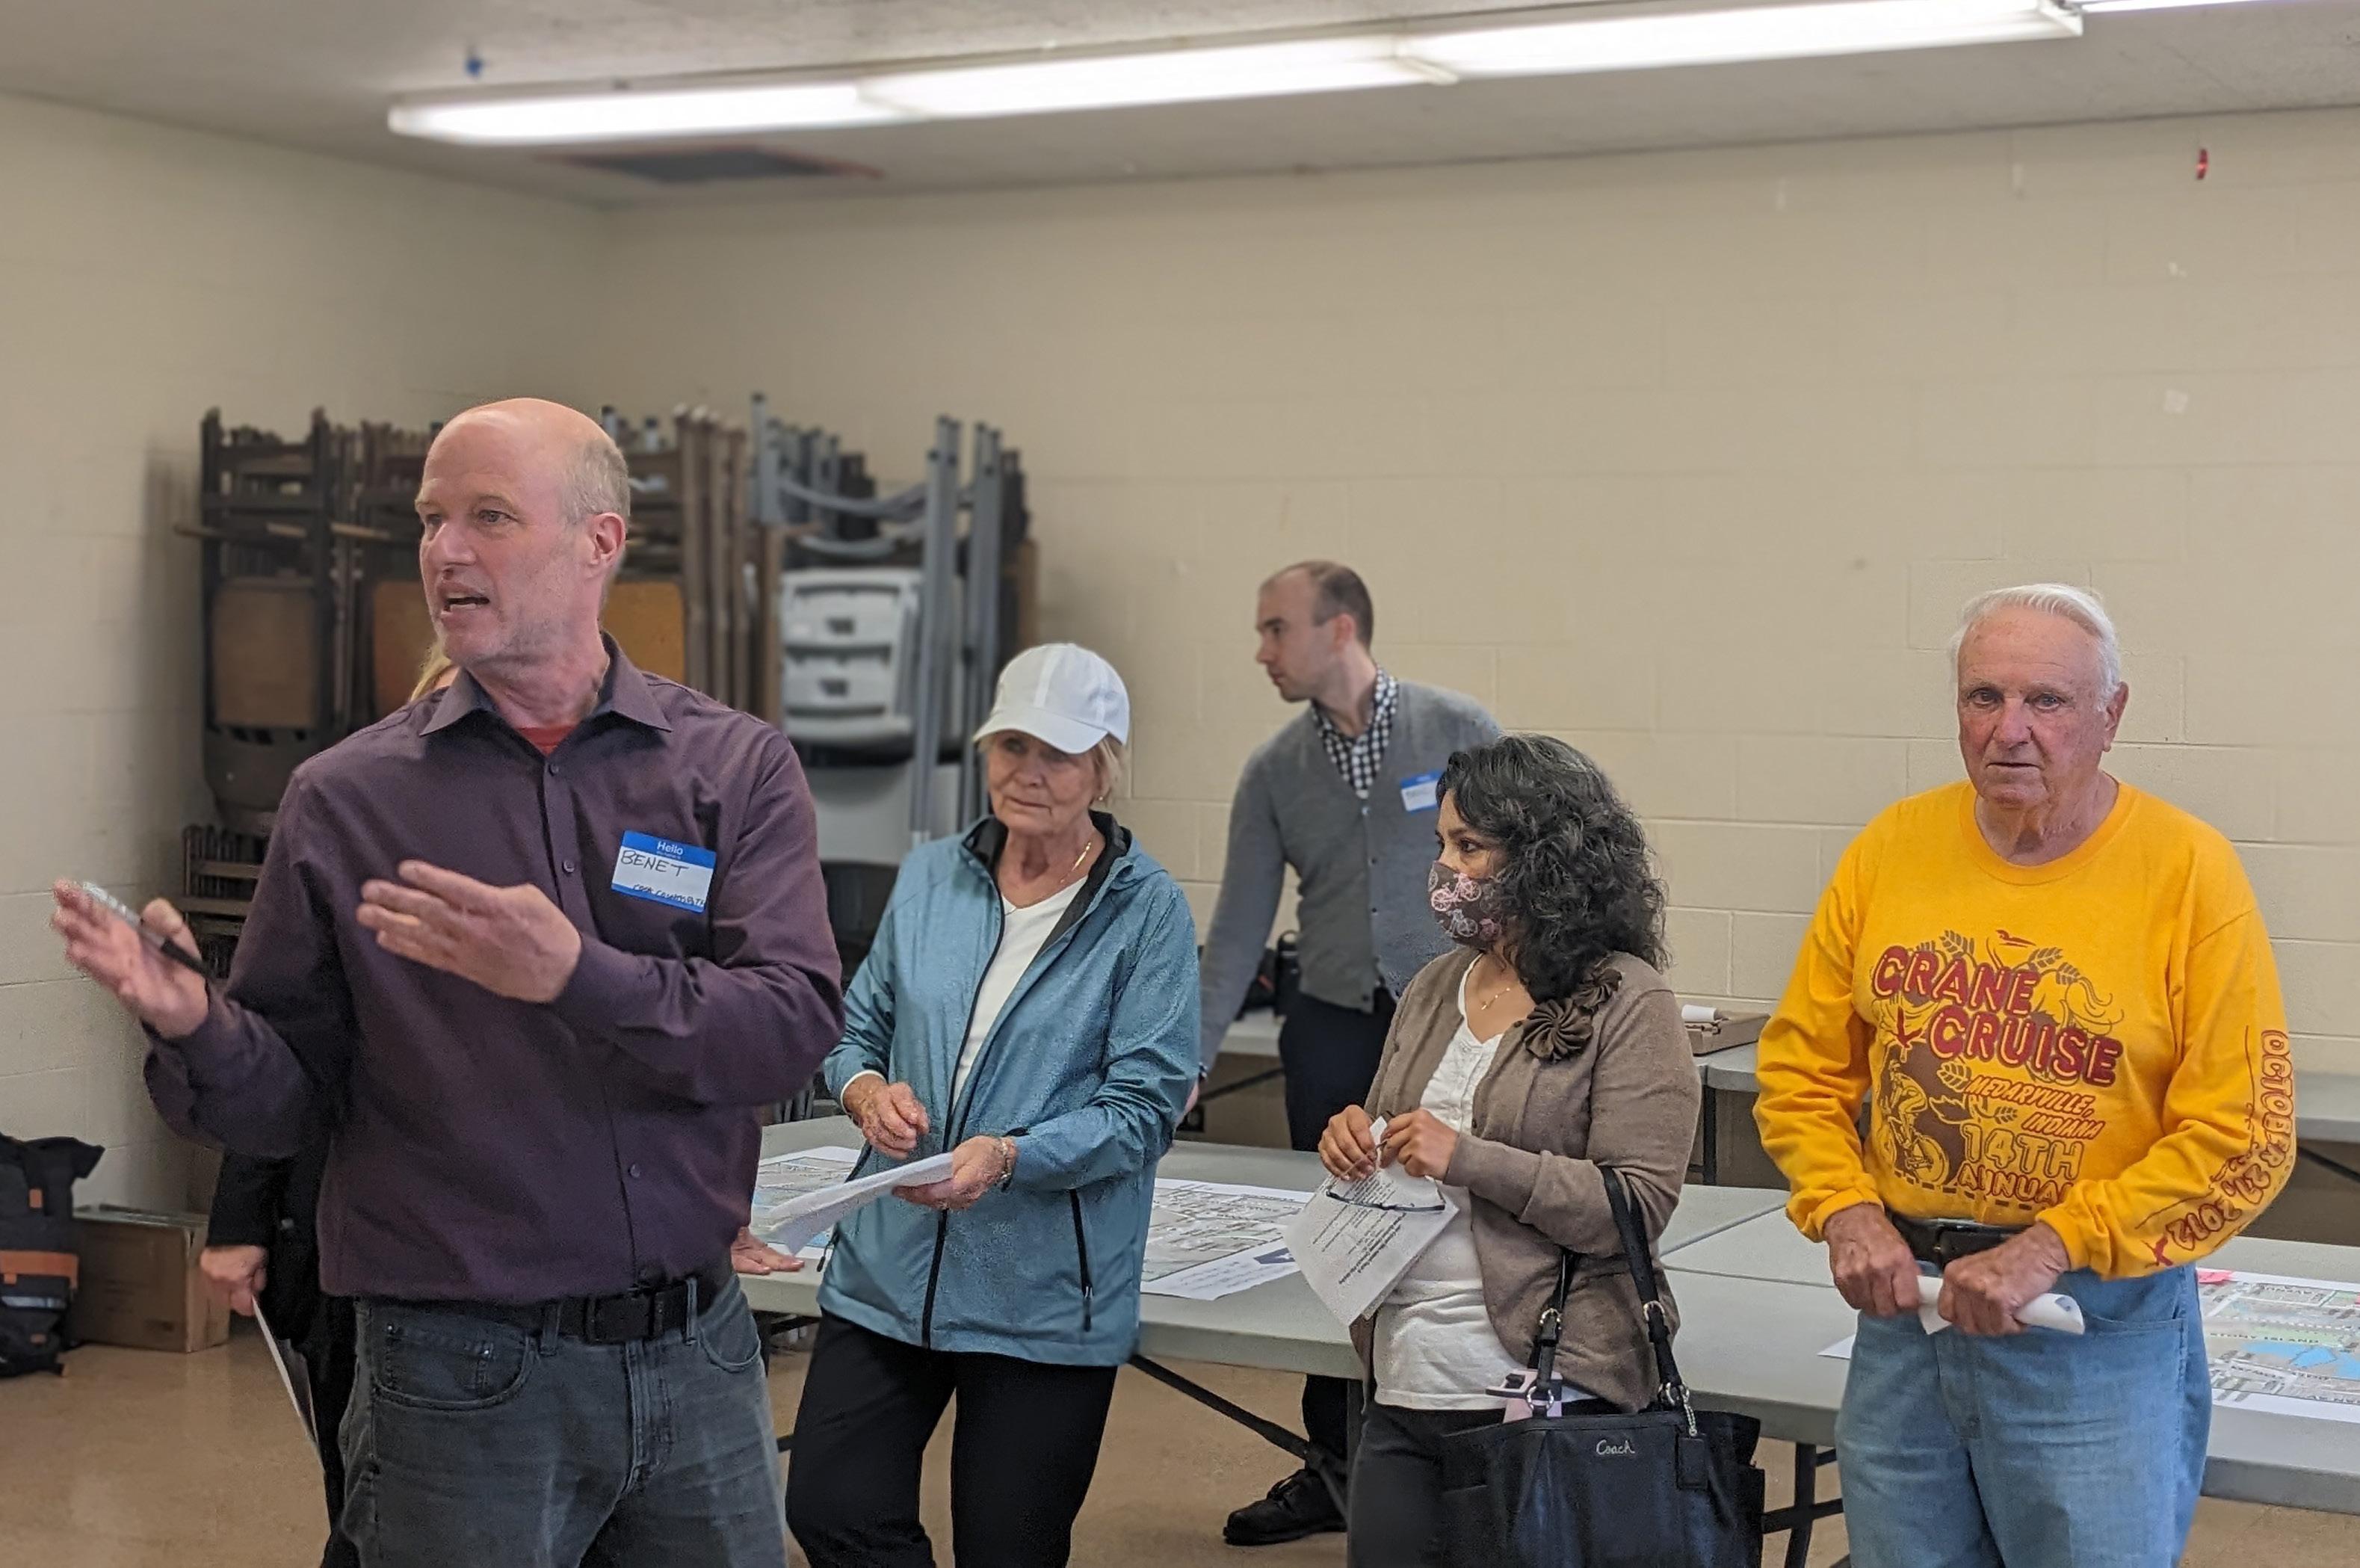
Open House Events
When I See People Biking in My Community, I Think...
“It’s a sign of community health!” “Hope they are safe, it can be dangerous”
“One less car”
“How fit they are!” “It brings joy”
“I would like to join them!”
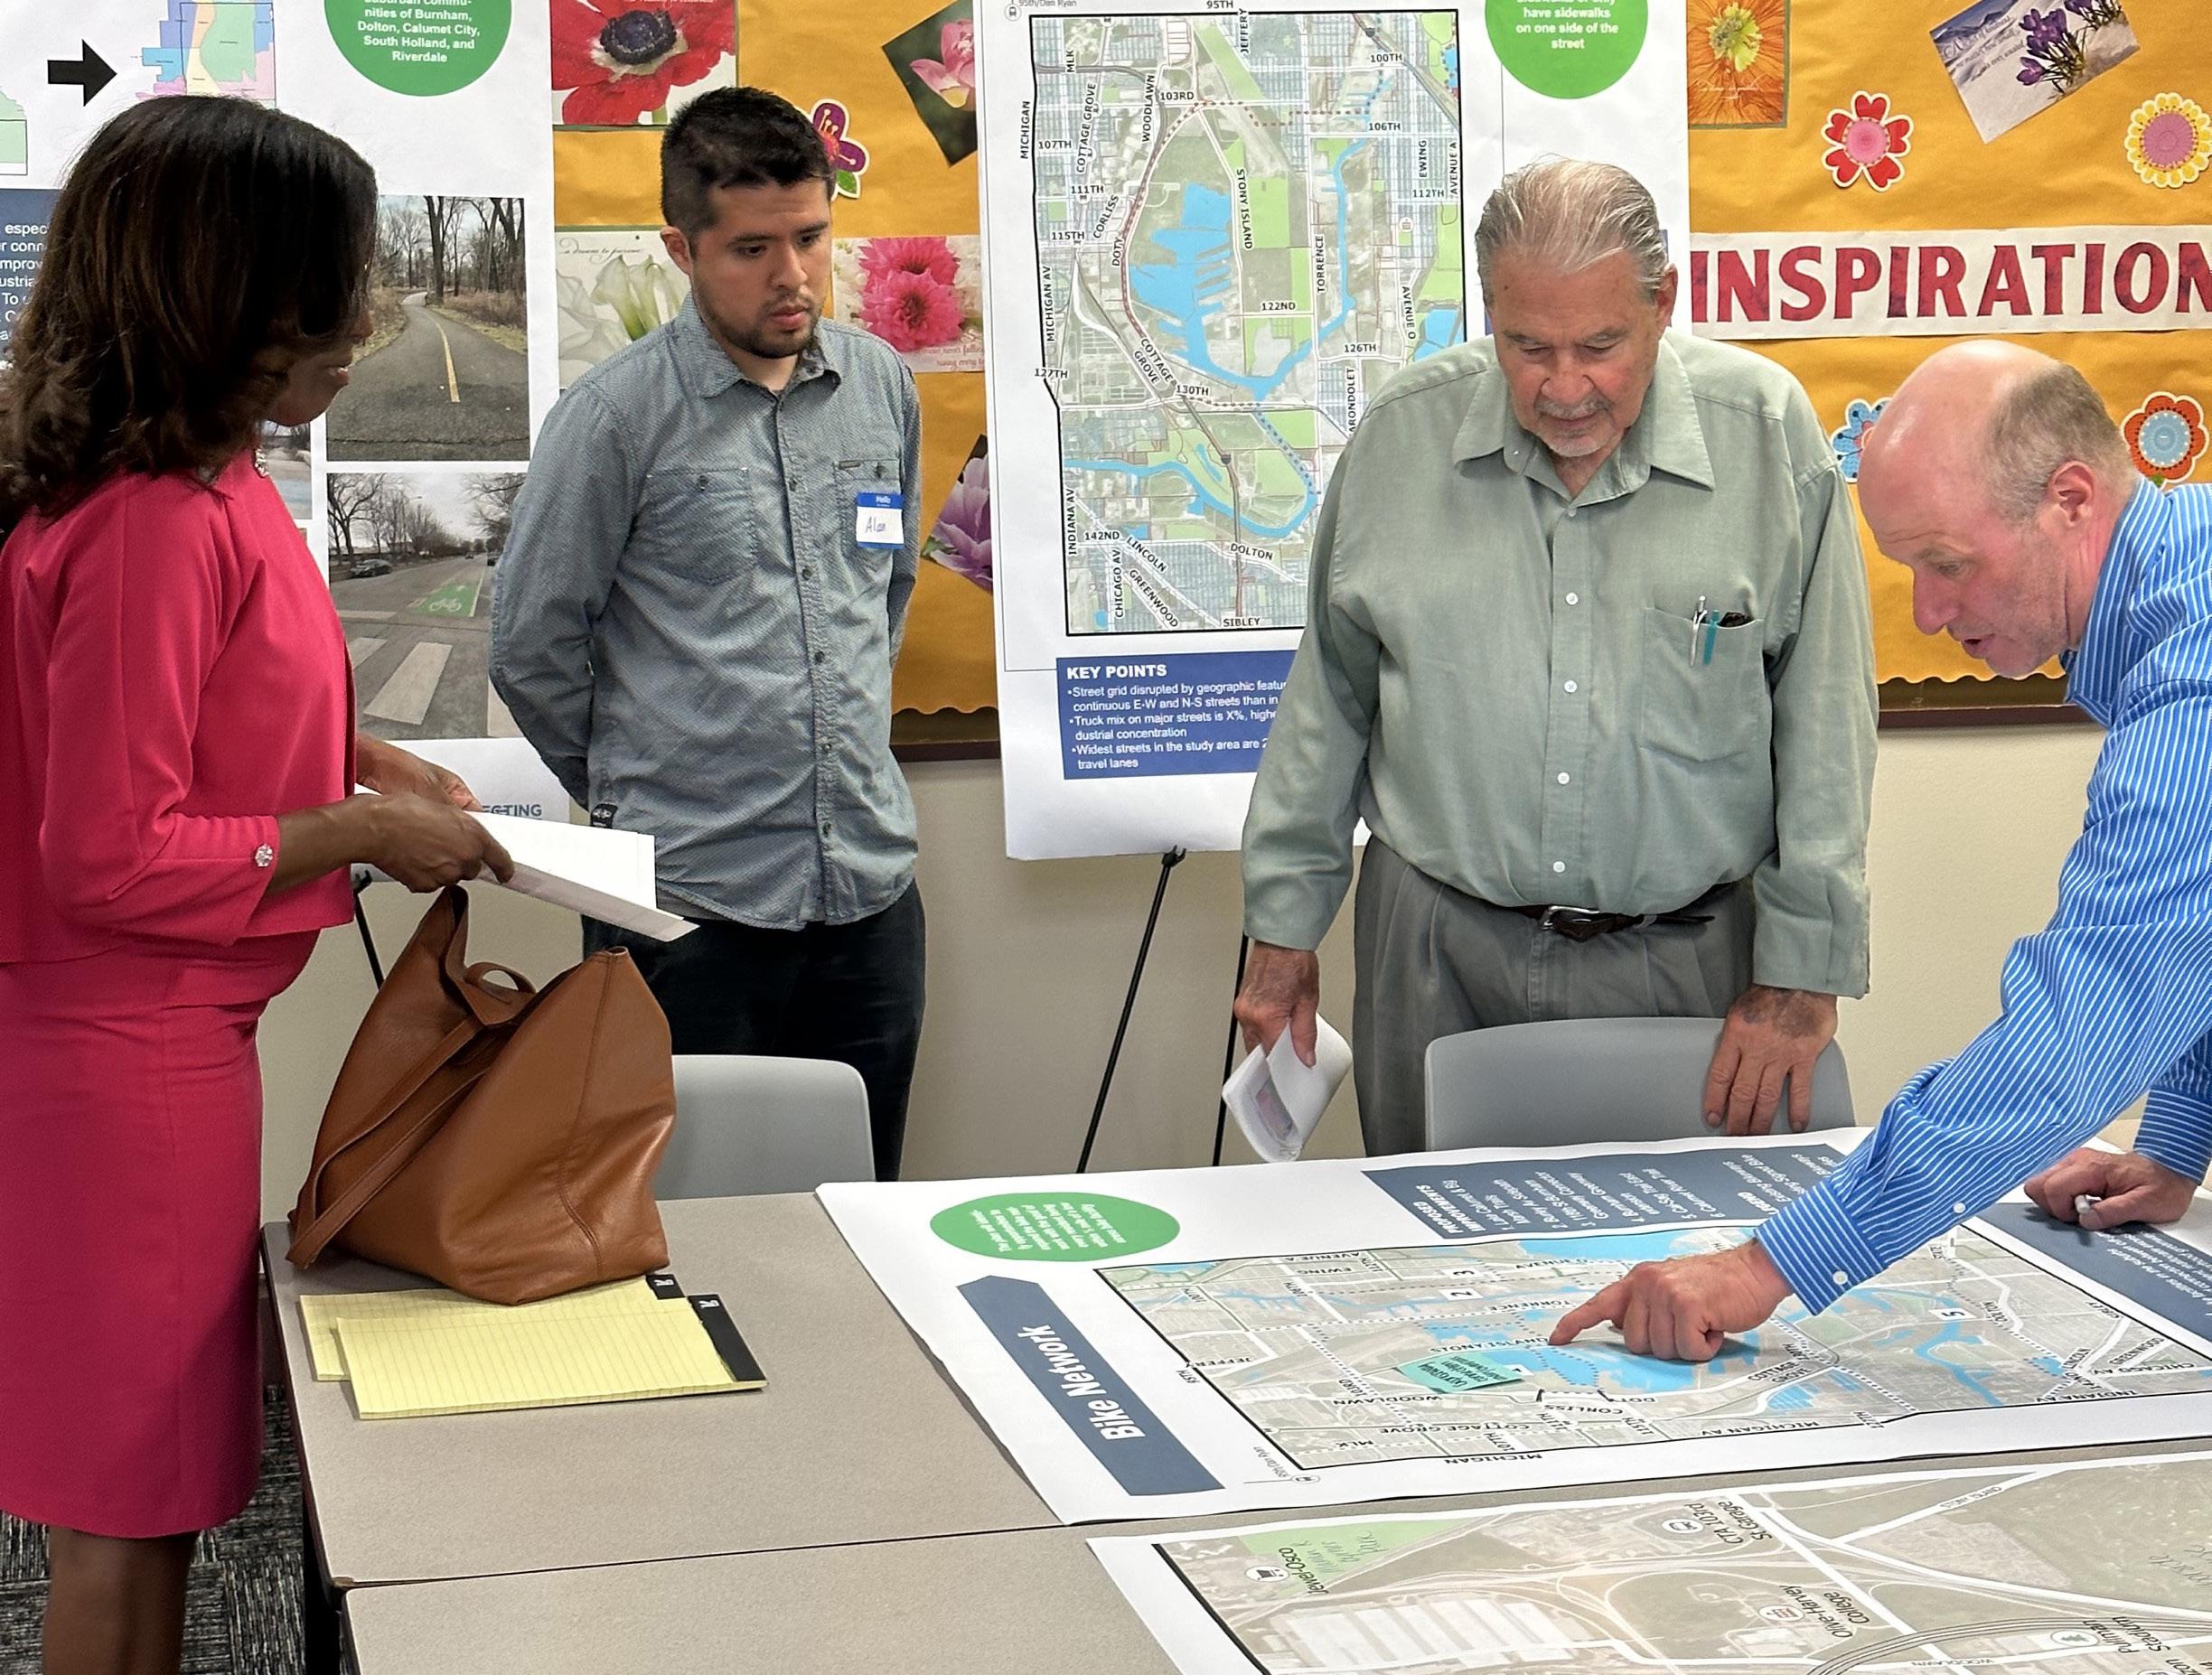
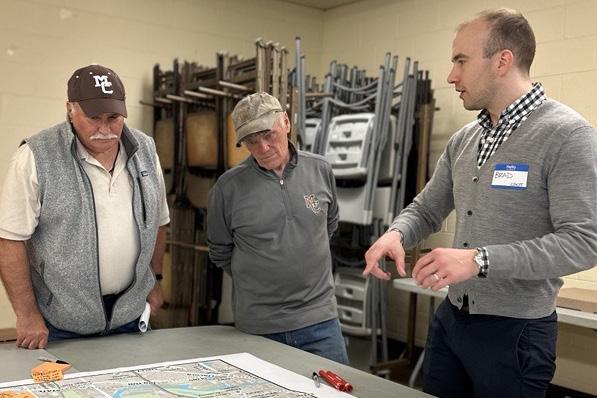
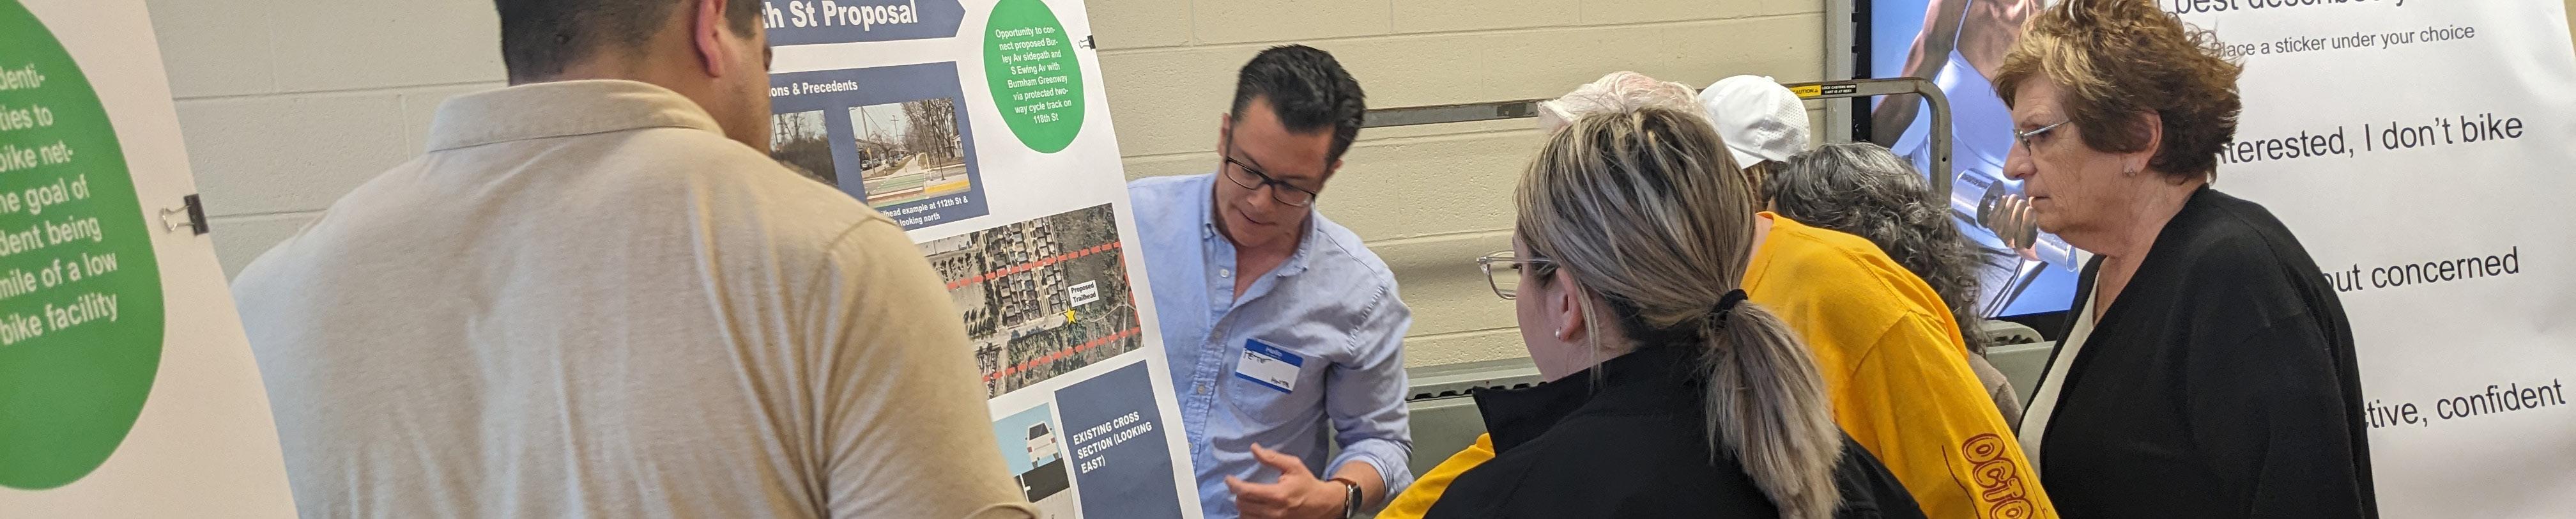
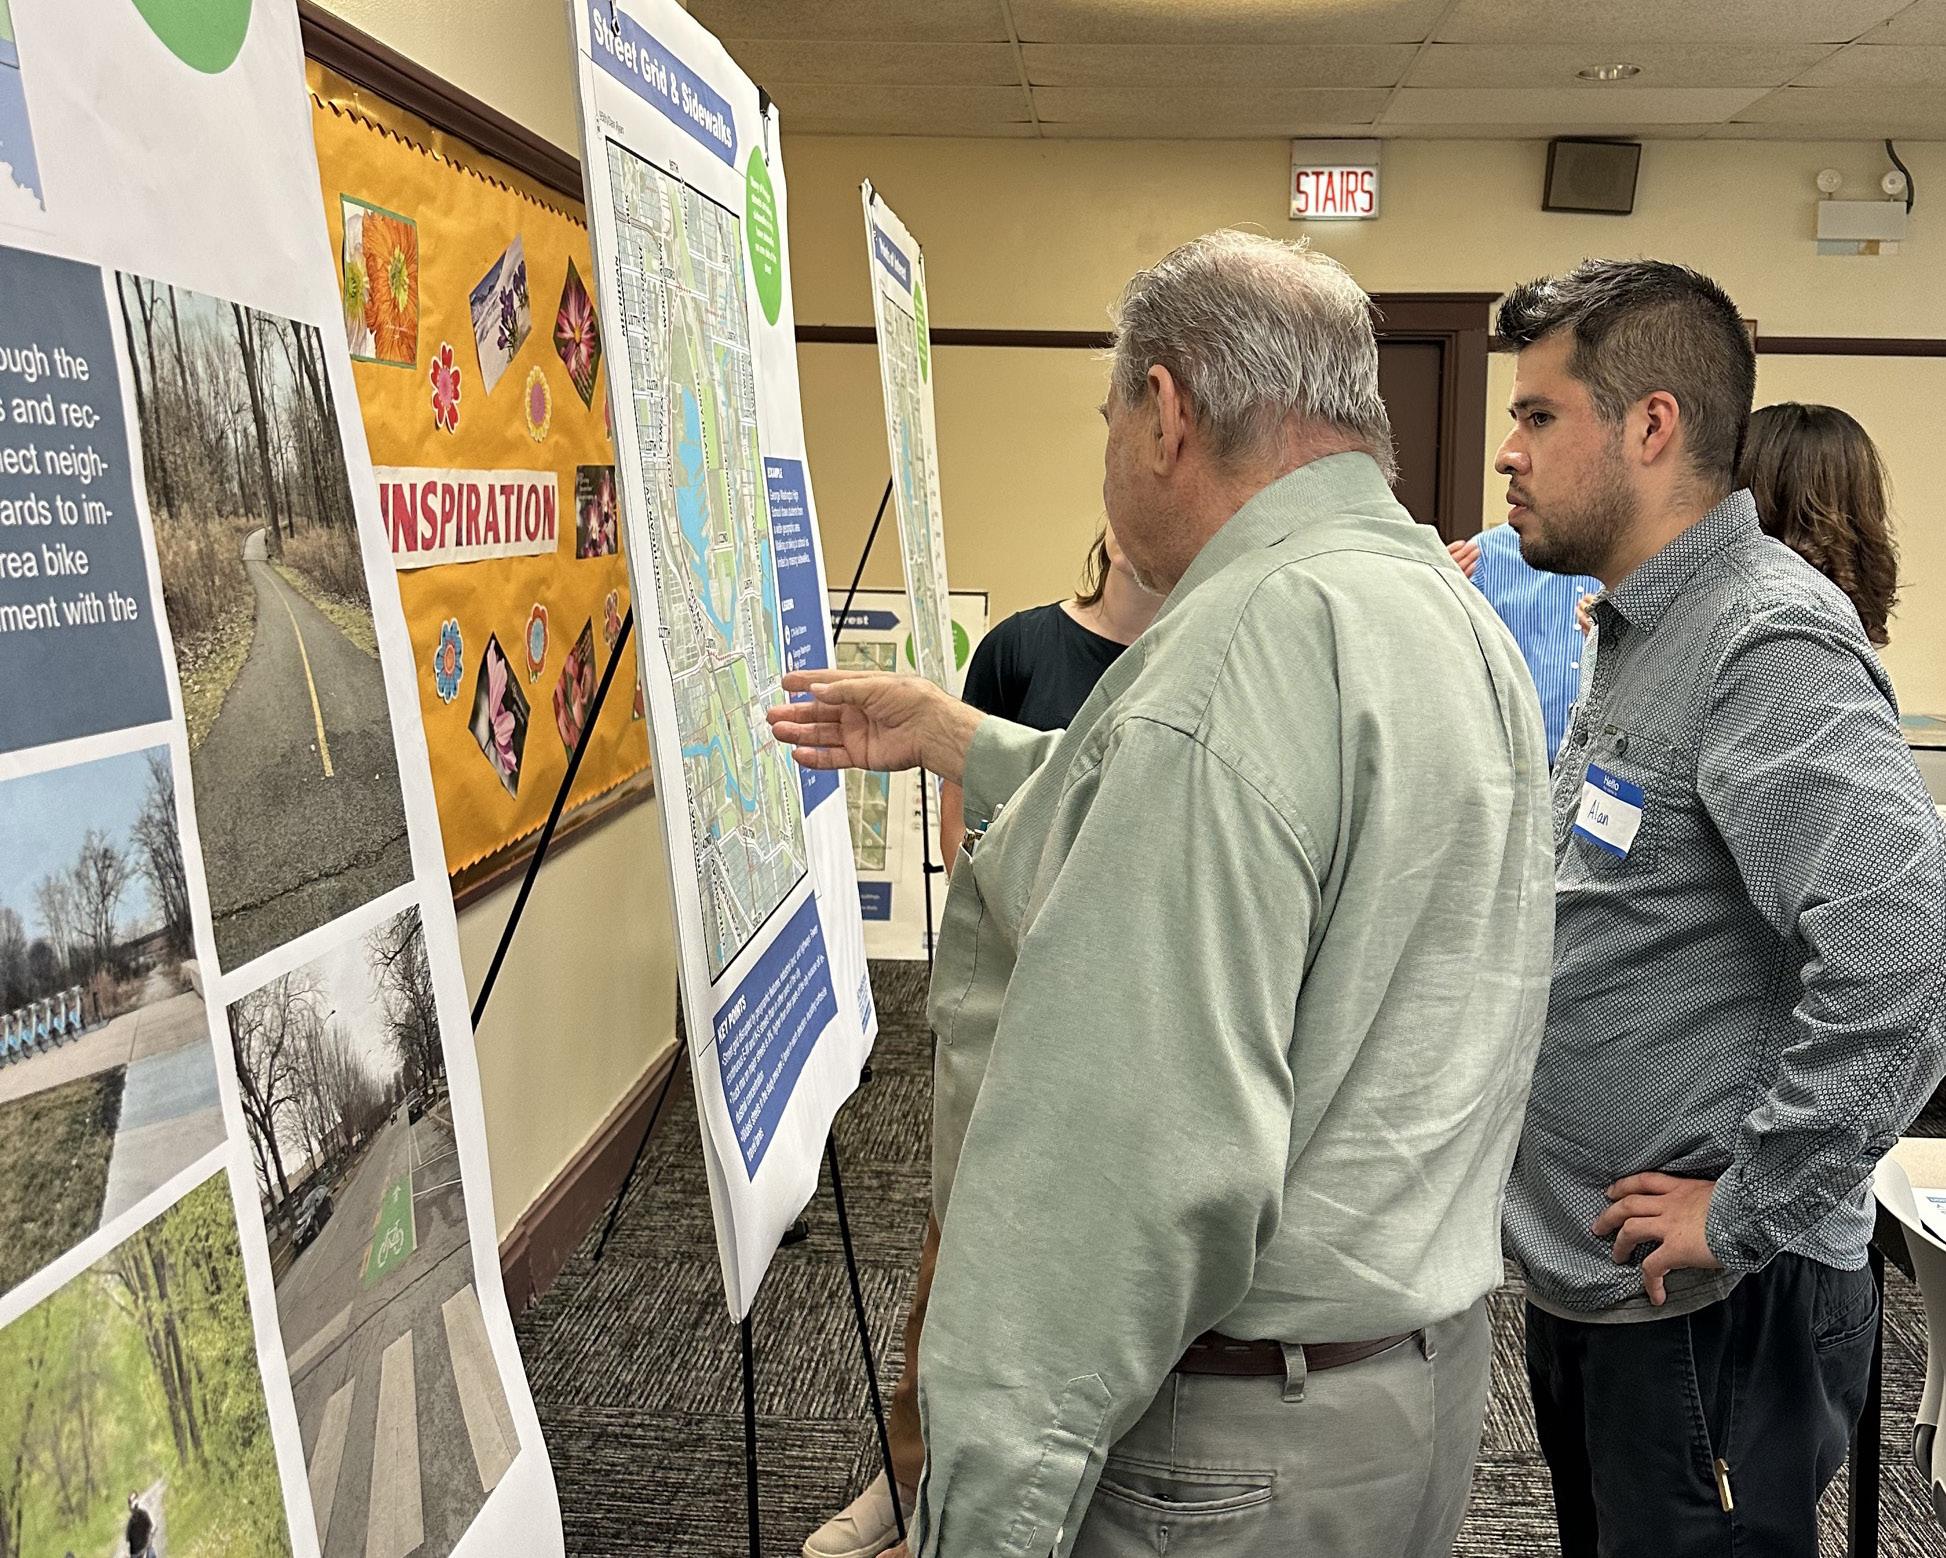
To date, four open house meetings have been hosted by Cook County and project team members. Attendees were notified from a direct email invitation and are active members in their communities which sparked their personal interest to learn about the Lake Calumet Bike Network Study. Community input was collected via open discussion, posted notes, and written comments.
Open House #1: Rowan Park, Chicago’s 10th Ward
The meeting took place on Thursday, April 20, 5:30 to 7:00 PM at Rowan Park, 11546 S. Avenue L in Chicago. Over 20 participants came to the meeting.
Key Takeaways:
• Major challenges: freight and truck traffic, motorists not obeying signs, broken lights along Burnham Greenway Trail
• Prioritize adding more protected bike lanes and making bike lanes already in the study area protected bikeways
• Connect existing bike lanes with each other in a safer manner for cyclists and considering the amount of vehicular traffic in the area
• Enhance the street infrastructure to enhance safety on neighborhood streets such as installing more bike racks, adding more lighting and reducing speed of cars
• Connect Burnham Greenway to Avenue O
• Add more bike lanes along 116th and 118th streets
• Add bike bridges similar to downtown
“Regional Bike trails are the most important destination for me”
“I live in an industrial area that has a lot of traffic and causes a barrier for me to get around”
“Some of my favorite places to go are Calumet Park, Wolf Lake, and William Powers Conservation Area”
Image Source: Rudd Resources
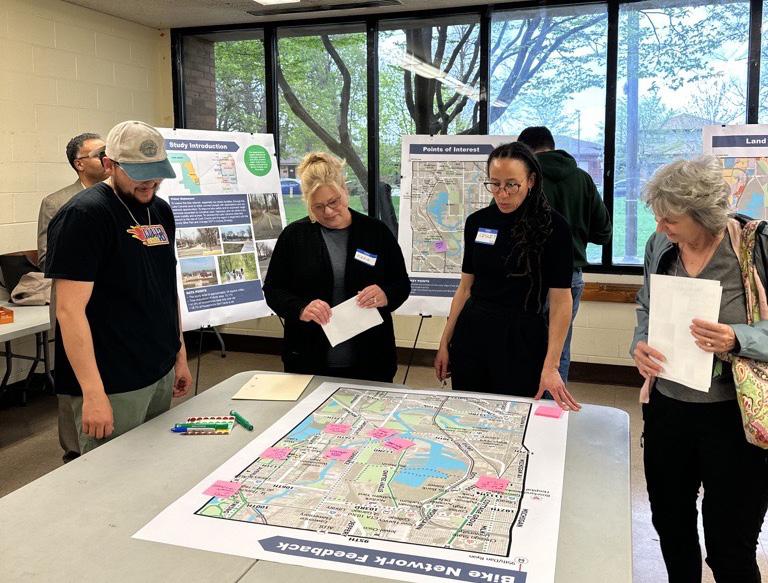
Open House #2 & #3: Dolton Public Library (Village of Dolton) & Chicago Public Library (West Pullman Neighborhood)
Open House #2 took place on Wednesday, June 14, 5:30 to 7:00 PM at Dolton Park District Ember Room at 14700 Evers Streets in Dolton.
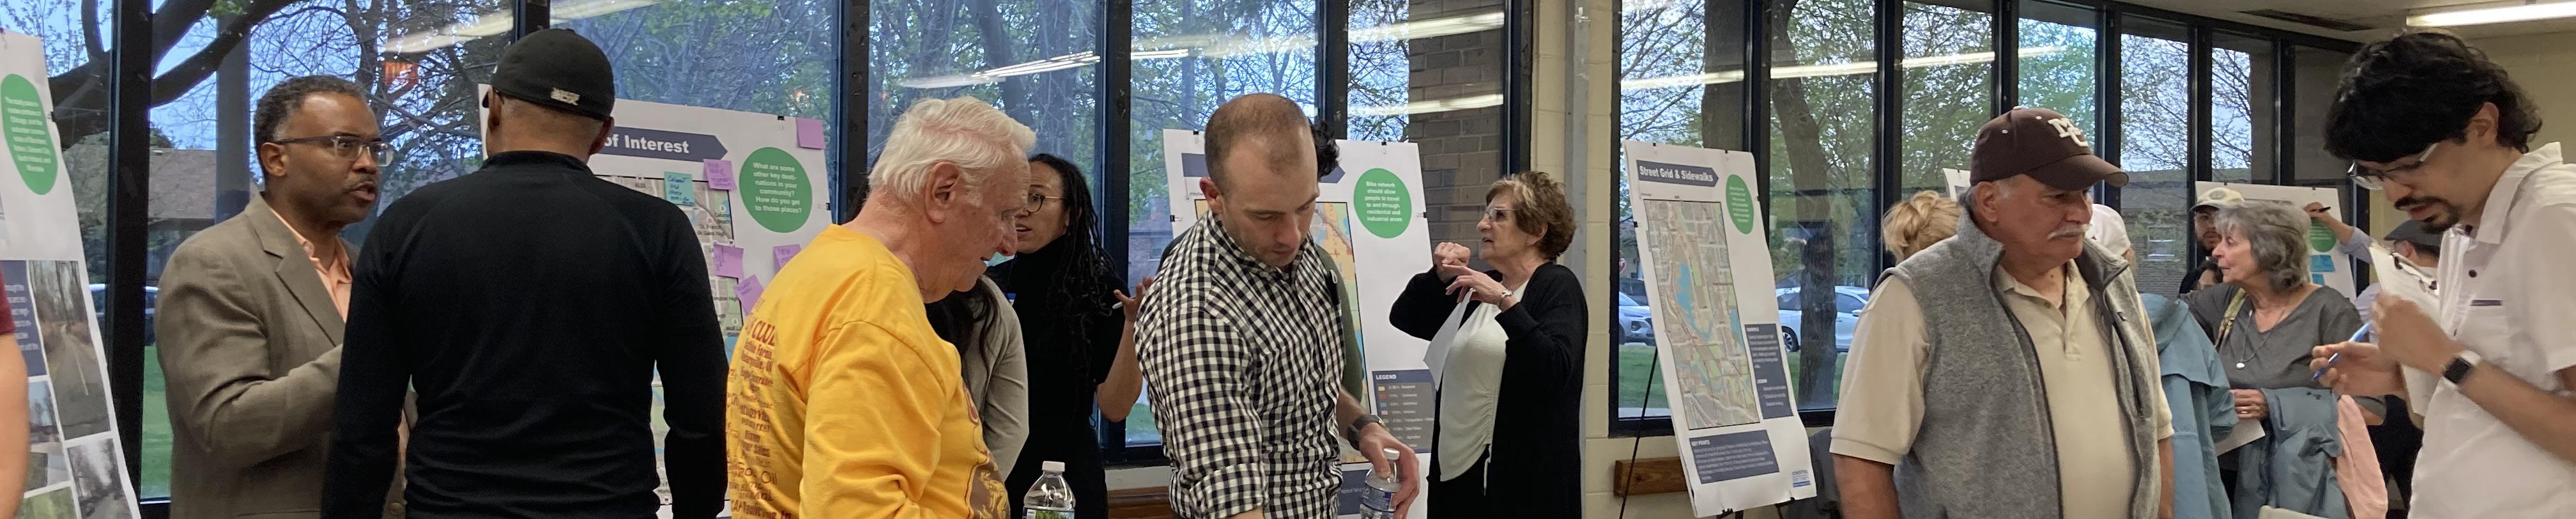
Open House #3 took place on Thursday June 15, 5:30 to 7:00 PM at the West Pullman Chicago Public Library at 11001 S. Indiana Avenue in Chicago. In total, seven (7) participants attended the meetings. Key takeaways include:
• Major challenges: 103rd between Cottage Grove and Woodlawn, frequent drag racing on Stony Island. 111th and 115th near S Doty Ave need safe crossing to go directly into Big Marsh. A bridge leading from Village of Burnham to Hegewisch on Torrence, Brainard between Avenue O and Torrence
• Finding a way to connect Hegewisch and Big Marsh on Torrence
• Add concrete barrier bike lanes on S Cottage Grove Ave between 95th and 115th
• Add protected bike lanes on MLK within the study area
• Connecting Pullman to Altgeld Gardens and Beaubien Woods
• Torrence bridge leading West on 130th needs improvements
• Connecting the Burnham Greenway south of 34th St
• Overall, more protected bike lanes were requested where there are existing bike lanes in the study area
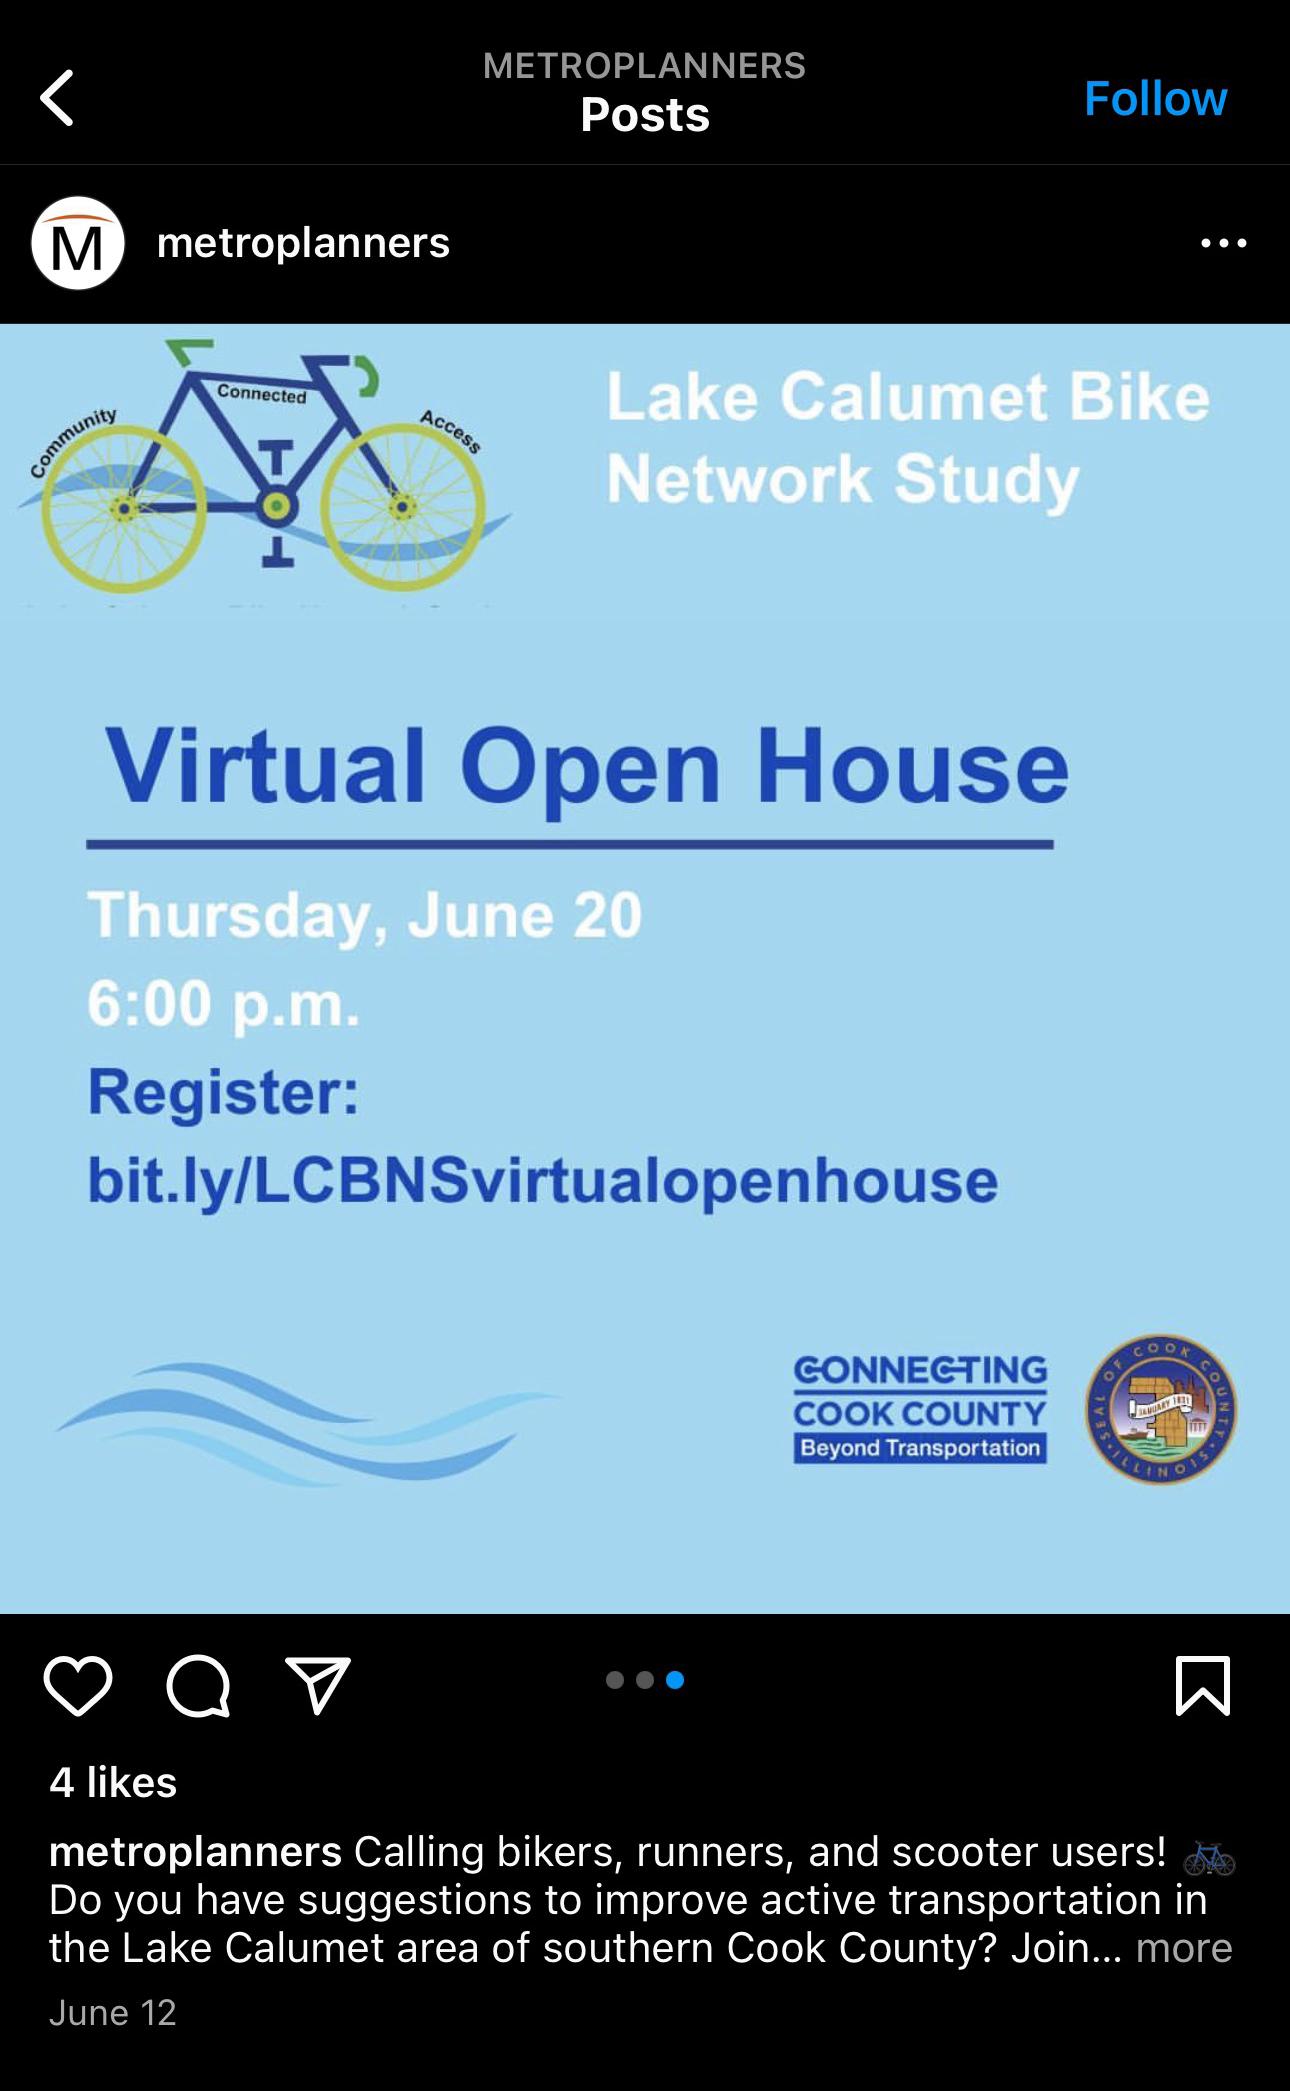
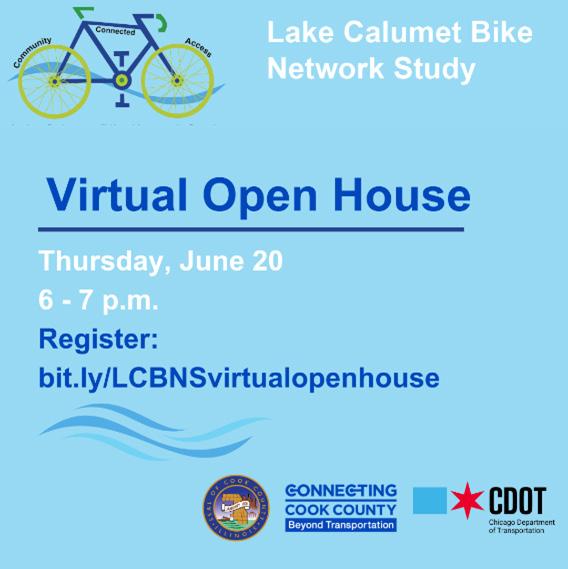
Open House #4: Virtual Open House
A virtual open house webinar was held on Tuesday, June 20 from 6:00 to 7:00 PM with four (4) participants in attendance. The meeting was hosted via Zoom platform and made available to the general public.
The virtual open house included an introduction of the project team, project overview and purpose, key tasks and timeline, and discussion about engagement activities and how the public can get involved in the process. Key takeaways include:
• Cottage Grove having high-speeding vehicles and the lack of protection for cyclists between 95th and 115th
• Connecting Pullman to Hegewisch considering that people may need this for work but may also need this to connect to other local points of interest (grocery stores, libraries, etc.)
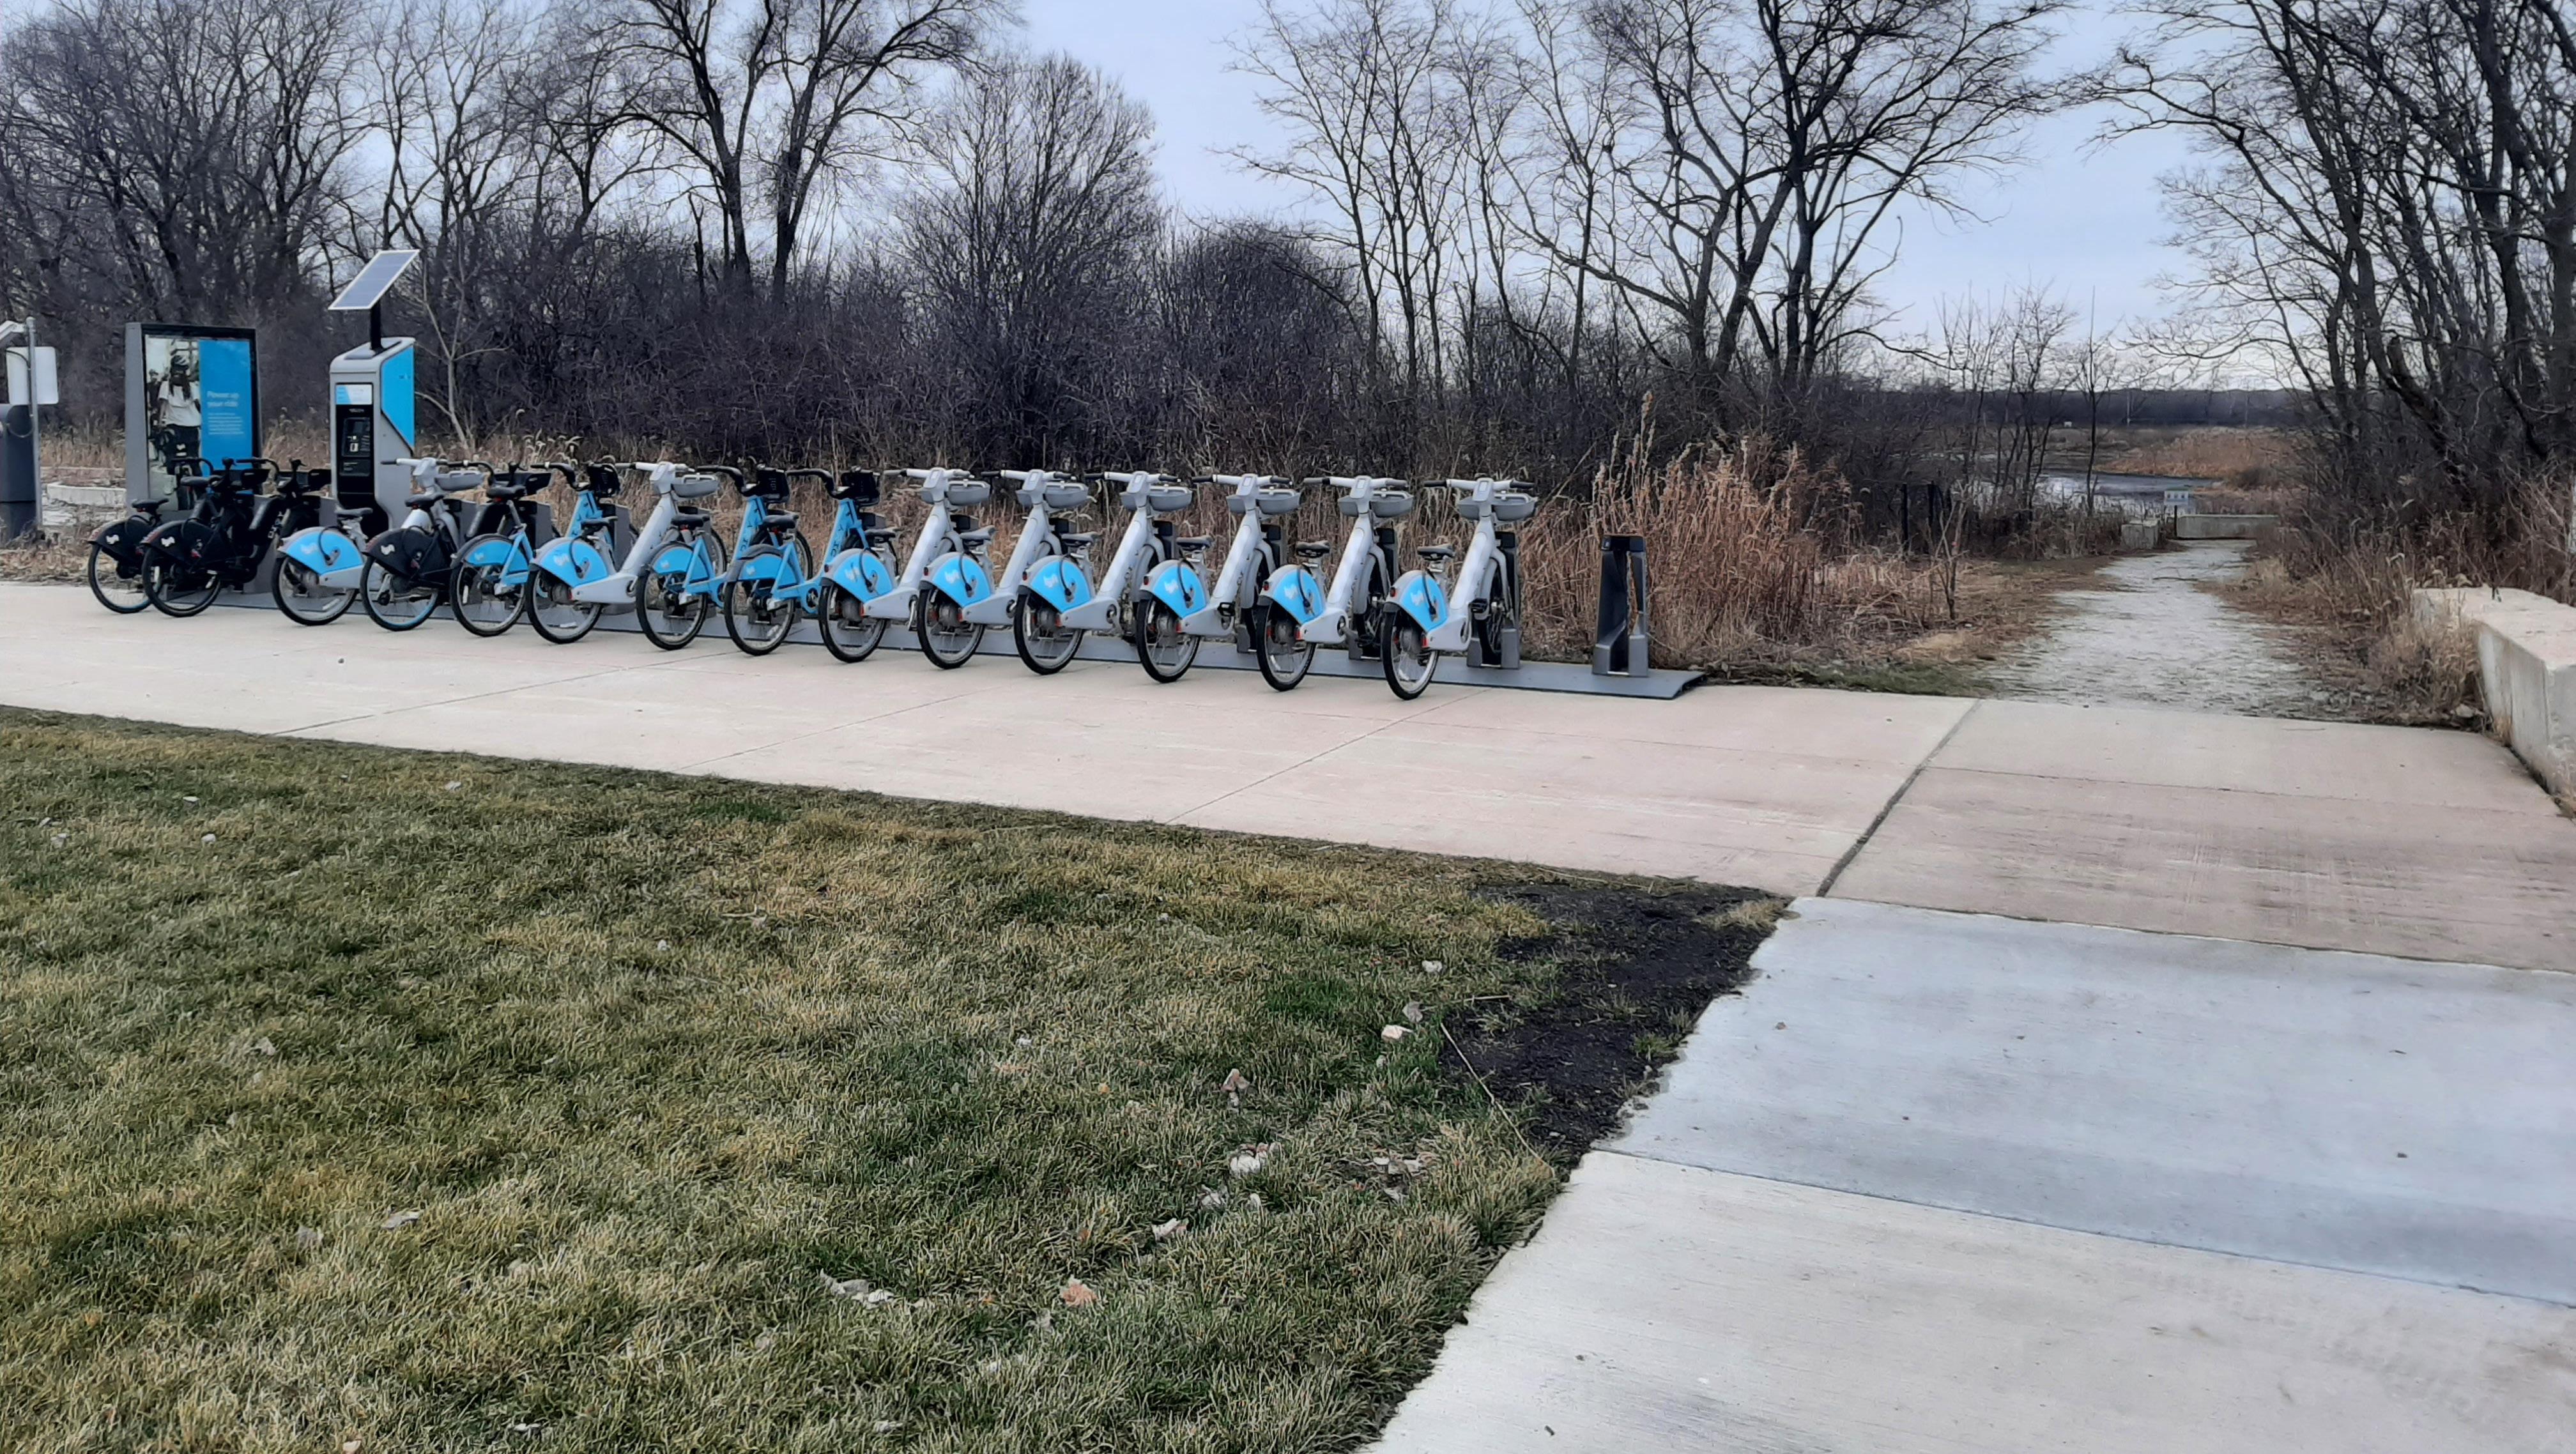
• The role Lyft and other bike share programs can play
Image Source: LJC
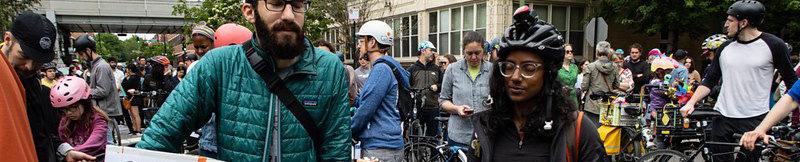
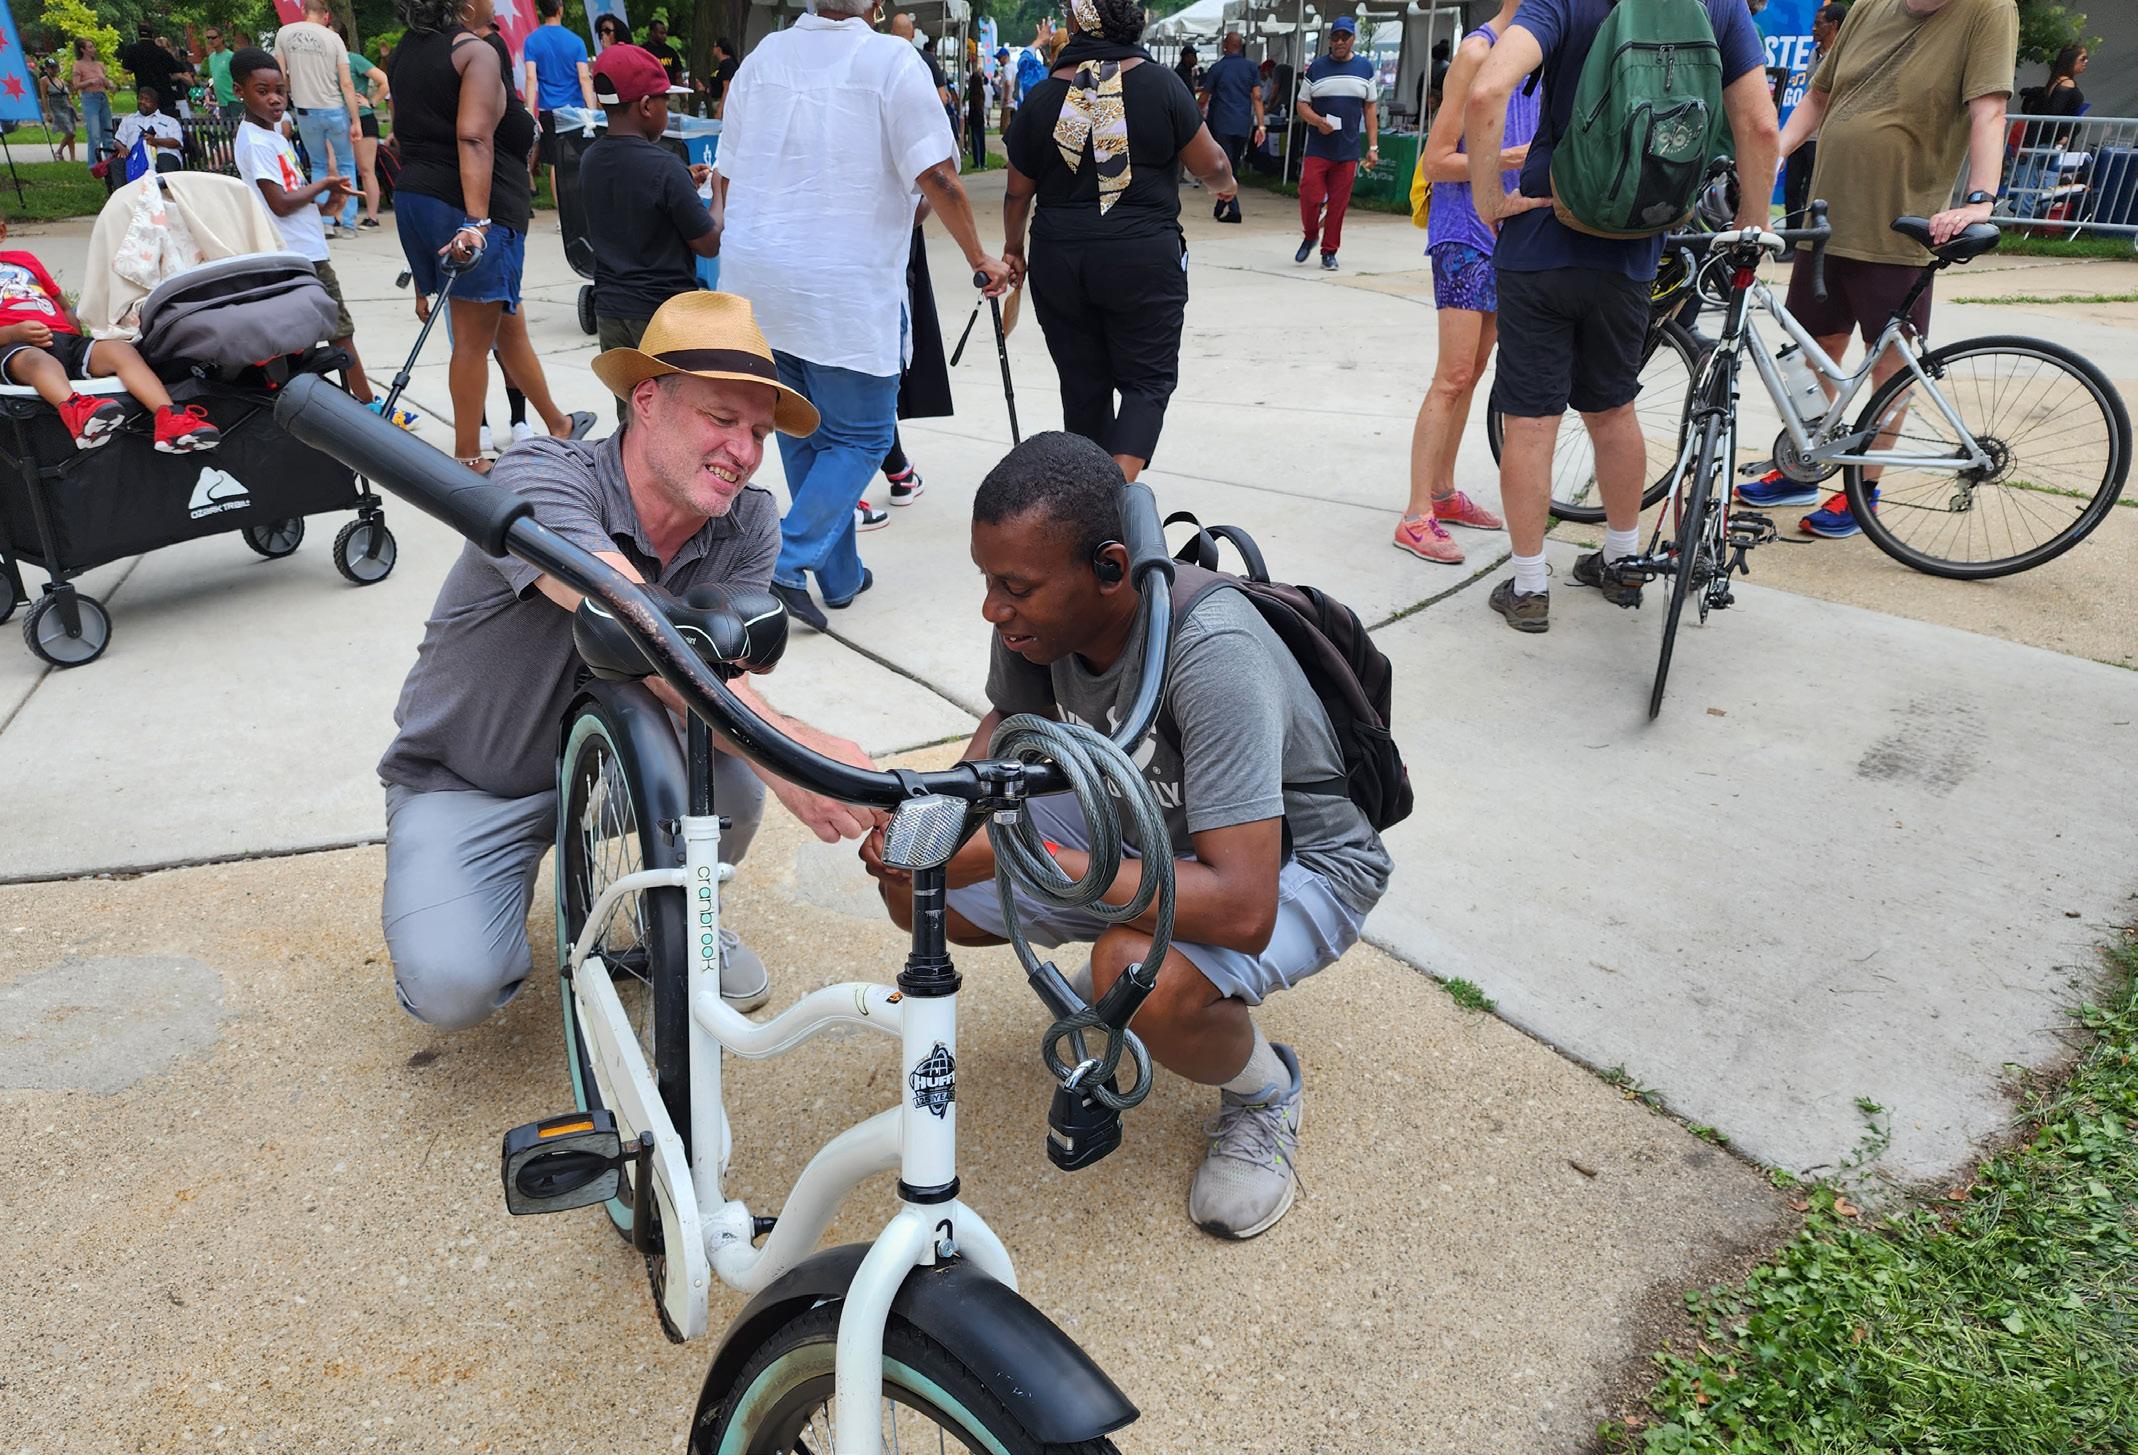
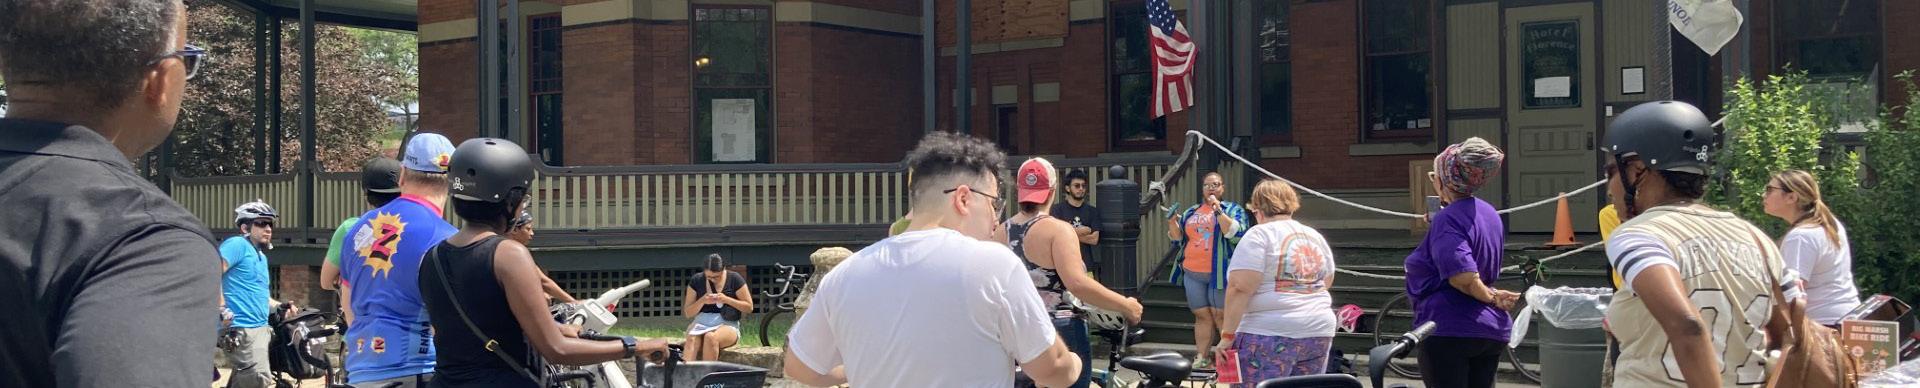
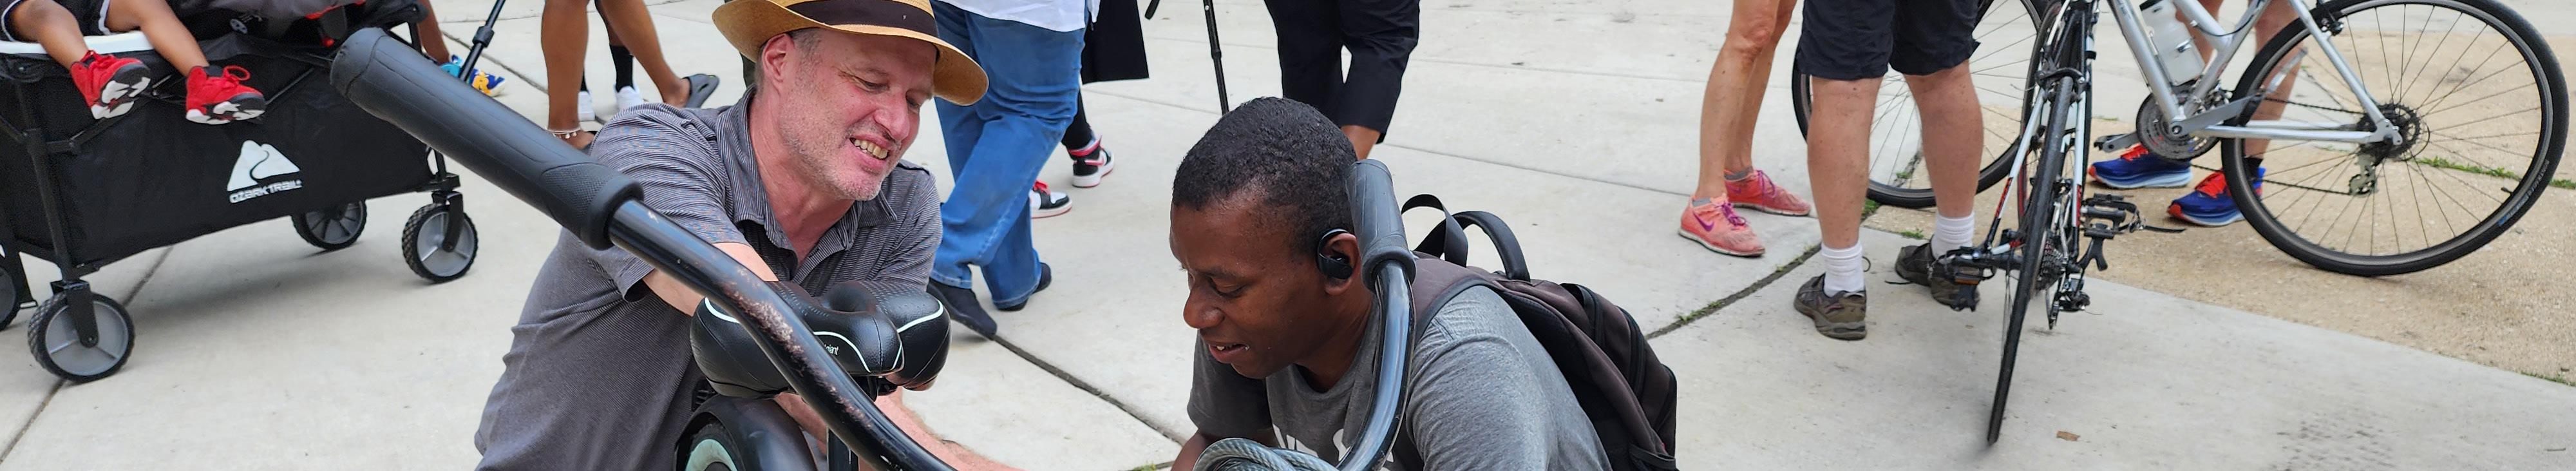
Pop-Up Events Focus Group
The pop-up events took place at the Taste of Chicago - Pullman Park, the Pullman Farmer’s Market, the 8th Annual “Lucas Legacy” Bike Ride and Hegewisch Fest throughout the summer of 2023. Over 100 attendees were able to engage directly with the Cook County Department of Transportation and Highways (DoTH) about the Lake Calumet Bike Network Study. They viewed current and proposed bike lanes/trails on a bike network map. They were asked to participate in an interactive board asking them whether they ride a bicycle, where they went on their last bike ride, what prevents them from riding and what they would like to see that is not available.
Key Takeaways:
• Lack of connection to their communities and made significant comparisons to the North and Southside regarding investment, connectivity, and resources.
• Interest in riding in their community, but they needed more resources to buy a bike, or bike maintenance.
• Current paths in the neighborhood frequently leave you stranded. While others pack their bikes and find trails which they find to be more accessible.
• Improving safety for cyclists by adding protected bike lanes and connecting the current trails/lanes to each other
• Increase in connections between bike trails and bike lanes such as the Cal-Sag Trail, Burnham Greenway in Calumet City, Major Taylor Trail, Big Marsh, and other neighborhood bike lanes
• Focus on East and West connections that will allow people to go from Pullman to Hegewisch or the East Side neighborhood
The virtual focus groups took place Wednesday, August 2 and Thursday, August 3 on Zoom. Overall, 15 participants joined the focus groups. HNTB and Rudd Resources provided a presentation for participants to understand the project purpose, timeline, network analysis and more. The project team utilized the chat function and asked participants to unmute to engage. Then, the project team focused on learning from the participants about local points of interest, biking opportunities and barriers.
Key Takeaways:
• Focus on a holistic approach to safety so people can feel safe riding on their own. Promote the bike lanes/trails, add bike racks, more lighting, emergency buttons like those in universities, and protected bike lanes.
• Seek connectivity of the south suburbs trails to those in Chicago and Indiana.
• Consideration of the impact of upcoming development and new CTA stations on bike
Stakeholder Committee Meetings
A project stakeholder committee was formed as a sounding board, essential to coordinating engagement activities, communicating their ideas and insight about the study and help guide the implementation of the final study.
Stakeholder committee members comprised local community residents, organizers and advocacy groups, public agencies and municipal departments, and elected, political officials.
• 10th Ward
• Active Transportation Alliance
• Bike Grid Now
• Black Girls Do
• Calumet City
• Calumet Collaborative
• Center for Neighborhood Technology
• Chicago Department of Transportation
• Chicago Metropolitian Agency for Planning
• Chicago Neighborhood Initiatives
• Chicago Park District
• Chicago Southland Chamber of Commerce
• Chicago Southland Economic Development Corporation
• Cook County Forest Preserve District
• Epstein
• Far South Community Coalition
• Far South Community Development Corporation
• Fit Life Social Club
• Friends of Major Taylor Trail
Stakeholder members were identified and selected in direct coordination with Cook County and local community groups to assure a diverse set of community representatives and their perspectives were brought to the table, enabling them to voice their input at scheduled meetings, open house events, and during the planning process.
The following organizations were invited to participate:
• Illinois International Port District
• Major Taylor Cycling Club of Chicago
• Major Taylor Trail Keepers
• Metropolitian Mayors Caucus
• Metropolitian Planning Council
• National League of Cities - Race, Equity and Leadership Council
Steering Committee meetings were scheduled bi-monthly, or every other month, starting in June 2023. At the time of publication, two meetings were held on June 5th and July 10th. Two additional meetings are scheduled for the Fall of 2023. The June stakeholder meeting served as a goal setting workshop to clarify the vision and mission of the project, and to share next steps of the project. The July meeting gathered feedback on current bicycle network opportunities and asked the stakeholders what they would like to see in a improved bicycle network. The Fall 2023 meetings will review the initial bicycle network recommendations, concept plans, and finalize design concepts.
Stakeholder Committee #1 (June 5, 2023)
The virtual meeting took place on Monday, June 5, 2023, from 6:00 to 7:00 PM.
Key Takeaways:
• Make a bike network focused on safety: the perception and reality of safety are important for people to want to ride on the bike network considering the infrastructure paved trails, adequate lighting, connectivity, and other important factors that would allow people to feel safe biking alone
• Sharing engagement opportunities with the stakeholder committee, other local leaders/ stakeholders, local media outlets, neighbors, and more
• Incorporation into the larger transportation system that includes public transportation, vehicular traffic, walkers, scooters, etc.
• How to make the bike network “special” for all who live in the Lake Calumet
Stakeholder Committee #2 (July 10, 2023)
The virtual meeting took place on Monday, June 10, 2023, from 6:00 to 7:00 PM.
Key Takeaways:
• Continue to share engagement opportunities with our stakeholder committee, consider sending specific language and a flier for each event.
• Focused messaging on how our vision intends to create more equitable and safer bicycling opportunities for all and not a selective process of picking certain improvements over others.
• Create a well-connected bike network that considers highways, rail yards, industrial uses, traffic, and other barriers that do not allow cyclists to travel safely.
• Update the stakeholder committee on the bike network recommendations and concept plans.
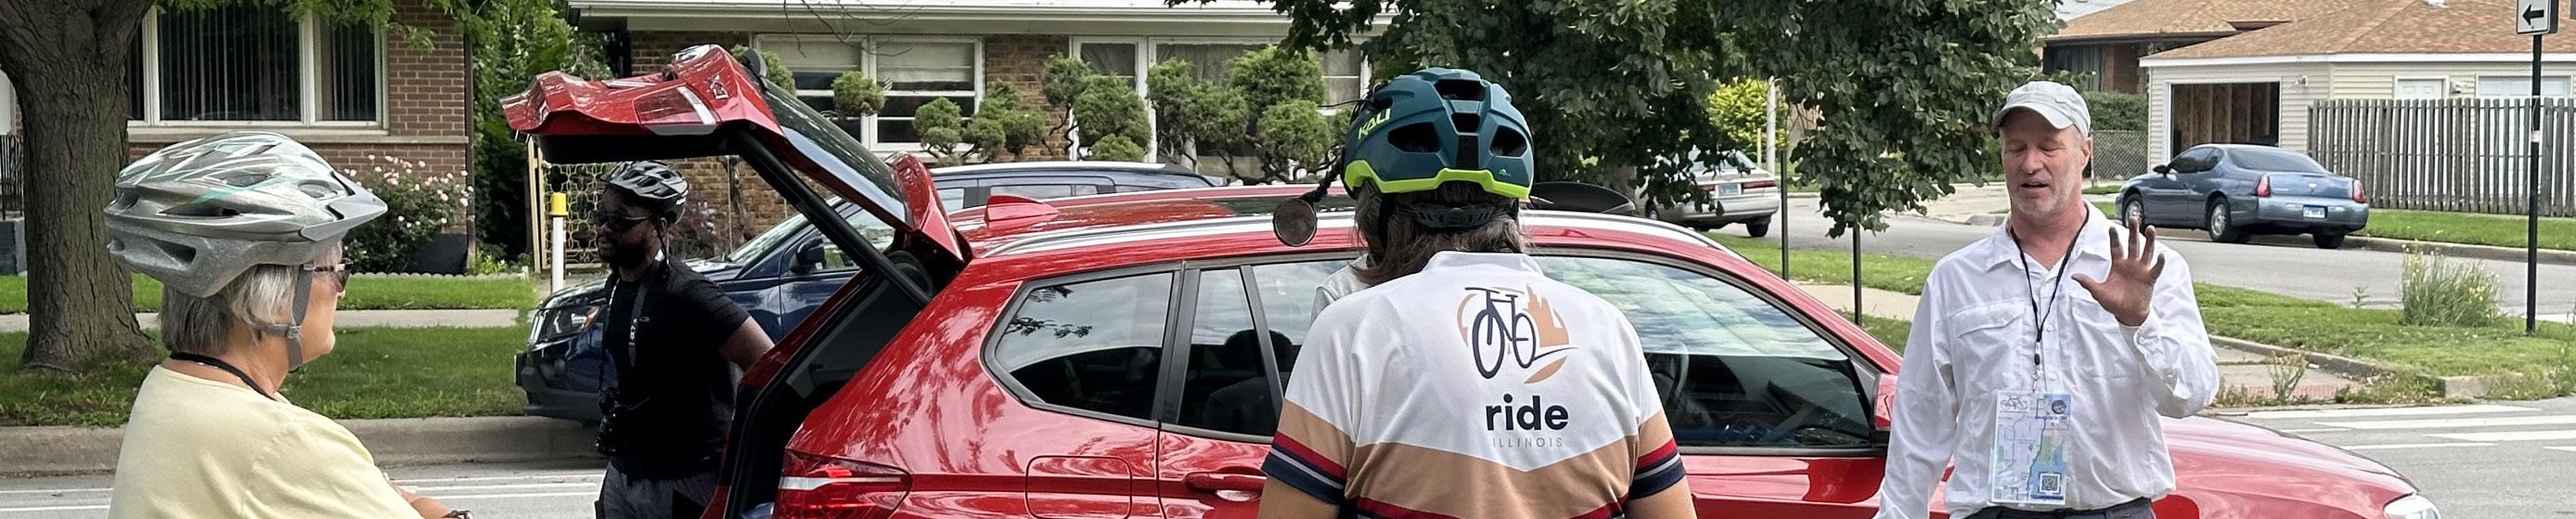
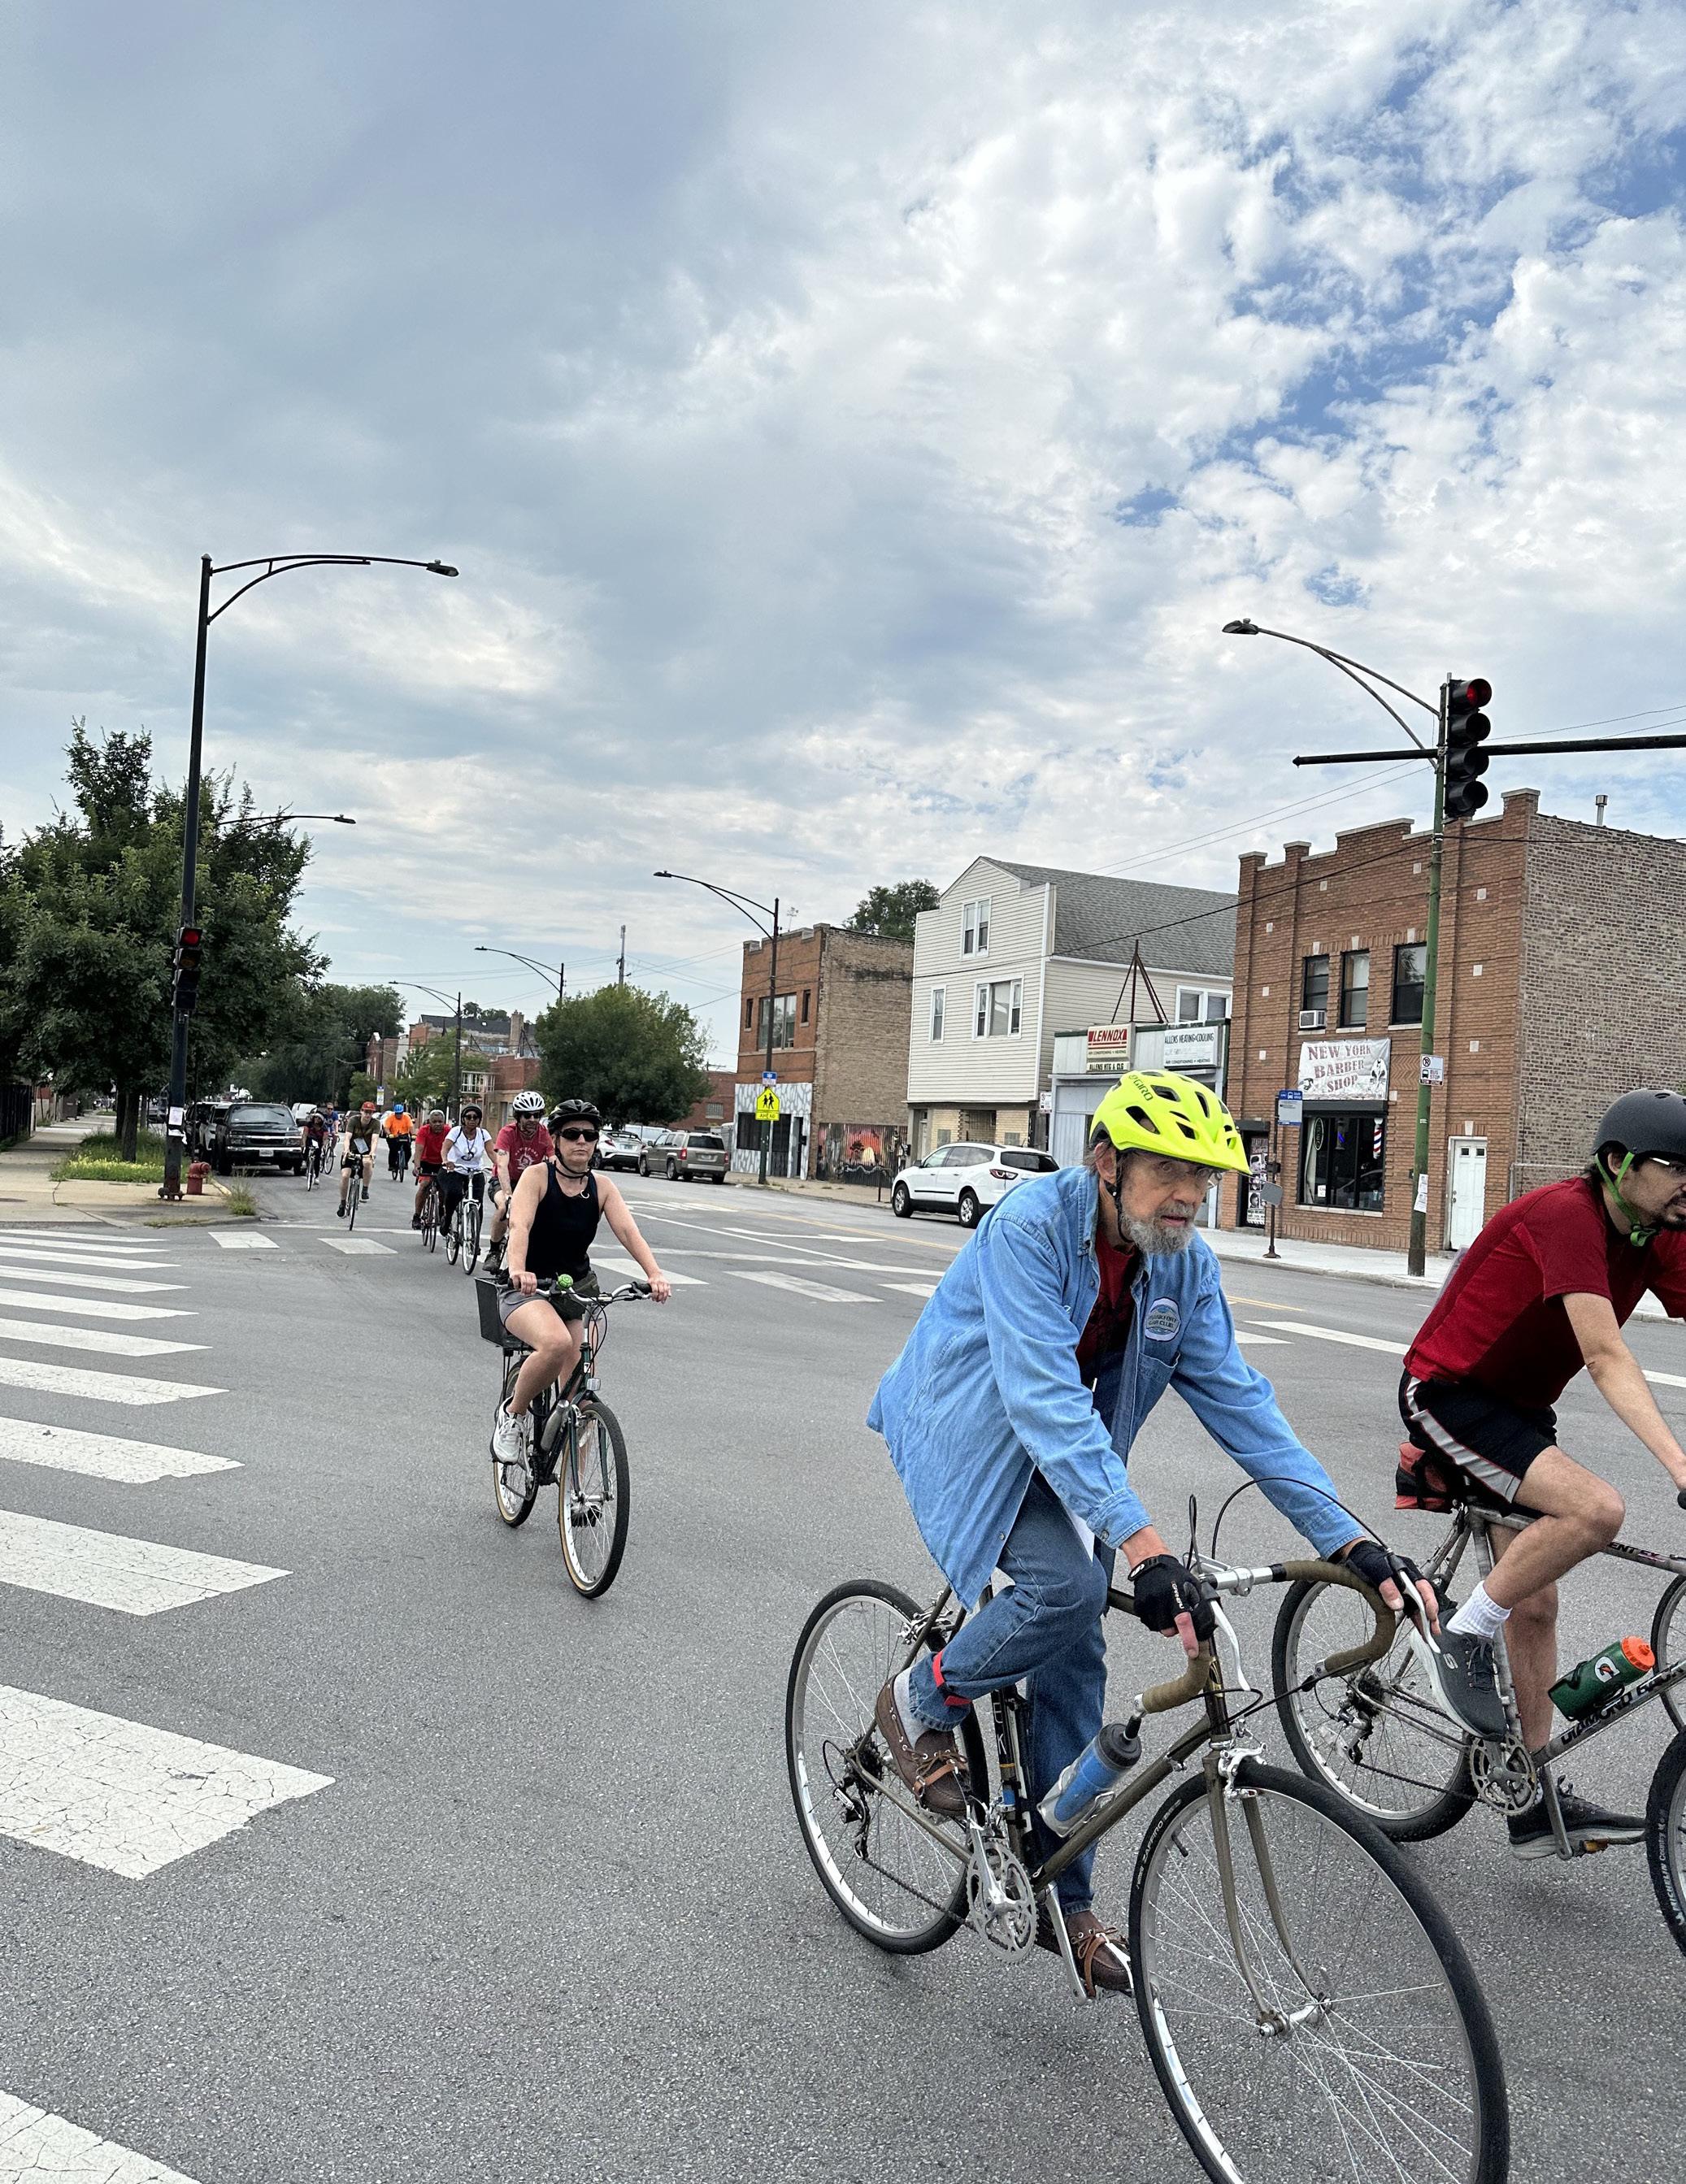
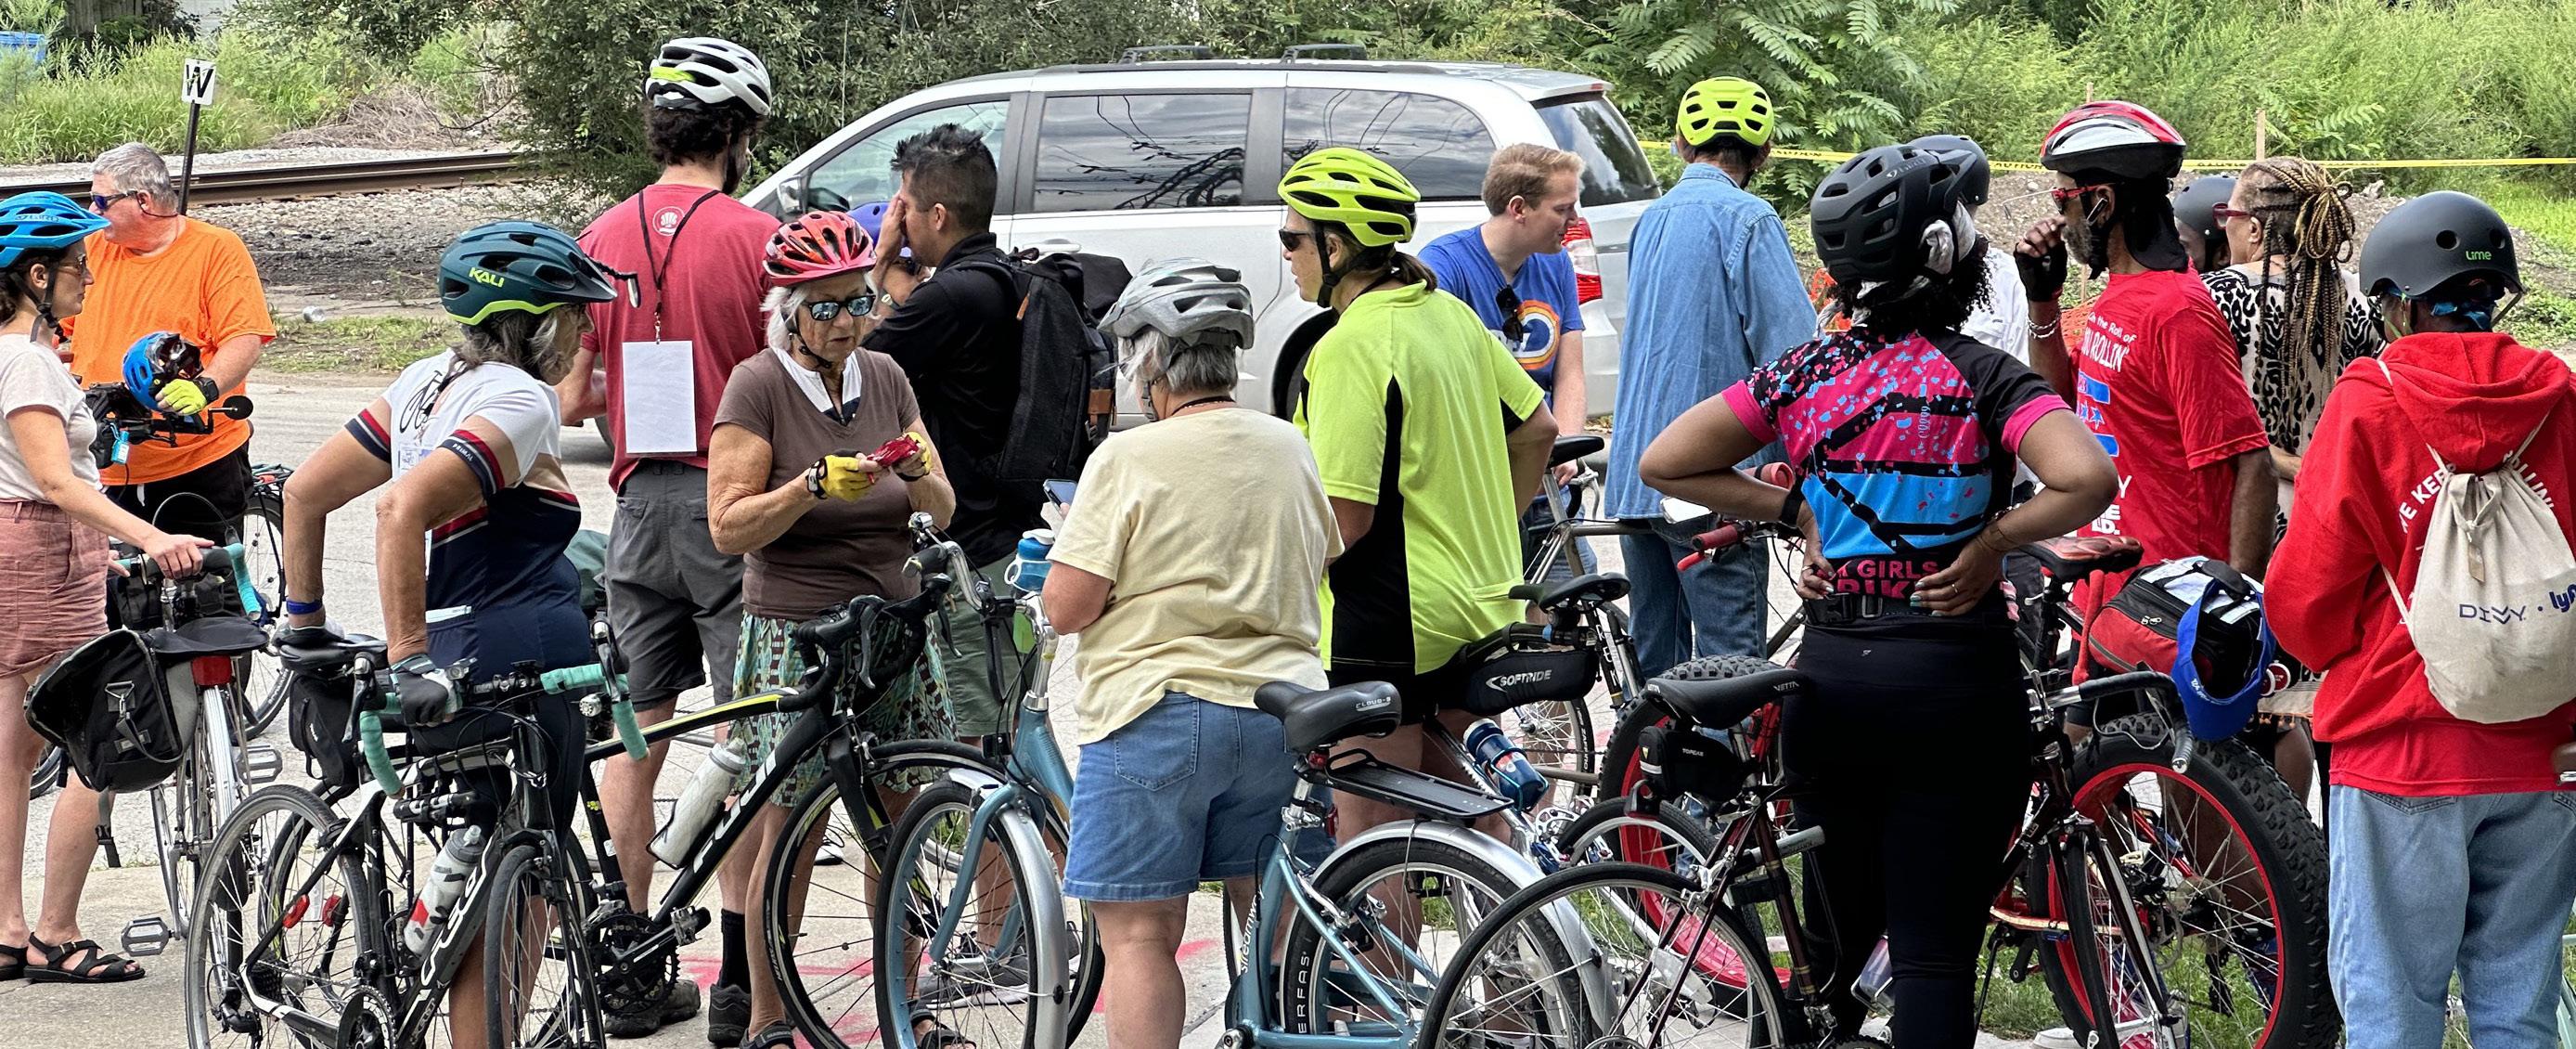
Bicycle Tours
Hegewisch and East Side Bicycle Tour
23 people participated in the Hegewisch and East Side bicycle ride on August 19, 2023. Riders engaged with Cook County Department of Transportation and Highways staff along with the project team to learn more about ways to improve walking and bicycling paths in the Hegewisch and East Side neighborhoods.
After the ride, participants were encouraged to fill out a brief survey:
Question 1: After going on the tour, are there any new streets or intersections that should be prioritized for improvement? Please list your top three.
Survey respondents stated Ewing Avenue, 106th Street, Indianapolis Avenue and Burnham Greenway most often as locations that need to have designated protected bicycle lanes and additional signage.
Question 2: Did you experience any barriers while biking today that could prevent you from biking and walking in the area?
Some of the participants mentioned the need to improve pavement conditions such as potholes and painting on the Burnham Greenway. Most participants said that they had to drive to the starting location of the tour since there are no east-to-west connections they could take to get to Hegewisch.
While riding from Hegewisch to East Side, many participants echoed the need for directional signs, clear crosswalk signals and more protected bicycle lanes. Some of the reasons that impeded their willingness to ride were car traffic, commercial truck traffic, and the lack of bicycle lanes.
Question 3: What are the top bicycling and walking issues you would like this project to address?
The first issue identified by respondents is more protected bicycle lanes and trails. In connection with this issue, more dedicated, separate and protected bicycle infrastructure were requested. The bicycle infrastructure improvements noted by respondents include repaved bicycle lanes, more lighting, and repainted bicycle lanes.
The second major issue that was brought up was the request for east-west connections and better connectivity to the south suburbs. One of the bicycle lanes that was mentioned to help the connection was a bike lane on Torrence and 130th Street.
Question 4: Any other comments or observations?
Some verbatims from the survey include:
• “No way to get east if you live west of 94.”
• “Please direct us to ways to keep promoting this work to our political representatives.”
• “The Southside/Eastside is almost forgotten in the city’s planning for fair and equitable bicycle options, especially with regard to such a huge barrier to cycling here.”
• “Some bumps on the Burnham Greenway due to tree roots.”
• “It was a well-organized ride. Interested in following the plans as they develop.”
Citizens from the study area on a bicycle tour crossing S Ewing Ave and S Indianapolis intersection.
04 Study Area Characteristics
Community Areas
The study area includes parts of seven Chicago community areas and two municipalities located in the Cook County region. Each community area or municipality in the study area has a diverse population and a rich cultural history.
East Side
The East Side neighborhood borders Lake Michigan with western access from Calumet Park. The community is adjacent to the Eggers Grove Forest Preserve.
Hegewisch
Hegewisch is located south of East Side and is bordered by Riverdale and South Deering to the west, and the Village of Burnham to the south. Most noteabley, Hegewisch’s namesake sought to create a worker’s community centered on rail.
Pullman
Pullman is located west of Lake Calumet. Pullman includes both North Pullman and Historic Pullman. Originally built to accomodate worker’s at the Pullman Company, the neighborhood has been recognized as a National Historic Landmark district.
Riverdale
Riverdale is bordered by the Little Calumet River to the north, 138th Street to the south, the Bishop Ford Expressway to the east, and Indiana Avenue to the west. Historically, Riverdale’s economy was based on industy. Two Metra Electric district trains serve the community.
Roseland
Situated between Pullman and Lake Calumet, Roseland is made up of three unique neighborhoods each with their own character and history. Roseland was one of Chicago’s most cosmopolitan and multi-ethnic communities in the City.
South Deering
This historically industrial community is the largest community area in Chicago, however 80% is industrial, wetlands, or park. The community is well known for its mid-centurymodern housing developments.
West Pullman
The Major Taylor Trail is partially located in the West Pullman community and connects to Whistler Woods Forest Preserve to the south. West Pullman historically housed workers of the Pullman Company.
South Surburban Cook County
City of Dolton
Dolton is bordered by Riverdale and Harvey to the west, South Holland to the south, and Calumet City to the east. The City separated from Riverdale in 1892.
Village of Burnham
The Village of Burnham is located southeast from the City of Chicago. The community is home to the Burnham Park District, the Burnham Historic District, and the Burnham Harbor.
Image Source: Rudd
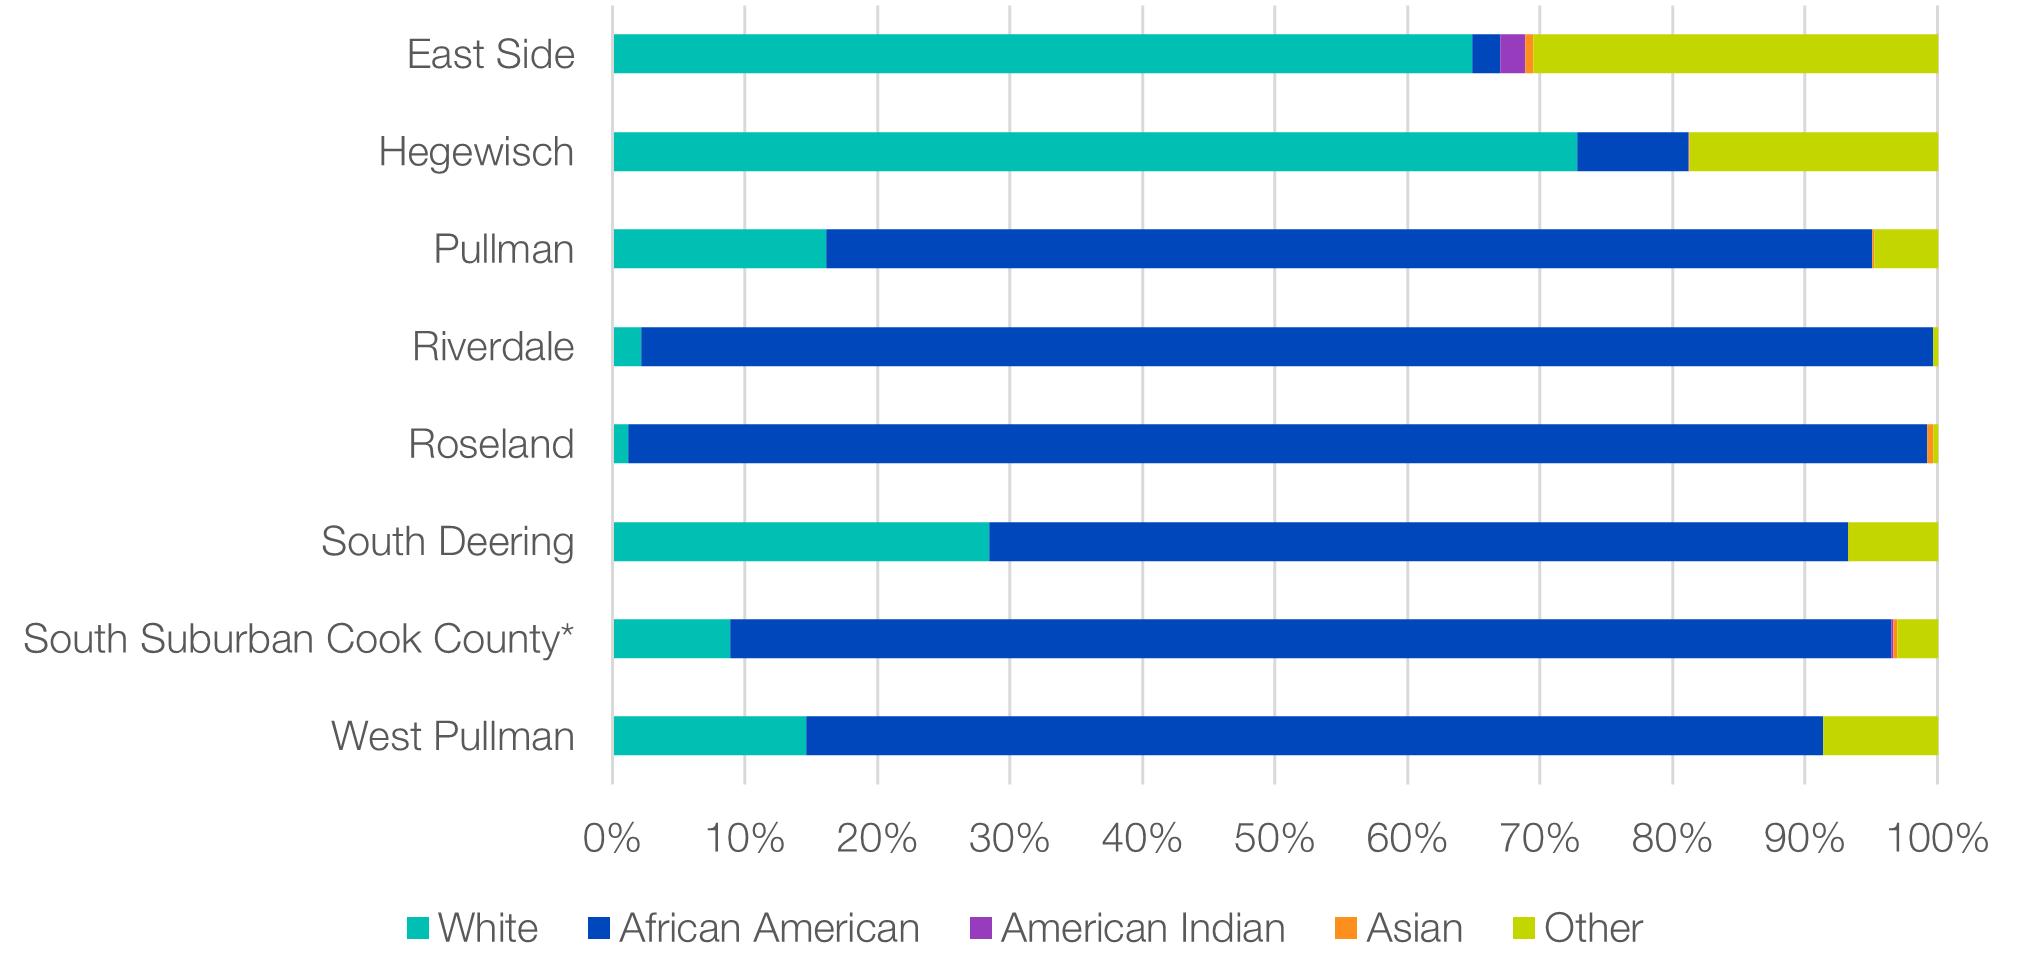
of White Population
Hegewisch contains the largest White population in the study area. The East Side is the next highest percentage of White population, however, the East Side is predominately Hispanic.
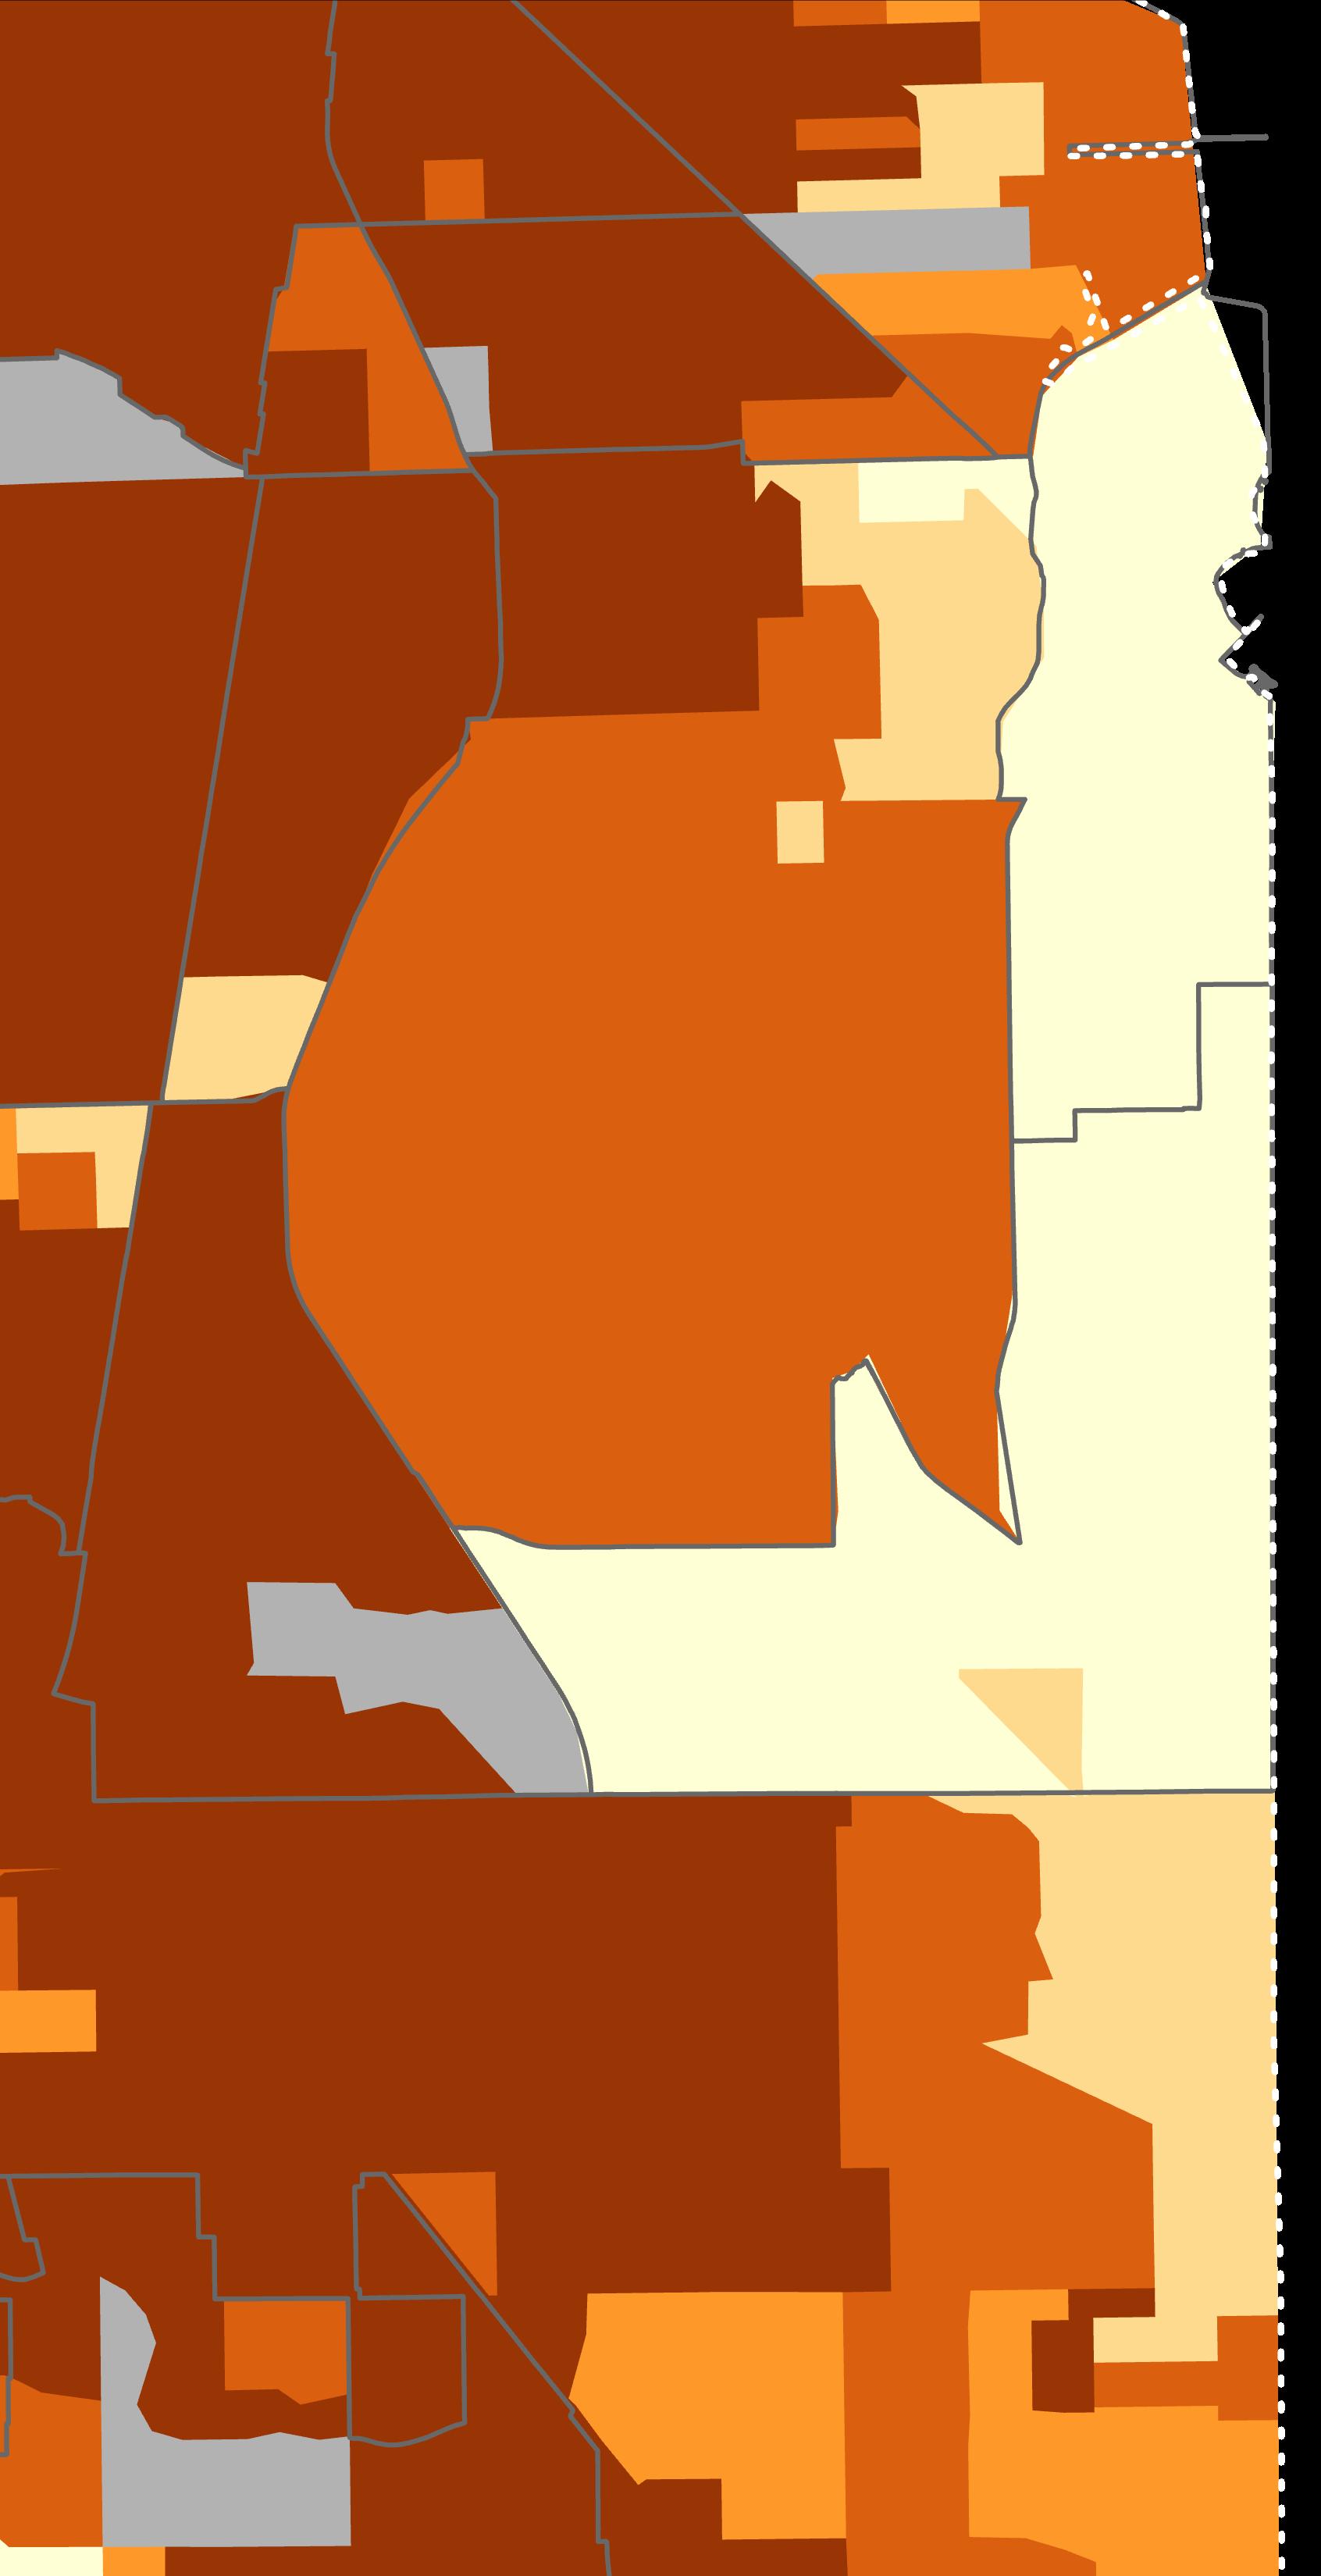
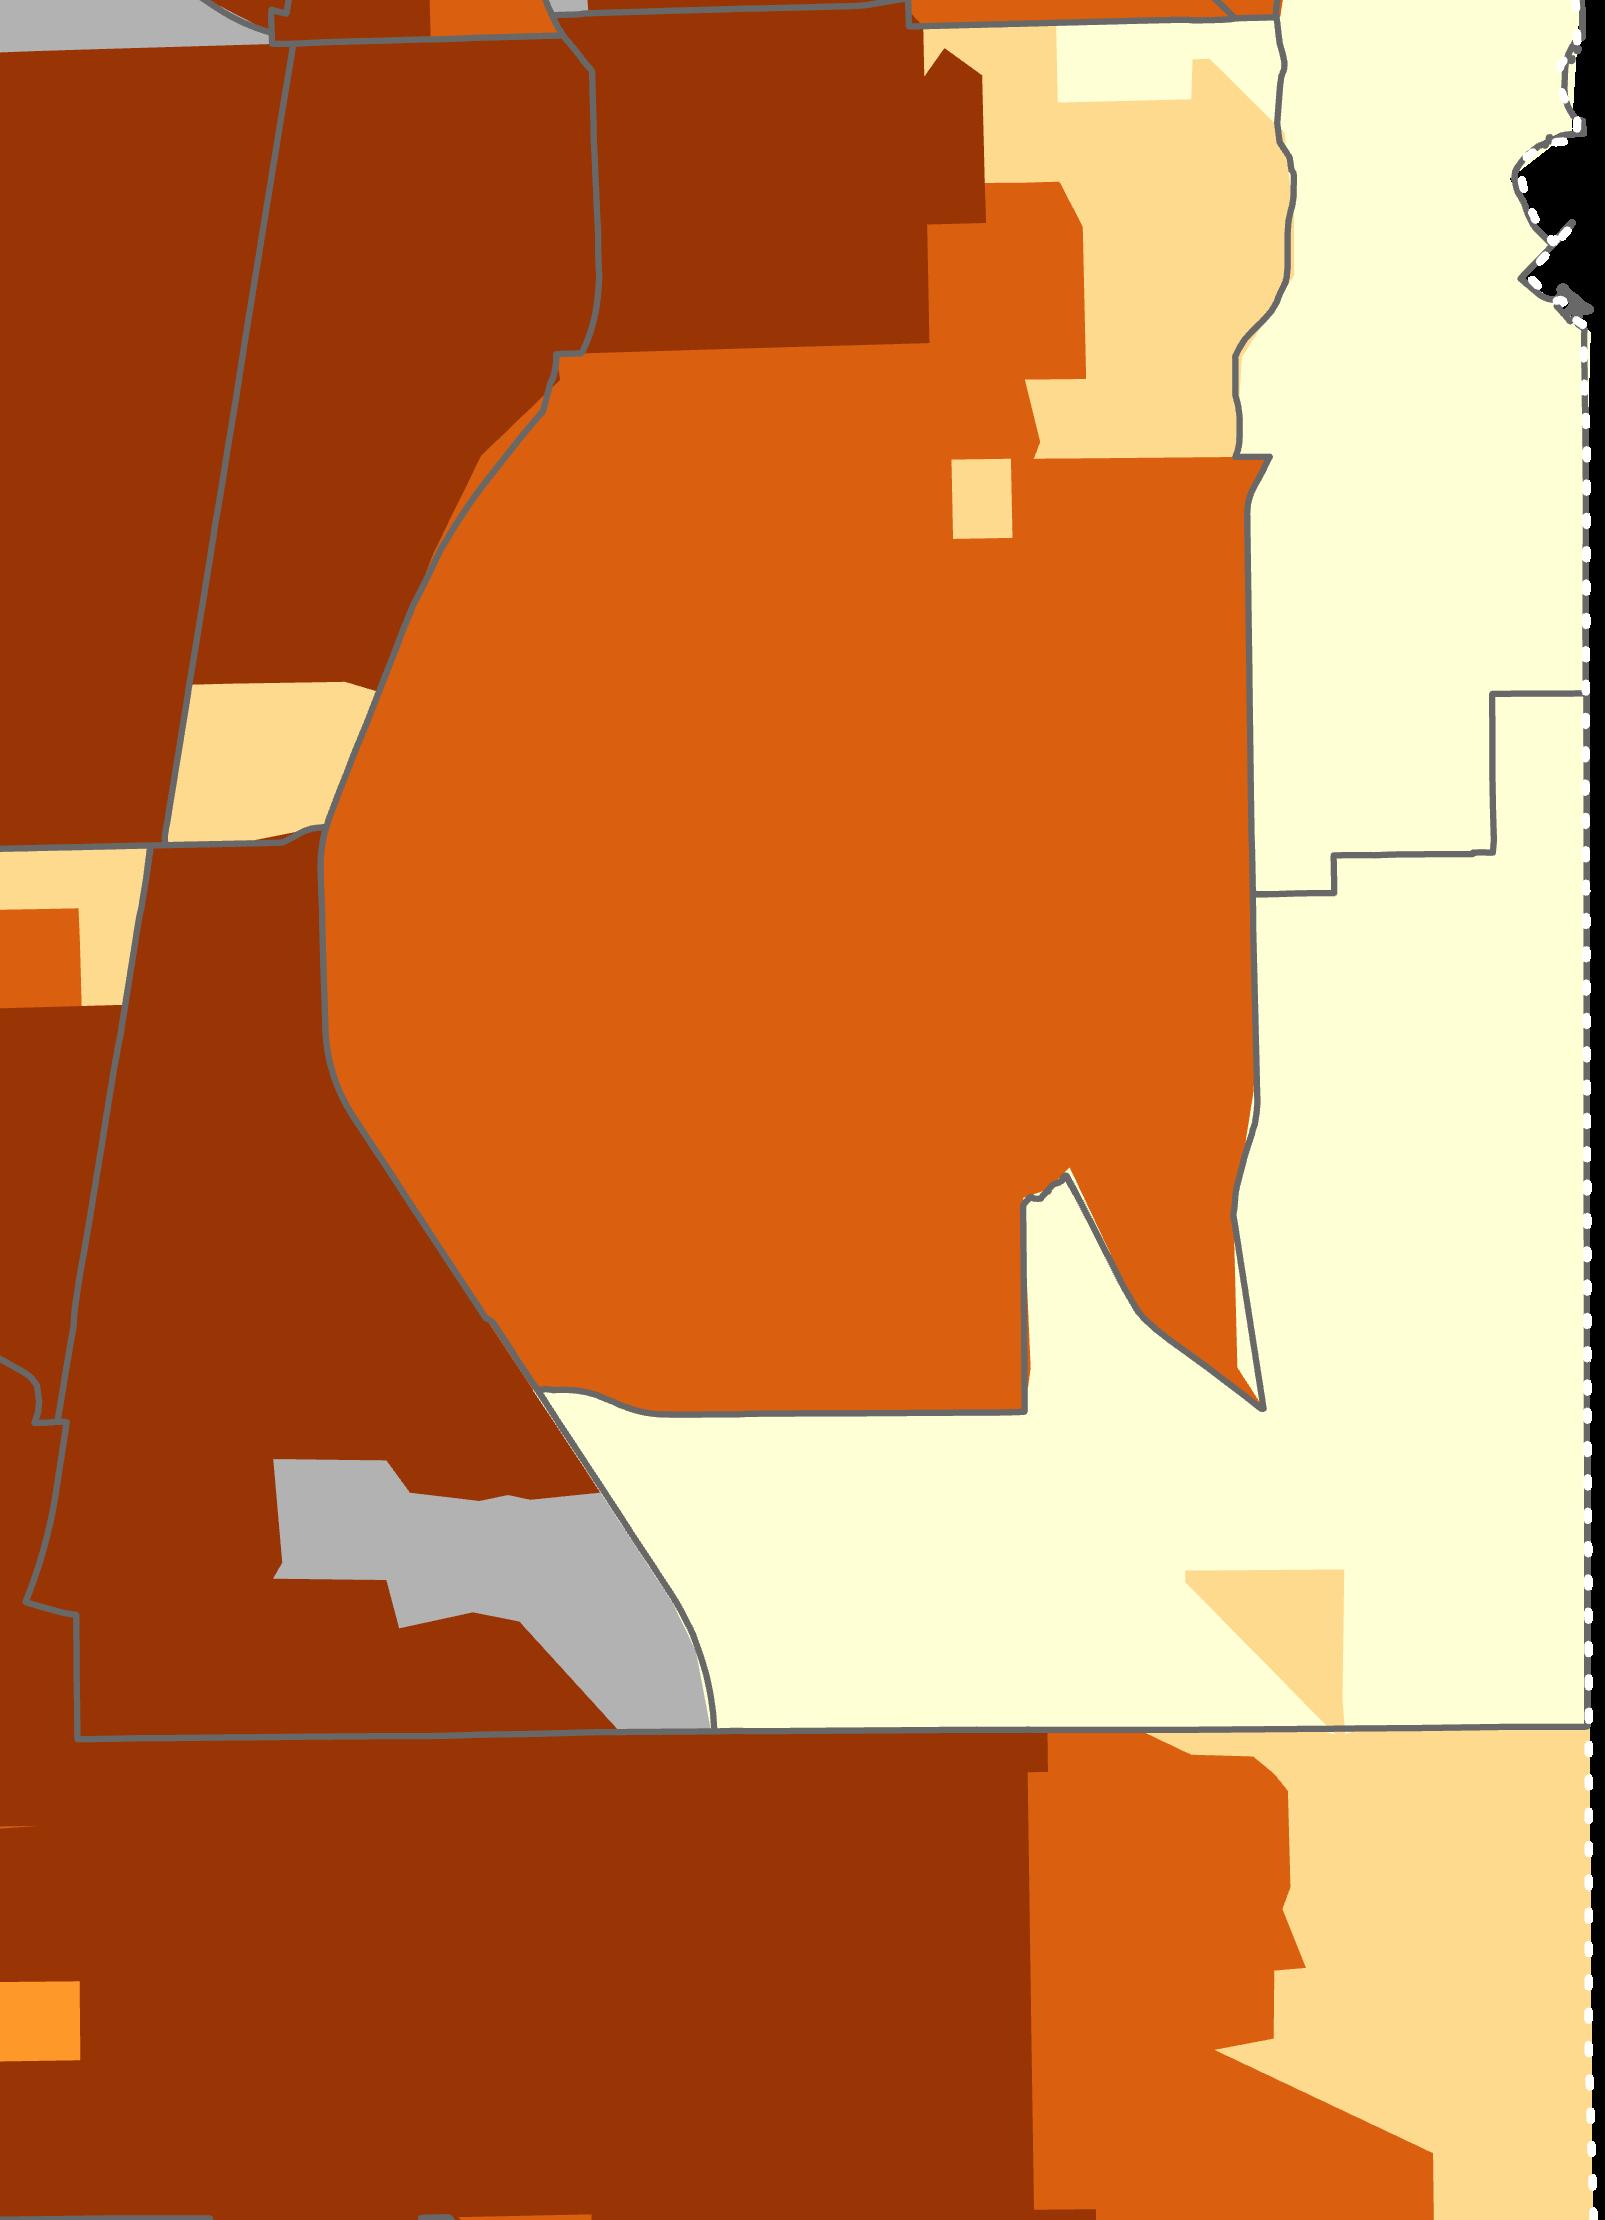
Percentage of Black / African American Population
The neighborhoods of Pullman, Riverdale, and Dolton have the highest majority of Black/African American persons between 80-100% of the neighborhood’s population. Burnham and South Deering have the next highest majority; between 60-80% Black/African American persons. There is the least representation of Black/African American persons in the Hegewich and East Side neighborhoods.
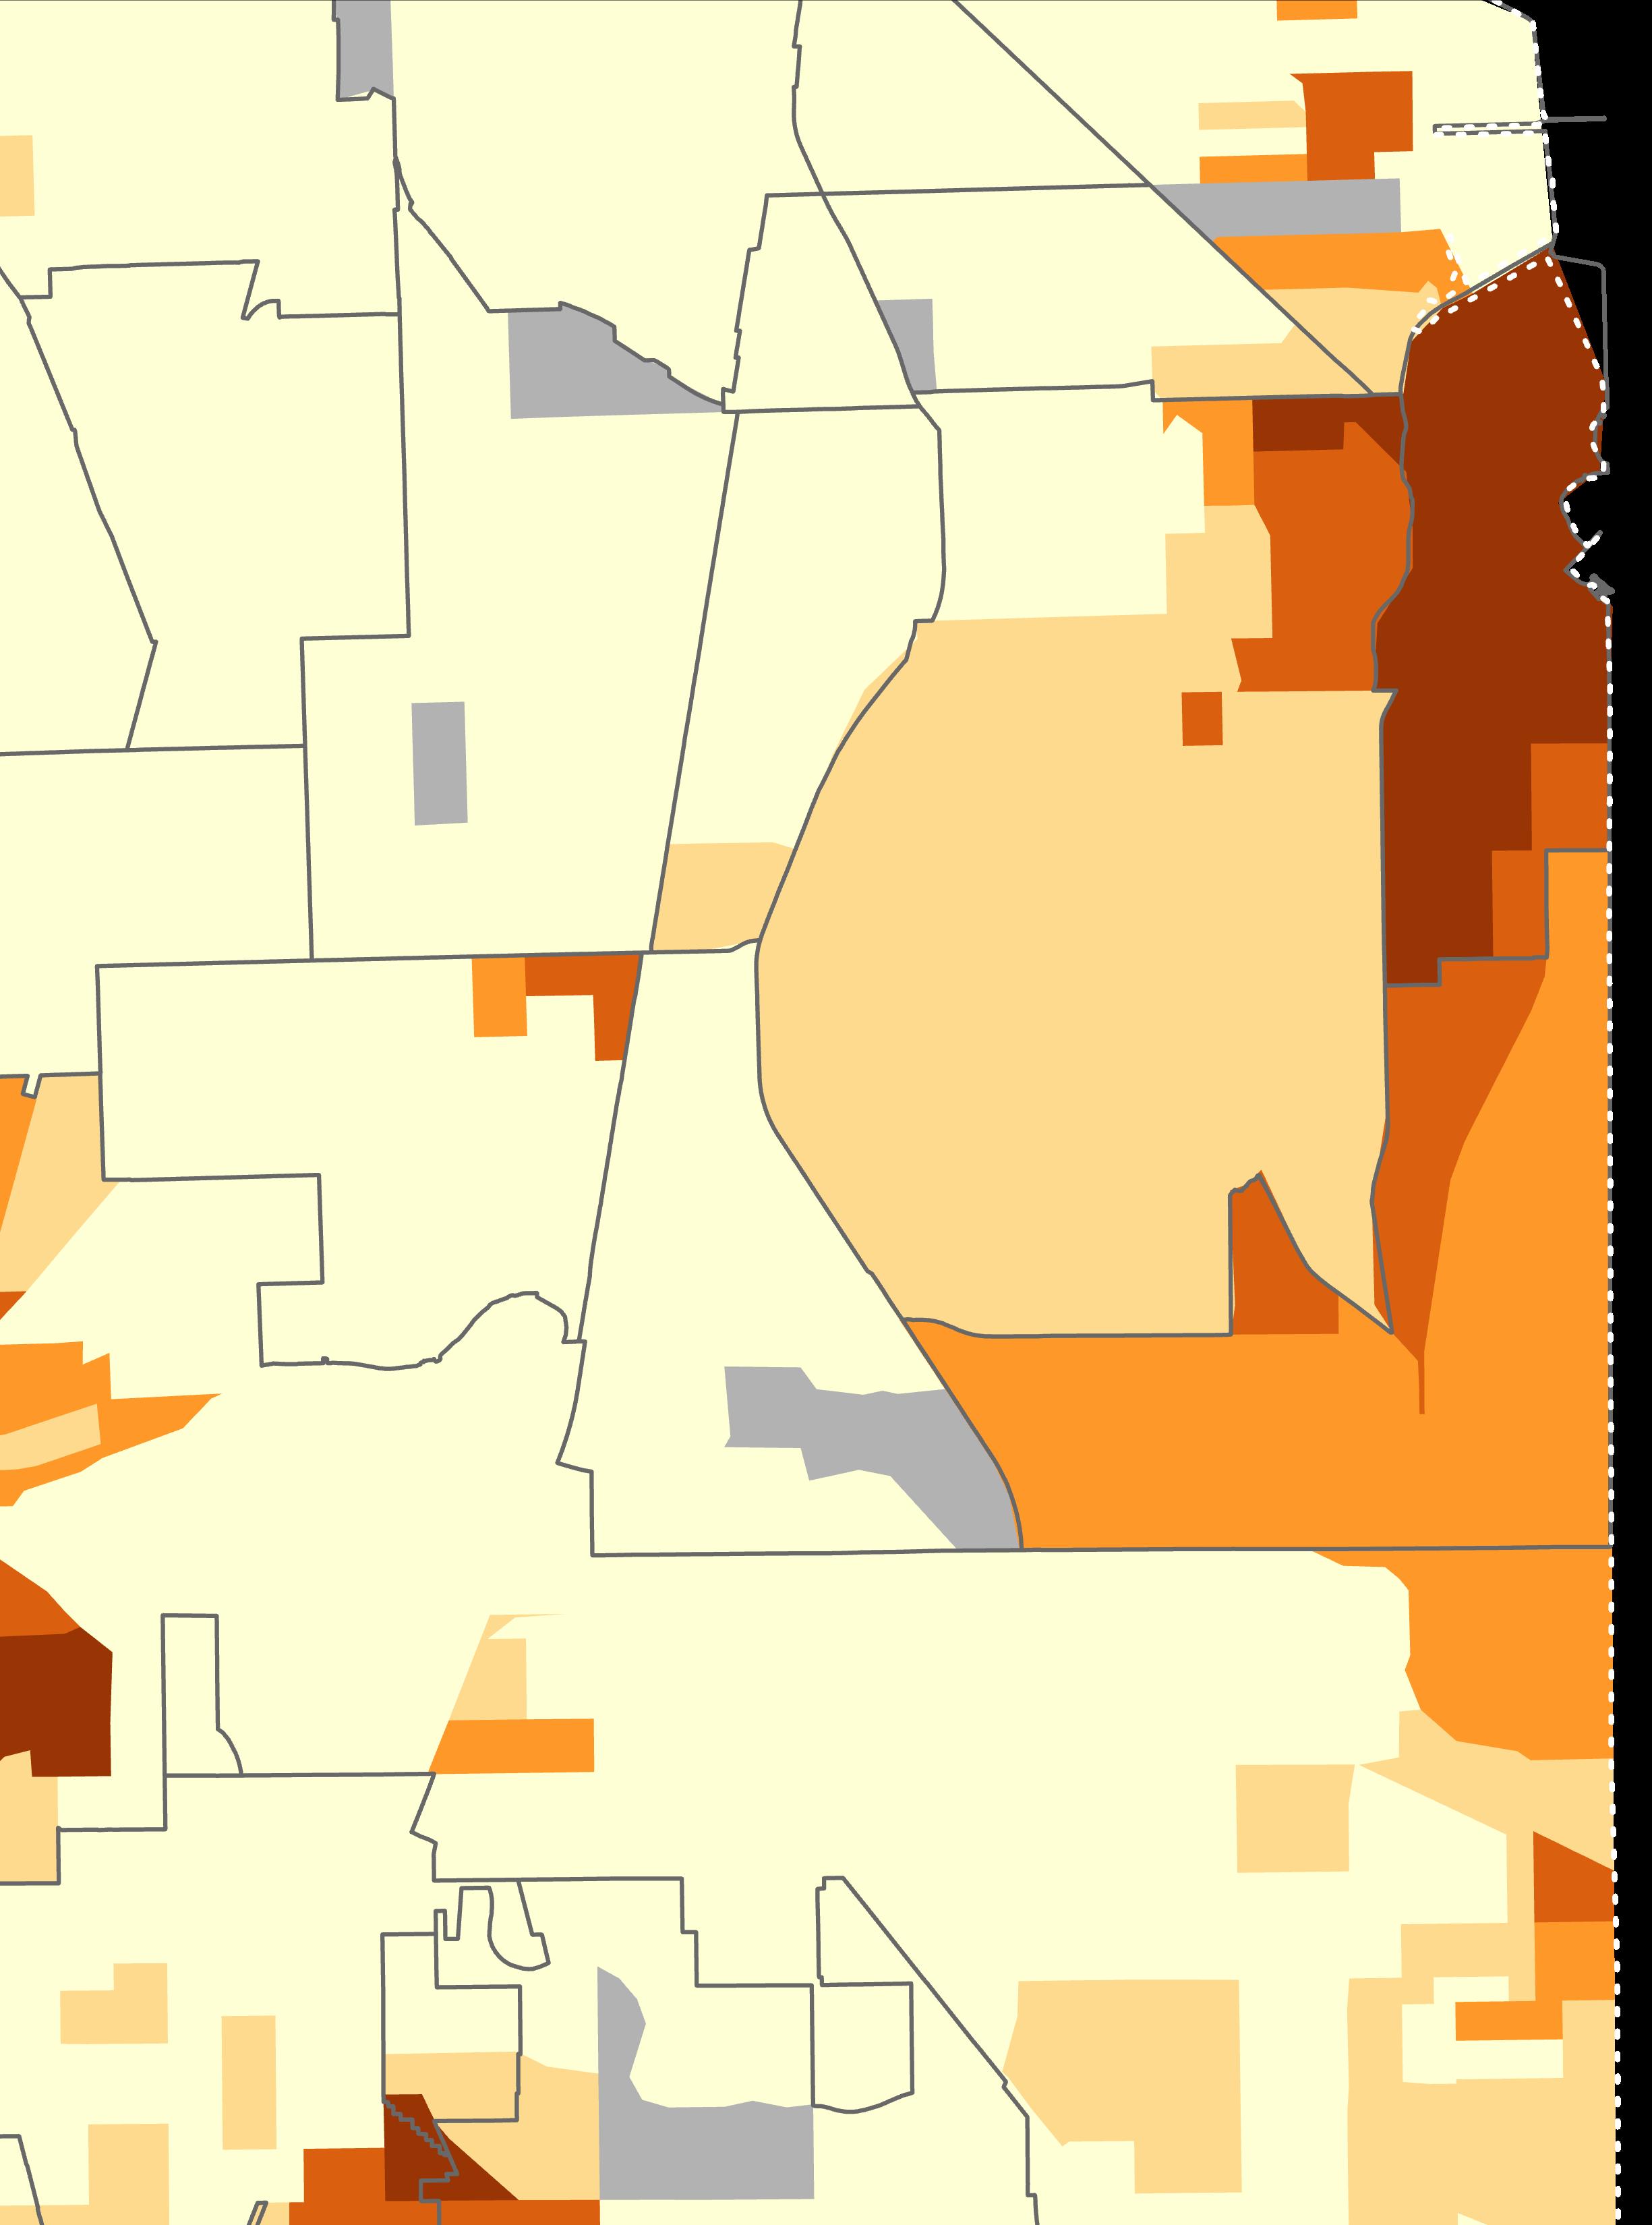
HEGEWISCH
PULLMAN
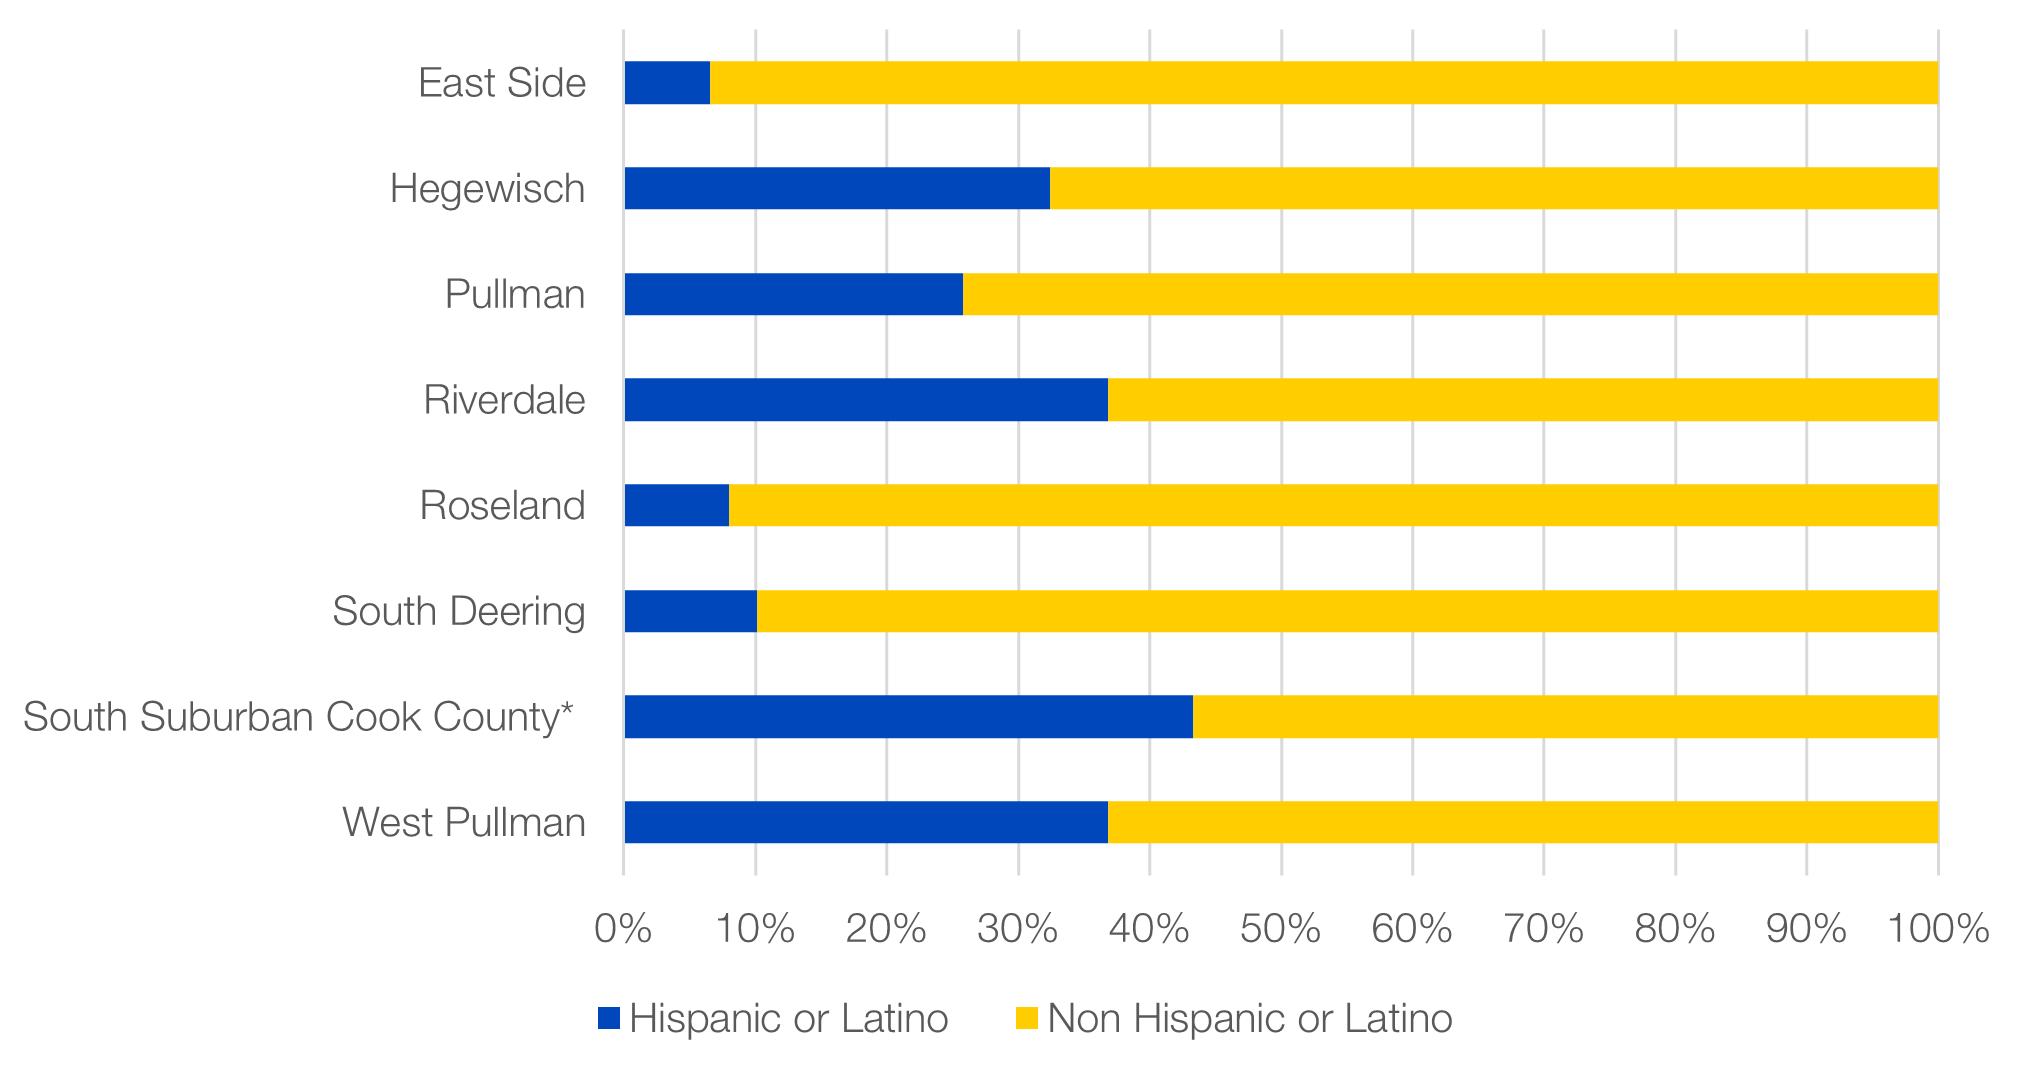
The Hispanic population is primarily (80-100%) located on the east side of the study area in the neighborhoods of Hegewich, East Side and the North East corner of Burnham. Hispanic persons are least represented in the Pullman, Riverdale, and Dolton neighborhoods.
Pullman, East Side, Roseland, Dolton, and Burnham are the neighborhoods with higher household income than others within the study area. Riverdale and parts of the southern area of Pullman have the lowest household income.
Number of Workers who Commute to Work on a Bicycle, 16 Years of Age or Older
Compared to other parts of the study area, the central and southernmost areas of Dolton and Burnham have the highest number of workers who commute to work on bicycles. A part of the Pullman neighborhood with access to a biking facility has a few bicycle riders commuting to work.
Source:
Workers Who Commute
Work
Truck
Van, 16 Years of Age or Older
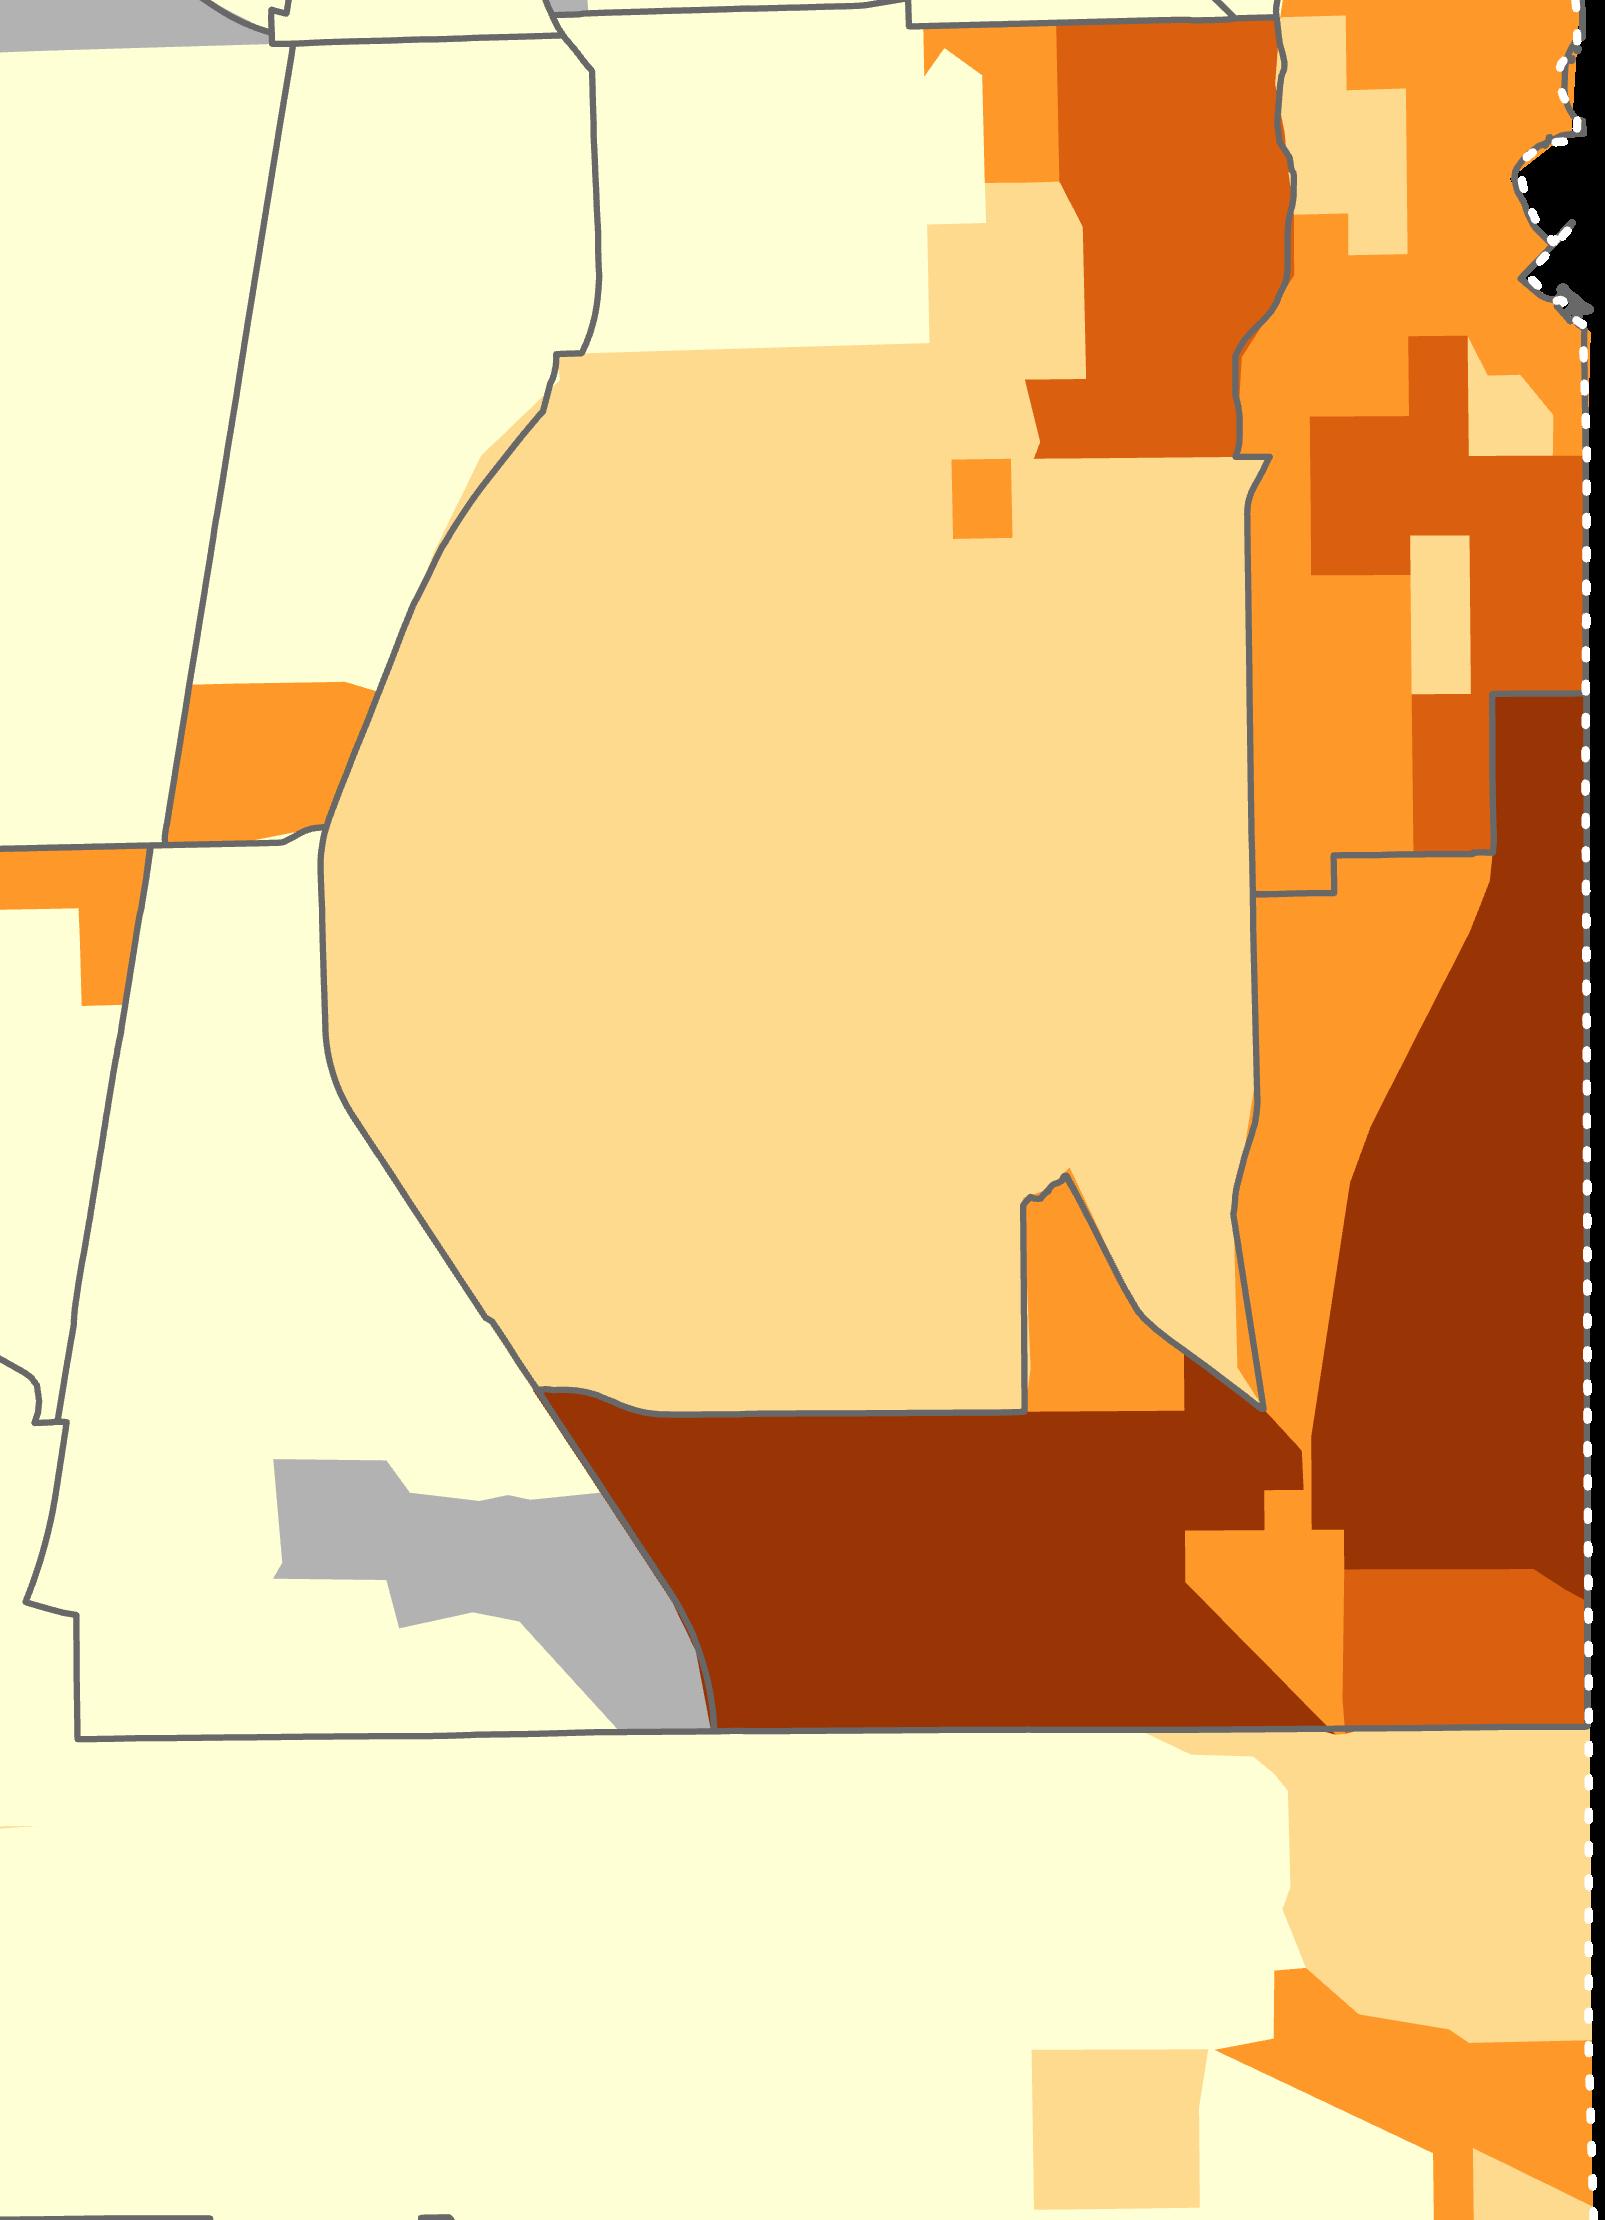
The East Side neighborhood, located on the northeastern side of the study area, has the highest number of workers who drive a car, truck, or van to work. In addition to cars, residents of the Riverdale and Roseland neighborhoods use alternative modes of transportation to work.
Number
of Workers who Commute to
Work
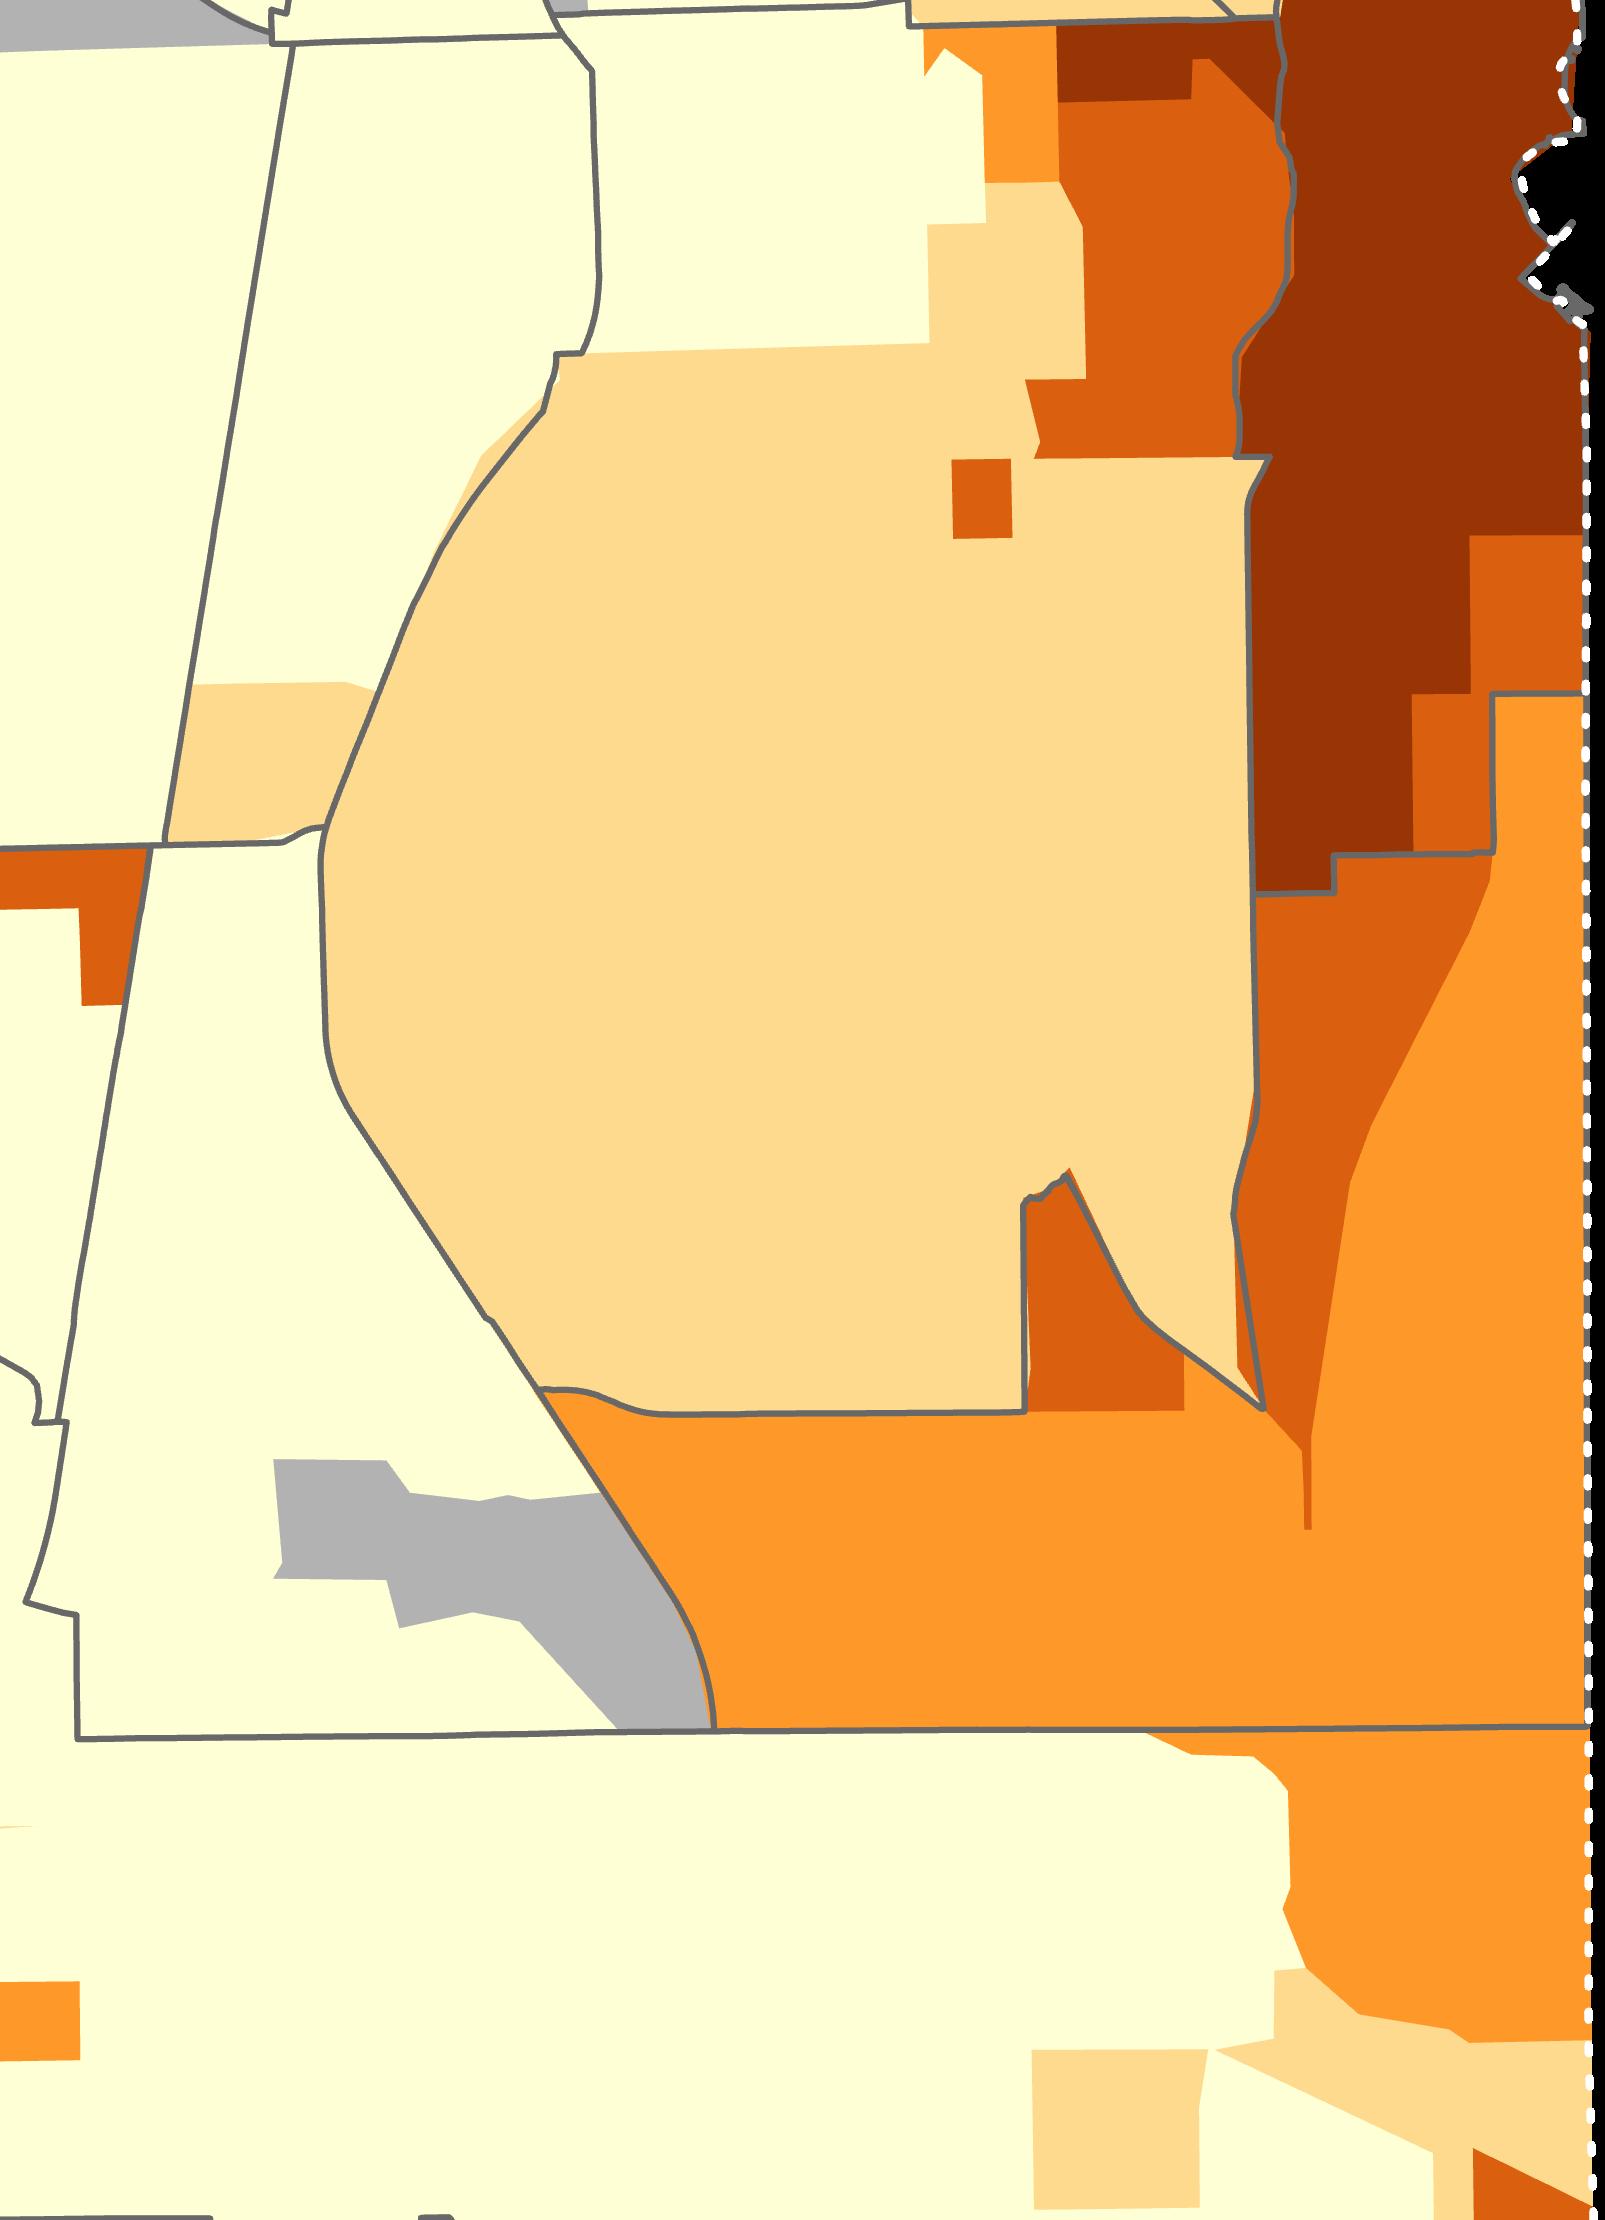
using Public Transportation including Taxi/ Shared Ride, 16 Years of Age or Older
The South Deering neighborhood has the highest percentage of residents who rely on public transit. A significant number of Pullman and Riverdale residents, who have access to Metra and CTA bus services, also use public transportation, including taxis, to commute to work.
A majority of households within the study area have access to at least one vehicle. There are subareas within the Pullman and Riverdale neighborhoods where households have limited
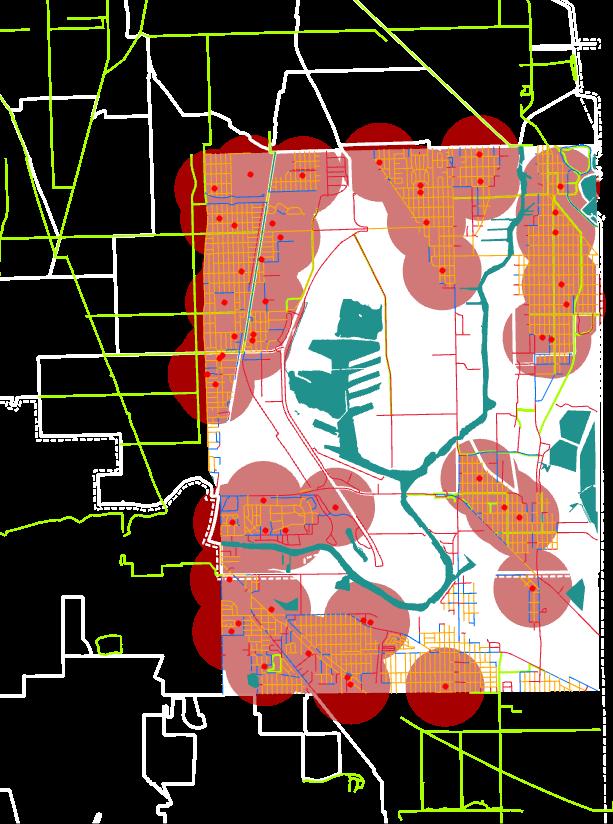
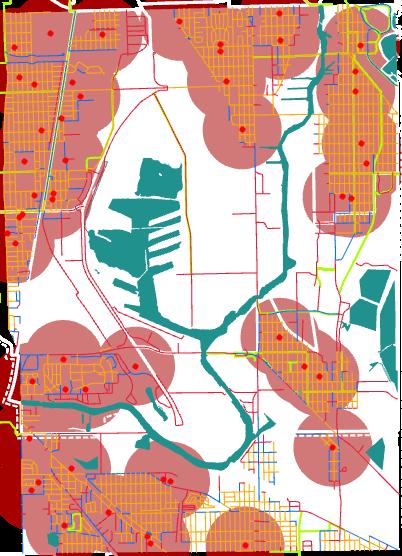
Access to Commercial Centers
Households within the neighborhoods of Pullman, East Side, Hegewisch, Burnham and Dolton generally have better access to commercial assets compared to the rest of the study area, based on 10-minute walk. South Deering, Riverdale, and the southern end of East Side have to travel further to reach commercial businesses.
Most of the households within the study area spend between $12,501 to $15,000 on transportation annually. Neighborhoods such as Pullman and Riverdale that spend less annually on transportation costs have more residents utilizing public transportation and own less cars than neighborhoods to the east. Although Pullman and Riverdale households spend less annually on transportation, these neighborhoods are more vulnerable to changes within public transportation modes than residents of the study area who have the opportunity to own more cars.
School
Catchment Areas with Sidewalk Inventory
The study area includes a total of 53 public and private schools. The neighborhoods of Riverdale and Dolton have no access to bicycle routes within 10 minutes of walking distance from a school. Schools on the Northern end of South Deering also has limited access to a bicycle network.
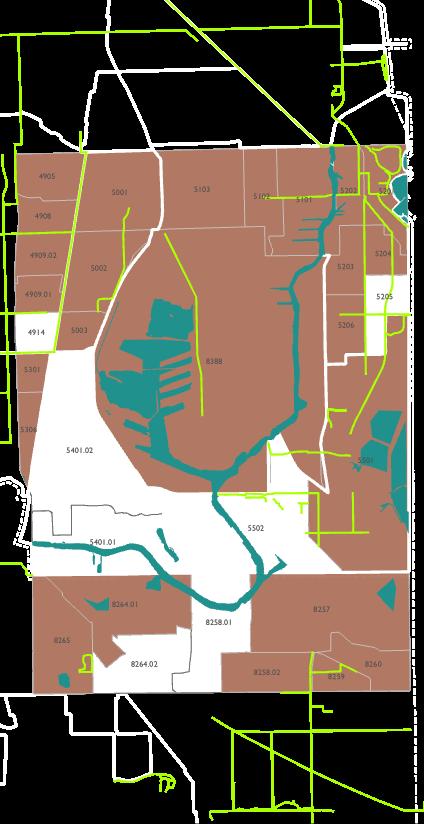
The U.S. Department of Transportation released a Justice40 initiative with the goal of at least 40% of resources to reach under served communities. This map shows the Census Tracts identified by the U.S. DOT as under served based on their metrics.
Tracts
Tracts
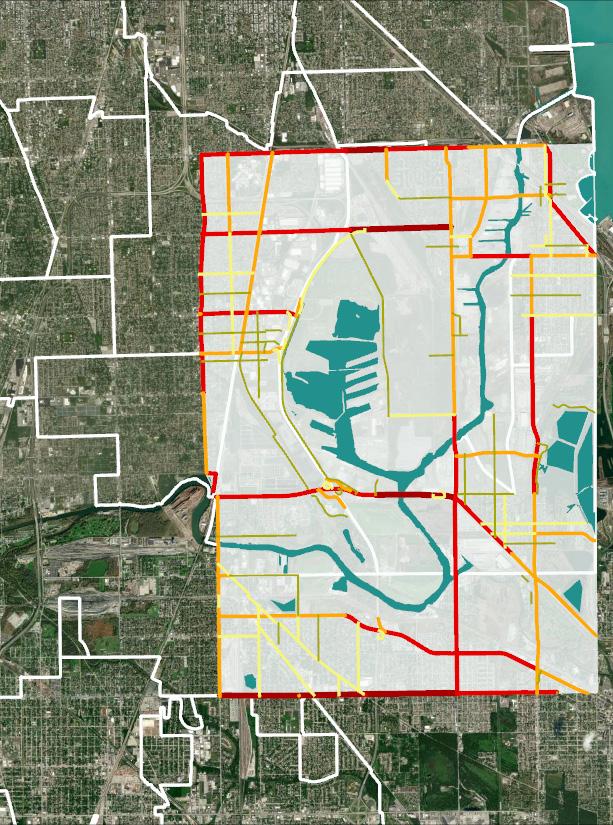
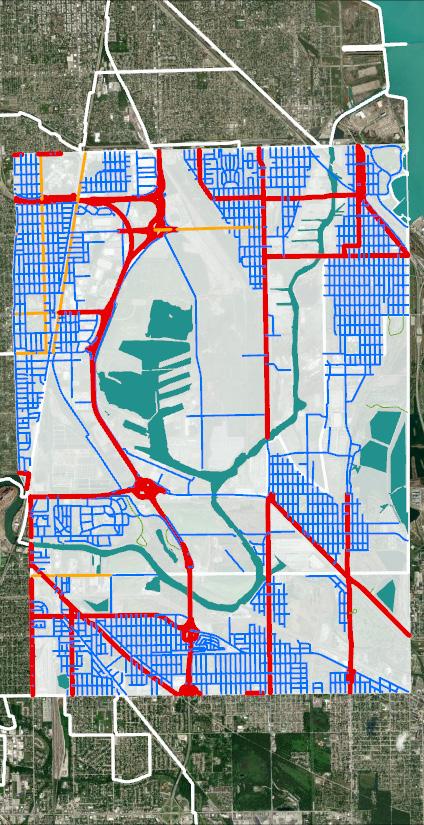
Average Annual Daily Traffic (AADT) estimates the average level of automovile traffic on a street during a typical day using data averaged over a year. Typically, streets with higher speed limits, more lanes, and wider lane widths have higher volumes of traffic. Within the study area, streets with the highest AADT levels are 103rd Street, 130th Street, and Sibley Boulevard.
The roadway jurisdiction of the study area identifies which agency is responsible for access management and maintenance of a roaway. Roadway jurisdiction is important to know when advocating for walking and bicycling improvements. For example, many roadways with high levels of traffic are under the jurisdiction of the State of Illinois. Therefore, improvements on these roadways would need to involve coordination with the Illinois Department of Transportation (IDOT).
Source: Getting Around Illinois, IDOT
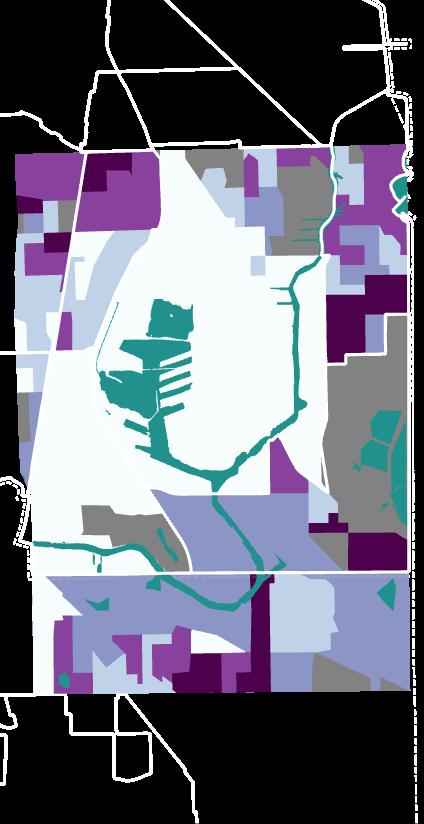
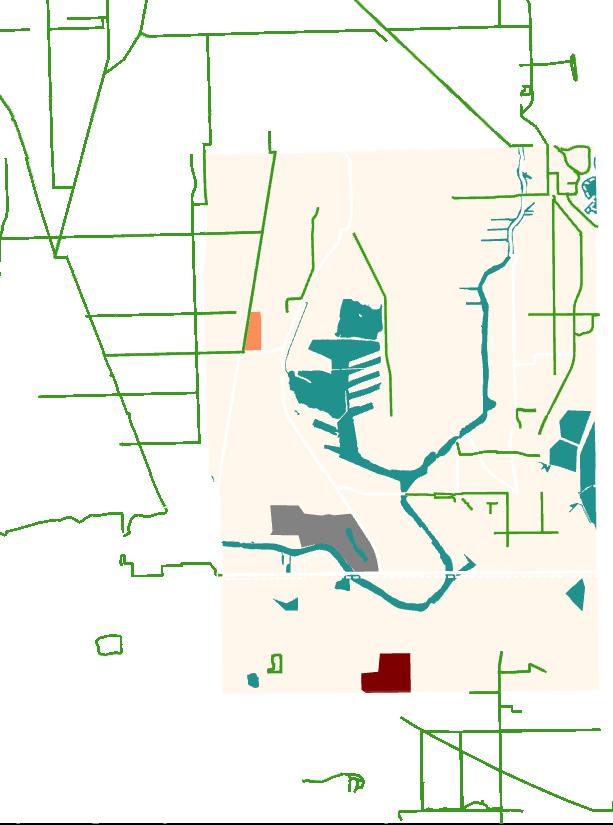
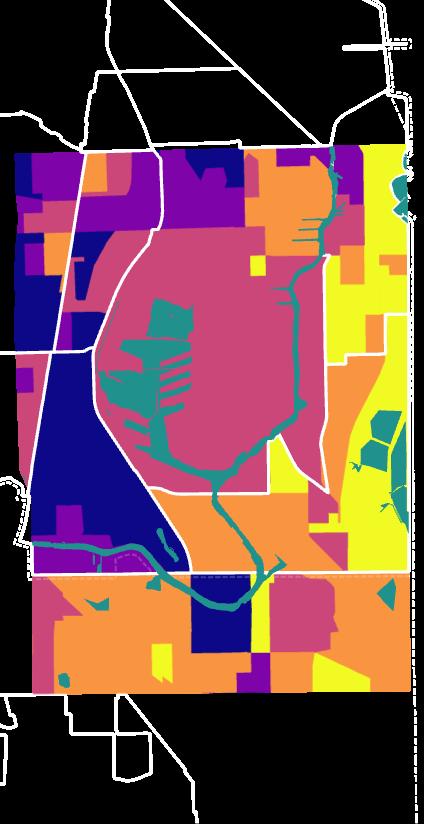
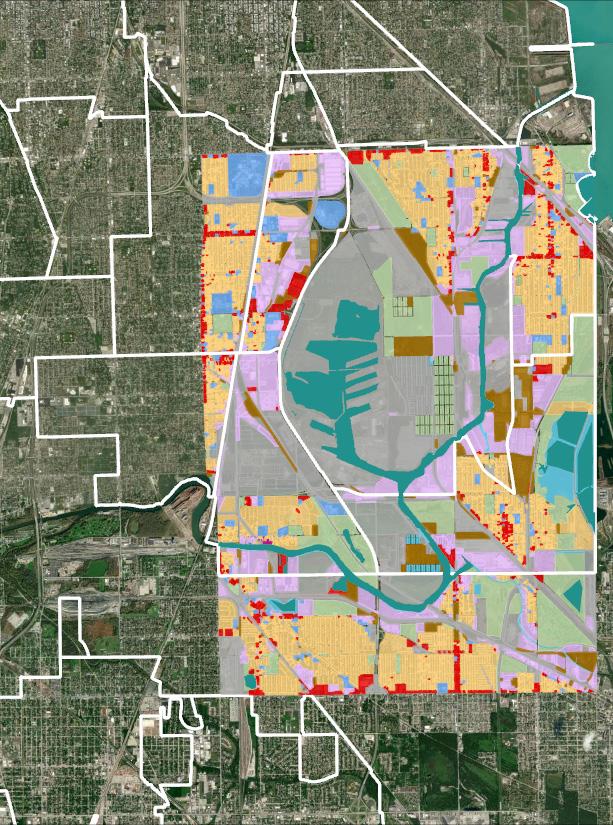
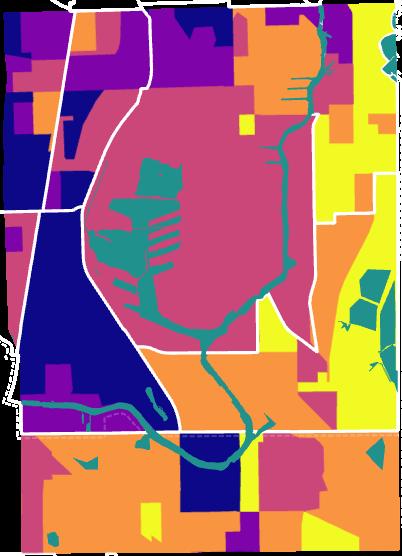
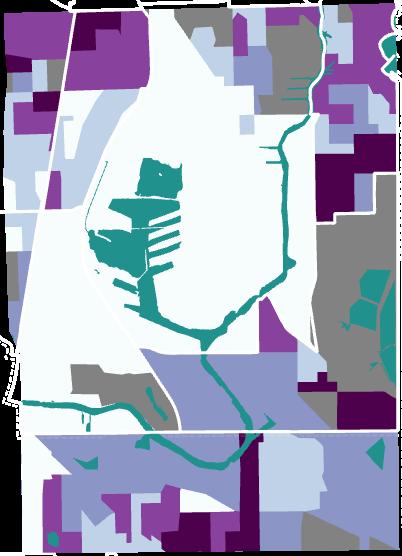
Land Use
The study area has a higher percentage of industrial, transportation, and open space land uses than the City of Chicago as a whole. Residential land uses are centered within each community areas or municipal boundary. Commercial corridors are represented as integral to the residential land use.
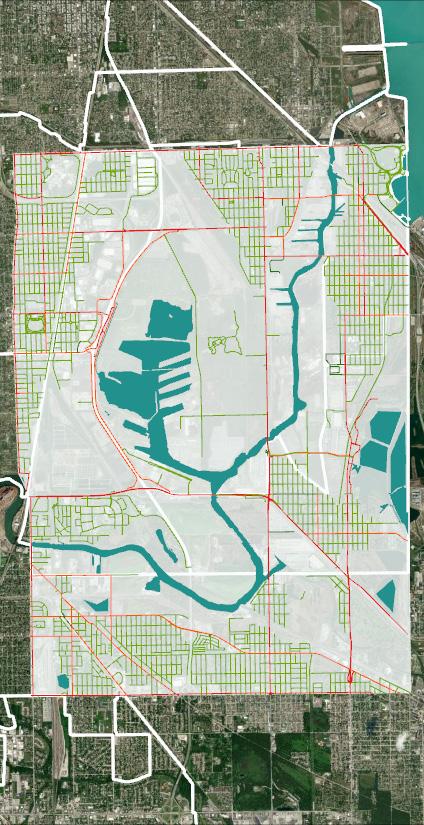
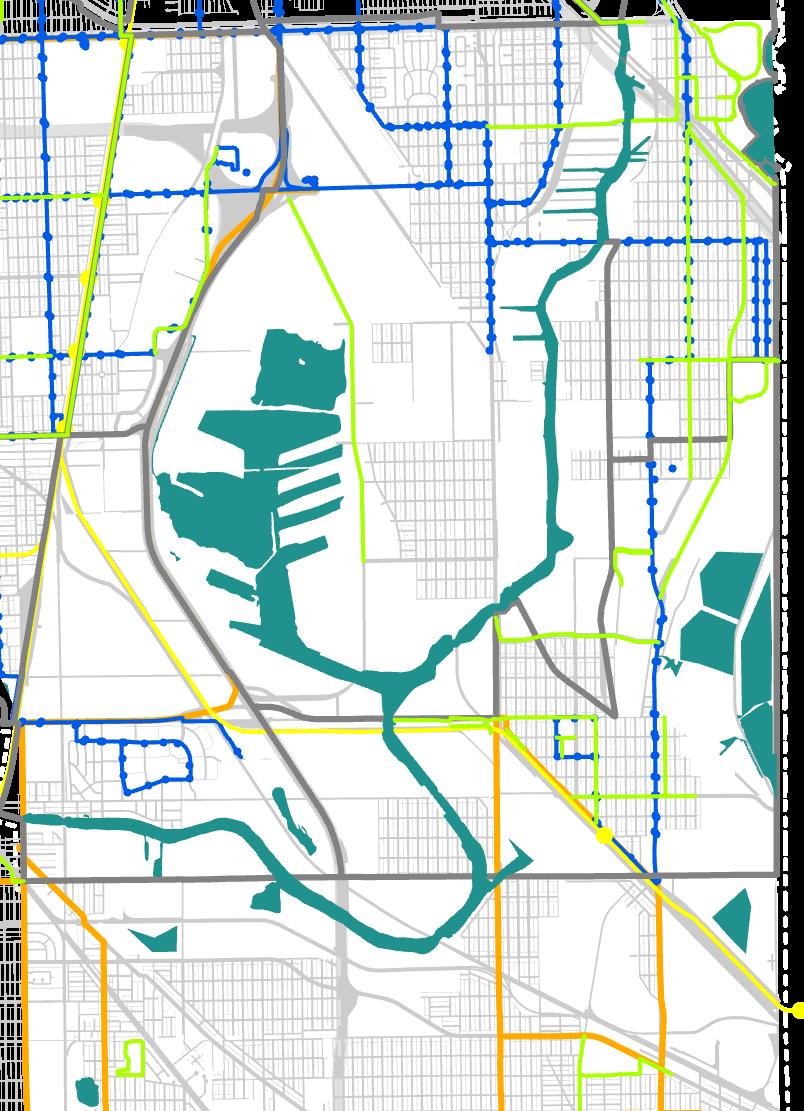
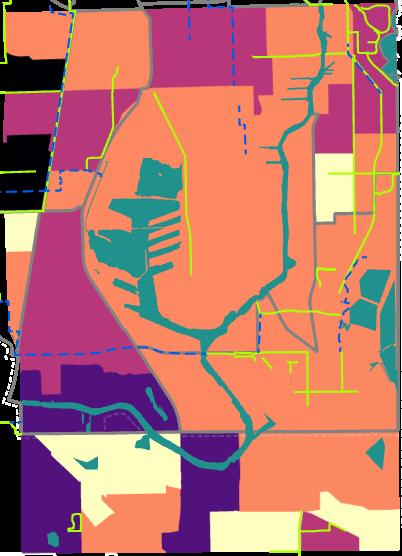
Level of Traffic Stress (LTS) is a qualitative measure that estimates the level of stress that would be experienced by a bicyclist traveling along a roadway. It is a function of roadway width, posted speed, and the amoung of facility width allocated to a bicyclist that is not shared with automobile traffic. LTS is assigned on a scale of 1 to 4, with 1 corresponding to low stress and 4 to high stress.
Source: Cook County Department of Transportation and Highways (DOTH)
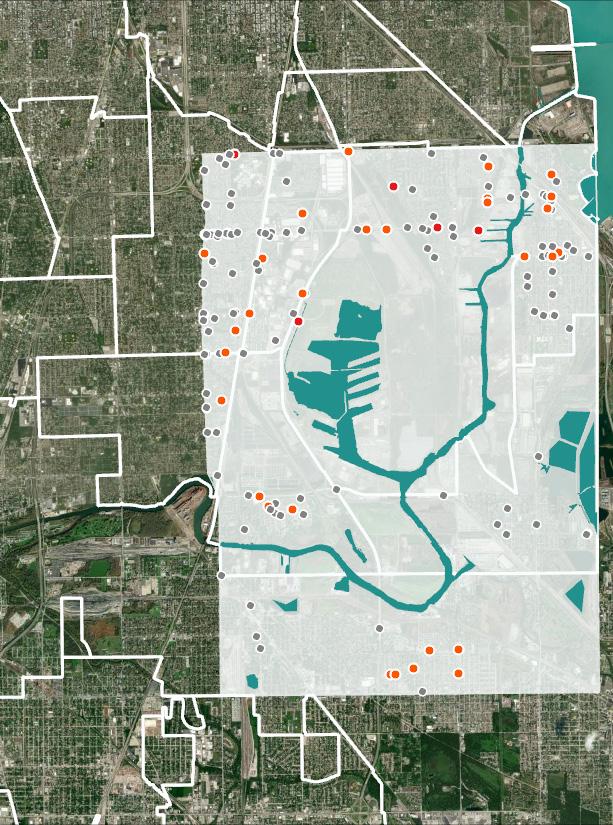
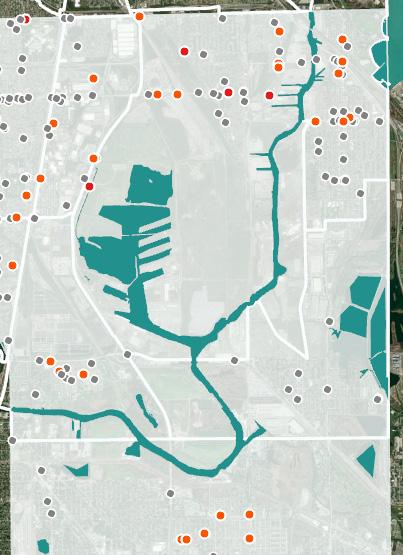
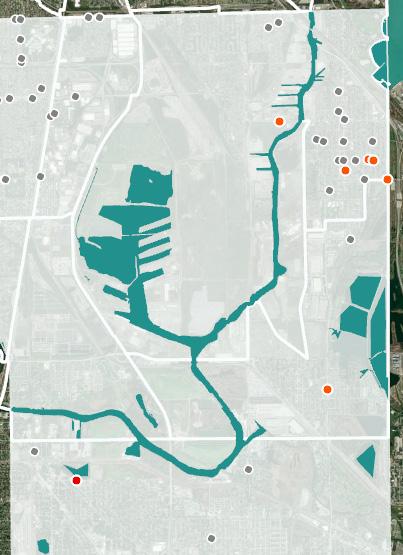
Pedestrian Crashes
Between 2017 and 2021, there have been 164 pedestrian crashes. Out of the 164 total pedestrian crashes, 5 (3%) resulted in a fatality, 31 (19%) resulted in an incapacitating injury, 76 (47%) resulted in a non-incapacitating injury, 30 (18%) resulted in reported injuries, but found not evident, and 22 (13%) resulted in no indication of injury. Pedestrian fatalities occurred in the northern half of the study area with one on Doty Avenue, one on 95th Street near Chicago State University, and three others on Commercial Avenue, Van Vlissingen Road, and Bensley Avenue near the East Side neighborhood.
Out of the 46 total bicyclist crashes, 1 (2%) resulted in a fatality, 6 (13%) resulted in an incapacitating injury, 19 (41%) resulted in a non-incapacitating injury, 9 (20%) resulted in reported injuries, but found not evident, and 11 (24%) resulted in no indication of injury. The one bicyclist fatality in the study area between 2017 and 2021 occurred in Dolton at the intersection of 142nd Street and Langley Avenue.
Locations of bicycle and pedestrian crashes correlate with roads of high AADT. Higher volumes of traffic, on roads with higher speeds of travel, are more dangerous for vulnerable road users such as pedestrians and cyclists.
Equity Analysis
The Equity analysis assesses the distribution of benefits and burdens among different population groups or communities. It involves evaluating the existing bicycle network and how it impacts various demographic, socioeconomic, and geographic factors to ensure fairness and equal access for all individuals.
An Equity Analysis was conducted in the study area and utilized data sets collected and visualized on the maps in the previous chapters. The study area was investigated through the three factors of accessibility, safety, and affordability. Data sets related to resident demography were acquired from the 5-year estimates of the American Community Survey.
The Impact of Land Use on the Equity Analysis
The Equity Analysis addresses the entirety of the project study area, however, significant portions of this geography are identified as an industrial land use. These areas include transportation infrastructure, utility infrastructure, and other industrial uses that do not have a significant residential component. In all of the analysis maps, the data sets that are represented are continuous through these areas. However, for the purposes of this analysis, we have excluded these areas from the analysis because of their lack of residential density.
Concentrations of industrial land use are primarily located in Riverdale, on the southwest edge of the study area, and Pullman, on the north side of the study area. While new points of connection and bike or pedestrian infrastructure may be contemplated for these areas, for the purposes of the equity analysis, these areas have been excluded from the analysis. To perform the equity analyses, three elements were identified to structure which data sets should be used to perform the analysis, and, which priority factors were necessary to understand to reach conclusions that fostered equitable distribution of bike facilities and infrastructure. The three elements that will be assessed are: accessibility, safety, and affordability.
These three factors quantitatively assess the spatial distribution of the study area bicycle infrastructure supply and how it serves (or doesn’t serve) residents. The factors also include analysis of specific data sets that reveal barriers and utilizes data to identify the low-equity groups and the variables that limit (or don’t limit) their demand for
bike facilities and infrastructure. When combined the these three factors present a more comprehensive picture and nuanced understanding of gaps in the bicycle network that should be prioritized to serve those most in need.
Following is the approach and methodology that was used to assess the study area:
Accessibility
The accessibility factor assesses whether the proposed bicycle network provides equitable access to different neighborhoods, communities, and demographic groups. Accessibility to bicycle facilities and infrastructure is critical to overcoming barriers that may impact socio-economic status, availability of employment, educational opportunities, housing choice, healthcare, and satisfying commercial/retail needs.
Analytical Methodology
The analysis that was performed identifies gaps in providing equitable access and reduction of disparities based on income, race, and age.
• Proximity to bicycle lanes and the low-stress network
• Connectivity to key destinations such as schools, retail, places of employment, parks, and recreational amenities
The following datasets were used to determine priority areas to focus mitigation efforts on gap disparities:
• Percentage of population in Historically Disadvantaged Communities within 10mins of a bicycle facility
• Percentage of population in census tracts with one or less cars per household
• Percentage of population in low English proficiency tracts
Safety
Evaluating the safety implications of the bicycle network for various user groups, including vulnerable populations such as children, seniors, and people with disabilities is critical to understand how to mitigate negative impact for those most at risk. The safety analysis is an important factor in the equity analysis and key recommendations related to ensuring network gaps in areas with the highest safety concerns are prioritized.
Analytical Methodology
An analysis was performed that result in identifying contributing factors to enhance cyclist safety. These key elements and data sets included:
• Traffic volume
• Road conditions
• Intersection design
• Presence of barriers or hazards that could disproportionately affect certain communities
Affordability
To reduce barriers to modal choice for residents, affordability in transportation planning must be addressed. The financial implications of bicycle network access for a variety of socio-economic groups were examined in this study. These variables address the creation of key recommendations that prioritize low-income households who historically, spend the largest portion of their annual income on transportation costs.
Analytical Methodology
The analysis that was performed identified contributing factors to understand how to ensure those households that are most in need, are able to access and utilize the bicycle network within their means. These key elements and data sets included:
• Current method of commuting
• Percentage of annual median household income spent on transportation
• Percentage of population in low median income tracts with access to biking facilities.
• Commute time to work
Process Diagram
ACCESSIBILITY SAFETY AFFORDABILITY
Percentage of White Population
Percentage of Black Population
Percentage of Hispanic Population
Average Median Household Income
Number of Workers who Commute to Work on a Bicycle, 16 Years of Age or Older
Number of Workers Who Commute to Work in Car, Truck and Van, 16 Years of Age or Older
Number of Workers who Commute to Work using Public Transportation including Cabs, 16 Years of Age or Older
School Catchment Areas with Sidewalk Inventory
Average number of Vehicles per Household
Access to Commercial Centers
Household Annual Transportation Cost
Historically Disadvantaged Tracts
Average Annual Daily Traffic
Pedestrian Crashes
Bicyclist Crashes
KEY RECOMMENDATIONS
Image Source: LJC
Accessibility
Race and Ethnicity
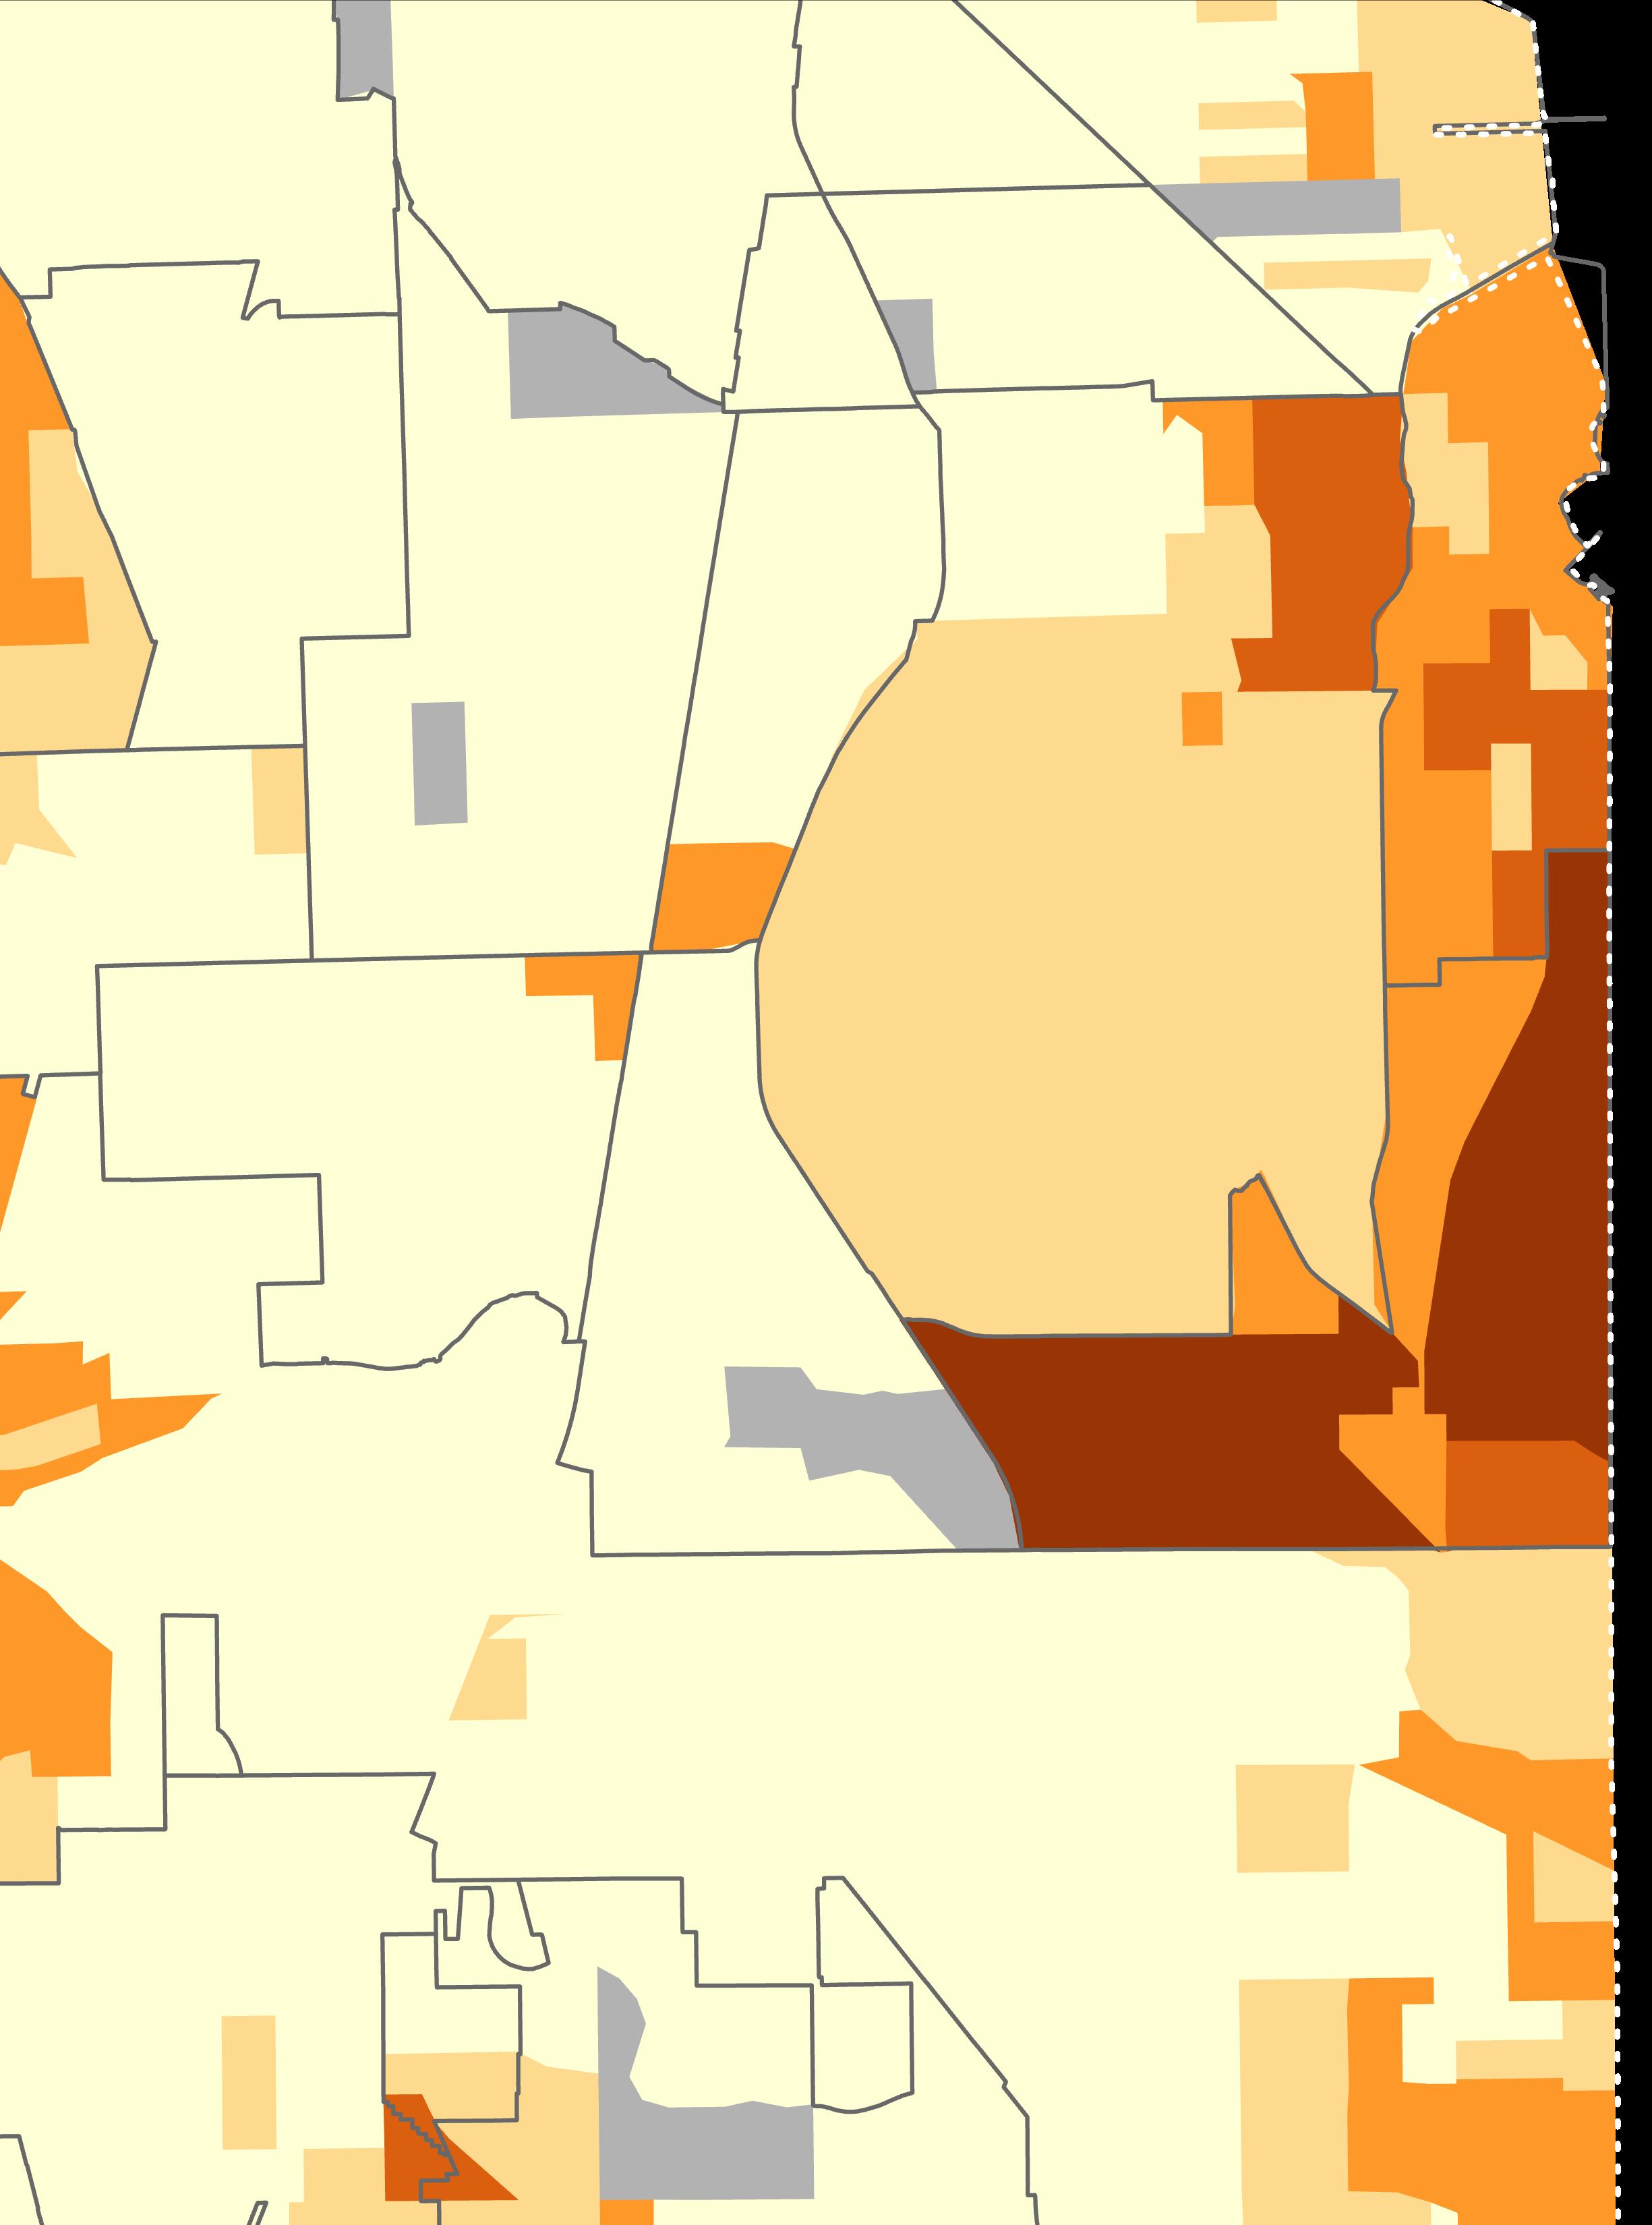
Generally, the study area is very diverse with representation of several race groups present. However, the data illustrates that the three race groups represented generally reside in separate sectors with in the study area geography. For example, areas of high concentrations of AfricanAmericans have low representation of White or Hispanic populations. The total population within the study area is 104,000 residents. Of that population, 66,000 are African-American. This is over 50% of the total area population. Within the study area, Roseland and Riverdale have the highest concentration of African-Americans with the exception of historic Pullman and an area south of Palmer Park.
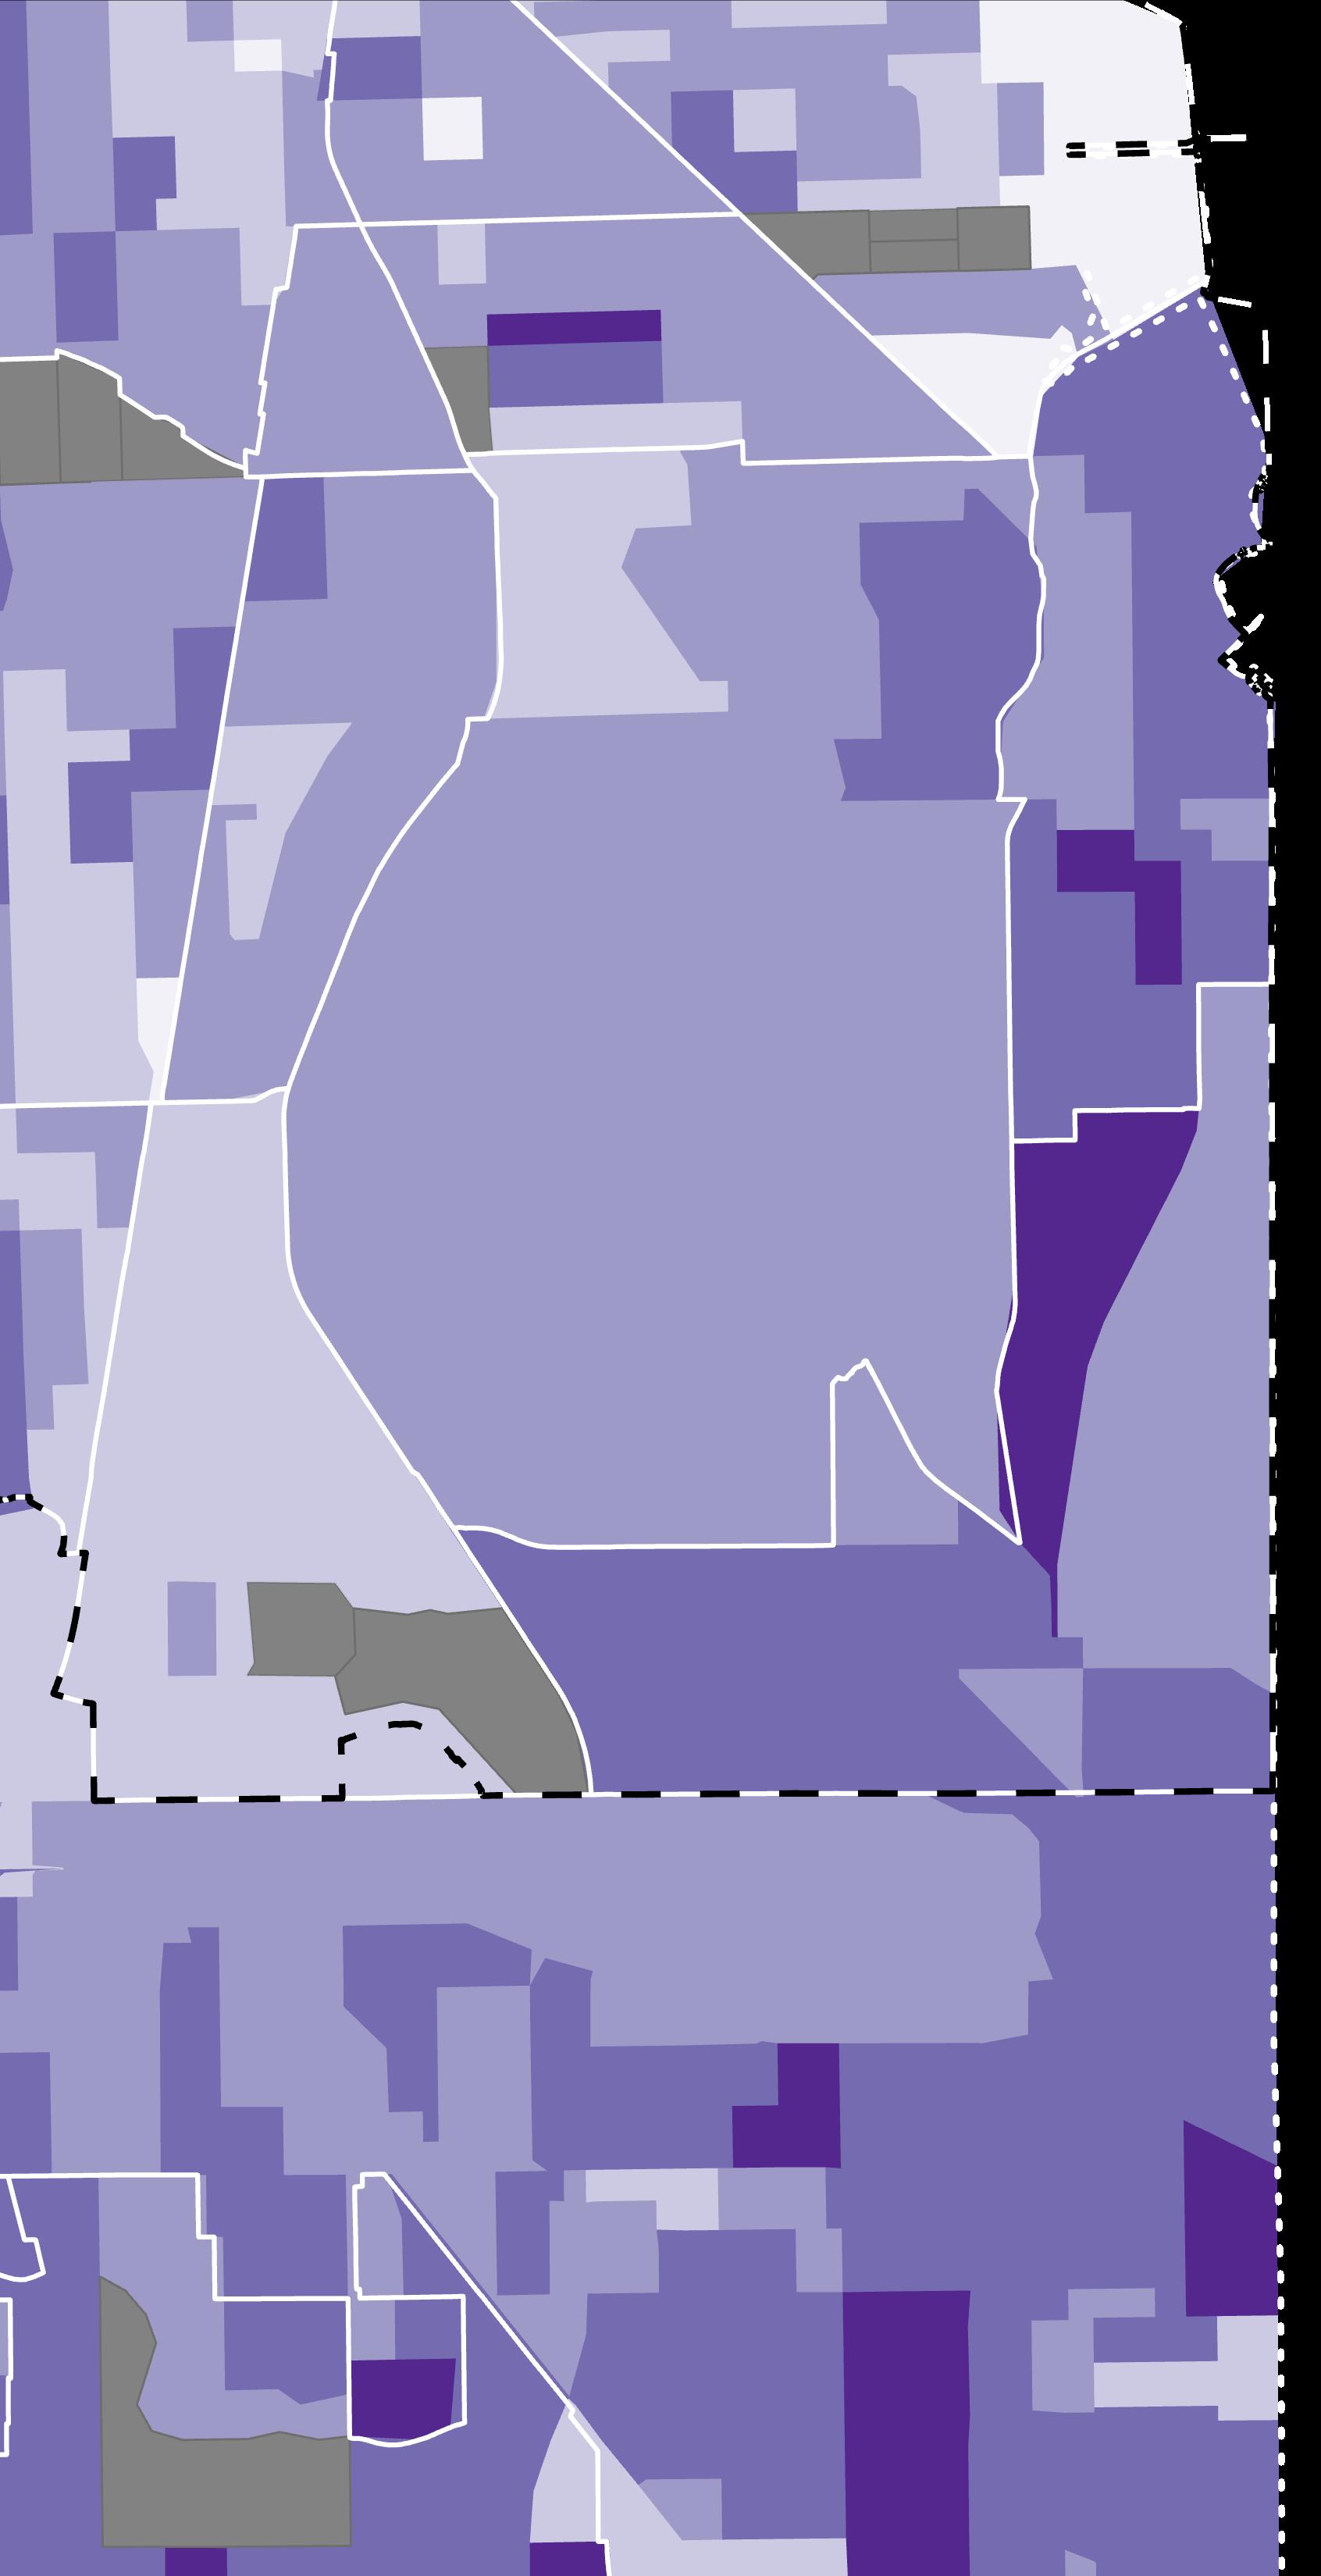
Average Number of Vehicles Per Household
The average number of vehicles in a household is an indicator of greater modal choice and ability to reach desired destinations. Within the study area, generally, most households have one to two cars available. The households with the most cars (2.0-4.0 cars) available are located in East Side, the eastern portion of Hegewisch, and the southern portion of Burnham. The Riverdale community has the lowest average number of vehicles per household, with some households not having access to a car (area average is 0.5-1 car). The only area where the majority of households do not have access to a car is the southeastern corner of Roseland, which also corresponds to the section where residents spend the lowest amount on transportation annually. The residents of Riverdale and Dolton communities have a limited or almost no access to a bicycle network.
Safety
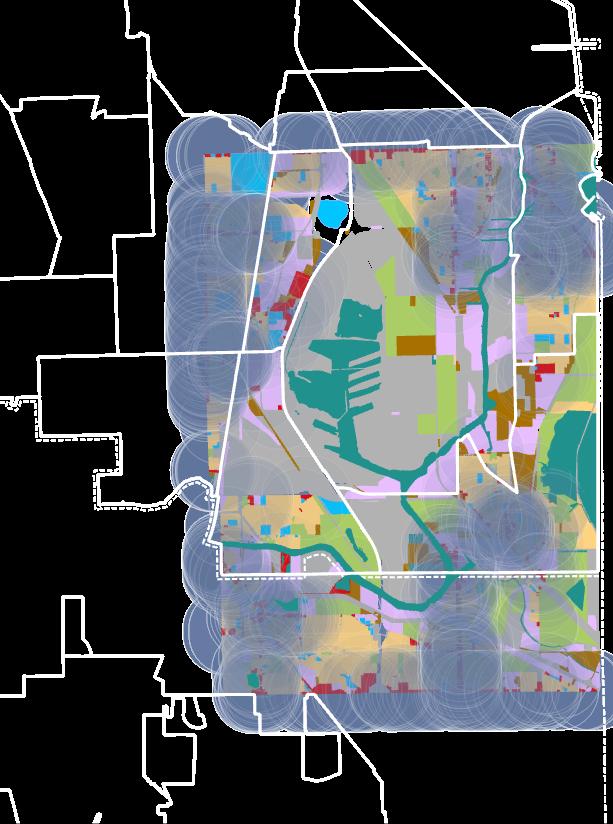
School Catchment Area with Sidewalk Inventory
The community areas of Riverdale, Dolton, and Burnham have no access to bike routes within 10 minutes of walking distance from a school. Schools on the northern end of South Deering also have limited access to a bike network. Limited access to a bike network and lack of sidewalk continuity elevates safety concerns for the subject neighborhoods.
Pedestrian Crashes
A significant number of pedestrian crashes occur within the Roseland, Pullman, South Deering, and East Side communities. Out of the total of five pedestrian fatalities recorded in the study area, three took place in South Deering, specifically on streets lacking sidewalks. The majority of incidents reported in the Pullman and East Side neighborhoods result in non-incapacitating injuries. In the Burnham neighborhood, incidents causing incapacitating injuries were reported on the southern side of the community area.
Bicycle Crashes
Among the 46 bicyclist accidents recorded, a majority were reported in the East Side neighborhood. Most of the injuries reported were non-incapacitating. The sole fatality within the specified study period from 2017 to 2021 took place in Dolton, specifically at the intersection of 142nd Street and Langley Avenue.
Affordability
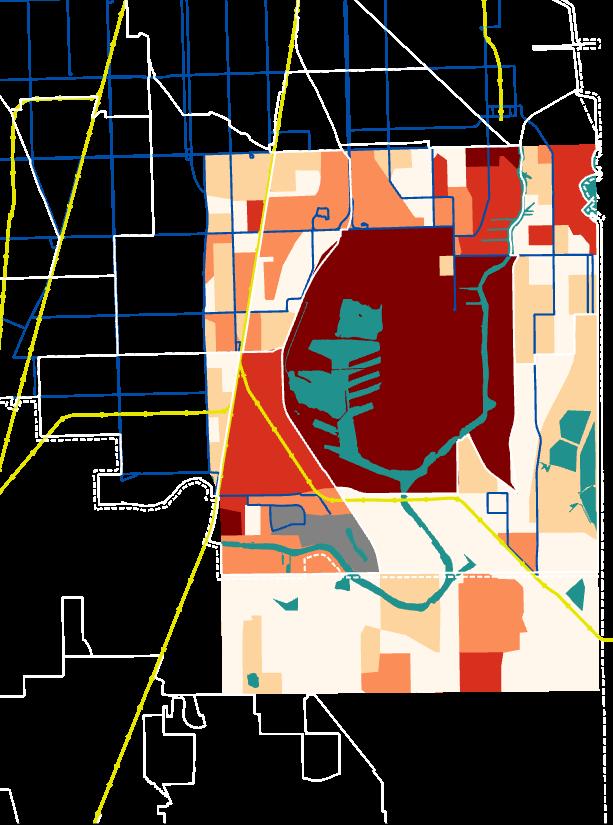
Household Annual Transportation Cost
Most of the households within the study area spend between $11,500 to $14,500 on transportation annually. Areas spending less $11,500 are primarily Black, and are more proximate to public transit options. The lowest amount of money spent on transportation within the study area is in the southeast corner of Roseland, which is likely connected to the many commercial areas within a 10 minute walking distance. Despite having limited access to commercial centers within a 10 minute walking distance, 85% of Riverdale community spends the least on transportation annually.
Average Number of Vehicles Per Household
The Riverdale community has the lowest average number of vehicles per household, with most households having an average of 0.5-1cars available. The only area where the majority of households do not have access to a car is the southeastern corner of Roseland, which also corresponds to the community where residents spend the lowest amount on transportation annually. These patterns correlate to similar patterns of median income, with areas having lower income also having low access to vehicles.
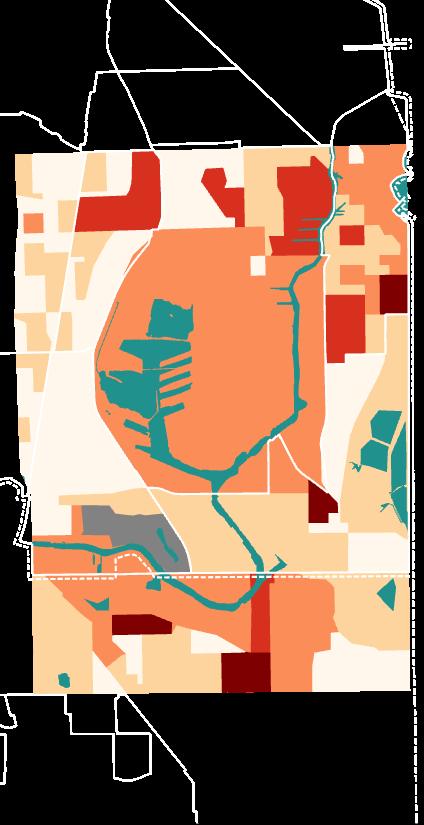
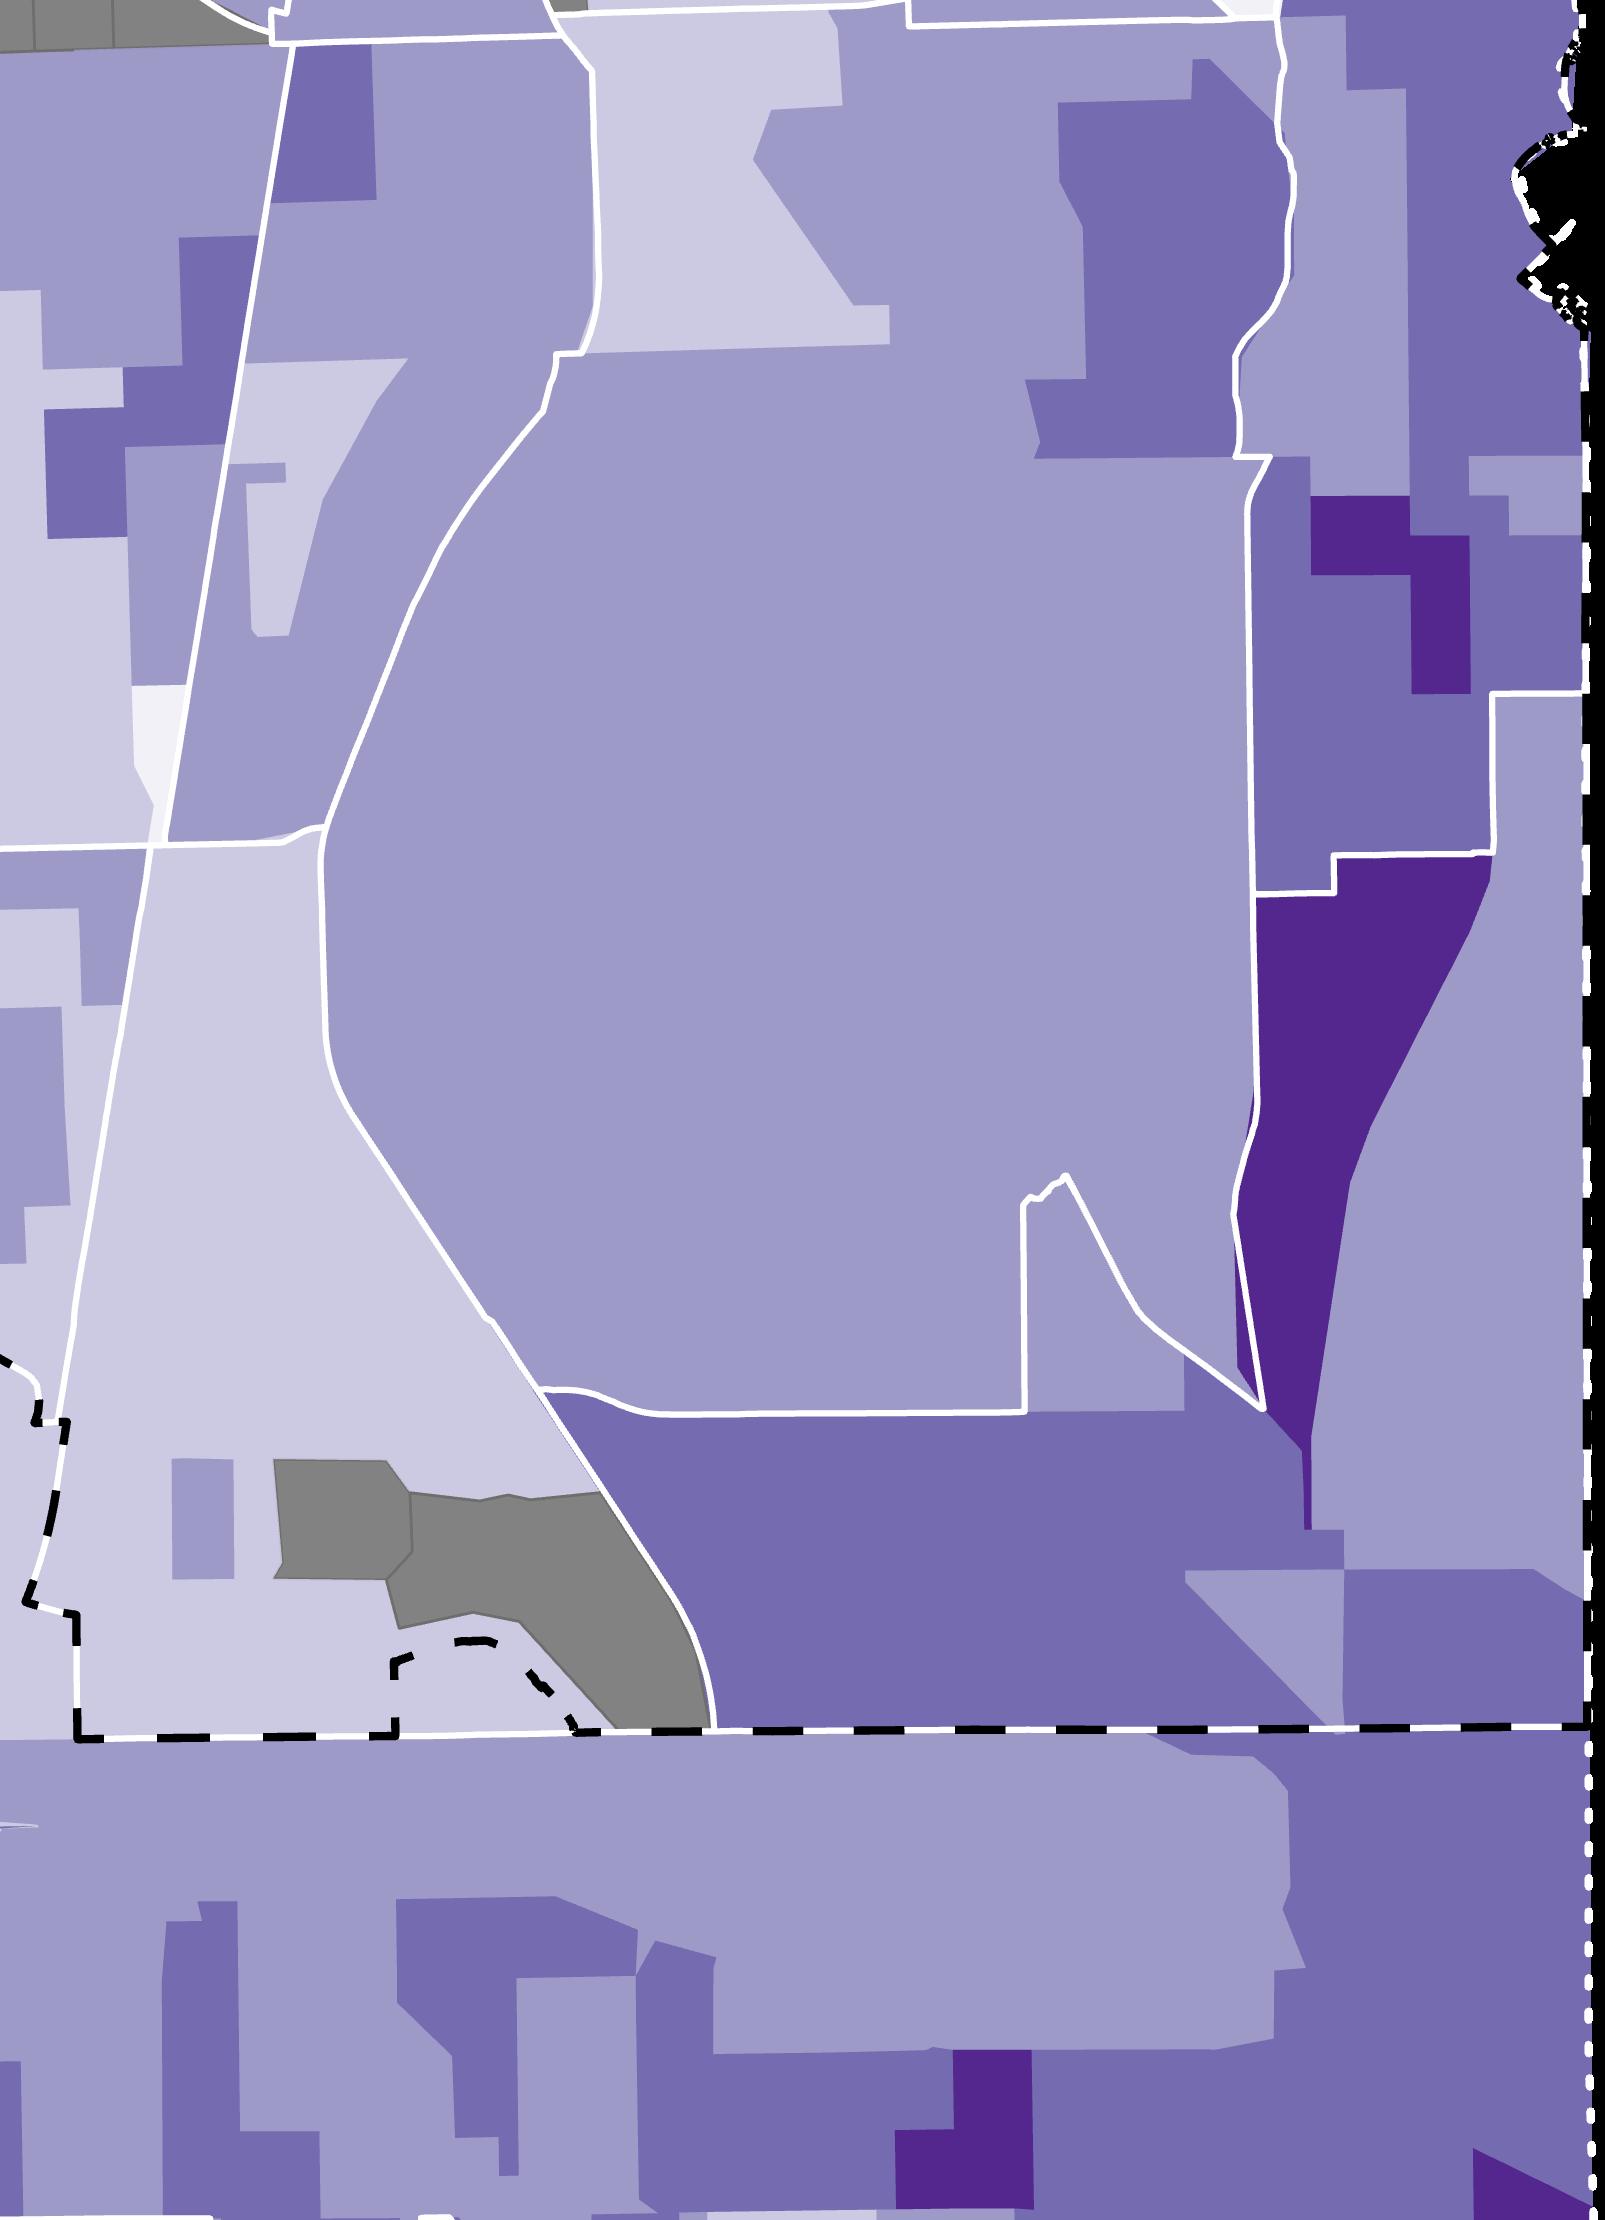
Average Median Household Income
Riverdale and South Deering appear to be largely dominated by a median household income of less than $30,000. The highest income section in the study area is in the southeast corner of Hegewisch, where there is a mix of parks and residential land use. The north western side of Dolton falls on the lower side withing the $30,000 to $50,000 category.
Rudd Resources
Key Recommendations
The following recommendations synthesize data shown in the preceding maps and identify geographies that are most in need of transit infrastructure and facilities. The analysis of various data sets illustrates that a high functioning and equitable multi-modal transportation system is critical to improving quality of life of study area residents most burdened by transportation costs, low median household income, low access to existing transit facilities, high incidence of crash conflicts, and high number of gaps in the sidewalk network. Further, there appears to be an intersection between race and household income that potentially limits resident’s ability to access existing facilities due to location and affordability. The key recommendations serve to close the gap between the three elements of safety, accessibility, and affordability to identify locations for priority consideration for new facilities and opportunities for improved connectivity.
Recommendation 1:
Improve sidewalk connectivity, specifically, encourage sidewalks on at least one side of the street in areas where gaps are most prevalent, to connect existing transit facilities. Priority locations are Roseland and Dolton. An area east of Pullman, while not overpopulated with schools, could benefit from additional sidewalk infrastructure. Gaps in the sidewalk network are present.
Recommendation 2:
Focus on improved multi-modal transportation connectivity in areas of high transportation cost, low car ownership, and low median household income. Priority locations are the East Side,
Hegewisch, and Burham whose households have the highest transportation cost burden. Pullman is a neighborhood with low car ownership and high household income, illustrating that this neighborhood may be better served by transportation than others in the study area.
Recommendation 3:
Coordinate local and regional proposed bike trails with areas that are least connected and have commute times that exceed the study area boundaries. Areas south of Pullman and north of Riverdale would benefit from additional bicycle infrastructure. East-west are underrepresented in the datasets, however, commute times in these neighborhoods exceed 30 minutes and could benefit from additional bicycle infrastructure to reach desired destinations.
RIVERDALE
BURNHAM
DOLTON SOUTH
HEGEWISCH
PULLMAN
Recommendation 4:
Prioritize multi-modal connectivity to destinations most needed by residents in areas that have low transportation access to schools, healthcare facilities, commercial corridors, and other modal choice. The southern border of the study area contains the highest concentration of pharmacies and/or healthserving businesses. This area is also served by PACE bus, however, bicycle infrastructure could be improved to connect neighborhoods to the east and west. Similarly, commercial corridors are generally located west of Lake Calumet. Improved connectivity from community areas to the east to amenities on the west side of Lake Calumet should be improved.
Recommendation 5:
Safety mitigation methods should be concentrated in the geographies of Roseland, Pullman, East Side, and Burnham. While some of these geographies are also well served by transit and bike infrastructure, focus should concentrate on connected sidewalks, access to transit and bicycle facilities, and modal options to ensure access to desired destinations.
Recommendation 6:
Identify and advance catalyst projects that align with established plans and community goals. Collective efforts made by DoTH, CDOT, IDOT, Forest Preserve, and local communities will focus on filling in critical gaps to the bike network and reinforce existing plans for bike network improvements through preliminary engineering, construction, management, and funding.
Bike Network Catalyst Projects
(126th to 130th)
S Cottage Grove Ave (Northern point of study area to 113th)
Stony Island (Doty Ave. to 122nd) 130th (Indiana Ave. East to South Carondolet Ave)
(Cottage Grove to Torrence)
Big Marsh (Lake Calumet Trail south of causeway connecting across Big Marsh park to East 116th St)