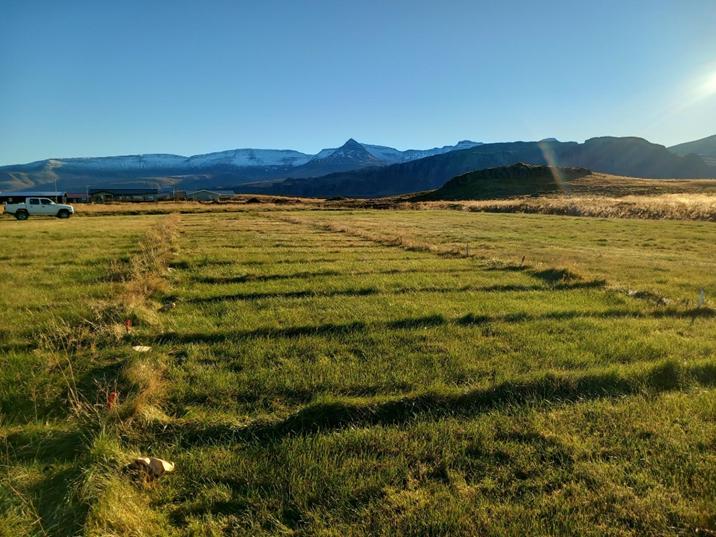
Friederike Dima Danneil
Landbúnaðarháskóli Íslands, 2024
Rit LbhÍ nr. 170
ISSN 1670-5785
ISBN 978-9935-512-46-8
Verkefnið var styrkt af: Þróunarsjóður nautgriparæktar
Höfundur/Ritstjóri: Dr. Friederike Dima Danneil
Ljósmynd á forsíðu: Dr. Friederike Dima Danneil
Uppsetning: Dr. Friederike Dima Danneil
Landbúnaðarháskóli Íslands starfar á sviði sjálfbærrar auðlindanýtingar, búvísinda, umhverfisvísinda, skipulagsfræði og matvælaframleiðslu á norðurslóðum. Fagfólk skólans nýtur akademísks frelsis og hefur sjálfdæmi við val á viðfangsefnum, túlkun niðurstaðna og birtingu þeirra, innan ramma starfsreglna skólans. Hlutverk Rits LbhÍ er að miðla faglegri þekkingu en það er ekki ritrýnt. Efni hvers rits er á ábyrgð höfunda og ber ekki að túlka sem álit Landbúnaðarháskóla Íslands.
8.10
List of Tables
Table 1: Analysis result of cow manure from Hvanneyrarbúið for ammonia, phosphorus, and potassium in 2022 and 2023. The values are given in weight% of the complete, wet manure with a dry matter content of 4.8% in both years. ................................................................................................................. 2
Table 2: Macronutrients N (NH4-N), P, and K applied per 10 m2 plot when spreading 25 kg of cow manure per 10 m2 plot; nutrient target in g/10 m2; missing nutrients in g/10 m2 2
Table 3: Slurry treated with AGRIMEST loses in 56 days only 2.45% N. Non-treated slurry loses 18% N. Data source: Wageningen University and Research Centre (2006). 3
Table 4: Cow manure mixtures with additives Viscolight, Haugmelta XLG, Nova Optimizer, and AgriMestMix. .......................................................................................................................................... 4
Table 5: Cow manure mixture with additive Traust hrausti (sulfuric acid). 5
Table 6: Summary of mineral fertilizer NPK 20-10-10 amount per plot, and amounts of the nutrients N, P, and K applied in each plot (10 m2). 5
Table 7: Timeline of the project „Cow manure mixed with disinfecting/deodorizing additives as fertilizer“ of the years 2022 and 2023. 10
Table 8: Mean NDVI value and standard deviation per fertilizer treatment on or just before the mowing dates (cut 1: 22.06.2022, cut 2: 02.08.2022, and cut 3: 13.09.2022). .................................................... 12
Table 9: Mean NDVI value and standard deviation per replica block on or just before the mowing dates (cut 1: 22.06.2022, cut 2: 02.08.2022, and cut 3: 13.09.2022). 12
Table 10: Results of Tukey´s test for f1 discerning between the mean NDVI values of different dates throughout the growing season. Standard deviation and assigned groups are shown. .......................... 14
Table 11: Mean height value and standard deviation in cm per fertilizer treatment on or just before the cutting dates (cut 1: 22.06.2022, cut 2: 02.08.2022, and cut 3: 13.09.2022). *p-value calculated with Kruskal-Wallis method. 15
Table 12: Mean height and standard deviation per replica block on or just before the mowing dates (cut 1: 22.06.2022, cut 2: 02.08.2022, and cut 3: 13.09.2022). *p-value calculated with Kruskal-Wallis method. 15
Table 13: Results of Tukey´s test for f1 discerning between the mean height values of different dates throughout the growing season 2022. Standard deviation and assigned groups are shown. ................. 16
Table 14: Mean dry matter yield and standard deviation in t per fertilizer treatment on the cutting dates (cut 1: 22.06.2022, cut 2: 02.08.2022 and cut 3: 13.09.2022). 17
Table 15: Mean dry matter yield and standard deviation per replica block on the cutting dates (cut 1: 22.06.2022, cut 2: 02.08.2022, and cut 3: 13.09.2022). ........................................................................ 17
Table 16: Total dry matter yield and standard deviation in t per fertilizer treatment as sum of the mean dry matter yields of each treatment over all cutting dates (cut 1: 22.06.2022, cut 2: 02.08.2022. and cut 3: 13.09.2022). ....................................................................................................................................... 18
Table 17: Total dry matter yield and standard deviation in t per replica as sum of the mean dry matter yields of each replica over all cutting dates (cut 1: 22.06.2022, cut 2: 02.08.2022. and cut 3: 13.09.2022). 18
Table 18: Tukey´s test of dry matter yield for the pairwise significant difference between dmy of different cuts in 2022. 18
Table 19: Results of the soil analysis per analyzed parameter and treatment. Given are mean, standard deviation, and group, where p < 0.05. 20
Table 20: Results of the soil analysis per analyzed parameter and replica. Given are mean, standard deviation, and group, where p < 0.05. ................................................................................................... 21
Table 21: Results of the hay analysis per analyzed nutritional parameter and treatment for cut 1. Given are mean, standard deviation, and group, where p < 0.05. 23
Table 22: Results of the hay analysis per analyzed nutritional parameter and treatment for cut 2. Given are mean, standard deviation, and group, where p < 0.05. .................................................................... 25
Table 23: Results of the hay analysis per analyzed nutritional parameter and replica for cut 1. Given are mean, standard deviation, and group, where p < 0.05. 27
Table 24: Results of the hay analysis per analyzed nutritional parameter and replica for cut 2. Given are mean, standard deviation, and group, where p < 0.05. .......................................................................... 28
Table 25: Mean NDVI value and standard deviation per fertilizer treatment on or just before the mowing dates (cut 1: 03.07.2023 and cut 2: 23.08.2023). 30
Table 26: Mean NDVI value and standard deviation per replica on or just before the mowing dates (cut 1: 03.07.2023 and cut 2: 23.08.2023). ...................................................................................................
30
Table 27: Results of Tukey´s test for f1 and f4 discerning between the mean NDVI values of different dates throughout the growing season. Standard deviation and assigned groups are shown.
31
Table 28: Results of Tukey´s test for f1 discerning between the mean NDVI values of different replicas throughout the growing season. Standard deviation and assigned groups are shown.
31
Table 29: Mean height value and standard deviation in cm per fertilizer treatment on or just before the cutting dates (cut 1: 03.07.2023 and cut 2: 23.08.2023).
32
Table 30: Mean height and standard deviation per replica block on or just before the mowing dates (cut 1: 03.07.2023 and cut 2: 23.08.2023.
32
Table 31: Results of Dunn´s test for f1 discerning between the mean height values of different dates throughout the growing season 2023. Standard deviation and assigned groups are shown. .................
33
Table 32: Mean dry matter yield and standard deviation in t per fertilizer treatment on the cutting dates (cut 1: 03.07.2023, cut 2: 23.08.2023).
34
Table 33: Mean dry matter yield and standard deviation per replica block on the cutting dates (cut 1: 03.07.2023, cut 2: 23.08.2023). .............................................................................................................
34
Table 34: Total dry matter yield and standard deviation in t per fertilizer treatment as sum of the mean dry matter yields of each treatment over both cutting dates (cut 1: 03.07.2023, cut 2: 23.08.2023).
34
Table 35: Total dry matter yield and standard deviation in t per replica block as sum of the mean dry matter yields of each treatment over both cutting dates (cut 1: 03.07.2023, cut 2: 23.08.2023). .......... 35
Table 36: Total dry matter yield and standard deviation in t per cut as sum of the mean dry matter yields of each treatment on both cutting dates (cut 1: 03.07.2023, cut 2: 23.08.2023).
35
Table 37: Summary of the cutting schedule in this experiment and calculated growth rate (cm/d) according to the measured crop height. *days after fertilizing ..............................................................
39
Table 38: Summary of the cutting schedule in this experiment and calculated dry matter yield rate (kg/ha/d) according to the measured crop height. The abbreviation „sd“ is for „standard deviation“. *days after fertilizing .............................................................................................................................
40
47
Table 39: Dry matter yield, mean protein content, mean sugar content, harvested protein and sugar content, and FEm/ha of the first cut in 2022.
Table 40: Dry matter yield, mean protein content, mean sugar content, harvested protein and sugar content, and FEm/ha of the second cut in 2022. .................................................................................... 48
Table 41: Dry matter yield, harvested protein and sugar content, and FEm/ha of the first two cuts in 2022. 48
Table 42: Agronomic efficiency (AE) and partial factor productivity (PFP) of applied N, calculated for FEm and dmy in 2022. For FEm the results of chemical analysis for cuts 1 and 2 are used, for dry matter yield, the added yield of all three cuts is used. ...................................................................................... 49
Table 43: Agronomic efficiency (AE) and partial factor productivity (PFP) of applied N, calculated for dmy in 2023. *The fertilizer dosages for ta3 and ta1 are exchanged for the calculations since the dmy strongly indicates that an error during preparation occurred. ................................................................ 50
Table 44: Apparent crop recovery efficiency of N (RE) and internal utilization efficiency of applied N (IE); calculated based on the protein values of the chemical analysis of cut 1 and cut 2 in 2022 (Table 21 and Table 22).
51
Table 45: Apparent crop recovery efficiency of P (RE) and internal utilization efficiency of applied P (IE); calculated based on the chemical analysis of cut 1 and cut 2 in 2022 (Table 21 and Table 22). 51
Table 46: Apparent crop recovery efficiency of K (RE) and internal utilization efficiency of applied K (IE); calculated based on the chemical analysis of cut 1 and cut 2 in 2022 (Table 21 and Table 22). .. 52
List of Figures
Figure 1: Filling the barrels with cow manure on 12.5.2022 (first three images on the left), and on 08.05.2023 (image on the right). 4
Figure 3: Field layout of the 36 trial plots in 2022. Exemplary driving path for fertilizer application f3: The blue arrows indicate the driving path of the tractor applying fertilizer f3........................................ 6
Figure 4: Field layout of the 40 trial plots in 2023. Exemplary driving path for fertilizer application f3: The blue arrows indicate the driving path of the tractor applying fertilizer f3. 6
Figure 5: Trial field locations at Hvanneyri in 2022 and 2023. In 2022, the experiment was carried out on field no. 3, highlighted in blue. In 2023, the experiment was carried out on field no. 22, highlighted in red (source Jörð.is, 23.05.2024). 6
Figure 6: left – manure application; right – mineral fertilizer application; spreading date 18.05.2022. 7
Figure 7: Exemplary measurement with the NDVI device (combination of two sensors). The NDVI value here is 0.83. 8
Figure 8: Platemeter in the field. 8
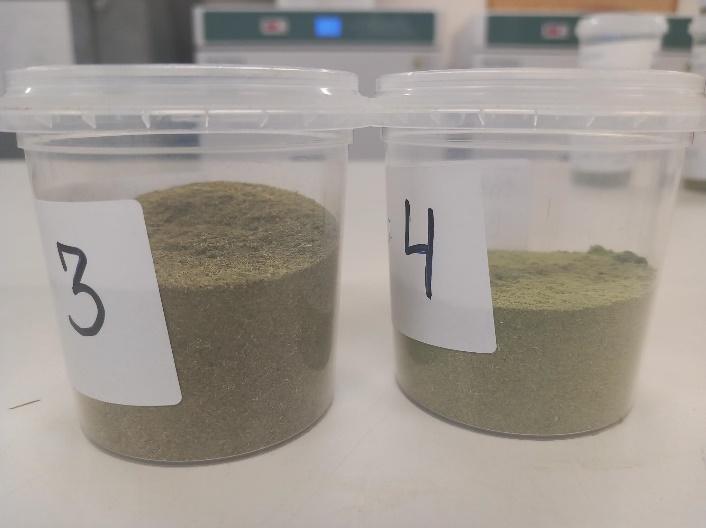
Figure 9: Ground hay samples for plots 3 and 4 of the first cut. ............................................................. 9
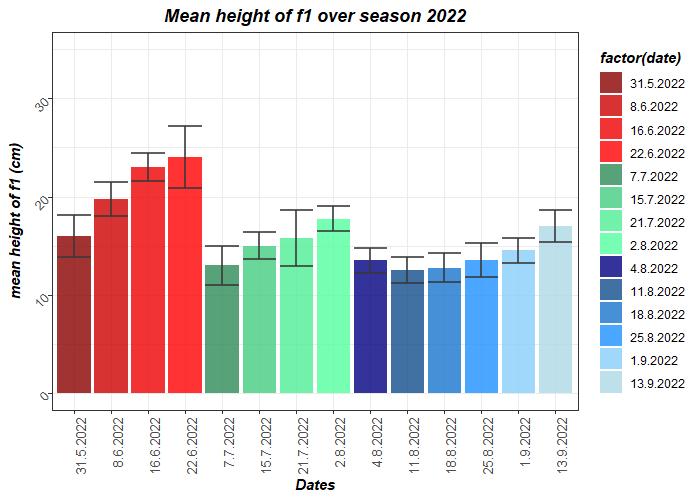
Figure 10: Mean NDVI and standard deviation of treatment f1 (cow manure + Viscolight) over the growing season in 2022. The color changes between red, green, and blue indicate the time periods between mowing dates. 13
Figure 11: Mean height and standard deviation in cm of treatment f1 (cow manure + Viscolight) over the growing season in 2022. The color changes between red, green, and blue indicate the time periods between mowing dates. 16
31
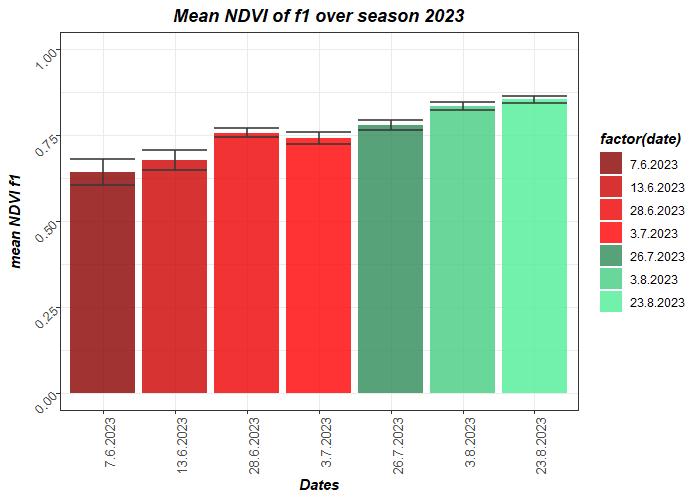
Figure 12: Mean NDVI and standard deviation of treatment f1 (cow manure + Viscolight; left) and f4 (cow manure + AgriMestMix; right) over the growing season in 2023. The color changes between red and green indicate the time periods between mowing dates.
Figure 13: Mean height and standard deviation in cm of treatment f1 (cow manure + Viscolight; left) and f4 (cow manure + AgriMestMix; right) over the growing season in 2023. The color changes between red and green indicate the time periods between mowing dates. ..........................................................
33
Figure 14: Trial field on August 2nd, right after the 2nd cut. The older, yellow part of the grass plants become visible after the cut.
Figure 15: Photography of plot 18 (ta3) after the second cut on 02.08.2022. .......................................
36
37
Figure 16: Shown are plots that are exemplary for the replica block at the growth stage just before the first cut on Jun2 23rd 2022. From left to right: plot 1 (replica block 1), plot 14 (replica block 2), plot 24 (replica block 3), plot 31 (replica block 4). The blue lines indicate the borders of the plot. In replica block 1 and 2 the weeds ranunculus subborealis, taraxacum spp. and rumex acetosa are all visible in abundance. In replica block 3 and 4 those weeds appear only scarcely.
37
Figure 17: Left – experimental plots before the first cut on 30.07.2023; right – experimental plots before the second cut on 23.08.2023. ............................................................................................................... 38
Figure 18: Average pasture growth rate in lb dm/a/day of rotationally grazed pastures in the Northeast of the United States of America (taken from [28])
38
Figure 19: Correlation between NDVI and dry matter yield on cutting dates 1, 2 and 3. The grey area around the regression line indicates the 95% confidence interval. ........................................................ 41
Figure 20: Correlation between height and dry matter yield on cutting dates 1, 2 and 3. The grey area around the regression line indicates the 95% confidence interval. 42
Figure 21: Correlation between NDVI and dry matter yield on cutting dates 1 and 2. The grey area around the regression line indicates the 95% confidence interval. ........................................................ 43
Figure 22: Correlation between height and dry matter yield on cutting dates 1 and 2. The grey area around the regression line indicates the 95% confidence interval.
44
Figure 23: left – Mulder´s chart (source: [31]); right – updated chart of cross reactions of plant macro and micro nutrients (source: [32]). 45
Samantekt
Markmið tilraunarinnar var að rannsaka áhrif íblöndunarefna á skammtíma áburðargildi kúamykju. Prófuð voru þrjú (2022)/fjögur(2023) mismunandi sótthreinsunarefni sem blanda á í kúamykju til að draga úr lyktarmengun í fjósum og auka flot mykjunnar og um leið tapi á rokgjörnu nitri (mest NH3 en einnig N2O). Virkir hlutar þessara sótthreinsunarefna eru álsílíköt og önnur ólífræn eða lífræn efnasambönd sem drepa bakteríur sem valda losun á koltvísýringi (CO2), metani (CH4), nituroxíði (N2O) og ammoníaki (NH3). Prófuð voru sótthreinsunarefni sem fáanlegar eru á markaði fyrir mykju hér á landi; Viscolight (álsíliköt), Haugmelta XLG (örverur), Nova Optimizer (álsílíköt) og AgriMestMix og áhrif þeirra á áburðargildi kúamykju. Þessum efnum var blandað í kúamykju samkvæmt ráðleggingum framleiðenda. Tilraunin var endurtekin á tveimur mismunandi túnum, nr. 3 árið 2022 og nr. 22 árið 2023, báðar staðsettar á Hvanneyri Athuganir sem gerðar voru árið 2022, bentu til þess að aldur túnsins gæti haft mikil áhrif á niðurstöðuna. Túnin voru frjóvguð með kúaáburði, kúaáburði auk aukaefnanna, kúaáburði sýrðum með brennisteinssýru og hefðbundnum steinefna N-PK áburði í þremur mismunandi skömmtum. Þurrefnisuppskeran var mæld og metin (bæði árin) og heyog jarðvegssýni efnagreind (aðeins fyrsta árið).
Markmiðið var að svara eftirfarandi rannsóknaspurningum:
• Eykur íblönduð mykja til skemmri tíma heyuppskeru á túnum samanborið við ómeðhöndlaða/sýrða kúamykju eða tilbúinn N-P-K áburð?
Svar: Munurinn á þurrefnisuppskeru þriggja (fjögurra árið 2023) mismunandi aukefna var ekki tölfræðilega marktækur. Haugmelta XLG skilaði hæstu dmy árið 2022 af kúaáburði byggðum á áburði. Viscolight var með hæstu dmy árið 2023 af kúamykju sem byggir á áburði. Árið 2022 var hæsta hlutfall steinefnaáburðar (450 kg/ha af NPK 20-10-10) ekki tölfræðilega marktækt hærra en kúamykju áburðurinn miðað við heildar dmy, en það var árið 2023.
• Eykur það næringarinnihald uppskerunnar að bæta sótthreinsiefni í áburð samanborið við ómeðhöndlaðan/sýrðan kúaáburð og steinefnaáburð?
Svar: Næringarefnainnihald uppskerunnar í fyrsta slætti var hæst fyrir steinefnaáburðinn (undantekningu: K, sem var hæst fyrir áburðarmeðhöndlun sem byggir á áburði), og með því lægsta, einkum fyrir P og K, í seinni skerðingunni. Niðurstöður fyrsta sláttar voru tölfræðilega marktækar fyrir mikilvægu stórnæringarefnin P, K, Mg og S. Haugmelta XLG hefur hæsta RE (sýnilega endurheimt ræktunarhagkvæmni endurheimt skilvirkni) fyrir N, P og K af kúamykju sem byggir á áburði. Viscolight hefur lægsta RE fyrir N, P og K af kúamykju sem byggir á áburði.
• Breytir það að bæta sótthreinsiefnum í mykju næringarinnihaldi jarðvegsins samanborið við ómeðhöndlaðan/sýrðan kúaáburð og steinefnaáburð?
Svar: Á heildina litið skilur áburður sem byggir á kúaáburði eftir sig meira (þó ekki tölfræðilega marktækt) magn næringarefna í jarðveginum samanborið við steinefnaáburðinn (undantekning: fosfór).
Af þremur kúaáburðarmeðferðum árið 2022 skildi Nova Optimizer eftir mesta magn næringarefna í jarðvegi, næst á eftir Haugmelta XLG og síðan Viscolight (munurinn var ekki tölfræðilega marktækur).
Sýrður kúaáburður kom á milli Nova Optimizer og Haugmelta XLG. Hreinn kúaáburður skilur eftir sig mest magn af P og K, en einnig Na, í jarðvegi.
viii
Summary
The objective of this experiment is to investigate specific treatments of cow manure with three/four different disinfectants regarding their fertilizer value. The active parts of these disinfectants are aluminosilicates and other inorganic or organic materials. They reduce the gaseous loss of nutrients by killing off bacteria in the cow manure which convert liquid ammonia components to gaseous states like CH4 (methane), NH3 (ammonia), CO2 (carbon dioxide), or N2O (nitrous oxide). The disinfectants used in this experiment are conventionally used by farmers to prevent odor development in the cow shed and to facilitate the cleaning of the manure storage tank. The commercially available, odor-preventing disinfecting products for manures Viscolight (aluminosilicate), Haugmelta XLG (microorganisms), Nova Optimizer (aluminosilicate), and AgriMestMix were tested on how they influence the fertilizer value of cow manure. The experiment was replicated on two different grass fields, no. 3 in 2022 and no. 22 in 2023, both located in Hvanneyri since the observations made in 2022, indicated that the age of the grass field might have a strong impact on the outcome. The grass fields were fertilized with cow manure, cow manure plus the additives, cow manure acidified with sulfuric acid, and conventional mineral N-P-K fertilizer in three different dosages. The dry matter yield was measured and evaluated (both years), and hay and soil samples chemically analyzed (only in the first year).
The three following questions could be answered after conducting the trial:
• Does adding disinfectants to manure increase the dry matter yield – fertilizer value – compared to untreated/acidified cow manure and mineral fertilizer?
The difference between the dry matter yield of the three (four in 2023) different additives, was not statistically significant. Haugmelta XLG resulted in the highest dmy in 2022 out of the cow-manurebased fertilizers. Viscolight had the highest dmy in 2023 out of the cow-manure-based fertilizers. In 2022, the highest rate of mineral fertilizer (450 kg/ha of NPK 20-10-10) was not statistically significantly superior to the cow-manure-based fertilizers with regards to the total dmy, but it was in 2023.
• Does adding disinfectants to manure increase the nutrient content of the harvest compared to untreated/acidified cow manure and mineral fertilizer?
The nutrient content of the harvest in the first cut was highest for the mineral fertilizers (exception: K, which was highest for manure-based fertilizer treatments), and among the lowest, particularly for P and K, in the second cut. The results of the first cut were statistically significant for the essential plant macronutrients P, K, Mg, and S. Haugmelta XLG has the highest RE (apparent crop recovery efficiency) for N, P, and K out of the cow-manure-based fertilizers. Viscolight has the lowest apparent crop recovery efficiency (RE) for N, P, and K out of the cow-manure-based fertilizers.
• Does adding disinfectants to manure change the nutrient content in the soil compared to untreated/acidified cow manure and mineral fertilizer?
Overall, cow-manure-based fertilizers left a greater (not statistically significant, though) amount of nutrients in the soil compared to the mineral fertilizers (exception: phosphorus). Of the three cow manure treatments in 2022, Nova Optimizer left the highest amounts of nutrients in the soil, followed by Haugmelta XLG and then Viscolight (the differences were not statistically significant). Acidified cow manure came in between Nova Optimizer and Haugmelta XLG. Pure cow manure left the highest amount of P and K, but also Na, in the soil.
1 Introduction
Animal manures are a suitable source of nitrogen (N) – and other nutrients – for crops because they provide readily available mineral N (short-term effect), while its organically bound N mostly contributes to long-term and residual fertilizer effects [1]. Compared to the production of mineral fertilizer and its application, manure in combination with the use of crop residues can reduce the gas emissions, reversing the agriculture ecosystem from a carbon source (+2.7 t CO2-eq hm-2year-1) to a carbon sink (-8.8 t CO2-eq. hm-2year-1) [2]. The efficiency of manure N depends on manure physicochemical properties, as well as application period and method [3]. Variability of manure composition firstly originates from animal species and diet [4], [5], [6], [7], and type of husbandry; in addition, other biotic or abiotic processes could further modify manure characteristics, and possibly their N efficiency [8], [9], [10]. The gaseous emissions of cow manure like methane (CH4) and NH3 (ammonia), CO2 (carbon dioxide), or N2O (nitrous oxide), which lower its fertilizer value, also depend on the afore mentioned factors [11]. These gases may also be a concern to animal health in confined buildings [12]. Disinfecting and deodorizing products, like the products used in this experiment, are on the market that help prevent smell of manure, and by this, gaseous losses, which usually also mean a loss of nutrients.
The dry matter yield of the grass – the weight of the dried grass (hay) per hectare – is a good indicator of the efficacy of a fertilizer. The evaluation of the dry matter yield is used in this experiment to determine the effect of the additives to cow manure. The uptake of certain essential plant macro- and micronutrients is also investigated because they play an important role on one hand in the production capacity of the crop, and on the other hand in animal nutrition. The soil is analyzed for its mineral nutrient content after harvest to evaluate any possible differences between different fertilizer treatments.
The evaluation of mineral and feed parameters of the hay, as well as the chemical analysis of soil samples was crucial for answering the research questions of this project.
• Does adding disinfectants to manure increase the dry matter yield – fertilizer value – compared to untreated/acidified cow manure and mineral fertilizer?
• Does adding disinfectants to manure increase the nutrient content of the harvest compared to untreated/acidified cow manure and mineral fertilizer?
• Does adding disinfectants to manure change the nutrient content in the soil compared to untreated/acidified cow manure and mineral fertilizer?
2 Materials, methods, and time schedule
2.1 Materials used
In the following subchapters the different materials and methods that were used in this experiment are described. The last two subchapters describe the overall time schedule of the project and the statistical evaluation of the data.
2.1.1 Cow manure
The preliminary calculations on how much cow manure to use are based on the chemical analysis data of the cow manure of Hvanneyrarbúið from 2022 and 2023. The chemical analysis was performed by Efnagreining ehf. in Akranes. The cow manure is analyzed regarding its content of ammonia (NH4-N), phosphorus (P) and potassium (K). These results fluctuate throughout the year depending on the cow feed, grazing schedule etc. The result of this analysis is given in Table 1 in % of the fresh cow manure. Nitrogen (N), phosphorus (P), and potassium (K) are considered macronutrients for plants. They greatly influence the health and thus the yield of crops [13]. Ammonium N (NH4-N) describes the part of nitrogen in cow manure that is inorganically bound in ammonium molecules and is immediately available to the crop following application [14]
Table 1: Analysis result of cow manure from Hvanneyrarbúið for ammonia, phosphorus, and potassium in 2022 and 2023. The values are given in weight% of the complete, wet manure with a dry matter content of 4.8% in both years.
The fertilizer target for these three nutrients for a grass field on the soil in Hvanneyri (histic andosol) is 120 kg/ha NH4-N, 35 kg/ha P, and 60 kg/ha K. Regarding this nutrient target, the ratio of potassium to NH4-N and potassium to phosphorus is high in cow manure, so it is possible to target the fertilizer need of potassium with cow manure. The targeted nutrient content of about 60 kg/ha K corresponds to about 25 t/ha cow manure, which in turn provides about 1/3 (40 kg/ha) of the regularly targeted N-fertilizing (NH4-N) of 120 kg/ha and a little bit less than 1/3 (10 kg/ha) of the regularly targeted P-fertilizing (35 kg/ha) on the fields in Hvanneyri. With pure cow manure it is not possible to reach the target of 120 kg/ha NH4-N or 35 kg/ha P because their relative concentration would require more manure to be spread than the meadow could tolerate. With a plot size of 10 m2, these considerations result in 25 kg/10 m2 of cow manure. This amount of manure leads to the following amounts of macronutrients N (NH4-N), P and K applied per 10 m2 (see Table 2)
Table 2: Macronutrients N (NH4-N), P, and K applied per 10 m2 plot when spreading 25 kg of cow manure per 10 m2 plot; nutrient target in g/10 m2; missing nutrients in g/10 m2
macronutrients
(NH4-N)
Macronutrients in 25 kg cow manure 2022 (g/10 m2)
Macronutrients in 25 kg cow manure 2023 (g/10 m2)
Nutrient target (g/10 m2)
Nutrient deficit on plot fertilized with 25 kg cow manure 2022 (g/10 m2)
Nutrient deficit on plot fertilized with 25 kg cow manure 2023 (g/10 m2)
2.1.2 Deodorizing additives to cow manure
The cow manure mixtures are prepared in the following way (abbreviated name within the experiment given in the bracket) before being used as fertilizer:
• without any treatment (k),
• acidified with sulfuric acid (a),
• mixed with Viscolight (f1),
• mixed with Haugmelta XLG (f2),
• mixed with Nova Optimizer (f3),
• mixed with AgriMestMix (f4, only in 2023).
The additive Viscolight (f1) is sold as crystalline aluminosilicate. Aluminosilicates mainly have the chemical composition Al2SiO5, so they contain oxides of Al and Si plus countercations. They are not water-soluble. The chemical content is not further described in the data safety sheet by Azelis [15] The action mode of Viscolight is described as that it “( ) binds ammonia and allows manure to have a higher retained nitrogen content, raising its value; nitrogen emissions into the environment are significantly reduced, thus also reducing the odour. Ensures a perfect flow in the intermediate storage channels by absorbing sediment sands, allowing the manure to be transported more efficiently in the preliminary tank and to the manure tower” [16].
The additive Haugmelta XLG (f2) contains 7 - 13 % microorganisms for waste decomposition. It dissolves well with water. It is described as that it contains “numerous strains of active bacterial flora [which] immediately begin the decomposition of organic waste. Haugmelta XLG turns ammonia into protein, which will serve as a long-term fertilizer, instead of burning plants and polluting the groundwater” [17].
The additive Nova Optimizer (f3) consists of Kaolin, which is a rock that contains mainly the mineral Kaolinite. Kaolinite belongs to the category of phyllosilicates, a layered aluminum silicate (chemical composition Al₂Si₂O₅(OH)₄). It is not water-soluble. Like other aluminosilicates, Kaolin has adsorbing, purifying and astringent properties. It „( ) can absorb fertilizer and water. Due to this process, NovaOptimizer acts as a buffer for both manure and water, thus reducing the leaching of manure into groundwater. The ion exchange also reduces airborne pollutants such as odours or evaporation containing ammonia (…). The reason the minerals work so well is that negative ions are converted into positive ones. The ammonia in the manure binds to it, which greatly reduces ammonia evaporation. The product also has a good effect on the fertilizer and produces a more even mass” [18]
AgriMestMix „is a natural mineral blend. It starts important biochemical processes in slurry. AGRIMEST stimulates the growth of micro-organisms like bacteria, which transform organic bound nitrogen into an ammonium nitrogen.” AgriMestMix „prevents effectively from scabbing, smell- and ammonia emission, and promotes micro biological processes. Manure treated with AGRIMEST has more energy available for the micro-organisms living in the soil” [19]. This shows in the higher nitrogen content in the manure treated with AgriMestMix after a certain amount of storage time as shown in Table 3
Table 3: Slurry treated with AGRIMEST loses in 56 days only 2.45% N. Non-treated slurry loses 18% N. Data source: Wageningen University and Research Centre (2006).
slurry Nitrogen (%; day 0) Nitrogen (%; day 56) N-mineral (g/kg; dry matter; day 0) N-mineral (g/kg; dry matter; day 56)
The additives Viscolight, Haugmelta XLG, Nova Optimizer, and AgriMestMix are dosed and added according to the manufacturer’s recommendations (see Table 4). The recommendations on the bottle of AgriMestMix needed to be transformed since all dosages were given in ml per square unit, not cubic unit. The amount of 33 ml/200 l (= 165 ml/m3) was chosen.
Table 4: Cow manure mixtures with additives Viscolight, Haugmelta XLG, Nova Optimizer, and AgriMestMix.
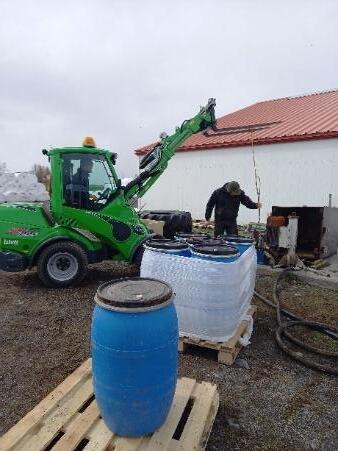
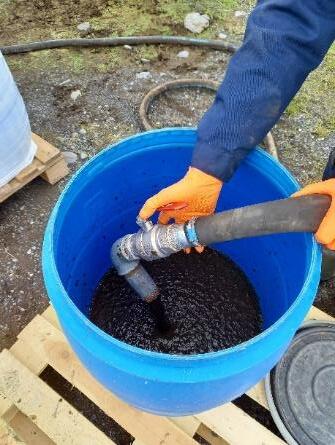
The cow manure used in mixtures f1, f2, and f3 was collected from the main manure storage tank outside of Hvanneyrarbúið on 12.05.2022 and 08.05.2023, respectively. The manure was filled in six 120-lbarrels, 100 l of manure in each barrel (Figure 1). Two barrels were treated equally with the additives in the recommended amounts (Table 4: f1, f2, and f3), so for each 100-l-barrel half of the calculated amounts in column "Additive (ml or g)". The manure for treatment f4 was collected on 17.05.2023 from the manure storage below the barn and directly filled into the container behind the trac tor. This manure was slightly diluted compared to the manure from the outside storage a week earlier, since there was a leakage in one of the water pipes supplying fresh water to the heifers.
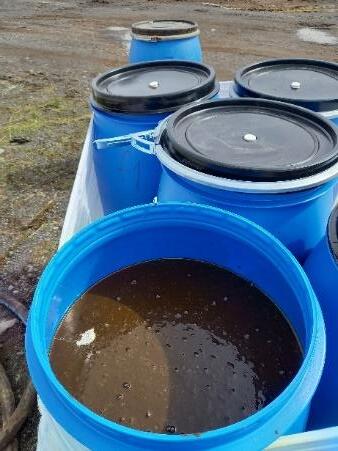
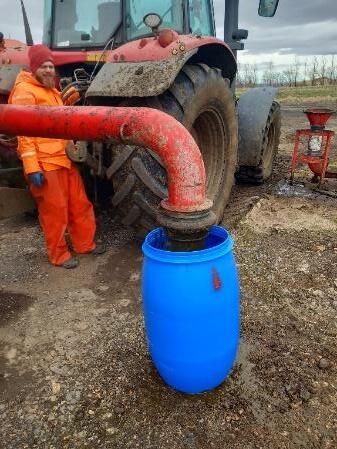
In 2022, the mixtures f1, f2, and f3 sat in the barrels from 12.05.2022 until the day of spreading on 18.05.2022. In 2023, the mixtures f1, f2, and f3 sat in the barrels from 08.05.2023 until the day of field application on 16.05.2023. The AgriMestMix was added on 17.05.2023 directly into the manure tank of the tractor and immediately spread afterwards.
2.1.3 Acidification of cow manure
For the acidifying the cow manure the initial pH level of cow manure was measured at the laboratory of Agricultural University of Iceland (LbhÍ) at Hvanneyri, which was pH = 7.48 in 2022, and pH = 7.55 in 2023. Values from literature [5] are used as a guideline to estimate the amount of sulfuric acid that is needed to lower the pH in one barrel (100 l) to about 6.5. The spreader tank at the back of the tractor is filled with 200 l of cow manure and 960 ml of the pipe cleaner Trausti hrausti (sulphuric acid) According to [20] 960 ml of 70% sulfuric acid – which is in the case of this experiment in form of a pipe cleaner Trausti hrausti [21] that consists mainly of sulfuric acid – lowered 200 l of manure from a pH value of around 7.5 to a pH of about 6.4 which is regarded an economical optimum [22]. The mixture
Figure 1: Filling the barrels with cow manure on 12.5.2022 (first three images on the left), and on 08.05.2023 (image on the right).
Viscolight for mix f1
is summarized in Table 5. The tank contains a built-in pump at the bottom that continuously mixed its content. A good mixture of manure and acid was thus given.
The manure was acidified on the day of its application (18.05.2022 and 17.05.2023, respectively).
Table 5: Cow manure mixture with additive Traust hrausti (sulfuric acid).
additive Mixture abbreviation Mixture amount (l) Additive (ml or g) how to (literature)
Trausti hrausti (HSO4) a 200 960 [20]
In 2023, a pH test of the acidified manure showed, however, that the pH value after acidification dropped to 2.30. This is very low and does not match the calculations. An explanation can be the dilution of the manure with rather soft water, due to a leakage in one of the water pipes supplying fresh water to the heifers which can explain the lower buffer capacity compared to undiluted cow manure.
2.1.4 Mineral fertilizer
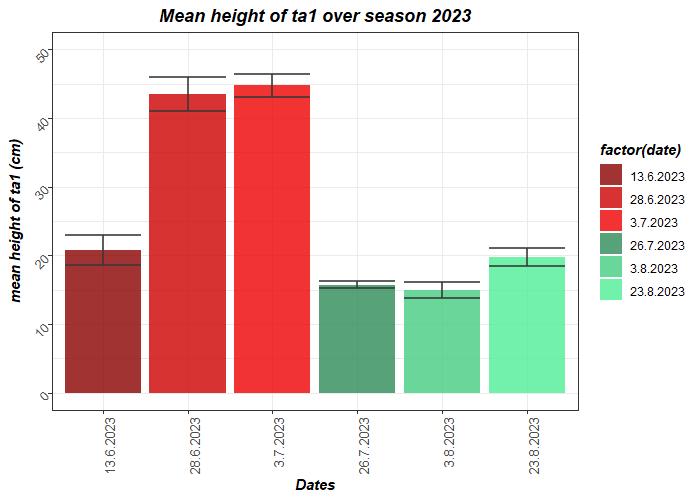
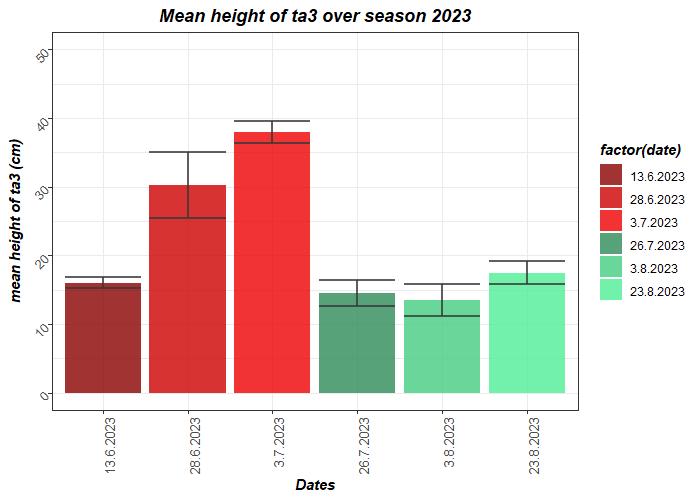
The mineral fertilizer NPK 20-10-10 was prepared in three different dosages of nitrogen: 30 kg/ha, 60 kg/ha, and 90 kg/ha. According to these requirements 150 kg/ha, 300 kg/ha, and 450 kg/ha of mineral NPK 20-10-10 fertilizer were needed. Since the plot size is 10 m2, this corresponded to 150 g/plot, 300 g/plot, and 450 g/plot. The names for the fertilizer dosages were ta1, ta2, and ta3, respectively. The mineral fertilizer applications, and the amount of the nutrients N, P, and K applied, are summarized in Table 6.
Table 6: Summary of mineral fertilizer NPK 20-10-10 amount per plot, and amounts of the nutrients N, P, and K applied in each plot (10 m2).
Fertilizer abbreviation in trial
The fertilizer was weighed accordingly and prepared to be hand-spread. All fertilizer treatments are summarized in Appendix 8.1
2.2 Field set-up
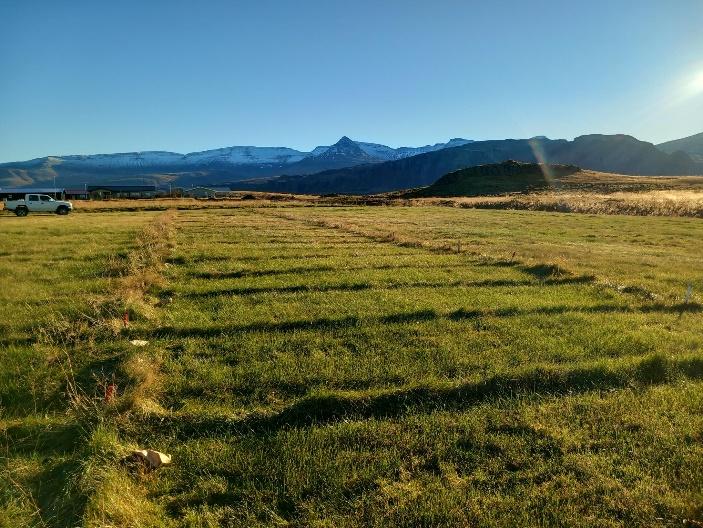
In order to receive statistically significant data, the 8 (9 in 2023) different fertilizer materials introduced in chapter 2.1 and one control plot without any treatment were arranged in a complete block design, 4 replica blocks, treatments randomly ordered in each block, so altogether 36 (40 in 2023) trial plots. A single plot is around 6.67 m long and 1.5 m wide which results in an area of around 10 m2. For reasons of feasibility and precision in application with the tractor, the plots were arranged in one long row where the tractor could drive to each plot individually without contaminating the neighboring plots with manure material. A schematic depiction of the field set-up of 2022 is given in Figure 2, the field set-up of 2023 is given in Figure 3.
Building Ásgarður N
Figure 2: Field layout of the 36 trial plots in 2022. Exemplary driving path for fertilizer application f3: The blue arrows indicate the driving path of the tractor applying fertilizer f3.
Municipal buildings
Figure 3: Field layout of the 40 trial plots in 2023. Exemplary driving path for fertilizer application f3: The blue arrows indicate the driving path of the tractor applying fertilizer f3.
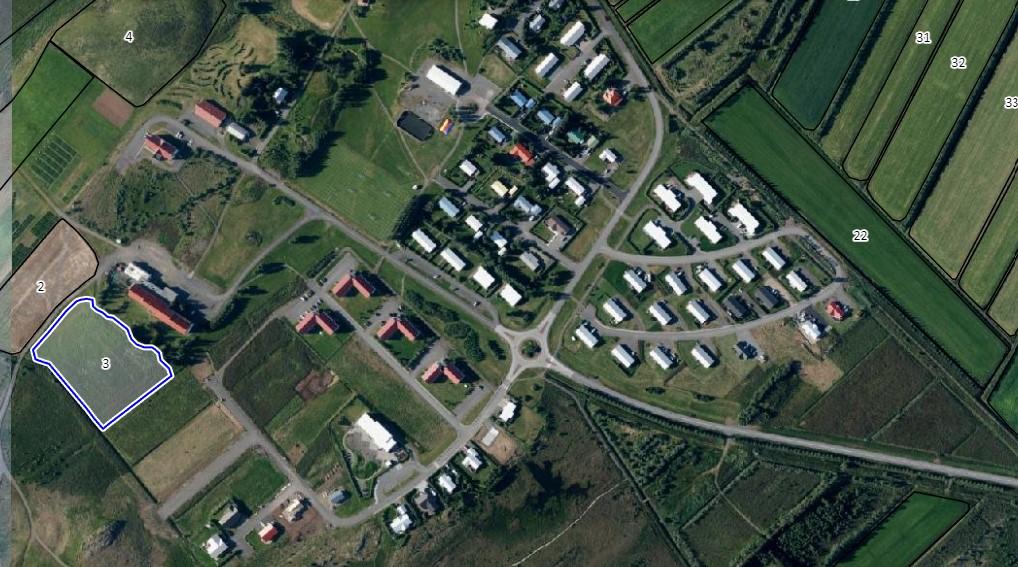
Both experiments were carried out at Hvanneyri, on fields no. 3 and no. 22. Both trial locations are shown in Figure 4.
and
Figure 4: Trial field locations at Hvanneyri in 2022
2023. In 2022, the experiment was carried out on field no. 3, highlighted in blue. In 2023, the experiment was carried out on field no. 22, highlighted in red (source Jörð.is, 23.05.2024)
2.3 Fertilizing
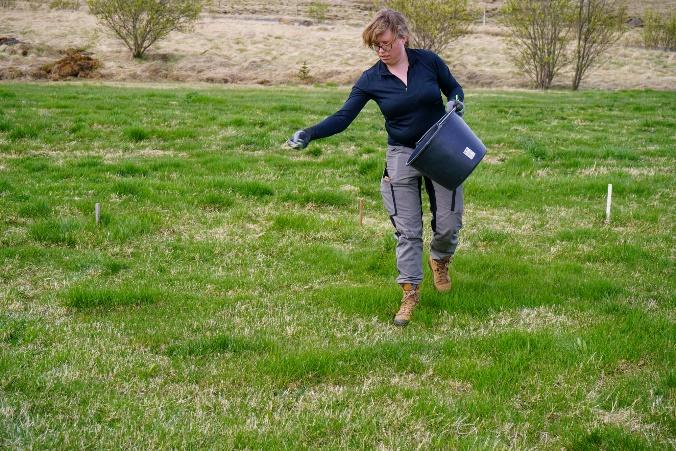
In 2022, all fertilizers were applied on 18.05.2022 (Figure 5 – left). For the manure mixtures f1, f2, and f3 this meant that they had 6 days of exposure time to the additives, which were added on 12.05.2022 (see Chapter 2.1.2). The acidified manure (a) was prepared on the day of application, 18.05.2022, immediately before spreading (see Chapter 2.1.3). The mineral fertilizer was hand-spread (Figure 5 –right), the manure and manure mixtures were applied with the tractor as shown in Figure 5 – left.
In 2023, the manure mixtures f1, f2, and f3 were spread on 16.05.2023, which meant that they had 8 days of exposure time to the additives (see Chapter 2.1.2). Mineral fertilizer was also applied on that day. The acidified manure (a) and the AgriMestMix mixture (f4) were prepared on the day of their application, 17.05.2023, immediately before spreading (see Chapter 2.1.3). The untreated cow manure (k) was also spread on that date.
The container for the manure at the back
the tractor was cleaned out with water after each fertilizer treatment to avoid contamination with other additives.
2.4 Monitoring
Plant development was monitored over the entire growing season. Two methods were used: the Normalized Difference Vegetation Index (NDVI) and height measurements with a platemeter. Both methods are explained below.
2.4.1
NDVI
The Normalized Difference Vegetation Index (NDVI) was used to determine the greenness of the plants, which is an indicator of plant health. This in turn is related to sufficiently available nutrients (fertilizer), water supply, plant diseases, and so on. The spatial density also plays a role in the measurements: very few green, healthy plants on a certain area will result in a lower NDVI value than many green healthy plants on the same sized area. The NDVI is based on the formula:
where NIR is the measured reflected near infrared light and Red is the measured reflected red light. Our measurement device, a Trimble ® Greenseeker, emits a near infrared light frequency of 780 nm, and a red-light frequency of 660 nm, and contains two sensors that register these wavelengths [23]. The NDVI value is calculated, and the user can read the resulting NDVI value from a display (see Figure 6).
Figure 5: left – manure application; right – mineral fertilizer application; spreading date 18.05.2022.
of
Figure 6: Exemplary measurement with the NDVI device (combination of two sensors). The NDVI value here is 0.83.
If the reflected red light (Red) is 0 (zero), in case of an ideal green surface, the NDVI value is 1. If the NIR and Red value are equal – red light and near infrared light are reflected equally, which can be the case on rock, sand, or snow – the NDVI value is 0 (zero). And if there is no reflection of NIR the NDVI value becomes -1, which is usually the case when measuring water bodies. Our measurements gave results between 0 (zero) and 1.
2.4.2 Height
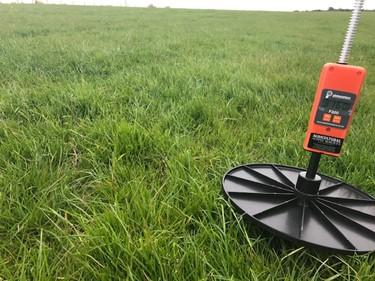
The height of the grass was determined with a rise platemeter by F400 by Platemeter ™ [24]. This device measures the height of the vegetation by having a smoothly gliding plate on a pin, that is rising on top of the vegetation while the pin in the middle is pressed on the ground. The height of the plate above ground determines the height of the vegetation.
Since this method involves gravity, the density of the vegetation and the toughness of each single grass blade also play a role in the measurements (see Figure 7) besides the actual grass height. The thicker and denser the grass is growing, the more realistic is the actual height measurement since less grass is bent over by the plastic disc. A few high grass leaves are not capable of keeping the disc of the platemeter as high (they bend over more easily), as denser or tougher growing grass leaves (the weight of the plate is better distributed or better held up).
In the experiment it was assumed that the vegetation density in the plots is equal, so that this factor does not impact the results. The measured heights are given in cm.
Figure 7: Platemeter in the field.
2.5 Harvesting and hay samples
The cutting was executed with a Haldrup F-55 harvester. Grass samples of around 200 g – 300 g were taken on the cutting days. The grass samples were dried for several days in the drying cabinets at the laboratory of LbhÍ in Hvanneyri at a temperature of 60 °C. The hay samples were taken at each cut and the dry matter yield evaluated.
In 2022, the first cut was realized on 23.06.2022 (35 days after fertilizing), the second cut on 02.08.2022 (76 days after fertilizing), and the third cut on 13.09.2022 (118 days after fertilizing). 40 days passed between the first and the second cut, and 42 days passed between the second and the third cut. Since it was only applied for funding of two analyses (72 samples), the last harvest, which contains the least amount of harvested hay and nutrients (by experience), was not chemically analyzed
For the chemical analysis, the dried grass samples were ground to a fine powder on 01.12.2022 and 02.12.2022 (examples of ground hay shown in Figure 8). Some mold was found on samples 13, 14, 15, 16, 17, 19, 20 (1st cut), 43, 49, 52 and 57 (2nd cut) before grinding them. The moldy parts were carefully removed before the grinding process.
The ground samples were sent for the analysis of P, K, Ca, Mg, Na, S, Fe, Cu, Mn, and Zn to Efnagreining ehf. on 07.12.2022. Crude protein, digestibility, NDF, iNDF, sCp, and sugar (carbohydrates) were also measured with NIR. The energy content in milk feed units (FEm) was calculated. The results of this analysis were received on 21.2.2023.
In 2023, the first cut was realized on 03.07.2023 (48 days after fertilizing), and the second cut on 23.08.2023 (99 days after fertilizing). 51 days passed between the first and the second cut. In 2023, the harvest was only evaluated for its dry matter yield.
2.6 Soil samples
The soil samples were taken on 27.10.2022. The device to take the samples was a 12 cm long cylinder with a diameter of 4.5 cm. The top 2 cm of each sample were discarded since they consist mostly of grass and grass roots. The volume of one sample was about 159 cm3. Two samples per plot were taken, put in one bag to be analyzed as one, so the sample volume to be analyzed was about 318 cm3. The bagged samples were dried for several days at 50°C in drying cabinets at the laboratory of LbhÍ at Hvanneyri. The dried samples were sent to Efnagreining ehf. on 14.11.2022 for analysis of Ca, Mg, Na, K, P, S, Mn, Zn, Cu, density, and pH.
Figure 8: Ground hay samples for plots 3 and 4 of the first cut.
Figure 9: Collecting soil samples on 27.10.2022. Bagged samples can be seen at the left side of the plots.
The results of the soil analysis were received on 6.2.2023.
2.7 Summarized schedule
The experimental schedule, starting from mixing the manures and preparing the fertilizers to the last cut each year, and the lab work following up the field work, is summarized in Table 7
Table 7: Timeline of the project „Cow manure mixed with disinfecting/deodorizing additives as fertilizer“ of the years 2022 and 2023.
Year 2022
12.05.2022
Task
Mixing manure with f1, f2, and f3
18.05.2022 Mixing manure with sulfuric acid
18.05.2022 Spreading of manure, manure mixtures, and mineral fertilizer
23.06.2022 Cut 1 (and drying of hay samples afterwards)
02.08.2022 Cut 2 (and drying of hay samples afterwards)
13.09.2022 Cut 3 (and drying of hay samples afterwards)
27.10.2022 Taking of soil samples
Year 2023
08.05.2023
Task
Mixing manure with f1, f2, and f3
08.05.2023 Manure sample taken for chemical analysis
16.05.2023 Spreading of mixtures f1, f2, f3, and the mineral fertilizer
17.05.2023 Mixing manure with f4, and sulfuric acid
17.05.2023 Spreading of manure mixture f4, acidified manure and untreated manure
03.07.2023 Cut 1
23.8.2023 Cut 2
14.11.2022 Soil samples to Efnagreining ehf. On a regular basis NDVI and height measurements
01.-
02.12.2022
Grinding of hay samples
07.12.2022 Hay samples to Efnagreining ehf.
06.02.2023 Results of soil analysis from Efnagreining ehf.
21.02.2023 Results of hay analysis from Efnagreining ehf.
On a weekly basis NDVI and height measurements
2.8 Statistical data evaluation
The statistical evaluation in the experiment was carried out with the program R (version 4.2.2; 202210-31 ucrt) within the RStudio environment (version 2023.09.1+494).
To prove the null hypothesis H0, which states there is no significant difference observed between the different fertilization treatments, the data residuals were created with rstandard (),
then checked for normality with the Shapiro-Wilk-test: shapiro.test().
A result of p < 0.05 leads to rejection of the null hypothesis, which states that the data residuals are normally distributed. For p > 0.05 the data residuals are normally distributed.
Data with normally distributed residuals was further evaluated with the analysis of variance (ANOVA): anova(),
followed post hoc by Tukey´s test, if the ANOVA results in p < 0.05 (rejection of H0). The formula for Tukey´s test in R is:
HSD.test().
Tukey´s test compares all possible pairs of means, and it is based on a studentized range distribution (this distribution is similar to the distribution of t from the t-test).
Data with not normally distributed residuals was analyzed with the Kruskal-Wallis test: kruskal.test()),
which is a non-parametric method for testing whether samples originate from the same distribution. Since it is non-parametric it does not assume a normal distribution of the residuals. If the KruskalWallis test results in p < 0.05 (rejection of H0), Dunn´s test is used post hoc to compare all possible pairs of means:
dunn.test().
Dunn´s test is, like the Kruskal-Wallis test, a non-parametric test. It does not assume that the data comes from a particular distribution.
The linear model tested in this report is: y = fertilizer treatment + cut (number) + repetitions(fertilizer treatment) + error.
3 Results 2022
The experiment was carried out on field no. 3 (see Figure 4). The results for NDVI and height – the monitoring parameters during the growing season – are presented in chapter 3.1 and chapter 3.2 , respectively. The dry matter yield of 2022 is given in chapter 3.3. The results of the soil analysis are presented in chapter 3.4. The results of the soil analysis are presented in chapter 3.5.
3.1 Normalized Difference Vegetation Index (NDVI)
The NDVI residual data of 2022 was normally distributed on each date as the Shapiro-Wilk test confirmed (p > 0.05). Hence, the p-values for NDVI data were calculated pre-hoc with the ANOVA, and the post-hoc pairwise comparison with Tukey´s test.
The average NDVI results and standard deviations of the different fertilizer treatments at or just before the cutting dates (22.6., 2.8., and 13.9.) are given in Table 8. The NDVI values for each fertilizer treatment and replica before each cut are summarized in Appendix 8.2
Table 8: Mean NDVI value and standard deviation per fertilizer treatment on or just before the mowing dates (cut 1: 22.06.2022, cut 2: 02.08.2022, and cut 3: 13.09.2022).
22.06.2022
For all four different replicas the p-value on the first cut was p < 0.05 (see Table 9). Tukey´s test confirmed that there was a statistically significant difference between the different replica blocks.
Table 9: Mean NDVI value and standard deviation per replica block on or just before the mowing dates (cut 1: 22.06.2022, cut 2: 02.08.2022, and cut 3: 13.09.2022).
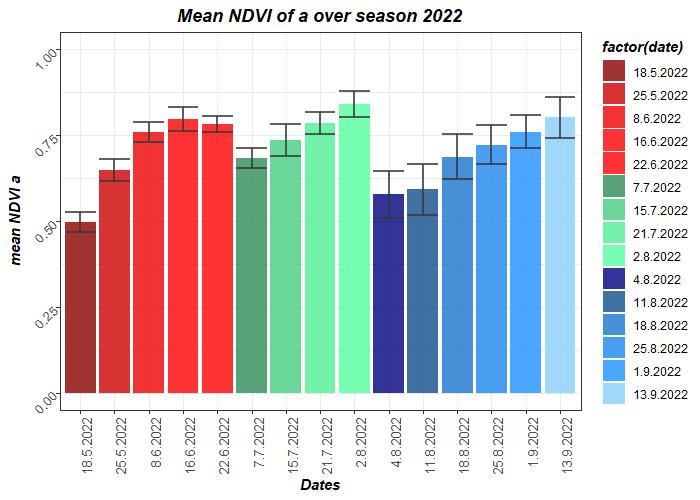
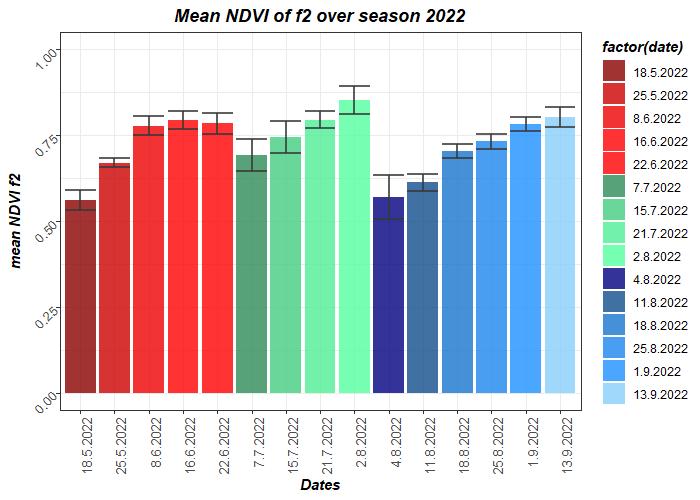
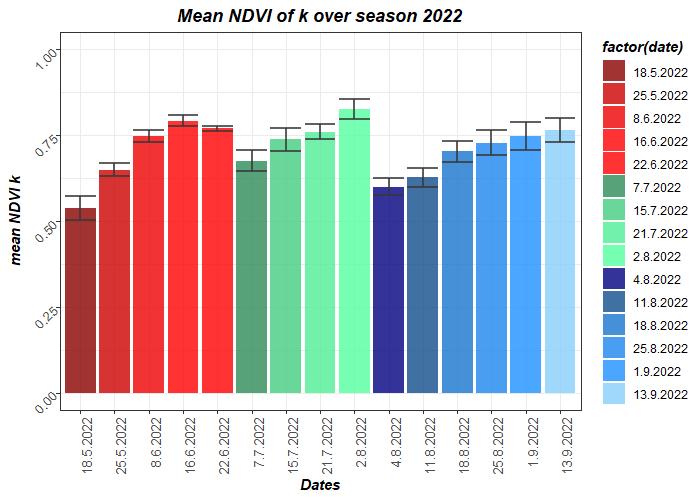
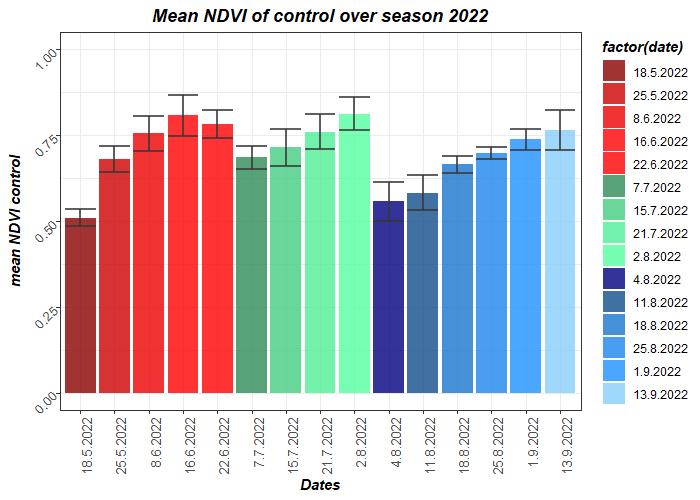
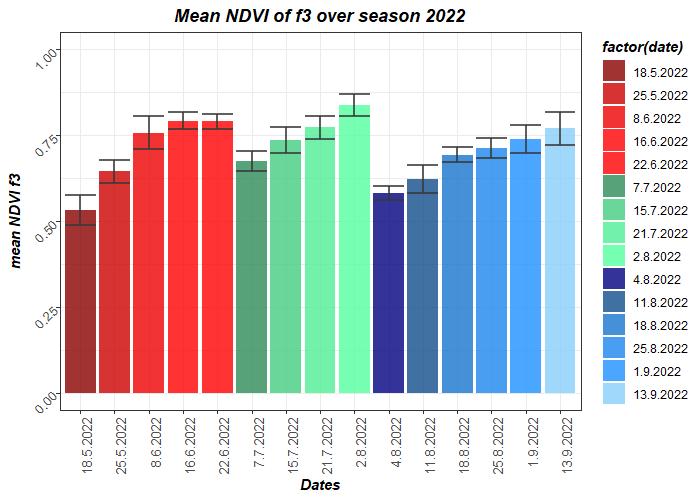
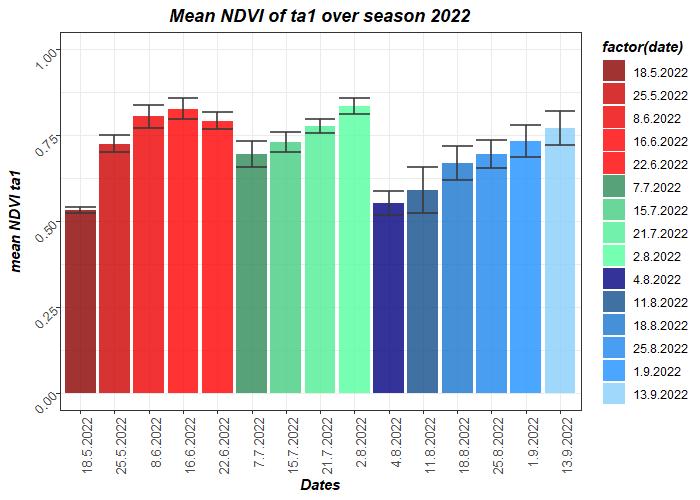
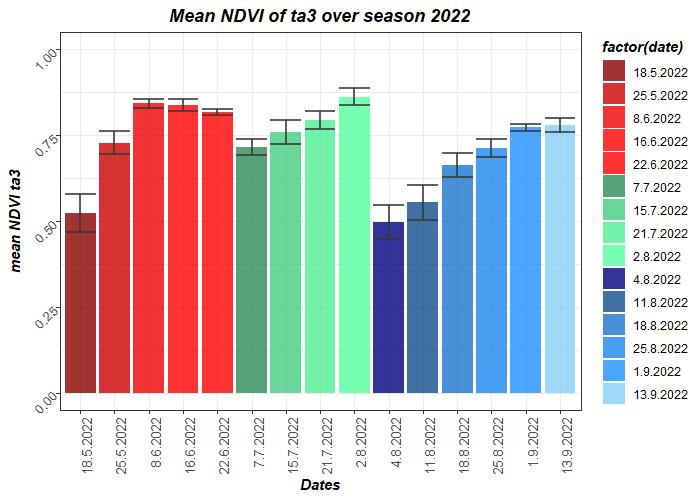
The NDVI was monitored over the entire growing season. In Figure 9 it is exemplary shown how the mean NDVI values for treatment f1 (cow manure + Viscolight) changed over the growing season. The results for the other fertilizer treatments are shown in Appendix 8.5. It is obvious that the NDVI values decreased significantly after each cut (where the main colors change in Figure 9).
Figure 9: Mean NDVI and standard deviation of treatment f1 (cow manure + Viscolight) over the growing season in 2022. The color changes between red, green, and blue indicate the time periods between mowing dates.
Overall, it is also visible that the steepest incline in greenness occurred at the beginning of the growing season between fertilizer application and first cut (red color in Figure 9), and the steepest drop occurs after the second cut (between green and blue color in Figure 9). These NDVI results over the season look similar for all fertilizer treatments.
ANOVA of the data of f1 showed that the p-value for the different dates was p < 0.05, for the replicas p > 0.05. Tukey´s test for f1 revealed on which dates the greenness of the grass showed significant differences (Table 10).
Table 10: Results of Tukey´s test for f1 discerning between the mean NDVI values of different dates throughout the growing season. Standard deviation and assigned groups are shown.
mean NDVI sd group
2.8.2022 0.86 0.03 a
16.6.2022 0.81 0.03 ab
13.9.2022 0.80 0.04 ab
22.6.2022 0.80 0.03 abc
21.7.2022 0.79 0.04 abc
15.7.2022 0.78 0.03 abcd
8.6.2022 0.78 0.03 abcd
1.9.2022 0.77 0.02 abcd
25.8.2022 0.73 0.01 bcde
7.7.2022 0.71 0.03 cde
18.8.2022 0.69 0.03 de
25.5.2022 0.65 0.04 ef
11.8.2022 0.60 0.06 fg
18.5.2022 0.56 0.02 fg
4.8.2022 0.55 0.07 g
3.2 Height
The height measurements in cm for each fertilizer treatment and replica before each cut are summarized in Appendix 8.3. The height data of 2022 was not normally distributed on the first cut as the ShapiroWilk test of the residuals confirmed (p < 0.05). Hence, the p-values for height data of the first cut was calculated with the Kruskal-Wallis test, and the post-hoc pairwise comparison was evaluated with Dunn´s test (Bonferroni method). For the 2nd and 3rd cut the data was normally distributed, and ANOVA and Tukey´s test were used to evaluate statistical significance.
The mean height results and standard errors of the different treatments at or just before the cutting dates (22.6., 2.8., and 13.9.) are given in cm in Table 11. The p-values for all afore mentioned height means was p > 0.05 for the different treatments on the different cutting dates. Dunn´s test showed no statistically significant difference between the mean height values of each fertilizer treatment at the first cut, Tukey´s test on the 2nd and 3rd cut, as presented in Table 11, they were all equally ranked.
Table 11: Mean height value and standard deviation in cm per fertilizer treatment on or just before the cutting dates (cut 1: 22.06.2022, cut 2: 02.08.2022, and cut 3: 13.09.2022). *p-value calculated with Kruskal-Wallis method.
For the replicas the p-value decreased from cut to cut: the p-value on the first cut was p = 0.59, on the second cut p = 0.14, and on the third cut p = 0.01 (see Table 12).
Table 12: Mean height and standard deviation per replica block on or just before the mowing dates (cut 1: 22.06.2022, cut 2: 02.08.2022, and cut 3: 13.09.2022). *p-value calculated with Kruskal-Wallis method.
22.06.2022
02.08.2022 13.09.2022 p = 0.59* p = 0.14 p = 0.01
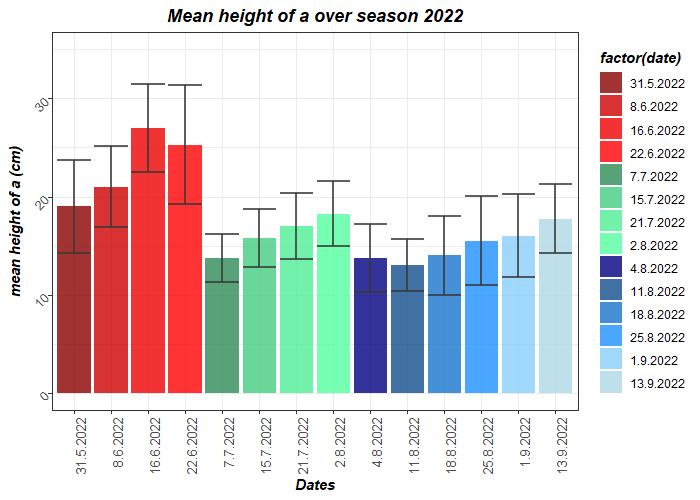
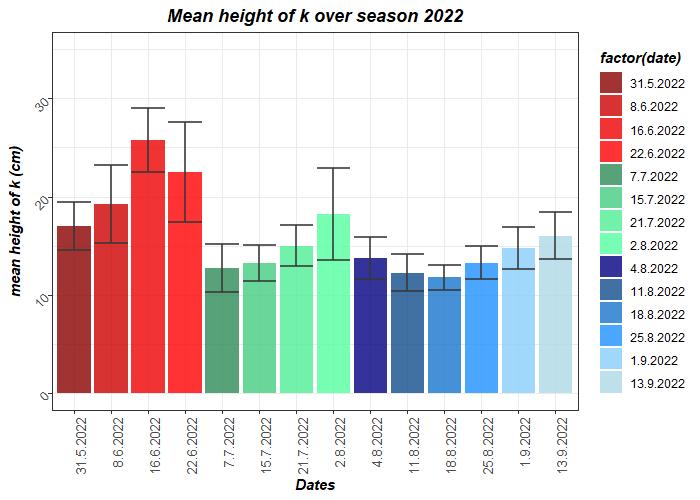
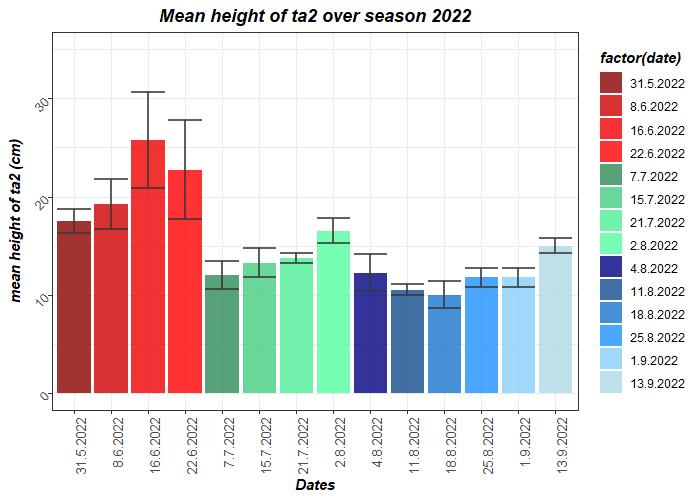
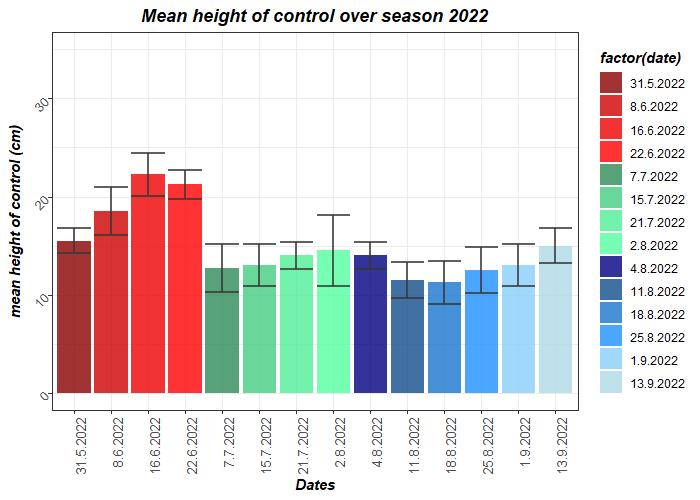
The height was measured during the entire growing season starting about two weeks after fertilizer application. The results of those measurements are exemplary shown for the fertilizer treatment f1 (cow manure + Viscolight) in Figure 10. The results for the other fertilizer treatments are shown in Appendix 8.6. The fastest and highest growth occurred right after fertilizing before the first cut.
Figure 10: Mean height and standard deviation in cm of treatment f1 (cow manure + Viscolight) over the growing season in 2022. The color changes between red, green, and blue indicate the time periods between mowing dates.
The highest measurements were recorded on 22.06.2022 right before the first cut (see Table 13) and the week before that (also group a).
Table 13: Results of Tukey´s test for f1 discerning between the mean height values of different dates throughout the growing season 2022. Standard deviation and assigned groups are shown.
3.3 Dry matter yield
3.3.1 Dry matter yield for each cut
The dry matter yield (dmy) data of all three cuts of each fertilizer treatment and replica of 2022 can be found in Appendix 8.4. The dry matter yield data for each date was normally distributed as the result of
the Shapiro-Wilk test showed with p > 0.05. The significance of the results was hence evaluated with ANOVA (pre-hoc) and Tukey´s test (post-hoc).
The mean dry matter yield per treatment and cut is summarized in Table 14.
Table 14: Mean dry matter yield and standard deviation in t per fertilizer treatment on the cutting dates (cut 1: 22.06.2022, cut 2: 02.08.2022 and cut 3: 13.09.2022).
In general, the control had the lowest dmy of all treatments in cut 1 and cut 2 In cut 3, f3 and ta2 had even lower results than the control. Out of the cow manure treatments f2 was the most consistent, ranking always quite high in the list (see Table 14). It is apparent that there is a great overlap between results. This is confirmed post-hoc with Tukey´s test, that resulted in wider groups of equally ranked treatments.
The mean dry matter yield per replica block and cut is summarized in Table 15. Replica block 2 had a statistically lower dmy at the 2nd and 3rd cut than replica blocks 3 and 1.
Table 15: Mean dry matter yield and standard deviation per replica block on the cutting dates (cut 1: 22.06.2022, cut 2: 02.08.2022, and cut 3: 13.09.2022).
3.3.2 Total dry matter yield
The total dry matter yield for each treatment, cut and replica is given in Appendix 8.4. The total dry matter yield for each treatment was calculated by summing up the dry matter yield per treatment and replica over all three cuts. The summed-up data was normally distributed as the Shapiro-Wilk test confirmed with p > 0.05. Two-way ANOVA (treatment and replica) of the resulting summed up data results in p < 0.05 with regards to treatments also the replicas. Out of the summed up dry matter yield, the mean total dry matter yield and standard deviation for each treatment are calculated. The resu lts are given in Table 16
Table 16: Total dry matter yield and standard deviation in t per fertilizer treatment as sum of the mean dry matter yields of each treatment over all cutting dates (cut 1: 22.06.2022, cut 2: 02.08.2022. and cut 3: 13.09.2022).
The control had the lowest mean dmy summed up over all three cuts, while ta3 had the highest mean dmy summed up over all three cuts.
The difference between the summed up dry matter yield for each replica is statistically significant (p < 0.05). A post-hoc Tukey´s test confirms this (Table 17).
Table 17: Total dry matter yield and standard deviation in t per replica as sum of the mean dry matter yields of each replica over all cutting dates (cut 1: 22.06.2022, cut 2: 02.08.2022. and cut 3: 13.09.2022).
rep dmy (t)
The difference between the mean dmy of each cut is statistically highly significant (p < 0.05). A posthoc Tukey´s test confirms this (Table 18). Between each cut there is a statistically significant pairwise difference to both other cuts.
Table 18: Tukey´s test of dry matter yield for the pairwise significant difference between dmy of different cuts in 2022.
cut dmy (t) sd (t) group
1 2.16 0.57 a
2 1.19 0.42 b
3 0.41 0.19 c
3.4 Soil analysis
The results of the soil analysis are given in Table 19 (mean values for each nutrient per treatment) and Table 20 (mean values for each nutrient per replica). The tables can be found on page 20f. The data residuals were first analyzed for normality with the Shapiro-Wilk test, then statistical tests were chosen accordingly. Presented are the means per nutrient and treatment, standard deviation, p-value, which was determined either by ANOVA or Kruskal-Wallis test (Bonferroni method), and the groups, which were either determined by Tukey´s test or Dunn´s test.
Apparently, there is no statistically significant difference between the treatments, except when looking at Na (p < 0.05). The lowest Na content in the soil is found for the highest mineral fertilizer treatment
ta3, which is significantly lower than the highest Na content in the soil found for pure cow manure (k) and cow manure + Haugmelta (f2).
The difference between different replicas was found more often than the difference between different treatments. P, Ca, Mn, and Cu content, as well as pH and soil density seem to be dependent on the location on the field (p < 0.05).
Table 19: Results of the soil analysis per analyzed parameter and treatment. Given are mean, standard deviation, and group, where p < 0.05.
Table 19 continued: Results of the soil analysis per analyzed parameter and treatment. Given are mean, standard deviation, and group, where p < 0.05.
KW + Dunn p > 0.05
KW + Dunn p > 0.05
Anova + Tukey p > 0.05 KW + Dunn p > 0.05
Anova + Tukey p > 0.05
Table 20: Results of the soil analysis per analyzed parameter and replica. Given are mean, standard deviation, and group, where p < 0.05.
Table 20 continued: Results of the soil analysis per analyzed parameter and replica. Given are mean, standard deviation, and group, where p < 0.05.
Anova + Tukey KW + Dunn Anova + Tukey Anova + Tukey KW + Dunn
3.5 Hay analysis
The results of the hay analysis are given in Table 21 and Table 22 (mean values per treatment and cut), which can be found on pages 22ff, and in Table 23 and Table 24 (mean values per replica and cut), which can be found on pages 27ff The data residuals were first analyzed for normality with the ShapiroWilk test, then statistical tests were chosen accordingly. Presented are the means per nutrient, treatment, and cut, standard deviation, p-value, which was determined either by ANOVA or Kruskal-Wallis test (Bonferroni method), and the groups, which were either determined by Tukey´s test or Dunn´s test.
Table 21: Results of the hay analysis per analyzed nutritional parameter and treatment for cut 1. Given are mean, standard deviation, and group, where p < 0.05.
Anova + Tukey Anova +Tukey Anova + Tukey Anova + Tukey KW + Dunn
1
Table 21 continued: Results of the hay analysis per analyzed nutritional parameter and treatment for cut 1. Given are mean, standard deviation, and group, where p < 0.05.
Anova + Tukey Anova + Tukey KW + Dunn KW + Dunn Anova + Tukey
cut 1
Table 21 continued: Results of the hay analysis per analyzed nutritional parameter and treatment for cut 1. Given are mean, standard deviation, and group, where p < 0.05.
Anova + Tukey Anova + Tukey
cut 1
Anova + Tukey Anova + Tukey
Table 21 continued: Results of the hay analysis per analyzed nutritional parameter and treatment for cut 1. Given are
Table 22: Results of the hay analysis per analyzed nutritional parameter and treatment for cut 2. Given are mean, standard deviation, and group, where p < 0.05.
Anova + Tukey Anova + Tukey Anova + Tukey Anova + Tukey Anova + Tukey Anova + Tukey
+ Tukey
Table 22 continued: Results of the hay analysis per analyzed nutritional parameter and treatment for cut 2. Given are mean, standard deviation, and group, where p < 0.05.
2 Anova + Tukey KW + Dunn
Table 22 continued: Results of the hay analysis per analyzed nutritional parameter and treatment for cut 2. Given are mean, standard deviation, and group, where p < 0.05.
Anova + Tukey Anova + Tukey Anova + Tukey Anova + Tukey
Table 23: Results of the hay analysis per analyzed nutritional parameter and replica for cut 1. Given are mean, standard deviation, and group, where p < 0.05.
Anova + Tukey Anova + Tukey Anova + Tukey Anova + Tukey KW + Dunn Anova + Tukey
cut 1
Table 23 continued: Results of the hay analysis per analyzed nutritional parameter and replica
Table 23 continued: Results of the hay analysis per analyzed nutritional parameter and replica for cut 1. Given are mean, standard deviation, and group, where p < 0.05
+ Tukey
1
Table 23 continued: Results of the hay analysis per analyzed nutritional parameter and replica for cut 1. Given are mean, standard deviation, and group, where p < 0.05 cut 1 Anova + Tukey p > 0.05
Table 24: Results of the hay analysis per analyzed nutritional parameter and replica for cut 2. Given are mean, standard deviation, and group, where p < 0.05.
Anova + Tukey Anova + Tukey Anova + Tukey Anova + Tukey Anova + Tukey Anova + Tukey
cut 2
Table 24continued: Results of the hay analysis per analyzed nutritional parameter and replica for cut 2. Given are mean, standard deviation, and group, where p < 0.05.
Anova + Tukey
Anova + Tukey
KW + Dunn
Anova + Tukey
Table 24 continued: Results of the hay analysis per analyzed nutritional parameter and replica for cut 2. Given are mean, standard deviation, and group, where p < 0.05.
Anova + Tukey Anova + Tukey Anova + Tukey Anova + Tukey
2
Table 24 continued: Results of the hay analysis per analyzed nutritional parameter and replica for cut 2. Given are mean, standard deviation, and group, where p < 0.05.
Anova + Tukey Anova +Tukey Anova + Tukey
2
4
Results 2023
The experiment of 2022 was replicated in 2023 on a different patch of grass field (no. 22 in Figure 4). The results for NDVI and height – the monitoring parameters during the growing season – are presented in chapter 4.1 and chapter 4.2, respectively. The dry matter yield of 2023 is given in chapter 4.3. There was no soil and hay analysis in 2023.
4.1 Normalized Difference Vegetation Index (NDVI)
The NDVI residual data of 2023 was normally distributed on each date as the Shapiro-Wilk test confirmed (p > 0.05). Hence, the p-values for NDVI data were calculated pre-hoc with ANOVA, and the post-hoc pairwise comparison with Tukey´s test.
The average NDVI results and standard deviations of the different fertilizer treatments at or just before the cutting dates (03.07.2023 and 23.08.2023) are given in Table 25. The NDVI values for each fertilizer treatment and replica before each cut are summarized in Appendix 8.11.
Table 25: Mean NDVI value and standard deviation per fertilizer treatment on or just before the mowing dates (cut 1: 03.07.2023 and cut 2: 23.08.2023).
03.07.2023
23.08.2023 p < 0.05 p < 0.05
Since in 2022 the location of the replicas had a significant impact on the NDVI data, the NDVI data of 2023 was also evaluated for significance of the replica (Table 26). The p-value (ANOVA) for both cutting dates is higher than the significance level (p > 0.05), and post-hoc Tukey´s test revealed no statistically significant difference between different replicas.
Table 26: Mean NDVI value and standard deviation per replica on or just before the mowing dates (cut 1: 03.07.2023 and cut 2: 23.08.2023).
03.07.2023 23.08.2023 p > 0.05 p > 0.05 rep mean NDVI sd mean NDVI sd
1 0.74 0.02 0.84 0.02
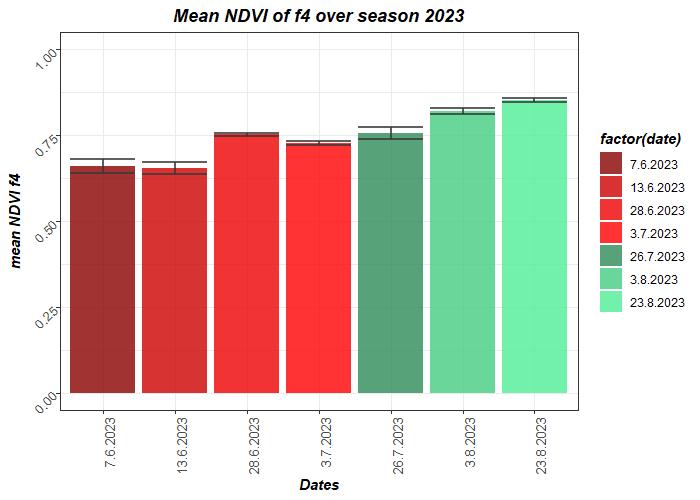
Figure 11: Mean NDVI and standard deviation of treatment f1 (cow manure + Viscolight; left) and f4 (cow manure + AgriMestMix; right) over the growing season in 2023. The color changes between red and green indicate the time periods between mowing dates.
Tukey´s test for f1 and f4 reveals on which dates the greenness of the grass shows significant differences (Table 27). ANOVA shows that the p-value for the different dates is p < 0.05 for both treatments.
Table 27: Results of Tukey´s test for f1 and f4 discerning between the mean NDVI values of different dates throughout the growing season. Standard deviation and assigned groups are shown.
There is also a significant difference in replicas observed in f1 (Table 28), not in f4.
Table 28: Results of Tukey´s test for f1 discerning between the mean NDVI values of different replicas throughout the growing season. Standard deviation and assigned groups are shown.
4.2 Height
The height measurements in cm for each fertilizer treatment and replica before each cut are summarized in Appendix 8.12. The height data of 2023 was normally distributed on each cut, as the Shapiro-Wilk test of the residuals confirmed (p > 0.05). Hence, the p-values for height data were calculated pre-hoc with ANOVA, and the post-hoc pairwise comparison was conducted with Tukey´s test.
The mean height results and standard errors of the different treatments at or just before the cutting dates (03.07. and 23.08.) are given in cm in Table 29. The p-values of the results were p < 0.05.
Table 29: Mean height value and standard deviation in cm per fertilizer treatment on or just before the cutting dates (cut 1: 03.07.2023 and cut 2: 23.08.2023).
03.07.2023
23.08.2023
p < 0.05 p < 0.05
The average heights per replica block are given in Table 30. At the first cut, the difference between some replica blocks was significant, for the second cut it was not.
Table 30: Mean height and standard deviation per replica block on or just before the mowing dates (cut 1: 03.07.2023 and cut 2: 23.08.2023.
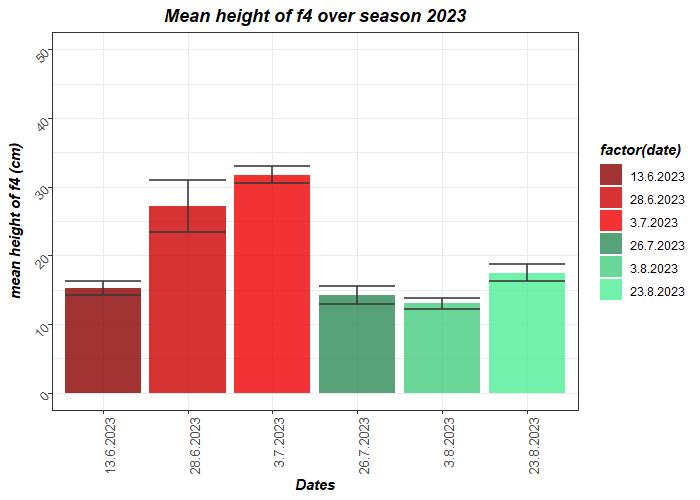
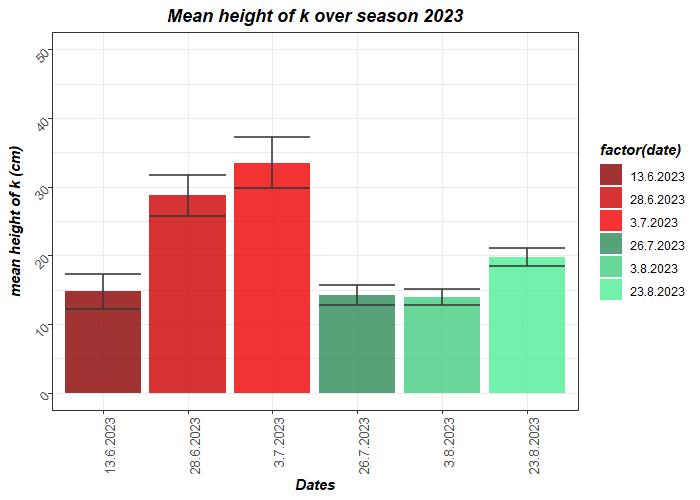
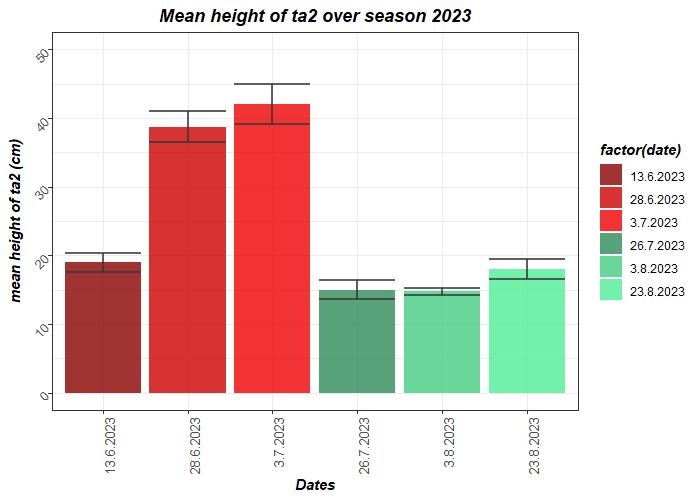
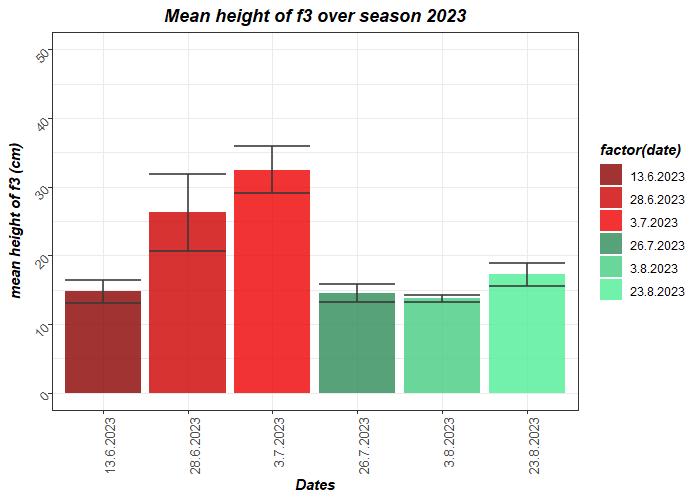
The height was measured during the entire growing season starting about three weeks after fertilizer application. The results of those measurements are exemplary shown for the fertilizer treatments f1 (cow manure + Viscolight) and f4 (cow manure + AgriMestMix) in Figure 12. The results for the other fertilizer treatments are shown in Appendix 8.13. The fastest and highest growth occurred right after fertilizing before the first cut.
Figure 12: Mean height and standard deviation in cm of treatment f1 (cow manure + Viscolight; left) and f4 (cow manure + AgriMestMix; right) over the growing season in 2023. The color changes between red and green indicate the time periods between mowing dates.
The highest measurements for f1 and f4 were recorded on 03.07.2023 right before the first cut (see Table 31), and the week before that for f1. Before the second cut on 23.08.2023 a mean height of 18.3 ±2.2 cm (group ab) was measured.
Table 31: Results of Dunn´s test for f1 discerning between the mean height values of different dates throughout the growing season 2023. Standard deviation and assigned groups are shown.
The Kruskal-Wallis test results in p > 0.05 for replicas of f1 and f4.
4.3 Dry matter yield
4.3.1 Dry matter yield for each cut
The dry matter yield (dmy) data of all three cuts of each fertilizer treatment and replica of 2023 can be found in Appendix 8.13. The dry matter yield data for each date is normally distributed as the result of the Shapiro-Wilk test with p > 0.05 shows. The significance of the results is hence proven with ANOVA (pre-hoc) and Tukey´s test (post-hoc).
Table 32: Mean dry matter yield and standard deviation in t per fertilizer treatment on the cutting dates (cut 1: 03.07.2023, cut 2: 23.08.2023).
cut 1
cut 2
Table 33: Mean dry matter yield and standard deviation per replica block on the cutting dates (cut 1: 03.07.2023, cut 2: 23.08.2023).
4.3.2 Total dry matter yield
The total dry matter yield for each treatment, cut and replica is given in Appendix 8.13. The total dry matter yield for each treatment (Table 34), replica (Table 35), and cut (Table 36) is calculated by summing up the dry matter yield per treatment over all three cuts for each replica. Two-way ANOVA (treatment and rep) of the resulting data results in p < 0.05 with regards to treatments, and p < 0.05 for the replicas. Out of the summed up dry matter yield, the mean total dry matter yield and standard deviation for each treatment are calculated.
Table 34: Total dry matter yield and standard deviation in t per fertilizer treatment as sum of the mean dry matter yields of each treatment over both cutting dates (cut 1: 03.07.2023, cut 2: 23.08.2023).
treatment dmy (t) sd (t) group
4.57 0.64 a
3.77 0.51 ab
3.42 0.64 b f1 3.34 0.41 b a 3.33 0.43 b f3 3.20 0.92 b
3.04 0.22 bc f4 2.99 0.45 bc f2 2.88 0.48 bc
2.08 0.56 c
Table 35: Total dry matter yield and standard deviation in t per replica block as sum of the mean dry matter yields of each treatment over both cutting dates (cut 1: 03.07.2023, cut 2: 23.08.2023).
Table 36: Total dry matter yield and standard deviation in t per cut as sum of the mean dry matter yields of each treatment on both cutting dates (cut 1: 03.07.2023, cut 2: 23.08.2023).
5 Discussion
5.1 NDVI
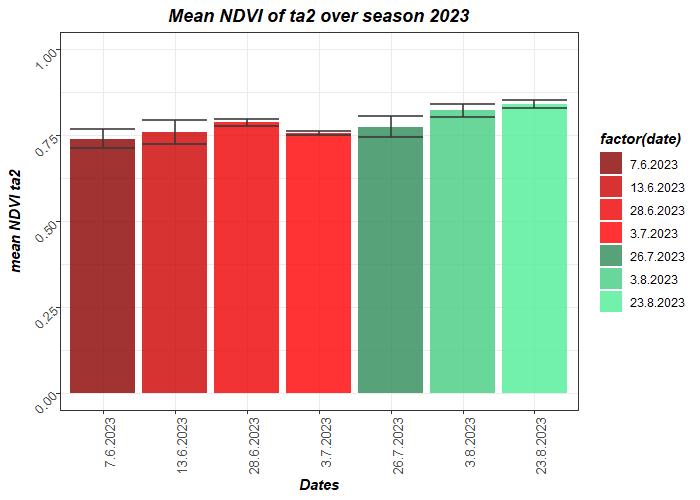
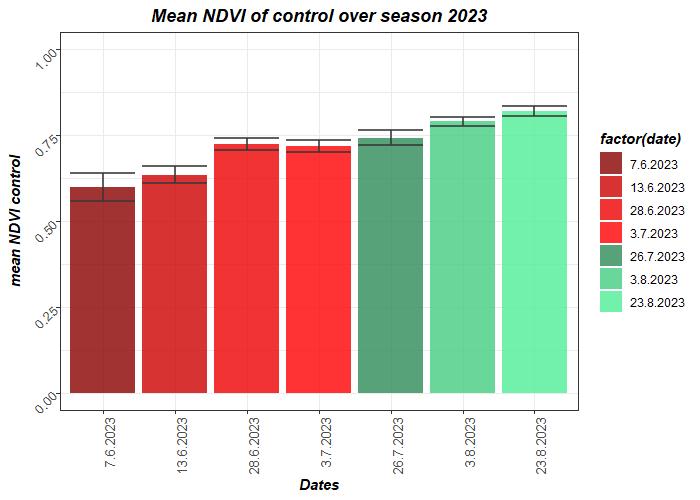
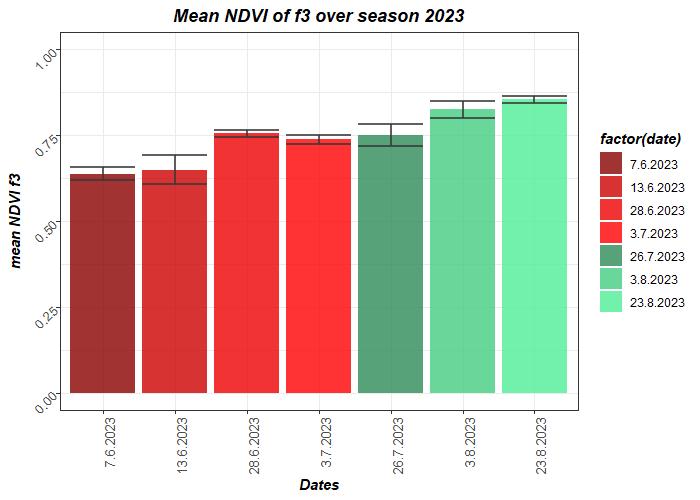
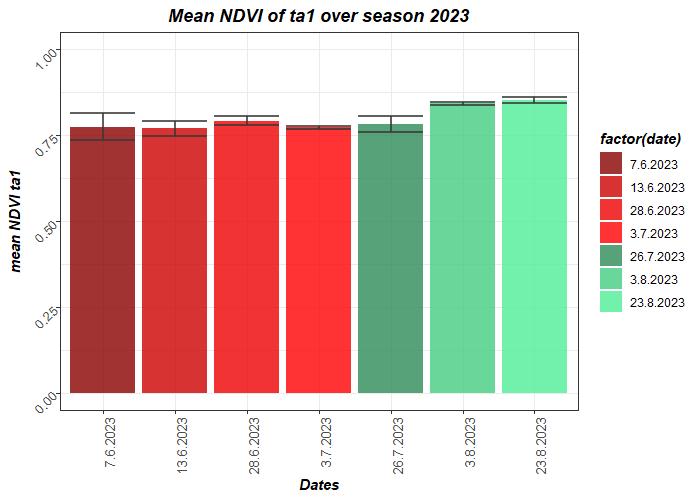
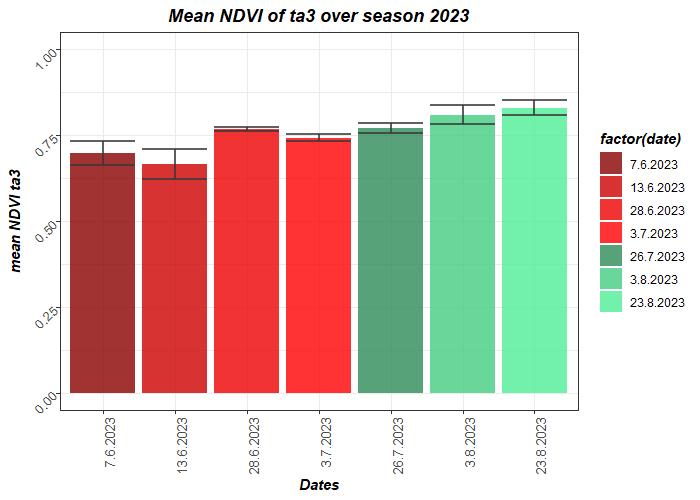
At the first cut in 2022, the NDVI values for mineral fertilizers were on average higher than the NDVI values of the manure-based treatments (see Table 8). This ratio decreased towards the third cut, when the manure-based fertilizer treatments had comparably higher NDVI values than the mineral fertilizers. The exception was ta3 (highest dosage of mineral fertilizer) which was still comparably high in the third cut. The continuing greenness throughout the growing season indicates a sufficient supply of nitrogen [25]. With organic fertilizers, like manure, this supply is more continuous. The release of the plant available nitrogen is slower than in the mineral fertilizer, since the organically bound nitrogen compounds must be mineralized before the plants can take them up as ammonia or nitrate [26]. This process of mineralization does not happen all at once but slowly over time, so also conversion to and the release of ammonia and nitrate is distributed over a longer period. The mineral fertilizer releases its nitrogen compounds faster, so the supply runs out towards the end of the growing season if not a second fertilization takes place after the first cut. Similar results were observed for the two cuts in 2023. The mineral fertilizers resulted in higher NDVI values, ta1 reaching the highest values in both cuts. This result (and the results for height and dry matter yield) raised the suspicion that the bags for ta1 and ta3 were wrongly labelled and the two treatments were exchanged in the field.
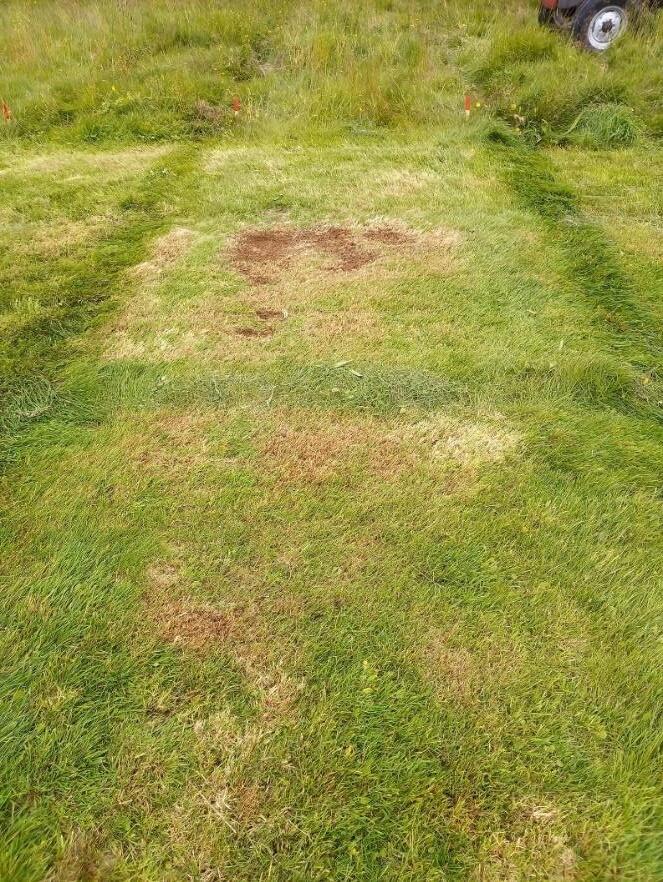
The observed low NDVI values immediately after cutting in 2023 could derive from two things: firstly, the remaining grass leaves at the bottom of the grass plant, that were not cut, are older. Their color turns more and more yellow throughout the growing season, the older they get. These older leaves become more visible after each cut until the younger and greener leaves re-grow and cover them up again (see Figure 13).
Secondly, on one plot it had been cut too flat above the surface which can happen on an uneven grass field (see Figure 14). There the bare soil became visible which of course reduced the measured NDVI value.
Figure 13: Trial field on August 2nd, right after the 2nd cut. The older, yellow part of the grass plants become visible after the cut.
: Photography of plot 18 (ta3) after the second cut on 02.08.2022.
In 2023 there was no such steep drop in NDVI values after cutting (Figure 11 and Appendix 8.14). There was no cutting in the soil (flatter underground of field no. 22 than field no. 3), and also the remaining grass leaves were not as yellow as observed in 2022. This could be due to the younger age of grass field no. 22.
The statistical analysis of the NDVI results in 2022 showed that the NDVI values of the four replica blocks became more significant throughout the growing season (Table 9). This increasing difference between the different replica blocks is probably due to the very heterogenous vegetation found on the chosen experimental field. The grass field was probably too old (accumulation of weeds over time) for such a sensitive experiment. Weeds usually start growing in places that offer their favored conditions (soil acidity, nutrient availability, soil humidity). The grass field was not completely plain, with a slight slope towards north-west, which over the years probably led to a gradient in nutrient distribution, in acidity, and in humidity due to the sub soil water flow along that slope. The weeds accumulated accordingly. Weeds like taraxacum spp. (túnfífill), rumex acetosa (túnsúra), and ranunculus subborealis (brennisóley) were mostly found in replica blocks 1 and 2. In replica blocks 3 and 4 mo re grass species grew, but also rhinanthus minor (lokasjóður). In the following Figure 15, pictures taken on 23.06.2022, the weed content of the experimental plots becomes visible.
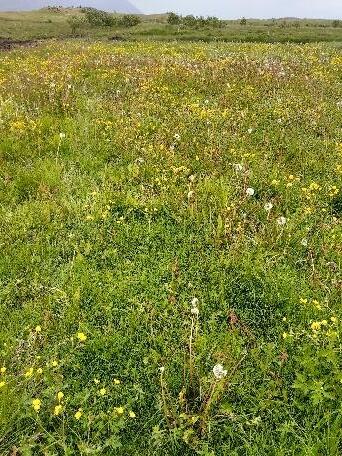
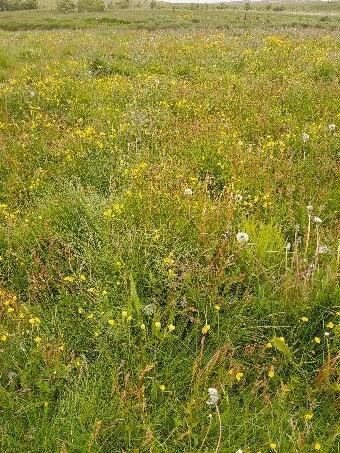
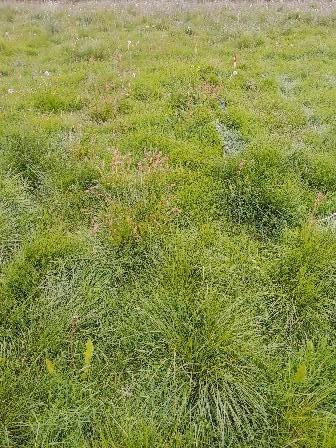
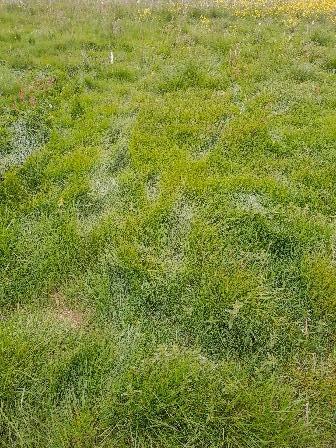
15: Shown are plots that are exemplary for the replica block at the growth stage just before the first cut on Jun2 23rd 2022. From left to right: plot 1 (replica block 1), plot 14 (replica block 2), plot 24 (replica block 3), plot 31 (replica block 4). The blue lines indicate the borders of the plot. In replica block 1 and 2 the weeds ranunculus subborealis, taraxacum spp. and rumex acetosa are all visible in abundance. In replica block 3 and 4 those weeds appear only scarcely.
Figure 15 confirms the NDVI results for the first cut where replica blocks 3 and 4 had higher mean NDVI than replica block 1 and a significantly higher NDVI than replica block 2 (see Table 9).
Figure
Figure
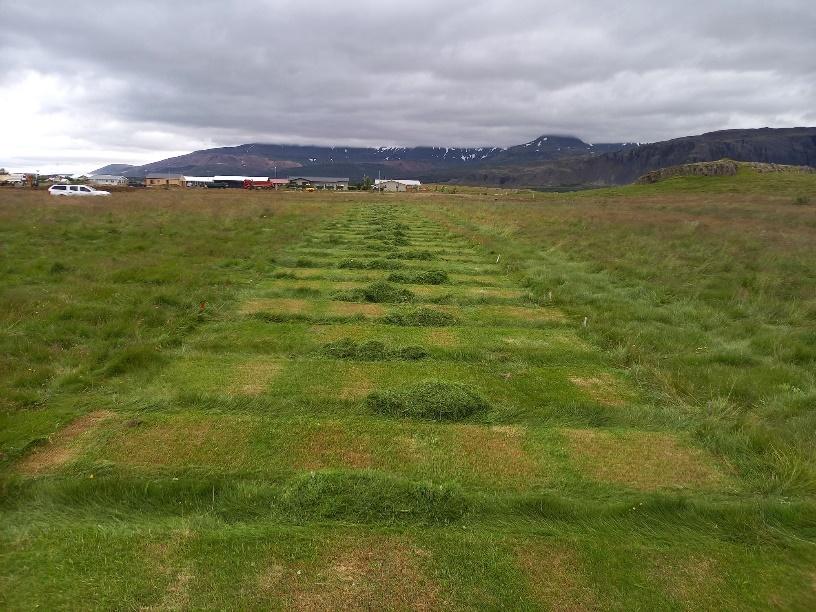
No such observations (statistically significant differences between replica blocks) were made in 2023 in field 22 (Table 26). In Figure 16 the field is shown right before the first cut (left) and second cut (right). The difference in age between the two grass fields and thus the preferential growth location of the vegetation in the older grass field had a strong impact on the NDVI results.
16: Left – experimental plots before the first cut on 30.07.2023; right – experimental plots before the second cut on 23.08.2023.
5.2 Height
Out of the three cuts in 2022, the first cut had the highest measured mean heights compared to the other two cuts (see Table 11). In 2023, the first cut also resulted in significantly higher height measurements than the second cut (see Table 29). This is not a surprising result since most of the carbohydrate producing part of the plant has been removed before the second cut, and the plant must now use more of its carbohydrate reserves found in the root system. The greater the part of leaf volume removed the higher the rate of stop of root growth [27] Different forage species have different optimal post-harvest heights [28]. The growth rate of forages changes in general throughout the growing season. In the northeast of the United States of America, there is typically a peak in growth rate spring/early summer of forage from which on it mostly declines (see Figure 17, taken from [28]). Bear in mind that the unit on the y-axis of this graph is not height, but dry matter yield/a/day. Of course, the growth rate can vary each year depending on weather conditions during growing season (air and soil temperature, radiation, timing and amount of precipitation etc.), but also on the weather conditions in the preceding winter [29].
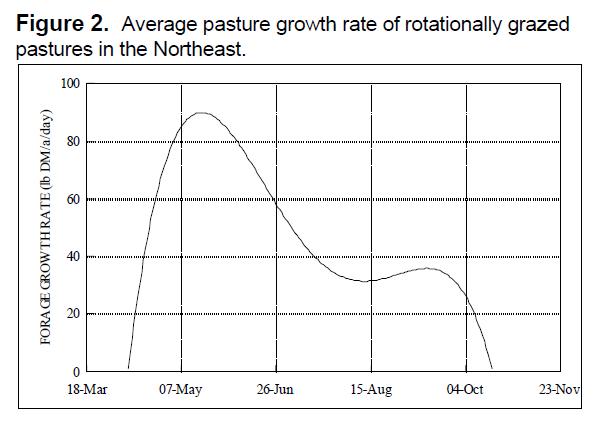
17: Average pasture growth rate in lb dm/a/day of rotationally grazed pastures in the Northeast of the United States of America (taken from [28]).
In 2022, the timely distance between the first and the second cut, and the second and the third cut was also almost the same, 41 and 42 days, respectively (see Table 37). In 2023, the timely distance between the first and second cut was 51 days. In this experiment, the growth rate after the first cut was just about
Figure
Figure
half as high as before the first cut in both years (see Table 37). Similar observations regarding the drop in growth rate at regrowth have been made for indigenous grass species in Canada and Iceland [30].
Table 37: Summary of the cutting schedule in this experiment and calculated growth rate (cm/d) according to the measured crop height. *days after fertilizing
The different fertilizer treatments resulted in different mean heights, but the differences were not statistically significant in 2022 (see Table 11) but were statistically significant in 2023 (see Table 29). Since in 2022 we did not observe a statistically significant difference between the mean height of the three different rates of mineral NPK 20-10-10 fertilizer, which were 150 g/10m2 (ta1), 300 g/10m2 (ta2) and 450 g/10m2 (ta3), which provide plant-available nutrients, it can be assumed that nutrient availability did not significantly influence height in this experiment.
In 2023, however, a statistically significant difference between ta1 and ta3 is observed (see Table 29) in the first cut, ta1 having the highest height. This confirms the suspicion from NDVI, that the treatments ta1 and ta3 were labelled wrongly, and that the results of ta1 (lowest fertilizer rate) are the results of ta3 (highest fertilizer rate) and vice versa. There is no statistically significant difference observed between the different cow manure treatments (f1, f2, f3, f4, a, k).
In 2022, the heights of the different replica blocks became more significant throughout the growing season, as also observed for the NDVI values. In Table 12 the p-values decrease for the replica blocks with each cut which indicates their increasing significance. Only at the third cut the p-value becomes p < 0.05 and Tukey’s test confirmed that replica block 3 was significantly higher than replica blocks 4 and 2. This difference in mean heights between different replica blocks can be explained by the age of the grass field which leads to an increase in the number of weed plants which can be found in each block. Those weeds, like taraxacum spp. (túnfífill), rumex acetosa (túnsúra), ranunculus subborealis (brennisóley) – growing mostly in replica blocks 1 and 2 – and rhinanthus minor (lokasjóður) – growing mostly in replica blocks 3 and 4 – which grow at a different rate. Later in the season the forage growth is reduced so the afore mentioned weeds predominantly contribute to the height measurements.
In 2023, the heights of the different replica blocks were more statistically significantly different than in the second cut, with decreasing heights from replica block 4 to replica block 1 (see Table 30). An explanation could be a nutrient gradient in the soil that expressed mainly itself during the highest growth rate of the grass (see Figure 17).
5.3 Dry matter yield
In general, there was a statistically significant difference between the dry matter yield (dmy) of the three cuts in 2022 and the two cuts in 2023, where the first cut had the highest dmy, the second cut the second highest dmy, and the third cut the third highest dry matter yield (see Table 18 and Table 36, respectively). This is a common observation due to the typical growth rates of crops during the growing season [28] (see also Figure 17). In general, the dmy for the first cut is commonly a lot higher than for the second cut. In this experiment the ratio of dmy between first and second cut was about 9:5 in 2022 and (see Table 18). Analogous to Table 37 could calculate the daily rate of dmy produced per hectare (see Table 38). It is apparent that the daily produced dry matter yield decreases rapidly throughout the growing season and that the first cut plays the dominant role for the total dry matter yield of a crop.
Table 38: Summary of the cutting schedule in this experiment and calculated dry matter yield rate (kg/ha/d) according to the measured crop height. The abbreviation „sd“ is for „standard deviation“. *days after fertilizing
date cut days after fertilizing days in between cuts
Looking at the impact of the different fertilizer treatments on the dry matter yield in 2022, it was observed that the dmy of the different treatments displayed significant differences (p < 0.05) for cut 1 (p = 0.006) and cut 2 (p = 0.026), but not for cut 3 (p = 0.373) which is shown in Table 14. The significance of the treatments decreased from cut 1 to cut 2 to cut 3. The mineral fertilizers lost their advantage over the growing season. Most of the crop production happens during the vegetative stage –which is before the first cut (see growth rates in Table 38). The highest nutrient requirement exists during this time and the crop will take up what is available, so the fertilizer type (which determines the plantavailability of the nutrients) and rate play an important role at this stage. There was no statistically significant difference observed between the dry matter yields of any of the different cow manure treatments f1, f2, f3, a, and k.
In 2023, the dry matter yield per treatment was also statistically significantly different for both cuts (Table 32), still there was no statistically significant difference observed between the dry matter yields of the different cow manure treatments f1, f2, f3, f4, a, and k. The control in the first cut yielded significantly less than the mineral fertilizer treatments, in the second cut the control yielded significantly less than ta1, which was the highest rate of mineral fertilizer in 2023.The total dry matter yield per treatment in 2022 and 2023 had a level of significance of p < 0.05 ( Table 16 and Table 34, respectively).
Treatment ta3 in 2022 and ta1 in 2023 resulted in the highest total dry matter yield, which confirms the suspicion derived from the NDVI and height observations, that in 2023, ta1 was applied where ta3 should have been applied and vice versa. Probably the fertilizer bags had been labelled wrongly during preparation.
5.3.1 Correlation between NDVI and dry matter yield in 2022
The NDVI was measured each time before the field was cut (cut 1: 23.06.2022, cut 2: 02.08.2022, cut 3: 13.09.2022). In Figure 18 the correlation between NDVI values and dry matter yield is presented. A linear regression for each cut was fitted to the NDVI data (x-axis) and the dry matter yield (y-axis), the grey area around the regression line indicating the 95%-interval. Linear regressions and R2 values are also given in Figure 18
The steepest slope is registered for the second cut with a gradient of 9.18 t/ha. The lowest gradient was evaluated for the third cut with 3.13 t/ha. For the first cut, a gradient of 7.72 t/ha was calculated. The R2-value is smallest for the first cut with R2 = 0.13 and largest for the second cut with R2 = 0.65.
Y1 = -3.95+7.72*x; R2 = 0.13
Y2 = -6.51+9.18*x; R2 = 0.65
Y3 = -2.02+3.13*x; R2 = 0.62
5.3.2 Correlation between height and dry matter yield in 2022
The grass height was measured each time before the field was cut (cut 1: 23.06.2022, cut 2: 02.08.2022, cut 3: 13.9.2022). In Figure 19 the correlation between measured heights and dry matter yield is presented. A linear regression for each cut was fitted to the height data (x-axis) and the dry matter yield (y-axis), the grey area around the regression line indicating the 95%-interval. Linear regressions and R2values are also given in Figure 19
Figure 18: Correlation between NDVI and dry matter yield on cutting dates 1, 2 and 3. The grey area around the regression line indicates the 95% confidence interval.
Y1 = 0.86+0.053*x; R2 = 0.23
Y2 = -0.12+0.078*x; R2 = 0.24
Y3 = -0.57+0.060*x; R2 = 0.53
Figure 19: Correlation between height and dry matter yield on cutting dates 1, 2 and 3. The grey area around the regression line indicates the 95% confidence interval.
The steepest slope is registered for the second cut with a gradient of 0.078 t/(ha*cm). The lowest gradient was evaluated for the first cut with 0.053 t/(ha*cm). For the third cut, a gradient of 0.060 t/(ha*cm) was calculated. The R2-value is smallest for the first cut with R2 = 0.23 and largest for the third cut with R2 = 0.53.
In 2022, the NDVI observations before cutting were a reasonably good indicator for dry matter yield (dmy) of the corresponding cut, especially for the second and third cut with higher R 2-values (0.65 and 0.62, respectively, see Figure 18 in Chapter 3.3). E.g. the dmy for the second cut could be estimated with
dmy / ! "# 0 = 6 51 ! "# + 9 18 ! "# ∙ NDVI-value,
which is the formula given for the second cut in Figure 18
The height measured immediately before cutting was a reasonably good indicator of the dry matter yield (dmy) of the corresponding cut (see Figure 19 in Chapter 3.3). The best correlation (R2 = 0.53) was found for the third cut with
dmy / ! "#0 = 0 57 ! "# + 0 06 ! "# %& ∙ height(��)
With this formula a good estimation for the dmy of of the third cut could be made.
The results of the calculated dmy values from NDVI and height for the first, second, and third cut in 2022 are summarized in Appendix 8.7, 8.8, and 8.9
5.3.3 Correlation between NDVI and dry matter yield in 2023
The NDVI was measured each time before the field was cut (cut 1: 03.07.2023, cut 2: 23.08.2023). In Figure 20 the correlation between NDVI values and dry matter yield is presented. A linear regression for each cut was fitted to the NDVI data (x-axis) and the dry matter yield (y-axis), the grey area around the regression line indicating the 95%-interval. Linear regressions and R2 values are also given in Figure 20
The higher slope is registered for the first cut with a gradient of 24.98 t/ha. The lower gradient was evaluated for the second cut with 5.44 t/ha. The R2-value is smaller for the second cut with R2 = 0.28 and larger for the first cut with R2 = 0.50.
Y1 = -16.24+24.98*x; R2 = 0.50
Y2 = -3.64+5.44*x; R2 = 0.28
Figure 20: Correlation between NDVI and dry matter yield on cutting dates 1 and 2. The grey area around the regression line indicates the 95% confidence interval.
5.3.4 Correlation between height and dry matter yield in 2023
The grass height was measured each time before the field was cut (cut 1: 03.07.2023, cut 2: 23.08.2023). In Figure 21 the correlation between measured heights and dry matter yield is presented. A linear regression for each cut was fitted to the height data (x-axis) and the dry matter yield (y-axis), the grey area around the regression line indicating the 95%-interval. Linear regressions and R2-values are also given in Figure 21.
The steeper slope is registered for the first cut with a gradient of 0.08 t/(ha*cm). The lower gradient was evaluated for the second cut with 0.05 t/(ha*cm). The R2-value is bigger for the first cut with R2 = 0.66 and smaller for the second cut with R2 = 0.25.
Y1 = -0.61+0.08*x; R2 = 0.66
Y2 = 0.01+0.05*x; R2 = 0.25
Figure 21: Correlation between height and dry matter yield on cutting dates 1 and 2. The grey area around the regression line indicates the 95% confidence interval.
In 2023, the formulas for the NDVI-dmy and height-dmy correlation looked very different (Figure 20 and Figure 21). The better correlation (R2 = 0.50) was found for the first cut with
dmy / ! "#0 = 16 24 ! "# + 24 98 ! "# ∙ NDVI-value,
which is the formula for the first cut in Figure 20.
Also, the height was a reasonably good indicator of the dry matter yield in the first cut (R2 = 0.66) with the following correlation:
dmy / ! "#0 = 0 61 ! "# + 0 08 ! "# %& ∙ height(��),
which is the formula for the first cut in Figure 21.
The correlations found here between pre-harvest measurements and the actual dry matter yield are not perfect and vary greatly between years and cuts. The crops growing in the grass field and the age of the grass field (having an impact on the crops growing there) apparently have a big influence on these correlations.
For the year 2023 the calculated dmy values from NDVI and height are summarized in Appendix 8.16 and 8.17.
5.4 Soil evaluation
The only mineral where the fertilizer treatment had a significant impact on the soil content after harvest was Na. It was significantly lower at the highest rate of mineral fertilizer (ta3) than at treatments f2 and k. The treatments f2 and k did not, however, cause a significantly higher Na soil content than the other treatments based on cow manure or the control. The high Na soil content (Na being one half of the NaCl molecule) of f2 and k, could be due the manure capturing process from the manure pit under the stable where the manure was pumped from directly to the barrels without further stirring before this process (see Figure 1).
The replica blocks had a significant impact on P, Ca, Mn, and Cu content, as well as pH and soil density. This can lead to the conclusion that there is a significant difference in soil conditions between the different replica blocks. As it was discussed for the strongly block-dependant significance of the NDVI results (see Figure 9 and Figure 15), this could also reflect in the nutrient content of the soil.
It is generally known that nutrients in the soil interact with each other which leads to changes in the availability to plants. This is visualized in the Mulder´s chart (Figure 22), which shows the antagonistic and synergistic relationships between certain soil minerals with regards to plant availability.
In the results in Table 20 the highest P value was observed in the replica block 2 where the lowest Ca values were observed. Where the highest Cu values were observed, the Mn levels were low. These results could be interpreted as where P was lowest in the soil after harvest (replica bock 4), it was much taken up by the crops, while its antagonists Ca was not taken up as much, thus there was significantly more Ca left in the soil compared to replica block 2 and 3. Similarly, it could be argued for Cu. Where most of it was left in the soil after harvest, its antagonist Mn was mostly taken up by the crops, thus leaving Cu in the soil.
The pH level was highest in replica block 4 where Ca levels were highest (P levels lowest). The detected Ca could be remnants of CaCO3 molecules that for some reason were available mostly in replica block 4. The reaction of CaCO3 with acidic molecules could have caused the pH level to rise significantly (compared to the other replica blocks), while at the same time leaving Ca in the soil. As for the NDVI data, the location of the experiment (replica block) played a significant role for the mineral content found in the soil. This was also a reason for the decision to repeat the experiment on a different field under different conditions.
Figure 22: left – Mulder´s chart (source: [31]); right – updated chart of cross reactions of plant macro and micro nutrients (source: [32]).
5.5 Hay quality and nutrient yield
5.5.1 Impact of treatments
In the first cut of 2022, the nutrients P, Mg, K, S, and protein and NDF content showed statistically significant results for different treatments (Table 21). Interestingly, the control did not always have the worst results for a certain nutrient, i.e. for Mg or K, where other fertilizer treatments performed the same. Only the highest mineral fertilizer rate ta3 performed significantly better than some of the cow manure fertilizers and the control, the exception being the nutrient K where f3 significantly outperformed ta3, and ta3 had the lowest content of all treatments, even the control. An explanation could be, that the K of the mineral fertilizer, in combination with the high rate of N, was 1) readily available for immediate uptake, 2) lead to additional fast uptake of the natural occurring available K in the soil, due to the high N rate which lets the crop grow fast. The NDF amount of treatment a was significantly higher than that of the control, while all other treatments were not statistically significant. The NDF value gives an indication of the total amount of cell walls within a product (cellulose – partially digestible, lignin – not digestible, hemicellulose – digestible), so usually farmers want to be the NDF value rather low compared to protein and sugar content which contribute more to milk production. In the samples of the first cut, the protein content was significantly higher for treatment ta3 than for the control and treatment k. For ta3 also the ratio between protein content and NDF was largest. The highest rate of the mineral fertilizer produced the highest amount of protein content, and it is an economic question if the difference between i.e. ta2 and ta3 (ta2+50%) is resulting in that much more milk production that it compensates for the higher fertilizer investment. According to the lab results the milk production (milk feed units - FEm) for all treatments was statistically more or less the same.
There was no statistically significant difference in chemical content of the hay of the first cut between any of the cow-manure-based treatments f1, f2, f3, a, and k.
In the second cut, no statistically significant differences were observed between the chemical content of the hay of different fertilizer treatments but between the chemical content of the hay of the four different replica blocks.
5.5.2 Impact of replica blocks
In cut 1, there were statistically significant differences between replica blocks for P, Mg, S, Mn, Cu, Zn, and NDF (see Table 23). Certain nutrients appear to be high or low in the hay at the same time in certain replica blocks, i.e. P and Mg were significantly higher in the hay of replica block 2 than in the hay of replica block 4. Zn behaved exactly the other way around: the hay of replica block 2 contained significantly more Zn than the hay of replica block 4. This is in accordance with Mulder´s chart (see Figure 22, left), where P and Mg interact with each other, while P and Zn are antagonists, P preventing the uptake of Zn. Another example are S and Mn, which are significantly higher in replica block 3 than in replica block 1. In the updated Mulder´s chart (Figure 22, right) it is indicated that S negatively impacts the uptake of Mn. The NDF content was significantly higher in replica block 3 than in replica block 4. Since the vegetation of these two replica blocks looked very similar (see Figure 15), there seems to be a difference in the cellular structure (cell wall to cell content ratio), which could stem from the difference in underlying soil, replica block 4 having many significant results in this evaluation.
There were more significant differences in the chemical content of the hay to observe in the second cut than in the first one. There were statistically significant differences between replica blocks for P, Ca, Na, Mn, Cu, Fe, Zn, protein, sCp, and iNDF. The hay of replica block 4 contained significantly lower P than replica block 1, significantly higher Ca than replica block 2, significantly lower Na than replica block 3 (similar to replica block 2), significantly higher Mn than replica block 1 and 2 (similar to replica block 3), significantly lower Cu than replica block 3, significantly lower Zn than replica block 1 and 3, significantly lower protein than replica block 3, and significantly higher iNDF than replica block 3. Replica block 2 had not only the lowest dry matter yield in total of all four replica blocks in 2022 (see
Table 17), its hay also had significantly lower P content than block 1, significantly lower Ca than block 4, significantly lower Na than block 3, and significantly lower Mn than replica blocks 3 and 4. These results are inverted compared to the nutrient content of the first cut, where we observed the opposite for P, Mg, and Zn (replica block 2 having significantly higher values than replica block 4).
5.5.3 Sugar, protein, and milk feed units
Looking into the total harvest of protein and sugar in the first cut (57% of the total dry matter yield) it was found that the mineral fertilizer treatments ta3 and ta2 gave the highest yield in protein and sugar (see Table 39, calculated from Table 14 and Table 21). The control gave the lowest yield of both. The mineral fertilizer treatment ta1 did not perform much better than the cow-manure-based fertilizer treatments f1, f2, f3, a, and k. The milk feed units (FEm) per ha followed more or less the results of the dmy, the only exception being treatments a and f3, where f3 had the lower dry matter yield, but higher milk feed units than treatment a.
Table 39: Dry matter yield, mean protein content, mean sugar content, harvested protein and sugar content, and FEm/ha of the first cut in 2022.
1st cut
In the second cut the results are very similar to the first cut (see Table 40). The mineral fertilizer treatments ta3 and ta2 result in the highest protein and sugar yield, ta1 did not perform better than the cow-manure-based treatments. Control had the lowest yield of protein and sugar. Overall, the ratio protein/sugar was lower than in the first cut. The milk feed units per ha in the second cut followed exactly the results of the dry matter yield, the treatment with the highest dmy/ha also had the highest FEm/ha.
Table 40: Dry matter yield, mean protein content, mean sugar content, harvested protein and sugar content, and FEm/ha of the second cut in 2022.
2nd cut
These results are also reflected in the total yield (see Table 41) where ta3 and ta2 lead the results with regards to total harvested protein and sugar, and with the protein/sugar ratio. The control performed worst in everything except for the protein/sugar ratio which was lower for treatment f3 and equal for treatment a.
Table 41: Dry matter yield, harvested protein and sugar content, and FEm/ha of the first two cuts in 2022.
+
The range of the summed-up milk feed units of both cuts (see Table 41) shows a range from 3002 FEm/ha for treatment f2 to 2207 FEm/ha for treatment f1. Treatment ta1, as the lowest of the mineral fertilizer treatments, had almost as high FEm as the best performing cow-manure-based treatment (f2).
5.5.4 Agronomical efficiency factor and productivity of the fertilizer In Table 42 agronomic efficiency (AE) and the partial factor productivity (PFP) [33] of applied N with regards to milk feed units (FEm) and dry matter yield (dmy) are summarized for the year 2023. The calculations are based on the results found in Table 21 and Table 22, and Table 16. The agronomic efficiency indicates the yield increase per kg nutrient applied. The partial factor productivity indicates the kg of harvested product per kg nutrient applied.
Agronomic efficiency is calculated by: �� = (� �' )/� and the partial factor productivity is calculated by: ��� = (�/� ), where F is the amount of fertilizer or nutrient applied (kg/ha), Y is the dry matter yield of the crop resulting from the applied nutrient (kg/ha), and Y0 is the dry matter yield of the crop in a control treatment without the nutrient (kg/ha).
As can be seen in Table 42, the highest AE and PFP for the FEm is found for ta1. The highest PFP for dmy is also found for ta1 but the highest AE for dmy is found for f2, followed by ta1.
Table 42: Agronomic efficiency (AE) and partial factor productivity (PFP) of applied N, calculated for FEm and dmy in 2022. For FEm the results of chemical analysis for cuts 1 and 2 are used, for dry matter yield, the added yield of all three cuts is used.
It appears that ta1 is the most efficient way to apply nitrogen with regards to AE and PFP for FEm, so highest milk feed unit increase per kg nitrogen applied and highest amount of harvested milk feed units per kg nitrogen applied. The dry matter yield of f2 increases the most with each kg of fertilizer applied, while the total amount of harvested material is highest for ta1.
Out of the cow manure treatments f2 has the highest AE and PFP for FEm and dmy. Treatment f1 is worse than k (untreated cow manure) regarding AE and PFP for FEm. For the dmy, treatment k is worst, so adding the additives improves the AE and PFP of cow manure.
In Table 43 AE and PFP for the dmy of 2023 are summarized. The calculations are based on the results in Table 34. For the calculations that Table 43 is based on it is assumed that treatments ta1 and ta3 were most probably exchanged, and ta3 in fact received the lowest dosage of N (30 kg/ha) while ta1 received the highest dosage of N (90 kg/ha), see also Appendix 8.1.
Treatment ta3 (lowest N dosage) has the highest AE of the mineral fertilizer treatments, but all cowmanure-based treatments have a higher AE, the lowest (f2, AE = 45.7 kg/(ha*kg)) being around 40% higher than the AE of ta3. The same is the case for PFP: ta3 (lowest N dosage) has the highest PFP, but it is still around 60% lower than the lowest PFP of the cow-manure-based treatments (f2, PFP = 164.3 kg/(ha*kg)).
Out of the cow-manure-based treatments f2 performed the worst with regards to dmy, AE and PFP. This is the complete opposite to the year 2022 on the other experimental site, which was an older grass field. The untreated cow manure had the best results for dmy, AE and PFP in 2023.
Table 43: Agronomic efficiency (AE) and partial factor productivity (PFP) of applied N, calculated for dmy in 2023. *The fertilizer dosages for ta3 and ta1 are exchanged for the calculations since the dmy strongly indicates that an error during preparation occurred.
5.5.5 N, P, K return in harvest
In Table 44 the input of NH4-N and output (harvest) of N is given. RE (apparent crop recovery efficiency of applied nutrient) and IE (internal utilization efficiency of applied nutrient) are presented. RE is the kg increase in nutrient uptake per kg nutrient applied, which depends on the congruence between plant demand and nutrient release from fertilizer. IE is the kg yield per kg nutrient uptake, which describes the ability of a plant to transform nutrients acquired from all sources (soil, fertilizer) into economic yield [33]
Apparent crop recovery efficiency is calculated by: �� = (� �' )/� and the internal utilization efficiency is calculated by: �� = (�/�), where F is the amount of fertilizer or nutrient applied (kg/ha), U is the nutrient yield resulting from the applied nutrient (kg/ha), and U0 is the nutrient yield in a control treatment without the application of this nutrient (kg/ha), and Y is the dry matter yield of the crop.
The calculations of RE and IE were performed on the basis of the analyzed protein content (Table 21 and Table 22), the resulting harvested protein (Table 39 and Table 40) by dividing the value of harvested protein by the factor 6.25, and the summed up dmy of cut 1 and cut of 2022 (Table 14).
The RE is highest for treatments ta1 and f2, where 0.86 kg and 0.80 kg of N are taken up, respectively, with each kg N applied. The lowest RE is registered for k and f1, where 0.22 kg and 0.24 kg of N are taken up, respectively, with each kg N applied. The high RE values can indicate a well-managed system with low levels of applied N or low levels of N in the soil – so practically, everything that is available is taken up. The IE is highest for treatment k and f3 with 49.20 kg dmy/kg N and 48.02 kg dmy/kg N This indicates that these two treatments lead to the highest transformation of acquired N to economic yield. IE was lowest for ta3 and ta2, with 40.92 kg dmy/kg N and 43.81 kg dmy/kg N, respectively. Optimal levels of IE are found between 55 - 65 kg/kg at a balanced nutrition and high yield levels for cereals [33]. Since we are observing a grass field in this experiment the numbers here can vary from the considered optimal values, and still be very good.
Table 44: Apparent crop recovery efficiency of N (RE) and internal utilization efficiency of applied N (IE); calculated based on the protein values of the chemical analysis of cut 1 and cut 2 in 2022 (Table 21 and Table 22).
In Table 45 the input and output (harvest) of P is given. RE and IE for P are also presented. The calculations were performed based on the chemically analyzed P content (Table 21 and Table 22) and the summed up dmy of cuts 1 and 2 in 2022 (Table 14).
The highest RE is found for treatment f2 with 0.35 kg P taken up per kg P applied, the lowest for treatment f1 with 0.08 kg P taken up per kg P applied. This observation suggests that most of the applied P is either washed out or remains immobilized in the soil. The process of immobilization apparently happens faster than the plants’ capacity to take up the P which, at least for the mineral fertilizer, should be in its optimal state to be taken up. It has already been established that several soils in Iceland tend to quickly immobilize P from fertilizers, depending on their FEox and Alox (oxalate extractable FE and Al) [34]. This is probably the case in the experimental field at Hvanneyri where the FEox content has been found to be very highly correlated with P retention [34]. The cow-manure-based fertilizer materials seem to have an impact on the plant availability of the P.
Table 45: Apparent crop recovery efficiency of P (RE) and internal utilization efficiency of applied P (IE); calculated based on the chemical analysis of cut 1 and cut 2 in 2022 (Table 21 and Table 22).
IE is highest for treatments f1 and a, with 422.67 kg dmy per kg P taken up while it is lowest for treatment ta3 with 339.52 kg dmy per kg P taken up, which means that it has the lowest transformation of P to economic yield. A very high IE can suggest a deficiency of the that nutrient, while a low IE can indicate poor internal conversion of the nutrient due to other stresses, like drought, heat, etc. [33]. All
IE values are within a reasonably close range (339.52 kg/kg – 422.67 kg/kg) so it can be assumed that the experimental plots did not experience much difference between physical, chemical or biological stress. Since the uptake of P is an order of a magnitude smaller than that of N, the resulting IE are an order of a magnitude larger than that of N.
In Table 46 the input and output of K is given. RE and IE for K are also presented. The calculations were performed based on the chemically analyzed K content (Table 21 and Table 22) and the summed up dmy of cuts 1 and 2 in 2022 (Table 14).
The highest RE is observed for treatment ta1 with 1.60 kg K taken up per kg K applied. The lowest RE is observed for f1 with 0.20 kg K taken up per K applied. The IE is highest for ta3 with 68.23 kg dmy produced per kg K taken up, while the lowest IE is observed for f3 with 48.85 kg dmy per kg K taken up.
Table 46: Apparent crop recovery efficiency of K (RE) and internal utilization efficiency of applied K (IE); calculated based on the chemical analysis of cut 1 and cut 2 in 2022 (Table 21 and Table 22).
cut 1 cut 2 total RE IE
Treatment f1 has the lowest RE values for all three observed nutrients N, P, and K, very similar to that of treatment k (pure cow manure). It is not visible here how significant the impact of treatment f1 is, but there seems that there is little to no advantage compared to simply using untreated cow manure as fertilizing material with regards to RE.
On this particular field ta1 (the lowest mineral fertilizer rate of 150 kg/ha NPK 20-10-10) had the best RE values for N and K out of all fertilizer treatments, while it still had the best RE value for P out of the mineral fertilizer treatments.
6 Summary
• Age of the field (vegetation, weeds) and underlying soil have a strong impact on the outcome of the experiment. Particularly, the location of the replica blocks was higher statistically significant for the soil evaluation than the fertilizer treatment.
• NDVI and height measurements can be used as predictors for yield but can vary highly from field to field (see point above: impact of the location and age of the field).
• In this experiment even the highest rate of mineral fertilizer (450 kg/ha of NPK 20-10-10) is not statistically significantly superior to the cow-manure based fertilizers with regards to the total dmy in 2022, but it is in 2023.
• f2 (Haugmelta XLG) has the highest dmy in 2022 out of the cow-manure-based fertilizers.
• f1 (Viscolight) has the highest dmy in 2023 out of the cow-manure-based fertilizers.
• f2 (Haugmelta XLG) has the highest RE (apparent crop recovery efficiency) for N, P, and K out of the cow-manure-based fertilizers.
• f1 (Viscolight) has the lowest RE for N, P, and K out of the cow-manure-based fertilizers.
• Overall, manure-based fertilizers left a greater (not statistically significant, though) amount of nutrients in the soil compared to the mineral fertilizers (exception: phosphorus).
7 Literature
[1] R. Gutser, Th. Ebertseder, A. Weber, M. Schraml, and U. Schmidhalter, ‘Short-term and residual availability of nitrogen after long-term application of organic fertilizers on arable land’, Journal of Plant Nutrition and Soil Science, vol. 168, no. 4, pp. 439–446, 2005, doi: 10.1002/jpln.200520510.
[2] H. Liu, J. Li, X. Li, Y. Zheng, S. Feng, and G. Jiang, ‘Mitigating greenhouse gas emissions through replacement of chemical fertilizer with organic manure in a temperate farmland’, Science Bulletin, vol. 60, no. 6, pp. 598–606, Mar. 2015, doi: 10.1007/s11434-014-0679-6.
[3] J. Webb et al., ‘Chapter Seven - An Assessment of the Variation of Manure Nitrogen Efficiency throughout Europe and an Appraisal of Means to Increase Manure-N Efficiency’, in Advances in Agronomy, vol. 119, D. L. Sparks, Ed., in Advances in Agronomy, vol. 119. , Academic Press, 2013, pp. 371–442. doi: 10.1016/B978-0-12-407247-3.00007-X.
[4] P. Kyvsgaard, P. Sørensen, E. Møller, and J. Magid, ‘Nitrogen mineralization from sheep faeces can be predicted from the apparent digestibility of the feed’, Nutrient Cycling in Agroecosystems, vol. 57, no. 3, pp. 207–214, Jul. 2000, doi: 10.1023/A:1009874500769.
[5] J. M. Powell, M. A. Wattiaux, G. A. Broderick, V. R. Moreira, and M. D. Casler, ‘Dairy Diet Impacts on Fecal Chemical Properties and Nitrogen Cycling in Soils’, Soil Science Society of America Journal, vol. 70, no. 3, pp. 786–794, 2006, doi: 10.2136/sssaj2005.0286.
[6] P. Sørensen and J. A. Fernández, ‘Dietary effects on the composition of pig slurry and on the plant utilization of pig slurry nitrogen’, The Journal of Agricultural Science, vol. 140, no. 3, pp. 343–355, May 2003, doi: 10.1017/S0021859603003113.
[7] P. Sørensen, M. R. Weisbjerg, and P. Lund, ‘Dietary effects on the composition and plant utilization of nitrogen in dairy cattle manure’, The Journal of Agricultural Science, vol. 141, no. 1, pp. 79–91, Aug. 2003, doi: 10.1017/S0021859603003368.
[8] E. S. Gale, D. M. Sullivan, C. G. Cogger, A. I. Bary, D. D. Hemphill, and E. A. Myhre, ‘Estimating Plant-Available Nitrogen Release from Manures, Composts, and Specialty Products’, Journal of Environmental Quality, vol. 35, no. 6, pp. 2321–2332, 2006, doi: 10.2134/jeq2006.0062.
[9] T. Morvan, B. Nicolardot, and L. Péan, ‘Biochemical composition and kinetics of C and N mineralization of animal wastes: a typological approach’, Biol Fertil Soils, vol. 42, no. 6, pp. 513–522, Aug. 2006, doi: 10.1007/s00374-005-0045-6.
[10] K. Peters and L. S. Jensen, ‘Biochemical characteristics of solid fractions from animal slurry separation and their effects on C and N mineralisation in soil’, Biol Fertil Soils, vol. 47, no. 4, pp. 447–455, May 2011, doi: 10.1007/s00374-011-0550-8.
[11] D. Cavalli, M. Corti, D. Baronchelli, L. Bechini, and P. Marino Gallina, ‘CO2 emissions and mineral nitrogen dynamics following application to soil of undigested liquid cattle manure and digestates’, Geoderma, vol. 308, pp. 26–35, Dec. 2017, doi: 10.1016/j.geoderma.2017.08.027.
[12] M. A. Ashraf and M. Mohd Hanafiah, ‘Sustaining life on earth system through clean air, pure water, and fertile soil’, Environ Sci Pollut Res, vol. 26, no. 14, pp. 13679–13680, May 2019, doi: 10.1007/s11356-018-3528-3.
[13] T. C. de Bang, S. Husted, K. H. Laursen, D. P. Persson, and J. K. Schjoerring, ‘The molecular–physiological functions of mineral macronutrients and their consequences for deficiency symptoms in plants’, New Phytologist, vol. 229, no. 5, pp. 2446–2469, 2021, doi: 10.1111/nph.17074.
[14] ‘mmf_manurenutribehaviour_factsheet.pdf’. Accessed: Feb. 15, 2023. [Online]. Available: https://www.gov.mb.ca/agriculture/environment/nutrientmanagement/pubs/mmf_manurenutribehaviour_factsheet.pdf
[15] ‘Safety_Data_Sheet_Viscolight.pdf’. Accessed: Aug. 31, 2022. [Online]. Available: https://www.nexles.com/uploads/Safety_Data_Sheet_Viscolight.pdf
[16] ‘Viscolight, 7 kg disinfectant from Azelis | Nexles Europe’. Accessed: Aug. 31, 2022. [Online]. Available: https://www.nexles.com/eu/azelis-disinfectant-viscolight-7-kg.html
[17] ‘Haugmelta XLG niðurbrotsnefni í haughús’, Kemi. Accessed: Aug. 31, 2022. [Online]. Available: https://kemi.is/verslun/hreinsiefni/haugmelta-xlg-baetiefni-fyrir-haughus/
[18] ‘Nova Optimizer niðurbrotsefni í haughús’, Kemi. Accessed: Aug. 31, 2022. [Online]. Available: https://kemi.is/verslun/landbunadarvorur/gripahus/novaoptimizer-nidurbrotsefni-i-haughus/ [19] admin, ‘AgriMestMix’, Rinagro. Accessed: May 10, 2023. [Online]. Available: https://rinagrosmart-farming.nl/en/agrimestmix/
[20] V. Sokolov et al., ‘Greenhouse Gas Mitigation through Dairy Manure Acidification’, Journal of Environmental Quality, vol. 48, no. 5, pp. 1435–1443, 2019, doi: 10.2134/jeq2018.10.0355.
[21] ‘Trausti Hrausti stíflueyðir’, Kemi. Accessed: Aug. 31, 2022. [Online]. Available: https://kemi.is/verslun/hreinsiefni/hreinsiefni-fyrir-nidurfoll/trausti-hrausti-stiflueydir/
[22] ‘3079_syren-light-brochure-2019-agritechnica.pdf’. Accessed: Aug. 31, 2022. [Online]. Available: http://www.biocover.dk/CustomerData/Files/Folders/11-pdf-2020/3079_syren-lightbrochure-2019-agritechnica.pdf
[23] ‘agriculture-greenseeker-handheld-datasheet-en-us.pdf’. Accessed: Feb. 14, 2023. [Online]. Available: https://assets.ctfassets.net/npb3dl1oqqgh/6J7w3BW4Z1yvQwJLedVznc/f34b3dd463cae9b0a696fba78 544c7ad/agriculture-greenseeker-handheld-datasheet-en-us.pdf
[24] ‘F400 Platemeter’, Platemeters. Accessed: Jan. 24, 2023. [Online]. Available: https://platemeters.co.nz/products/f400-platemeter
[25] X. Mu and Y. Chen, ‘The physiological response of photosynthesis to nitrogen deficiency’, Plant Physiology and Biochemistry, vol. 158, pp. 76–82, Jan. 2021, doi: 10.1016/j.plaphy.2020.11.019.
[26] A. C. Risch et al., ‘Soil net nitrogen mineralisation across global grasslands’, Nat Commun, vol. 10, no. 1, Art. no. 1, Oct. 2019, doi: 10.1038/s41467-019-12948-2.
[27] ‘Cutting management for cool-season forage grasses’, MSU Extension. Accessed: Mar. 16, 2023. [Online]. Available: https://www.canr.msu.edu/news/cutting_management_for_cool_season_forage_grasses
[28] E. B. Rayburn, ‘Pasture Management for Pasture-finished Beef’.
[29] G. Thorvaldsson, H. Björnsson, and J. Hermannsson, ‘The influence of weather on early growth rate of grasses’.
[30] Wm. W. Mitchell, ‘GRASSES INDIGENOUS TO ALASKA AND ICELAND COMPARED WITH INTRODUCED GRASSES FOR FORAGE QUALITY’, Can. J. Plant Sci., vol. 67, no. 1, pp. 193–201, Jan. 1987, doi: 10.4141/cjps87-023.
[31] ‘Mulders Chart: Nutrient Interactions – Nutriag’. Accessed: Jun. 12, 2024. [Online]. Available: https://www.nutriag.com/mulderschart/
[32] X. Fan, X. Zhou, H. Chen, M. Tang, and X. Xie, ‘Cross-Talks Between Macro- and Micronutrient Uptake and Signaling in Plants’, Front. Plant Sci., vol. 12, Oct. 2021, doi: 10.3389/fpls.2021.663477.
[33] A. Dobermann, ‘Nutrient use efficiency – measurement and management’, Department of Agronomy and Horticulture: Faculty Publications, Jan. 2007, [Online]. Available: https://digitalcommons.unl.edu/agronomyfacpub/1442
[34] T. Gudmundsson, S. T. Gudmundsson, and G. Thorvaldsson, ‘Soil phosphorus fractionation in Icelandic long-term grassland field experiments’.
