FINAL REPORT


„ÁhrifLEDlýsingarávöxt,uppskeruoggæði
gróðurhúsajarðarberjaaðvetri“
Duration: 01/10/2017–30/09/2018
Projectleader:
LandbúnaðarháskólaÍslands
Reykjum Dr.ChristinaStadler 810Hveragerði Email:christina@lbhi.is Mobile:8435312
Garðyrkjufræðingur: BörkurHalldórBlöndalHrafnkelsson
Ræktunarstjóritilraunahús: ElíasÓskarsson
Collaborators: HelgiJóhannesson,Ráðgjafarmiðstöðlandbúnaðarins
EinarPálsson,Sólbyrgi
EiríkurÁgústsson,Silfurtún
GísliJóhannsson,Dalsgarður
GuðmundurHafsteinsson,Reykjum2
HólmfríðurGeirsdóttir,Kvistar
JóhannChristiansen,Laugarbóli
KristmundurHannesson,Grænamörk
Projectsponsors: Framleiðnisjóðurlandbúnaðarins
SambandGarðyrkjubænda
BændahöllinniviðHagatorg 311Borgarnes 107Reykjavík
Hvanneyrargötu3
TheNetherlands
Yield
Interiorqualityofyield
Sugar content
Taste of strawberries
Drysubstance of fruits
Relationship between
substance and sugar content of fruits
Fig.1: Experimentaldesignofcabinets.
Fig.2: Timecourseofsolarirradiation.
Fig.3: Soiltemperature.
Fig.4: Leaftemperature. 16
Fig.5: Dailyappliedwater.
Fig.6: E.C.andpHof irrigationwaterandrunoff.
Fig.7: Proportionof amountofrunofffromappliedirrigationwater.
Fig.8: Numberof leavesatstrawberryplants.
Fig.9: Numberof runnersatstrawberryplants. 21
Fig.10: Numberof clusters atstrawberryplants. 22
Fig.11: Numberofflowers/fruitspercluster. 23
Fig.12: Openflowers/fruitsperplant. 24
Fig.13: Numberof totalflowersandunpollinatedflowers. 24
Fig.14: Cumulativetotalyieldofstrawberries. 26
Fig.15: Timecourseofaccumulatedmarketableyieldof strawberries. 27
Fig.16: Time course of accumulated marketable yield of strawberries forthewholechamber. 28
Fig.17: Timecourseofmarketableyield. 29
Fig.18: Averageweightof strawberries. 31
Fig.19: Number of days from pollination to harvest and weight of the harvestedfruit. 32
Fig.20: Development of openflowers/ fruits, harvested fruits andtheir sumduringthegrowthofthestrawberries. 33
Fig.21: Sugarcontentof strawberries. 35 Fig.22: Sweetness,flavour,juicinessandfirmnessofstrawberries. 36
Fig.23: Drysubstanceofstrawberries. 37 Fig.24: Relationshipbetweendrysubstanceandsugarcontentoffruits. 37
Fig.25: UsedkWhinthedifferentchambers. 38
Fig.26: Revenuesatdifferenttreatments. 44
Fig.27: Variableandfixedcosts(withoutlightingandlabourcosts). 45 Fig.28: Divisionofvariableandfixedcosts.
Fig.29: Profitmargininrelationtotariffandtreatment. 46
Fig.30: Profit margin in relation to yield with different light sources –calculationscenarios(urbanarea,VA210).
Fig.31: Profit margin in relation to yield with different varieties –calculationscenarios(urbanarea,VA210).
Fig.32: Profit margin in relation to treatment – calculation scenarios (urbanarea,VA210).
Tab. 1: Usedfertilizermixtureforstrawberries.
Tab. 2: Lightdistributioninthechambers.
Tab. 3: Chambersettings.
Tab. 4: Cumulativetotalnumberofmarketablefruits.
Tab. 5: Proportionof marketableandunmarketableyield.
Tab. 6: Lightinghours,power andenergyinthecabinets.
Tab. 7a: Costs for consumption of energy for distribution and sale of energyforlightingwithHPSlights.
Tab. 7b: Costs for consumption of energy for distribution and sale of energyforlightingwithLEDs.
Tab. 8: Variablecostsof electricityinrelationtoyield.
Tab. 9: Profit margin of strawberries at different light treatments (urbanarea,VA210).
Tab. 10: Calculationscenariosofprofitmarginperyear.
In Iceland, winter production of greenhouse crops is totally dependent on supplementary lighting and has the potential to extend seasonal limits and replace imports during the winter months. Adequate guidelines for winterproduction of strawberries are not yet in place and need to be developed. The objective of this study was to test if the light source is affecting growth, yield and quality over the winterofjunebearersandtoevaluatetheprofitmargin.
A strawberry experiment with junebearers (Fragaria x ananassa cv. Sonata and cv. Magnum) was conducted from the beginning of December 2017 to the beginning of April 2018 in the experimental greenhouse of the Agricultural University of Iceland at Reykir. Strawberries were grown in 5l pots in six replicates with 12plants/m2 under high-pressure vapour sodium lamps (HPS, 180W/m2, 277µmol/m2/s) or under LED lights (279µmol/m2/s) for a maximum of 16hours light. The day temperature was 16°C and the night temperature 8°C, CO2 800 ppm. Strawberries received standard nutritionthroughdripirrigation.The effectof thelightsourcewastestedandtheprofit marginwascalculated.
When it was not getting a bit bright outside were bumblebees still pollinating flowers in the HPS treatment, but not inthe LED treatment. It took 1-2 days from floweringto pollination. The fruits were ripe in 40/41 days (Magnum/Sonata) under HPS lights and in 45/47 days (Magnum/Sonata) under LED lights. Sonata had about 10 more flowers than Magnum. For Sonata were 1% of the total flowers unpollinated. For Magnum were15% unpollinated flowers or later rejected flowers counted under LED lights and 27% under HPS lights. The development of the flowers and berries was delayed by 1,5-2 weeks under LED lights and therefore, gave the plants under HPS lights two weeks earlier ripe berries and harvest was also finished two weeks earlier thantheharvestunderLEDs.
The light source did not affect the weight of marketable yield. Sonata had with 580/590g/plant under LED and 540/610 g/plant under HPS lights a tendentially or significantly higher marketable yield than Magnum with 400/530 g/plant under LED and 440/520 g/plant under HPS lights. The reason for the more than 10% lower marketableyieldof MagnumcomparedtoSonatawasattributedto alowernumberof marketable fruits due to a significantly higher percentage of unshaped fruits.
Differences between varieties developed at the middle of the harvest period. Marketableyieldwasabout90%oftotalyield.
No differences in the sugar content between light sources were measured. Magnum had most of the time a significantly higher sugar content than Sonata. In the tasting experiment were higher grades given for the firmness under LED lights for both varieties and Sonata fruits seem to be evaluated juicier and Magnum fruits firmer. The use of Sonata increased the yield by 1,1 kg/m2 and the profit margin by 2.300 ISK/m2 underHPSlights,respectivelyby0,8kg/m2 and1.600ISK/m2 underLEDs.
Despitethatchamber settings wereset thesamebetweentreatments,wererecorded differences: The CO2 amount was abit higher inthe LEDchamber due to moreopen windows in the HPS chamber. Air temperature was in average 0,4°C higher under HPSlightsduetoahigherdaytemperaturecausedbyadditionalheadingbytheHPS lamps. Under HPS lights was the soil temperature about 1°C higher and the leaf temperature nearly 3°C higher compared to the LED treatment. This temperature advantage could have positively influenced growth and yield of the plants underHPS lights. However, it has also to be taken into account, that solar irradiation increased at the endoftheexperimentandthus, possiblythe LEDtreatment benefitedfromthis duetothetwoweekslongergrowingperiodcomparedtotheHPStreatment.
Using LED lights was associated with nearly 45% lower daily usage of kWh’s, resulting in lower expenses for the electricity but higher investment costs compared to HPS lights. With the use of LEDs increased the profit margin by 1.200ISK/m2 for Magnum and by 500ISK/m2 for Sonata for one growing circle. A higher tariff did not change profit margin. Also, the position of the greenhouse (urban, rural) did nearly not influence profit margin. However, there was a small advantage for the urban area.Takingthreeyears of growingstrawberries intoaccount was resultinginaprofit margin that was similar between light sources. Possible recommendations for saving costsotherthanloweringtheelectricitycostsarediscussed.
Before LEDs can be adviced in practice, more scientific studies are needed with different temperaturesettings tocompensate the additional heating bytheHPS lights andthe delayed growth and harvest. Inaddition, solutions fora successful pollination during the time when no solar light is entering the greenhouse must be found to ensure a satisfactory yield with LED lighting. Therefore, so far a replacement of the HPSlampsbyLEDsis notrecommended.
Vetrarræktun í gróðurhúsum á Íslandi er algjörlega háð aukalýsingu. Viðbótarlýsing getur því lengt uppskerutímann og komið í stað innflutnings að vetri til. Fullnægjandi leiðbeiningar vegna vetrarræktunar á jarðarberjum eru ekki til staðar og þarfnast frekari þróunar. Markmiðið var að prófa hvort ljósgjafi hefði áhrif á vöxt, uppskeru og gæðiyfirháveturájunebearersoghvortþaðværihagkvæmt.
Gerðvar jarðarberja tilraunmeð junebearers (Fragaria x ananassa cv. Sonata og cv. Magnum) frá byrjun desember 2017 og fram í byrjun apríl 2018 í tilraunagróðurhúsi Landbúnaðarháskóla Íslands að Reykjum. Jarðarber voru ræktuð í 5l pottum í sex endurtekningum með 12plöntum/m2 undir topplýsingu frá háþrýsti-natríumlömpum (HPS, 180 W/m2, 277 µmol/m2/s) eða undir LED ljósi (279 µmol/m2/s) að hámarki í 16klst.Daghitivar16°Cognæturhiti8°C,CO2 800ppm.Jarðarberinfengunæringu meðdropavökvun.Áhrifljósgjafavarprófuðogframlegðreiknuðút.
Þegar það naut ekki smá dagsbirtu voru býflugur ennþá að frjóvga blóm í HPS meðferð, en ekki í LED meðferð. Það tók 1-2daga frá blómgun til frjóvgunar. Ávextir voru þroskaðir á 40/41degi (Magnum/Sonata) undir HPS ljósi og á 45/47dögum (Magnum/Sonata) undir LED ljósi. Sonata var með fleiri blóm borið saman við Magnum. Að auki voru 1% af heildarblómum ófrjóvguð. Hins vegar var hlutfall hjá Magnum 15% ófrjóvgað eða blómin blómstruðu og visnuðu síðan undir LED ljósum og 27% undir HPS ljósum. Þróun blómanna og berjanna var um 1,5-2 víkum seinni með LED ljósum og því byrjaði meðferð undir HPS ljósum tveimur vikum áður að gefaþroskuðberoguppskeranvareinnigbúintveimurvikumfyrr.
Ljósgjafinn hafði ekki áhrif á þyngd markaðshæfrar uppskeru. Sonata var með 580/590g/plöntur undir LED ljósi og 540/610g/plöntur undir HPS ljósum markaðhæfrar uppskeru en Magnum með 400/530g/plöntur undir LED ljósi og 440/520g/plöntur undir HPS ljósum. Ástæðan fyrir meira en 10% lægri markaðshæfrar uppskeru af Magnum borið saman við Sonata voru færri jarðarber vegna tölfræðilega marktækt hærra hlutfalls af illa löguðum jarðarberjum. Mismunur milli yrkja myndaðist á miðju uppskeru tímabilinu. Hlutfall uppskerunnar sem hægt varaðseljavarum90%.
Enginn munur var á sykurinnihaldi milli ljósgjafa, en sykurinnihaldið var yfirleitt meira hjá Magnum en hjá Sonata. Þessi munur fannst ekki í bragðprófun. Einkun fyrir þéttleika var hærri undir LED ljósi fyrir bæði yrkin og Sonata var með meiri safi og
Magnum með meiri þéttleika. Ræktun af Sonata í staðin fyrir Magnum jók uppskeru um 1,1kg/m2 og framlegð um 2.300ISK/m2 undir HPS ljósi og um 0,8kg/m2 og 1.600ISK/m2 undirLED.
Þrátt fyrir eins stillingar milli meðferða, var skráður munur: CO2 magnið var svolítið hærra í LED klefa vegna þess að gluggarnir í HPS klefa voru að opnast meira. Lofthitastigið var að meðaltali 0,4°C hærra í HPS klefanum vegna hærri dagshita út af viðbótarhiti frá HPS lömpum. Í HPS klefanum var jarðvegshiti um 1°C hærri og laufhiti næstum því 3°C hærri samanborið við LED klefann. Það getur líka haft jákvæð áhrif á vöxt plantna og uppskeru. Hins vegar þarf einnig að taka tillit til þess að sólarinngeislun jókst í lok tilraunarinnar og því gæti LED meðferð hafði hagnast á þessuvegnaumtveggjaviknalengravaxtartímabilsmiðaðviðHPSmeðferðina. Með notkun LED ljóss var næstum 45% minni dagleg notkun á kWh, sem leiddi til minni útgjalda fyrir raforku miðað við HPS ljós, en hærri fjárfestingarkostnaður af LED. Þegar LED ljós var notaður, þá jókst framlegð um 1.200 ISK/m2 fyrir Magnum og um 500 ISK/m2 fyrir Sonata yfir einn vaxtarhring. Hærri rafmagnsgjaldskrá breytir framlegð næstum ekkert. Það skiptir nánast ekki máli hvort gróðurhús er staðsett í þéttbýli eða dreifbýli, framlegð er svipuð, en þó aðeins betri í þéttbýli. Möguleikar til að minnka kostnað, aðrir en að lækka rafmagnskostnað eru taldir upp í umræðunum íþessariskýrslu.
Áður en hægt er að ráðleggja að nota LED, er þörf á fleiri vísindarannsóknum með mismunandi hitastillingar til að bæta viðbótarhitun sem varð með HPS ljósunum við LED klefann til að ekki sé seinkun á vexti og uppskeru þar. Að auki þarf að finna lausnir fyrir vel heppnað frjóvgun á þeim tíma þegar ekkert sólarljós kemur inn í gróðurhúsið til að tryggja líka áranguríka uppskeru með LED lýsingu. Þess vegna er ekkimæltmeðþvíaðskiptaHPSlampaútfyrirLEDaðsvostöddu.
Theextremely low naturallight levelis the major limiting factor for winter greenhouse productioninIcelandandothernorthernregions.Therefore,supplementarylightingis essential to maintain year-round production. This could replace imports from lower latitudes during the winter months and make domestic vegetables and fruits even morevaluablefortheconsumermarket.
Árni MagnúsHannessonfromFluðiris thepioneeringrowingstrawberriesinIceland. He has started withthe production inthe year 1985. Eiríkur Ágústssonand Olga Lind GuðmundsdóttirstartedtogrowstrawberriesatSilfurtúnintheyear2002andin2011 more growers joined producing strawberries. 2018 were seven strawberrry growers counted.
The possibilities for strawberry production are based on growing under vegetation coversforthemarketinJune-Augustorcultivatestrawberriesin heated greenhouses with preferably supplementary lighting. The harvest period was so far from May to October and therefore, Icelandic strawberries are not available in winter and spring. However,a demand exists becauserelative cheapstrawberries are importedand the Icelandicproducerscanhardlycompetewiththepriceof importedstrawberries.
Since several years it is tradition to grow strawberries in heated greenhouses in the Netherlands and Belgium (e.g. van Delm et al., 2016). Also, the Norwegians are experimenting with greenhouse cultivation of strawberries during winter (e.g. Verheul et al.,2007).Thequestionis whetherthis canalsobepursuedinIceland. It is difficult to cultivate strawberries on high latitudes like in Iceland, because there are short days and little daylight from middle of September to middle of April and the low naturallight level is the main limiting factor for a production in winter in greenhouses. Therefore, supplemental lighting is necessary to maintain an equal harvest over the year and this could make imports from lower latitudes unnecessary. Vegetables are grown during winter with supplemental lighting and the question is whether it is possible to extend the growing season of strawberries in the same way. Therefore, it should be considered if it is possible to use supplemental lighting when active radiation(PAR)fallsbelowthecriticalvalueinproductionof strawberries.
Strawberryproduction inthegreenhouseis basedonproducingstrawberries attimes where cheap strawberries are not available. "Sonata" and "Elsanta" are the most common strawberry varieties abroad and also in Iceland. These varieties are
junebearers that produce one harvest in June or early spring. Under lighting abroad is also the junebearer “Magnum” grown. This variety is giving bigger berries than the two before mentioned varieties and has been tested in Iceland the first time in the year2017byonegrower.
The positive influence of artificial lighting on plant growth, yield and quality of tomatoes (Demers et al., 1998a), cucumbers (Hao & Papadopoulos, 1999) and sweet pepper (Demers et al., 1998b) has been well studied. It is often assumed that an increment in light intensity results in the same yield increase. Indeed, yield of sweet pepperinthe experimental greenhouseof theAgriculturalUniversityofIceland at Reykir increased with light intensity(Stadler et al., 2010). However, with tomatoes, a higher light intensity resulted not (Stadler, 2012) or in only a slightly higher yield (Stadler, 2013). Van Delm et al. (2016) reported that the total yield of strawberries in Belgium decreased with lower light intensities. In the research greenhouse of the Agricultural University of Iceland were two different light intensities tested and at the beginning of the harvest were strawberries at the higher light intensity (150W/m2) some days earlier ripe than at 100W/m2. The higher light intensity had a positive effectonmarketableyield.Theyieldwasabout15%moreduetoa highernumberof “extra class” strawberries. The unmarketable yield seemed to be lower at the higher light intensity (Stadler, 2016a; Stadler 2016b). However, these results apply to the junebearers Sonata and Elsanta, whereas for Magnum is not yet knowledge available.
Supplemental lighting that is normally used in greenhouses has no or only a small amount of UV-B radiation. High pressure sodium (HPS) lamps are the most commonly used type of light source in greenhouse production due to their appropriate light spectrum for photosynthesis and their high efficiency. The spectral output of HPS lamps is primarily in the region between 550 nm and 650 nm and is deficient in the IV and blue region (Krizek et al., 1998). However, HPS lights suffer fromrestrictedcontrollabilityanddimmingrangelimitations(Pinho etal.,2012).
Light-emitting diodes (LED) have been proposed as a possible light source for plant production systems and have attracted considerable interest in recent years with their advantages of reduced size and minimum heating plus a longer theoretical lifespan as compared to high intensity discharge light sources such as HPS lamps (Bula et al., 1991). These lamps are a radiation source with improved electrical
efficiency (Bula et al., 1991), in addition to the possibilityto control the light spectrum and the light intensity which is a good option to increase the impact on growth and plant development. Several plant species have been successfully cultured under LEDs (e.g. Philips, 2017; Philips, 2015; Tamulaitis et al., 2005; Schuerger et al., 1997; Brown et al., 1995; Hoenecke et al., 1992). However, with HPS was achieved asignificantly higher fresh yield of salad in comparison to LEDs. But, two times more kWh was necessary with only HPS lights in comparision with only LEDs. The only use of HPS lights resulted in the highest yield, while the yield with only LEDs was about¼less(Stadler, 2015).
But, before LEDs are put into practice on a larger scale, more knowledge must be acquired on effects of LED lighting on crops (Dueck et al., 2012). In addition to the yield is also the quality of the harvest important. Research in the Netherlands has shown that with LED lights was it possible to increase the taste (Hanenberg et al., 2016).Experienceof growingstrawberriesunderLEDsinIcelandis notavailableand therefore, the effect of light on yield over the high winter (with low levels of natural light) need to be tested under Icelandic conditons. There is already knowledge available about growing the variety “Sonata” during the winter under HPS lights and therefore,thisvarietywillbecomparedtooneotherpromisingvariety,Magnum.
Incorporating lighting into a production strategy is an economic decision involving added costs versus potential returns. Therefore, the question arises whether these factorsareleadingtoanappropriateyieldof strawberries.
The objective of this study was to test if (1) the light source is affecting growth, yield and quality of different strawberry varieties, if (2) this parameter is converted efficiently into yield, and if (3) the profit margin can be improved by the chose of the light source and variety. This study should enable to strengthen the knowledge on the best method of growing strawberries and give strawberry growers advice how to improvetheirproductionbymodifyingtheefficiencyof strawberryproduction.
A strawberry experiment with two different varieties of junebearers (Fragaria x ananassa) cv. Sonata and cv. Magnum and different light sources (see chapter “3.2 Treatments”) was conducted at the Agricultural University of Iceland at Reykir during winter2017/2018.
Four heavy tray plants of Sonata respectively Magnum were planted on 07.12.2017 in 5l pots filled with moist strawberry substrate in two chambers with different light sources.
The strawberry pots were placed in rows in six 134cm high beds (Fig.1) with 8cm between pots and 93cm between beds. Beds were divided into two parts and the
different varieties put out in a zick zack system. One bed had 16 pots with eight pots from each variety. Six replicates, one replicate in each bed consisting of one pot (4plants for Sonata/Magnum) acted as subplots for measurements. The plant density was 12plants/m2. The temperature was set on 16°C during day and 8°C during night. Ventilation started at 20°C. It was heated up with 1,5-2°C per hour. The aim was to reach 16°C at one hour after day starts. At the end of the day was the temperature dropped without delay. The underheating started heating up two hours beforelights wereturnedonandreached 35°C duringthe day and was turned offonehourbeforenight.
Carbon dioxide was provided (800ppmCO2 (from week three until the end) with no ventilation and 500ppmCO2 with ventilation). A misting system was installed. Humiditywassetto75%tobeabletoreach70%duringthewholeexperiment.
Bumblebees were usedforpollination.Paraatwassprayed four daysafterplanting.It was started three weeks after planting to spray Loker once a week (see details in appendix). Once was sprayed with Prev-Magnum tm (Multi-purpose adjuvant boosted withmagnesiumoxide)andoncewithTopaz ® forthepreventativecontrolofpowdery mildew. Plant protection was managed by beneficial organisms. Aphiscout (mix of parasitic wasps),Thripor-L(Orius laevigatus) wasused(seedetailsinappendix).
StrawberryplantsgotfertilizeraccordingtoTab.1.
Plants wereirrigated through drip irrigation(1tube perbucket). The watering was set up that the plants could root well down, which means no runoff after planting and a low amount of runoff in the first 2-3 weeks. At the growing stage was the irrigation arranged to 10-20% runoff on sunny days and 0-5% on cloudy days with an E.C in the drip of 1,5-1,7. At flowering and carrying green fruits was the runoff supposed to be 25-30% on sunny days and 10-15% on cloudy days with lowering the E.C. from 1,7 to 1,5 one week before harvest. The E.C. of the input and runoff water is supposed to be adjusted that their sum was 3,2-3,3 during growth and flowering and 3,0-3,1 during harvest. 100 ml/drip was irrigated. In general was the rulethat thefirst drip in the morning should not give runoff. The first watering was at 9.00 and the last at 21.00 with E.C. 1,6 and pH 5,8. The irrigation interval was variable in accordance totherunoff.
Strawberries were grown from 07.12.2017-05.04.2018 in two chambers with different lightsources:
1. HPStoplighting(Philipsbulbs,600W)180W/m2,277µmol/m2/s, HPS
2. LEDtoplighting(GreenPowerLED,Philips),279µmol/m2/sµmol, LED Lamps for top lighting were mounted horizontally over the canopy. Directly after planting was the lighting from 07.00-15.00 and increased by one hour per day until 16 hours (07.00-23.00) were reached. Half of the lamps went on at 07.00 and the other half at 07.30. Half of the lamps went off at 23.00 and the other half at 23.30. The lamps were automatically turned off when incoming illuminance was above the desired set-point. The lamps were distributed in the way that strawberries got the most equal light distribution, on average, 277µmol/m2/s in the HPS chamber and 279µmol/m2/s in the LED chamber (Tab.2). In addition, white plastic on the surroundingwallshelpedtoget ahigherlightlevelattheedgesofthegrowingarea.
1 244 290 310 281 274 291 257 280
272 276 291 280 276 295 270 281
282 295 292 290 275 298 267 279
270 274 257 267 274 290 272 280
262 281 276 273 278 292 273 280
273 286 250 270 279 294 266 274 average 267 284 279 277 276 293 268 279
In addition, six flowering lamps (Philips GreenPower, deep red/white/far red) were set up in the LED chamber in the same hight as the LED lights. When 1,5-2 leaves were visible, it was started to turn on the flowering lamps during the time, when the LED lights were turned off. The desired growth was one cm/day. Because this value was not reached, the flowering lamps were turned on for 24 hours. The flowering lamps were turned off when leaves were 18-20cm. However, the growth was then lessthan1,0-1,5cm/dayandclusterswereshort,andtherefore,thefloweringlamps wereturnedonagainuntilthebeginningoftheharvest.
Soil temperature and leaf temperature was measured once a week. The amount of fertilizationwater(inputandrunoff)wasmeasuredeveryday.
To be able to determine plant development, the number of leaves, the number of clusters and the number of open flowers was counted each week. This gave information regardingthe total amount of flowers per plant and the number of flowers percluster.
During the growth period were runners regularly taken away and the number per plant was registered. During the harvest period were berries regularly collected (2 times per week) in the subplots. Total fresh yield, number of fruits, fruit category (extra-class (>25mm), 1.class (18mm) and not marketable fruits (too little fruits (<18 mm), damaged fruits, misshaped fruits, moldy fruits) were determined. At the
end of the harvest period was on each plant the number of immature fruits (green) counted.Themarketableyieldof thewholechamberwasalsomeasured.
In the LED chamber were LED glasses used for picking to be able to distinguish if berries wereripeornot.
The interior quality of the berries was determined. A brix meter (Pocket Refractometer PAL-1, ATAGO, Tokyo, Japan) was used to measure sugar content of the strawberries during the growth period. From the same harvest, the flavour of fresh fruits was examined in a tasting experiment with untrained assessors. Also, subsamplesofthefruitsweredriedat105°Cfor24htomeasuredrymatter yield.
Energy use efficiency (total cumulative yieldin weight per kWh) and costs for lighting per kg yield were calculated for economic evaluation and the profit margin was determined.
SAS Version 9.4 was used for statistical evaluations. The results were subjected to one-way analyses of variance with the significance of the means tested with a Tukey/KramerHSD-testatp≤0,05.
Solar irradiation was allowed to comeinto the greenhouse. Therefore, incoming solar irradiation was affecting plant development and was regularly measured. The natural lightlevelwaslowduringthe wholegrowingperiod.FromDecember tothebeginning of February were less than 1kWh/m2 reached. After that increased the incoming solarirradiationupto5kWh/m2 attheendoftheexperiment(Fig.2).
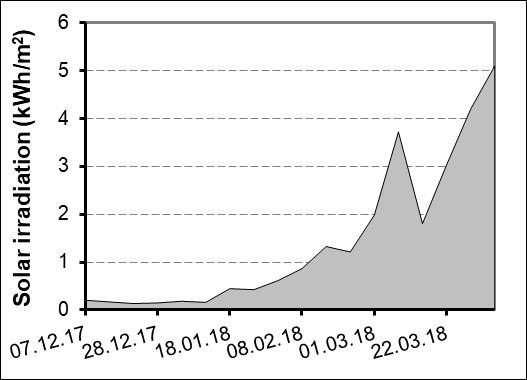
Fig.2: Timecourseofsolarirradiation.
Solar irradiation was measured every day and values for one week were cumulated.
The settings in the chambers were regularly recorded. Table3 shows the weekly average of the CO2 amount and the average air and floor temperature as well as the averagedayandnight temperature.
The mean CO2 amount was in average a bit higher in the LED treatment due to nearly 50% more often open windows inthe HPS chamber. The CO2 amount was in the LED chamber higher in the first three weeks of the growing period, while later in the growing period no differences between light sources were observed when week 8, 15 and 16 were excluded. In week 12 was the CO2 amount higher in the HPS treatment,whileinweek13wasittheotherwayround.
Theairtemperaturewas inaverage 0,4°C higher intheHPSchamber.This was due to a higher day temperature in the HPS chamber because of the HPS lamps generate high radiant heat. This difference between chambers was much smaller duringthenight.
The floor temperature was comparable between light sources during the day. However, during the night was the temperature higher in the HPS chamber than in theLEDchamber.
Tab.3: Chambersettings.
Week CO2 (ppm)
Floorday/night (°C) HPS LED HPS LED HPS LED
1 497 527 13,0(15,9/11,1) 12,5(15,1/10,4) 34,8/23,5 34,9/21,3
2 460 487 16,4(18,0/11,5) 15,2(16,7/11,3) 34,8/28,0 34,9/26,2
433 470 15,0(16,6/10,8) 14,5(16,0/10,4) 34,8/20,9 34,9/17,3
727 723 14,9(16,3/10,5) 14,2(15,4/10,1) 34,8/19,9 34,9/17,2
712 724 16,2(17,3/12,2) 15,5(16,6/11,8) 34,8/21,9 34,9/18,9
728 741 16,0(17,2/11,9) 15,4(16,6/11,3) 34,8/21,8 34,9/18,8
540 527 15,7(16,9/11,3) 15,0(16,1/11,4) 34,8/21,7 34,9/19,2
649 736 15,9(17,2/11,3) 15,5(16,7/11,3) 34,8/21,5 34,9/19,1
696 729 15,9(17,2/11,4) 15,5(16,8/11,3) 34,8/21,5 34,9/19,1
744 757 15,5(16,8/10,8) 15,0(16,3/10,8) 34,8/21,3 34,9/18,5
682 713 16,0(17,3/11,5) 15,6(16,8/11,3) 34,8/21,6 34,9/18,9
717 681 16,5(17,7/12,6) 16,1(17,3/12,2) 34,8/22,7 34,9/19,9
678 735 15,7(17,1/10,6) 15,4(16,7/10,9) 34,8/21,8 34,9/18,9
710 722 15,5(16,9/11,0) 15,2(16,6/10,9) 34,8/21,3 34,9/18,5
578 636 16,6(17,9/12,3) 16,3(17,5/12,0) 34,8/20,5 34,9/18,4
637 16,0(17,3/11,5) 34,9/17,8
645 15,9(17,3/11,2) 35,1/17,7
637 659 15,6(17,1/11,4) 15,2(16,6/11,2) 34,8/22,0 34,9/19,2
Soil temperature was measured weekly at low solar radiation at 10.00 (except on 15.02 was measured at 12.00) and fluctuated between 14-19°C. Soil temperature was most of the time significantly higher in the HPS chamber compared to the LED chamber. In average amounted the differenceabout 1°C.Whilein the LED chamber no differences between varieties were observed, was the temperature in the pots with Magnum tendentially and sometimes during the latter part of the growing period significantlyhigherthanwithSonata(Fig.3).

Letters indicate significant differences during the growing period (HSD, p ≤ 0,05).
Leaf temperature was measured weekly at low solar radiation at 10.00 (except on 15.02 was measured at 12.00). Leaf temperature fluctuated between 12-20°C. Leaf temperature was most of the time higher in the HPS chamber compared to the LED chamber. In average was the leaf temperature nearly 3°C higher in the HPS chamber.Differencesbetweenvarieties werenotobserved(Fig.4).

Letters indicate significant differences during the growing period (HSD, p ≤ 0,05).
The amount of applied water increased with longer growth of the strawberries from about 100ml/plant to about 400ml/plant (Fig.5). The plants in the LED chamber were watered with a lower amount of water than the HPS chamber. Even though, was the growing media more wet in the LED treatment. More water was applied to MagnumcomparedtoSonata.
Fig.5: Dailyappliedwater.
E.C. and pH of irrigation water was fluctuating much (Fig.6). The E.C. of applied water ranged most of the time between 1,2-2,0 and the pH between 4,0-7,0. The E.C.ofrunoff stayedmostofthetimebetween0,8-2,4andthepHbetween5,5-8,5.
At the beginning of the growing period was the irrigation adjusted to no runoff due to the rooting down of the roots. After that was the amount of runoff increased. The amount of runoff from applied irrigation fluctuated very much and varied most of the time between 10-50% runoff. In average had Sonata a higher runoff than Magnum (Fig.7).
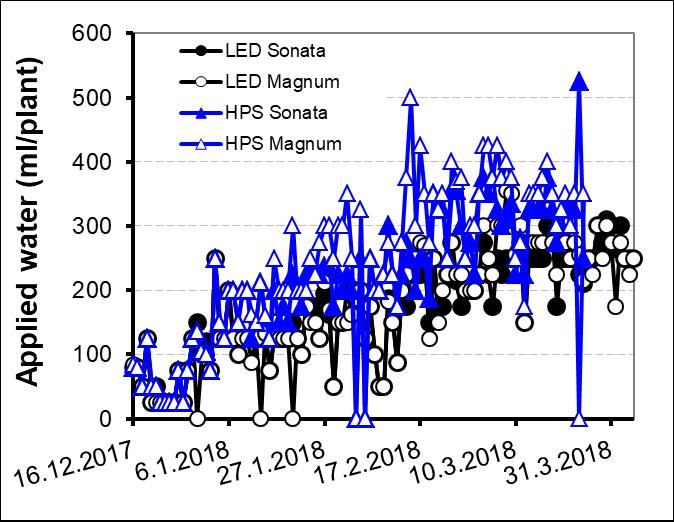
Fig.6: E.C.and pH ofirrigationwater and runoff.
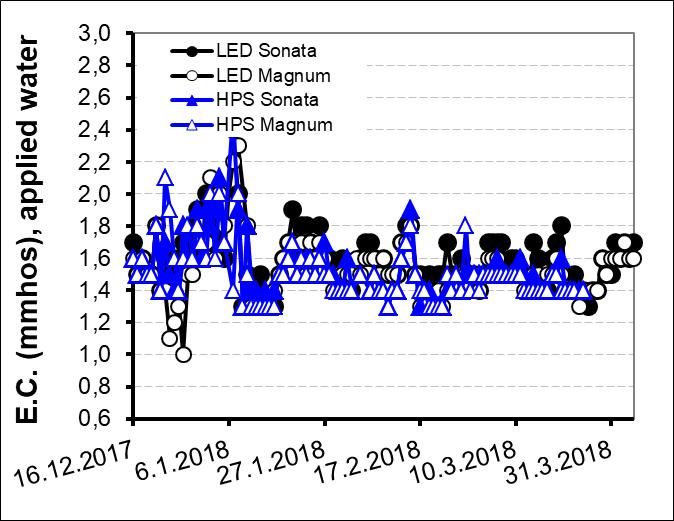
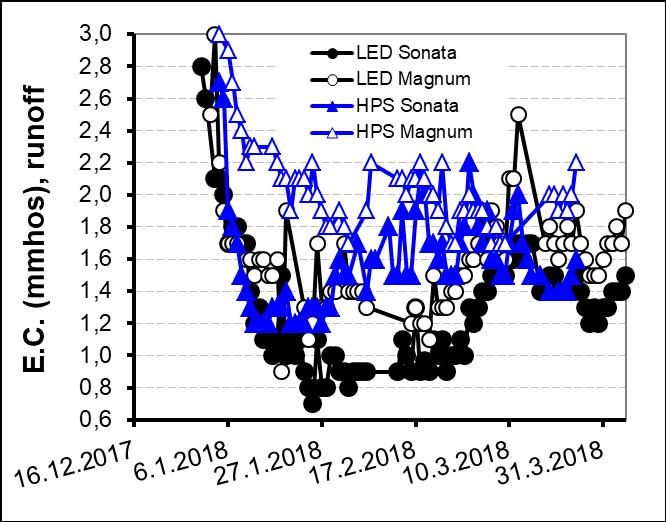
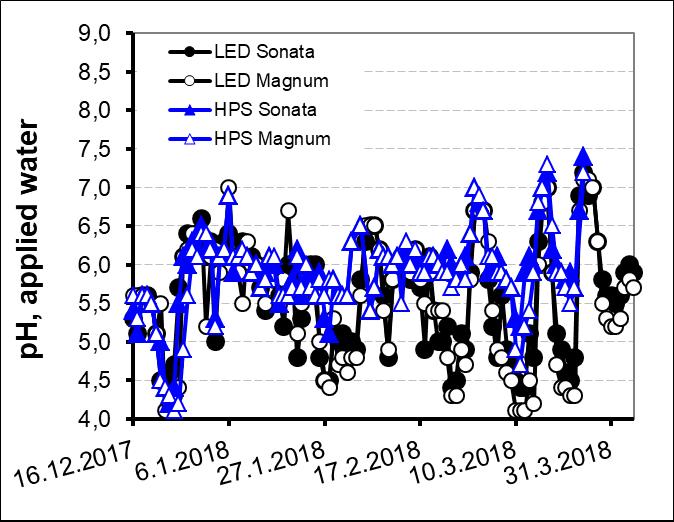
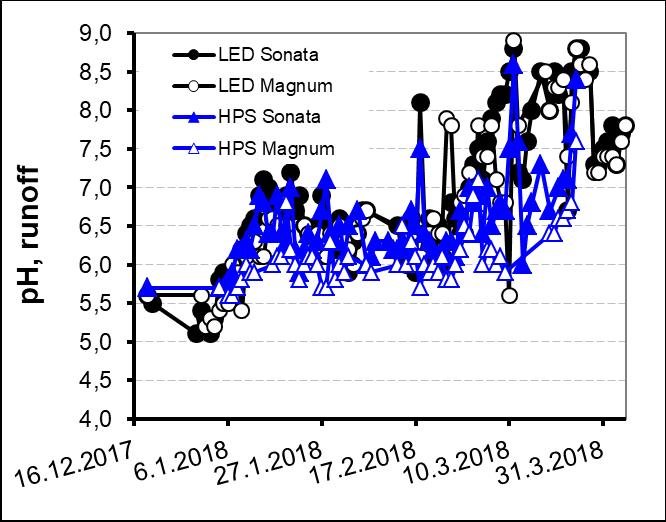
Fig.7: Proportionofamountofrunofffromappliedirrigationwater.
Some strawberry plants of Sonata were infected with phytopthora (Phytopthora cactorum). Infected plants were removed. Symptoms started to appear about one month after planting. However, the amount of Sonata plants with phytopthora was low and amounted 2% in the HPS chamber and 1% in the LED chamber. Magnum wasnotinfectedwithphytopthora.

The number of leaves increased for Sonata from 14 to 26 and for Magnum from 16 to 30 (Fig.8). No significant differences in the number of leaves between light sources andbetween varieties were found. However, the leaves inthe HPS chamber started earlier to grow after planting. In addition, the leaves were also taller in the HPS chamber. Under bothlight sources hadMagnum taller leaves thanSonata(data notshown).
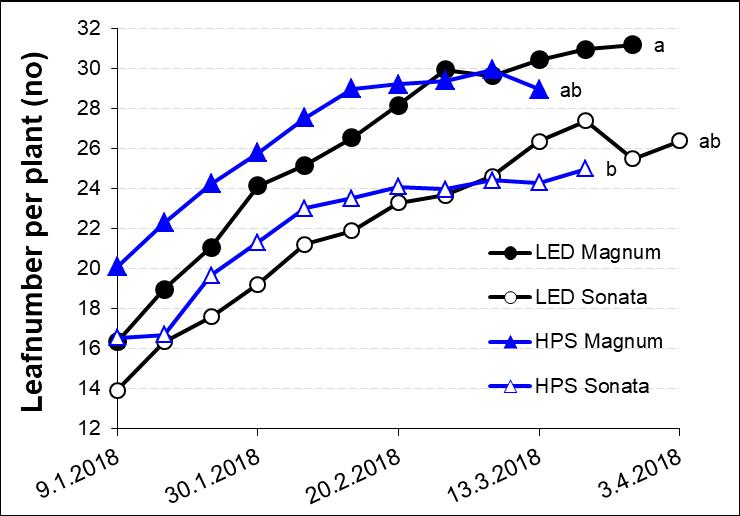
Letters indicate significant differences at the end of the each growing period (HSD, p ≤ 0,05).
Strawberry plants of the variety Magnum had more than six runners per plant while Sonata had about four runners per plant. The light source was not influencing the numberofrunners(Fig.9).
Letters indicate significant differences at the end of each growing period (HSD, p ≤ 0,05).

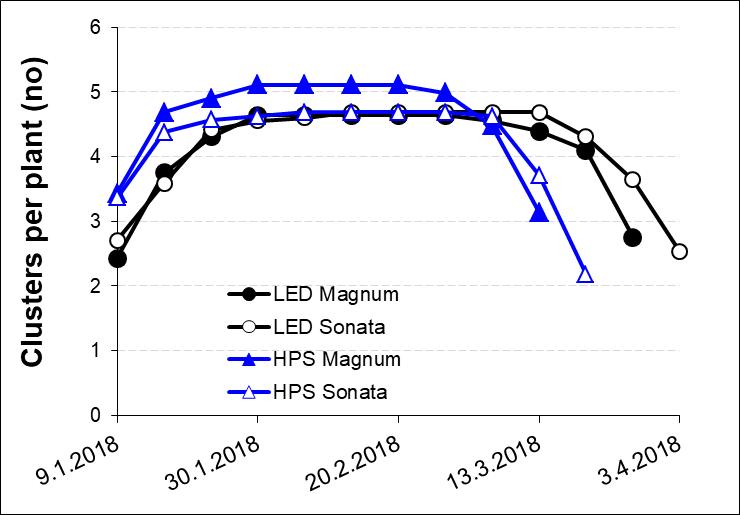
Thenumber of clusterswithflowersand/or fruitsincreaseduntilthebeginning of the harvest and decreased after that when all fruits from a cluster were harvested. The development (increasing and decreasing) of plants in the LED chamber was a bit behindoftheplantsintheHPSchamber(Fig. 10).
Fig.10: Numberofclustersatstrawberryplants.
Thenumber of open flowers/fruits percluster reached about 12forSonata and 9for Magnum (Fig.11). After that, thenumberdecreasednaturallyduetoharvestedfruits. The peak was delayed at the LED treatment compared to the HPS treatment (Fig.11).
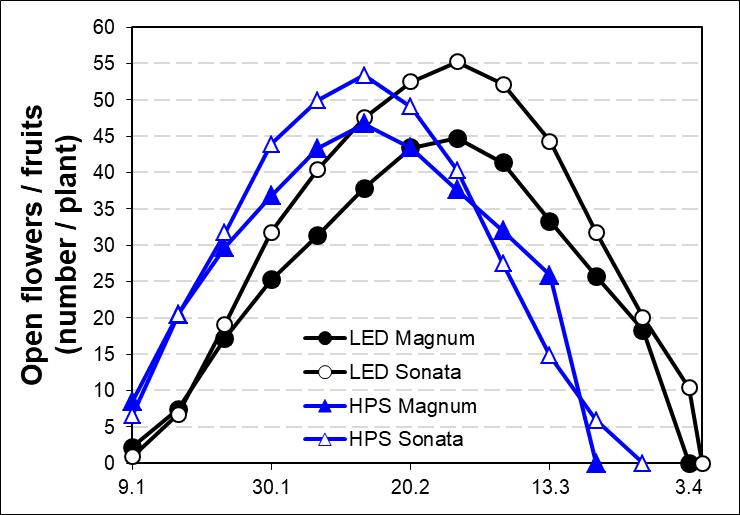
The number of open flowers/fruits of the Sonata plant reached about 55, while the Magnum plant reached about 45 before harvest started (Fig. 12). Thereafter, this number decreased naturally due to harvested fruits. The open flowers appeared earlier in the HPS chamber than in the LED chamber, where the development was 1,5-2 weeks behind plants from the HPS chamber. However, the number of the flowers/fruits was not different between chambers, except the before mentioned delayintheLEDchamber(Fig.12).
However, the total number of flowers of Magnum consisted of a high amount of unpollinated flowers and later rejected flowers, 15% under LEDs and 27% under HPS lights (Fig.13). This was not observed for Sonata, where the percentage of unpollinatedflowerswas1%.

Fig.12: Openflowers/fruitsperplant.
Fig.13: Numberoftotalflowersandunpollinatedflowers.
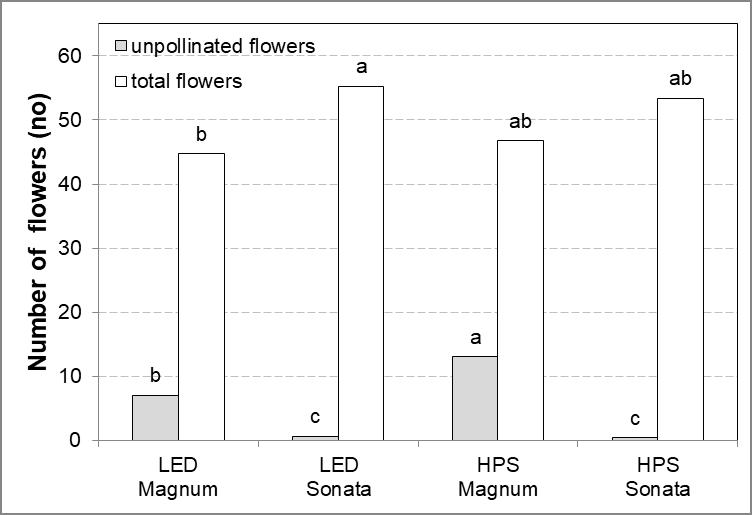
Letters indicate significant differences at the end of each growing period (HSD, p ≤ 0,05).
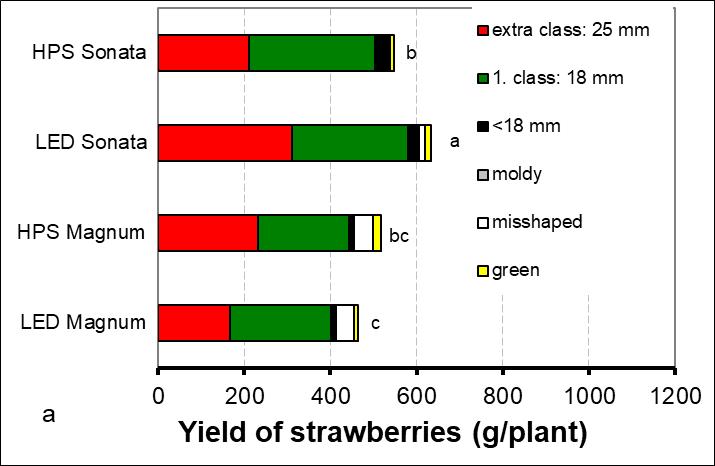
The yield of strawberries included all harvested red fruits during the growth period. The fruits were classified in extra-class (>25 mm), 1.class (18mm) and not marketable fruits (too little fruits (<18 mm), misshaped fruits, moldy fruits and green fruitsattheendoftheharvestperiod).
Cumulativetotal yield of strawberries ranged between 0,46-0,65g/plant (Fig.14). For the experimental plants was a significantly higher yield of Sonata measured under LED lights, whereas for Magnum was the yield tendentially higher under HPS lights (Fig.14a). However, this difference was not observed for the plants, where only the yield was measured(Fig.14b). There seem to be a small advantage in the total yield forSonatacomparedtoMagnum.
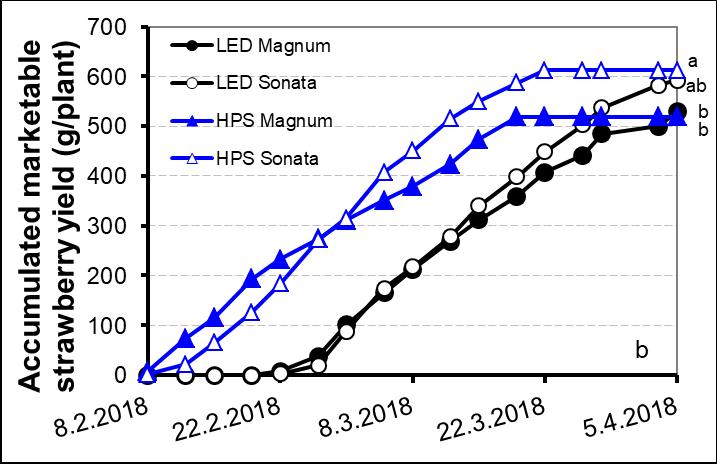
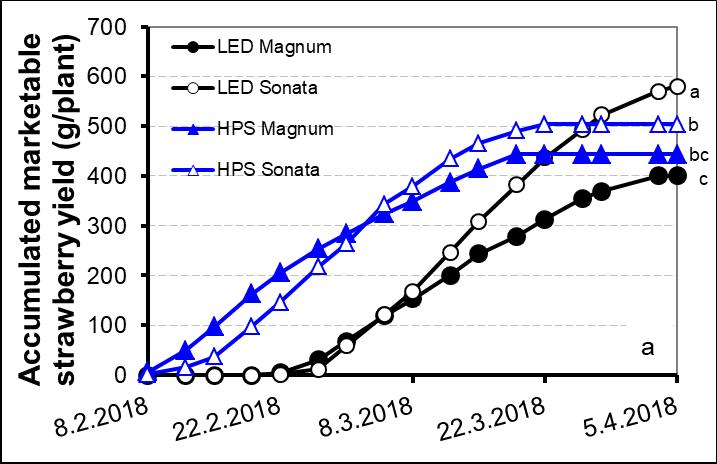
At the end of the harvest period amounted yield of strawberries 0,40-0,61g/plant (Fig.15a, Fig.15b). The light source had no influence on marketable yield of the plants where only the yield was measured (Fig.15b). However, the marketable yield of the measurement plants was for Sonata significantly higher under LEDs, whereas for Magnum was no significant difference regarding light sources observed (Fig.15a). But, it took two more weeks to get ripe fruits in the LED chamber compared to the HPS chamber. Also, the harvest in the HPS treatment ended two weeksbeforetheLEDtreatment.
Regarding the variety, was the marketable yield of Sonata (580/590 g/plant under LED, 540/610 g/plant under HPS) tendentially respectively significantly higher than the marketable yield of Magnum (400/530 g/plant under LED, 440/520 g/plant under HPS). The marketable yield of Magnum was 69%(LED)/88% (HPS) (Fig.15a) and 89%(LED)/85% (HPS) (Fig.15b) of the marketable yield of Sonata.
Magnum was about half a week earlier ripe than Sonata. Differences between varieties developed at the middle of the harvest period with an advantage of Sonata. The last berries of Magnum were harvested half a week earlier than the berries of Sonata.
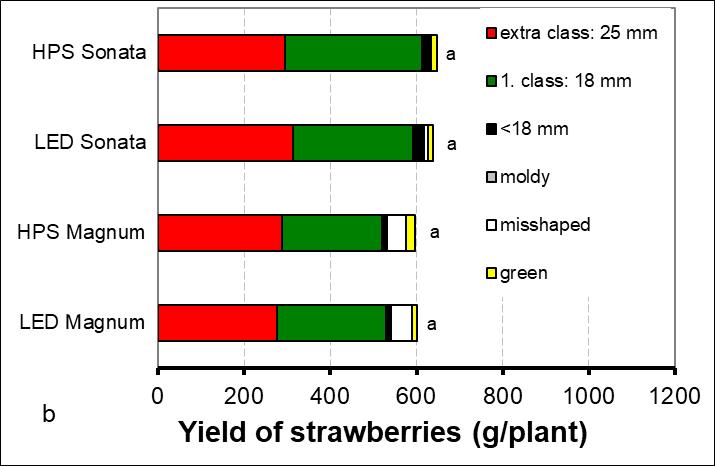
“a” is theyieldof themeasurement plants, “b” theyieldof theplants,where onlytheyieldwasmeasured.
Letters indicate significant differences at the end of the experiment (HSD, p ≤ 0,05).
“a” is theyieldof themeasurement plants, “b” theyieldof theplants,where onlytheyieldwasmeasured.
Letters indicate significant differences at the end of the experiment (HSD, p ≤ 0,05).
Also, themarketable yield of the wholechamberwas measured. A higher marketable yield was reached with Sonata (LED: 570g/plant, HPS: 550g/plant) compared to Magnum (LED: 460g/plant, HPS: 510g/plant) (Fig.16). Regarding light sources, for Magnum was an advantage of the HPS treatment compared to the LED treatment reached, whileforSonatawerenodifferencesbetweenlightsourcescalculated.
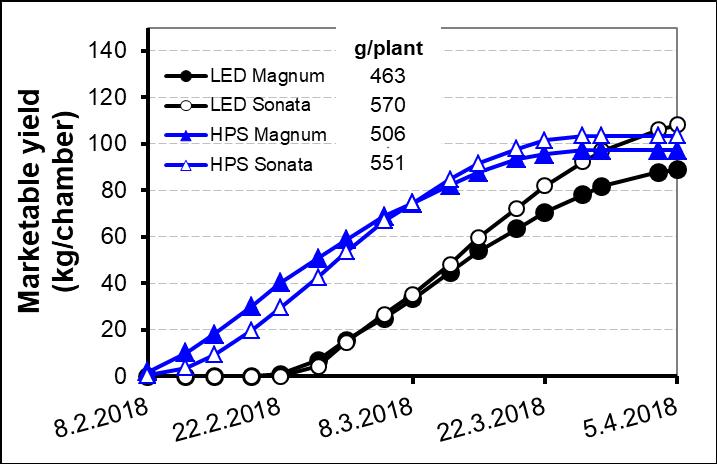
Fig.16: Time course of accumulated marketable yield of strawberries for the wholechamber.
Fruits in the HPS chamber started earlier to ripe, resulting in a higher first yield, whereas later the marketable yield increase decreased. In the LED treatment gave the plantslaterthan theHPS treatment marketable ripeberries. Themarketable yield oneachharvestdaywasnearlyalways higherforSonata(Fig.17).

“a”istheyieldof themeasurementplants,“b”theyieldoftheplants, where onlytheyieldwasmeasured.
There were no differences in the number of extra class fruits, neither between light sourcesnorbetweenvarieties whenthesignificant highernumberof extraclassfruits

with the variety Sonata under LED lights compared to HPS lights and the significant higher number of extra class fruits of Sonata compared to Magnum under LED lights was excluded (Tab.4). For “class I + II” were no significant differences between light sources counted. In contrast, Sonata had a significant (under HPS lights) / respectively tendentially (under LED lights) higher number of first and second class fruits. However, when the sum of the marketable fuits was observed, was mostly a significant higher number of fruits for Sonata examined, whereas no differences betweenlightsourceswerefound.
Numberofmarketablefruits extraclass classI+II total(extraclass+classI+II) (no/plant) (no/plant) (no/plant)
HPSSonata 10 b 32a 42a
LEDSonata 14a 28ab 43a
HPSMagnum 11ab 22 c 33 b
LEDMagnum 8 b 24 bc 33 b
HPSSonata * 15a 33a 48a
LEDSonata * 14a 29ab 44ab
HPSMagnum * 14a 24 b 38 b
LEDMagnum * 13a 25 b 39 b
*fortheplants, whereonlytheyieldwasmeasured Letters indicate significant differences (HSD, p ≤ 0,05).
Average fruit size of marketable fruits decreased from 15-35g to around 10g during the harvest period (Fig.18a, 18b). No significant differences between light sources and between varieties were observed in the average weight of the marketable fruits. However, Sonata had a tendentially higher average weight of 1g under LED lights (Fig.18a, 18b), whereas this effect was not observed with Magnum (Fig.18b), respectivelywas it the other wayround fortheexperimental plants (Fig.18a). But, as statedbefore,werethesedifferencesnotstatisticallysignificant.

“a” is the average weight of the measurement plants, “b” the yield of the plants,whereonlytheyieldwasmeasured.
To observe the success of flowering until harvest, flowers were marked and followed from pollination until harvest. Flowers were within 1-2 days pollinated (data not

shown). Under HPS lights needed fruits of Sonata and Magnum fewer days to ripe than under LED lights. LEDs increased the number of days to get ripe fruits by five days. Number of days from pollination to harvest of Sonata was 33-46 days (average: 41days) under HPS lights and 41-56 (average: 47days) under LED lights and for Magnum 31-49 (average: 40days) under HPS lights and 39-55 (average: 45days) under LED lights (Fig.19). The variety seems to have no influence on the number of days. No relationship was found between the number of days from pollinationtoharvestandtheweightofthefruit.

Fig.19: Number of days from pollination to harvest and weight of the harvestedfruit.
In the middle of the harvest of Sonata were most ripe fruits per week counted compared to the beginning (first two weeks) and the end of the harvest period (last two weeks). Around 10fruits were weekly harvested when harvest reached its maximum (Fig.20a). In contrast, for Magnum was the harvest more even during the harvestperiodandweeklywerearoundsixfruitsharvested(Fig.20b).
Fig.20: Development of open flowers / fruits, harvested fruits and their sum duringthegrowthofthestrawberries.

Naturally, with the beginning of the harvest decreased the number of open flowers and fruits. The number of “harvested and open flowers/fruits” is the sum of the

harvested fruits and the number of open flowers/fruits that was registered at weekly measurements.Thisnumberwasabout 50-60flowers/fruitsforbothvarieties.
Marketableyieldwasabout90%(Tab.5).Sonatahadahigheramountofmarketable fruits than Magnum. There seem to be no difference between light sources in the proportionofmarketableandunmarketableyield.Sonataseemtohaveasignificantly respectivelya tendentially higher proportion of toolittlefruits. In contrast, significantly moremisshapedfruitswerecountedforMagnum.
Marketableyield(%) Unmarketableyield(%) extraclass >25mm 1.class >18mm toolittle weight moldy misshaped green
HPSSonata 38a 54a 5a 0a 1b 2a
LEDSonata 49a 43b 4ab 0a 2b 2a
HPSMagnum 44a 41b 2c 0a 9a 3a LEDMagnum 36a 50ab 3bc 0a 9a 2a
HPSSonata * 46a 49a 3ab 0a 1b 2a
LEDSonata * 49a 44ab 4a 0a 1b 2a HPSMagnum * 48a 39a 2b 0a 7a 3a LEDMagnum * 46a 42ab 2b 0a 8a 2a *fortheplants, whereonlytheyieldwasmeasured
Letters indicate significant differences at the end of the experiment (HSD, p ≤ 0,05).
Sugar content of strawberries was measured at three times during the harvest period. Due to differences in the ripening, different sample dates between treatments hadtobetaken. Magnum had withvalues of10-11°BRIXahighersugarcontent than Sonata with values of 8-9°BRIX. There were no differences between light sources measured. It seems that the sugar content increased at the end of the harvestperiod (Fig.21).
Fig.21: Sugarcontentofstrawberries. Letters indicate significant differences (HSD, p ≤ 0,05).
The taste of strawberries, subdivided into sweetness, flavour, juiciness and firmness was tested by untrained assessors on 02.03.2018. The rating within the same sample was varying very much and therefore, same treatments resulted in a high standard deviation. It seems that the light source did not influence the sweetness, flavour and juiciness of strawberries, while the firmness seems to be higher under
LED lights. It seems that Sonata was evaluated with more juiciness while Magnum wasevaluatedwithmorefirmness(Fig.22).

Fig.22: Sweetness,flavour,juicinessandfirmnessofstrawberries.
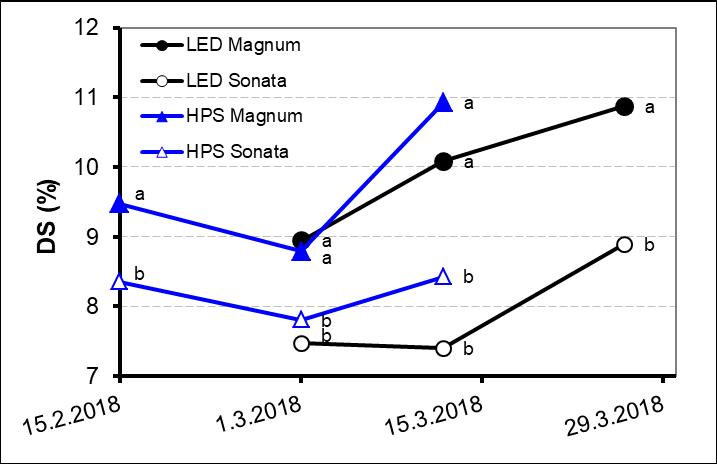
Dry substance (DS) of strawberries was measured on the same dates as the sugar content. Magnum had a significantly higher dry substance than Sonata. Between the light sources were no differences found. It seems that the dry substance increased during the harvest period from about 8 to 9% for Sonata and from 9 to 11% for Magnum(Fig.23).
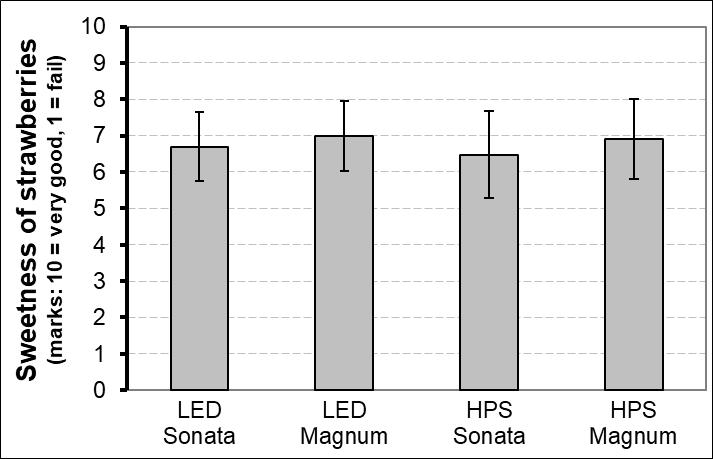
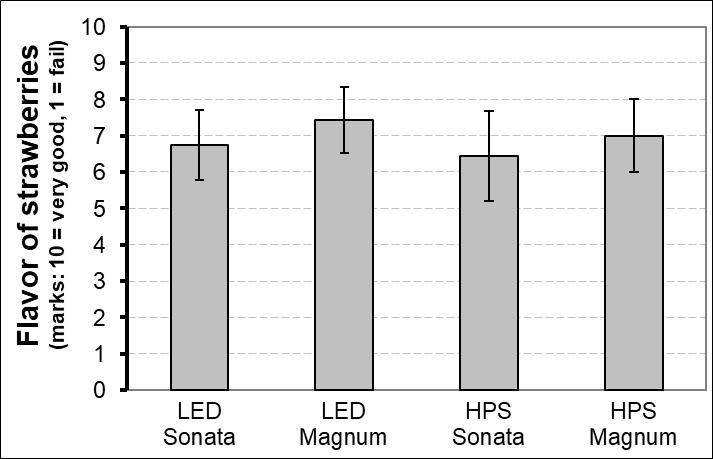
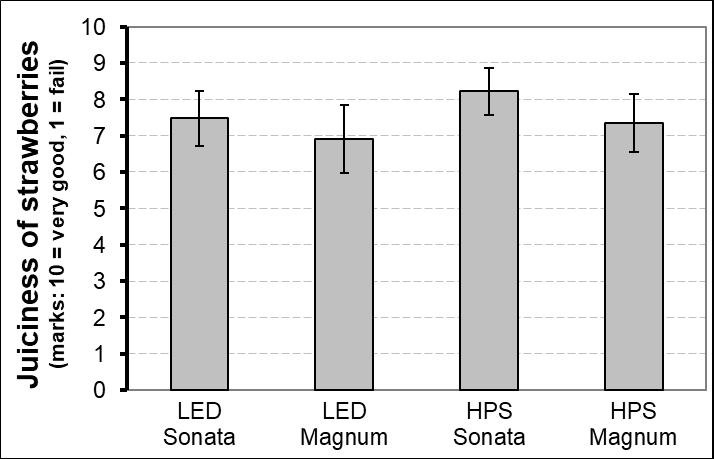
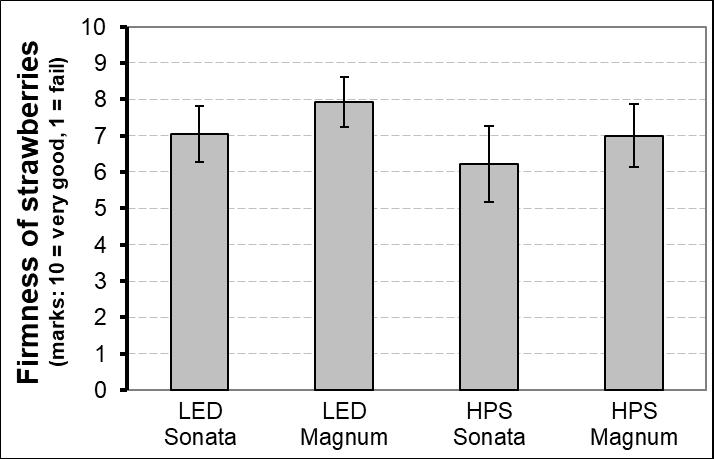
Fig.23: Drysubstanceofstrawberries.
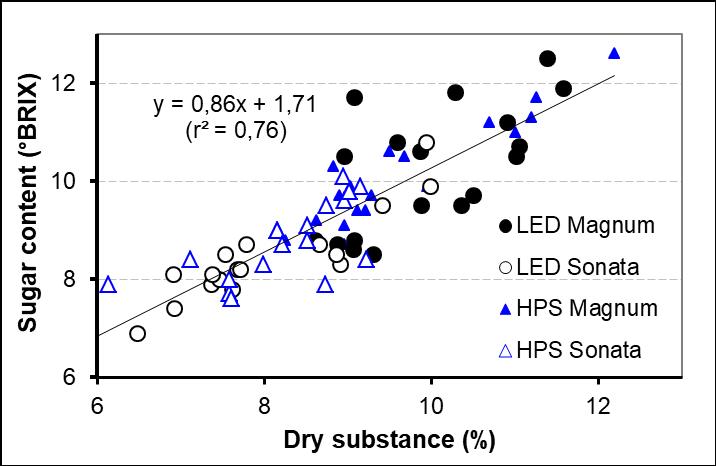
There was arelationshipbetweendry substance andsugar content of fruits (Fig.24).
Fig.24: Relationshipbetweendrysubstanceandsugarcontentoffruits.
Ahigherdrysubstancewasinvolvedwithahighersugarcontent. Sonatahadalower drysubstanceandalowersugarcontentthanMagnum.
Thenumber of lighting hoursis contributingto high annualcostsand needstherefore special consideration to consider decreasing lighting costs per kg marketable yield. The total hours of lighting during the growth period of strawberries were both simulatedandmeasuredwithdataloggers.
The HPS chamber had a daily usage of 189kWh (Fig.25), while the LED chamber hadwith106kWhnearly45%lessthantheHPSchamber.

The simulated value was calculated according to the lighting hours written down. However, there it was not adjusted for automatic turn off, when incoming solar radiation was above a set-point (Tab.6). Therefore, the simulated value was higher.
The measured lighting hours were higher for the LED chamber, because the harvest wasfinishedtwoweekslaterthantheHPSchamber.
Forcalculation of thepower, different electric consumptions were made, becausethe actual consumption is higher than the nominal value of the bulb: one was based on the power of thelamps (nominalWatts, 0% more power consumption), one with 6% more power consumption and one for 10% more power consumption. The power washigherforthemeasuredvaluesthanforthesimulatedones.
Treatment Hours Power Energy Energy/m2 h W kWh kWh/m2
Measuredvalues 1.512 259 19.601 392
Simulatedvalues
0%morepowerconsumption(nominal) 1.673 180 15.058 301
6%morepowerconsumption 1.673 191 15.962 319
10%morepowerconsumption 1.673 198 16.564 331
LEDSonata
Measuredvalues 1.638 136 11.170 223
Simulatedvalues
0%morepowerconsumption(nominal) 1.960 117 11.464 229
6%morepowerconsumption 1.960 124 12.152 243
10%morepowerconsumption 1.960 129 12.611 252
HPSMagnum
Measuredvalues 1.465 259 18.993 380
Simulatedvalues
0%morepowerconsumption(nominal) 1.623 180 14.609 292
6%morepowerconsumption 1.623 191 15.485 310
10%morepowerconsumption 1.623 198 16.070 321
LEDMagnum
Measuredvalues 1.613 136 11.002 220
Simulatedvalues
0%morepowerconsumption(nominal) 1.932 117 11.302 226
6%morepowerconsumption 1.932 124 11.980 240
10%morepowerconsumption 1.932 129 12.432 249
Sincethe applicationofthe electricity law 65/2003 in 2005, the cost for electricity has been split between the monopolist access to utilities, transmission and distribution and the competitive part, the electricity itself. Most growers are, due to their location, mandatory customers of RARIK, the distribution system operator (DSO) for most of IcelandexceptintheSouthwestandWestfjords(Eggertsson,2009).
a) energytariffs,forsmallercustomers,thatonlypayfixedpriceperkWh,
b) “time dependent” tariffs (tímaháður taxti, Orkutaxti TT000) with high prices during the day (09.00-20.00) at working days (Monday to Friday) but much lowerduringthenight andweekendsandsummer,and
c) demand based tariffs (afltaxti AT000), for larger users, who pay according to themaximumpowerdemand.
In the report, only afltaxti is used as the two other types of tariffs are not economic. Since2009,RARIKhas offered specialhigh voltagetariffs(“VA410”and “VA430”)for large users, that must either be located close to substation of the transmission systemoperator(TSO)orabletopayconsiderableupfrontfeefortheconnection.
Costs for distribution are divided into an annual fee and costs for the consumption based on used energy (kWh) and maximum power demand (kW) respectively the costsatspecialtimes ofusage.Theannualfeeisprettylowfor“VA210”and“VA230” when subdivided to the growing area and is therefore not included into the calculation. However, the annual fee for “VA410” and “VA430” is much higher. Growers in an urban area in “RARIK areas” can choose between different tariffs. In the report only the possibly most used tariffs “VA210” and “VA410” in urban areas and“VA230”and“VA430”inruralareasareconsidered.
The government subsidises the distribution cost of growers that comply to certain criteria’s. Currently 64,8% (before 87%) and 69,2% (before 92%) of variable cost of distributionforurban andrural areas respectively. This amount canbe expected to changeinthefuture.
Based on this percentage of subsidy and the lighting hours (Tab.6), for the cabinets the energy costs per m2 during the time of the experiment for the growers were calculated(Tab.7).
The energy costs per kWh are for distribution after subsides 1,74-2,03ISK/kWh for „VA210“ and 1,50-1,79 for „VA230“, 2,95-3,33ISK/kWh for „VA410“ and 2,10-2,32ISK/kWh for „VA430“. The energy costs for sale are for „Afltaxti“ 6,01-6,74ISK/kWhandfor„Orkutaxti“6,01-8,34ISK/kWh.
Cost of electricity was lower for the calculated values (Tab.7). In general, tariffs for large users rendered lower cost. Costs of electricity for the LED treatment were slightly lower than for the HPS chamber, however, differences between tariffs were bigger.
Tab.7a: Costs for consumption of energy for distribution and sale of energy forlightingwithHPSlights.
RARIKUrban
VA210 2,00 1,76 2,03
VA410
1,53
RARIKRural
VA230
VA430
Afltaxti Orkutaxti
Comments: The first number for the calculated value is with 0 % more power consumption, the second value with 6 % more power consumption and the last value with 10 % more power consumption.
Prices are from January2018.
Tab.7b: Costs for consumption of energy for distribution and sale of energy forlightingwithLEDs.
ment
64,8%subsidyfromthestate VA210
RARIKUrban
1,91 1,74 1,93 1,75
VA410 1,67 1,50 1,69 1,51
RARIKRural
69,2%subsidyfromthestate VA230
2,95 3,19 2,97
VA430
2,10 2,26 2,11
Afltaxti
Comments: The first number for the calculated value is with 0 % more power consumption, the second value with 6 % more power consumption and the last value with 10 % more power consumption.
Prices are from January2018.
Costs of electricity in relation to yield for wintergrown strawberries were calculated (Tab.8). While for the distribution several tariffs were possible, for the sale only the cheapest tariff was considered. The yield of the plants, where only the yield (and no other measurements were done) was used for the calculation, because it seems that the yield was decreased when plants and clusters were touched very often due to measurements.
The costs of electricity per kg yield decreased by nearly 45% (Sonata: 43%, Magnum: 44%) when LEDs were used instead of HPS lights. The selection of the varietydidnotinfluencethecostsof electricity(Tab.8).
Tab.8: Variablecostsofelectricityinrelationtoyield.
Variablecostsofelectricityperkgyield ISK/kg
HPSSonata LEDSonata HPSMagnum LEDMagnum Yieldkg/m2
VA210 3.389 2.360 2.502 2.596 1.864 1.775 1.882 1.953 3.332 2.318 2.457 2.550 1.848 1.760 1.866 1.936
VA410 3.295 2.289 2.426 2.517 1.810 1.721 1.824 1.893 3.241 2.248 2.383 2.473 1.795 1.706 1.809 1.877
VA230 3.894 2.728 2.892 3.001 2.146 2.054 2.177 2.259 3.825 2.677 2.838 2.945 2.127 2.035 2.157 2.239
VA430 3.517 2.468 2.616 2.714 1.939 1.858 1.970 2.044 3.454 2.421 2.566 2.663 1.922 1.841 1.952 2.025
The profit margin is a parameter for the economy of growing a crop. It is calculated by substracting the variable costs from the revenues. The revenues itself, is the product of the price of the sale of the berries and kg yield. For each kg of strawberries, growers are getting about 2.600 ISK from Sölufélag garðyrkjumanna (SfG). Therefore, the revenues increased with more yield (Fig.26). With the choose of the variety Sonata increased the revenue slightly compared to Magnum. The light sourcehadnoinfluenceontherevenue.
When considering the results of previous chapter, one must keep in mind that there are other cost drivers in growing strawberries than electricity alone (Tab.7). Among others, this are e.g. thecosts for the plant itself (≈1.200ISK/m2),soil (≈300ISK/m2), gutters andothermaterial(≈50ISK/m2),costsforplant protection(≈ 300ISK/m2)and beneficial organism (≈ 250ISK/m2), plant nutrition (≈ 100ISK/m2), CO2 transport (≈150ISK/m2), liquid CO2 (≈1.000ISK/m2), the rent of the tank (≈150ISK/m2), the rent of the green box (≈150ISK/m2), material for packing (≈350ISK/m2) and transportcostsfromSfG(≈100ISK/m2)(Fig.27).
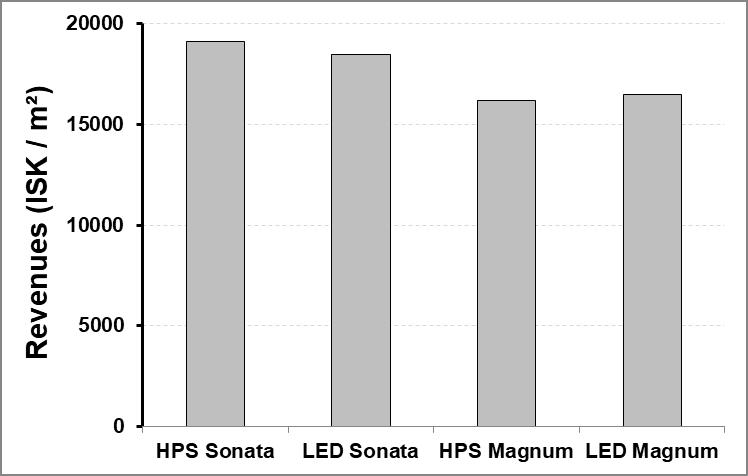
Fig.27: Variableandfixedcosts(withoutlightingandlabourcosts).
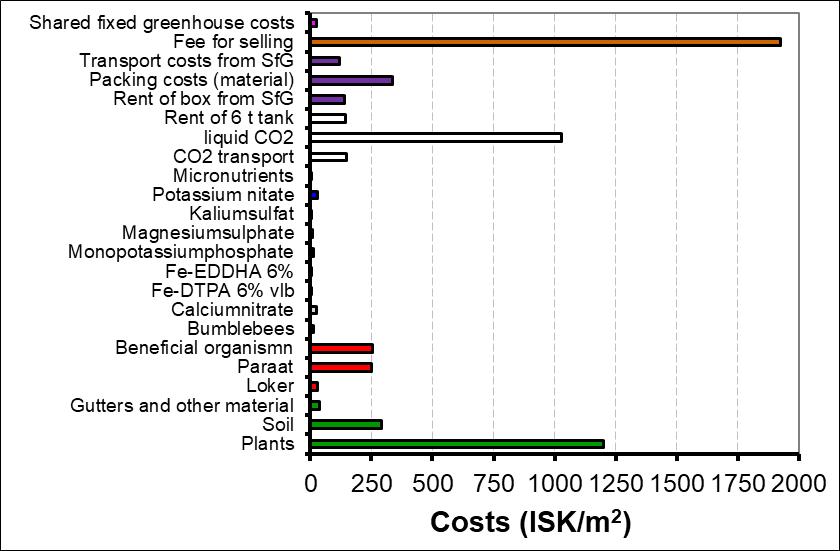
Fig.28: Divisionofvariableandfixedcosts.
However,inFig. 27fourofthebiggestcostdriversarenot includedandthesearethe investment in lamps and bulbs, electricity, labour costs and the fee for SfG for selling the strawberries. These costs are also included in Fig.28 and it is obvious, that especially the fee for selling the strawberries, the electricity as well as the labour costs are contributing much to the variable and fixed costs beside the costs for
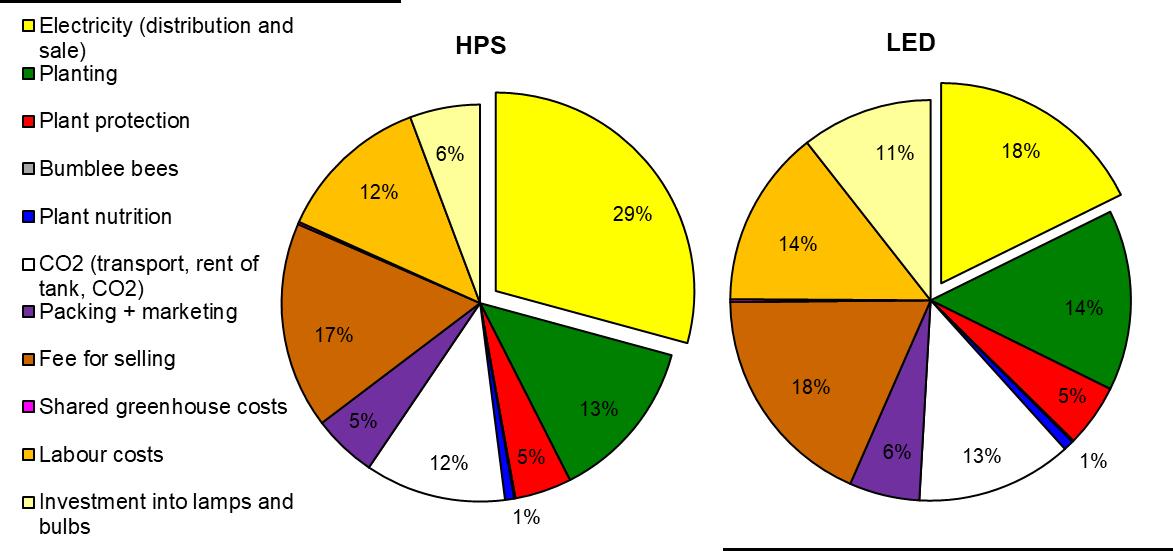
planting and CO2 costs. The proportion of the variable and fixed costs is mainly the same for the HPS treatment and the LED treatment, except that for the LED treatment is the proportion of electricity about 10% lower, whereas the proportion of the investment into lamps and bulbs is about 5% higher compared to the proportion of theHPSchamber.
Adetailedcompositionof thevariablecosts ateachtreatmentisshowninTab.9.
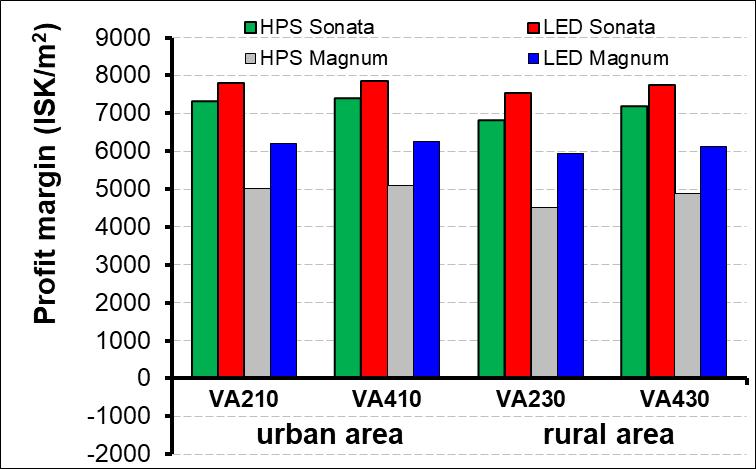
The profit margin was dependent on the treatment and was between 4.500-8.000 ISK/m2 (Fig.29). The profit margin was higher for Sonata (7.000-9.000 ISK/m2) than for Magnum (4.500-6.500 ISK/m2). The profit margin was higher when LEDs were used instead of HPS lights. That means the choose of LEDs instead of HPS lights roose the profit margin by 500 ISK/m2 for Sonata and by 1.200 ISK/m2 for Magnum. However, it has to be taken into account that the profit margin depends much on the actual price of the LEDs. Also, the choose of Sonata instead of Magnum increased the profit margin by 2.300 ISK/m2 when HPS lights were used and by 1.600 ISK/m2 whenLEDlights wereused.
Fig.29: Profitmargininrelationtotariffandtreatment.
Profit margin of strawberries at different light treatments (urban
Monopotassiumphosphate
pricewinter 2017/2018: 2.600 ISK/kg
assumption: urban area, tariff “VA210”, no annual fee(according to datalogger values)
100 ISK / strawberryplant
2.186 ISK / bag Klasmann soil 200 l TS-4
54 ISK / pot; assumption: 10 years life time, 3 circles / year
4.250 ISK / bund of tape; assumption: 10 years life time, 3 circles / year
660 ISK / m gutter; assumption: 10 years life time, 3 circles / year
25.500 ISK / 5 lLoker; assumption: sprayingonce per week (~8 times per growing season)
29.950 ISK / bund Paraat; assumption: spraying once per growing season, 400 ml / pot
beneficials: 4.615 ISK/ unit Orius laevigatus (predatorybug), once 2.995 ISK/ unit mix of the parasitic wasp species Aphidius colemani, Aphidius ervi, Aphelinus abdominalis, Praon volucre and Ephedrus cerasicola, once
4.622 ISK / unit bumblebees
2.750 ISK / 25 kg Calcium nitrate
3.550 ISK / 25 kg Potassium sulphate
17.050 ISK / 25 kg Fe-DTPA 6% vlb
14.770 ISK / 5 kg Fe-EDDHA 6%
7.050 ISK / 25 kg Monopotassium phosphate
1.700 ISK / 25 kg Magnesium sulfate
4.175 ISK / 25 kg Potassium nitrate
33.900 ISK / 5 kg micronutrients
CO2 transport from Rvk to Hveragerði / Flúðir: 8,0 ISK/kg CO2
liquid CO2: 45,0 ISK/kg CO2
rent for 6 t tank: 72.000 ISK/month, assumption: rent in relation to 1.000 m2 lightened area
90 ISK / box
packing costs (material): costs for packing of strawberries (0,20 kg): box: 4 ISK / 0,20 kg, lid: 4 ISK/ 0,20 kg, label: 2 ISK / 0,20 kg
fee for SfG for selling the strawberries: 57 ISK / 0,20 kg
transport costs from SfG: 2.652 ISK / board
94 ISK/m2/year for common electricity, real propertyandmaintenance
HPS lights: 30.000 ISK/lamp, life time: 8 years
LED lights: 42.000 ISK/lamp, life time: 11 years
HPS bulbs: 4.000 ISK/bulb, life time: 2 years
floweringlamps: 3.950ISK/lamp, life time: 8 years
A larger use (higher tariff: “VA 410” compared to “VA 210”, “VA 430” compared to “VA 230”), did not influence the profit margin. Also, it did nearly not matter if the greenhouse is situated in an urban or rural area, however, there was a small advantagefortheurbanarea(Fig.29).
Strawberry plants need to have strong vegetative growth in order to flower and to produce berries. In winter production is flower induction highly dependent on the supplemental light. In this experiment, the effect of two light sources was tested on two varieties of strawberries. The number of flowers of Sonata and Magnum was independent of the light source. However, for Magnum was the number of unpollinated flowers higher under HPS lights compared to LEDs, while for Sonata were no differences found between light sources. Strawberryplants under LED lights showed a delayed growth that was 1,5-2 weeks behind the development of strawberriestreatedwithHPSlights.Hence,startedtheharvest underHPSlightstwo weeks earlier. Consequently, the harvest under HPS lights was finished two weeks earlierthantheharvestunderLEDlights, whereittook5-6dayslongerfortheberries to ripe. Thus, the accumulated yield of Magnum and Sonata was not influenced by the light source, reflecting alsono differences inthe numberof fruits andthe average weight between light sources. It has to betaken into account,that the growing period of strawberries under LED lights was longer than the one of strawberries under HPS lights. Due to increasing solar irradiation with longer growing period was the LED treatment taking advantage of more solar light. Therefore, the yield with LEDs supported with natural solar irradiation might have been lower when the natural solar irradiation might have been nearly zero as with the HPS treatment all the time. Also, Lu et al. (2012) reported a positive affect of natural light on tomato fresh and dry weight. Stadler (2010) studied the effect of light intensity at low solar irradiation: A high light intensity significantly increased marketable yield of sweet pepper during periodsof lownaturallightlevel,thegaindecreasedwithincreasingnaturallightlevel andthe yield was at high natural light level not different within light intensities. This is supporting that the LED treatment might had a yield advantage at the latter part of theharvestperiod.
But, not only the solar irradiation, also the temperature might have influenced the growth and yield of the strawberries. Despite of the fact that the temperature settings were put the same between treatments, was the recorded air temperature 0,4°C higher, the soil temperature 1°C higher and the leaf temperature nearly 3°C higher in the HPS chamber compared to the LED chamber. This higher temperature might
be the reason for the faster development of the plants in the HPS chamber and the earlier ripening, but the influence of each factor is unknown. Indeed, van Delm et al. (2016)concludedthattheregulationof temperatureandlightingstrategyseemstobe importantforplantbalancebetweenearlinessandtotalyield.
Särkka et al. (2017) reported that cucumber leaf temperature was lower (4-5°C at the centre parts of leaf blades, 3-4°C at the top of the canopy) with only LED lights (top and interlighting) and there was a lower temperature difference between night and day compared to the other light treatments (HPS top and HPS interlights, HPS top and LED interlights). This resulted in reduced leaf appearance rate, flower initiation rate increased fruits abortion rate, whereas stem elongation and leaf expansion was increased compared to full HPS (HPS top and HPS interlights) and hybrid (HPS top and LED interlights) lighting. Similarly, in the presented experiment might the lower temperature have led to a leaf number reduction, delayed initiation rate, but an increased fruits abortion rate was not observed. However, the lower leaf and therefore also fruit temperature had delayed, but not decreased fruit growth, contrary to Särkka et al. (2017), where the lower temperature might have decreased fruit growth of cucumbers in the LED treatment throught reduced cell growth and indirectlythroughsinkstrength.Also, Hernández & Kubota (2015)attributedthe28% greater shoot dry mass of cucumber transplants, the 28-32% higher shoot fresh weight and the 9-12% higher leaf number under HPS lights compared to the LED treatments(blueLED, redLED)tothehighercanopyairtemperature.
However, it has to be mentioned that both, the soil temperature as well as the leaf temperature was only measured once per week at the same time (10.00) and temperature differences between treatments might therefore be less or higher at other times. For an exact examination, it is therefore necessary to measure the temperaturemore often, best permanently to get a real picture of this effect. It is also necessary to repeat the experiment in the way that a higher temperature is choosen in the LED chamber to compensate the additional heating by the HPS lights to be ableto get the same soil and leaf temperature in both chambers. With thesesettings mightitbepossibletogetwithoutdelayripefruitsintheLEDtreatment.
A yield increase of strawberries might be possible with a higher plant density. For example found Paranjpe et al. (2008) that early and total marketable yield increased linearly with increasing plant densities (8,8; 9,5; 10,4; 11,4; 17,6; 19,1; 20,8; 22,9
plants/m²). These yield increases were achieved without adversely affecting mean fruitsize.
The importance of the photoperiod is shown by studies from Verheul et al. (2007), where a daily photoperiod of 12h or 13h resulted in the highest number of strawberry plants with emerged flowers. A photoperiod of 14h or more reduced this number, while no flowers emerged at a photoperiod of 16h, 20h or 24h (Verheul et al., 2006). Furtheron, interactions between photoperiod, temperature, duration of short-day treatment and plant age on flowering were documented from Verheul et al. (2006). In contrast, the presented experiment was conducted with a photoperiod of 16h,whichinducedgoodfloweringofstrawberries.
A big issue was the pollination with bumblebees during the time with no solar irradiation. When it was not getting bright outside, were the bumblebees in the LED chamber in their hive and therefore not pollinating the flowers, while bumblebees in the HPS chamber were always pollinating despite of how bright it was outside. But, when it was not overclouded and getting bright outside, were bumblebees also working in the LED chamber. This is showing the importance of finding a solution of how to ensure pollination of the flowers at the darkest time in Iceland when it is not even getting a bit bright outside and therefore with no garanteed pollination in the LEDchamber.
An other problem with the use of the LED lights is that LED glasses need to be used to distinguish between ripe and not ripe berries. The maintenance of the strawberry crop and the harvest of the berries was more difficult due to an other vision compared to the commonly used HPS lights. LED lights caused an irritation of the eyes.
Not only the yield, but also the appearance of the plant and the berries was affected by the light quality. Strawberry leaves and clusters were shorter with LED light than withHPSlight, becausetheamount of thefarredlightof thefloweringlamps was not enough in relation to the installed LED lights. This resulted in the danger of breaking clusters and the harvest was also more difficult due to close to each other hanging fruits. Byincreasing the number of theflowering lamps by 50% should the stretching of the leaves and clusters get better. With that could the risk of breaking clusters be reduced and the harvest improved. Also, Trouwborst et al. (2010) measured a lower plantlengthof cucumbersunderLEDs.Thepresentexperiment gaveacluethat LED
lightsmight have apositive influenceon the firmness of thefruits. Strawberries might therefore be stored longer due to a possibly higher shelf life. However, this needs to be tested in further experiments. Philips (2018) reported sweeter fruits under LEDs compared to HPS lights and Hanenberg et al. (2016) mentioned that it was possible to increase the taste by using LED lights. However, this was not observed in the presentedexperiment.
Nadalini et al. (2017) showed that strawberries under red and blue LEDs are able to grow and yield fruits of standard quality. The use of blue lights was able to cause positive effects on fruit set by 25% that caused a relevant higher yield compared to red LED and fluorescence neon tubes treated strawberries. The authors concluded that ways of application (blue light alone or in combination with other light sources) andtimingmustbefurtherinvestigated.
UsingLEDs was associated withnearly45% lowerdaily usageof kWh’s, resulting in lower expenses for the electricity compared to the use of HPS lights. Despite of the longer growing period of two weeks in the LED chamber, were energy costs (distribution+sale) lowered by43% / 44% (Sonata/ Magnum) comparedto the use of HPS lights. However, it has to be mentioned that the investment into LEDs was nearly dobble as high as for the HPS lights. Meaning, that the lower use of electricity byLEDswascompensatedbyahigherpriceofthelights.
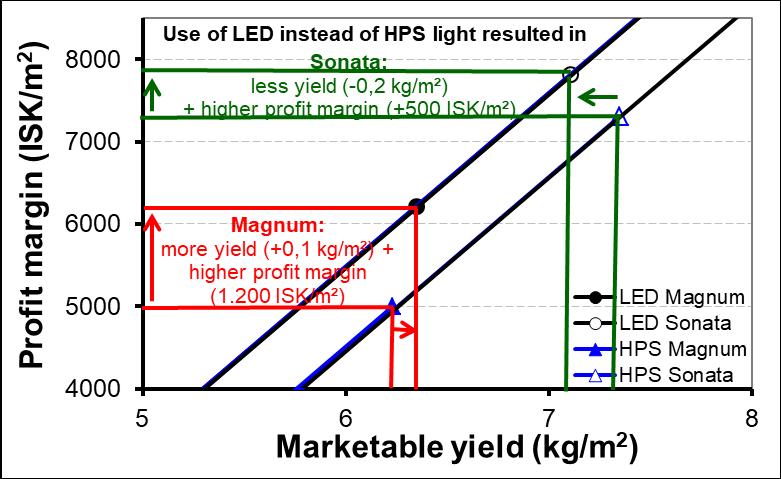
For both, Sonata and Magnum, resulted the use of LEDs in a higher profit margin than the use of HPS lights. In contrast to the fact that the yield was independent of thelightsource, was the profit marginincreased by1.200ISK/m2 for Magnumandby 500 ISK/m2 for Sonata when LED lights were used instead of HPS lights (Fig.30).
When the yield of the HPS treatment would have been 0,3kg/m2 higher for Sonata and 0,6 kg/m2 higher for Magnum, would the profit margin have been comparable to theoneoftheLEDtreatment.
Fig.30: Profit margin in relation to yield with different light sources –calculationscenarios(urbanarea,VA210).
Regarding the profit margin, it also has to be taken account to the longer growth periodof twoweeks under LEDlightscomparedtoHPSlights. Inthree yearswouldit be possible to have ten circles of strawberries under HPS lights, while under LED lights only nine circles would be possible, assuming that cleaning between circles would take half a week. This would result in a 900 ISK/m2 higher yearly profit margin with Sonata for the HPS treatment and a 1.900 ISK/m2 higher yearly profit margin withMagnumfortheLEDtreatment(Tab.10).
Tab.10: Calculationscenariosofprofitmarginperyear.
)
Also, Särkka et al. (2017) mentioned that the electrical use efficiency (kg yield J-1) increased when HPS light was replaced with LEDs in cucumbers. When LED lights
and interlights were used was the light use efficiency (g fruit FW mol-1 PAR) highest, but resulted in a fewer number of fruits in mid-winter particularly and the lowest yield potential. However, the high capital cost is still animportant aspect delaying the LED technology in horticultural lighting. Singh et al. (2015) showed that the introduction of LEDs allows, despite of high capital investment, reduction of the production cost of vegetables and ornamental flowers in the long-run (several years), due to the LEDs’ highenergyefficiency,lowmaintenancecostandlongevity.
Särkka et al. (2017) concluded that at the current stage of LED technology, the best lighting solution for high latitude winter growing appears to be HPS top lights combined with LED interlights. However, a solution for the near future could be a combination of LED and HPS as top lights to be able to maintain a suitable temperature,butreduceenergyuse.
The effect of different light compositions on strawberry growth, yield and quality was the object of some studies conducted recently with LEDs: Leaves and fruits biomass production was found increased in strawberry treated with different combinations of red and blue lights as comparedto fluorescent lamps (Piovene et al., 2015). Spectral composition could have contributed to contrasting results. So far, limited information is available comparing HPS supplemental lighting with LED supplemental lighting in terms of plant growth and development (Hernández & Kubota, 2015). Reported results are controversial, first because of different plant species and cultivars are used and second due to various experimental conditions. Therefore, it is concluded by different authors (Bantis et al., 2018; Hernández & Kubota, 2015; Singh et al., 2015), that more detailed scientific studies are necessary to understand the effect of different spectra using LEDs on plant physiology and to investigate the responses to supplemental light quality of economically important greenhouse crops and validate theappropriateandidealwavelengthcombinationsforimportantplantspecies.
It is known that different varieties of strawberries naturally result in different yield levels. Since years is Sonata the most used variety for winter greenhouse cultivation under lights in Iceland and Magnum has been tested in commercial production in Icelandin2017.
While Sonata had about ten more flowers per plant than Magnum, were in addition for Magnum 15% unpollinated flowers or later rejected flowers under LED lights and 27% under HPS lights counted. The harvest period started half a week earlier for Magnum. The marketable yield was more than 10% lower for Magnum compared to Sonata. This was attributed to a lower number of marketable fruits due to a significantly higher percentage of unshaped fruits. Magnum was ripe after 40/45 days (HPS/LED) and Sonata after 41/47 days (HPS/LED). Stadler (2016c) found comparablevaluesforSonata.
Sonata had more marketable fruits, mainly due to a higher number of 1st and 2nd class fruits, while there were no variety differences in the extra class fruits and in the averageweight.ThereweremoremisshapenedfruitsatMagnumthanatSonata.
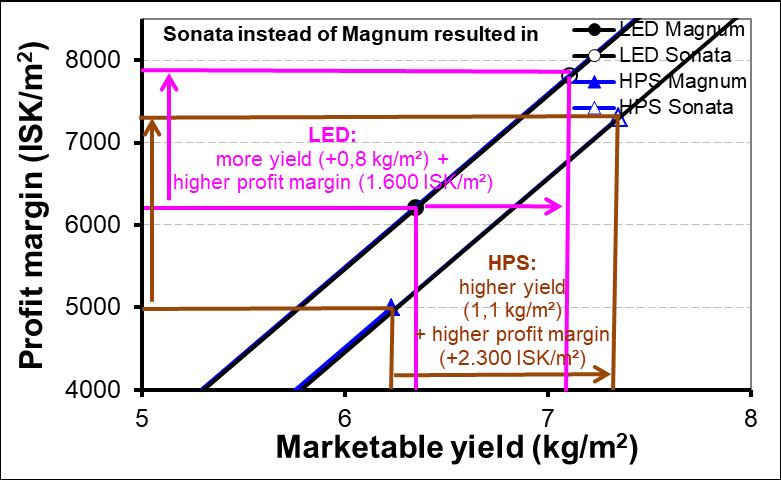
By the selection of Sonata instead of Magnum could the yield and the profit margin be increased: At the HPS treatment resulted the use of Sonata in a 1,1kg/m2 higher yield,whichwasreflectedina2.300ISK/m2 higherprofitmargin(Fig.31).AttheLED treatment resulted the use of Sonata in a 0,8 kg/m2 higher yield, which was reflected in a 1.600 IKS/m2 higher profit margin. This means, by the choose of the variety can theprofitmarginbeinfluencedpositively.
Fig.31: Profit margin in relation to yield with different varieties – calculation scenarios(urbanarea,VA210).
Proefcentrum Hoogstraten (2016) measured an increasing sugar content from 7,4 to 8,7 with an average of 7,6°Brix for Sonata, while the Brix content decreased to the middle of the harvest period and increased again to the end of the harvest period. This is in accordance to the presented measurements, even though were higher values measuredforSonata. ComparedtoSonatawasthesugarcontent of Magnum most of the time significantly higher. The reason for that may lay in the higher DS content of Magnum compared to Sonata. Magnum fruits were evaluated more firm, while Sonata fruits were more juicy. Proefcentrum Hoogstraten (2016) evaluated Sonata with high grades (In total got the fruit assessment of Sonata a high score of 82,3% with high grades particularly at “bruising skin”, “colouring” and “regularity” (shape);Magnumwas notinthistest).
However, with the selection of the variety has to be payed not only attention to the yield, but also to the quality (e.g. sugar content). The consumer might be willing to paymoreforsweeterfruits.
In terms of the economy of lighting it is also worth to make some future speculations about possible developments also regarding the fact that the subsidy has been decreased by more than 20%. So far, the lighting costs (electricity + bulbs) are contributing to a big part of the production costs of strawberries. In the past and present therehavebeenandtherearestillalot of discussionsconcerningtheenergy prices. Therefore, it is necessary to highlight possible changes in the energy prices (Fig.32).
The white columns are representing the profit margin according to Fig.29. Where to be assumed, that growers would get no subsidy from the state for the distribution of the energy, that wouldresultinaprofit marginof 3.600-7.000ISK/m2 (blackcolumns, Fig.32). Without the subsidy of the state, probably less Icelandic grower would produce strawberries over the winter months. When it is assumed that the energy costs, both in distribution and sale, would increase by 25%, but growers would still get the subsidy, then the profit margin would range between 4.200-7.300 ISK/m2 (dotted columns). When it is assumed that growers have to pay 25% less for the energy, theprofit marginwouldincreaseto 5.800-8.300ISK/m2 (graycolumns).From these scenarios, it can be concluded that from the grower’s side it would be
preferable to get subsidy to be able to get a higher profit margin and grow strawberries over the winter. Referring to the reduction of the subsidy of 20% from the year 2017 to the year2018, it is obvious that actions must be taken, that growers are alsoproducing duringthe winter at lowsolar irradiation. It isalso showingclearly, that it is only paying of to produce strawberries during the winter in Iceland, when a high yieldis guarantied. Also, the use of LEDsareshowingthepossibilityto increase profit margin. This is getting especially important as the reduction of the subsidity is decreasing, because do to less use of electricity by the LED lights, a reduction becamelessappearentthanwiththeuseof HPSlights.
Fig.32: Profit margin in relation to treatment – calculation scenarios (urban area,VA210).

The current economic situation for growing strawberries necessitate for reducing production costs to be able to heighten profit margin for strawberry production. On the other hand side, growers have to think, if strawberries should be grown during lowsolarirradiationandmuchuseofelectricity.
Itcanbesuggested,thatgrowerscanimprovetheirprofitmarginofstrawberriesby:
It may be expected to get a higher price, when consumers would be willing to pay even more for Icelandic berries than imported ones. Growers could also get a higher price for the fruits with direct marketing to consumers (which is of course difficult for large growers). Theycould also try to find other channels of distribution (e.g. selling directly to the shops and not over SfG). In doing so, growers could save the very high expences of the fee to SfG for selling the strawberries. This is especially important when a high yield is expected, because thenthe proportion of the fee for selling thestrawberries through SfG is contributing to ¼ of the production costs. Therefore, it would be profitable forthegrowertochooseotherchannelsofdistribution.
The price for the strawberry plant is quite high. By using the strawberry plant not only once, but twice, could costs be decreased. By that, also the costs for the soil would be lowered. However, it is necessary that the yield is staying at ahighvaluewhensameplants areusedmorethanonce.
According to the presented results, seems it not to pay off to useeverbearers, and with that decreasing the planting costs by making it unnecessary to plant strawberries in about three months intervals as for junebearers due to a low yield. Also, with using everbearers it would not be possible to clean the greenhouse in between which is especially important if the crop has aphids or plantdiseases.
Not only the variety, but also within a variety yield differences are possible. Therefore, it is necessary to select first of all plants with a high yield guaranty. Beside that is the choose of the variety important and can result in a profit marginthatismorethan1.600ISK/m2 higher(Stadler,2016c).
Growers can decrease their plant nutrition costs by mixing their own fertilizer. When growers would buy different nutrients separately for a lower price and mix out of this their own composition, they would save fertilizer costs. However, this takes more time and it is more difficult to perform this task by employees.
ThecostsofCO2 areprettyhigh.Therefore,thequestionarises,if itisworthto use that much CO2 or if itwouldbe better touseless andget alower yieldbut all together have a possible higher profit margin. The CO2 selling company hascurrentlyamonopolyandacompetitionmightbegood.
Thecosts for packing (material) from SfG and the costs for the rent of thebox arehigh.Costscouldbedecreasedbyusingcheaperpackingmaterials.
The efficiency of each employee has to be checked regularly and growers will have an advantage to employ faster workers. Growers should also check the user-friendliness of the working place to perform only minimal manual operations. Very often operations can be reduced by not letting each employee doing each task, but to distribute tasks over employees. In total, employeeswillworkmoreefficientlyduetothespecialisation.
Growers should decrease artificial light intensity at increased solar irradiation, because this would possibly result in no lower yield (Stadler et al.,2010).
Growers should check if they are using the right RARIK tariff and the cheapest energy sales company tariff. Unfortunately, it is not so easy, to say,whichistherighttariff,becauseitisgrowerdependent.
Growers should check if they are using the power tariff in the right way to be able to get a lowered peak during winter nights and summer (max. power -30%). It is important to use not so much energy when it is expensive, buthaveahighuseduringcheaptimes.
Growers can save up to 8% of total energy costs when they would divide the winter lighting over all the day. That means growers should not let all lamps be turned on at the same time. This would be practicable, when they would grow in different independent greenhouses. Of course, this is not so easy realisable, when greenhouses are connected together, but
can also be solved there by having different switches for the lamps to be able to turn one part of the lamps off at a given time. Then, plants in one compartment of the greenhouse would be lightened only during the night.
When yield would be not more than 2% lower with lighting at nights compared to the usual lighting time, dividing the winter lighting over all the day would pay off. However, a tomato experiment showed that the yield was decreased by about 15% when tomatoes got from the beginning of November to the end of February light during nights and weekends (Stadler, 2012). This resulted in a profit margin that was about 18% lower compared to the traditional lighting system and therefore, normal lighting timesarerecommended.
For large growers, that are using a minimum of 2GWh it could be recommended to change to “stórnotendataxti” in RARIK and save up to 35%ofdistributioncosts.
It is expected that growers are cleaning their lamps to make it possible, that all the light is used effectively and that they are replacing their bulbs beforetheexpensiveseasonisstarting.
Aikman (1989) suggests to use partially reflecting material to redistribute theincidentlightbyinterceptingmaterialtoredistributetheincidentlightby intercepting direct light before it reaches those leaves facing the sun, and to reflect some light back to shaded foliage to give more uniform leaf irradiance.
The use of LED lights instead of HPS lights can reduce electricity consumtion by 45%. However, the growing period was increased by two weeks and environmental settings need to be adapted to the use of this lightsource.
The strawberry yield was not influenced by the light source. The reduction of the lightingcostsby45% bytheuseof LEDsinsteadof HPSlightswas accompanied by a high increase of the investion costs. The profit margin could be increased by more than 500 ISK/m2 by the use of LEDs. However, the growing period was increased by twoweeks, possibly duetoa lowerair, leaf andsoiltemperature, resulting in a yearly profit margin that was not much different between light sources. Therefore, before LEDs can be adviced in practise, more experiments need to be conducted with adapted temperature settings. The high capital cost is an important aspect delaying the LED technologyin horticulturallighting as long as more knowledge is available to different plant species. In addition, solutions for a successful pollination during the time when no solar light is entering the greenhouse must be found when LED lights areused.Sofar,areplacementof theHPSlampsbyLEDsisnotrecommendedfrom the economicside. Due to thelower yield of the Magnum compared toSonata, is the selection of the variety important. Growers should pay attention to possible reduction intheirproductioncostsforstrawberriesotherthanenergycosts.
AIKMAN DP, 1989: Potential increase in photosynthetic efficiency from the redistributionof solarradiationinacrop.J.Exp.Bot.40,855-864.
BANTIS F, SMIRNAKOU S, OUZOUNIS T, KOUKOUNARAS A, NTAGKAS N, RADOGLOU K, 2018: Current status and recent achievements in the field of horticulture with the use of light-emitting diodes (LEDs). Sci. Hortic 235, 437-451.
BROWN CS, SCHUERGER AC, SAGER JC, 1995: Growth and photomorphogenesis of pepper plants under red light-emitting diodes with supplementalblueorfar-redlighting.J.Amer.Soc.Hort.Sci.120,808-813.
BULA RJ, MORROW EC, TIBBITTS TW, BARTA DJ, IGNATIUS RW & MARTIN TS, 1991: Light-emitting diodes as a radiation source for plants. HortScience 26, 203-205.
DEMERS DA, DORAIS M, WIEN CH, GOSSELIN A, 1998a: Effects of supplemental light duration on greenhouse tomato (Lycopersicon esculentum Mill.) plants andfruityields.Sci.Hortic.74,295-306.
DEMERSDA,GOSSELINA,WIENHC,1998b:Effectsof supplementallight duration on greenhouse sweet pepper plants and fruit yields. J. Amer. Hort. Sci. 123, 202-207.
DUECK TA, JANSE J, EVELEENS BA, KEMPKES FLK, MARCELIS LFM, 2012: Growth of tomatoes under hybrid LED and HPS lighting. Acta Hortic. 952, 335-342.
EGGERTSSON H, 2009: Personal communication (Notice in writing) from Haukur Eggertsson,Orkustofnun,October2009.
HANENBERG MAA, JANSE J, VERKERKE W, 2016: LED light to improve strawberryflavour,qualityandproduction.ActaHortic.1137,207-212.
HAO X, PAPADOPOULOS AP, 1999: Effects of supplemental lighting and cover materials on growth, photosynthesis, biomass partitioning, early yield and qualityofgreenhousecucumber.Sci.Hortic.80,1-18.
HERNÁNDEZ R, KUBOTA C, 2015: Physiological, morphological, and energy-use efficiency comparisons of LED and HPS supplemental lighting for cucumber transplant production.HortScience50(3),351-357.
HOENECKE ME, BULA RJ, TIBBITTS TW, 1992: Importance of “blue” photon levels for lettuce seedlings grown under red-light-emitting diodes. HortScience 27, 427-430.
KRIZEK DT, MIRECKI RM, BRITZ SJ, HARRIS WG, THIMIJAN RW, 1998: Spectral properties of microwave sulfur lamps in comparison to sunlight and high pressuresodium/metalhalidelamps.Biotronics27,69-80.
LU N, MARUO T, JOHKAN M, HOHJO M, TSUKAGOSHI S, ITO Y, ICHIMURA T, SHINOHARA Y, 2012: Effects of supplemental lighting with light-emitting diodes (LEDs) on tomato yield and quality of single-truss tomato plants grown athighplantingdensity.Environ.ControlBiol. 50,63-74.
NADALINIS,ZUCCHIP,ANDREOTTIC,2017:EffectsofblueandredLEDlightson soilless cultivated strawberry growth performances and fruit quality. Eur. J. Hortic.Sci92(1),12-20.
PARANJPE A, CANTLIFFE DJ, STOFFELLA PJ, LAMB EM, POWELL CA, 2008: Relationship of plant density to fruit yield of ‘Sweet Charli’ strawberry grown in a pine bark soilless medium in a high-roof passively ventilated greenhouse. Sci.Hortic.115,117-123.
PHILIPS, 2015: The ideal replacement for the incandescent lamp. http://www.lighting.philips.com/b-dam/b2b-li/en_AA/Experience/cases/Brookberries/PHIL_143918_CaseStudy_Brookberries_UK.pdfvisited:01.02.2017.
PHILIPS, 2017: Higher yields of better quality tomatoes. http://images.philips.com/is/content/Philips Consumer/PDFDownloads/Global/ Case-studies/CSLI20170119_001-UPD-en_AA-PHIL_164209_CaseStudy_ MartinSigg.pdfvisited:01.02.2017.
PHILIPS, 2018: Strawberries ahead of the rest. http://www.lighting.philips.com/main/cases/cases/horticulture/welroy-fruit. visited: 11.09.2018
PINHO P, HYTÖNEN T, RANTANEN M, ELOMAA P, HALONEN L, 2013: Dynamic control of supplemental lighting intensity in a greenhouse environment. LightingRes.Technol.45,295-304.
PIOVENE C, ORSINI F, BOSI S, SANOUBAR R, BREGOLA V, DINELLI G, GIANQUINTO G, 2015: Optimal red:blue ratio in led lighting for nutraceutical indoorhorticulture.Sci.Hortic.193,202-208.
PROEFCENTRUM HOOGSTRATEN VZW., 2016: Screening trail of new strawberry cultivars2016.
SÄRKKA L, JOKINEN K, OTTOSEN CO, KAUKORANTA T, 2017: Effects of HPS andLEDlightingoncucumberleaf photosynthesislight qualitypenetrationand temperature in the canopy, plant morphology and yield. Agricultural and Food Science26,102-110.
SCHUERGER AC, BROWN CS, STRYJEWSKI EC, 1997: Anatomical features of pepper plants (Capsicum annum L.) grown under red light-emitting diodes supplementedwithblueorfar-redlight.Ann.Bot.79,273-282.
SINGHD,BASUC,MEINHARDT-WOLLWEBERM,ROTHB,2015:LEDsforenergy efficient greenhouselighting. RenewableandSustainableEnergy Reviews 49, 139-147.
STADLER C, 2010: Effects of plant density, interlighting, light intensity and light quality on growth, yield and quality of greenhouse sweet pepper. Final report, RitLbhÍnr.30.
STADLER C, 2012: Effects of lighting time and light intensity on growth, yield and qualityofgreenhousetomato.Finalreport,RitLbhÍnr.40.
STADLER C, 2013: Áhrif ljósstyrks, rótarbeðsefnis, vökvunar og umhirðu á vöxt, uppskeruoggæðigróðurhúsatómata.Finalreport,RitLbhÍnr.43.
STADLER C, 2015: Áhrif LED lýsingar á vöxt, uppskeru og gæði gróðurhúsasalats aðvetri.Finalreport,RitLbhÍnr.61.
STADLER C, 2016a: Áhrif ljósstyrks ávöxt, uppskeru og gæði gróðurhúsajarðarberja aðvetri.Finalreport,RitLbhÍnr.63.
STADLER C, 2016b: Jarðarberjaræktun á óhefðbundnum tíma á Íslandi. Bændablaðið, 04.tölublað,25.02.2016,Blaðnr.461,54.
STADLER C, 2016c: Áhrif ljósstyrks á vöxt, uppskeru og gæði gróðurhúsajarðarberja aðvetri–önnurtilraun.Finalreport,RitLbhÍnr.72.
STADLER C, HELGADÓTTIR Á, ÁGÚSTSSON, M, RIIHIMÄKI MA, 2010: How does light intensity, placement of lights and stem density affect yield of wintergrown sweetpepper?Fræðaþinglandbúnaðarins,227-232.
TAMULAITIS G, DUCHOVSKIS P, BLIZNIKAS Z, BREIVE K, ULINSKAITE R, BRAZAITYTE A, NOVICKOVAS A, ZUKAUSKAS A, 2005: High-power lightemitting diode based facility for plant cultivation. J. Phys. D: Appl. Phys. 38, 3182-3187.
TROUWBORST G, OOSTERKAMP J, HOGEWONING SW, HARBINSON J, VAN IEPEREN W, 2010: The responses of light interception, photosynthesis and fruit yield of cucumber to LED-lighting within the canopy. Physiol. Plant 138, 289-300.
VAN DELM T, MELIS P, STOFFELS K, VANDERBRUGGEN R, BAETS W, 2016: Advancing the strawberry season in Belgian glasshouses with supplemental assimilationlighting.ActaHortic.1134,147-154.
VERHEUL M, SØNSTEBY A, GRIMSTAD S, 2006: Interactions of photoperiod, temperature, duration of short-day treatment and plant age on flowering of Fragaria x ananasa Duch.cv.Korona.Sci.Hortic.107,164-170.
VERHEUL M, SØNSTEBY A, GRIMSTAD S, 2007: Influences of day and night temperatures on flowering of Fragaria x ananassa Duch., cvs. Korona and Elsanta,atdifferentphotoperiods.Sci.Hortic.112,200-206.
5.des plantscameandwerekeptinacold chamber plantscameandwerekeptina coldchamber
6.des measuringlight moreµmolintheLEDchamber measuringlight
7.des
8.des
9.des
10.des
takingbrownleaves,planting, daystartsat5:00,wateringat 10:00,14:00,18:00
11.des Paraat(400ml/pot),onewatering perday(10:00)for3min,daystarts 4hbeforelight
temperatureincreasestooless
takingbrownleaves,planting, daystartsat5:00,wateringat 10:00,14:00,18:00
12.des
13.des 14.des
daystartsat3:00,measuringlight (279µmol),humiditysetto75%to beabletoreach70%
Paraat(400ml/pot),threelights wereadded(total:18lights),one wateringperday(10:00)for3min temperatureincreasestooless
daystartsat3.00,measuringlight (277µmol),humiditysetto75%to beabletoreach70%
15.des 16hlightreached 16hlightreached
16.des
17.des
18.des daystartsat4:00insteadof3:00 daystartsat4:00insteadof3:00
19.des measuringgrowth lessthan1cm/daygrowth
20.des
measuringgrowth,leaf-andsoil temperature,daystartsat5:00, openingwindowschanged(from 20°Cto17°C)
growthwaslessthan1cm/day forMagnum,butnearly1cm/day forSonata
measuringleaf-andsoil temperature,daystartsat5:00, openingwindowschanged(from 20°Cto17°C)
21.des measuringgrowth,Loker Loker
firstflowersandclustersare coming
22.des measuringgrowth,rootschecked, daystartsat4:00insteadof5:00
23.des
24.des
littleofnewwhiteroots,plants werewetfromraincomingin throughopenwindows rootschecked, daystartsat4:00insteadof5:00
littleofnewwhiteroots,plants werewetfromraincomingin throughopenwindows
25.des addedwateringat16:00 addedwateringat16:00
26.des
27.des measuringgrowth,leaf andsoil temperature
firstflowersvisible measuringleaf andsoil temperature
28.des
rootsatthebottomofthepot,fast interval(3xbetween9:00-21:00), 800ppm(500ppmwithopen windows),measuringgrowth,Loker
rootsatthebottomofthepot,fast interval(3xbetween9:00-21:00), 800ppm(500ppmwithopen windows),Loker orderedhivewasnotcomingdue toaproblematKoppert
29.des measuringgrowth, daystartsat3:30 daystartsat3:30
30.des 31.des
1.jan
2.jan 2hbetweenwaterings,settingup bandfortheleaves,takingleaves
3.jan
measuringgrowth,3hbetween waterings,settingupbandforthe leaves,turningfloweringlampon for24h,2°Copeningwindows, TZ1:03:30,3°C toomuchdrain
2hbetweenwaterings, takingleaves
4.jan measuringgrowth,Prev-Magnum
1hbetweenwaterings,settingup bandfortheleaves,2°Copening windows,TZ1:03:30,3°C
newleavesbrown,nodrain, windowsaretoomuchopen
3hbetweenwaterings,setting tapefortheclusters,puttinghive up(1hopen),Prev-Magnum toomuchwatering
5.jan measuringgrowth checkingpollination
Date tasks observations/problems tasks observations/problems
6.jan hiveopenfor2h darkoutside,beesarenot workingwell
7.jan
8.jan
measuringgrowth,settinguptape forclusters,Fe+Mnshoot(0,3lFe (6%)+40gMn-sulfate/1000m2)
9.jan measuringgrowth, weeklymeasurements
notpossibletotakeclustersto thefrontduetoshortclusters
Fe+Mnshoot (0,3lFe(6%)+40g Mn-sulfate/1000m2),workingon clusters,checkingpollination
substrateisverywet, shortclusters weeklymeasurements
10.jan
measuringgrowth,leaf andsoil temperature,firsthive(open: 12:00-15:00),checkingpollination, Topaz
hiveopenfor3h,measuringleafandsoiltemperature,Topaz
11.jan measuringgrowth, checkingpollination checkingpollination
12.jan measuringgrowth, checkingpollination nobeesoutsidethehiveat13:00
13.jan 14.jan
15.jan measuringgrowth,Fe+Mnshoot, wateringsetto1,5hinterval
16.jan weeklymeasurements
1820cmleavehightreached, firstbrightdaysincehivewasset intothechamber:beeswere pollinatingintheafternoon
Fe+Mnshoot,workingonclusters
brightoutsideandbeesworking weeklymeasurements, workingonclusters leavesarelight
17.jan
measuringgrowth,leaf-andsoil temperature,light,watersample taken,workingonclusters,checking pollination
18.jan workingonclusters
potsarewet(butlittledrain), brightoutsideandbeesworking
workingonclusters,measuring leaf-andsoiltemperature,light, watersampletaken,workingon clusters,checkingpollination
19.jan
20.jan
measuringgrowth,Loker,working onclusters,problemswithwatering systemcausedtoomuchwatering, continuingtousefloweringlamps
growth:about0,5cm/dag,22cm reached
Loker, Magnum:1hintervalwatering, Sonata:1,5hintervalwatering
21.jan CO2 finished CO2 finished
22.jan measuringgrowth,Topaz
Topaz,workingonclusters
23.jan weeklymeasurements substrateiswet weeklymeasurements,workingon clusters
24.jan
measuringgrowth,leaf-andsoil temperature,checkingpollination, CO2 wasfilled
measuringleaf-andsoil temperature,checkingpollination, CO2 wasfilled
25.jan workingonclusters,watering intervallchangedfrom2:00to2:30 wateringMagnum:intervall changedfom1:20to1:00
26.jan measuringgrowth,workingon clusters,watering:4hintervall (additionalat9:30and10:30)
27.jan workingonclusters
28.jan
29.jan measuringgrowth
shortclusters,difficulttowork with watering:4hintervall
morewateringtodecreaseE.C. andtoflushout
muchdevelopmentsince26.01: clustershavestretched workingonclusters
30.jan weeklymeasurements, Oriuslaevigatus someflowers,notpollinatedand toomuchpollinated weeklymeasurements, Oriuslaevigatus
31.jan measuringgrowth,leaf andsoil temperature,checkingpollination measuringgrowth,leaf andsoil temperature
1.feb workingonclusters changingfertilizer,workingon clusters
2.feb Loker,workingonclusters Loker
3.feb
Sonatafruitsseemnotto increasemuch
stopwateringduetoproblem withtheelectricity
4.feb
5.feb measuringgrowth
clustersshorterthanintheHPS chamber,difficulttoworkwith them stopwatering
MagnumogSonatawithfirstred berries,electricitywentoff
6.feb
weeklymeasurements,workingon clusters,stopwatering(additional wateringstakenoff)
7.feb
measuringgrowth,leaf andsoil temperature,07.02-12.02no wateringbecausesoilistoowet (dryingup),workingonclusters, checkingpollination,2waterings (10:30,14:30) substratetoowet
weeklymeasurements leavesverylight
measuringleaf-andsoil temperature
8.feb Loker firstharvest,Loker
9.feb wateringincreased
fertilizerchanged harvest
13.feb weeklymeasurements weeklymeasurements
14.feb Aphiscout Aphiscout,workingonclusters
Sonataclustershavelengthened much,Sonataberriesarelightred
15.feb
16.feb
workingonclusters,measuringleafandsoiltemperature, Loker,Fe+Mnshoot
harvest,Brix,measuringleaf-and soiltemperature, Loker,Fe+Mnshoot
turningofffloweringlamps
workingonclusters harvest
20.feb weeklymeasurements weeklymeasurements
22.feb firstharvest,measuringleaf and soiltemperature harvest,measuringleaf andsoil temperature
23.feb
24.feb
25.feb
26.feb harvest harvest
27.feb weeklymeasurements,taking leavesandrunners substrateiswet weeklymeasurements,taking leavesandrunners
28.feb
measuringleaf andsoil temperature,added100mlacidto stocksolution
measuringleaf andsoil temperature,added100mlacidto stocksolution
1.mar harvest,Brix harvest,Brix
2.mar tastingexperiment,Loker tastingexperiment,Loker
3.mar
4.mar
5.mar harvest harvest
6.mar weeklymeasurements
substrateiswet,shortclusters arebeginningtobrake weeklymeasurements
7.mar measuringleaf andsoil temperature measuringleaf andsoil temperature
8.mar harvest harvest
9.mar
10.mar
11.mar
12.mar harvest harvest
13.mar weeklymeasurements substrateiswet weeklymeasurements
14.mar measuringleaf-andsoil temperature measuringleaf-andsoil temperature
15.mar harvest harvest
16.mar
17.mar
18.mar
19.mar harvest harvest,lastharvestofMagnum
20.mar weeklymeasurements weeklymeasurements
21.mar measuringleaf andsoil temperature measuringleaf andsoil temperature
22.mar harvest,Loker lastharvestofSonata 23.mar 24.mar 25.mar 26.mar harvest,Brix 27.mar weeklymeasurements 28.mar harvest 29.mar 30.mar 31.mar
1.apr 2.apr
3.apr harvest,lastharvestofMagnum, weeklymeasurements
4.apr
5.apr lastharvestofSonata
