REPORT


I Rit LbhÍ nr. 45 „Áhrif ljósstyrks, ágræðslu og umhverfis á vöxt, uppskeru og gæði gróðurhúsatómata“ FINAL
ChristinaStadler
2013
„Áhrif ljósstyrks, ágræðslu og umhverfis á vöxt, uppskeru og gæði gróðurhúsatómata“
FINAL REPORT
Christina Stadler
Rit LbhÍ nr. 45 ISSN 1670-5785
Landbúnaðarháskóli Íslands December 2013
Finalreportoftheresearchproject
Áhrifljósstyrks,ágræðsluogumhverfisávöxt, uppskeruoggæðigróðurhúsatómata“
Duration: 01/08/2012 – 31/12/2013
Project leader: Landbúnaðarháskóla Íslands
Reykjum
Dr. Christina Stadler
810 Hveragerði
Email: christina@lbhi.is
Tel.: 433 5312 (Reykir), 433 5249 (Keldnaholt)
Mobile: 843 5312
Collaborators: Magnús Ágústsson, Bændasamtökum Íslands
Dr. Ægir Þór Þórsson, Bændasamtökum Íslands
Knútur Ármann, Friðheimum
Þorleifur Jóhannesson, Hverabakka II
Dr. Mona-Anitta Riihimäki, HAMK University of Applied Sciences, Finland
Project sponsor: Samband Garðyrkjubænda
Bændahöllinni við Hagatorg
107 Reykjavík
„
Table of contents
I
List of figures III List of tables IV Abbreviations V 1 SUMMARY 1 YFIRLIT 3 2 INTRODUCTION 5 3 MATERIALSANDMETHODS 6 3.1 Greenhouse experiment 6 3.2 Treatments 10 3.3 Measurements, sampling and analyses 11 3.4 Statistical analyses 12 4 RESULTS 12 4.1 Environmental conditions for growing 12 4.1.1Solarirradiation 12 4.1.2Illuminanceandairtemperature 13 4.1.3Soiltemperature 14 4.1.4Irrigationoftomatoes 14 4.2 Development of tomatoes 18 4.2.1Height 18 4.2.2Numberofclusters 19 4.2.3Distancebetweenclusters 21 4.3 Yield 27 4.3.1Totalyieldoffruits 27 4.3.2Marketableyieldoffruits 28 4.3.3Outerqualityofyield 33
II 4.3.4Interiorqualityofyield 34 4.3.4.1 Sugar content 34 4.3.4.2 Taste of fruits 35 4.3.4.3 Dry substance of fruits 35 4.3.4.4 Nitrogen content of fruits 36 4.3.5Drymatteryieldofstrippedleaves 37 4.3.6Cumulativedrymatteryield 37 4.4 Nitrogen uptake 38 4.5 Economics 39 4.5.1Lightinghours 39 4.5.2Energyprices 40 4.5.3Costsofelectricityinrelationtoyield 43 4.5.4Profitmargin 44 5 DISCUSSION 49 5.1 Yield in dependence of light intensity 49 5.2 Yield in dependence of variety 50 5.3 Yield in dependence of plant treatment (grafted / ungrafted) 50 5.4 Future speculations concerning energy prices 52 5.5 Recommendations for increasing profit margin 53 6 CONCLUSIONS 56 7 REFERENCES 57
Listoffigures
Fig. 1: Experimental design of cabinets.
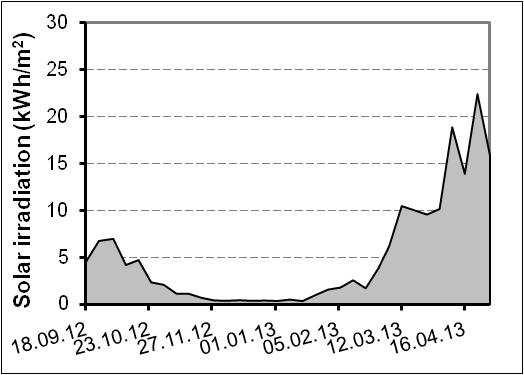
Fig. 2: Time course of solar irradiation. Solar irradiation was measured every day and values for one week were cumulated.
Fig. 3: Illuminance (solar + HPS lamps) and air temperature at different treatments. Illuminance and air temperature was measured early in the morning at a cloudy day.
Fig. 4: Soil temperature at different treatments. The soil temperature was measured at little solar irradiation early in the morning.
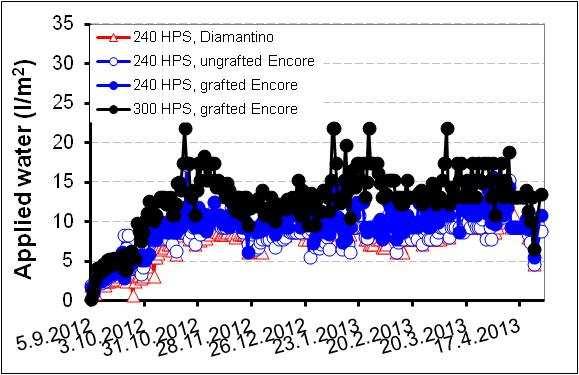
Fig. 5: Daily applied water at different treatments
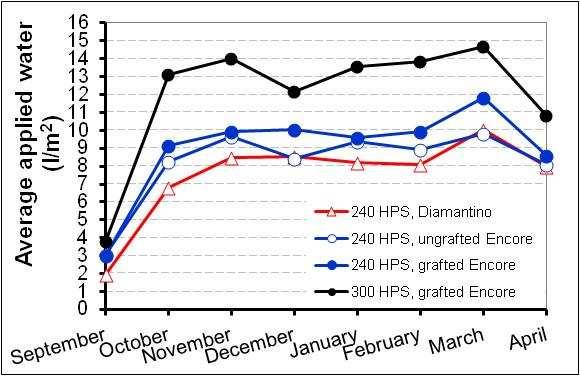
Fig. 6: Average daily applied water at different treatments.
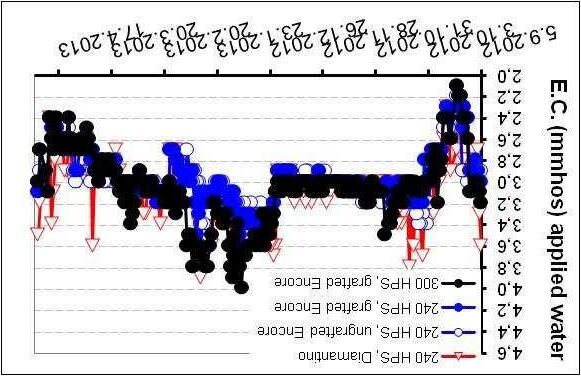
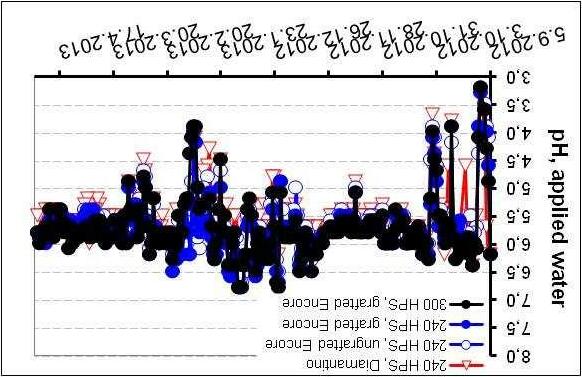
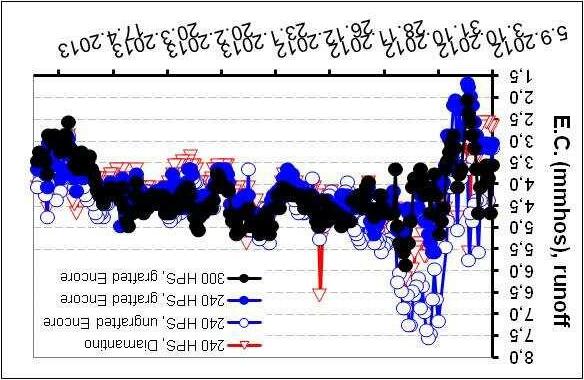
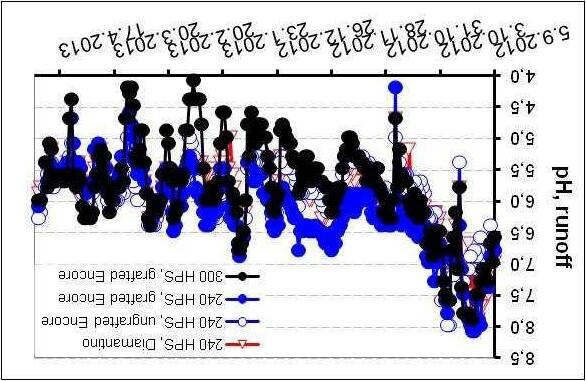
Fig. 7: E.C. (a, c) and pH (b, d) of irrigation water (a, b) and runoff of irrigation water (c, d).
Fig. 8: Proportion of amount of runoff from applied irrigation water at different treatments.
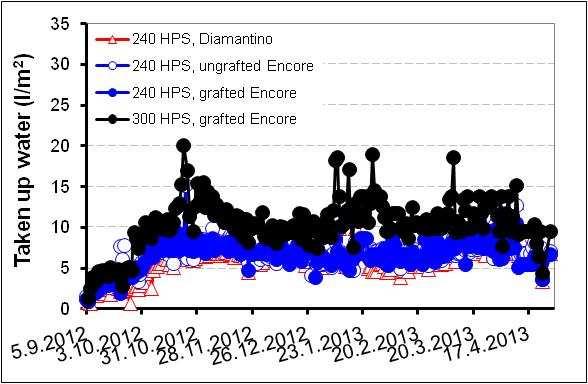
Fig. 9: Water uptake at different treatments.
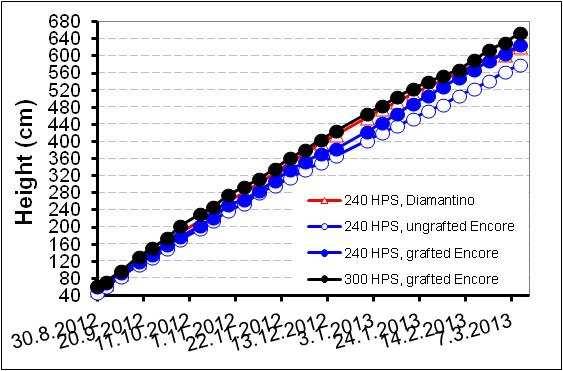
Fig. 10: Height of tomatoes at different treatments.
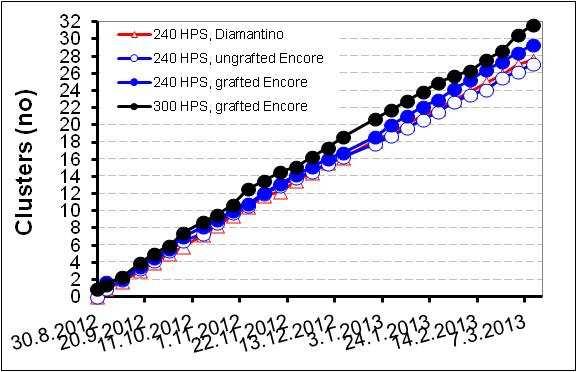
Fig. 11: Number of clusters at different treatments.
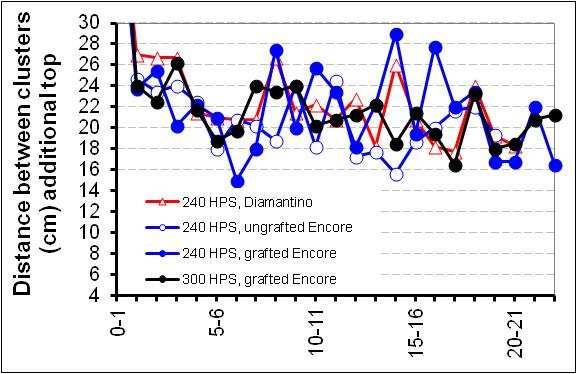
Fig. 12: Average distance between clusters at different treatments.
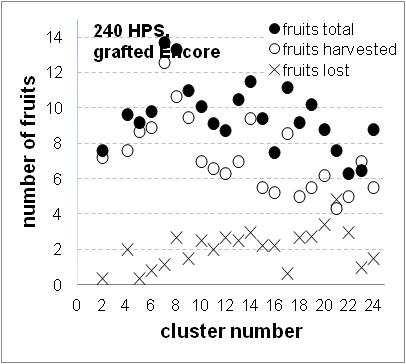
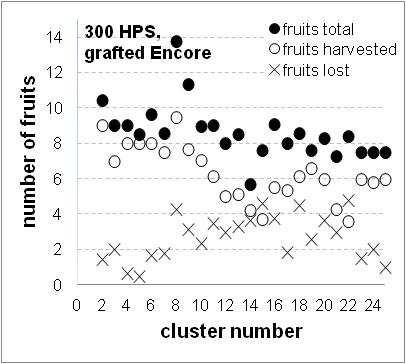
Fig. 13: Fruits per cluster at different treatments.
Fig. 14: Not pollinated fruits per cluster at different treatments. 23 Fig. 15: Length of leaves at different treatments. 24
Fig. 16: Weekly growth at different treatments. 24
Fig. 17: Number of flowers at different treatments. 25 Fig. 18: Stem diameter and weekly growth at different treatments.
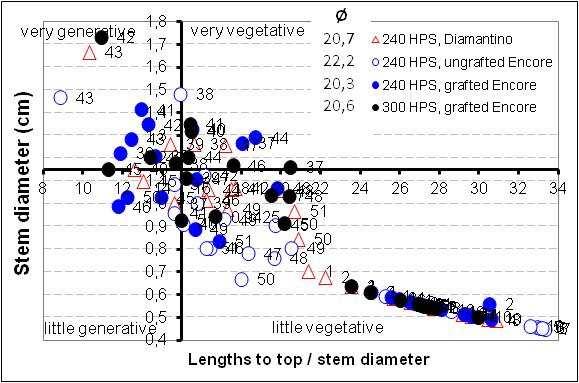
Fig. 19: Stem diameter and quotient lengths to top and stem diameter at different treatments.
Fig. 20: Cumulative total yield at different treatments.
Fig. 21: Time course of accumulated marketable yield (1. and 2. class fruits) with grafted and ungrafted tomatoes.
Fig. 22: Time course of accumulated marketable yield (1. and 2. class fruits) of grafted Encore with different light intensities.
Fig. 23: Time course of accumulated marketable yield (1. and 2. class fruits) with the different varieties Encore and Diamantino.
Fig. 24: Time course of marketable 1. class yield at different treatments.
Fig. 25: Time course of marketable 2. class yield at different treatments.
III
7
12
13
14
15
15
16
17
18
19
20
21
22
26
26
27
28
29
29
36
36
Fig. 26: Time course of marketable yield at different treatments. 31
Fig. 27: Average weight of tomatoes (1. class fruits) at different treatments. 32
Fig. 28: Number of fruits at setting and harvest at different treatments. 33
Fig. 29: Sugar content of fruits at different treatments. 34
Fig. 30: Sweetness, flavour and juiciness of fruits at different treatments. 35
Fig. 31: Dry substance of fruits at different treatments. 36 Fig. 32: N content of fruits at different treatments. 36
Fig. 33: Dry matter yield of stripped leaves at different treatments.
Fig. 34: Cumulative dry matter yield at different treatments. 38
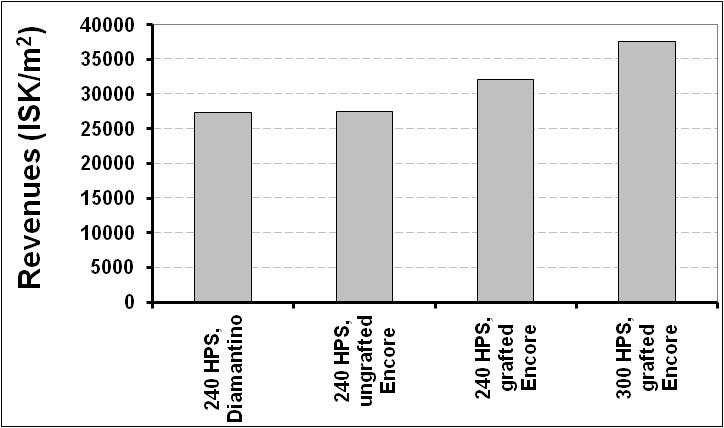
Fig. 35: Cumulative N uptake of tomatoes. 39 Fig. 36: Revenues at different treatments. 44
Fig. 37: Variable and fixed costs (without lighting and labour costs). 45 Fig. 38: Division of variable and fixed costs. 45 Fig. 39: Profit margin in relation to tariff and treatment. 46
Fig. 40: Profit margin in relation to yield – calculation scenarios (urban area, VA210).
Fig. 41: Profit margin in relation to treatment – calculation scenarios (urban area, VA210).
Listoftables
Tab. 1: Fertilizer mixture according to advice from Azelis. 8 Tab. 2: Irrigation of tomatoes. 8 Tab. 3: Cumulative total number of marketable fruits at different treatments. 31 Tab. 4: Proportion of marketable and unmarketable yield at different treatments.
Tab. 5: Lighting hours, power and energy in the cabinets. 40 Tab. 6 Costs for consumption of energy for distribution and sale of energy. 42 Tab. 7: Variable costs of electricity in relation to yield. 43 Tab. 8: Profit margin of tomatoes at different treatments (urban area, VA210).
IV
37
51
53
34
47
Abbreviations
B boron
Cu cooper DM dry matter yield DS dry substance
E.C. electrical conductivity Fe iron
HPS high-pressure vapour sodium lamps kWh kilo Watt hour
LAI leaf area index
Mo molybdenum
N nitrogen P phosphor pH potential of hydrogen ppm parts per million W Watt Wh Watt hours Zn zinc
Other abbreviations are explained in the text.
V
SUMMARY
In Iceland, winter production of greenhouse crops is totally dependent on supplementary lighting and has the potential to extend seasonal limits and replace imports during the winter months. Adequate guidelines for increasing yield are not yet in place for tomato production and need to be developed. The objective of this study was to test if different varieties, grafting and light intensity are affecting growth, yield and quality of tomatoes and to evaluate the profit margin.
An experiment with tomato (Lycopersicon esculentum Mill. cv. Encore and cv. Diamantino) was conducted from 30.08.2012-06.05.2013 in the experimental greenhouse of the Agricultural University of Iceland at Reykir. Tomatoes were grown in four replicates with 3.13 tops/m2 in pumice under high-pressure vapour sodium lamps (HPS, 240 W/m2) for a maximum of 18 hours light. One chamber was equipped with 4.38 tops/m2 and a high light intensity (300 W/m2). Grafted plants had two tops/plant and one additional top from each other top. Ungrafted plants had one top/plant and one additional top from each other top.
Temperature was kept at 23 °C / 20 °C (day / night) and CO2 was 1,400 ppm in the cabinet with 300 W/m2, but 20-21 °C / 16-17 °C (day / night) and 800 ppm for the cabinets with 240 W/m2. Tomatoes received standard nutrition through drip irrigation. The influence of the variety, grafting and light intensity on growth, yield and quality of tomato was tested and the profit margin calculated.
The choice of the variety did not influence the accumulated marketable yield. However, Diamantino had a higher amount of 1. class fruits than Encore, but also a higher amount of not well shaped fruits. Diamantino showed a lower quality by having a lower sugar content and got lower marks for sweetness, flavour and juiciness in the tasting experiment.
At the beginning of the harvest period was no yield difference between grafted and ungrafted tomatoes. However, later was the positive effect of grafting becoming obvious. After one month harvest increased the marketable yield of grafted tomatoes much more than of ungrafted ones. 70 kg/m2 were reached with grafted Encore, but 60 kg/m2 with ungrafted Encore. This was attributed to more fruits, both 1. and 2. class, whereas there was no difference in the average weight of the fruits.
1 1
Until the middle of the harvest period was less difference in yield between the tested light intensities. However, at the latter part of the harvest period increased yield at the higher light intensity more than at the lower light intensity. At the end of the harvest period were 80 kg/m2 reached with the high light intensity, but 70 kg/m2 with the lower light intensity. This was attributed to more 2. class fruits at the higher light intensity, whereas there was no difference in the average weight of the fruits.
Marketable yield was 81-86 % of total yield. Eight fruits per cluster were counted, but this number was by one fruit lower for grafted Encore at the higher light intensity. Not polluninated fruits were low and about one fruit per cluster, but at the higher light intensity did this number increase to nearly two fruits per cluster.
When ungrafted Encore was replaced by grafted Encore, increased the yield by 10 kg/m2 and profit margin by 3,000 ISK/m2. This means, it is economic to use grafted tomatoes. When the light intensity increased from 240 W/m2 to 300 W/m2 and in addition a higher top density, a higher temperature and CO2 amount was used, increased profit margin only a bit. It is only paying off to increase the light intensity when at least 10 kg/m2 more yield are reached. A higher tariff did not change profit margin. Also, the position of the greenhouse (urban, rural) did not influence profit margin.
Ungrafted tomatoes grow a bit slower and developed slower the next cluster and had shorter leaves compared to grafted tomatoes. The distance between clusters was not influenced by the treatment, but ungrafted plants were lower. Cumulative DM yield (yield of fruits, leaves, shoots) and N uptake was highest for the high light intensity. Varieties are different in yield. Therefore, it is recommended to use a high yielding variety. But, the taste can be quite different and needs therefore also to be considered. The very high increase in energy costs by lighting 60 W/m2 more in addition to more CO2, a higher temperature and more plants, was accompanied by only a 10 kg/m2 yield increase. Therefore it can be only recommended to increase the light intensity in case a much more than 10 kg/m2 higher yield would be reached.
Possible recommendations for saving costs other than lowering the electricity costs are discussed. From an economic viewpoint it is recommended to use grafted tomatoes to be able to get a higher yield and it is not economic to increase light intensity.
2
YFIRLIT
Vetrarræktun í gróðurhúsum á Íslandi er algjörlega háð aukalýsingu. Viðbótarlýsing getur því lengt uppskerutímann og komið í stað innflutnings að vetri til. Fullnægjandi leiðbeiningar vegna ræktunar á tómötum eru ekki til staðar og þarfnast frekari þróunar. Markmiðin voru að prófa, hvort yrki, ágræðsla og ljósstyrkur hefðu áhrif á vöxt, uppskeru og gæði tómatanna og hvort það væri hagkvæmt.
Gerð var tilraun með tómata (Lycopersicon esculentum Mill. cv. Encore og cv. Diamantino) þann 30.08.2012-06.05.2013 í tilraunagróðurhúsi Landbúnaðarháskóla Íslands að Reykjum. Tómatarnir voru ræktaðir í fjórum endurtekningum með 3,13 toppa/m2 í vikri undir topplýsingu frá háþrýsti-natríumlömpum (HPS, 240 W/m2) að hámarki í 18 klst. Í klefanum með hærri ljósstyrk (300 W/m2) var 4,38 toppar/m2 Ágræddir tómatar voru með tvo toppa á plöntu og tekinn var upp aukasproti á annarri hverri. En tómatar á eigin rót voru með einn topp á plöntu og tekinn var upp aukasproti á annarri hverri.
Daghiti með hærri ljósstyrk (300 W/m2) var 23 °C og næturhiti 20°C, CO 2 1400 ppm. Við lægri ljósstyrkinn (240 W/m2) var daghiti 20-21°C og næturhiti 16-17°C, CO 2 800 ppm. Tómatarnir fengu næringu með dropavökvun.
Áhrif yrkja, ágræðslu og ljósstyrks á vöxt, uppskeru og gæði tómatanna var prófaður og framlegð reiknuð út.
Val yrkis hafði ekki áhrif á söluhæfa uppskeru. Fleiri aldin af Diamantino fara í fyrsta flokk en af Encore, en hlutfall illa lagaðra var hærra. Diamantino sýnir einnig minni gæði með lægra sykurmagni og var í bragðprófun með lægri einkunn fyrir sætu, bragðgæði og safa. Í upphafi uppskerutímabils var enginn uppskerumunur á milli ágræddra tómata og tómata á eigin rót. En þegar leið á vaxtartímabilið komu jákvæð áhrif ágræddu tómatanna í ljós. Eftir eins mánaðar uppskeru, jókst uppskera söluhæfra tómata af ágræddum plöntum mun meira en af plöntum á eigin rót. Þannig fengust 70 kg/m2 af ágræddum Encore á móti 60 kg/m2 af Encore á eigin rót. Það kom fram sem fjöldi aldina, bæði í 1. og 2. flokki, meðalþyngd hefur engin áhrif hér á. Hlutfall uppskerunnar sem hægt var að markaðssetja var 81-86 %. Átta aldin fengust af klasa nema fyrir ágrætt Encore á hærri ljósstyrk var um einu aldini færra. Ófrjóvguð
3
aldin voru fá eða um eitt aldin á klasa, en á háum ljósstyrk voru næstum tvö aldin á klasa.
Fram á mitt tímabilið er lítill munur á uppskeru eftir ljósstyrk. Hins vegar jókst uppskera með hærri ljósstyrk á seinni hluta tímabilsins meira en við minna ljósstyrk. Og í lok vaxtartímabils var uppskera með hærri ljósstyrk um 80 kg/m2. Uppskera við minna ljósstyrk var komin í 70 kg/m2. Við hærri ljósstyrk komu fleiri aldin í 2. flokk en meðalþyngd hvers aldins var svipað. Þegar notað er ágrætt Encore í stað Encore á eigin rót, þá jókst uppskera um 10 kg/m2 og framlegð um 3.000 ISK/m2. Það þýðir að hagkvæmara er að nota ágrædda tómata. Með því að auka ljósstyrk úr 240 W/m2 í 300 W/m2 og auka þéttleika, hitastig og CO2 jókst framlegð aðeins örlítið. Það borgar sig eingöngu að auka ljósstyrk þegar fæst að minnsta kosti 10 kg meiri uppskera á m2. Hærri gjaldskrá breytir framlegð næstum ekkert. Það skiptir ekki máli hvort gróðurhús er staðsett í þéttbýli eða dreifbýli, framlegð er svipuð.
Tómatar á eigin rót vaxa svolítið hægar og eru lengur að mynda næsta klasa og voru með styttri laufblöð samanborið við ágrædda tómata. Aðferðin hafði engin áhrif á lengd milli klasa. Þurrefnisuppskera (aldina, laufa, sprota) og upptaka á N, var mest þar sem lýsingin var mest. Almennt eru yrki misuppskerumikil, þess vegna er kostur að velja yrki með góða uppskeru. En bragð getur verið líka mjög breytilegt og þarf líka að skoða. Með því að auka lýsingu um 60 W/m2, nota meira CO2, hærri hita og fjölga plöntum fékkst ekki nema 10 kg/m2 aukning í uppskeru. Hins vegar hækkar orkukostnaður mjög mikið og þess vegna þarf miklu meira en 10 kg/m2 meiri uppskeru ef mæla á með því. Möguleikar til að minnka kostnað, aðrir en að lækka rafmagnskostnað eru ræddir. Frá efnahagslegu sjónarmiði er mælt með því að nota ágrædda tómatar til að fá meiri uppskeru og ekki er hagkvæmt að auka ljósstyrk.
4
INTRODUCTION
The extremely low natural light level is the major limiting factor for winter greenhouse production in Iceland and other northern regions. Therefore, supplementary lighting is essential to maintain year-round vegetable production. This could replace imports from lower latitudes during the winter months and make domestic vegetables even more valuable for the consumer market.
The positive influence of artificial lighting on plant growth, yield and quality of tomatoes (Demers et al., 1998a), cucumbers (Hao & Papadopoulos, 1999) and sweet pepper (Demers et al., 1998b) has been well studied. It is often assumed that an increment in light intensity results in the same yield increase. Indeed, yield of sweet pepper in the experimental greenhouse of the Agricultural University of Iceland at Reykir increased with light intensity (Stadler et al., 2010). However, with tomatoes, a higher light intensity resulted not (Stadler, 2012) or in only a slightly higher yield (Stadler, 2013). Also, a higher stem density was transfered better into yield of sweet pepper at high light intensity (Stadler et al., 2010). Additional research is needed to verify the influence of light intensity together with top density, temperature and CO2
It is very well known that the choice of the variety has a big impact on yield and quality of tomatoes. Varieties with positive results in other northern countries might also give a good yield under icelandic conditions and might be able to replace the standard variety „Encore“. So far, mostly ungrafted plants of „Encore“ are planted. Only in few icelandic nurseries are grafted tomatoes used. However, in the literature is grafting considered as positive (e.g. Pogonyi et al., 2005; Kowalczyk & GajcWolska, 2011). Therefore, the question is, if also in Iceland plants should be grafted. Environmental conditions and the tending strategy are expected to have an impact on the growth of the plants. Plants can be too vegetative or too generative often due to environmental conditions. Plants can be kept in balance or steered back in the required direction by changing light, temperature, humidity, CO2, irrigation, nutrition and plant management. Plants become vegetative in favourable, mild growing conditions and generative in harsh growing conditions. Determining the plant balance requires accurate observation of the plants, which is reached by weekly crop registration (Houter et al., 2007a; Houter et al., 2007b).
Incorporating light intensity, grafting and variety into a production strategy is an economic decision involving added costs versus potential returns. Therefore, the
5 2
question arises whether these factors are leading to an appropriate yield of fruits. Also, the profit margin of the horticultural crop was considered.
The objective of this study was to test if (1) different varieties, grafting and light intensity are affecting growth, yield and quality of tomatoes and the N uptake of the plant, if (2) a higher light intensity is converted efficiently into yield, and if (3) the profit margin can be improved by the choice of the variety, grafting and the amount of light intensity. This study should enable to strengthen the knowledge on the lighting regime and give vegetable growers advice how to improve their tomato production by modifying the efficiency of electricity consumption in lighting.
3 MATERIALSANDMETHODS
3.1 Greenhouseexperiment
An experiment with grafted and ungrafted tomatoes, two different varieties (Lycopersicon esculentum Mill. cv. Encore and cv. Diamantino), two light intensities and top densities was conducted in four cabinets at the Agricultural University of Iceland at Reykir. Seeds of tomatoes were sown on 09.07.2012 (Maxifort) and 23.07.2012 (Encore) in rock wool plugs. On 30.08.2012 four plants (ungrafted tomatoes) respectively two plants with each two tops (grafted tomatoes) were transplanted in 18 l pots filled with pumice stones and transferred to the cabinets with different treatments. Tomatoes were transplanted in rows in four 70 cm high beds (Fig. 1) with 3.13 tops/m2. Beds were equipped with 5 pots respectively 20 tops. However, in the cabinet with the higher light intensity, 4.38 tops/m2 with grafted tomatoes (2 tops/plant) were transplanted and beds were equipped with 7 pots, respectively 28 tops. Four replicates, one replicate in each bed consisting of two pots (8 tops) acted as subplots for measurements. Other pots were not measured. Do to the weekly hanging down, all plants were at least once at the end of the bed.
Wires were placed in about 3.56 m height from the floor with each 90 cm distance between floors and beds. Bumblebees were used for pollination and hives were open from 11.00-14.00. Hives were replaced every two to three weeks.
Different temperatures were used (see chapter “3.2 Treatments”). Carbon dioxide was provided (800 ppm CO2 with no ventilation and 400 ppm CO2 with ventilation, respectively 1,000 ppm CO2 with no ventilation and 500 ppm CO2 with ventilation at
6
Experimental design of cabinets.
received standard
by
7 300 W/m2). A misting system was installed. Plant protection was managed
beneficial organisms and if necessary with insecticides. Klefi 6 30 0,6 m0,9 m0,9 m0,9 m0,9 m0,9 m0,6 m 30 300 W/m2 hærri hiti5,0 m 6,25 m meiri CO2 vikur 4 toppar/m2 DCBA ágrætt 1,0 m 4. rep.3. rep.2. rep.1. rep. Encore Klefi 5 30 0,6 m0,9 m0,9 m0,9 m0,6 m 30 240 W/m2 vog5,0 m 6,25 m Encore vikur 3 toppar/m2 DCBA ágrætt 1,0 m 4. rep.3. rep.2. rep.1. rep. 240 W/m2 Klefi 4 30 0,6 m0,9 m0,9 m0,9 m0,9 m0,9 m0,6 m 30 240 W/m2 5,0 m 6,25 m Encore vikur 3 toppar/m2 DCBA á eigin rót 1,0 m 4. rep.3. rep.2. rep.1. rep. 240 W/m2 Klefi 3 30 0,6 m0,9 m0,9 m0,9 m0,9 m0,9 m0,6 m 30 240 W/m2 5,0 m 6,25 m Diamentino vikur 3 toppar/m2 DCBA á eigin rót 1,0 m 4. rep.3. rep.2. rep.1. rep. 240 W/m2 10,0 m pottar með plöntunar á eigin rót 4 plöntunar á pottin og tekinn upp aukasproti á annarri hverri pottar með agrættar plöntunar 2 plöntunar á póttin með 2 toppum á plöntunar og tekinn aukasproti á hverjum topp Shelter belt Shelter belt Shelter belt Shelter belt Shelter belt Shelter belt Shelter belt Shelter belt N Fig. 1:
Tomatoes
nutrition consisting of “Pioner Basis 6-4-30 + Mg” (AZELIS) according to the following fertilizer plan (Tab. 1):
Tab. 1: Fertilizer mixture according to advice from Azelis. Stem solution A (1000 l)
Fertilizer (amount in kg)
Stem solution B (1000 l)
Irrigation water Runoff water
Calcium nitrate Nitrogen acid Pioner Basis 6-4-30 + Mg Magnesium sulphate Pioner Iron Chelate EDDHA 6 % Resistim (as required) E.C. (mS/cm) pH pH
Planting – flower ing on 3. truss 100 as required 10012.5 10 2.6-3.25.2-5.55.7-5.9
Flowering on 3. truss – topping 100 as required 125 0,5 10-202.4-3.05.2-5.55.7-5.9
Topping – end 75 as required 125 0,5 10-202.4-3.05.2-5.55.7-5.9
Plants were irrigated through drip irrigation (4 tubes per bucket). Irrigation differed in cabinets (Tab. 2). Numbers for “time of irrigation”, “duration between irrigations” and “duration of irrigation” are not available, because it was not written down from the personal that was daily taking care of the tomatoes
Tab. 2: Irrigation of tomatoes.
Group Time of irrigation Duration between irrigations
Duration of irrigation Number of irrigations 05.30-21.30 min min Watering in “240 HPS, Diamantino”
05.09.12-21.09.12 10 22.09.12-27.09.12 24 28.09.12-24.10.12
25.10.12-04.11.12
05.11.12-07.11.12
08.11.12-31.12.12
01.01.13-02.02.13
03.02.13-28.02.13
01.03.13-04.03.13
05.03.13-31.03.13
01.04.13-06.05.13
8
30
31
35
39
31
32
31
34
Tab. 2: Irrigation of tomatoes (continuation) Group
Time of irrigation Duration between irrigations
Duration of irrigation Number of irrigations
05.30-21.30 min min
Watering in “240 HPS, ungrafted Encore” 05.09.12-14.09.12 10 15.09.12-31.09.12 24 01.10.12-24.10.12 30 25.10.12-03.11.12 31 04.11.12-07.11.12 35 08.11.12-30.11.12 39 01.12.12-31.12.12 34 01.01.13-03.01.13 31 04.01.13-31.01.13 35 01.02.13-28.02.13 32 01.03.13-03.03.13 31 04.03.13-31.03.13 35 01.04.13-06.05.13
Watering in “240 HPS, grafted Encore” 05.09.12-06.05.13 Wateringbyscale 10-45
Watering in “300 HPS, grafted Encore” 05.09.12-20.09.12 10 21.09.12-31.09.12 24 01.10.12-24.10.12 30 25.10.12-03.11.12 31 04.11.12-07.11.12 35 08.11.12-12.11.12 39 13.11.12-31.12.12 34 01.01.13-03.01.13 31 04.01.13-31.01.13 35 01.02.13-04.02.13 31 05.02.13-08.02.13 35 09.02.13-28.02.13 32 01.03.13-03.03.13 31 04.03.13-31.03.13 35 01.04.13-06.05.13
9
3.2 Treatments
Tomatoes were grown until 06.05.2013 under high-pressure sodium lamps (HPS) for top lighting at different light intensities and top densities in four cabinets at the Agricultural University of Iceland in Reykir:
1. HPS top lighting 300 W/m2 + high top density + grafted Encore + high temperature + high CO2; light: 18 h, reduced to 16 h on 15.11; 23 °C / 20 °C (day / night); 1,000 ppm CO2 300 HPS, grafted Encore
2. HPS top lighting 240 W/m2 + low top density + grafted Encore + watering with a scale; light: 18 h, reduced to 16 h on 14.12; 21 °C / 16 °C (day / night); 800 ppm CO2 240 HPS, grafted Encore
3. HPS top lighting 240 W/m2 + low top density + ungrafted Encore; light: 18 h, reduced to 14 h on 30.11, increased to 16 h on 09.01; 20 °C / 16 °C (day / night); 800 ppm CO2 240 HPS, ungrafted Encore
4. HPS top lighting 240 W/m2 + low top density + ungrafted Diamantino; light: 18 h, reduced to 16 h on 09.01; 21°C / 17°C (day / night); 800 ppm CO 2 240 HPS, Diamantino
HPS lamps for top lighting (600 W bulbs) were mounted horizontally over the canopy. Light (240 W/m2) was provided for 0-18 hours, depending on solar irradiation and age of plants (1-4). For the highest light intensity (300 W/m2) a higher temperature (23 °C / 20 °C) and higher CO 2 (1,000 ppm) was chosen (1), because the optimal temperature is increasing with light intensity (Dorais, 2003). The other chambers (2-4) received 240 W/m2 and 20-21 °C / 16-17 °C (day / night) and 800 ppm CO2.
The lamps were automatically turned off when incoming illuminance was above the desired set-point.
In the cabinet with the scale (2) the runoff was measured each three hours. The scale was connected to the computer and it was watered according to the measurements of the runoff.
In all cabinets ten plants were measured weekly and regarding the growth (vegetative/generative) it was acted on environmental factors and tending strategies.
10
3.3 Measurements,samplingandanalyses
Soil temperature was measured once a week and air temperature and irradiation (subdivided between vertical and horizontal irradiation) manually monthly at different vertical heights above ground (0 m, 0.5 m, 1.0 m, 1.5 m, 2.0 m) close to the plant under diffuse light conditions.
The amount of fertilization water (input and runoff) was measured every day and regularly analyzed for nutrients.
To be able to determine plant development, the height of plants was measured each week and the number of clusters was counted and the distance of clusters measured. Further weekly measurements include diameter of head, length growth, leaf length, flowering cluster, total fruit on plant per stem, highest cluster and harvested cluster.
Yield (fresh and dry biomass) of seedlings and their N content was analyzed. During the growth period, fruits were regularly collected (2-3 times per week) in the subplots.
Total fresh yield, number of fruits, fruit category (A-class (> 55 mm), B-class (45-55 mm) and not marketable fruits (too little fruits (< 45 mm), fruits with blossom end rot) was determined. Additional samplings included samples from pruning during the growth period. Plants were topped at the 13.03.2013. At the end of the growth period on each plant from the subplots the number of immature fruits was counted. The aboveground biomass of these plants was harvested and divided into immature green fruits and shoots. For all plant parts, fresh biomass weight was determined and subsamples (three times for stripped leaves, fruits) were dried at 105 °C for 24 h for total dry matter yield (DM). Dry samples were milled and N content was analyzed according to the DUMAS method (varioMax CN, Macro Elementar Analyser, ELEMENTAR ANALYSENSYSTEME GmbH, Hanau, Germany) to be able to determine N uptake from tomatoes.
The interior quality of fruits was determined. A brix meter (Pocket Refractometer PAL-1, ATAGO, Tokyo, Japan) was used to measure sugar content in fruits at the beginning, in the middle and at the end of the growth period. From the same harvest, the flavour of fresh fruits was examined in tasting experiments with untrained assessors.
Energy use efficiency (total cumulative yield in weight per kWh) and costs for lighting per kg yield were calculated for economic evaluation.
11
3.4 Statisticalanalyses
SAS Version 9.2 was used for statistical evaluations. The results were subjected to one-way analyses of variance with the significance of the means tested with a Tukey/Kramer HSD-test at p ≤ 0,05.
4 RESULTS
4.1 Environmentalconditionsforgrowing
4.1.1 Solar irradiation
Solar irradiation was allowed to come into the greenhouse. Therefore, incoming solar irradiation is affecting plant development and was regularly measured. The natural light level decreased after transplanting into the cabinets continuously to < 5 kWh/m2 and was staying at this value to the beginning of March 2013. However, with longer days solar irradiation increased naturally continuously to > 10 kWh/m2 at the beginning of April 2013 (Fig. 2).
Fig. 2: Time course of solar irradiation. Solar irradiation was measured every day and values for one week were cumulated.
12
4.1.2
Illuminance and air temperature
Illuminance is the total luminous flux incident on a surface, per unit area. In the case of the tomato experiment solar irradiation was allowed to come into the greenhouse and therefore, illuminance and air temperature is composed of solar irradiation and irradiation of HPS lamps and adjusted air temperature in the cabinets and heat of HPS lamps. To eliminate the incoming solar radiation and the outside temperature, illuminance and air temperature were measured early in the morning during cloudy days.
The measured values for illuminance and air temperature are converted into colours (red for high illuminance / air temperature, yellow and white for low illuminance / air temperature). Naturally, with higher light intensity, illuminance and air temperature rose. Highest values were measured close to the lamps (Fig. 3).
Illuminance (klux)
Lighting treatment (W/m2)
Hight above ground
between two plants near the plant
Air temperature (°C)
at the end of the bed
between two plants near the plant
at the end of the bed
240 HPS, Diamantino2,0 °C 1,5 32,6-60,0 1,0 30,1-32,5 0,5 27,5-30,0 0,0 25,1-27,5 22,6-25,0
240 HPS, ungrafted Encore2,0 20,1-22,5 1,5 15-20,0 1,0 0,5 0,0 klux 30,1 99
240 HPS, grafted Encore2,0 25,1 30 1,5 20,1 25 1,0 15,1 20 0,5 10,1 15 0,0 5,1 10 0 5
300 HPS, grafted Encore2,0 1,5 1,0 0,5 0,0
Fig. 3: Illuminance (solar + HPS lamps) and air temperature at different treatments. Illuminance and air temperature was measured early in the morning at a cloudy day.
13
4.1.3 Soil temperature
Soil temperature was measured weekly at low solar radiation in the morning (at about 08.30) and was mainly influenced by the light intensity. Soil temperature stayed most of the time between 20-23°C (Fig. 4). Naturally, the soil temperature of the highest light intensity “300 HPS, grafted Encore” was most of the time highest.
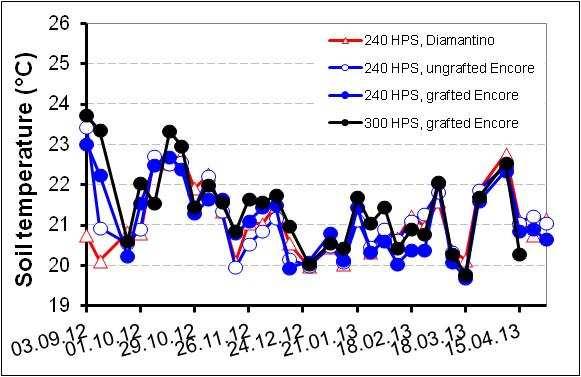
Fig. 4: Soil temperature at different treatments. The soil temperature was measured at little solar irradiation early in the morning.
4.1.4 Irrigation of tomatoes
The amount of applied water increased with grafting (about 10 % increase). In addition, a higher light intensity (and top density) was going ahead with a higher amount of applied water (Fig. 5).
By calculating the daily applied water rate per months it is getting more obvious that a higher light intensity and top density is going ahead with a higher use of water.
Also, the differences between grafted and ungrafted tomatoes are getting more obvious. Diamantino seem to need less water than Encore (Fig. 6).
14
Fig. 5: Daily applied water at different treatments.
Fig. 6: Average daily applied water at different treatments.
E.C. and pH of irrigation water was fluctuating much (Fig. 7 a, b). E.C. of applied water ranged most of the time between 2.5 and 3.5 and pH between 5.0 and 6.5.
15
Fig. 7: E.C. (a, c) and pH (b, d) of irrigation water (a, b) and runoff of irrigation water (c, d).
1 6
E.C. of runoff stayed mostly between 3.0 and 5.5. The pH of runoff decreased during the growth period from about 6.5 to 4.5-6.5 and seems to be lower at the higher light intensity (Fig. 7 c, d).
The amount of runoff from applied irrigation water was about 20-40 % (Fig. 8).
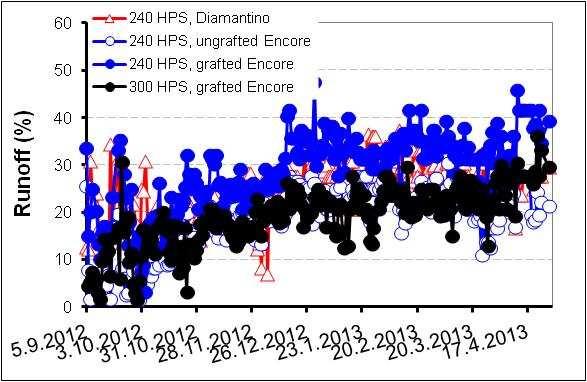
Fig. 8: Proportion of amount of runoff from applied irrigation water at different treatments.
Monthly taken water samples from the drip and the runoff water provide an information basis on which nutrients are close to the target of the drain water. During the whole time of the experiment, all chambers showed a high Cu content. At the beginning of November, all chambers showed also a high B content and the Fe content was increased in “240 HPS, ungrafted Encore” and “240 HPS, grafted Encore” and the Zn content was increased in “240 HPS, ungrafted Encore”. At the beginning of December, the Fe content and Zn content was still the same as one month earlier and in addition “300 HPS, grafted Encore” showed also a high Fe and Zn content. In January, all chambers showed beside a high Cu content also a high Fe and Zn content. In “240 HPS, Diamantino” also the Mo content was increased. At the middle of February, only “300 HPS, grafted Encore” had a high B and Zn content, and Fe content was increased also in chamber ”240 HPS, ungrafted Encore”. All chambers except “240 HPS, Diamantino” had a high P content (data not shown).
17
Plants took up to 10 l/m2 with 240 W/m2 and up to 15 l/m2 with 300 W/m2 for grafted tomatoes (Fig. 9). Fig. 9: Water uptake at different treatments.
4.2 Developmentoftomatoes
4.2.1 Height
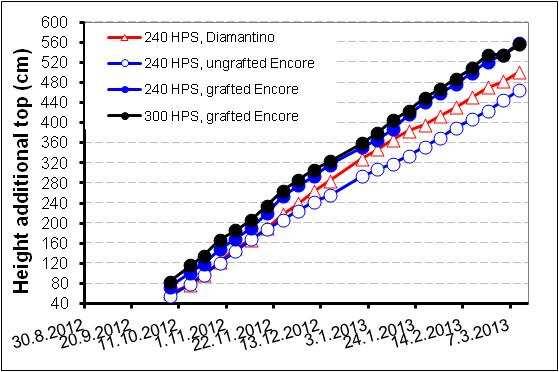
Tomato plants were growing about 2-4 cm per day and reached at the end of the experiment about 5.5-6.5 m (Fig. 10). Also, the additional top was growing about 2-4 cm per day and reached at the end of the experiment about 4.5-5.5 m. The ungrafted plants grow slightly slower than the grafted ones. Diamantino was growing faster than Encore.
18
Fig. 10: Height of tomatoes at different treatments.
4.2.2 Number of clusters
The number of clusters increased with approximately one additional cluster per week. Grafted plants developed faster a new cluster and especially at a higher light
19
intensity the number of clusters was increased (Fig. 11). There were no differences in the number of clusters between the two varieties observed.
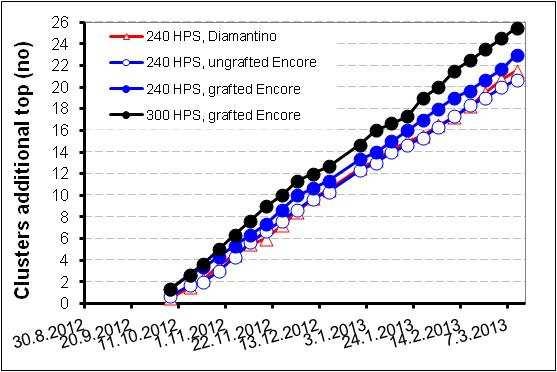
Fig. 11: Number of clusters at different treatments.
20
4.2.3
Distance between clusters
The distance between clusters was regularly measured and stayed most of the time between 16-26 cm (average of chambers: 20-22 cm) with no differences between treatments (Fig. 12).
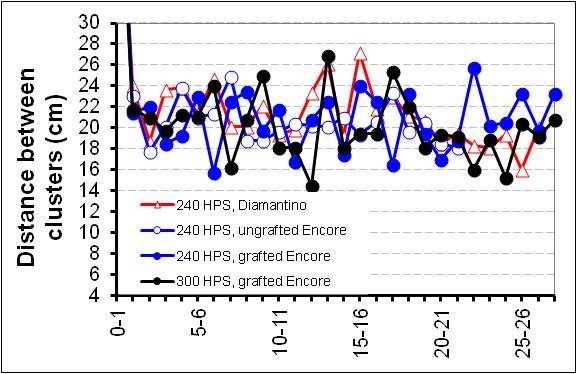
Fig. 12: Average distance between clusters at different treatments.
21
Fruits and not pollinated fruits per cluster fluctuated much (Fig. 13, Fig. 14).
HPS, Diamantino
HPS, ungrafted Encore
HPS, grafted Encore
HPS, grafted Encore
HPS, Diamantino
HPS, ungrafted Encore
HPS, grafted Encore
HPS, grafted Encore
Fig. 13: Fruits per cluster at different treatments.
Fruits per cluster amounted mostly between 6-10. In average, plants with the highest light intensity had less fruits per cluster (about 7) whereas the other treatments had about 8 fruits (Fig. 13). Most not pollinated fruits (around 2 fruits) were detected in
22
0 2 4 6 8 10 12 14 13579111315171921232527293133 Cluster (no) Fruits per cluster (no) 240
240
240
300
∅ ∅∅ ∅ 8,1 8,0 8,2 7,1 0 2 4 6 8 10 12 14 13579111315171921232527 Cluster (no) Fruits per cluster (no) additional top 240
240
240
300
∅ ∅∅ ∅ 7,4 7,1 8,1 6,9
the cabinet with the highest light intensity and top density whereas this number was lower (around 1 or less than 1 fruit) for the other treatments (Fig. 14).
fruits
240 HPS, Diamantino
240 HPS, ungrafted Encore
HPS, grafted Encore
HPS, grafted Encore
fruits per
top
240 HPS, Diamantino
240 HPS, ungrafted Encore 240 HPS, grafted Encore 300 HPS, grafted Encore
Fig. 14: Not pollinated fruits per cluster at different treatments.
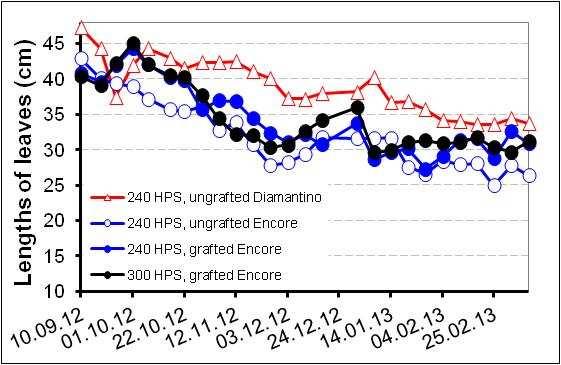
Lengths of leaves decreased until the end of the experiment from about 40-45 cm to 25-35 cm. Diamantino had in average about 7 cm longer leaves than Encore.
23
0 2 4 6 8 10 12 14 13579111315171921232527293133 Cluster (no) Not pollinated
per cluster (no)
240
300
∅ ∅∅ ∅ 0,7 1,2 0,9 1,7 0 2 4 6 8 10 12 14 13579111315171921232527 Cluster (no) Not pollinated
cluster (no) additional
∅ ∅∅ 0,5 1,1 0,7 1,8
Grafting increased the lengths of the leaves slightly. A higher light intensity had nearly no effect on the lengths of the leaves (Fig. 15).
Fig. 15: Length of leaves at different treatments.
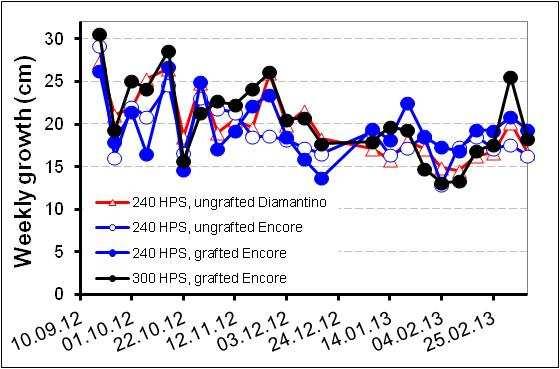
Fig. 16: Weekly growth at different treatments.
24
There was no difference in the weekly growth of tomatoes; all treatments were growing each week in average 19.0-20.5 cm (Fig. 16).
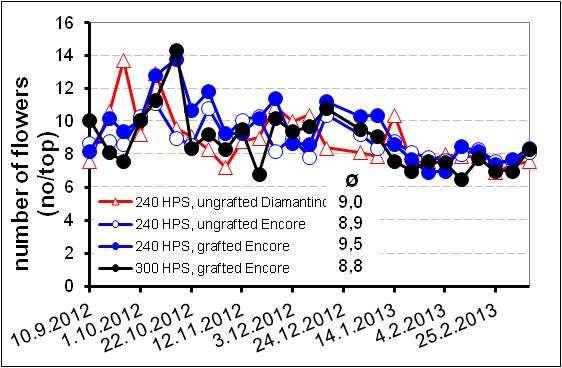
The number of flowers increased with grafting (compare “240 HPS, ungrafted Encore” with “240 HPS, grafted Encore”) and decreased at a higher light intensity (compare “240 HPS, grafted Encore” with “300 HPS, grafted Encore”) (Fig. 17).
Fig. 17: Number of flowers at different treatments.
Stem diameter was varying very much from 0.4 to 1.7 cm and was highest for grafted Encore plants und ungrafted Diamantino (average about 0.9 cm), whereas ungrafted Encore had a thinner stem (average about 0.8 cm) (Fig. 18).
25
Fig. 18: Stem diameter and weekly growth at different treatments.
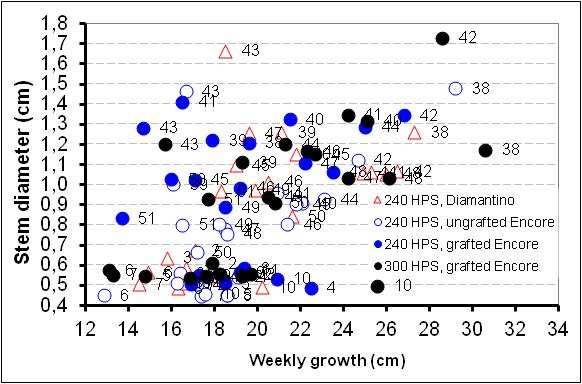
Numbers are representing the week number.
Fig. 19: Stem diameter and quotient lengths to top and stem diameter at different treatments.
Numbers are representing the week number.
26
Ungrafted Encore had in average a higher quotient of “lengths to top to stem diameter” (about 22) compared to the other treatments (about 20) (Fig. 19). All treatments were getting more “little vegetative” with longer growing period.
4.3 Yield
4.3.1 Total yield of fruits
The yield of tomatoes included all harvested red fruits at the end of the growth period. The fruits were classified in 1. class (> 55 mm), 2. class (45-55 mm) and not marketable fruits (too little fruits (< 45 mm), fruits with blossom end rot, flawed, cracked and not well shaped fruits).
Cumulative total yield of tomatoes ranged between 72-100 kg/m2 (Fig. 20). A higher
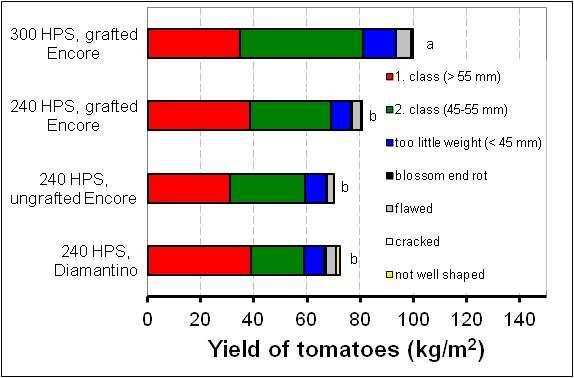
light intensity and top density increased total yield. Also, grafting increased tendentially total yield. There were no variety differences in total yield (Fig. 20).
Fig. 20: Cumulative total yield at different treatments. Letters indicate significant differences at the end of the experiment (HSD, p ≤ 0,05).
27
4.3.2 Marketable yield of fruits
At the beginning of the harvest period no yield differences between grafted and ungrafted tomatoes were observed. However, with longer growing period the positive effect of grafting was becoming obvious and after one month harvest, yield of grafted tomatoes increased more than with ungrafted tomatoes and therefore, at the end of the harvest period was yield significantly higher with grafted tomatoes than with ungrafted ones (Fig. 21).
marketable yield (kg/m
HPS, ungrafted
HPS, grafted Encore
21: Time course of accumulated marketable yield (1. and 2. class fruits) with grafted and ungrafted tomatoes. Letters indicate significant differences at the end of the experiment (HSD, p ≤ 0,05).
Accumulated yield was until the middle of the growth period quite similar between the tested light intensities. However, in the second half of the harvest period increased yield at the high light intensity more than at the lower light intensity and at the end of the harvest period was accumulated yield significantly higher at the higher light intensity compared to the lower light intensity (Fig. 22).
28
Fig.
0 10 20 30 40 50 60 70 80 15.10.1212.11.1210.12.127.1.134.2.134.3.131.4.1329.4.13Accumulated
2 ) 240
Encore 240
a b
marketable yield
240 HPS,
HPS, grafted Encore
Fig. 22: Time course of accumulated marketable yield (1. and 2. class fruits) of grafted Encore with different light intensities. Letters indicate significant differences at the end of the experiment (HSD, p ≤ 0,05).
No variety differences in accumulated marketable yield were calculated (Fig. 23).
HPS, Diamantino
marketable
HPS, ungrafted Encore
Fig. 23: Time course of accumulated marketable yield (1. and 2. class fruits) with the different varieties Encore and Diamantino. Letters indicate significant differences at the end of the experiment (HSD, p ≤ 0,05).
29
0 10 20 30 40 50 60 70 80 15.10.1212.11.1210.12.127.1.134.2.134.3.131.4.1329.4.13Accumulated
yield (kg/m 2 ) 240
240
a a 0 10 20 30 40 50 60 70 80 15.10.1212.11.1210.12.127.1.134.2.134.3.131.4.1329.4.13Accumulated
(kg/m 2 )
grafted Encore 300
a b
At the beginning of the harvest period, all treatments had a high 1. class yield. However, in December decreased 1. class yield (Fig. 24) and increased 2. class yield (Fig. 25) and thus, decreasing the proportion of 1. class yield on total yield.
Accumulated marketable yield
class (kg/m
240 HPS, Diamantino
HPS, ungrafted Encore
HPS, grafted Encore
HPS, grafted Encore
Fig. 24: Time course of marketable 1. class yield at different treatments. Letters indicate significant differences at the end of the experiment (HSD, p ≤ 0,05).
marketable yield
class (kg/m
HPS, Diamantino
HPS, ungrafted Encore 240 HPS, grafted Encore
HPS, grafted Encore
Fig. 25: Time course of marketable 2. class yield at different treatments. Letters indicate significant differences at the end of the experiment (HSD, p ≤ 0,05).
30
a a a a 0 5 10 15 20 25 30 35 40 45 50 15.10.1212.11.1210.12.127.1.134.2.134.3.131.4.1329.4.13
1.
2 )
240
240
300
b b c a 0 5 10 15 20 25 30 35 40 45 50 15.10.1212.11.1210.12.127.1.134.2.134.3.131.4.1329.4.13Accumulated
2.
2 ) 240
240
300
Weekly harvest of first class fruits increased until the middle of November to 2-3 kg/m2, but decreased thereafter and stayed at about 1-2 kg/m2 until the end of December and decreased to 0.5-1.3 kg/m2 before yield increased again at the end of the harvest period (Fig. 26).
Marketable yield 1. class (kg/m
HPS, Diamantino
HPS, ungrafted Encore
HPS, grafted Encore
HPS, grafted Encore
Fig. 26: Time course of marketable yield at different treatments.
Number of 1. class fruits was lowest for ungrafted Encore whereas there were only small differences between the other treatments (Tab. 3). The total number of marketable fruits was higher for grafted fruits and here especially at the higher light intensity and top density. The number of 2. class fruits was quite low for Diamantino. Tab. 3: Cumulative total number of marketable fruits at different treatments.
Lighting regime
HPS, Diamantino
HPS, ungrafted Encore
HPS, grafted Encore
HPS, grafted Encore
of marketable fruits
31
0,0 0,5 1,0 1,5 2,0 2,5 3,0 3,5 15.10.1212.11.1210.12.12 7.1.13 4.2.134.3.13 1.4.1329.4.13
2 ) 240
240
240
300
Number
1. class 2. class 240
376 284 240
302 386 240
386 415 300
357 626
Average fruit size of first class tomatoes was varying between 85-120 g / fruit (Fig. 27). Diamantino had even a higher fruit size at the beginning of the harvest period, but decreased to the value of the other treatments. It seems that grafted tomatoes had slightly smaller fruits, especially with a higher light intensity (300 W/m2) and top density.
Average weight of tomatoes 1. class (g/fruit)
HPS, Diamantino
HPS, ungrafted Encore
HPS, grafted Encore
HPS, grafted Encore
Fig. 27: Average weight of tomatoes (1. class fruits) at different treatments.
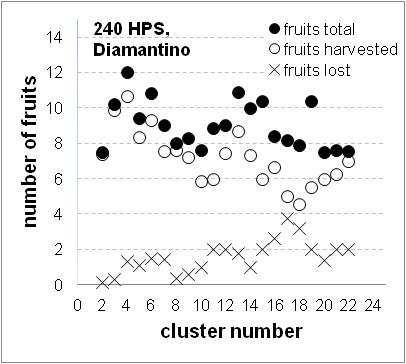
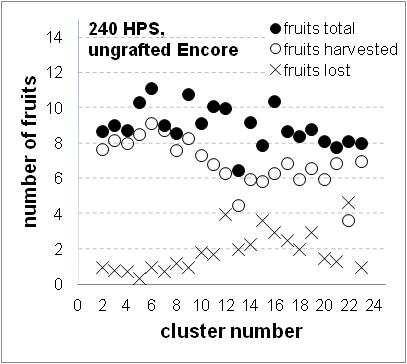
To observe the success of flowering until harvest, the flowering was classified and the number of “fruits total” (fruits that were supposed to be harvested later) was registered. When a cluster was harvested, the total number of “fruits harvested” was counted. The number of “lost fruits” is marking the difference between the number of fruits that were registered at flowering (fruits total) and the number of harvested fruits. “Lost fruits” might have been aborted or did not develop well and stayed small. The number of lost fruits was in average slightly higher when Encore was grafted compared to ungrafted Encore. Much light had a negative influence on the number of fruits, in average 0.7 more “lost fruits” were counted (Fig. 28).
32
75 80 85 90 95 100 105 110 115 120 125 130 135 140 145 150 14.10.1211.11.129.12.12 6.1.13 3.2.13 3.3.1331.3.1328.4.13
240
240
240
300
Ø 101 100 98 96
4.3.3 Outer quality of yield
Marketable yield was about 81-86 %. Marketable yield was lowest with the highest light intensity and top density due to a high amount of flawed and cracked fruits and with Diamantino due to a high amount of flawed and not well shaped fruits.
Diamantino had more 1. class fruits compared to the other treatments, while Encore had a high proportion of 2. class fruits (Tab. 4).
33
Fig. 28: Number of fruits at setting and harvest at different treatments.
Tab. 4: Proportion of marketable and unmarketable yield at different treatments.
Treatments
Marketable yield
yield
4.3.4 Interior quality of yield
4.3.4.1 Sugar content
Sugar content of tomatoes was measured three times during the harvest period and varied between 3.4 and 4.9. Diamantino had always lower sugar content than Encore. Ungrafted Encore seems to have slightly higher sugar content than grafted tomato plants. With increasing solar irradiation increased sugar content in all treatments (Fig. 29).
HPS, Diamantino
HPS, ungrafted Encore
HPS, grafted Encore
HPS, grafted Encore
Fig. 29: Sugar content of fruits at different treatments. Letters indicate significant differences at the end of the experiment (HSD, p ≤ 0,05).
34
Unmarketable
1. class 2. class too little weight blossom endrot flawedcrackednotwell shaped 240HPS,Diamantino 53 28 11 1 5 0 2 240HPS,ungraftedEncore44 40 11 1 4 0 0 240HPS,graftedEncore 48 38 10 0 4 0 0 300HPS,graftedEncore 35 46 12 0 5 1 0
b b b a a a a b b a ab a 3,0 3,5 4,0 4,5 5,0 12.11.12 10.12.12 7.1.13 4.2.13 4.3.13 1.4.13 29.4.13 Sugar content of fruits (°BRIX) 240
240
240
300
4.3.4.2
Taste of fruits
Sweetness (marks: 10 = very good, 1 = fail)
240HPS,Diamantino
Flavor (marks: 10 = very good, 1 = fail)
240HPS,ungraftedEncore 240HPS,graftedEncore 300HPS,graftedEncore 5,0 5,5 6,0 6,5 7,0 7,5 8,0 8,5 12.11.201210.12.20127.1.20134.2.20134.3.20131.4.201329.4.2013
240HPS,Diamantino 240HPS,ungraftedEncore 240HPS,graftedEncore 300HPS,graftedEncore 5,0 5,5 6,0 6,5 7,0 7,5 8,0 8,5
Juiciness (marks: 10 = very good, 1 = fail)
240HPS,Diamatino
240HPS,ungraftedEncore 240HPS,graftedEncore 300HPS,graftedEncore
The taste of tomatoes, subdivided into sweetness, flavour and juiciness was tested by untrained assessors at the beginning (12.12.2012), middle (14.01.2013) and at the end (08.04.2013) of the harvest period. The rating within the same sample was varying very much and therefore, same treatments resulted in a high standard deviation. However, it was obvious that Diamantino was much lower rated in taste, sweetness, flavour and juiciness than Encore. No obvious differences between grafted and ungrafted tomatoes were detected during tasting (Fig. 30). 5,0 5,5 6,0 6,5 7,0 7,5 8,0 8,5 12.11.201210.12.20127.1.20134.2.20134.3.20131.4.201329.4.2013
12.11.201210.12.20127.1.20134.2.20134.3.20131.4.201329.4.2013
Fig. 30: Sweetness, flavour and juiciness of fruits at different treatments.
4.3.4.3 Dry substance of fruits
Dry substance (DS) of fruits was measured three times during the harvest period. DS increased slightly during the harvest period from 4.6-4.9 % to 5.2-5.6 %. Grafted tomatoes had a lower dry substance content than ungrafted ones. It was observed a higher content for Encore than for Diamantino (Fig. 31).
35
240 HPS, Diamantino
240 HPS, ungrafted Encore
240 HPS, grafted Encore
HPS, grafted Encore
Fig. 31: Dry substance of fruits at different treatments.
Nitrogen content of fruits
N content of fruits was measured three times and decreased slightly with longer harvest period and varied between 1.8-2.4 % (Fig. 32).
240 HPS, Diamantino
240 HPS, ungrafted Encore
240 HPS, grafted Encore
300 HPS, grafted Encore
Fig. 32: N content of fruits at different treatments.
36 4,5 4,6 4,7 4,8 4,9 5,0 5,1 5,2 5,3 5,4 5,5 5,6 5,7 21.11.12 19.12.12 16.1.13 13.2.13 13.3.13 DS (%)
300
4.3.5.4
0,0 0,5 1,0 1,5 2,0 2,5 3,0 12.11.12 10.12.12 7.1.13 4.2.13 4.3.13 1.4.13N content of red fruits (%)
4.3.5 Dry matter yield of stripped leaves
During the growth period, leaves were regularly taken off the plant and the cumulative DM yield of these leaves was determined. Diamantino had a higher dry matter yield of stripped leaves than the variety Encore and grafted plants had a higher value than ungrafted ones. A higher top density and light intensity increased also the DM yield of stripped leaves (Fig. 33).
yield of stripped leaves (g/m
Fig. 33: Dry matter yield of stripped leaves at different treatments. Error bars indicate standard deviations and are contained within the symbol if not indicated.
4.3.6 Cumulative dry matter yield
The cumulative DM yield included all harvested red fruits, the immature fruits at the end of the growth period, the stripped leaves during the growth period and the shoots. The cumulative DM yield was highest in the chamber with the highest light intensity and top density. Cumulative DM yield increased with grafting of tomatoes. No variety differences in cumulative DM yield were observed (Fig. 34). The ratio fruits to “shoots + leaves” was more than 70 %, with no differences between treatments.
37
0 100 200 300 400 500 600 700 800 240HPS,Diamantino240HPS,ungraftedEncore240HPS,graftedEncore300HPS,graftedEncoreDM
2 )
Cumulative dry matter yield (g/m
fruits leaves shoots
240 HPS, Diamantino 240 HPS, ungrafted
240 HPS, grafted
Fig. 34: Cumulative dry matter yield at different treatments.
4.4 Nitrogenuptake
HPS, Encore
The cumulative N uptake included N uptake of all harvested fruits, the immature fruits at the end of the growth period, the stripped leaves during the growth period and the shoots. The fruits contributed much more than the leaves and shoots to the cumulative N uptake (Fig. 35). The N uptake of the variety Diamantino was higher than of Encore. Grafting increased the N uptake and an additional N uptake could be reached with a higher light intensity together with a higher top density.
38 0 1000 2000 3000 4000 5000 6000
Encore
Encore 300
2 )
fruits leaves shoots
N uptake (g N/m
Fig. 35: Cumulative N uptake of tomatoes.
4.5 Economics
4.5.1 Lighting hours
The number of lighting hours is contributing to high annual costs and needs therefore special consideration in order to find the most efficient lighting treatment to be able to decrease lighting costs per kg marketable yield.
The total hours of lighting during the growth period of tomatoes were both simulated and measured with dataloggers. Values were calculated for 300 W/m2 according to the measurements obtained with the lower light intensity.
The simulated value was calculated according to the lighting hours written down. However, there it was not adjusted for automatic turn off, when incoming solar radiation was above a set-point (Tab. 5). The calculation of the power was higher for the measured values than for the simulated ones, because lights at the outer beds were also partly contributing to lighten the shelter belt. For calculation of the power, different electric consumptions were made, because the actual consumption is higher than the nominal value of the bulb: one was based on the power of the lamps (nominal Watts, 0 % more power consumption), one with 6 % more power consumption and one for 10 % more power consumption.
39 0 20 40 60 80 100 120 140 240 HPS, Diamantino 240 HPS, ungrafted Encore 240 HPS, grafted Encore 300 HPS, Encore
2 )
Tab. 5: Lighting hours, power and energy in the cabinets.
Treatment
240 HPS, Diamantino
Hours Power Energy Energy/m2 h W kWh kWh/m2
Measured values 3,314 291 50,361 1,007
Simulated values
0 % more power consumption (nominal) 3,930 240 47,160 943
6 % more power consumption 3,930 254 49,990 1,000
10 % more power consumption 3,930 264 51,876 1,038
240 HPS, ungrafted Encore
Measured values 3,964 291 48,188 964
Simulated values
0 % more power consumption (nominal) 3,744 240 44,928 899
6 % more power consumption 3,744 254 47,624 952
10 % more power consumption 3,744 264 49,421 988
240 HPS, grafted Encore
Measured values 4,041 293 49,394 928
Simulated values
0 % more power consumption (nominal) 3,868 240 46,416 984
6 % more power consumption 3,868 254 49,201 1,021
10 % more power consumption 3,868 264 51,058 1,226
300 HPS, grafted Encore
Measured values 4,807 366 61,284 1,226
Simulated values
0 % more power consumption (nominal) 3,807 300 57,105 1,142
6 % more power consumption 3,807 318 60,531 1,211
10 % more power consumption 3,807 330 62,816 1,256
4.5.2 Energy prices
Since the application of the electricity law 65/2003 in 2005, the cost for electricity has been split between the monopolist access to utilities, transmission and distribution and the competitive part, the electricity itself. Most growers are, due to their location, mandatory customers of RARIK, the distribution system operator (DSO) for most of Iceland except in the Southwest and Westfjords (Eggertsson, 2009).
RARIK offers basically three types of tariffs:
a) energy tariffs, for smaller customers, that only pay fixed price per kWh,
b) “time dependent” tariffs (þrígjaldstaxti) with high prices during the day and winter but much lower during the night and summer, which mostly suites customers with electrical heating, but seem to be restricting for growers, and
c) demand based tariffs (afltaxti), for larger users, who pay according to the maximum power demand (Eggertsson, 2009).
40
In the report, only afltaxti is used as the two other types of tariffs are not economic. Since 2009, RARIK has offered special high voltage tariffs (“VA410” and “VA430”) for large users, that must either be located close to substation of the transmission system operator (TSO) or able to pay considerable upfront fee for the connection.
Costs for distribution are divided into an annual fee and costs for the consumption based on used energy (kWh) and maximum power demand (kW) respectively the costs at special times of usage. The annual fee is pretty low for “VA210” and “VA230” when subdivided to the growing area and is therefore not included into the calculation. However, the annual fee for “VA410” and “VA430” is much higher.
Growers in an urban area in “RARIK areas” can choose between different tariffs. In the report only the possibly most used tariffs “VA210” and “VA410” in urban areas and “VA230” and “VA430” in rural areas are considered.
The government subsidises the distribution cost of growers that comply to certain criteria’s. Currently 76.4 % and 84.0 % of variable cost of distribution for urban and rural areas respectively. This amount can be expected to change in the future.
Based on this percentage of subsidy and the lighting hours (Tab. 5), for the cabinets the energy costs per m2 during the time of the experiment for the growers were calculated (Tab. 6).
41
Tab. 6: Costs for consumption of energy for distribution and sale of energy. Costs for consumption Energy ISK/kWh
Treatment 240HPS, Diamantino
Energy costs with subsidy per m2 ISK/m2
240HPS, ungrafted Encore
240HPS, grafted Encore
300HPS, grafted Encore
real
240HPS, Diamantino
240HPS, ungrafted Encore
240HPS, grafted Encore
300HPS, grafted Encore real calculated real calculated real
real calculated real calculated real calculated real calculated
DISTRIBUTION
RARIK Urban 76.4%subsidyfromthestate VA210
0.82 0.79 0.84 0.80 0.83 0.79 0.84 0.80 830 741 786 815 809 719 764 791 822 734 778 807 1024 908 963 999 VA410
0.67 0.63 0.68 0.64 0.68 0.63 0.68 0.64 672 594 629 653 658 579 613 636 668 589 624 647 832 730 773 803
RARIK Rural 84.0%subsidyfromthestate VA230
0.81 0.68 0.80 0.68 0.80 0.69 0.80 0.68 815 638 677 702 774 608 645 669 786 638 676 702 975 780 826 858
VA430 0.54 0.44 0.53 0.44 0.53 0.45 0.53 0.44 542 414 439 456 514 395 419 434 521 415 440 457 646 507 538 558
Afltaxti ÞrígjaldstaxtiTT
ÞrígjaldstaxtiTV
4.60 6.05 5.69
4.45 5.70 5.57
4.65 6.03 5.66
4.49 5.72 5.52
4.63 6.10 5.75
4.47 5.73 5.62
SALE
4.63 6.04 5,69
4.48 5.76 5,66
4,638
4,199 4,451 4,619
4,481
4,038 4,280 4,441
4,572
4,145 4,394 4,560
5,679
5,115 5,422 5,627
Comments: The first number for the calculated value is with 0 % more power consumption, the second value with 6 % more power consumption and the last value with 10 % more power consumption. Prices are from April 2013.
The energy costs per kWh for distribution after subsides are around 0.7-0.8 ISK/kWh for „VA210“ and „VA230“, around 0.6-0.7 ISK/kWh for „VA410“ and 0.5 ISK/kWh for „VA430“. The energy costs for sale are for „afltaxti“ around 4.5-4.6 ISK/kWh and for „þrígjaldstaxti TT“ and „þrígjaldstaxti TV“ around 5.5-6.0 ISK/kWh.
Cost of electricity was lower for the calculated values (Tab. 7). In general, tariffs for large users rendered lower cost.
42
calculated
calculated
4.5.3 Costs of electricity in relation to yield
Costs of electricity in relation to yield for wintergrown tomatoes were calculated (Tab. 7).
Tab. 7: Variable costs of electricity in relation to yield. Variable costs of electricity per kg yield ISK/kg
Treatment 240HPS, Diamantino 240HPS, ungraftedEncore 240HPS, graftedEncore 300HPS, graftedEncore Yield/m2 58.6 59.0 68.8 80.7 real calculated real calculated real calculated real calculated
Urban area (Distribution + Sale) VA210 93 84 89 93 90 81 85 89 78 71 75 78 83 75 79 82 VA410 91 82 87 90 87 78 83 86 76 69 73 76 81 72 77 80
Rural area (Distribution + Sale) VA230 93 83 87 91 89 79 83 87 78 70 74 77 82 73 77 80 VA430 88 79 83 87 85 75 80 83 74 66 70 73 78 70 74 77
While for the distribution several tariffs were possible, for the sale only the cheapest tariff was considered. The costs of electricity decreased by more than 10 % with grafting of tomatoes (“240 HPS, grafted Encore” compared to “240 HPS, ungrafted Encore”) due to a higher yield. However, despite of a higher yield of grafted plants at a higher light intensity (“300 HPS, grafted Encore”), costs of electricity decreased compared to grafted tomatoes at the lower light intensity (“240 HPS, grafted Encore”) (Tab. 7).
43
4.5.4 Profit margin
The profit margin is a parameter for the economy of growing a crop. It is calculated by subtracting the variable costs from the revenues. The revenues itself, is the product of the price of the sale of the fruits and kg yield. For each kg of tomatoes, growers are getting about 400 ISK from Sölufélag garðyrkjumanna (SfG) and in addition about 66 ISK from the government. Therefore, the revenues increased with more yield (Fig. 36).
Price SfG: 400 ISK/kg
Price Government: 66.12 ISK/kg
Fig. 36: Revenues at different treatments.
When considering the results of previous chapter, one must keep in mind that there are other cost drivers in growing tomatoes than electricity alone (Tab. 6). Among others, this are e.g. the costs for seeds and seedling production (
500 ISK/m2), costs for plant nutrition (
500 ISK/m2) and transplanting (
1,200 ISK/m2), CO2 transport (
300 ISK/m2), liquid CO2 (
1,400 ISK/m2), the rent of the tank (
500 ISK/m2), material for packing (
500 ISK/m2), the rent of the green box (
1,500 ISK/m2), packing costs with the machine from SfG (
800 ISK/m2) and transport costs from SfG (≈ 550 ISK/m2) (Fig. 37).
44
≈
≈
≈
≈
≈
≈
≈
≈
≈
Fig. 37: Variable and fixed costs (without lighting and labour costs).
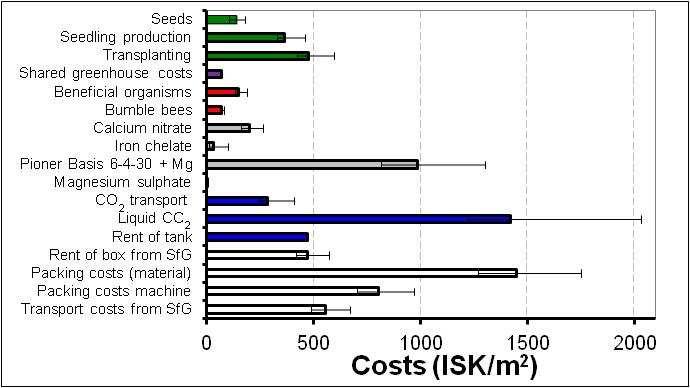
Fig. 38: Division of variable and fixed costs.
However, in Fig. 37 three of the biggest cost drivers are not included and these are investment in lamps and bulbs, electricity and labour costs. These costs are also included in Fig. 38 and it is obvious, that especially the electricity and the investment
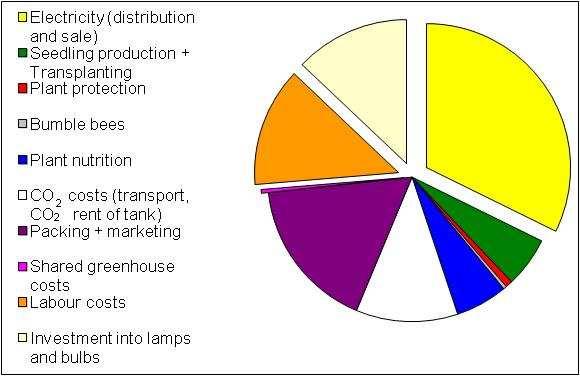
45
31% 18% 12% 13% 6% 14% 5%
in lamps and bulbs as well as the labour costs, are contributing much to the variable and fixed costs beside the costs for packing and marketing and CO2 costs.
A detailed composition of the variable costs at each treatment is shown in Tab. 8.
The profit margin was dependent on the treatment (Fig. 39). Profit margin was with about 11,000 ISK/m2 lowest at “240 HPS, Diamantino” and “240 HPS, ungrafted Encore”. However, the profit margin rose to 14,000 ISK/m2, when instead of ungrafted tomatoes (“240 HPS, ungrafted Encore”), grafted tomatoes (“240 HPS, grafted Encore”) are used. That means, grafting of tomatoes increased the profit margin by about 3,000 ISK/m2. An increase of the light intensity (from 240 W/m2 to 300 W/m2), in addition to a higher top density, a higher temperature and CO2 amount increased the profit margin only slightly. A larger use (higher tariff: “VA 410” compared to “VA 210”, “VA 430” compared to “VA 230”), did not influence the profit margin. Also, it did not matter if the greenhouse is situated in an urban or rural area, the profit margin was comparable. However, at a higher tariff there was a surprisingly small advantage of rural areas due to the state subsidies (Fig. 39).

46
Fig. 39: Profit margin in relation to tariff and treatment.
8: Profit margin of tomatoes at different treatments (urban
HPS, Diamantino
Marketable yield/m
Sales
SfG(ISK/kg)
Revenues (ISK/m
Variable and fixed costs (ISK/m
Electricitydistribution
Electricitysale
Seedlingproduction
Grodansmall
Grodanbig
Pumice
PionerBasis6-4-30+Mg
Calciumnitrate
Magnesiumsulphate
PionerIronChelateEDDHA6%
Strings
RentofboxfromSfG
Packingmaterial
Packing(labour+machine)
TransportfromSfG
VA210)
1,218 2,030
165
1,490 1,749
47 Tab.
area,
. Treatment 240
240 HPS, ungrafted Encore 240 HPS, grafted Encore 300 HPS, grafted Encore
2 58.6 59.0 68.8 80.7
1 400 400 400 400 Government(ISK/kg) 2 66.12 66.12 66.12 66.12
2) 27,328 27,503 32,050 37,617
2)
3 830 809 822 1.024
4,638 4,481 4,572 5,679 Seeds 4 179 124 106 148
329 329 329 461
5 13 13 26 36
6 69 69 34 48
7 246 246 246 344 Predatorybug 8 51 51 51 72 Parasiticwasps 9 82 82 82 114 Bumblebees 10 63 63 63 79
11 815 865 966 1302
12 162 174 194 262
13 0 1 1 1
14 8 9 10 13 CO2 transport 15 245 245 245 409 LiquidCO2 16 1,218 1,218
RentofCO2 tank 17 469 469 469 469
118 118 118
18 415 418 487 572
19 1,270 1,278
20 704 708 825 968
21 487 490 571 670 Sharedfixedcosts 22 71 71 71 71 Lamps 23 1,429 1,429 1,429 1,786 Bulbs 24 762 762 762 952 ∑ variable costs 14,673 14,521 15,185 19,507 Revenues -∑ variable costs 12,655 12,982 16,865 18,110 Workinghours(h/m2) 0.70 0.70 0.90 1.10 Salary(ISK/h) 1,352 1,352 1,352 1,352 Labourcosts(ISK/m2) 2,268 2,276 2,766 3,306 Profit margin (ISK/m2) 10,387 10,706 14,098 14,804
price winter 2012/2013: 400 ISK/kg
price in October for 2013: 66.12 ISK/kg
assumption: urban area, tariff “VA210”, no annual fee (according to datalogger values)
7,143 ISK / 100 Diamantino seeds, 24,846 ISK / 500 Encore seeds; 16,127 ISK / 500 Maxifort
36x36x40mm, 900 ISK / 220 Grodan small
6.56 42/40, 33 ISK / 1 Grodan big
8,696 ISK/m3 (2.6 m3 big pumice, 0.65 m3 small pumice)
5,901 ISK / unit predatory bug (Macrolophus caliginosus)
9,383 ISK / unit parasitic wasps (Encarsia formosa)
7,042 ISK / unit bumble bees
6,950 ISK / 25 kg Pioner Basis 6-4-30 + Mg
2,100 ISK / 25 kg Calcium nitrate
1,625 ISK / 25 kg Magnesium sulphate
17210 ISK / 5 kg Iron Chelate
CO2 transport from Rvk to Hveragerði / Flúðir: 6.5 ISK/kg CO2
liquid CO2: 32.30 ISK/kg CO2
rent for 6 t tank: 58,600 ISK/month, assumption: rent in relation to 1,000 m2 lightened area
85 ISK / 12 kg box
packing costs (material): costs for packing of big tomatoes (0.75 kg): platter: 11 ISK / 0.75 kg, plastic film: 4 ISK / 0.75 kg, label: 1.25 ISK / 0.75 kg
packing costs (labour + machine): 12 ISK / kg
transport costs from SfG: 8.30 ISK / kg
94 ISK/m2/year for common electricity, real property and maintenance
HPS lights: 30,000 ISK/lamp, life time: 8 years
HPS bulbs: 4,000 ISK/bulb, life time: 2 years
48 1
2
3
4
5
6
7
8
9
10
11
12
13
14
15
16
17
18
19
20
21
22
23
24
DISCUSSION
5.1 Yield in dependence of light intensity
The yield of tomatoes was compared at two light intensities. The results show that at a high light intensity it is possible to enhance tomato productivity only to a small extent by distributing an even higher amount of light intensity. Marcelis et al. (2006) reported that generally, it can be said that 1 % increase of light intensity is resulting in a yield increase of 0.7-1.0 % for fruit vegetables. These values are in accordance with the present findings, a 1 % increase of light intensity resulted in a yield increase of 0.7 %.
The reasons for the higher yield at higher light intensity were an increased number of harvested fruits, whereas the average weight was not affected. However, in the year 2011/2012 was the reason for the higher yield at a higher light intensity an increased number of harvested fruits and in addition, to a smaller extend, a higher average weight of tomatoes (Stadler, 2013). Also, for sweet pepper the reason for the higher yield at higher light intensity was attributed to more, rather than heavier fruits (Stadler, 2010). However, in the literature there are also other explanations for a higher yield. For example, pulled Lorenzo & Castilla (1995) in their conclusion a higher LAI together with a higher yield; i.e. higher values of LAI in the high density treatment lead to an improved radiation interception and, subsequently, to higher biomass and yield of sweet pepper than in the low density treatment. However, more factors than only light intensity might have influenced yield: The higher plant density, higher temperature and higher CO2 might also have been contributed to a yield increase, but the influence of each factor is unknown.
When a higher light intensity was applied to tomatoes, pollination was decreased. About one fruits less was pollinated compared to the lower light intensity. Also, first class yield was decreased with higher light intensity. This means a decrease in the number of marketable fruits per plant, but an increased number of fruits per m2 due to the higher plant density compared to the one at lower light intensity. In contrast, Heuvelink et al. (2006) reported that a higher light intensity (13 h with 188 µmol/m2/s compared to 17 h and 125 µmol/m2/s) improved yield of sweet pepper by better fruit set while average fruit weight was hardly affected.
Using a higher light intensity is associated with higher expenses for the electricity. Thus, it is necessary that the higher use of electricity is paying off by obtaining a
49 5
higher yield. However, the higher light intensity (and higher top density, higher temperature and higher CO2 amount) resulted in an about 10 kg/m2 higher yield, but in nearly the same profit margin than the lower light intensity, meaning that the yield was not high enough to pay off for the higher use of electricity. Only, when the yield would have been clearly more than 10 kg/m2 at the higher light intensity, profit margin would have been higher compared to the lower light intensity. That means it is only worth to use 60 W/m2 more light if this would result in a considerably more than 10 kg/m2 higher yield (Fig. 40).
5.2 Yield in dependence of variety
The yield between the two varieties “Diamantino” and “Encore” was comparable. However, the taste of “Diamantino” was not as good as of “Encore”. According to Enza Zaden (2013) is “Diamantino” suitable for cultivation under artificial lighting, in terms of production, is “Diamantino” comparable with standard varieties, but its greater endurance means that it will be more profitable at the end of the season.
In general, it can be assumed that taste as well as yield level differs between varieties. Therefore, it is recommended to use a good yielding variety to have a positive effect on yield, but to consider also the taste of the variety.
5.3 Yield in dependence of plant treatment (grafted / ungrafted)
So far, it is common to plant ungrafted tomatoes in Iceland. Grafted tomatoes are only used by few Icelandic growers. However, in the literature are grafted tomatoes evaluated as positive (e.g. Pogonyi et al., 2005; Kowalczyk and Gajc-Wolska, 2011): Pogonyi et al. (2005) reported higher yields of grafted tomatoes that was on the one hand caused by more fruits per cluster and on the other hand by an increased weight of the fruits. Also, Kowalczyk and Gajc-Wolska (2011) observed a yield advantage of cherry tomatoes after grafting. However, yield was only significantly increased with grafted tomatoes of the variety „Organza“. Grafted plants of the variety „Dasher“ produced much more fruits than ungrafted ones with a similar average weight. In contrast to tomatoes, did grafting of eggplant not exert any significant influence on marketable yield but determined a lower percentage of marketable fruit and the
50
average weight of fruits was significantly higher in all grafted plants (Moncada et al., 2013).
In the present experiment, the yield between grafted and ungrafted tomatoes was during the first month of harvest comparable. However, thereafter showed grafted tomatoes a yield advantage and reached at the end of the harvest period a significantly higher yield compared to ungrafted tomatoes. In contrast to Pogonyi et al. (2005), was the higher yield of grafted tomatoes caused by more harvested fruits, whereas the average weight was even slightly higher for ungrafted tomatoes.
Contrary to the presented results of grafted tomatoes was the previous year (Stadler, 2013). However, in 2011/2012 the not so good performance of grafted tomatoes was partly attributed to the two weeks later planting of grafted tomatoes caused by the slower development at seedling production. Also, during the first two months recieved grafted plants a fertilizer application which was adapted to the needs of ungrafted tomatoes and was after that adapted to the needs of grafted plants. In addition, grafted tomatoes showed a stronger vegetative growth that had to be countered by the additional removal of leaves. This was, however, only sufficiently performed in the second half of the growth period. However, if grafted plants are treated from the beginning according to their needs, then a better yield than with ungrafted ones can be reached like it was shown in the present experiment.
51
Fig. 40: Profit margin in relation to yield – calculation scenarios (urban area, VA210). 0 2000 4000 6000 8000 10000 12000 14000 16000 18000 20000 30405060708090 Marketable yield (kg/m2) Profit margin (ISK/m2 ) 240 HPS, Diamantino 240 HPS, ungrafted Encore 240 HPS, grafted Encore + 10 kg/m2 + 3000 ISK/m2 + 10 kg/m2 + 0 ISK/m2
Grafting resulted not only in a 10 kg/m2 higher yield, but also in an about 3,000 ISK/m2 higher profit margin (Fig. 40). Therefore, with respect to a long term effect is grafting recommended.
5.4 Future speculations concerning energy prices
In terms of the economy of lighting – which is not looking very promising from the growers’ side – it is also worth to make some future speculations about possible developments. So far, the lighting costs are contributing to about 1/3 of the production costs. In the past and present there have been and there are still a lot of discussions concerning the energy prices. Therefore, it is necessary to highlight possible changes in the energy prices (Fig. 41). The white columns are representing the profit margin according to Fig. 39. Where to be assumed, that growers would get no subsidy from the state for the distribution of the energy, that would result in a profit margin of 8,000 ISK/m2 for ungrafted tomato plants of Diamantino and Encore and of 11,000 for grafted Encore at both light intensities (black columns, Fig. 41). Without the subsidy of the state, probably less Icelandic grower would produce tomatoes over the winter months. When it is assumed that the energy costs, both in distribution and sale, would increase by 25 %, but growers would still get the subsidy, then the profit margin would range between 9-13,000 ISK/m2 (dotted columns). When it is assumed, that growers have to pay 25 % less for the energy, the profit margin would increase to 12,000-16,000 ISK/m2. From these scenarios it can be concluded that from the grower’s side it would be preferable to get subsidy to be able to get a higher profit margin and grow tomatoes over the winter.
52
with
41:
5.5 Recommendations for increasing profit margin
The current economic situation for growing tomatoes necessitate for reducing production costs to be able to heighten profit margin for tomato production. On the other hand side, growers have to think, if tomatoes should be grown during low solar irradiation and much use of electricity.
It can be suggested, that growers can improve their profit margin of tomatoes by:
1. Getting higher price for the fruits
It may be expected to get a higher price, when consumers would be willing to pay more for Icelandic fruits than imported ones. Growers could also get a higher price for the fruits with direct marketing to consumers (which is of course difficult for large growers).
2. Decrease plant nutrition costs
Growers can decrease their plant nutrition costs by mixing their own fertilizer. When growers would buy different nutrients separately for a lower price and mix out of this their own composition, they would save fertilizer costs.
At low solar irradiation, watering with a scale can save up to 20 % of water –and with that plant nutrition costs – with same yield when compared to
53 -2000 0 2000 4000 6000 8000 10000 12000 14000 16000 18000 20000 22000 240 HPS, Diamantino 240 HPS, ungrafted Encore 240 HPS, grafted Encore 300 HPS, grafted EncoreProfit margin (ISK/m2 ) energycosts without subsidy +25% energycosts (distribution + sale) with current subsidy energycosts
current subsidy -25% energycosts (distribution + sale) with current subsidy Fig.
Profit
margin in relation to treatment – calculation scenarios (urban area, VA210).
automatic irrigation (Stadler, 2013). It is profitable to adjust the watering to the amount of last water application (Yeager et al., 1997).
3. Lower CO2 costs
The costs of CO2 are pretty high. Therefore, the question arises, if it is worth to use that much CO2 or if it would be better to use less and get a lower yield but all together have a possible higher profit margin. The CO2 selling company has currently a monopoly and a competition might be good.
4. Decrease packing costs
The costs for packing (machine and material) from SfG and the costs for the rent of the box are high. Costs could be decreased by using less or cheaper packing materials. Also, packing costs could be decreased, when growers would due the packing at the grower’s side. They could also try to find other channels of distribution (e.g. selling directly to the shops and not over SfG).
5. Efficient employees
The efficiency of each employee has to be checked regularly and growers will have an advantage to employ faster workers. Growers should also check the user-friendliness of the working place to perform only minimal manual operations. Very often operations can be reduced by not letting each employee doing each task, but to distribute tasks over employees. In total, employees will work more efficiently due to the specialisation.
6. Decrease energy costs
- Lower prices for distribution and sale of energy (which is not realistic)
- Growers should decrease artificial light intensity at increased solar irradiation, because this would result in no lower yield (Stadler et al., 2010).
- Also, growers could decrease the energy costs by about 6 % when they would lighten according to 100 J/cm2/cluster and 100 J/cm2 for plant maintenance (Stadler, 2012). This would mean that especially at the early stage after transplanting, plants would get less hours light. Also at high natural light, lamps would be turned off. In doing so, compared to the traditional lighting system, profit margin could be increased by about 10 % (assuming similar yield).
54
- Light during nights and weekends from the beginning of November to the end of February is not recommended due to the lower yield and lower profit margin (Stadler, 2012).
- Growers should check if they are using the right RARIK tariff and the cheapest energy sales company tariff. Unfortunately, it is not so easy, to say, which is the right tariff, because it is grower dependent.
- Growers should check if they are using the power tariff in the right way to be able to get a lowered peak during winter nights and summer (max. power -30 %). It is important to use not so much energy when it is expensive, but have a high use during cheap times.
- Growers can save up to 8 % of total energy costs when they would divide the winter lighting over all the day. That means growers should not let all lamps be turned on at the same time. This would be practicable, when they would grow in different independent greenhouses. Of course, this is not so easy realisable, when greenhouses are connected together, but can also be solved there by having different switches for the lamps to be able to turn one part of the lamps off at a given time. Then, plants in one compartment of the greenhouse would be lightened only during the night. When yield would be not more than 2 % lower with lighting at nights compared to the usual lighting time, dividing the winter lighting over all the day would pay off. However, the last experiment showed that the yield was decreased by about 15 % when tomatoes got from the beginning of November to the end of February light during nights and weekends (Stadler, 2012). This resulted in a profit margin that was about 18 % lower compared to the traditional lighting system and therefore, normal lighting times are recommended.
- For large growers, that are using a minimum of 2 GWh it could be recommended to change to “stórnotendataxti” in RARIK and save up to 35 % of distribution costs.
- It is expected, that growers are cleaning their lamps to make it possible, that all the light is used effectively and that they are replacing their bulbs before the expensive season is starting.
55
- Aikman (1989) suggests to use partially reflecting material to redistribute the incident light by intercepting material to redistribute the incident light by intercepting direct light before it reaches those leaves facing the sun, and to reflect some light back to shaded foliage to give more uniform leaf irradiance.
6 CONCLUSIONS
The tomato yield was not influences by the variety. However, a high yielding variety is recommended. Grafting of tomatoes resulted in a 10 kg/m2 higher yield in addition to a 3,000 ISK/m2 higher profit margin compared to ungrafted tomatoes. Therefore grafting of tomatoes can be highly recommended. The very high increase in energy costs by lighting when increasing the light intensity from 240 W/m2 to 300 W/m2 was accompanied by only a small yield increase. From the economic side it seems to be not recommended to provide 60 W/m2 more light. To have a higher profit benefit with more use of electricity clearly more than 10 kg/m2 higher yield must be obtained. Growers should pay attention to possible reduction in their production costs for tomatoes other than energy costs.
56
REFERENCES
AIKMAN DP, 1989: Potential increase in photosynthetic efficiency from the redistribution of solar radiation in a crop. J. Exp. Bot. 40, 855-864.
DEMERS DA, DORAIS M, WIEN CH, GOSSELIN A, 1998a: Effects of supplemental light duration on greenhouse tomato (Lycopersicon esculentum Mill.) plants and fruit yields. Sci. Hortic. 74, 295-306.
DEMERS DA, GOSSELIN A, WIEN HC, 1998b: Effects of supplemental light duration on greenhouse sweet pepper plants and fruit yields. J. Amer. Hort. Sci. 123, 202-207.
DORAIS M., 2003: The use of supplemental lighting for vegetable crop production: Light intensity, crop response, nutrition, crop management, cultural practices. Canadian Greenhouse Conference October 9.
EGGERTSSON H, 2009: Personal communication (Notice in writing) from Haukur Eggertsson, Orkustofnun, October 2009.
ENZA ZADEN, 2013: Enza Zaden's Diamantino does well under artificial lighting. http://www.hortidaily.com/article/2777/Enza-Zadens-Diamantino-does-well-under-artificiallighting. Publication date: 6/27/2013
HAO X, PAPADOPOULOS AP, 1999: Effects of supplemental lighting and cover materials on growth, photosynthesis, biomass partitioning, early yield and quality of greenhouse cucumber. Sci. Hortic. 80, 1-18.
HEUVELINK E, BAKKER MJ, HOGENDONK L, JANSE J, KAARSEMAKER R, MAASWINKEL R, 2006: Horticultural lighting in the Netherlands: New developments. Acta Hort. 711, 25-33.
HOUTER BN, NEDERHOFF E, 2007a: Controlling plant growth. Number 5 in a mini series. Grower 5, 45-46.
HOUTER BN, NEDERHOFF E, 2007b: Controlling plant growth. Number 6 in a mini series. Grower 6, 42-44. http://oregonstate.edu/dept/NWREC/upload/pubs/Owen_Jim/project15/Owen.pdf.
KOWALCZYK K, GAJC-WOLSKA J, 2011: Effect of the kind of growing medium and transplant grafting on the cherry tomato yielding. Acta Sci. Pol., Hortorum Cultus 10, 61-70.
57 7
LORENZO P, CASTILLA N, 1995: Bell pepper response to plant density and radiation in unheated plastic greenhouse. Acta Hort. 412, 330-334.
MARCELIS LFM, BROEKHUIJSEN AGM, MEINEN E, NIJS EHFM, RAAPHORST MGM, 2006: Quantification for the growth response to light quality of greenhouse grown crops. Acta Hort. 711, 97-104.
MONCADA A, MICELI A, VETRANO F, MINEO V, PLANETA D, D’ANNA F, 2013: Effect of grafting on yield and quality of eggplant (Solanum melongena L.). Sci. Hortic. 149, 108-114.
POGONYI Á, PÉK Z, HELYES L, LUGASI A, 2005: Effect of grafting on the tomato’s yield, quality and main fruit components in spring forcing. Acta Alimentaria 34, 453-462.
STADLER C, HELGADÓTTIR Á, ÁGÚSTSSON, M, RIIHIMÄKI MA, 2010: How does light intensity, placement of lights and stem density affect yield of wintergrown sweet pepper? Fræðaþing landbúnaðarins, 227-232.
STADLER C, 2010: Effects of plant density, interlighting, light intensity and light quality on growth, yield and quality of greenhouse sweet pepper. Final report, Rit LbhÍ nr. 30.
STADLER C, 2012: Effects of lighting time and light intensity on growth, yield and quality of greenhouse tomato. Final report, Rit LbhÍ nr. 40.
STADLER, C, 2013: Áhrif ljósstyrks, rótarbeðsefnis, vökvunar og umhirðu á vöxt, uppskeru og gæði gróðurhúsatómata. Final report, Rit LbhÍ nr. 43.
YEAGER TH, GILLIAM CH, BILDERBACK TE, FARE DC, NIEMIERA AX, TILT KM, 1997: Best management practices guide for producing container-grown plants. Southern Nurs. Assoc., Marietta, GA.
58

