Table of contents
I
List of figures III List of tables IV Abbreviations V 1 SUMMARY 1 YFIRLIT 3 2 INTRODUCTION 5 3 MATERIALSANDMETHODS 7 3.1 Greenhouseexperiment 7 3.2 Treatments 10 3.3 Measurements,samplingandanalyses 10 3.4 Statisticalanalyses 11 4 RESULTS 11 4.1 Environmentalconditionsforgrowing 11 4.1.1 Solarirradiation 11 4.1.2 Chambersettings 12 4.1.3 Soiltemperature 13 4.1.4 Leaftemperature 13 4.1.5 Irrigationofstrawberries 14 4.2 Developmentofstrawberries 17 4.2.1 Numberofleaves 17 4.2.2 Numberofrunners 18 4.2.3 Numberofclusters 18 4.2.4 Openflowers/fruitspercluster 19 4.2.5 Openflowers/fruitsperplant 19
Yield
4.3.1
Interiorqualityofyield
Sugarcontent
Tasteofstrawberries
Costsofelectricityinrelationtoyield
II 4.3
20
Totalyieldofstrawberries 20 4.3.2 Marketableyieldofstrawberries 20 4.3.3 Outerqualityofyield 24 4.3.4
25 4.3.4.1
25 4.3.4.2
25 4.3.4.3 Drysubstanceoffruits 27 4.4 Economics 27 4.4.1 Lightinghours 27 4.4.2 Energyprices 28 4.4.3
32 4.4.4 Profitmargin 32 5 DISCUSSION 37 5.1 Yieldindependenceofthelightintensity 37 5.2 Futurespeculationsconcerningenergyprices 39 5.3 Recommendationsforincreasingprofitmargin 40 6 CONCLUSIONS 43 7 REFERENCES 44 8 APPENDIX 46
Listoffigures
Fig. 1: Experimental design of cabinets. 7
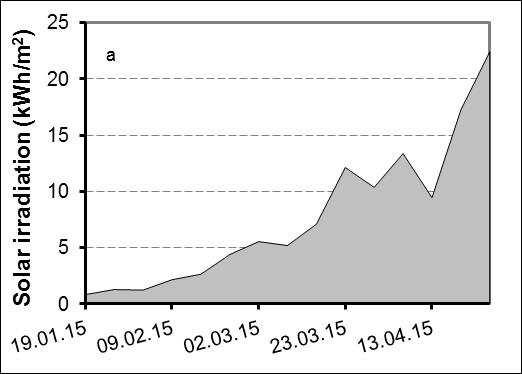
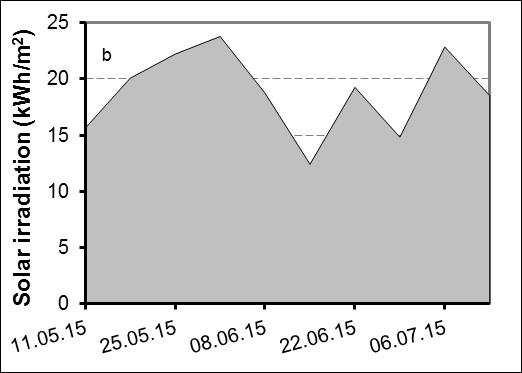
Fig. 2: Time course of solar irradiation for part A (a) and part B (b). 11
Fig. 3: Soil temperature for part A (a) and part B (b). 13
Fig. 4: Leaf temperature for part A (a) and part B (b). 13
Fig. 5: Daily applied water for part A (a) and part B (b). 14
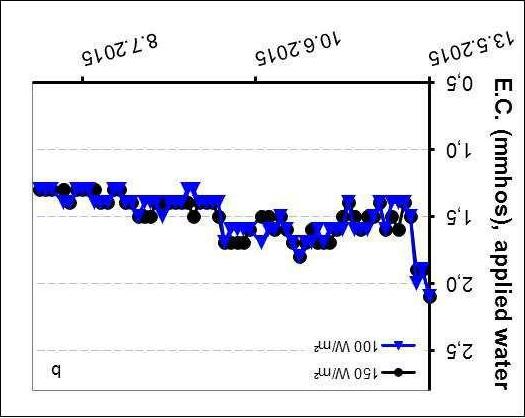
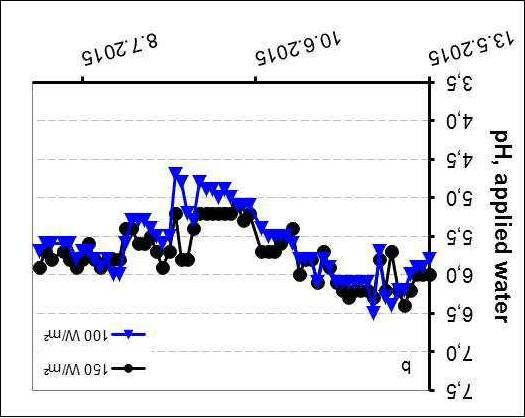
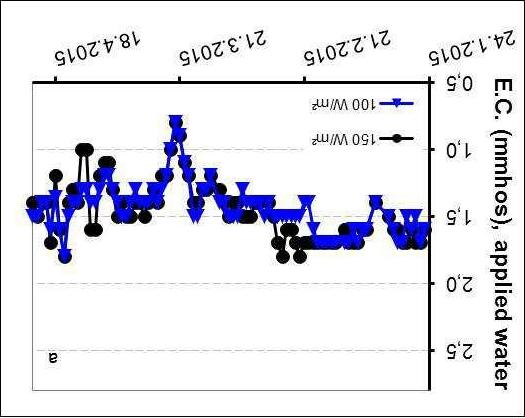
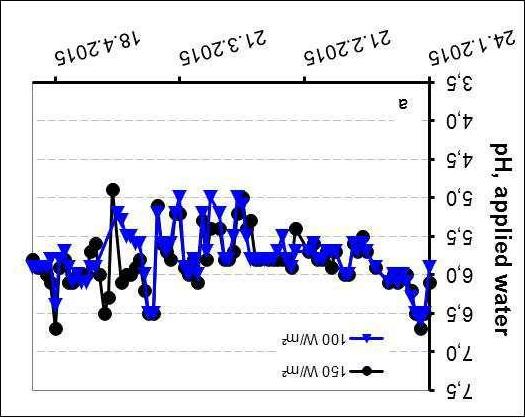
Fig. 6: E.C. and pH of irrigation water for part A (a) and part B (b). 15
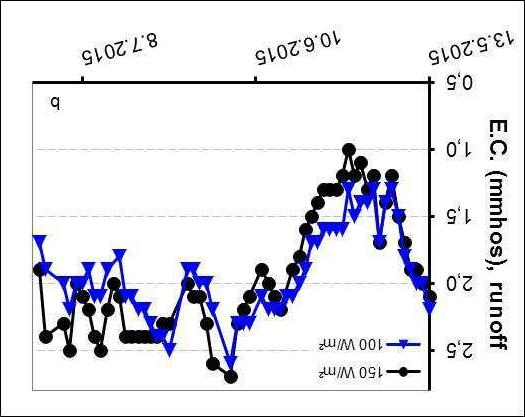
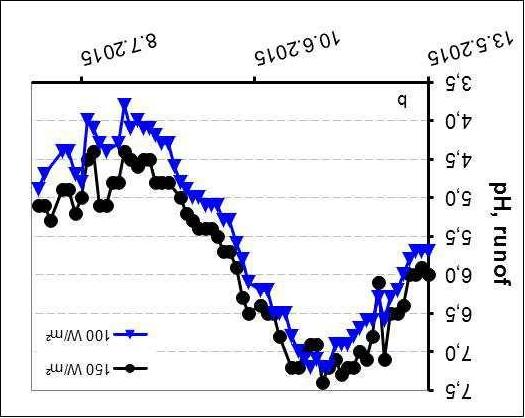
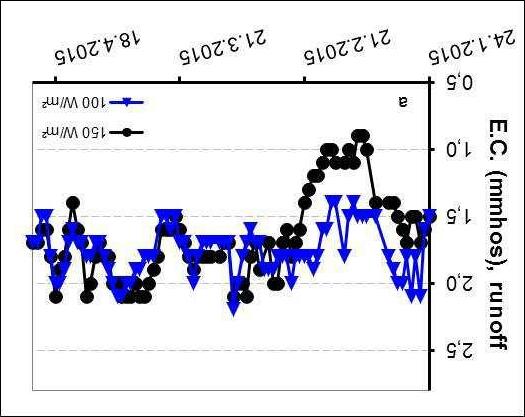
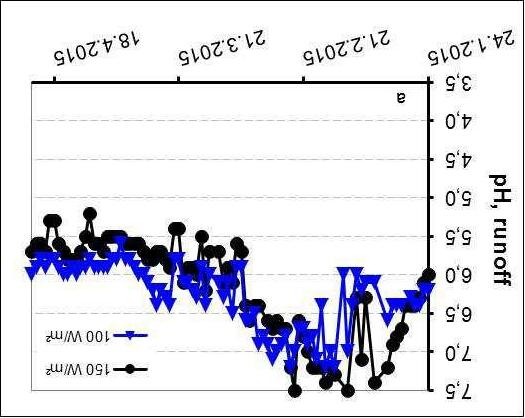
Fig. 7: E.C. and pH of runoff of irrigation water for part A (a) and part B (b). 16
Fig. 8: Proportion of amount of runoff from applied irrigation water for part A (a) and part B (b). 17
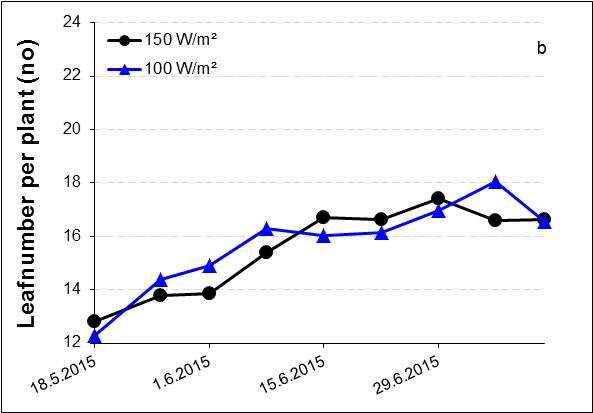
Fig. 9: Number of leaves at strawberry plants for part A (a) and part B (b). 17
Fig. 10: Number of runners at strawberry plants for part A (a) and part B (b). 18
Fig. 11: Number of clusters for part A (a) and part B (b). 18
Fig. 12: Number of fruits per clusters for part A (a) and part B (b). 19
Fig. 13: Open flowers / fruits per cluster for part A (a) and part B (b). 19
Fig. 14: Cumulative total yield of strawberries for part A (a) and part B (b). 20
Fig. 15: Time course of accumulated marketable yield of strawberries for part A (a) and part B (b). 21
Fig. 16: Time course of accumulated marketable yield of strawberries for the whole chamber for part A (a) and part B (b). 21
Fig. 17: Time course of marketable class yield for part A (a) and part B (b). 22
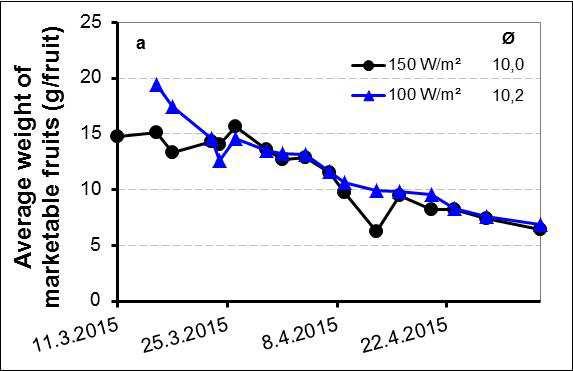
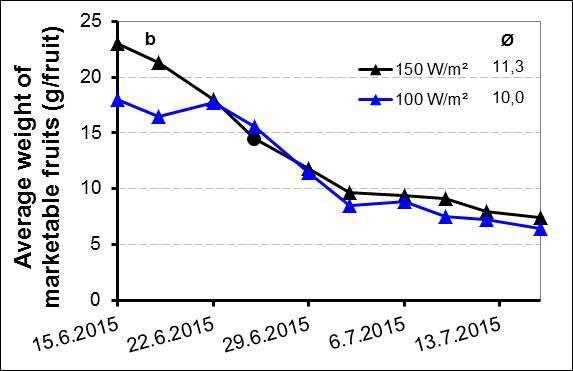
Fig. 18: Average weight of strawberries for part A (a) and part B (b). 23
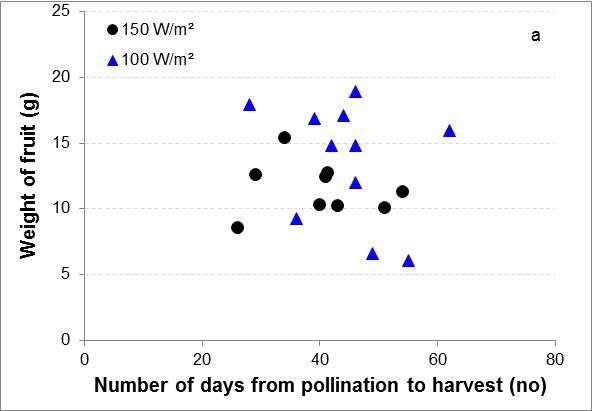
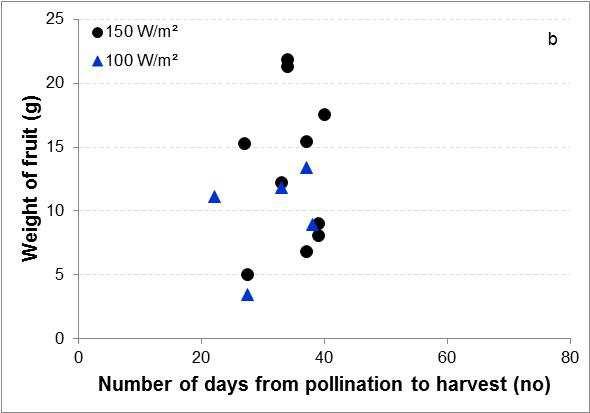
Fig. 19: Number of days from pollination to harvest and weight of the harvested fruit for part A (a) and part B (b). 23
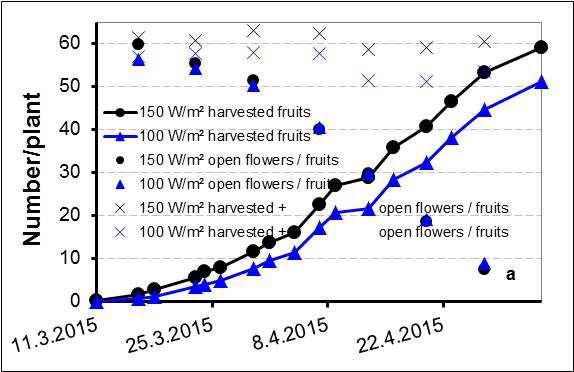
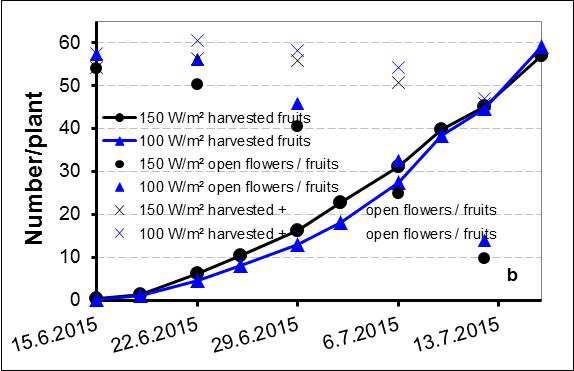
Fig. 20: Development of open flowers / fruits, harvested fruits and their sum during the growth of the strawberries for part A (a) and part B (b). 24
Fig. 21: Sugar content of strawberries for part A (a) and part B (b). 25
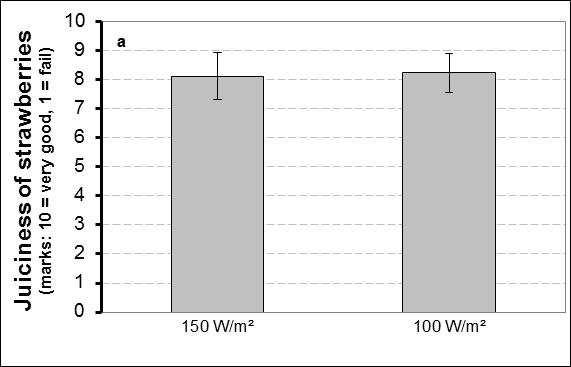
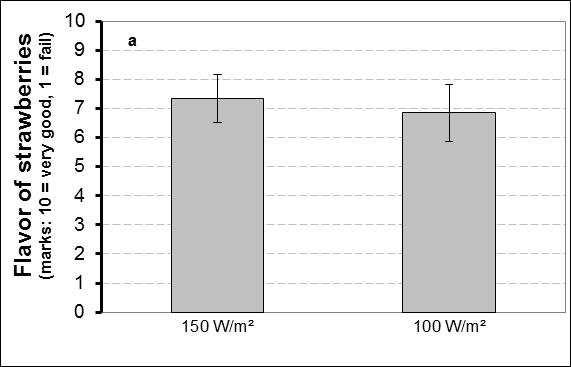
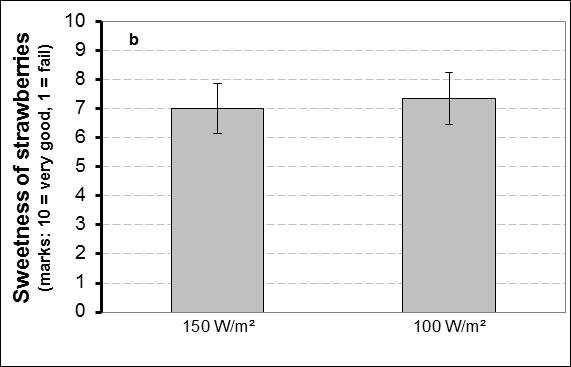
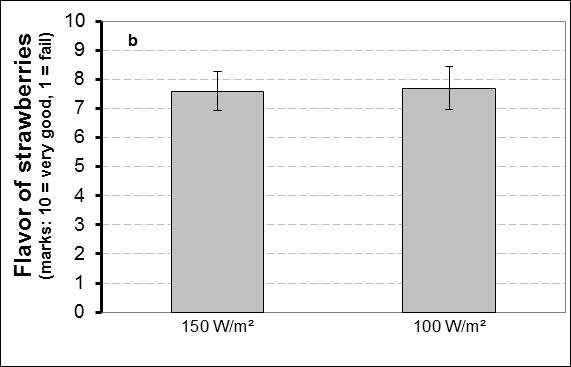
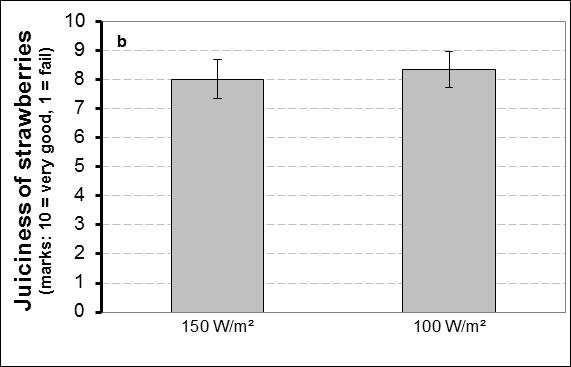
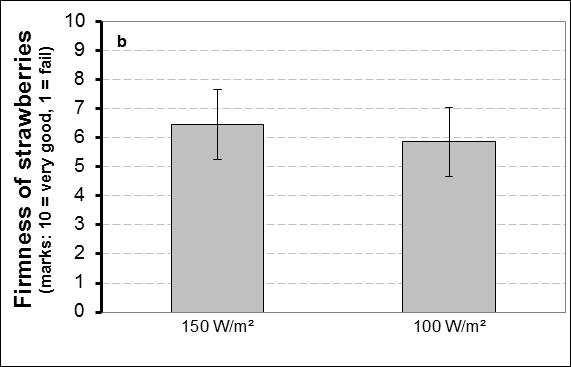
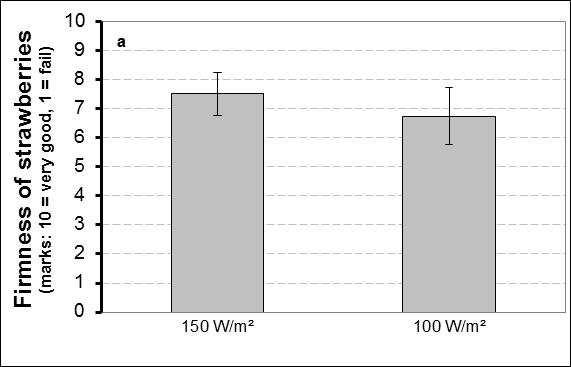
Fig. 22: Sweetness, flavour, juiciness and firmness of strawberries for part A (a) and part B (b). 26
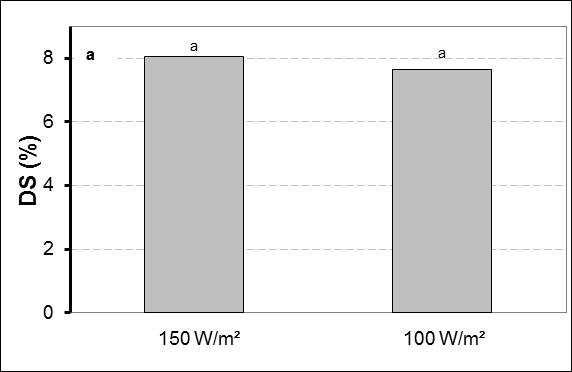
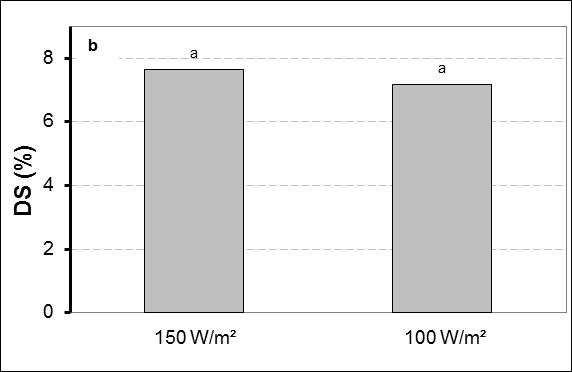
Fig. 23: Dry substance of strawberries for part A (a) and part B (b). 27
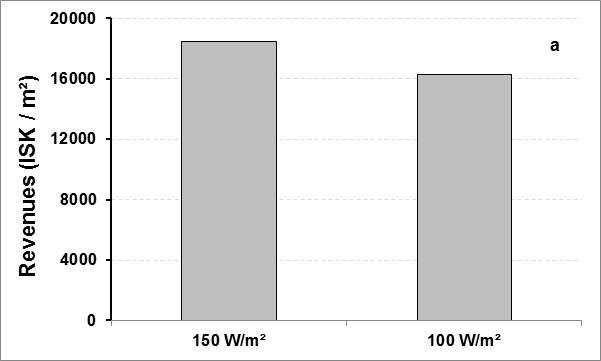
Fig. 24: Revenues at different treatments for part A (a) and part B (b). 33 Fig. 25: Variable and fixed costs (without lighting and labour costs). 33
III
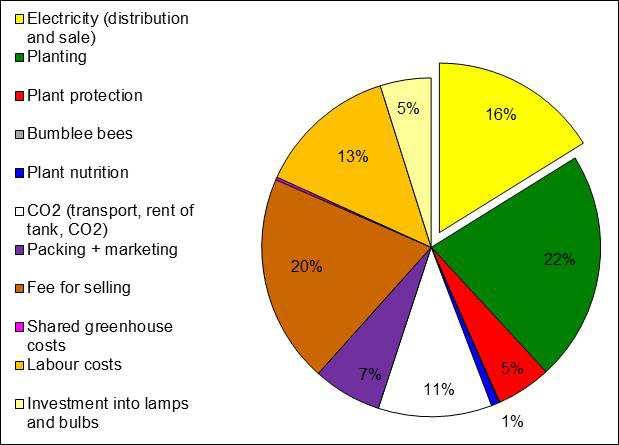
Fig. 26 Division of variable and fixed costs (numbers from part A). 34
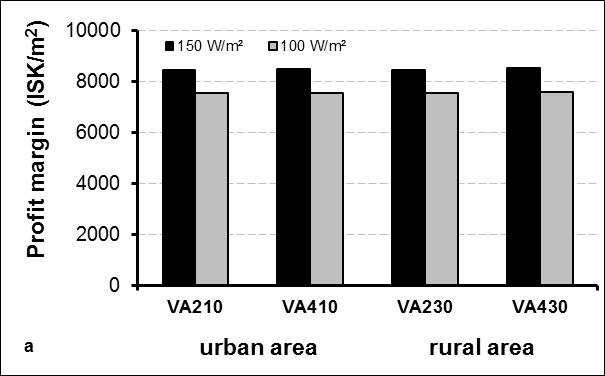
Fig. 27: Profit margin in relation to tariff and treatment for part A (a) and part B (b). 37
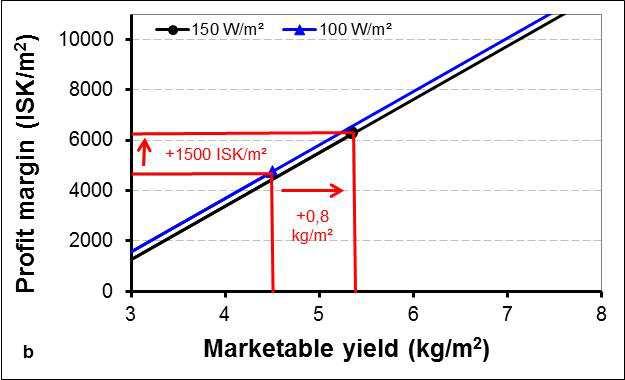
Fig. 28: Profit margin in relation to yield with light intensity – calculation scenarios (urban area, VA210). 39
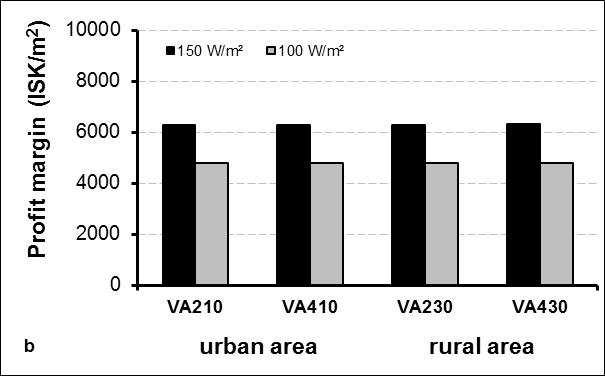
Fig. 29: Profit margin in relation to treatment – calculation scenarios (urban area, VA210). 40
Listoftables
Tab. 1a: Fertilizer mixture according to advice from Azelis. 8 Tab. 1b: Fertilizer mixture according to advice from DLV plant. 9
Tab. 2: Chamber settings for part A and part B. 12
Tab. 3: Cumulative total number of marketable fruits for part A and part B. 22
Tab. 4: Proportion of marketable and unmarketable yield for part A and part B. 24
Tab. 5a: Lighting hours, power and energy in the cabinets for part A. 28 Tab. 5b: Lighting hours, power and energy in the cabinets for part B. 28 Tab. 6a Costs for consumption of energy for distribution and sale of energy for part A. 30
Tab. 6b Costs for consumption of energy for distribution and sale of energy for part B. 31
Tab. 7: Variable costs of electricity in relation to yield. 32 Tab. 8: Profit margin of strawberries at different light treatments for part A and part B (urban area, VA210). 35
IV
Abbreviations
DM dry matter yield
DS dry substance
E.C. electrical conductivity
HPS high-pressure vapour sodium lamps
kWh kilo Watt hour
LAI leaf area index
N nitrogen pH potential of hydrogen ppm parts per million
W Watt Wh Watt hours
Other abbreviations are explained in the text.
V
SUMMARY
In Iceland, winter production of greenhouse crops is totally dependent on supplementary lighting and has the potential to extend seasonal limits and replace imports during the winter months. Adequate guidelines for winterproduction of strawberries are not yet in place and need to be developed. The objective of this study was to test if winterproduction of strawberries is possible in Iceland and if the light intensity is affecting growth, yield and quality of strawberries and to evaluate the profit margin.
Two experiments with strawberries (Fragaria x ananassa cv. Sonata) were conducted, the first (A) from January to May 2015 and the second (B) from the middle of May to the end of July 2015, in the experimental greenhouse of the Agricultural University of Iceland at Reykir. Strawberries were grown in pots in five replicates with 12 plants/m2 under high-pressure vapour sodium lamps (HPS) at two light intensities (150 W/m2 and 100 W/m2) for a maximum of 18 hours light. The day temperature was 16° C and the night temperature 8° C, CO2 800 ppm. Strawberries received standard nutrition through drip irrigation. The effect of light intensity was tested and the profit margin calculated.
It took 1-2 days from flowering to pollination. The fruits were ripe in 42 days for part A and 33-35 days for part B. It seems that more light (150 W/m2) resulted in more flowers, but later was the effect lower in part A. In part B were from the middle of the growth period on more flowers / fruits counted at 100 W/m2. The treatment with the higher light intensity started some days earlier to give ripe berries in comparision to 100 W/m2
A higher light intensity had a positive effect on marketable yield, the harvest increased by 13 % in part A and by 19 % in part B compared to the lower light intensity. The higher yield was attributed to a higher number of „extra class“ fruits, while the avarage weight was only in part B higher at 150 W/m2, but not in part A. It seems that unmarketable yield was decreased at a higher light intensity. In part A was marketable yield 600 g/plant with 150 W/m2 but 500 g/plant with 100 W/m2 However, the difference was not statistically significant. In part B were 450 g/plant marketable yield at 150 W/m2 and more than 350 g/plant at 100 W/m2 , which was also not statistically different. Marketable yield was 90-94 % of total yield in part A
1 1
and 86-88% in part B. The reason for the higher unmarketable yield in part B was a higher amount of unshaped strawberries due to overpollination.
It seems that sugar content was a bit higher at 150 W/m2. However, this difference was not found in the tasting experiment in the sweetness of the strawberries. The tasting gave a hint that a higher light intensity improved taste and firmness but not the juiciness.
In the chamber with 150 W/m2 was a higher air temperature, a higher leaf temperature and a higher soil temperature measured compared to the chamber with 100 W/m2. This could also have a positive influence on the yield and growth of the plants. For example was a tendency for a higher amount of runners found at 150 W/m2, whereas the number of leaves was comparable between different light intensities.
With a higher light intensity increased the yield by 0,8 kg/m2 (1 % increase of light intensity increased yield by 0,3-0,4 %) and the profit margin by 900 ISK/m2 for part A and 1.500 ISK/m2 for part B. A higher tariff did not change profit margin. Also, the position of the greenhouse (urban, rural) did not influence profit margin.
Possible recommendations for saving costs other than lowering the electricity costs are discussed. From an economic viewpoint it is recommended to use a higher light intensity to be able to increase yield and profit margin.
2
YFIRLIT
Vetrarræktun í gróðurhúsum á Íslandi er algjörlega háð aukalýsingu. Viðbótarlýsing getur því lengt uppskerutímann og komið í stað innflutnings að vetri til. Fullnægjandi leiðbeiningar vegna vetrarræktunar á jarðarberjum eru ekki til staðar og þarfnast frekari þróunar. Markmiðin voru að prófa, hvort vetrarræktun gróðurhúsajarðarberja er möguleg á Íslandi og hvort ljósstyrkur hefði áhrif á vöxt, uppskeru og gæði jarðarberja og hvort það væri hagkvæmt. Gerðar voru tvær tilraunir með jarðarberjum (Fragaria x ananassa cv. Sonata), sú fyrri (A) frá janúar til maí 2015 og sú síðari (B) frá miðjum maí til loka júlí 2015, í tilraunagróðurhúsi Landbúnaðarháskóla Íslands að Reykjum. Jarðarber voru ræktuð í pottum í fimm endurtekningum með 12 plöntum/m2 undir topplýsingu frá háþrýstinatríumlömpum (HPS) með tvenns konar ljósstyrk (150 W/m2 og 100 W/m2) að hámarki í 18 klst. Daghiti var 16° C og næturhiti 8° C, CO2 800 ppm. Jarðarberin fengu næringu með dropavökvun. Í hluta A og hluta B voru áhrif ljósstyrks prófuð og framlegð reiknuð út. Það tók 1-2 daga frá blómgun til frjóvgunar. Ávextir voru þroskaðir í 42 daga í hluta A og í hluta B 33-35 daga. Það virðist vera að meira ljós (150 W/m2) gefi fleiri blóm en síðan eru áhrifin minni í hluta A. Í hluta B voru frá miðju vaxtarskeiði fleiri blóm / aldin við 100 W/m2. Í upphafi uppskerutímabils byrjaði meðferð með hærri ljósstyrk nokkrum dögum fyrr að gefa þroskuð ber í samanburði við 100 W/m2 . Hærri ljósstyrkur hefur jákvæð áhrif á markaðshæfa uppskeru, uppskeran var 13 % meiri í hluta A og 19 % meiri í hluta B. Ástæðan var fleiri jarðarber sem voru í úrvalsflokki, en meðalþyngd var aðeins hærri við 150 W/m2 í hluti B en ekki í hluti A. Það virðist að ómarkaðshæf uppskera hafi minnkað við hærri ljósstyrk. Þannig fengust 600 g/plöntu markaðshæfrar uppskeru við 150 W/m2 en 500 g/plöntu við 100 W/m2 í hluta A, sem var samt ekki tölfræðilega marktækur munur. En í hluta B fengust 450 g/plöntu við 150 W/m2 og meira en 350 g/plöntu við 100 W/m2 sem var heldur ekki tölfræðilega marktækur munur. Hlutfall uppskerunnar sem hægt var að selja var 90-94 % í hluta A og 86-88% í hluta B. Hærra hlutfall ómarkaðshæfrar uppskeru í hluta B var vegna hærri hluta af jarðarberjum sem voru illa löguð vegna ófrjóvgunar.
3
Það virðist að sykurinnihald væri örlítið hærra við 150 W/m2. Hins vegar fannst þessi munur ekki í bragðprófun á sætu í jarðarberjum. Smökkun gaf í skyn að hærri ljósstyrkur yki bragð og þéttleika en ekki safa. Í klefa með 150 W/m2 mældist hærri lofthiti, hærri laufhiti og hærri jarðvegshiti samanborið við klefa með 100 W/m2. Það getur líka haft jákvæð áhrif á uppskeruna og vöxt plantna. Til dæmis virðist tilhneiging til fjölgunar hlaupara við 150 W/m2, þótt fjöldi laufa væri hinn sami við mismunandi ljósstyrk. Þegar hærri ljósstyrkur var notaður, þá jókst uppskera um 0,8 kg/m2 (1 % hækkun í ljósstyrk jók uppskeru um 0,3-0,4 %) og framlegð um 900 ISK/m2 í hluta A og 1.500 ISK/m2 í hluta B. Hærri rafmagnsgjaldskrá breytir framlegð næstum ekkert. Það skiptir ekki máli hvort gróðurhús er staðsett í þéttbýli eða dreifbýli, framlegð er svipuð. Möguleikar til að minnka kostnað, aðrir en að lækka rafmagnskostnað eru ræddir. Frá hagkvæmnisjónarmiði er mælt með því að nota hærri ljósstyrk til að auka uppskeru og framlegð jarðarberja.
4
INTRODUCTION
The extremely low natural light level is the major limiting factor for winter greenhouse production in Iceland and other northern regions. Therefore, supplementary lighting is essential to maintain year-round production. This could replace imports from lower latitudes during the winter months and make domestic vegetables and fruits even more valuable for the consumer market.
Árni Magnús Hannesson from Fluðir is the pioneer in growing strawberries in Iceland. He has started with the production in the year 1985. Eiríkur Ágústsson and Olga Lind
Guðmundsdóttir started to grow strawberries at Silfurtún in the year 2002 and in 2011 more growers joined producing strawberries.
The possibilities for strawberry production are based on growing under vegetation covers for the market in June-August or cultivate strawberries in heated greenhouses with preferably supplementary lighting. The harvest period was so far from May to October and therefore, are Icelandic strawberries not available in winter and spring.
However, a demand exists because relative cheap strawberries are imported and the Icelandic producers can hardly compete with the price of imported strawberries. Strawberry production in the greenhouse is based on producing strawberries at times where cheap strawberries are not available. "Sonata" and "Elsanta" are the most common strawberry varieties abroad and also in Iceland.
Since several years is it tradition to grow strawberries in heated greenhouses in the Netherlands and Belgium. Also, the Norwegians are experimenting with greenhouse cultivation of strawberries during winter (e.g. Verheul et al., 2007). The question is whether this can also be pursued in Iceland. It is difficult to cultivate strawberries on high latitudes like in Iceland, because there are short days and little daylight from middle of September to middle of April and the low natural light level is the main limiting factor for a production in winter in greenhouses. Therefore, supplemental lighting is necessary to maintain an equal harvest over the year and this could make imports from lower latitudes unnecessary. Vegetables are grown during winter with supplemental lighting and the question is whether it is possible to extend the growing season of strawberries in the same way. Therefore, it should be considered if it is possible to use supplemental lighting when active radiation (PAR) falls below the critical value in production of strawberries.
5 2
In strawberries is it necessary to use supplemental lighting for 12 to 13 hours (Verheul et al., 2007). Longer lighting reduced the number of flowers. A day temperature of 18 °C and / or a night temperature of 12 °C was the best to get flowers and also at the shortest time.
At the nursery Kvistar were good results reached with minimal heating (day temperature of 16 °C and night temperature of 8 °C) in a plastic greenhouse in summer production. Under that conditions were 4 kg/m2 of strawberries possible and sold for 3.000 ISK / kg.
The positive influence of artificial lighting on plant growth, yield and quality of tomatoes (Demers et al., 1998a), cucumbers (Hao & Papadopoulos, 1999) and sweet pepper (Demers et al., 1998b) has been well studied. It is often assumed that an increment in light intensity results in the same yield increase. Indeed, yield of sweet pepper in the experimental greenhouse of the Agricultural University of Iceland at Reykir increased with light intensity (Stadler et al., 2010). However, with tomatoes, a higher light intensity resulted not (Stadler, 2012) or in only a slightly higher yield (Stadler, 2013a). Knowledge in growing berries at different light intensities is not yet available. Therefore, two light intensities will be tested to investigate if growing strawberries in winter is possible.
Incorporating lighting into a production strategy is an economic decision involving added costs versus potential returns. Therefore, the question arises whether these factors are leading to an appropriate yield of strawberries.
The objective of this study was to test if (1) the light intensity is affecting growth, yield and quality of strawberries, if (2) this parameter is converted efficiently into yield, and if (3) the profit margin can be improved by the chose of the light intensity. This study should enable to strengthen the knowledge on the best method of growing strawberries and give strawberry growers advice how to improve their production by modifying the efficiency of strawberry production.
6
3.1 Greenhouseexperiment
An experiment with strawberries (Fragaria x ananassa cv. Sonata) and different light intensities was conducted at the Agricultural University of Iceland at Reykir during winter / spring (part A) and spring / summer (part B). Four heavy tray plants were planted on 19.12.2014 for part A and on 13.04.2015 for part B in 5 l pots filled with moist strawberry substrate. The plants stayed into the young plants production chamber with 150 W/m2 until 19.01.2015 (part A)
until 12.05.2015 (part B). The temperature was adjusted to 16 °C / 12 °C (day / night) and the ventilation started with 20 °C.
7 3 MATERIALSANDMETHODS
respectively
Chamber5 30 0,36 m1,06 m0,36 m1,06 m0,36 m1,06 m0,36 m1,06 m0,36 m1,06 m0,36 m1,06 m0,36 m 30 100W/m2 Sonata 6,12m EDCBA 5. rep. 1,0 m 4. rep.3. rep.2. rep.1. rep. Chamber6 30 0,36 m1,06 m0,36 m1,060,36 m1,060,36 m1,060,36 m1,060,36 m1,060,36 m 30 150W/m2 Sonata 6,12m EDCBA 5. rep. 1,0 m 4. rep.3. rep.2. rep.1. rep. 10,06m 4plants perpot Shelter belt Shelter belt Shelter belt Shelter belt N Fig. 1: Experimental design of cabinets.
After four weeks in the young plants production chamber were pots moved into the growing chambers with different light intensities (see chapter “3.2 Treatments”). The strawberry pots were placed in rows in five 70 cm high beds (Fig. 1) with 8 cm between pots and 1,06 m between beds. One bed had 16 pots. Five replicates, one replicate in each bed consisting of one pots (4 plants) acted as subplots for measurements. The temperature was set on 16 °C during day and 8 °C during night. Carbon dioxide was provided (800 ppm CO2 with no ventilation and 400 ppm CO2 with ventilation). In part A was at the latter part of the harvest the amount increased to 1.200 ppm CO2. Bumblebees were used for pollination. A misting system was installed. Plant protection was managed by beneficial organisms. In part A was Rovral sprayed once after planting and about two weeks later Paraat against phythopthora. In part B was Paraat sprayed after planting and again after 10 days. After moving plants into the chambers with different light intensities was in both parts Loker sprayed once a week (see details in appendix).
In part A was the first 6 weeks after moving plants into the different chambers the fertilizer plan accoring to Azelis used (Tab. 1a) and after that the fertilizer plan according to DLV plant (Tab. 1b). In part B was during the whole growth period the fertilizer plan according to DLV plant used. Tab. 1a: Fertilizer mixture according to advice from Azelis.
solution
(1000
8
Stem
A
l) Stem solution B (1000 l) Irrigation water Relation Fertilizer (amount in kg) (amount in l)* Calcium nitrate Pioner NPK Red 9-5-30 Pioner NPK Yellow 10-4-25 Potassium sulfate Pioner Mikro Plus * Pioner Iron Chelate EDDHA 6 % Resistim (as needed)* E.C. (mS/cm) Planting – 10 white fruits / plant (growth) 75 50 50 25 14 0,5 10 1,6 1:150 10 white fruits / plant – harvest end (fruit development) 75 100 25 14 0,5 1,6 1:150
Planting – 10 white fruits / plant (growth) 21,8 62,5 6,45 0,535,9 17 29,1 510140 27 21012 1,5 1:100
10 white fruits / plant – harvest end (fruit development)
74,1 7,16 3,235,2 17 41,8 590140 25 26014 1,5 1:100
Plants were irrigated through drip irrigation (1 tube per bucket). The watering was set up that the plants could root well down, which means no runoff after planting and a low amount of runoff in the first 2-3 weeks. At the growing stage was the irrigation arranged to 10-20 % runoff on sunny days and 0-5 % on cloudy days with an E.C in the drip of 1,5-1,7. At flowering and carrying green fruits was the runoff supposed to be 25-30 % on sunny days and 10-15 % on cloudy days with a lowering of E.C. from 1,7 to 1,5 one week before harvest. The E.C. of the input and runoff water is supposed to be adjusted that their sum is 3,2-3,3 during growth and flowering and 3,0-3,1 during harvest. In geneneral was the rule that the first drip in the morning should not give runoff. 100 ml/drip was irrigated in 2,5 h intervals (first at 5.00 and last at 17.00) with E.C. 1,6 and pH 5,8.
9 Tab. 1b: Fertilizer mixture according to advice from DLV plant. Stem solution A (1000 l) –––––– Stem solution B ––––––(1000 l) Irrigation water Relation Fertilizer (amount in kg) (amount in l) * (amount in g) ** Calciumnitrate liquid * Calciumnitrate Fe-DTPA 3 % vlb Potassium sulfate Magnesium sulfate Monopotassium phosphate Potassium nitrate Mangansulfat 32,5 % Mn ** Borax 11,3 % B ** Koparsulfat 24 % Cu ** Zinksulfat 23 % Zn ** Natriummolybdat 40 % Mo ** E.C. (mS/cm)
3.2 Treatments
Strawberries from part A were grown from 19.01-04.05.2015 and strawberries from part B from 12.05-22.07.2015 under high-pressure sodium lamps (HPS) in two chambers with different light intensities:
1. HPS top lighting 150 W/m2 HPS, 150 W/m2
2. HPS top lighting 100 W/m2 HPS, 100 W/m2
HPS lamps for top lighting (600 W bulbs) were mounted horizontally over the canopy. Light was provided for 18 hours. Half of the lamps went on at 03.00 and the other half at 03.30. Half of the lamps went off at 19.00 and the other half at 19.30. When lights went off it was 16 °C, at 9.00 10 °C, when half of the lamps went on it was 16 °C, when other half went on 18 °C. The lamps were automatically turned off when incoming illuminance was above the desired set-point.
3.3 Measurements,samplingandanalyses
Soil temperature and leaf temperature was measured once a week.
The amount of fertilization water (input and runoff) was measured every day and once analyzed for nutrients.
To be able to determine plant development, the number of leaves, the number of clusters and the number of open flowers was counted each week. This gave information regarding the total amount of flowers per plant and the number of flowers per cluster.
During the growth period were runners regularly taken away and the number per plant was registered. During the harvest period were berries regularly collected (2-3 times per week) in the subplots. Total fresh yield, number of fruits, fruit category (extra-class (> 25 mm), 1.class (18 mm) and not marketable fruits (too little fruits (< 18 mm), damaged fruits, misshaped fruits, moldy fruits) were determined. At the end of the harvest period was on each plant the number of immature fruits counted. The marketable yield of the whole chamber at each light intensity was also measured.
10
The interior quality of the berries was determined. A brix meter (Pocket Refractometer PAL-1, ATAGO, Tokyo, Japan) was used to measure sugar content in the strawberries during the growth period. From the same harvest, the flavour of fresh fruits was examined in tasting experiments with untrained assessors. Also, subsamples of the fruits were dried at 105 °C for 24 h to measure dry matter yield (DM).
Energy use efficiency (total cumulative yield in weight per kWh) and costs for lighting per kg yield were calculated for economic evaluation and the profit margin was determined.
3.4 Statisticalanalyses
SAS Version 9.4 was used for statistical evaluations. The results were subjected to one-way analyses of variance with the significance of the means tested with a Tukey/Kramer HSD-test at p ≤ 0,05.
4 RESULTS
4.1 Environmentalconditionsforgrowing
4.1.1 Solar irradiation
Solar irradiation was allowed to come into the greenhouse. Therefore, incoming solar irradiation is affecting plant development and was regularly measured. Solar irradiation was lower for part A than for part B. For part A increased the natural light
Fig. 2: Time course of solar irradiation for part A (a) and part B (b). Solar irradiation was measured every day and values for one week were cumulated.
11
level with proceeding growth period. At the beginning of March were 5 kWh/m2 reached, at the end of March more than 10 kWh/m2 and at the end of the experiment more than 20 kWh/m2. In contrast, part B was conducted during longer days and solar irradiation stayed during the whole growth period at around 15-25 kWh/m2 (Fig. 2).
4.1.2 Chamber settings
The settings in the chambers were regularly recorded. Table 2 shows the weekly average of the CO2 amount, the air and floor temperature. The settings were mainly equal between the different light intensities. However, in part A was in week 1 the CO2 amount higher and the air temperature lower at 100 W/m2 compared to 150 W/m2. Also, in week 5 was the floor temperature lower at the lower light intensity. In part B was the CO2 amount in week 1, in week 4-7, week 9 and week 10 higher in the chamber with the lower light intensity. In addition, the temperature on the floor was in week 9 and week 10 also higher at 100 W/m2 compared to 150 W/m2
2: Chamber settings for part A and part B.
Part A Part B
16,7
16,6 16,5
17,3 17,3 28,7
505 18,0 17,9 27,1 27,9
16,5 16,6 34,6 32,8 467 495 18,0 18,1 27,4 27,1
16,5 16,4 37,5 37,1
483 17,9 18,0 28,7 29,4
16,9 16,6 39,0 39,1 449 476 19,7 19,6 30,0 30,3
18,0 17,7 37,2 37,0 447 464 20,4 20,5 28,5 29,0
17,3 17,2 38,7 38,7 463 486 19,7 19,9 22,3 23,4
17,0 16,8 38,7 38,8
16,5 16,4 38,7 38,7
16,5 16,4 34,6
16,1 16,2 31,5
15,3 30,5
15,4 30,8
484 19,3 19,3 18,5 19,8
12
Table
CO2 (ppm) Air (°C) Floor (°C) CO2 (ppm) Air (°C) Floor (°C) Week * 150 100 150 100 150 100 150 100 150 100 150 100 no –––––––––– W/m2 –––––––––– –––––––––– W/m2 ––––––––––1 621 669 17,2 16,5 28,8 29,5 720 782 16,7
32,4 33,3 2 755 759 16,5 16,1 28,3 28,8 505 512
27,0 27,6 3 809 817 16,9 16,8 29,6 30,2 575 587
29,1 4 869 878 16,5 16,5 32,1 32,6 424
5 884 904
6 871 884
453
7 833 854
8 582 602
9 847 824
10 773 781
433
11 781 793
12 879 883
35,2 13 1047 1045
32,5 14 1124 1126 15,2
31,5 15 1080 1079 15,5
31,6 * weekaftermovingpotsintochamberswithdifferentlightintensities
4.1.3 Soil temperature
Soil temperature was measured weekly at low solar radiation in the morning (at about 08.30). In part A and part B was soil temperature most of the time higher at the higher light intensity. In part A fluctuated soil temperature most of the time between 15-18° C, while in part B increased soil temperature from 17 °C to 19 °C (Fig. 3).
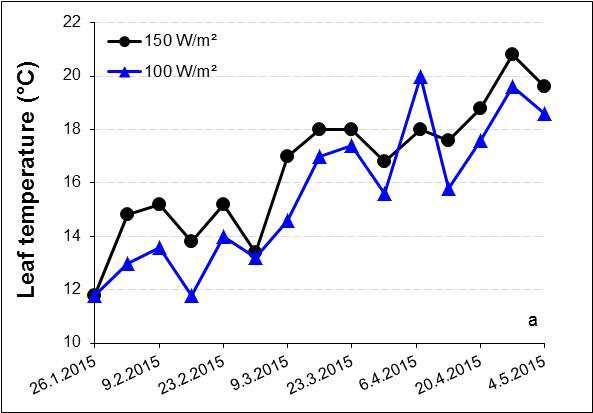
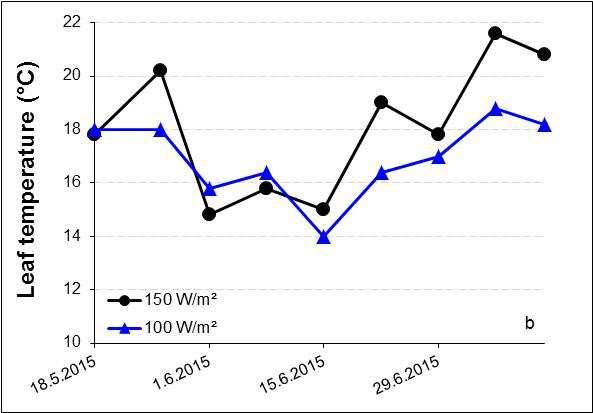
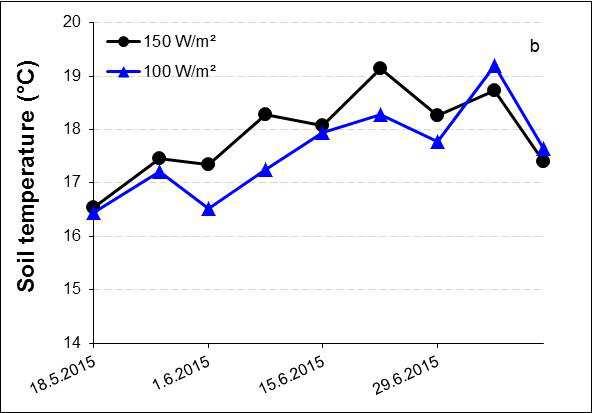
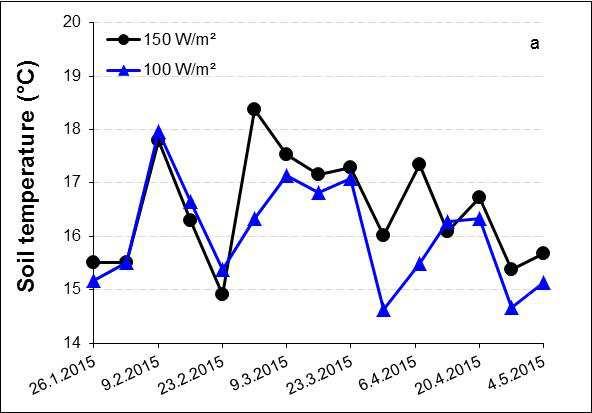
Fig. 3: Soil temperature for part A (a) and part B (b). The soil temperature was measured at little solar irradiation early in the morning.
4.1.4 Leaf temperature
Leaf temperature was measured weekly at low solar radiation in the morning (at about 08.30). In part A and part B was leaf temperature most of the time higher at the higher light intensity. In part A increased leaf temperature from 12 °C to 20 °C, while for part B fluctuated leaf temperature between 14-22 °C (Fig. 4).
Fig. 4: Leaf temperature for part A (a) and part B (b). The soil temperature was measured at little solar irradiation early in the morning.
13
4.1.5 Irrigation of strawberries
The amount of applied water increased with longer growth of the strawberries from about 100 ml/plant to about 500 ml/plant in part A and from 200 ml/plant to about 500 ml/plant in part B. The amount of applied water was higher at the higher light intensity (Fig. 5).
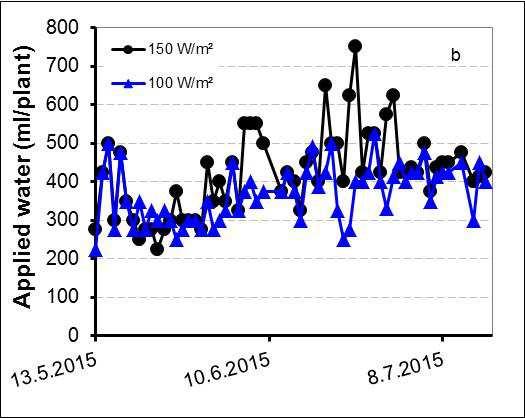
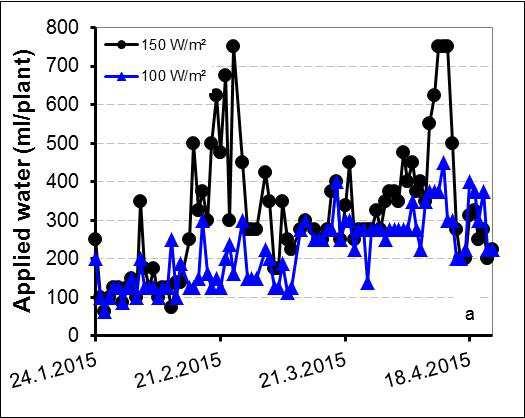
Fig. 5: Daily applied water for part A (a) and part B (b).
E.C. and pH of irrigation water was fluctuating much (Fig. 6a, b). The E.C. of applied water ranged most of the time between 1,2-1,8 and the pH between 5,0-6,5. The E.C. of runoff stayed mostly between 1,4-2,4 and the pH of runoff between 4,5-7,5. The pH of runoff seems to decrease during the growth period (Fig. 7a, b).
14
Fig. 6: E.C. and pH of irrigation water for part A (a) and part B (b).
1 5
Fig. 7: E.C. and pH of runoff of irrigation water for part A (a) and part B (b).
1 6
The amount of runoff from applied irrigation water was about 5-25 % (Fig. 8). The runoff seems to be lower for the higher light intensity. Water samples taken from the drip and the runoff water provide an information basis on which nutrients are close to the target of the drain water. Samples taken on the 16.02.2015 showed a high pH and a high S content and Cu content, while the Mn and Mo content was low, independent of chambers (data not shown).
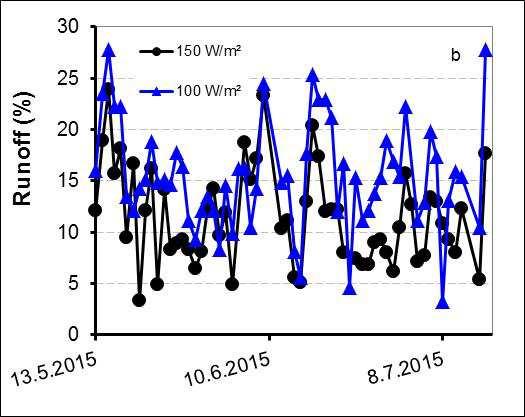
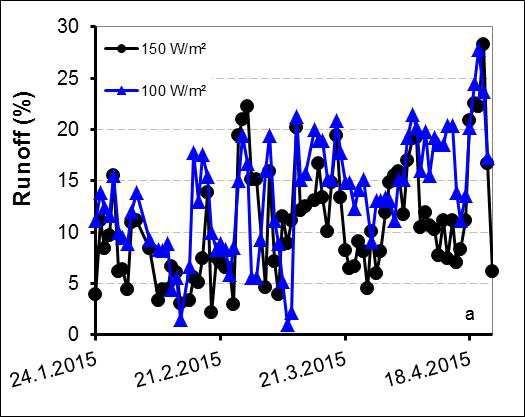
Fig. 8: Proportion of amount of runoff from applied irrigation water for part A (a) and part B (b).
4.2 Developmentofstrawberries
4.2.1 Number of leaves
Strawberry plants had more leaves in the winter / spring crop, while the number of leaves was lower in the spring / summer crop. The number of leaves stayed more or less stable between 18-20 in part A (Fig. 9a), while the number of leaves increased from 12-19 in part B (Fig. 9b). No differences in the number of leaves regarding the two light intensities were observed.

Fig. 9: Number of leaves at strawberry plants for part A (a) and part B (b).
17
4.2.1 Number of runners
Strawberry plants had more runners in the winter / spring crop, while the number of runners was lower in the spring / summer crop. The number of runners was tendentially (Fig. 10a) respectively significantly (Fig. 10b) increased at the higher light intensity.
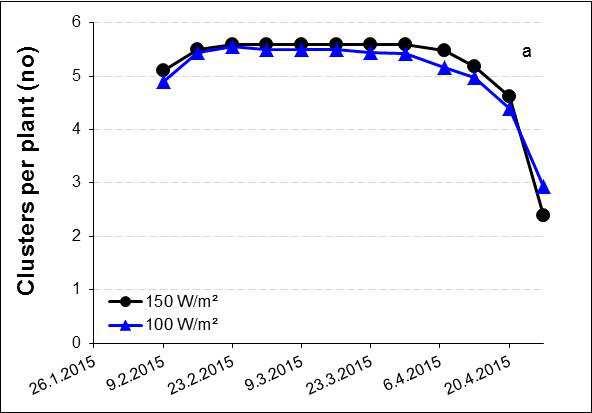
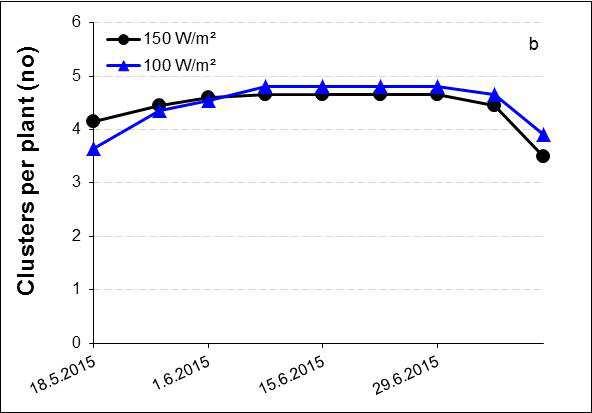
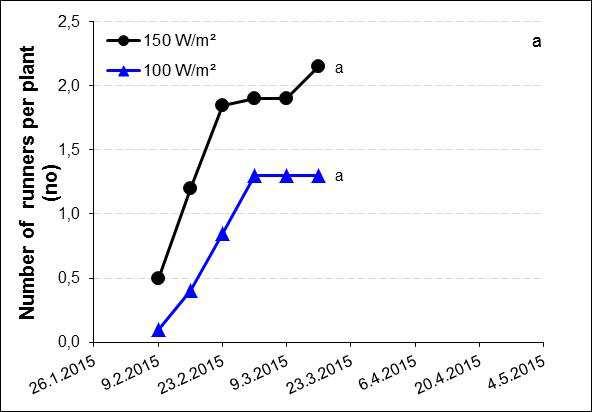
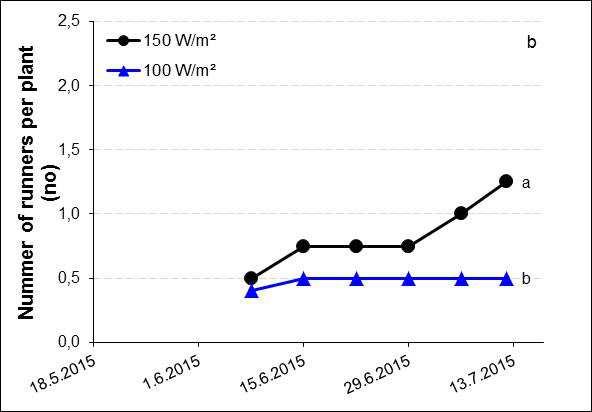
Fig. 10: Number of runners at strawberry plants for part A (a) and part B (b). Lettersindicatesignificantdifferencesattheendoftheexperiment(HSD,p ≤ 0,05).
4.2.2 Number of clusters
The number of clusters with flowers and / or fruits increased until the beginning of harvest and decreased after that when all fruits from a cluster were harvested. No differences in the number of clusters were observed between different light intensities (Fig. 11).
Fig. 11: Number of clusters for part A (a) and part B (b).
18
4.2.3 Open flowers / fruits per cluster
The number of open flowers / fruits per cluster reached 10-12 when harvest started. After that the number decreased naturally due to harvested fruits. It seems that the number of open flowers / fruits per cluster was a bit higher for the higher light intensity for part A, while this was not observed for part B. In part A, it seems that the number of open flowers / fruits decreased with the same spead (Fig. 12a). In contrast, in part B was this behaviour delayed for the lower light intensity compared to the higher light intensity (Fig. 12b).
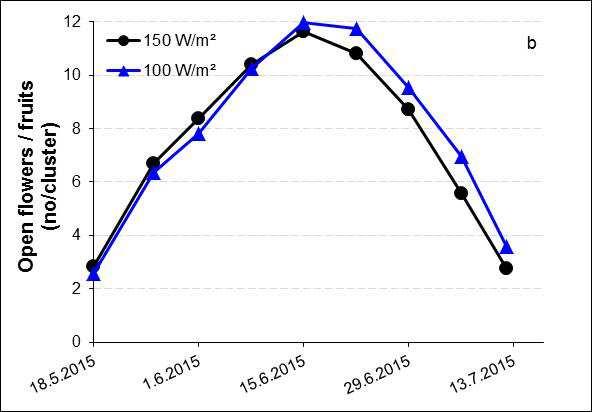
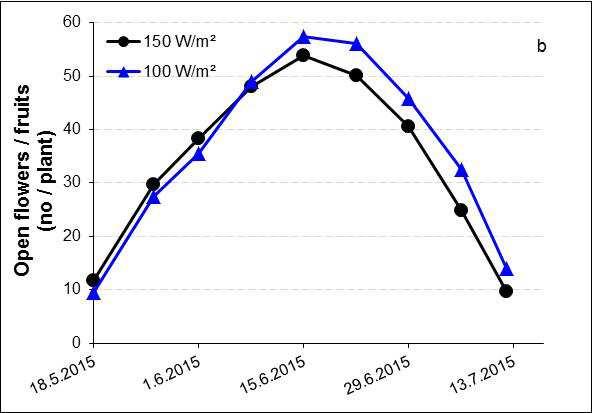
Fig. 12: Number of clusters per cluster for part A (a) and part B (b).
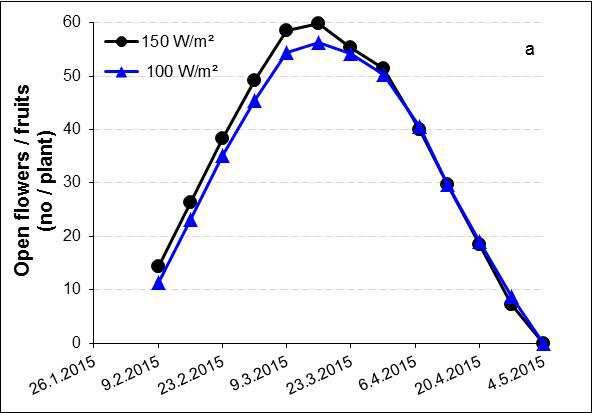
4.2.4 Open flowers / fruits per plant
The number of open flowers / fruits per plant reached about 60 for the higher light intensity and about 55 for the lower light intensity in part A before harvest started (Fig. 13a). However, in part B was it the other way round: The lower light intensity had nearly 60 open flowers / fruits per plant, while the higher light intensity had nearly 55 (Fig. 13b). Thereafter decreased this number naturally due to harvested fruits. In
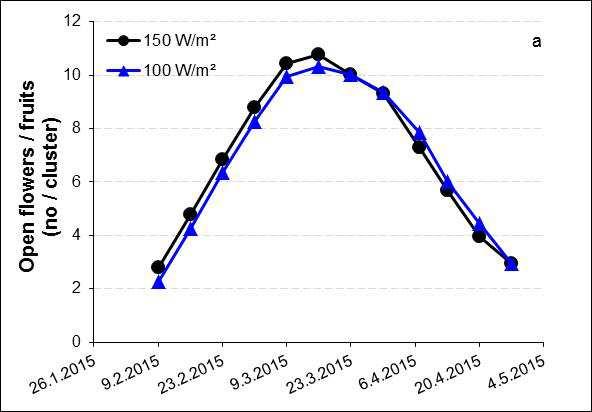
Fig. 13: Open flowers / fruits per cluster for part A (a) and part B (b).
19
part A, it seems that the number of open flowers / fruits decreased with the same spead (Fig. 13a). In contrast, in part B was this behaviour delayed for the lower light intensity when compared to the higher light intensity (Fig. 13b).
4.3 Yield
4.3.1 Total yield of strawberries
The yield of strawberries included all harvested red fruits during the growth period. The fruits were classified in extra-class (> 25 mm), 1. class (18 mm) and not marketable fruits (too little fruits (< 18 mm), damaged fruits, misshaped fruits, moldy fruits and green fruits at the end of the harvest period).
Cumulative total yield of strawberries ranged between 0,57-0,63 g/plant for part A (Fig. 14a) and 0,43-0,50 g/plant for part B (Fig. 14b). A higher light intensity increased tendentially total yield in both croppings.
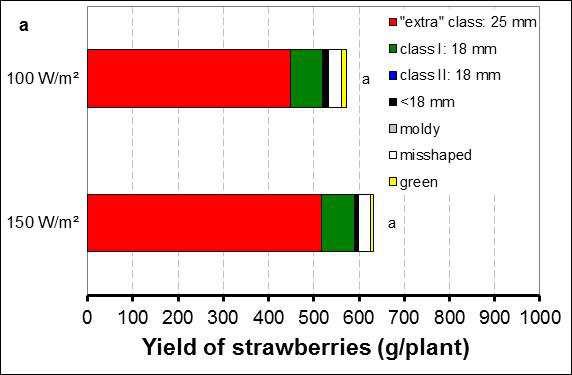
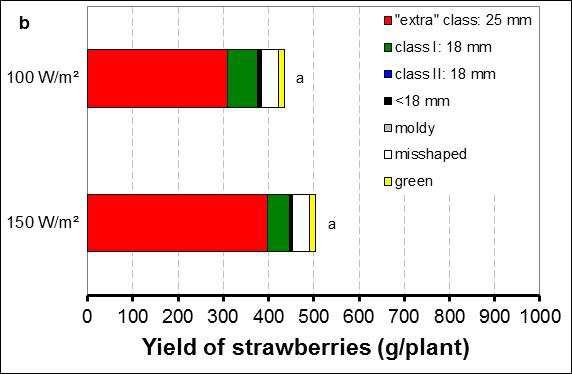
Fig. 14: Cumulative total yield of strawberries for part A (a) and part B (b). Lettersindicatesignificantdifferencesattheendoftheexperiment(HSD,p ≤ 0,05).
4.3.2 Marketable yield of strawberries
Both light intensities had a higher yield at the winter / spring crop (part A) than in the spring / summer crop (part B). At the end of the harvest period amounted yield of strawberries 0,5-0,6 g/plant for part A (Fig. 15a) and 0,35-0,45 g/plant for part B (Fig. 15b). No significant yield differences between the two light intensities were observed. However, the marketable yield was tendentially higher at the higher light intensity. A 50 % increase in light intensity resulted in an increase in yield of 13 % / 19 % (part A / part B), which is equivalent to a yield increase of 0,27 % / 0,38 % (part A / part B) at 1 % increase in light intensity. Differences between different light intensities developed at the beginning of the harvest period,
20
both for the winter / spring crop as well as for the spring / summer crop. Differences between the two light intensities decreased later in the harvest period (Fig. 15).
Fig. 15: Time course of accumulated marketable yield of strawberries for part A (a) and part B (b).
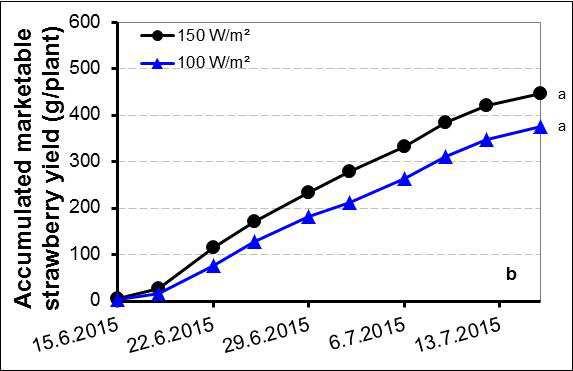
Lettersindicatesignificantdifferencesattheendoftheexperiment(HSD,p ≤ 0,05).
Also the marketable yield of the whole chamber was measured. In both parts was a higher marketable yield reached with a higher light intensity (Fig. 16). The yield increase of 150 W/m2 compared to 100 W/m2 was 21 % / 14 % (part A / part B).
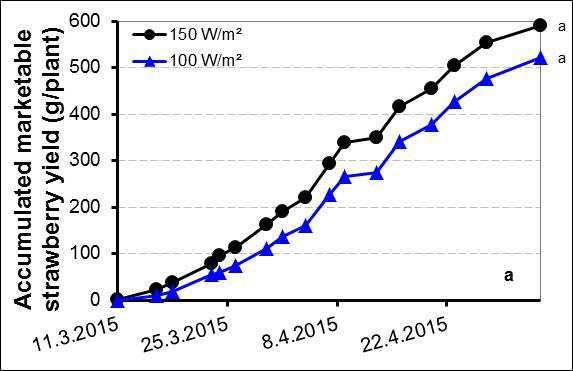
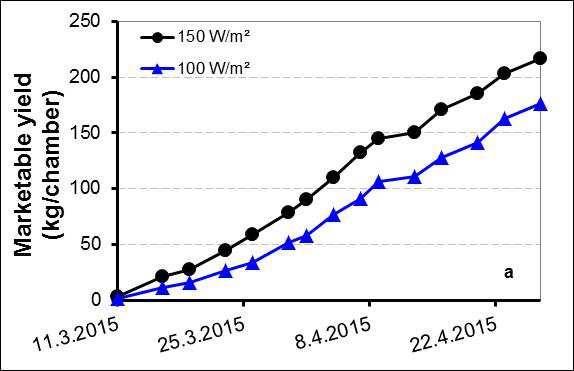
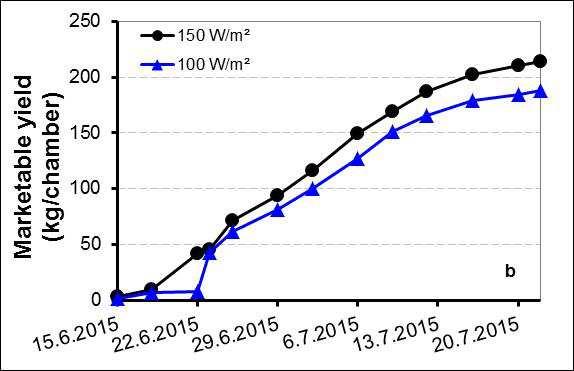
Fig. 16: Time course of accumulated marketable yield of strawberries for the whole chamber for part A (a) and part B (b).
Lettersindicatesignificantdifferencesattheendoftheexperiment(HSD,p ≤ 0,05).
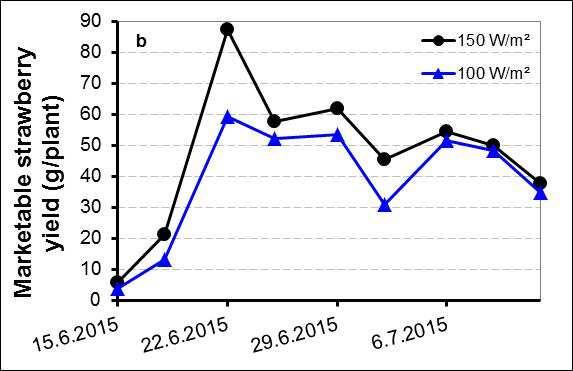
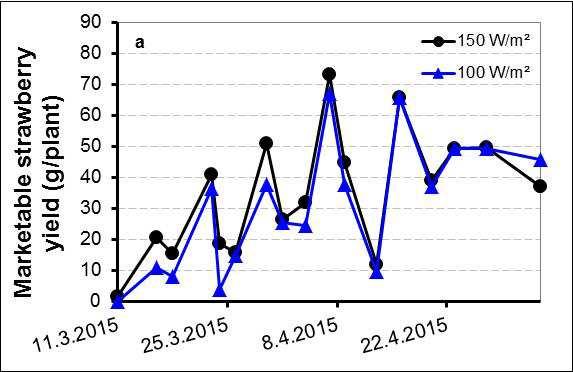
In part A and part B increased the harvested amount of strawberries until the middle of the growth (part A) respectively until the first third of the harvest period (part B) and decreased thereafter (Fig. 17). In part A was the marketable strawberry yield until the middle of the harvest period higher at the higher light intensity, while after that, yield was comparable between the two tested light intensities (Fig. 17a). In part B, was the higher yield of the higher light intensity until two thirds of the harvest
21
period even more obvious and after that was yield more or less comparable between light intensities (Fig. 17b).
Fig. 17: Time course of marketable yield for part A (a) and part B (b).
The number of extra class fruits was significantly higher for the higher light intensity for both, part A and part B (Tab. 3). In contrast, in the first and second class fruits were no statistically differences between the tested light intensities found.
Tab. 3: Cumulative total number of marketable fruits for part A and part B. Treatment Number of marketable fruits extra class class I + II (no/plant) (no/plant)
Part A 150 W/m2 45 a 14 a 100 W/m2 38 b 14 a Part B
150 W/m2 30 a 9 a 100 W/m2 25 b 13 a
Lettersindicatesignificantdifferences(HSD,p ≤ 0,05).
Average fruit size of marketable fruits decreased with a longer harvest period from 15-23 g/fruit to about 7 g/fruit. While in part A no differences in the average weight between different light intensities were measured (Fig. 18a), was in part B in average a higher average fruit yield determined for the higher light intensity (Fig. 18b).
22
Fig. 18: Average weight of strawberries for part A (a) and part B (b).
To observe the success of flowering until harvest, flowers were marked and followed from pollination until harvest. Flowers were within 1-2 days pollinated (data not shown). Number of days from pollination to harvest was about 30-50 days in part A (Fig. 19a) and about 30-40 days in part B (Fig. 19b). In average took it 42 days up to harvest in part A while in part B passed 35 days at the higher light intensity and 33 days at the lower light intensity. No relationship was found between the number of days from pollination to harvest and the weight of the fruit.
Fig. 19: Number of days from pollination to harvest and weight of the harvested fruit for part A (a) and part B (b).
The first 1-2 weeks of harvest were less fruits ripe compared to the weeks after that. After the second week increased the harvest and stayed constantly at about 10 fruits per week in part A. In contrast, in part B increased the number of weekly harvested fruits week after week during the whole harvest period. Naturally, with the beginning of the harvest, decreased the number of open flowers and fruits. The number of “harvested and open flowers / fruits” is the sum of the harvested fruits and the number of open flowers / fruits that was registered at weekly measurements. This
23
number was fluctuating at about 60 flowers / fruits in part A, while there was a decline from about 60 to 50 in part B (Fig. 20).
Fig. 20: Development of open flowers / fruits, harvested fruits and their sum during the growth of the strawberries for part A (a) and part B (b).
4.3.3 Outer quality of yield
Marketable yield was about 90 % in part A and less than 90 % in part B (Tab. 4). The proportion of fruits in “extra class” was higher with a higher light intensity. The proportion of misshaped fruits was higher in part B, due to a problem with overpollination.
Tab. 4: Proportion of marketable and unmarketable yield for part A and part B.
yield
green
24
Treatment Marketable yield Unmarketable
extra class 1.class2.classtoolittle weight moldy misshaped
–––––– % ––––––––– % Part A 150 W/m2 82 12 0 1 0 4 1 100 W/m2 78 12 1 2 0 5 2 Part B 150W/m2 79 9 0 1 0 8 3 100W/m2 71 15 0 2 0 9 3
4.3.4 Interior quality of yield
4.3.4.1 Sugar content
Sugar content of strawberries was measured once during the harvest period (part A: 16.04.2015, part B: 29.06.2015) and was around 7. The higher light intensity had a tendentially higher value (Fig. 21).
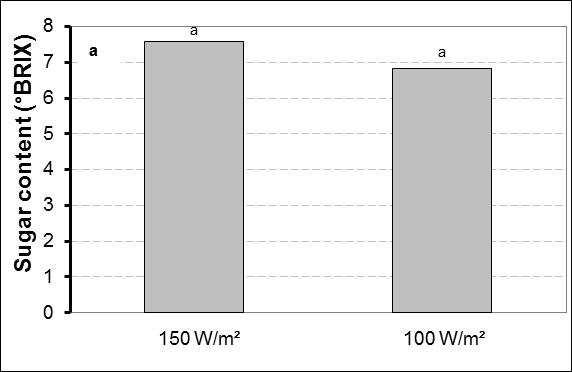
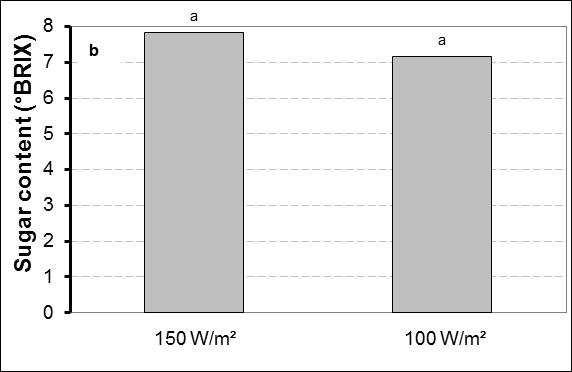
Fig. 21: Sugar content of strawberries for part A (a) and part B (b). Lettersindicatesignificantdifferencesattheendoftheexperiment(HSD,p ≤ 0,05).
4.3.4.2 Taste of strawberries
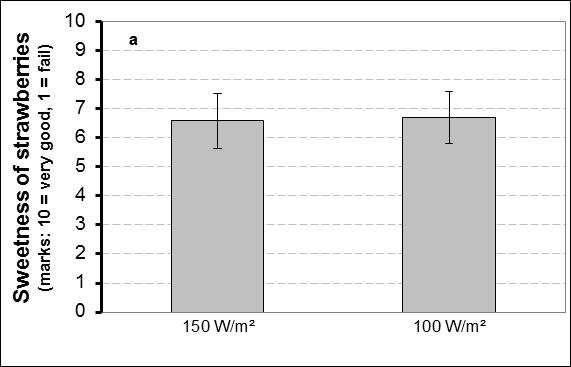
The taste of strawberries, subdivided into sweetness, flavour, juiciness and firmness was tested by untrained assessors on 16.04.2015 in part A and on 30.06.2015 in part B. The rating within the same sample was varying very much and therefore, same treatments resulted in a high standard deviation. It seems that with a higher light intensity the flavour and the firmness of the strawberries increased tendentially in part A (Fig. 22a). Also, in part B was the firmness tendentially increased with a higher light intensity (Fig. 22b). Between the other treatments were no obvious differences observed.
25
Fig. 22: Sweetness, flavour, juiciness and firmness of strawberries for part A (a) and part B (b).
26
4.3.4.3 Dry substance of fruits
Dry substance (DS) of strawberries was measured once during the harvest period and amounted 7-8 % (Fig. 23). It seems that the treatment with the higher light intensity had a slightly higher dry substance content.
Fig. 23: Dry substance of strawberries for part A (a) and part B (b).
4.4 Economics
4.4.1
Lighting hours
The number of lighting hours is contributing to high annual costs and needs therefore special consideration to consider to decrease lighting costs per kg marketable yield. The total hours of lighting during the growth period of strawberries were both simulated and measured with dataloggers.
The simulated value was calculated according to the lighting hours written down. However, there it was not adjusted for automatic turn off, when incoming solar radiation was above a set-point (Tab. 5a, 5b). The measured lighting hours were higher for the chamber with the higher light intensity, because the set-point was reached later compared to the chamber with the lower light intensity.
For calculation of the power, different electric consumptions were made, because the actual consumption is higher than the nominal value of the bulb: one was based on the power of the lamps (nominal Watts, 0 % more power consumption), one with 6 % more power consumption and one for 10 % more power consumption. The power was in part A lower for the measured values than for the simulated ones, while this value was comparable for part B.
27
Tab. 5a: Lighting hours, power and energy in the cabinets for part A.
Treatment Hours Power Energy Energy/m2 h W kWh kWh/m2
HPS 150 W/m²
Measured values 1.241 218 13.526 271
Simulated values
0 % more power consumption (nominal) 1.592 150 11.940 239
6 % more power consumption 1.592 159 12.656 253 10 % more power consumption 1.592 165 13.134 263
HPS 100 W/m²
Measured values 1.209 145 8.775 175
Simulated values
0 % more power consumption (nominal) 1.592 100 7.960 159
6 % more power consumption 1.592 106 8.438 169 10 % more power consumption 1.592 110 8.756 175
Tab. 5b: Lighting hours, power and energy in the cabinets for part B.
Treatment Hours Power Energy Energy/m2 h W kWh kWh/m2
HPS 150 W/m²
Measured values 501 150 3.765 75
Simulated values
0 % more power consumption (nominal) 1.120 150 8.400 168
6 % more power consumption 1.120 159 8.904 178 10 % more power consumption 1.120 165 9.240 185 HPS 100 W/m²
Measured values 460 99 2.268 45
Simulated values
0 % more power consumption (nominal) 1.120 100 5.600 112 6 % more power consumption 1.120 106 5.936 119 10 % more power consumption 1.120 110 6.160 123
4.4.2 Energy prices
Since the application of the electricity law 65/2003 in 2005, the cost for electricity has been split between the monopolist access to utilities, transmission and distribution and the competitive part, the electricity itself. Most growers are, due to their location, mandatory customers of RARIK, the distribution system operator (DSO) for most of Iceland except in the Southwest and Westfjords (Eggertsson, 2009).
RARIK offers basically three types of tariffs:
a) energy tariffs, for smaller customers, that only pay fixed price per kWh,
28
b) “time dependent” tariffs (tímaháður taxti, Orkutaxti TT000) with high prices during the day (09.00-20.00) at working days (Monday to Friday) but much lower during the night and weekends and summer, and
c) demand based tariffs (afltaxti AT000), for larger users, who pay according to the maximum power demand.
In the report, only afltaxti is used as the two other types of tariffs are not economic. Since 2009, RARIK has offered special high voltage tariffs (“VA410” and “VA430”) for large users, that must either be located close to substation of the transmission system operator (TSO) or able to pay considerable upfront fee for the connection.
Costs for distribution are divided into an annual fee and costs for the consumption based on used energy (kWh) and maximum power demand (kW) respectively the costs at special times of usage. The annual fee is pretty low for “VA210” and “VA230” when subdivided to the growing area and is therefore not included into the calculation. However, the annual fee for “VA410” and “VA430” is much higher.
Growers in an urban area in “RARIK areas” can choose between different tariffs. In the report only the possibly most used tariffs “VA210” and “VA410” in urban areas and “VA230” and “VA430” in rural areas are considered.
The government subsidises the distribution cost of growers that comply to certain criteria’s. Currently 87 % and 92 % of variable cost of distribution for urban and rural areas respectively. This amount can be expected to change in the future.
Based on this percentage of subsidy and the lighting hours (Tab. 5), for the cabinets the energy costs per m2 during the time of the experiment for the growers were calculated (Tab. 6).
In part A are the energy costs per kWh for distribution after subsides around 0,67-0,80 ISK/kWh for „VA210“ and „VA230“, around 0,58-0,71 ISK/kWh for „VA410“ and 0,47-0,55 ISK/kWh for „VA430“. The energy costs for sale are for „Afltaxti“ around 6,51-7,36 ISK/kWh and for „Orkutaxti“ around 5,85-7,24 ISK/kWh.
In part B are the energy costs per kWh for distribution after subsides around 0,91-1,65 ISK/kWh for „VA210“ and „VA230“, around 0,84-1,55 ISK/kWh for „VA410“ and 0,63-1,07 ISK/kWh for „VA430“. The energy costs for sale are for „Afltaxti“ around 1,86-11,13 ISK/kWh and for „Orkutaxti“ around 2,61-3,16 ISK/kWh.
29
Cost of electricity was lower for the calculated values (Tab. 6). In general, tariffs for large users rendered lower cost.
Tab. 6a: Costs for consumption of energy for distribution and sale of energy for part A.
Costsforconsumption
Treatment
100W/m²
RARIKUrban
87%subsidyfromthestate VA210
0,78 0,67 0,80 0,67 211 160 169 176 140 107 113 117 VA410 0,69 0,58 0,71 0,58 187 139 147 153 124 92 98 102
RARIKRural
92%subsidyfromthestate VA230 0,78 0,68 0,79 0,68 211 162 172 178 139 108 115 119 VA430 0,54 0,47 0,55 0,47 146 275 291 302 96 75 80 83
SALE
Comments:Thefirstnumberforthecalculatedvalueiswith0%morepowerconsumption,thesecond value with
more power consumption and the last value with 10% more power consumption.
30
Energy ISK/kWh Energycostswithsubsidyperm2 ISK/m2
150W/m²
150W/m² 100W/m² real calculated real calculated real calculated real calculated DISTRIBUTION
Afltaxti Orkutaxti 7,26 7,20 6,51 5,85 7,36 7,24 6,51 5,85 1.624 1.260 1.336 1.386 1.057 840 891 924
6%
PricesarefromApril2015.
Tab. 6b: Costs for consumption of energy for distribution and sale of energy for part B.
Costsforconsumption
ment
DISTRIBUTION
87%subsidyfromthestate VA210
RARIKUrban
1,54 0,93 1,65 0,93 116 156 166 172 75 104 110 115 VA410 1,44 0,84 1,55 0,84 108 141 149 155 70 94 100 103
RARIKRural
92%subsidyfromthestate VA230 1,46 0,91 1,56 0,91 110 154 163 169 71 102 109 113 VA430 1,00 0,63 1,07 0,63 75 106 112 117 49 71 75 78
SALE
with
31
Energy ISK/kWh Energycostswithsubsidyperm2 ISK/m2 Treat-
150W/m² 100W/m² 150W/m² 100W/m² real calculated real calculated real calculated real calculated
Afltaxti Orkutaxti 10,37 2,61 1,86 3,16 11,13 2,61 1,86 3,16 196 312 331 344 118 208 221 229 Comments:Thefirstnumberforthecalculatedvalueiswith0%morepowerconsumption,thesecond value with 6% more power consumption and the last value
10% more power consumption. PricesarefromApril2015.
4.4.3
Costs of electricity in relation to yield
Costs of electricity in relation to yield for wintergrown strawberries were calculated (Tab. 7). While for the distribution several tariffs were possible, for the sale only the cheapest tariff was considered. The costs of electricity increased by around 30 % with a higher light intensity in part A and part B (Tab. 7). Tab. 7: Variable costs of electricity in relation to yield.
Urbanarea(Distribution+Sale)
VA210 259 200 212 220 191 151 160 166 58 88 93 96 43 69 74 76 VA410 255 197 209 217 189 149 158 164 57 85 90 93 42 67 71 74
Ruralarea(Distribution+Sale)
VA230 259 201 213 221 191 151 161 167 57 87 92 96 42 69 73 76 VA430 250 194 205 213 184 146 155 161 51 78 83 86 37 62 66 68
4.4.4 Profit margin
The profit margin is a parameter for the economy of growing a crop. It is calculated by substracting the variable costs from the revenues. The revenues itself, is the product of the price of the sale of the berries and kg yield. For each kg of strawberries, growers are getting about 2.600 ISK from Sölufélag garðyrkjumanna (SfG). Therefore, the revenues increased with more yield (Fig. 24).
32
Variablecostsofelectricityperkgyield ISK/kg PartA PartB Treatment 150W/m2 100W/m2 150W/m2 100W/m2 Yield/m2 7,1 6,3 5,4 4,5 real calculated real calculated real calculated real calculated
Fig. 24: Revenues at different treatments for part A (a) and part B (b).
When considering the results of previous chapter, one must keep in mind that there are other cost drivers in growing strawberries than electricity alone (Tab. 6). Among others, this are e.g. the costs for the plant itself (
500 ISK/m2), gutters and other material (
1.500 ISK/m2), soil
50 ISK/m2), costs for plant protection
300 ISK/m2) and beneficial organism (
200 ISK/m2), plant nutrition
100 ISK/m2), CO2 transport (
150 ISK/m2), liquid CO2 (
700 ISK/m2), the rent of the tank (
150 ISK/m2), material for packing (
150 ISK/m2), the rent of the green box (
400 ISK/m2) and transport costs from SfG (
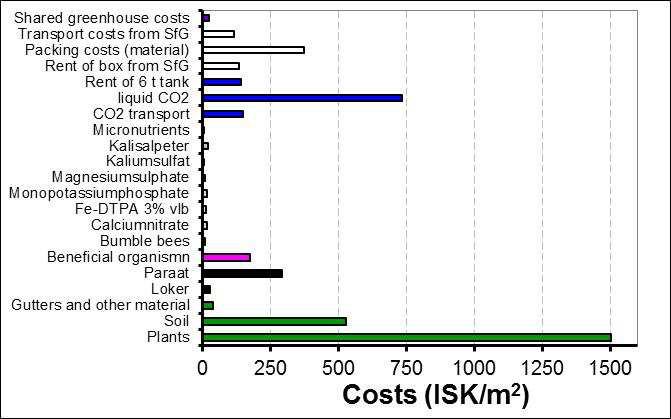
100 ISK/m2) (Fig. 25).
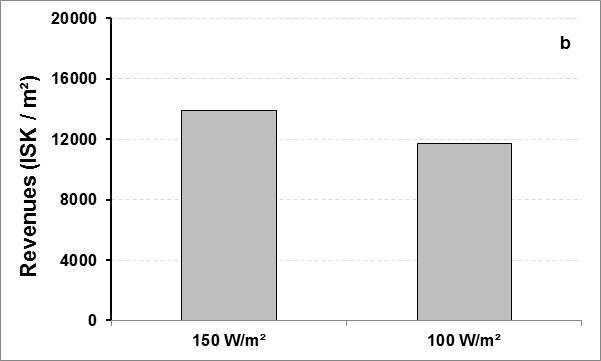
Fig. 25: Variable and fixed costs (without lighting and labour costs).
33
≈
(≈
≈
(≈
≈
(≈
≈
≈
≈
≈
≈
≈
2 2
Fig. 26: Division of variable and fixed costs (numbers from part A).
However, in Fig. 25 four of the biggest cost drivers are not included and these are the investment in lamps and bulbs, electricity, labour costs and the fee for SfG for selling the strawberries. These costs are also included in Fig. 26 and it is obvious, that especially the fee for selling the strawberries, the electricity as well as the labour costs are contributing much to the variable and fixed costs beside the costs for planting and CO2 costs.
A detailed composition of the variable costs at each treatment is shown in Tab. 8.
34
2 2
B
and fixed costs (ISK/m
35 Tab. 8: Profit margin of strawberries at different light treatments for part A and part B (urban area, VA210). Part A Part
Treatment 150 W/m2 100 W/m2 150 W/m2 100 W/m2 Marketable yield/m2 7,1 6,3 5,4 4,5 Sales SfG(ISK/kg) 1 2.600 2.600 2.600 2.600 Revenues (ISK/m2) 18.436 16.278 13.911 11.701 Variable
2) Electricitydistribution 2 211 140 116 75 Electricitysale 1.624 1.057 196 118 Strawberryplants 3 1.500 1.500 1.500 1.500 Soilforstrawberries 4 525 525 525 525 Pots 5 7 7 7 7 Tape 6 1 1 1 1 Gutters 7 28 28 28 28 Loker 8 27 27 27 27 Paraat 9 291 291 291 291 Beneficialorganismn 10 174 174 174 174 Bumblebees 11 6 6 6 6 Calciumnitrate 12 21 14 19 17 Ironchelate 13 15 12 14 12 Monopotassiumphosphate 14 23 16 22 19 Magnesiumsulfate 15 12 8 11 10 Potassiumsulfate 16 1 1 1 1 Potassiumnitrate 17 30 21 28 24 Micronutrients 18 2 2 2 2 CO2 transport 19 146 146 146 146 LiquidCO2 20 731 731 731 731 RentofCO2 tank 21 140 140 140 140 RentofboxfromSfG 22 140 123 105 89 Packingmaterial 23 394 348 298 250 FeeforSfG 24 1.985 1.753 1.498 1.260 TransportfromSfG 25 121 107 91 77 Sharedfixedcosts 26 24 24 24 24 Lamps 27 357 238 357 238 Bulbs 28 190 127 190 127 ∑ variable costs 8.707 7.555 6.531 5.902 Revenues -∑ variable costs 9.729 8.723 7.379 5.798 Workinghours(h/m2) 0,90 0,84 0,77 0,71 Salary(ISK/h) 1.436 1.436 1.436 1.436 Labourcosts(ISK/m2) 1.296 1.208 1.112 1.022 Profit margin (ISK/m2) 8.433 7.515 6.268 4.776
pricewinter2014/2015:2.600ISK/kg
assumption:urbanarea,tariff“VA210”,noannualfee(accordingtodataloggervalues)
100ISK/strawberryplant
3 soil
54ISK/pot;assumption:10yearslifetime,3circles/year
CO2 transportfromRvktoHveragerði/Flúðir:8,0ISK/kgCO2
liquidCO2:40,0ISK/kgCO2
rentfor6ttank:70.000ISK/month,assumption:rentinrelationto1.000m2 lightenedarea
85ISK/box
packingcosts(material):
costsforpackingofstrawberries(0,20kg):box:3ISK/0,20kg, lid:4ISK/0,20kg, label:1ISK/0,20kg
feeforSfGforsellingthestrawberries:45ISK/0,20kg
transportcostsfromSfG:2.575ISK/board
94ISK/m2/yearforcommonelectricity,realpropertyandmaintenance
HPSlights:30.000ISK/lamp,lifetime:8years
HPSbulbs:4.000ISK/bulb,lifetime:2years
The profit margin was dependent on the treatment (Fig. 27). In part A, the profit margin was with about 8.400 ISK/m2 highest with the higher light intensity and about 1.000 lower for the lower light intensity. Again, in part B was the profit margin with about 6.300 ISK/m2 highest at the higher light intensity and about 1.500 ISK/m2 lower for the lower light intensity. That means an increase of the light intensity by 50 W/m2 , from 100 W/m2 to 150 W/m2, roose the profit margin by 1.000-1.5000 ISK/m2. For both, part A and part B, a larger use (higher tariff: “VA 410” compared to “VA 210”, “VA 430” compared to “VA 230”), did not influence the profit margin. Also, it did not matter if the greenhouse is situated in an urban or rural area, the profit margin was comparable. However, at a higher tariff there was a surprisingly small advantage of rural areas due to the state subsidies (Fig. 27).
36 1
2
3
4 63.000ISK/4,5m
5
6 4.500ISK/bundoftape;assumption:10yearslifetime,3circles/year 7 660ISK/mgutter;assumption:10yearslifetime,3circles/year 8 4.790ISK/5lLoker;assumption:sprayingonceperweek(~8timespergrowingseason) 9 34.950ISK/bundParaat;assumption:sprayingtwicepergrowingseason,400ml/pot 10 5.212ISK/unitaphidpredator(aphidoletes) 11 4.900ISK/unitbumblebees 12 2.750ISK/25kgCalciumnitrate 13 17.050ISK/25kgIronchelate 14 7.050ISK/25kgMonopotassiumphosphate 15 1.700ISK/25kgMagnesiumsulfate 16 3.550ISK/25kgPotassiumsulfate 17 4.175ISK/25kgPotassiumnitrate 18 33.900ISK/5kgmicronutrients 19
20
21
22
23
24
25
26
27
28
5
DISCUSSION
5.1 Yield in dependence of the light intensity
Strawberry plants need to have strong vegetative growth in order to flower and to produce berries. In winter production is flower induction highly dependent on the supplemental light. At the two tested light intensities was the number of flowers increased at the higher light intensity, which resulted in the possibility to enhance strawberry productivity to a quite big extent by distributing a higher amount of light intensity. Marcelis et al. (2006) reported the general rule, that 1 % increase of light intensity results in a yield increase of 0,7-1,0 % for fruit vegetables, 0,8-1,0% for soil grown vegetables, 0,6-1,0 % for cut flowers, 0,25-1,25 % for bulb flowers, 0,5-1,0 % for flowering pot plants and 0,65 % for non-flowering pot plants. No values were indicated for berries. In the present findings, values of 0,3-0,4 % were found and are with that much lower than the above mentioned ones.
The reason for the higher yield at higher light intensity was an increased number of harvested extra class fruits and in addition, to a smaller extend, a higher average weight of strawberries in part B, while no effect of light intensity on average weight was observed in part A. Also, for fruit vegetables the reason for the higher yield at a higher light intensity was attributed to more, rather than heavier fruits of sweet pepper (Stadler, 2010) and tomatoes (Stadler, 2013a; Stadler 2013b).
However, in the literature there are also other explanations for a higher yield. For example, pulled Lorenzo & Castilla (1995) in their conclusion a higher LAI together with a higher yield; i.e. higher values of LAI in the high density treatment lead to an improved radiation interception and, subsequently, to higher biomass and yield of
37
Fig. 27: Profit margin in relation to tariff and treatment for part A (a) and part B (b).
sweet pepper than in the low density treatment. The LAI was not observed in the presented experiment, but the number of leaves was not different. However, more factors than only light intensity might have influenced yield: The higher light intensity resulted in a slightly higher air, soil and leaf temperature and might also have been contributed to a yield increase, but the influence of each factor is unknown. In tomatoes, it was found that a higher light intensity decreased pollination with about one fruit less pollinated compared to the lower light intensity (Stadler, 2013a). However, in the presented experiment were flowers pollinated after 1-2 days, independent of the light intensity. It seems that the unmarketable yield was slightly higher for the lower light intensity, while with a higher light intensity a bigger amount of fruits in “extra class” were counted.
The importance of the photoperiod is shown by studies from Verheul et al. (2007), where a daily photoperiod of 12 h or 13 h resulted in the highest number of strawberry plants with emerged flowers and a photoperiod of 14 h or more reduced this number, while no flowers emerged at a photoperiod of 16 h, 20 h or 24 h (Verheul et al., 2006). Furtheron, interactions between photoperiod, temperature, duration of short-day treatment and plant age on flowering were documented from Verheul et al. (2006). In contrast, the presented experiment was conducted with a photoperiod of 18 h, which induced good flowering of strawberries.
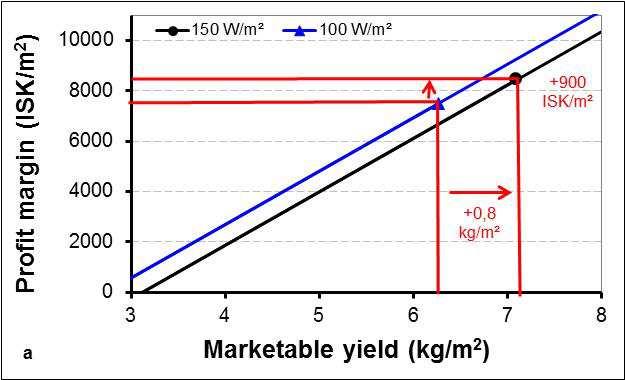
Using a higher light intensity is associated with higher expenses for the electricity. Thus, it is necessary that the higher use of electricity is paying off by obtaining a higher yield. The higher light intensity resulted in a higher profit margin than the lower light intensity, meaning that the additional yield was high enough to pay off for the higher use of electricity. An increase of the light intensity from 100 W/m² to 150 W/m² resulted in an yield increase of 0,8 kg/m² and this was reflected in an increase of profit margin of 900 ISK/m² (part A) respectively 1.500 ISK/m² for part B. When the yield of the higher light intensity would have been 0,4 kg lower in part A or 0,7 kg lower in part B, profit margin would have been comparable to the one at the lower light intensity. That means it is only worth to use 50 W/m2 more light if this would result in an almost 0,5 kg/m2 or 0,8 kg/m2 higher yield at 150 W/m2 compared to 100 W/m2 (Fig. 28).
38
Fig. 28: Profit margin in relation to yield with light intensity – calculation scenarios (urban area, VA210).
In part B were the lights often automatically turned off due to high solar radiation. That resulted in low expenses for sale and distribution of energy. Therefore, the effect of the light intensity on yield can not really be evaluated in part B. Stadler (2010) studied the effect of light intensity at low solar irradiation: A high light intensity significantly increased marketable yield of sweet pepper during periods of low natural light level, the gain decreased with increasing natural light level and the yield was at high natural light level not different within light intensities. However, this was not confirmed at the presented experiments with strawberries as there was also a gain in yield determined by using a higher light intensity at increasing natural light level. But as stated before, was the use of energy very low at high natural light level (in part B) and therefore may have other factors than the amount of supplemental light contributed to the higher yield at 150 W/m2 when compared to 100 W/m2
A further yield increase of strawberries might be possible with a higher plant density. For example found Paranjpe et al. (2008) that early and total marketable yield increased linearly with increasing plant densities (8,8; 9,5; 10,4; 11,4; 17,6; 19,1; 20,8; 22,9 plants/m²). These yield increased were achieved without adversely affecting mean fruit size.
5.2 Future speculations concerning energy prices
In terms of the economy of lighting it is also worth to make some future speculations about possible developments. So far, the lighting costs are contributing to about 1/6 of the production costs of strawberries. In the past and present there have been and there are still a lot of discussions concerning the energy prices. Therefore, it is
39
necessary to highlight possible changes in the energy prices (Fig. 29). The white columns are representing the profit margin according to Fig. 27. Where to be assumed, that growers would get no subsidy from the state for the distribution of the energy, that would result in a profit margin of 6.500-7.000 ISK/m2 in part A and of 4.200-5.5000 ISK/m2 in part B (black columns, Fig. 29). Without the subsidy of the state, probably less Icelandic grower would produce strawberries over the winter months. When it is assumed that the energy costs, both in distribution and sale, would increase by 25 %, but growers would still get the subsidy, then the profit margin would range between 7.200-8.000 ISK/m2 in part A and between 4.700-6.200 ISK/m2 in part B (dotted columns). When it is assumed, that growers have to pay 25 % less for the energy, the profit margin would increase to 7.800-9.000 ISK/m2 in part A and in part B to 4.800-6.3000 ISK/m2 (gray columns).
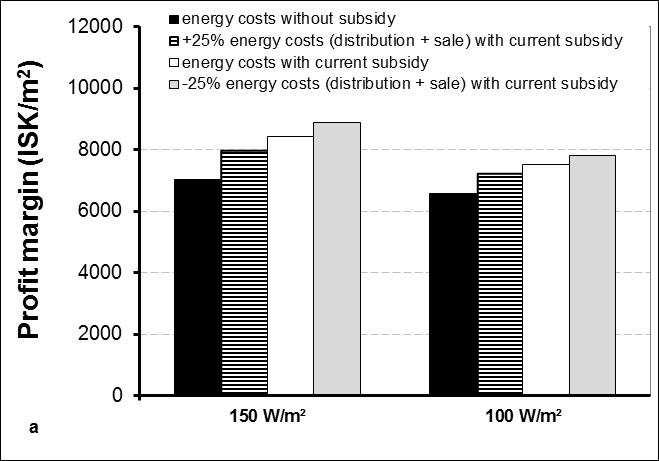
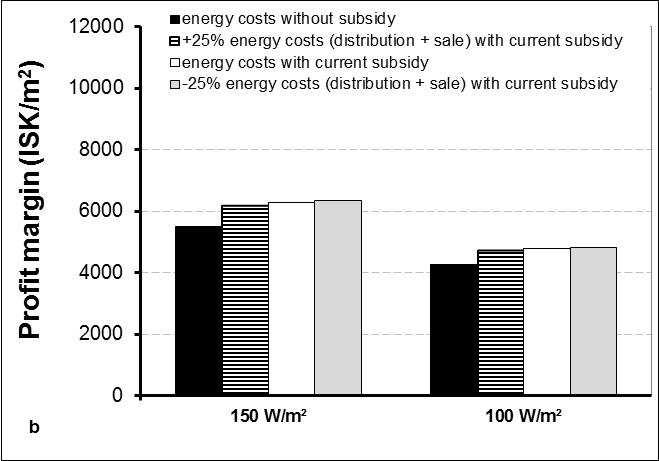
From these scenarios it can be concluded that from the grower’s side it would be preferable to get subsidy to be able to get a higher profit margin and grow strawberries over the winter.
Fig. 29: Profit margin in relation to treatment – calculation scenarios (urban area, VA210).
5.3 Recommendations for increasing profit margin
The current economic situation for growing strawberries necessitate for reducing production costs to be able to heighten profit margin for strawberry production. On the other hand side, growers have to think, if strawberries should be grown during low solar irradiation and much use of electricity.
It can be suggested, that growers can improve their profit margin of strawberries by:
40
1. Getting higher price for the berries
It may be expected to get a higher price, when consumers would be willing to pay even more for Icelandic berries than imported ones. Growers could also get a higher price for the fruits with direct marketing to consumers (which is of course difficult for large growers). They could also try to find other channels of distribution (e.g. selling directly to the shops and not over SfG). In doing so, growers could save the very high expences of the fee to SfG for selling the strawberries.
2. Lower planting costs
The price for the strawberry plant is quite high. By using the strawberry plant not only once, but twice, could costs be decreased. By that, also the costs for the soil would be lowered. However, it is necessary that the yield is staying at a high value when same plants are used more than once.
3. Decrease plant nutrition costs
Growers can decrease their plant nutrition costs by mixing their own fertilizer. When growers would buy different nutrients separately for a lower price and mix out of this their own composition, they would save fertilizer costs. However, this takes more time and it is more difficult to perform this task by employees.
4. Lower CO2 costs
The costs of CO2 are pretty high. Therefore, the question arises, if it is worth to use that much CO2 or if it would be better to use less and get a lower yield but all together have a possible higher profit margin. The CO2 selling company has currently a monopoly and a competition might be good.
5. Decrease packing costs
The costs for packing (material) from SfG and the costs for the rent of the box are high. Costs could be decreased by using cheaper packing materials.
6. Efficient employees
The efficiency of each employee has to be checked regularly and growers will have an advantage to employ faster workers. Growers should also check the user-friendliness of the working place to perform only minimal manual operations. Very often operations can be reduced by not letting each
41
employee doing each task, but to distribute tasks over employees. In total, employees will work more efficiently due to the specialisation.
7. Decrease energy costs
- Lower prices for distribution and sale of energy (which is not realistic)
- Growers should decrease artificial light intensity at increased solar irradiation, because this would possibly result in no lower yield (Stadler et al., 2010).
- Growers should check if they are using the right RARIK tariff and the cheapest energy sales company tariff. Unfortunately, it is not so easy, to say, which is the right tariff, because it is grower dependent.
- Growers should check if they are using the power tariff in the right way to be able to get a lowered peak during winter nights and summer (max. power -30 %). It is important to use not so much energy when it is expensive, but have a high use during cheap times.
- Growers can save up to 8 % of total energy costs when they would divide the winter lighting over all the day. That means growers should not let all lamps be turned on at the same time. This would be practicable, when they would grow in different independent greenhouses. Of course, this is not so easy realisable, when greenhouses are connected together, but can also be solved there by having different switches for the lamps to be able to turn one part of the lamps off at a given time. Then, plants in one compartment of the greenhouse would be lightened only during the night. When yield would be not more than 2 % lower with lighting at nights compared to the usual lighting time, dividing the winter lighting over all the day would pay off. However, a tomato experiment showed that the yield was decreased by about 15 % when tomatoes got from the beginning of November to the end of February light during nights and weekends (Stadler, 2012). This resulted in a profit margin that was about 18 % lower compared to the traditional lighting system and therefore, normal lighting times are recommended.
- For large growers, that are using a minimum of 2 GWh it could be recommended to change to “stórnotendataxti” in RARIK and save up to 35 % of distribution costs.
42
- It is expected, that growers are cleaning their lamps to make it possible, that all the light is used effectively and that they are replacing their bulbs before the expensive season is starting.
- Aikman (1989) suggests to use partially reflecting material to redistribute the incident light by intercepting material to redistribute the incident light by intercepting direct light before it reaches those leaves facing the sun, and to reflect some light back to shaded foliage to give more uniform leaf irradiance.
6 CONCLUSIONS
The strawberry yield was positively influenced by a higher light intensity. The high increase in energy costs by lighting when increasing light intensity from 100 W/m2 to 150 W/m2 was accompanied by a yield increase of 0,8 kg/m2 and in an increase of profit margin of 900-1.500 ISK/m2. Therefore, from the economic side it seems to be recommended to provide 50 W/m2 more light.
Growers should pay attention to possible reduction in their production costs for strawberries other than energy costs.
43
REFERENCES
AIKMAN DP, 1989: Potential increase in photosynthetic efficiency from the redistribution of solar radiation in a crop. J. Exp. Bot. 40, 855-864.
DEMERS DA, DORAIS M, WIEN CH, GOSSELIN A, 1998a: Effects of supplemental light duration on greenhouse tomato (Lycopersicon esculentum Mill.) plants and fruit yields. Sci. Hortic. 74, 295-306.
DEMERS DA, GOSSELIN A, WIEN HC, 1998b: Effects of supplemental light duration on greenhouse sweet pepper plants and fruit yields. J. Amer. Hort. Sci. 123, 202-207.
EGGERTSSON H, 2009: Personal communication (Notice in writing) from Haukur Eggertsson, Orkustofnun, October 2009.
HAO X, PAPADOPOULOS AP, 1999: Effects of supplemental lighting and cover materials on growth, photosynthesis, biomass partitioning, early yield and quality of greenhouse cucumber. Sci. Hortic. 80, 1-18.
LORENZO P, CASTILLA N, 1995: Bell pepper response to plant density and radiation in unheated plastic greenhouse. Acta Hort. 412, 330-334.
MARCELIS LFM, BROEKHUIJSEN AGM, MEINEN E, NIJS EHFM, RAAPHORST MGM, 2006: Quantification for the growth response to light quality of greenhouse grown crops. Acta Hort. 711, 97-104.
PARANJPE A, CANTLIFFE DJ, STOFFELLA PJ, LAMB EM, POWELL CA, 2008: Relationship of plant density to fruit yield of ‘Sweet Charli’ strawberry grown in a pine bark soilless medium in a high-roof passively ventilated greenhouse. Sci. Hortic. 115, 117-123.
STADLER C, 2010: Effects of plant density, interlighting, light intensity and light quality on growth, yield and quality of greenhouse sweet pepper. Final report, Rit LbhÍ nr. 30.
STADLER C, 2012: Effects of lighting time and light intensity on growth, yield and quality of greenhouse tomato. Final report, Rit LbhÍ nr. 40.
STADLER C, 2013a: Áhrif ljósstyrks, rótarbeðsefnis, vökvunar og umhirðu á vöxt, uppskeru og gæði gróðurhúsatómata. Final report, Rit LbhÍ nr. 43.
44 7
STADLER C, HELGADÓTTIR Á, ÁGÚSTSSON, M, RIIHIMÄKI MA, 2010: How does light intensity, placement of lights and stem density affect yield of wintergrown sweet pepper? Fræðaþing landbúnaðarins, 227-232.
STADLER C., 2013b: Áhrif ljósstyrks, ágræðslu og umhverfis á vöxt, uppskeru og gæði gróðurhúsatómata. Final report, Rit LbhÍ nr. 45.
VERHEUL M, SØNSTEBY A, GRIMSTAD S, 2006: Interactions of photoperiod, temperature, duration of short-day treatment and plant age on flowering of Fragaria x ananasa Duch. cv. Korona. Sci. Hortic. 107, 164-170.
VERHEUL M, SØNSTEBY A, GRIMSTAD S, 2007: Influences of day and night temperatures on flowering of Fragaria x ananassa Duch., cvs. Korona and Elsanta, at different photoperiods. Sci. Hortic. 112, 200-206.
45
150W/m²
100W/m²
Chamberforthefirst4weeks Emails/phone callswith advisors Date tasks observations/ problems tasks observations/ problems tasks observations/ problems
19.des planting, light:11-15 plantsarrivedwith manyleavesand big+smallfruits, somefruitswith graymould
20.des light:08-15 21.des 22.des light:08-16 24.des 25.des 26.des startdripirrigation:4x,10min.
27.des light:07-19 28.des 29.des 30.des floortemp.:30°C, ventilation:20°C toomuchrunoff, irrigationstopped
31.des irrigation:2per day,2,5min
1.jan
light:05-19 sprayLoker
17 8 APPENDIX
2.jan 3.jan 4.jan 5.jan
46
150W/m²
100W/m²
Chamberforthefirst4weeks Emails/phone callswith advisors Date tasks observations/ problems tasks observations/ problems tasks observations/ problems
6.jan light:03-19 light:changeto 03-19,beginningof Marchto14h(when brightoutside),and downto6-7hatend ofMarch spray1x/week Loker,sprayin3. weekofJanuary RoveralorTendor
7.jan 8.jan 9.jan 10.jan
Lokersprayed
14.jan Rovralsprayed
15.jan night:10°C plantonMonday, removefirstflowers
16.jan 17.jan
18.jan
19.jan plantedinto chambers,old leavesremoved
16°C/10°C (day/night) plantedinto chambers,old leavesremoved
16°C/10°C (day/night)
20.jan 21.jan Lokersprayed temperaturedrop Lokersprayed temperaturedrop
18
11.jan 12.jan
13.jan
47
150W/m²
100W/m²
Date tasks observations/ problems tasks observations/ problems tasks observations/ problems
Chamberforthefirst4weeks Emails/phone callswith advisors
22.jan 4waterings 4waterings 23.jan 24.jan 25.jan
26.jan measurements, oldleaves removed
measurements, oldleaves removed 27.jan 28.jan Lokersprayed Lokersprayed 29.jan 30.jan 31.jan 1.feb
2.feb 19badplants marked (Phythopthora), lastirrigation: 16.00,Paraat (400ml/pot)
3.feb
11badplants marked (Phythopthora), lastirrigation: 16.00,Paraat (400ml/pot)
4.feb firsthives, Lokersprayed firsthives, Lokersprayed
waterwithParaat 400ml/potand againafter10days
19
48
150W/m²
100W/m²
Chamberforthefirst4weeks Emails/phone callswith advisors Date tasks observations/ problems tasks observations/ problems tasks observations/ problems
5.feb irrigationinterval: 1,5h, badplants removed, potschangedso thatatshelter bedsarepots withremoved plants
plantsaremore stressed irrigationinterval: 1,5h, badplants removed, potschangedso thatatshelter bedsarepots withremoved plants
betterbalancein plants
Sven:
• changeto1000 ppm
• removebad plants
• wateragainafter 10to14days withParaat
• increaseE.C.to 1,7,when fruitingmax.1,4 E.C.
• firstdrainageof thedayshould benorunoff
• pollinationnext2 daysimportant
• increaseMgby 10%
• decreasenight temp.to7-8°C whenfruiting
• nexttimeonly3 plants/pot
6.feb runnersremoved runnersremoved
9.feb measurements, badplants removed
plantshave developedmuch sincelastweek
measurements, badplants removed
plantshave developedmuch sincelastweek
20
7.feb 8.feb
49
150W/m²
100W/m²
Date tasks observations/ problems tasks observations/ problems tasks observations/ problems
10.feb irrigationinterval: 1:45, runnersandold leafesremoved
irrigationinterval: 2:45, runnersandold leafesremoved
11.feb Lokersprayed Lokersprayed
12.feb badplants removed,Paraat (400ml/pot)
badplants removed,Paraat (400ml/pot)
13.feb irrigationinterval: 1:30,3:00min irrigationinterval 2:00,3:00min
14.feb
15.feb
16.feb measurements, badplantsand runnersremoved watersample taken
brownspotson theedgeof leaves
measurements, badplantsand runnersremoved watersamples taken irrigationinterval: 2:30,3:00min.
brownspotson theedgeof leaves
Chamberforthefirst4weeks Emails/phone callswith advisors
17.feb floortemp.:35°C
18.feb Lokersprayed Lokersprayed
19.feb putammonium nitratinmixture, watering4min, newbighives, badplants removed
20.feb 21.feb
22.feb
putammonium nitratinmixture, newbighives, badplants removed
21
50
150W/m²
100W/m²
Date tasks observations/ problems tasks observations/ problems tasks observations/ problems
23.feb measurements, badplantsand runnersremoved
24.feb
measurements, badplantsand runnersremoved
25.feb Lokersprayed Lokersprayed
26.feb 27.feb 28.feb
1.mar
2.mar measurements, badplantsand runnersremoved
3.mar fertilizerchanged tofruit, runners removed,cluster movedtofront
measurements, badplantsand runnersremoved
fertilizerchanged tofruit, runners removed, clustersmoved tofront
4.mar Lokersprayed Lokersprayed
5.mar 6.mar 7.mar
8.mar
9.mar measurements, badplantsand runnersremoved
measurements, badplantsand runnersremoved
10.mar badleavesand runnersremoved badleavesand runnersremoved
Chamberforthefirst4weeks Emails/phone callswith advisors
22
51
150W/m²
100W/m²
Date tasks observations/ problems tasks observations/ problems tasks observations/ problems
Chamberforthefirst4weeks Emails/phone callswith advisors
11.mar light:05-19, firstharvest Lokersprayed light:05-19, firstharvest Lokersprayed
12.mar aphidoletesmix system aphidoletesmix system
13.mar
14.mar
15.mar
16.mar measurements, badplantsand runners removed,harvest
measurements, badplantsand runners removed,harvest
17.mar removingbad leaves,runners removingbad leaves,runners
18.mar Lokersprayed Lokersprayed
19.mar mixtureforSonata, lowerE.C.to1,0-1,2
20.mar
21.mar
22.mar
23.mar measurements, harvest measurements, harvest
24.mar harvest harvest
25.mar Lokersprayed Lokersprayed
26.mar harvest harvest
28.mar
23
27.mar
52
150W/m²
Date tasks observations/ problems tasks observations/ problems tasks observations/ problems
100W/m² Chamberforthefirst4weeks Emails/phone callswith advisors
29.mar
30.mar measurements, harvest measurements, harvest
31.mar
1.apr harvest harvest
2.apr harvest
3.apr
4.apr harvest harvest
5.apr
6.apr
7.apr measurements, harvest measurements, harvest
8.apr
9.apr harvest, CO2:1.200ppm, night:8°C
harvest, CO2:1.200ppm, night:8°C
10.apr ironandmangan added ironandmangan added
11.apr
12.apr
13.apr measurements, harvest measurements, harvest planting strawberries
14.apr
15.apr
16.apr harvest harvest
17.apr Paraat
24
53
150W/m²
Date tasks observations/ problems tasks observations/ problems tasks observations/ problems
100W/m² Chamberforthefirst4weeks Emails/phone callswith advisors
18.apr
19.apr
20.apr measurements, harvest measurements, harvest 21.apr 22.apr
23.apr harvest harvest 24.apr 25.apr 26.apr 27.apr measurements, harvest measurements, harvest 28.apr Paraat 29.apr 30.apr badleavesand earlyflowers removed
1.maí
2.maí 3.maí
4.maí lastharvest, plantsthrownout lastharvest, plantsthrownout
5.maí
25
54
150W/m²
100W/m²
Chamberforthefirst4weeks Emails/phone callswith advisors Date tasks observations/ problems tasks observations/ problems tasks observations/ problems
6.maí light:05-19, badleavesand earlyflowers removed Lockersprayed
7.maí
8.maí
9.maí
10.maí 11.maí
12.maí newplantsput intochambers, badleaves removed
newplantsput intochambers, badleaves removed
13.maí Lokersprayed Lokersprayed 14.maí 15.maí 16.maí 17.maí
18.maí measurements measurements
19.maí oldleaves removed,put stringsforleaves
oldleaves removed
20.maí putstringsfor leaves
21.maí 22.maí
26
55
150W/m²
100W/m²
Date tasks observations/ problems tasks observations/ problems tasks observations/ problems
23.maí
24.maí
25.maí
26.maí measurements, badleaves removed
27.maí
everything pollinated(hives wereopenwhole weekend)
28.maí puttape beeshavebeen bitingfruits,light greenleaves
29.maí
measurements, badleaves removed
everything pollinated(hives wereopenwhole weekend)
puttape beeshavebeen bitingfruits,light greenleaves
Chamberforthefirst4weeks Emails/phone callswith advisors
addiron+mangan, changelight accordingtosolar irradiation
30.maí ironandmangan added ironandmangan added
31.maí
1.jún measurements measurements
Lokersprayed Lokersprayed
measurements firstfruits colouring measurements firstfruits colouring
9.jún Pirimolsprayed Pirimolsprayed
27
2.jún 3.jún 4.jún
5.jún 6.jún 7.jún 8.jún
56
150W/m²
100W/m²
Date tasks observations/ problems tasks observations/ problems tasks observations/ problems
Chamberforthefirst4weeks Emails/phone callswith advisors
10.jún newfertilizer solution(10fruits white)
11.jún
12.jún
13.jún
14.jún
newfertilizer solution(10fruits white)
15.jún measurements, firstharvest measurements, firstharvest
16.jún putclustersin front
17.jún
18.jún 1st.harvest, Lokersprayed
1st.harvest, putclustersin front, Lokersprayed
19.jún
20.jún
21.jún
22.jún measurements, harvest measurements
23.jún harvest
25.jún harvest, Lokersprayed harvest, Lokersprayed
28
24.jún
26.jún 27.jún 57
150W/m²
100W/m²
Date tasks observations/ problems tasks observations/ problems tasks observations/ problems
Chamberforthefirst4weeks Emails/phone callswith advisors
28.jún
measurements, harvest measurements, harvest
1.júl
2.júl harvest, Lokersprayed harvest, Lokersprayed
harvest harvest
9.júl harvest, Lokersprayed harvest, Lokersprayed
measurements, harvest measurements, harvest
lastharvest experimental plants
lastharvest experimental plants
29
29.jún
30.jún
3.júl 4.júl 5.júl 6.júl
7.júl 8.júl
10.júl 11.júl 12.júl 13.júl
14.júl 15.júl 16.júl
17.júl 58
100W/m² Chamberforthefirst4weeks Emails/phone callswith advisors Date tasks observations/ problems tasks observations/ problems tasks observations/ problems
18.júl
150W/m²
harvest harvest
lastharvest lastharvest
30
19.júl 20.júl
21.júl 22.júl
59


