Table of contents
I
List of figures III List of tables IV Abbreviations V 1 SUMMARY 1 YFIRLIT 3 2 INTRODUCTION 5 3 MATERIALSANDMETHODS 7 3.1 Greenhouseexperiment 7 3.2 Treatments 10 3.3 Measurements,samplingandanalyses 10 3.4 Statisticalanalyses 11 4 RESULTS 11 4.1 Environmentalconditionsforgrowing 11 4.1.1 Solarirradiation 11 4.1.2 Chambersettings 12 4.1.3 Soiltemperature 12 4.1.4 Leaftemperature 14 4.1.5 Irrigationofstrawberries 14 4.2 Developmentofstrawberries 17 4.2.1 Plantdiseases 17 4.2.2 Numberofleaves 18 4.2.3 Numberofrunners 18 4.2.4 Numberofclusters 19 4.2.5 Openflowers/fruitspercluster 19 4.2.6 Openflowers/fruitsperplant 20
Interiorqualityofyield
Sugar content
Taste of strawberries
Dry substance of fruits
II 4.3 Yield 21 4.3.1 Totalyieldofstrawberries 21 4.3.2 Marketableyieldofstrawberries 22 4.3.3 Outerqualityofyield 29 4.3.4
30 4.3.4.1
30 4.3.4.2
30 4.3.4.3
32 4.4 Economics 32 4.4.1 Lightinghours 32 4.4.2 Energyprices 33 4.4.3 Costsofelectricityinrelationtoyield 37 4.4.4 Profitmargin 38 5 DISCUSSION 45 5.1Yieldindependenceofthelightintensity 45 5.2Yieldindependenceofthevariety 49 5.3Futurespeculationsconcerningenergyprices 52 5.4Recommendationsforincreasingprofitmargin 54 6 CONCLUSIONS 57 7 REFERENCES 58 8 APPENDIX 60
Listoffigures
Fig. 1: Experimental design of cabinets for part B. 7
Fig. 2: Time course of solar irradiation for part A (a) and part B (b). 11
Fig. 3: Soil temperature for part A (a) and part B (b). 12
Fig. 4: Leaf temperature for part A (a) and part B (b). 14
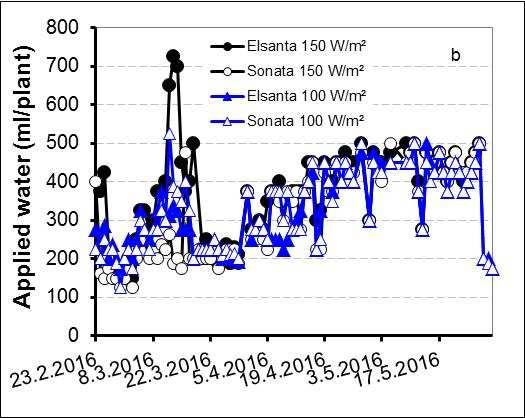
Fig. 5: Daily applied water for part A (a) and part B (b). 14
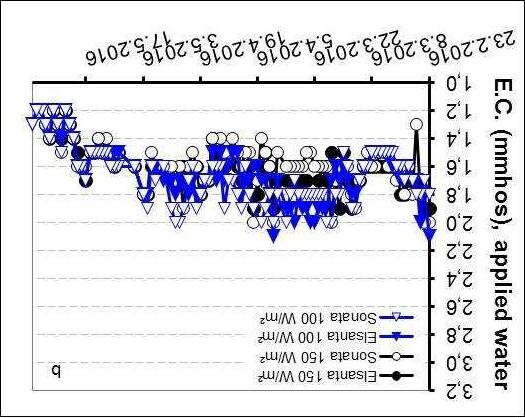
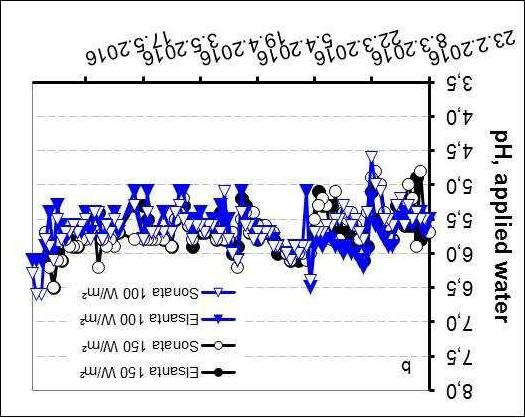
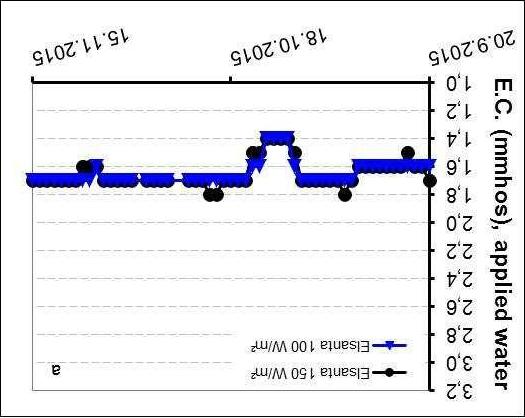
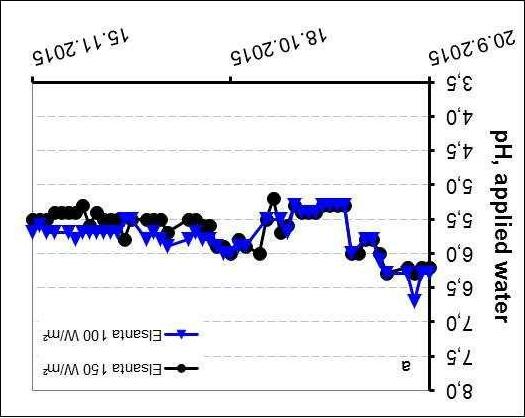
Fig. 6: E.C. and pH of irrigation water for part A (a) and part B (b). 15
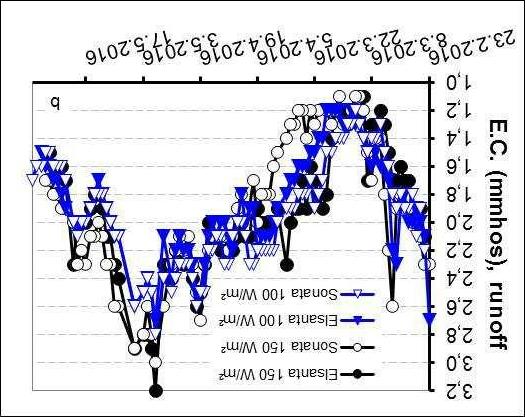
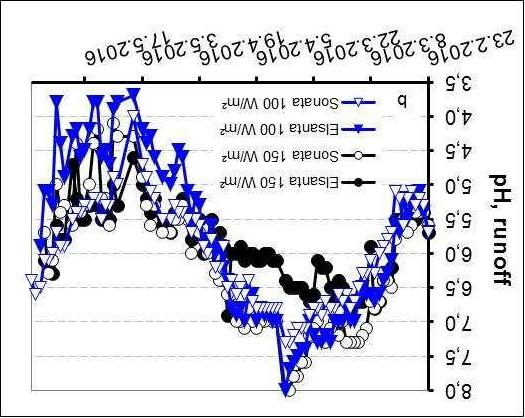
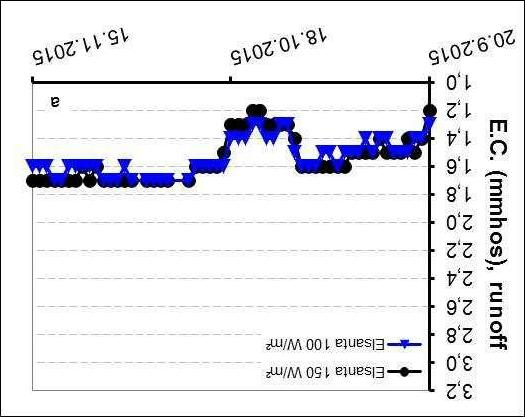
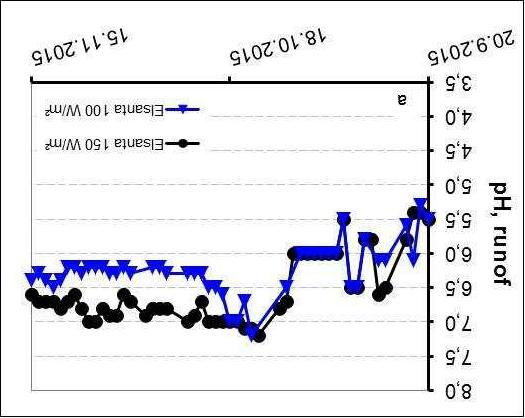
Fig. 7: E.C. and pH of runoff of irrigation water for part A (a) and part B (b). 16
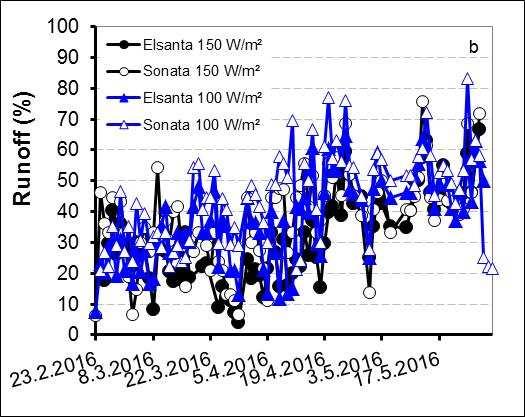
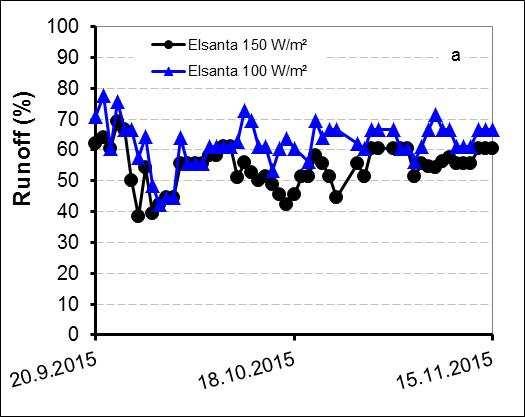
Fig. 8: Proportion of amount of runoff from applied irrigation water for part A (a) and part B (b). 17
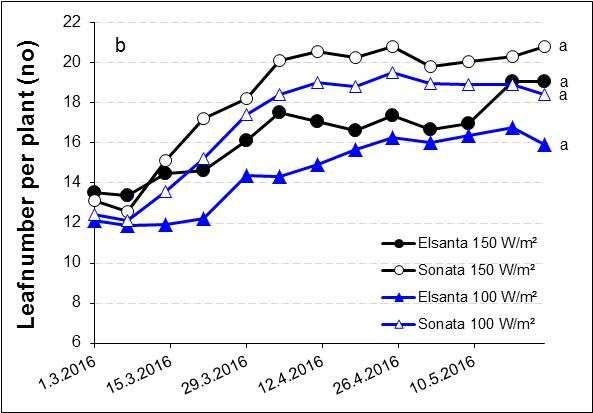
Fig. 9: Number of leaves at strawberry plants for part A (a) and part B (b). 18
Fig. 10: Number of runners at strawberry plants for part A (a) and part B (b). 18
Fig. 11: Number of clusters for part A (a) and part B (b). 19
Fig. 12: Number of flowers / fruits per clusters for part A (a) and part B (b). 19
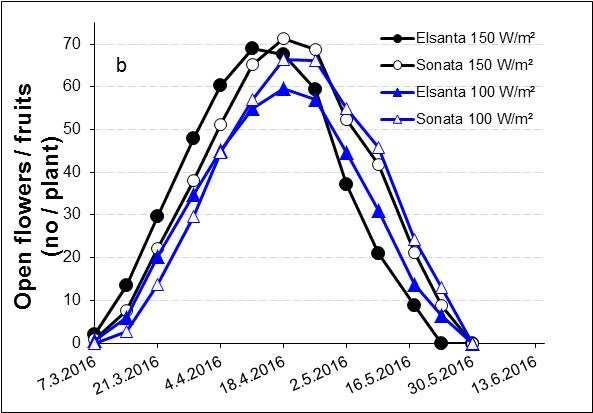
Fig. 13: Open flowers / fruits per cluster for part A (a) and part B (b). 20
Fig. 14: Cumulative total yield of strawberries for part A (a, c) and part B (b, d). 21
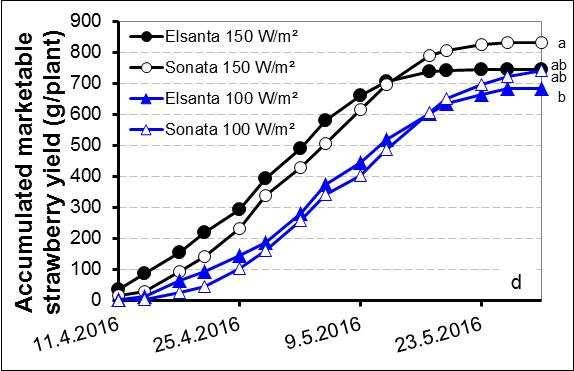
Fig. 15: Time course of accumulated marketable yield of strawberries for part A (a, c) and part B (b, d). 22
Fig. 16: Time course of accumulated marketable yield of strawberries for the whole chamber for part A (a) and part B (b). 23
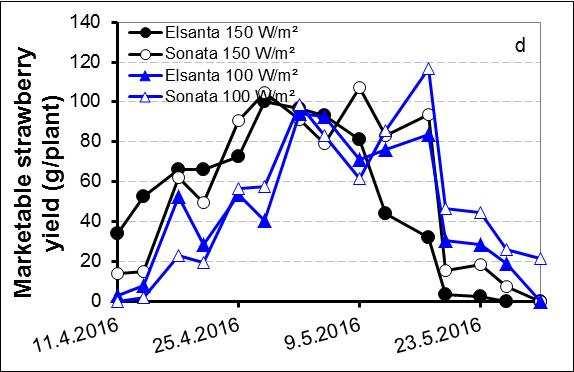
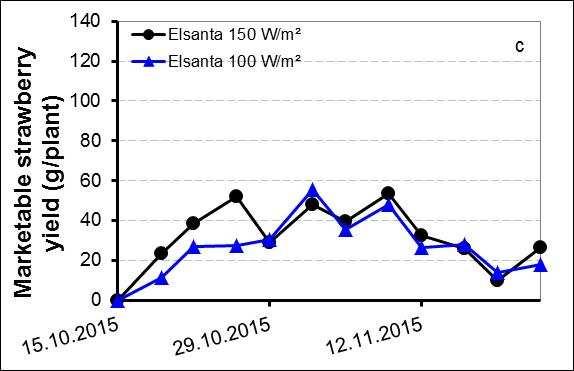
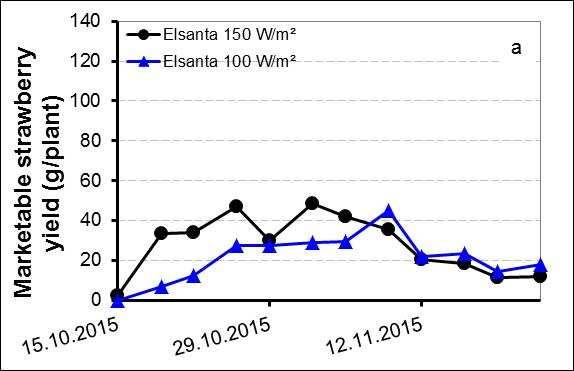
Fig. 17: Time course of marketable yield for part A (a, c) and part B (b, d). 24
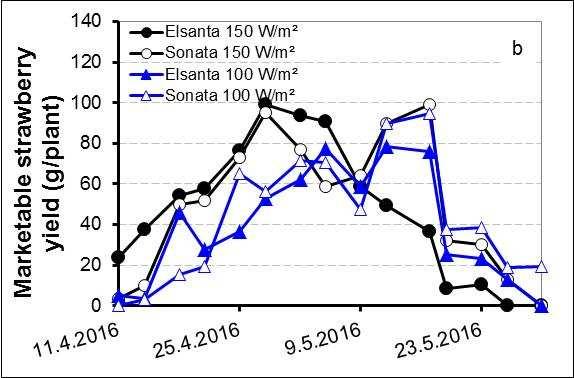
Fig. 18: Average weight of strawberries for part A (a, c) and part B (b, d). 26
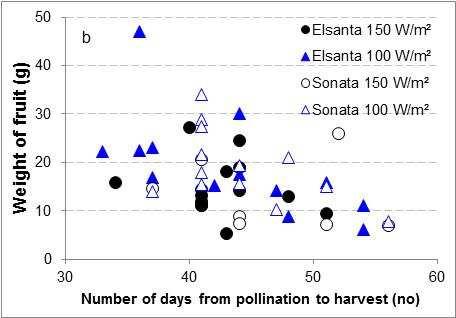
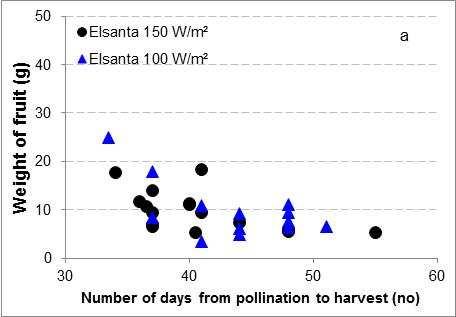
Fig. 19: Number of days from pollination to harvest and weight of the harvested fruit for part A (a) and part B (b). 27
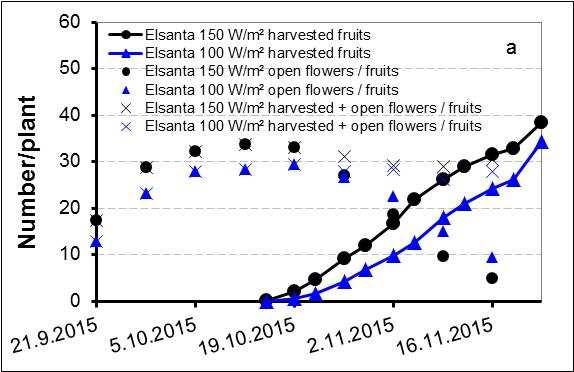
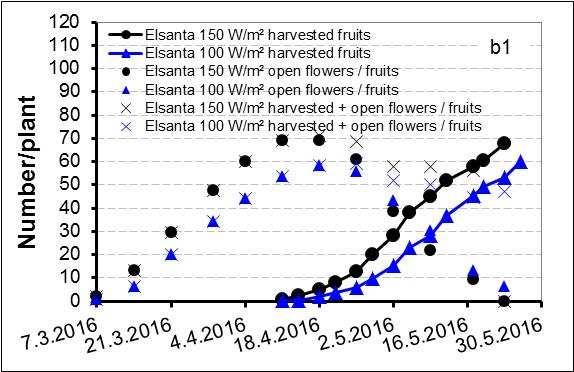
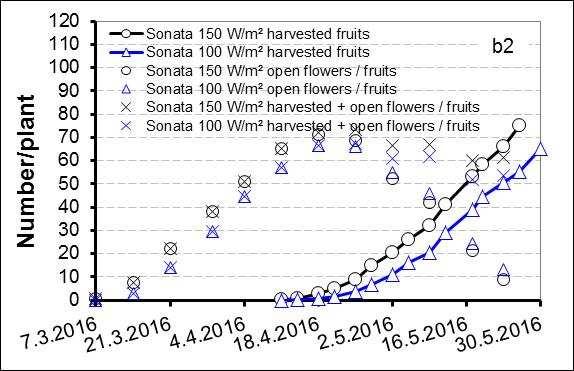
Fig. 20: Development of open flowers / fruits, harvested fruits and their sum during the growth of the strawberries for part A (a) and part B (b1 and b2). 28
Fig. 21: Sugar content of strawberries for part A (a) and part B (b). 30
Fig. 22: Sweetness, flavour, juiciness and firmness of strawberries for part A (a) and part B (b). 31
Fig. 23: Dry substance of strawberries for part A (a) and part B (b). 32
III
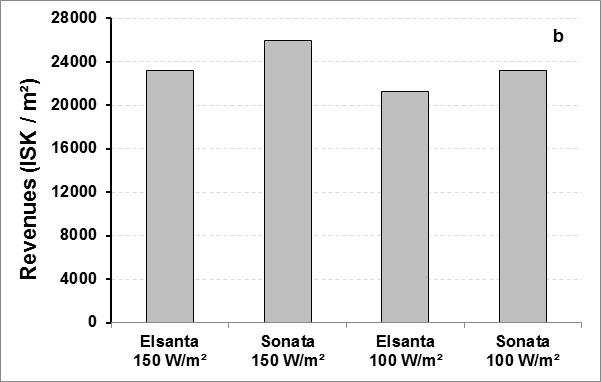
Fig. 24: Revenues at different treatments for part A (a) and part B (b). 39
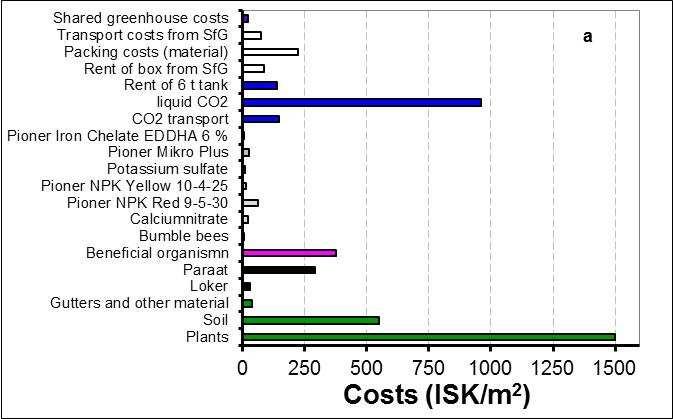
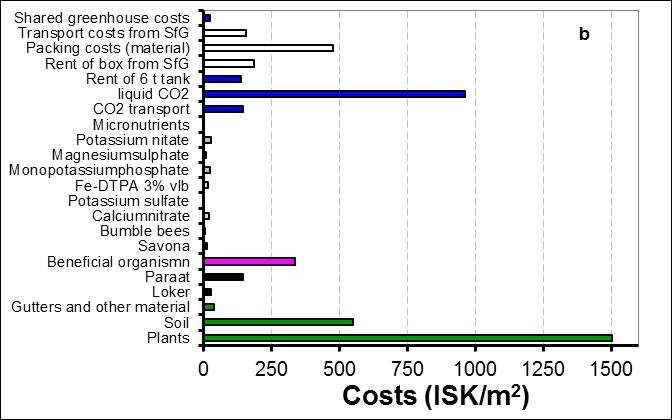
Fig. 25: Variable and fixed costs (without lighting and labour costs) for part A (a) and part B (b). 40
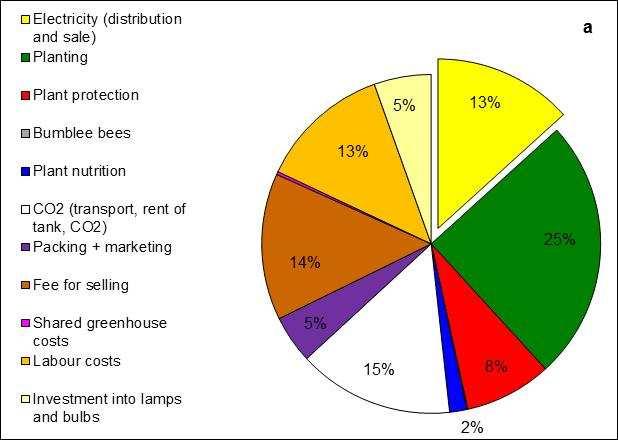
Fig. 26 Division of variable and fixed costs for part A (a) and part B (b).
Fig. 27: Profit margin in relation to tariff and treatment for part A (a) and part B (b).
Fig. 28: Profit margin in relation to yield with light intensity – calculation scenarios (urban area, VA210) in part A (a) and part B (b). 48
Fig. 29: Profit margin in relation to yield with different varieties –calculation scenarios (urban area, VA210) in part B. 50
Fig. 30: Profit margin in relation to treatment – calculation scenarios (urban area, VA210). 53
Listoftables
Tab. 1a: Fertilizer mixture according to advice from Azelis. 8 Tab. 1b: Fertilizer mixture according to advice from DLV plant. 9 Tab. 2: Chamber settings for part A and part B. 13
Tab. 3: Cumulative total number of marketable fruits for part A and part B. 25
Tab. 4: Proportion of marketable and unmarketable yield for part A and part B. 29
Tab. 5a: Lighting hours, power and energy in the cabinets for part A. 33 Tab. 5b: Lighting hours, power and energy in the cabinets for part B. 33 Tab. 6a Costs for consumption of energy for distribution and sale of energy for part A. 35 Tab. 6b Costs for consumption of energy for distribution and sale of energy for part B. 36
Tab. 7a: Variable costs of electricity in relation to yield in part A. 37 Tab. 7b: Variable costs of electricity in relation to yield in part B. 38
Tab. 8: Profit margin of strawberries at different light treatments for part A and part B (urban area, VA210). 42
IV
41
44
Abbreviations
DM dry matter yield
DS dry substance
E.C. electrical conductivity
HPS high-pressure vapour sodium lamps
kWh kilo Watt hour
LAI leaf area index
N nitrogen
pH potential of hydrogen ppm parts per million
W Watt Wh Watt hours
Other abbreviations are explained in the text.
V
SUMMARY
In Iceland, winter production of greenhouse crops is totally dependent on supplementary lighting and has the potential to extend seasonal limits and replace imports during the winter months. Adequate guidelines for winterproduction of strawberries are not yet in place and need to be developed. The objective of this study was to test if winterproduction of strawberries is possible in Iceland and if the light intensity is affecting growth, yield and quality of different strawberry varieties and to evaluate the profit margin.
Two experiments with strawberries (Fragaria x ananassa cv. Sonata and cv. Elsanta) were conducted, the first (A) from middle of September to the end of November 2015 and the second (B) from the end of January to the end of May 2016, in the experimental greenhouse of the Agricultural University of Iceland at Reykir.
Strawberries were grown in 5 l pots in six replicates with 12 plants/m2 under highpressure vapour sodium lamps (HPS) at two light intensities (150 W/m2 and 100 W/m2) for a maximum of 18 hours light. The day temperature was 16 °C and the night temperature 8 °C, CO 2 800 ppm. Strawberries received standard nutrition through drip irrigation. The effect of light intensity was tested and the profit margin calculated.
It took 1-2 days from flowering to pollination. The fruits were ripe in 41 days at the higher light intensity and in 43 days at the lower light intensity for part A. For part B was Elsanta ripe in 42 days and Sonata in 46 days at 150 W/m2, and Elsanta in 44 days and Sonata in 46 days at 100 W/m2. It seems that more light (150 W/m2) resulted in more flowers. The treatment with the higher light intensity started some days earlier to give ripe berries in comparision to 100 W/m2. In addition ripened Elsanta earlier, but at planting were plants of Elsanta more developed than plants of Sonata.
A higher light intensity had a positive effect on marketable yield, the harvest increased by 18-31 % for Elsanta in part A and by 9-19 % for Elsanta in part B and by 12-16 % for Sonata in part B compared to the lower light intensity. The higher yield of the higher light intensity was attributed to a higher number of harvested fruits. Differences between light intensities developed at the beginning of the harvest period and decreased later in the harvest period. In part A was marketable yield of Elsanta 330-380 g/plant with 150 W/m2 but 250-320 g/plant with 100 W/m2. In part B was
1 1
marketable yield of Elsanta 700-740 g/plant and of Sonata 750-830 g/plant at 150 W/m2 and of Elsanta 590-680 g/plant and of Sonata 650-740 g/plant at 100 W/m2. Differences were mostly only tendentially between light intensities and also tendentially between varieties. However, the yield of Sontata was about 10 % higher compared to Elsanta. Marketable yield was 88-92 % of total yield in part A and 87-95 % in part B. It seems that unmarketable yield was decreased at a higher light intensity. More unshaped strawberries were counted in Elsanta compared to Sonata. It seems that sugar content was a bit higher at 150 W/m2 in part A, but not in part B. However, this difference was not found in the tasting experiment in the sweetness of the strawberries. The tasting gave a hint to better grades for Sonata in sweetness, flavour and juiciness compared to Elsanta.
In the chamber with 150 W/m2 was a higher air temperature, a higher leaf temperature and a higher soil temperature measured compared to the chamber with 100 W/m2. This could also have a positive influence on yield and growth of the plants as well as a negative influence on the spreading of fungal diseases. For example was in the winter/spring crop a tendency for a higher number of leaves found at 150 W/m2, whereas the number of runners was comparable between different light intensities. Plants that reciewed more light looked more stressed compared to the lower light intensity. This might have resulted in a higher number of plants with phytopthora at the higher light intensity. In addition, an earlier start of mildew was observed at the higher light intensity and also the intensity of mildew was more pronounced at 150 W/m2 compared to 100 W/m2. Therefore, a higher light intensity is going ahead with a worser condition of plants.
With a higher light intensity increased the yield of Elsanta by 0,7 kg/m2 (1 % increase of light intensity increased yield by 0,2-0,6 %) and the profit margin by 800 ISK/m2 for part A and 900 ISK/m2 for part B. With Sonata was the yield at 150 W/m2 increased by 1,1 kg/m2 (1 % increase of light intensity increased yield by 0,2-0,3 %) and the profit margin by 1.600 ISK/m2 for part B. A higher tariff did not change profit margin.
Also, the position of the greenhouse (urban, rural) did not influence profit margin.
Possible recommendations for saving costs other than lowering the electricity costs are discussed. From an economic viewpoint it is recommended to use a higher light intensity as well as the variety Sonata to be able to increase yield and profit margin. However, from the appearance of the plant is a lower light intensity recommended.
2
YFIRLIT
Vetrarræktun í gróðurhúsum á Íslandi er algjörlega háð aukalýsingu. Viðbótarlýsing getur því lengt uppskerutímann og komið í stað innflutnings að vetri til. Fullnægjandi leiðbeiningar vegna vetrarræktunar á jarðarberjum eru ekki til staðar og þarfnast frekari þróunar. Markmiðin voru að prófa, hvort vetrarræktun gróðurhúsajarðarberja er möguleg á Íslandi og hvort ljósstyrkur hefði áhrif á vöxt, uppskeru og gæði mismunandi jarðarberja yrka og hvort það væri hagkvæmt. Gerðar voru tvær tilraunir með jarðarberjum (Fragaria x ananassa cv. Sonata og cv. Sonata), sú fyrri (A) frá miðjum september til loka nóvember 2015 og sú síðari (B) frá janúar lokum til loka maí 2016, í tilraunagróðurhúsi Landbúnaðarháskóla Íslands að Reykjum. Jarðarber voru ræktuð í 5 l pottum í sex endurtekningum með 12 plöntum/m2 undir topplýsingu frá háþrýsti-natríumlömpum (HPS) með tvenns konar ljósstyrk (150 W/m2 og 100 W/m2) að hámarki í 18 klst. Daghiti var 16 °C og næturhiti 8 °C, CO 2 800 ppm. Jarðarberin fengu næringu með dropavökvun. Í hluta A og hluta B voru áhrif ljósstyrks prófuð og framlegð reiknuð út. Það tók 1-2 daga frá blómgun til frjóvgunar. Ávextir voru þroskaðir á 41 degi með hærri ljósstyrk og á 43 dögum með minni ljósstyrk í hluta A. Í hluta B voru Elsanta þroskaðir á 42 dögum og Sonata á 46 dögum með 150 W/m2 og Elsanta á 44 dögum og Sonata á 46 dögum með 100 W/m2. Það virðist vera að meira ljós (150 W/m2) gefi fleiri blóm. Í upphafi uppskerutímabils byrjaði meðferð með hærri ljósstyrk að gefa þroskuð ber nokkrum dögum fyrr borið saman við 100 W/m2. Að auki þroskaðist Elsanta snemma, en þegar plantað var, var Elsanta með þróaðari plöntu en Sonata. Hærri ljósstyrkur hefur jákvæð áhrif á markaðshæfa uppskeru, uppskeran var 18-31 % meiri með Elsanta í hluta A og 9-19 % meiri með Elsanta í hluta B og 12-16 % meiri með Sonata í hluta B. Ástæðan fyrir meiri uppskeru við 150 W/m2 var meiri fjöldi jarðarberja. Mismunur milli ljósstyrkja myndaðist í upphafi uppskeru tímabilsins og var lækkaður á síðara uppskerutímabilinu. Þannig fengust 330-380 g/plöntu markaðshæfrar uppskeru með Elsanta við 150 W/m2 en 250-320 g/plöntu við 100 W/m2 í hluta A. En í hluta B fengust 700-740 g/plöntu með Elsanta og 750-830 g/plöntu með Sonata við 150 W/m2 og 590-680 g/plöntu með Elsanta og 650-740 g/plöntu með Sonata við 100 W/m2. Munurinn var oftast ekki tölfræðilega marktækur hvorki milli ljósstyrkja né milli yrkja. Hins vegar var uppskera af Sonata um 10 % hærri samanborið við Elsanta. Hlutfall uppskerunnar sem hægt
3
var að selja var 88-92 % í hluta A og 87-95% í hluta B. Það virðist að ómarkaðshæf uppskera hafi minnkað við hærri ljósstyrk. Hærra hlutfall illa lagaðra jarðarberja var í Elsanta samanborið við Sonata.
Svo virðist sem að sykurinnihald sé örlítið hærra við 150 W/m2 í hluta A en ekki í hluta B. Hins vegar fannst þessi munur ekki í bragðprófun á sætu í jarðarberjum. Smökkun gaf í skyn hærri einkunn í Sonata fyrir sætu, bragð og safa samanborið við Elsanta. Í klefa með 150 W/m2 mældist hærri lofthiti, hærri laufhiti og hærri jarðvegshiti samanborið við klefa með 100 W/m2. Það getur líka haft jákvæð áhrif á uppskeruna og vöxt plantna en neikvæð áhrif á dreifingu sveppasýkina. Til dæmis virðist tilhneiging til aukins fjölda laufa við 150 W/m2, þótt fjöldi hlaupara væri sambærilegur við mismunandi ljósstyrk. Plöntur sem fengu meira ljós virðast stressaðari samanborið við plöntur undir minni ljósstyrk. Þetta gæti hafa leitt til hærra hlutfalls af plöntum með myglu (phytophthora). Þar að auki varð sveppasýkingar (mjöldögg) fyrr vart við hærri ljósstyrk auk þess sem magn af mjöldögg var meira við 150 W/m2 samanborið við 100 W/m2. Þess vegna fylgir hærri ljósstyrk verra ástand plantnanna. Þegar hærri ljósstyrkur var notaður, þá jókst uppskera með Elsanta um 0,7 kg/m2 (1 % hækkun í ljósstyrk jók uppskeru um 0,2-0,6 %) og framlegð um 800 ISK/m2 í hluta A og 900 ISK/m2 í hluta B. Við Sonata jókst uppskera við 150 W/m2 um 1,1 kg/m2 (1 % hækkun í ljósstyrk jók uppskeru um 0,2-0,3 %) og framlegð um 1.600 ISK/m2 í hluta B. Hærri rafmagnsgjaldskrá breytir framlegð næstum ekkert. Það skiptir ekki máli hvort gróðurhús er staðsett í þéttbýli eða dreifbýli, framlegð er svipuð. Möguleikar til að minnka kostnað, aðrir en að lækka rafmagnskostnað eru ræddir. Frá hagkvæmnisjónarmiði er mælt með því að nota hærri ljósstyrk og Sonata til að auka uppskeru og framlegð jarðarberja. En hins vegar út frá útlit plöntunar er mælt með lægri ljósstyrk.
4
INTRODUCTION
The extremely low natural light level is the major limiting factor for winter greenhouse production in Iceland and other northern regions. Therefore, supplementary lighting is essential to maintain year-round production. This could replace imports from lower latitudes during the winter months and make domestic vegetables and fruits even more valuable for the consumer market.
Árni Magnús Hannesson from Fluðir is the pioneer in growing strawberries in Iceland. He has started with the production in the year 1985. Eiríkur Ágústsson and Olga Lind
Guðmundsdóttir started to grow strawberries at Silfurtún in the year 2002 and in 2011 more growers joined producing strawberries. In the year 2016 were already eight strawberrry growers counted.
The possibilities for strawberry production are based on growing under vegetation covers for the market in June-August or cultivate strawberries in heated greenhouses with preferably supplementary lighting. The harvest period was so far from May to October and therefore, are Icelandic strawberries not available in winter and spring. However, a demand exists because relative cheap strawberries are imported and the Icelandic producers can hardly compete with the price of imported strawberries.
Strawberry production in the greenhouse is based on producing strawberries at times where cheap strawberries are not available. "Sonata" and "Elsanta" are the most common strawberry varieties abroad and also in Iceland.
Since several years is it tradition to grow strawberries in heated greenhouses in the Netherlands and Belgium (e.g. van Delm et al., 2016). Also, the Norwegians are experimenting with greenhouse cultivation of strawberries during winter (e.g. Verheul et al., 2007). The question is whether this can also be pursued in Iceland. It is difficult to cultivate strawberries on high latitudes like in Iceland, because there are short days and little daylight from middle of September to middle of April and the low natural light level is the main limiting factor for a production in winter in greenhouses. Therefore, supplemental lighting is necessary to maintain an equal harvest over the year and this could make imports from lower latitudes unnecessary. Vegetables are grown during winter with supplemental lighting and the question is whether it is possible to extend the growing season of strawberries in the same way. Therefore, it should be considered if it is possible to use supplemental lighting when active radiation (PAR) falls below the critical value in production of strawberries.
5 2
In strawberries is it necessary to use supplemental lighting for 12 to 13 hours (Verheul et al., 2007). Longer lighting reduced the number of flowers. A day temperature of 18 °C and / or a night temperature of 12 °C was the best to get flowers and also at the shortest time.
The positive influence of artificial lighting on plant growth, yield and quality of tomatoes (Demers et al., 1998a), cucumbers (Hao & Papadopoulos, 1999) and sweet pepper (Demers et al., 1998b) has been well studied. It is often assumed that an increment in light intensity results in the same yield increase. Indeed, yield of sweet pepper in the experimental greenhouse of the Agricultural University of Iceland at Reykir increased with light intensity (Stadler et al., 2010). However, with tomatoes, a higher light intensity resulted not (Stadler, 2012) or in only a slightly higher yield (Stadler, 2013a). First knowledge in growing berries at different light intensities is available: Also here had a higher light intensity (150 W/m2) a positive effect on marketable yield (Stadler, 2016). The harvest increased by 13-19 % when compared to the lower light intensity (100 W/m2). The higher yield was mainly attributed to a higher number of „extra class“ fruits. However, the experiments were conducted from January to May 2015 and from May to July 2015 and therefore are experiments during the darkest time in Iceland missing.
Incorporating lighting into a production strategy is an economic decision involving added costs versus potential returns. Therefore, the question arises whether these factors are leading to an appropriate yield of strawberries.
The objective of this study was to test if (1) the light intensity is affecting growth, yield and quality of different strawberry varieties, if (2) this parameter is converted efficiently into yield, and if (3) the profit margin can be improved by the chose of the light intensity and variety. This study should enable to strengthen the knowledge on the best method of growing strawberries and give strawberry growers advice how to improve their production by modifying the efficiency of strawberry production.
6
3.1 Greenhouseexperiment
An experiment with strawberries (Fragaria x ananassa cv. Sonata and Elsanta) and different light intensities was conducted at the Agricultural University of Iceland at Reykir during autumn / winter (part A) and winter / spring (part B).
Four heavy tray plants of Elsanta were planted on 24.08.2015 in 5 l pots filled with moist strawberry substrate in the young production chamber with 150 W/m2 for part A. On the 17.09.2015 were pots moved into the growing chambers with different light intensities (see chapter “3.2 Treatments”). In contrast, for part B were four heavy tray plants of either Elsanta or Sonata planted on 28.01.2016 in 5 l pots filled with moist strawberry substrate and moved directly into the growing chambers with different light intensities. The temperature was in the beginning adjusted to 16 °C / 12 °C (day / night) and the ventilation sta rted with 20 °C.
7 3 MATERIALSANDMETHODS
30 0,36 m0,96 m0,36 m0,96 m0,36 m0,96 m0,36 m0,96 m0,36 m0,96 m0,36 m0,96 m0,36 m0,96 m0,36 m 30 6,12 m FEDCBA 6. rep. 5.rep. 1,0 m 4. rep.3. rep.2.rep.1. rep. 30 0,36 m0,96 m0,36 m0,96 m0,36 m0,96 m0,36 m0,96 m0,36 m0,96 m0,36 m0,96 m0,36 m0,96 m0,36 m 6,12 m FEDCBA 6.rep.5.rep. 1,0 m 4. rep.3. rep.2.rep.1. rep. 10,06 m 4 Elsanta plants per pot 4 Sonata plants per pot Shelter belt Shelter belt Shelter belt Shelter belt N Fig. 1: Experimental design of cabinets for part B
The strawberry pots were placed in rows in five 70 cm high beds (Fig. 1) with 8 cm between pots and 0,96 m between beds. One bed had 16 pots. Six replicates, one replicate in each bed consisting of one pots (4 plants) acted as subplots for measurements. For part B were beds divided into two parts and the different varieties put out in a zick zack system (Fig. 1), while in part A the whole chamber was filled with one variety (as only one variety was in the experiment). The temperature was set on 16 °C during day and 8 °C during night. Carb on dioxide was provided (800 ppm CO2 with no ventilation and 400 ppm CO2 with ventilation). Bumblebees were used for pollination. A misting system was installed. Plant protection was managed by beneficial organisms. In part A was Paraat sprayed four days after planting and again after 10 days. In part B was Paraat only sprayed once (eight days after planting). In both parts was started about 4 weeks after planting to spray Loker once a week (see details in appendix). In addition, in part B was mildew observed and therefore was Savona soap and Potassium bicarbonate used (see details in appendix).
In part A was the fertilizer plan accoring to Azelis used (Tab. 1a) and in part B the fertilizer plan according to DLV plant used (Tab. 1b). Tab. 1a: Fertilizer mixture according to advice from Azelis.
solution A (1000
8
Stem
l) –––– Stem solution B ––––(1000 l) Irrigation water Relation Fertilizer (amount in kg) (amount in l)* Calcium nitrate Pioner NPK Red 9-5-30 Pioner NPK Yellow 10-4-25 Potassium sulfate Pioner Mikro Plus * Pioner Iron Chelate EDDHA 6 % Resistim (as needed)* E.C. (mS/cm) Planting – 10 white fruits / plant (growth) 75 50 50 25 14 0,5 10 1,6 1:150 10 white fruits / plant – harvest end (fruit development) 75 100 25 14 0,5 1,6 1:150
Planting – 10 white fruits / plant (growth) 21,862,5 6,45 0,535,9 17 29,1 510140 27 21012 1,5 1:100
10 white fruits / plant – harvest end (fruit development)
74,1 7,16 3,235,2 17 41,8 590140 25 26014 1,5 1:100
Plants were irrigated through drip irrigation (1 tube per bucket). The watering was set up that the plants could root well down, which means no runoff after planting and a low amount of runoff in the first 2-3 weeks. At the growing stage was the irrigation arranged to 10-20 % runoff on sunny days and 0-5 % on cloudy days with an E.C in the drip of 1,5-1,7. At flowering and carrying green fruits was the runoff supposed to be 25-30 % on sunny days and 10-15 % on cloudy days with a lowering of E.C. from 1,7 to 1,5 one week before harvest. The E.C. of the input and runoff water is supposed to be adjusted that their sum is 3,2-3,3 during growth and flowering and 3,0-3,1 during harvest. In general was the rule that the first drip in the morning should not give runoff. 100 ml/drip was irrigated in 2 h intervals (first at 5.00 and last at 17.00) with E.C. 1,6 and pH 5,8.
9 Tab. 1b: Fertilizer mixture according to advice from DLV plant. Stem solution A (1000 l) –––––– Stem solution B ––––––(1000 l) Irrigation water Relation Fertilizer (amount in kg) (amount in l) * (amount in g) ** Calciumnitrate liquid * Calciumnitrate Fe-DTPA 3 % vlb Potassium sulfate Magnesium sulfate Monopotassium phosphate Potassium nitrate Mangansulfat 32,5 % Mn ** Borax 11,3 % B ** Koparsulfat 24 % Cu ** Zinksulfat 23 % Zn ** Natriummolybdat 40 % Mo ** E.C. (mS/cm)
3.2 Treatments
Strawberries from part A were grown from 17.09.-23.11.2015 and strawberries from part B from 28.01.-30.05.2016 under high-pressure sodium lamps (HPS) in two chambers with different light intensities:
1. HPS top lighting 150 W/m2 HPS, 150 W/m2
2. HPS top lighting 100 W/m2 HPS, 100 W/m2
HPS lamps for top lighting (600 W bulbs) were mounted horizontally over the canopy. Light was provided for 18 hours. Half of the lamps went on at 03.00 and the other half at 03.30. Half of the lamps went off at 19.00 and the other half at 19.30. When lights went off it was 16 °C, at 9.00 10 °C, when half of the lamps went on it was 16 °C, when other half went on 18 °C. The lamps were automatically turned off when incoming illuminance was above the desired set-point.
3.3 Measurements,samplingandanalyses
Soil temperature and leaf temperature was measured once a week.
The amount of fertilization water (input and runoff) was measured every day. To be able to determine plant development, the number of leaves, the number of clusters and the number of open flowers was counted each week. This gave information regarding the total amount of flowers per plant and the number of flowers per cluster.
During the growth period were runners regularly taken away and the number per plant was registered. During the harvest period were berries regularly collected (2 times per week) in the subplots. Total fresh yield, number of fruits, fruit category (extra-class (> 25 mm), 1. class (18 mm) and not marketable fruits (too little fruits (< 18 mm), damaged fruits, misshaped fruits, moldy fruits) were determined. At the end of the harvest period was on each plant the number of immature fruits (green) counted. The marketable yield of the whole chamber at each light intensity was also measured.
10
The interior quality of the berries was determined. A brix meter (Pocket Refractometer PAL-1, ATAGO, Tokyo, Japan) was used to measure sugar content in the strawberries during the growth period. From the same harvest, the flavour of fresh fruits was examined in tasting experiments with untrained assessors. Also, subsamples of the fruits were dried at 105 °C for 24 h to measure dry matter yield (DM).
Energy use efficiency (total cumulative yield in weight per kWh) and costs for lighting per kg yield were calculated for economic evaluation and the profit margin was determined.
3.4 Statisticalanalyses
SAS Version 9.4 was used for statistical evaluations. The results were subjected to one-way analyses of variance with the significance of the means tested with a Tukey/Kramer HSD-test at p ≤ 0,05.
4 RESULTS
4.1 Environmentalconditionsforgrowing
4.1.1 Solar irradiation
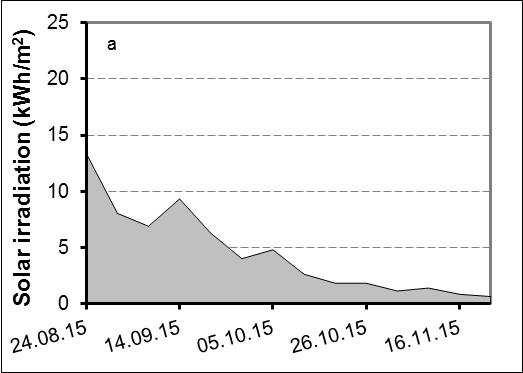
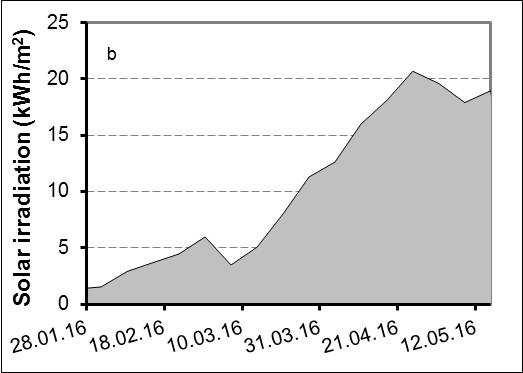
Solar irradiation was allowed to come into the greenhouse. Therefore, incoming solar irradiation is affecting plant development and was regularly measured. Solar irradiation was lower for part A than for part B. For part A decreased the natural light
Fig. 2: Time course of solar irradiation for part A (a) and part B (b). Solar irradiation was measured every day and values for one week were cumulated.
11
level with proceeding growth period. From October to the end of the experiment were less than 5 kWh/m2 reached. In contrast, part B was conducted during longer days and solar irradiation increased from less than 5 kWh/m2 at the beginning of the experiment to more than 5 kWh/m2 at the middle of March, and from April more than 15 kWh/m2 (Fig. 2). Due to a computer crash were no dates recorded for the last two weeks.
4.1.2 Chamber settings
The settings in the chambers were regularly recorded. Table 2 shows the weekly average of the CO2 amount, the air and floor temperature. The settings were mainly equal between the different light intensities. However, in part A was in week 1, 2 and 10 the CO2 amount higher and in week 1 the floor temperature higher at 100 W/m2 compared to 150 W/m2. In part B was the CO2 amount in week 7 higher at the higher light intensity, but in week 1-4, week 11 and week 14 higher in the chamber with the lower light intensity. In addition, the temperature on the floor was in week 3 also higher at 100 W/m2 compared to 150 W/m2. Overall was in both parts a slightly higher air temperature measured at 150 W/m2 compared to 100 W/m2 .
4.1.3 Soil temperature
Soil temperature was measured weekly at low solar radiation in the morning (at about 08.30). In part A and part B was soil temperature most of the time higher at the higher light intensity. In part A fluctuated soil temperature most of the time between 15-17 °C, while in part B from 13 °C to 16 °C. Ther e seem to be no differences in the soil temperature between different varieties (Fig. 3).
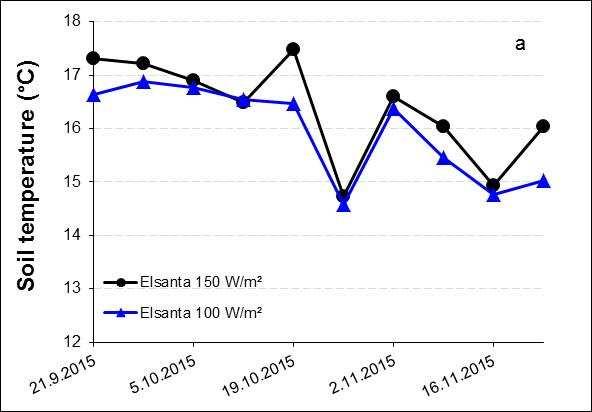
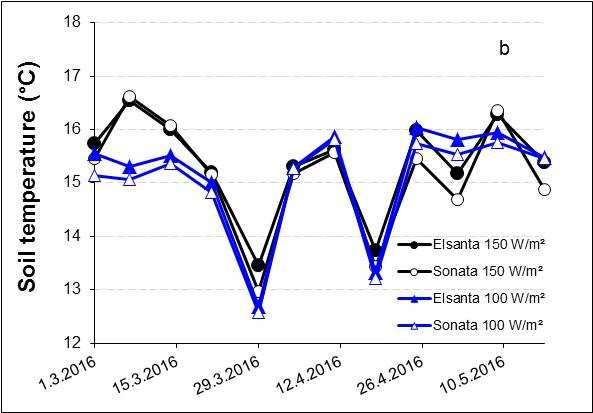
Fig. 3: Soil temperature for part A (a) and part B (b).
The soil temperature was measured at little solar irradiation early in the morning.
12
Tab. 2: Chamber settings for part A and part B.
Part A
Part B Week CO2 (ppm) Air (°C) day/night Floor (°C) CO2 (ppm) Air (°C) day/night Floor (°C) 150 100 150 100 150 100 150 100 150 100 150 100 W/m2 W/m2
1 358 423 17,7 19,2/14,0 17,8 19,2/14,4 21,5 24,1 416 467 13,9 14,9/11,9 13,8 14,8/11,7 30,5 31,2
2 399 461 17,6 19,6/12,7 17,5 19,4/12,9 30,6 31,1 290 333 16,1 18,1/10,9 15,4 17,2/10,3 30,2 31,0
3 705 706 17,1 19,2/12,0 16,9 18,9/12,1 30,3 30,9 246 316 14,6 16,4/10,4 15,3 16,0/9,6 22,6 25,6
4 700 703 17,2 19,3/13,0 17,0 19,0/12,3 30,4 31,4 280 327 15,8 17,9/11,2 15,5 17,6/10,7 29,5 30,3
5 713 713 17,4 19,4/12,7 17,2 19,0/12,7 30,3 31,3 510 510 15,6 19,2/11,5 15,1 18,7/11,0 26,6 27,8
6 715 713 16,5 18,5/11,8 16,3 18,3/11,6 30,1 31,2 558 512 16,3 19,3/11,7 15,7 18,7/11,1 28,1 29,3
7 716 712 17,2 19,1/12,6 17,1 19,0/12,7 30,3 31,3 599 512 16,6 19,2/12,2 15,9 18,6/11,5 28,4 29,4
8 715 714 17,0 19,0/12,0 16,9 18,9/12,0 30,2 31,3 508 510 17,0 19,8/12,3 16,6 19,2/12,1 28,9 29,5
9 589 605 16,3 18,3/11,3 16,1 18,0/11,3 29,9 31,0 448 462 16,0 18,7/11,6 15,5 18,1/11,0 33,1 33,1
349 404 15,8 17,8/10,8 15,5 17,6/10,8 29,8 30,8 579 596 16,5 19,3/11,9 16,0 18,9/11,4 28,3 29,0
- - - - - - 338 579 16,6 19,4/12,1 16,4 19,2/11,9 27,0 29,2
- - - - - - 593 611 16,7 19,3/12,3 16,4 18,9/12,1 28,5 29,2
-
579 16,9 19,5/12,6 16,7 19,3/12,5 28,5 29,2
317 365 16,3 18,8/12,1 16,2 18,7/12,1 29,2 30,9
562 17,2 19,8/19,5 17,0 19,5/12,8 29,2 31,8
13
10
11
12
13 - - - - -
576
14 - - - - - -
15 - - - - - - 553
16 - - - - - - nodataavailableduetocomputercrash 17 - - - - - - nodataavailableduetocomputercrash 18 - - - - - - nodataavailableduetocomputercrash
4.1.4 Leaf temperature
Leaf temperature was measured weekly at low solar radiation in the morning (at about 08.30). In part A and part B was leaf temperature higher at the higher light intensity. In part A fluctuated leaf temperature between 15-19 °C, while for part B fluctuated leaf temperature between 15-22 °C. There seem to be no differences in the leaf temperature between different varieties (Fig. 4).
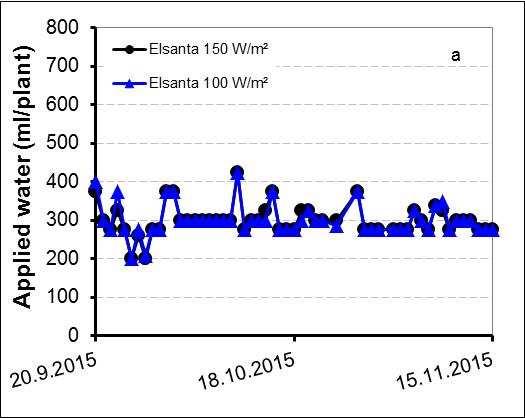
Fig. 4: Leaf temperature for part A (a) and part B (b).
The soil temperature was measured at little solar irradiation early in the morning.
4.1.5 Irrigation of strawberries
The amount of applied water was more or less stable with around 300 ml/plant for part A. In part B increased the amount of applied water with longer growth of the strawberries from about 200 ml/plant to about 500 ml/plant (Fig. 5).
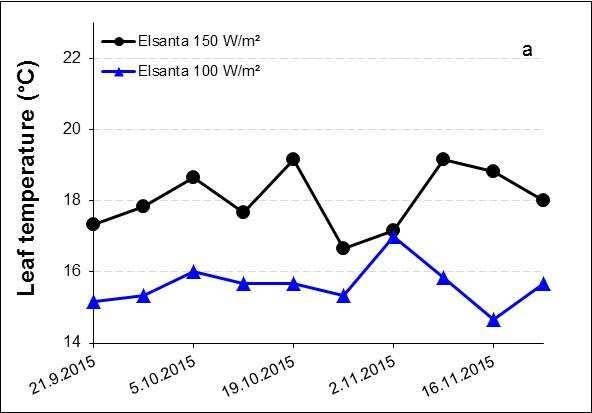
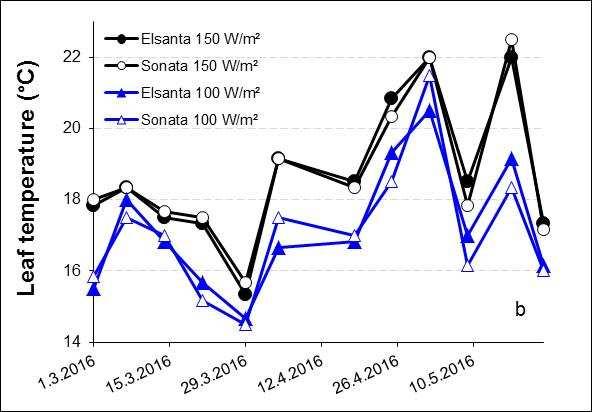
Fig. 5: Daily applied water for part A (a) and part B (b).
14
Fig. 6: E.C. and pH of irrigation water for part A (a) and part B (b).
1 5
Fig. 7: E.C. and pH of runoff of irrigation water for part A (a) and part B (b).
1 6
E.C. and pH of irrigation water was fluctuating much in part B and less in part A (Fig. 6a, b). The E.C. of applied water ranged most of the time between 1,4-1,7 and the pH decreased from 6,0 to 5,5 in part A. In part B decreased the E.C. of applied water from 1,5-2,0 to 1,2-1,5. The pH of applied water fluctuated between 5,0-6,0.
The E.C. of runoff stayed between 1,2-1,7 and the pH 5,5-7,0 in part A, while in part B the E.C. of runoff was 1,1-3,0 and the pH of runoff 4,0-7,5, each with ups and downs (Fig. 7a, b).
The amount of runoff from applied irrigation water was about 40-70 % in part A and fluctuated between 10-70 % in part B (Fig. 8). The runoff seems to be lower for the higher light intensity.
4.2 Developmentofstrawberries
4.2.1 Plant diseases
Some strawberry plants were infected with phytopthora (Phytopthora cactorum).
Infected plants were removed and counted. Symptoms started to appear about one month after planting. In part A were 2 % of the Elsanta plants removed due to phytopthora during the growth period and in part B 10 % at the higher light intensity and 7 % at the lower light intensity, both for Elsanta and Sonata. In addition, mildew (Sphaerotheca macularis) was observed in part B. Mildew started earlier at 150 W/m2 and spreaded also faster and over more plants at the higher light intensity compared to the lower light intensity.
17
Fig. 8: Proportion of amount of runoff from applied irrigation water for part A (a) and part B (b).
4.2.2 Number of leaves
Strawberry plants had more leaves in the winter / spring crop, while the number of leaves was lower in the autumn / winter crop. The number of leaves increased from 7 to 14 in part A (Fig. 9a), while the number of leaves increased from 12 to 16 (Elsanta) respectively from 14 to 20 (Sonata) in part B (Fig. 9b). No significant differences in the number of leaves regarding the two light intensities and the varieties were found, even though in part B were tendentially more leaves at the higher light intensity counted as well as Sonata had tendentially more leaves than Elsanta.
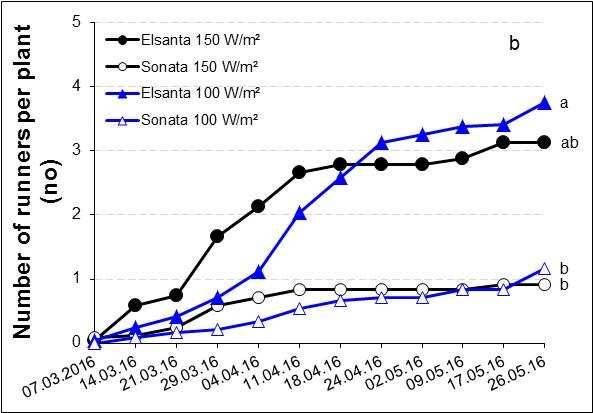
Fig. 9: Number of leaves at strawberry plants for part A (a) and part B (b). Letters indicate significant differences at the end of the experiment (HSD, p ≤ 0,05).
4.2.3 Number of runners
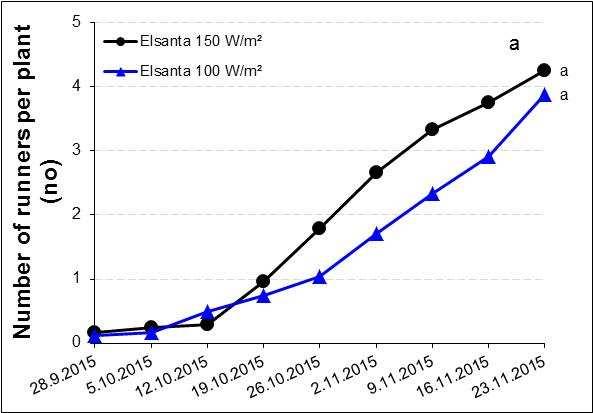
Strawberry plants of the variety Elsanta had more runners than Sonata. The light intensity seems not to influence the number of runners (Fig. 10).
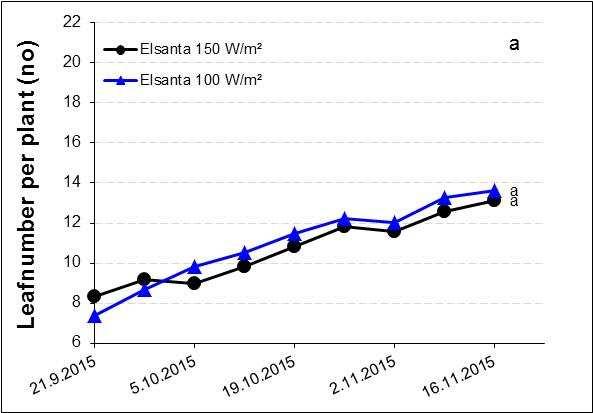
Fig. 10: Number of runners at strawberry plants for part A (a) and part B (b). Letters indicate significant differences at the end of the experiment (HSD, p ≤ 0,05).
18
4.2.4 Number of clusters
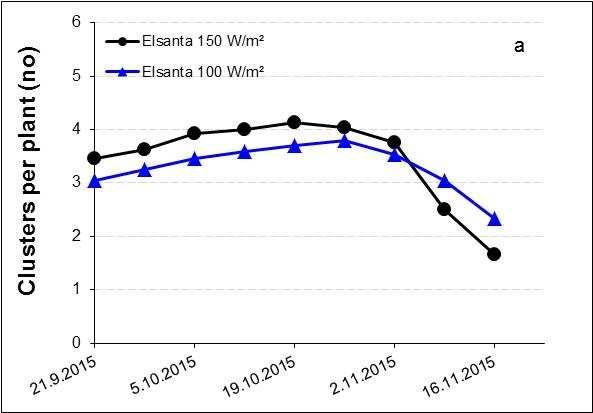
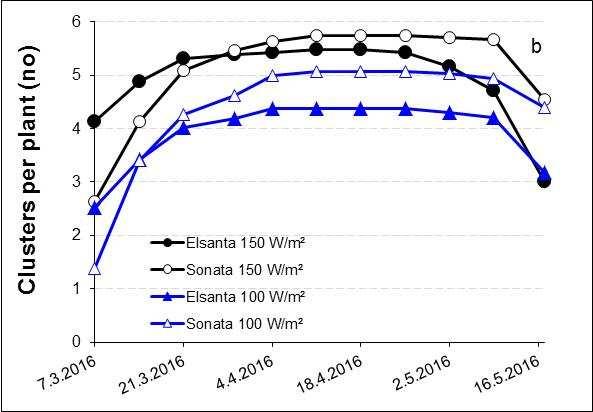
The number of clusters with flowers and / or fruits increased until the beginning of harvest and decreased after that when all fruits from a cluster were harvested. Plants at the higher light intensity seem to have a higher number of clusters compared to plants at the lower light intensity (Fig. 11).
Fig. 11: Number of clusters for part A (a) and part B (b).
4.2.5 Open flowers / fruits per cluster
The number of open flowers / fruits per cluster reached about 8 for Elsanta when harvest started in part A (Fig. 12a). After that the number decreased naturally due to harvested fruits. In contrast, in part B was the peak more pronounced and reached 12-14 open flowers / fruits per cluster before it decreased (Fig. 12b). With a higher light intensity was the peak ealier reached than with a lower light intensity, however, with a lower light intensity was the peak higher. It seems that the development was a bit delayed with Sonata compared to Elsanta. There seem to be no differences between varieties in the inclination, both for the increase and decrease. However, the lower light intensity seems to cause a delay in the decrease compared to the higher light intensity (Fig. 12).
19
Fig. 12: Number of flowers / fruits per cluster for part A (a) and part B (b).
4.2.6 Open flowers / fruits per plant
The number of open flowers / fruits per the Elsanta plant reached about 35 for the higher light intensity and about 30 for the lower light intensity in part A before harvest started (Fig. 13a). However, in part B was the number higher, about 70 open flowers / fruits for the higher light intensity, both for Elsanta and Sonata. For the lower light intensity were about 65 open flowers / fruits for Sonata and about 60 open flowers / fruits for Elsanta counted (Fig. 13b). Thereafter, decreased this number naturally due to harvested fruits. In both parts, it seems that the decrease was delayed for the lower light intensity when compared to the higher light intensity. No differences in the decrease between varieties were observed. However, the development of Sonata seems to be delayed compared to Elsanta (Fig. 13).
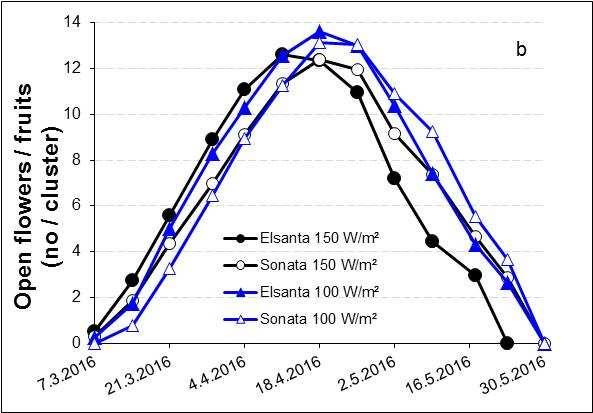
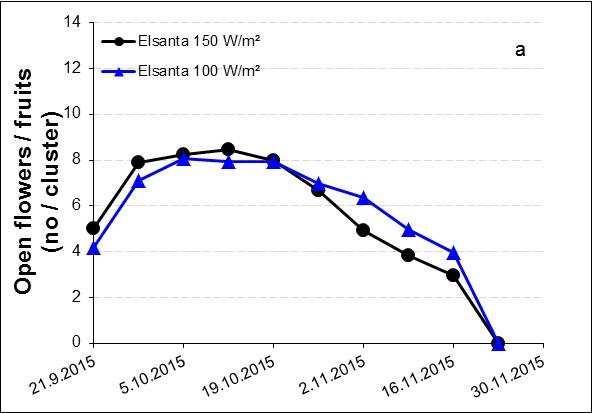
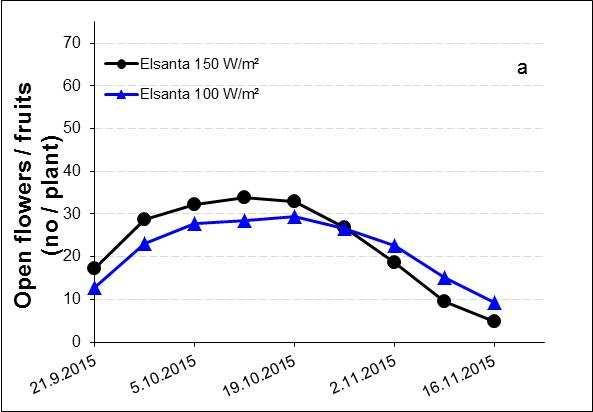
Fig. 13: Open flowers / fruits per cluster for part A (a) and part B (b).
20
4.3 Yield
4.3.1 Total yield of strawberries
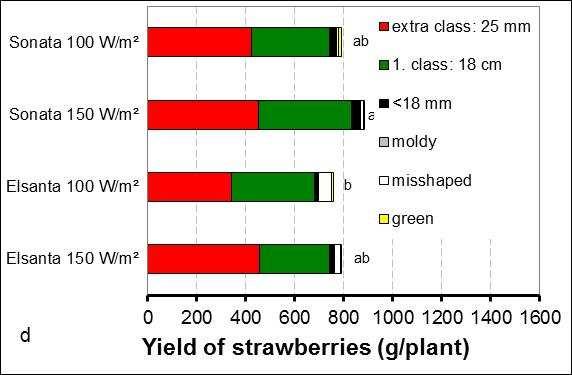
The yield of strawberries included all harvested red fruits during the growth period. The fruits were classified in extra-class (> 25 mm), 1. class (18 mm) and not marketable fruits (too little fruits (< 18 mm), misshaped fruits, moldy fruits and green fruits at the end of the harvest period).
Cumulative total yield of strawberries ranged between 0,29-0,41 g/plant for part A (Fig. 14a) and 0,67-0,89 g/plant for part B (Fig. 14b). A higher light intensity increased significantly (Fig. 14a) respective tendentially (Fig. 14b, Fig. 14c, Fig. 14d) total yield. The total yield of Sonata was tendentially higher compared to Elsanta.
Fig. 14: Cumulative total yield of strawberries for part A (a, c) and part B (b, d). “a” and “b” is the yield of the measurement plants, “c” and “d” the yield of the plants, where only the yield was measured.
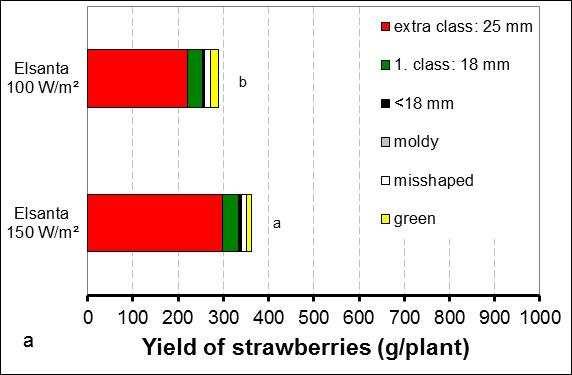
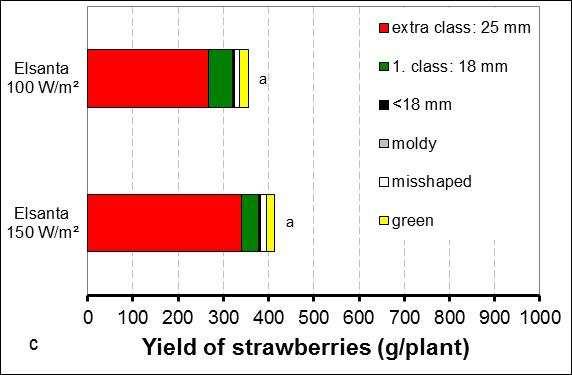
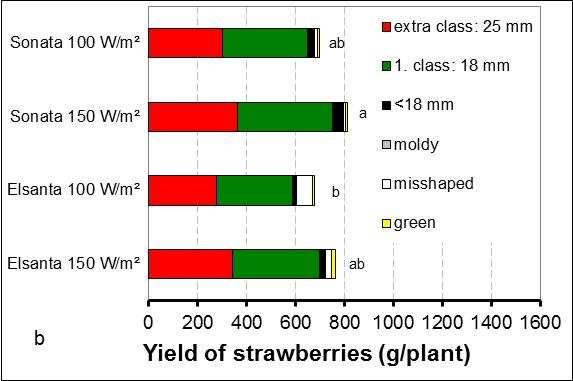
Letters indicate significant differences at the end of the experiment (HSD, p ≤ 0,05).
21
4.3.2
Marketable yield of strawberries
Both light intensities had a higher yield at the winter / spring crop (part B) than in the autumn / winter crop (part A). At the end of the harvest period amounted yield of strawberries 0,25-0,38 g/plant for part A (Fig. 15a, Fig. 15c) and 0,59-0,83 g/plant for part B (Fig. 15b, Fig. 15d). A higher light intensity resulted in a tendentially (Fig. 15b, Fig. 15c, Fig. 15d) respectively significantly (Fig. 15a) higher marketable yield compared to the lower light intensity. A 50 % increase in light intensity resulted in an increase in yield of 31 % (Fig.15a) / 18 % (Fig. 15c) for Elsanta in part A and 19 % (Fig. 15b) / 9 % (Fig. 15d) for Elsanta and 16 % (Fig. 15b) / 12 % (Fig. 15d) for Sonta in part B. This is equivalent to a yield increase of 0,62 % / 0,35 % for Elsanta in part A and 0,38 % / 0,18 % for Elsanta in part B and 0,31 % / 0,24 % for Sonata in part B at 1 % increase in light intensity. Differences between different light intensities developed at the beginning of the harvest period, both for the autumn / winter crop as well as for the winter / spring crop. Differences between the two light intensities decreased later in the harvest period (Fig. 15). The harvest at the higher light
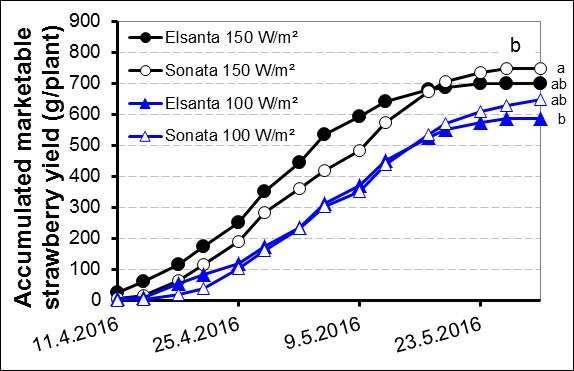
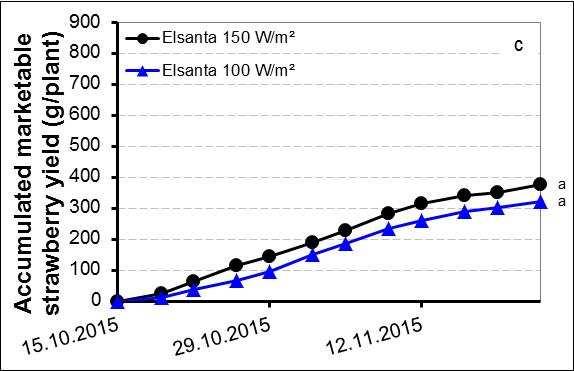
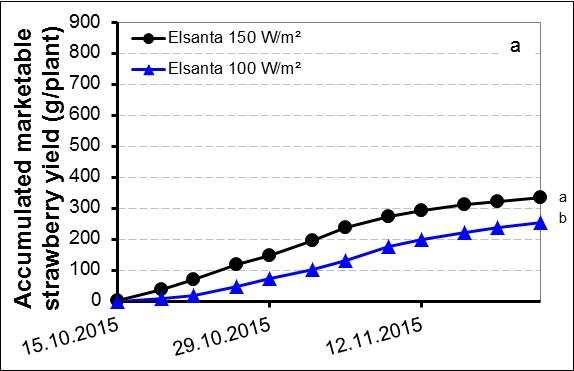
Fig. 15: Time course of accumulated marketable yield of strawberries for part A (a, c) and part B (b, d).
“a” and “b” is the yield of the measurement plants, “c” and “d” the yield of the plants, where only the yield was measured. Letters indicate significant differences at the end of the experiment (HSD, p ≤ 0,05).
22
intensity started few days earlier (about half week) compared to the lower light intensity and was also finished few days earlier. Also, Elsanta started few days earlier (half week) to give ripe fruits and harvest finished few days earlier. At the end of the harvest period was the yield tendentially higher with the variety Sonata compared to Elsanta (Fig. 15b, Fig. 15d): 700 / 740 g/plant was reached for Elsanta at 150 W/m², 750 / 830 g/plant for Sontata at 150 W/m² and 590 / 680 g/plant for Elsanta and 650 / 740 g/plant for Sonata at 100 W/m² in part B. The yield was about 10 % higher for Sonata compared to Elsanta. Also, the marketable yield of the whole chamber was measured. In both parts was a higher marketable yield reached with a higher light intensity (Fig. 16). After taking the removed plants into account, was a 22-23 % higher yield reached at 150 W/m2 compared to 100 W/m2 for both Elsanta and Sonata.
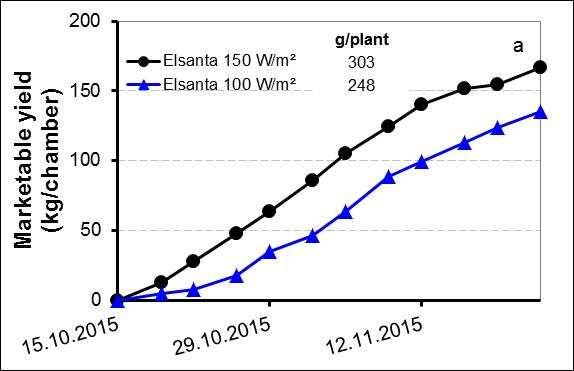
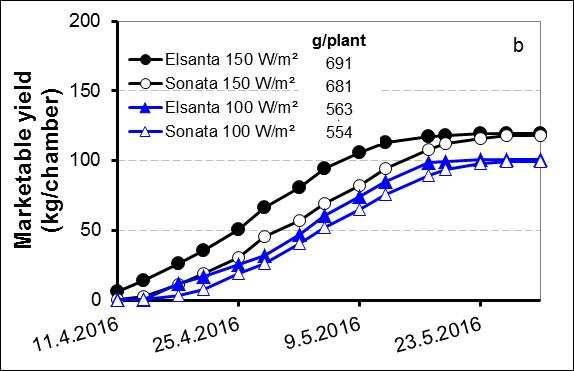
Fig. 16: Time course of accumulated marketable yield of strawberries for the whole chamber for part A (a) and part B (b).
The yield level was much higher in part B (Fig. 17b, 17d) compared to part A (Fig. 17a, 17c). In part A and part B increased the harvested amount of strawberries until the first third of the harvest period, stayed at about this value and decreased thereafter (Fig. 17). The marketable strawberry yield was until the middle of the harvest period higher at the higher light intensity, while after that, yield was slightly higher at the lower light intensity. Elsanta started earlier to ripe, resulting also in a higher first yield. In contrast, Sonata gave longer a higher yield.
23
Fig. 17: Time course of marketable yield for part A (a, c) and part B (b, d). “a” and “b” is the yield of the measurement plants, “c” and “d” the yield of the plants, where only the yield was measured.
The number of extra class fruits was tendentially or significantly higher for the higher light intensity in part A and part B (Tab. 3). Also, for “class I + II” was most of the time a tendentially higher number of fruits counted for the higher light intensity compared to the lower light intensity. While in the extra class fruits no differences between varieties were observed, was the number of class I + II fruits most of the time higher at the varietiy Sonata compared to Elsanta.
24
Tab. 3: Cumulative total number of marketable fruits for part A and part B. Treatment
Number of marketable fruits extra class class I + II (no/plant) (no/plant)
Part A
Elsanta 150 W/m2 23 a 6 a Elsanta 100 W/m2 18 b 6 a Elsanta 150 W/m2* 24 a 7 a Elsanta 100 W/m2* 22 a 10 a
Part B
Elsanta 150 W/m2 17 a 36 ab
Sonata 150 W/m2 17 a 41 a Elsanta 100 W/m2 13 a 32 b
Sonata 100 W/m2 13 a 37 ab
Elsanta 150 W/m2* 21 a 30 b
Sonata 150 W/m2* 20 a 40 a
Elsanta 100 W/m2* 17 a 35 ab
Sonata 100 W/m2* 19 a 33 ab * for the plants, where only the yield was measured Letters indicate significant differences (HSD, p ≤ 0,05).
Average fruit size of marketable fruits decreased with a longer harvest period from 25-18 g/fruit to about 10 g/fruit in part A (Fig. 18a, 18c). The strawberries at the higher light intensity were in average 0,8-1,8 g heavier. However, this difference was not statistically significant. In contrast, in part B was a much higher average weight with 20-50 g/fruit at the beginning of the harvest period reached (Fig. 18b, 18d), but decreased thereafter to about 8 g/fruit. Therefore, also in average was in part B a higher number in the fruit weight reached compared to part A. While in Fig. 18b the
average weight was comparable between light intensities and varieties, in Fig. 18d was Elsanta with a tendentially 1,5 g higher average weight compared to Sonata at the higher light intensity. However, at the lower light intensity was it the other way round: Fruits of Sonata were about 0,5 g heavier then Elsanta fruits. Whereas with Elsanta were 0,8 g heavier fruits reached at 150 W/m2 compared to 100 W/m2, but
25
Sonata fruits were 1,2 g heavier at the lower light intensity compared to the higher light intensity.
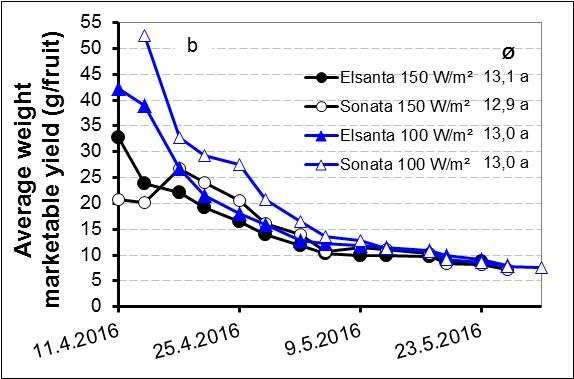
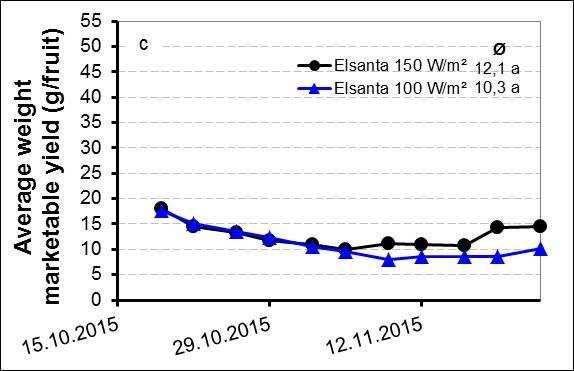
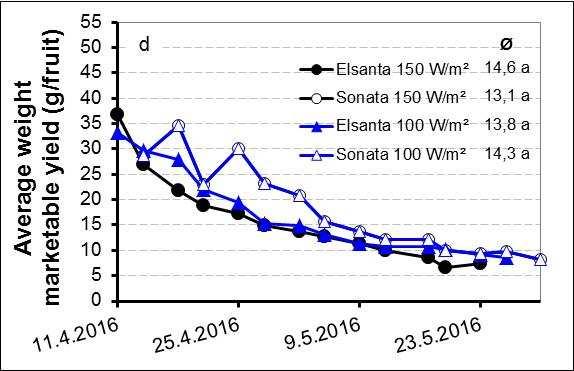
Fig. 18: Average weight of strawberries for part A (a, c) and part B (b, d).
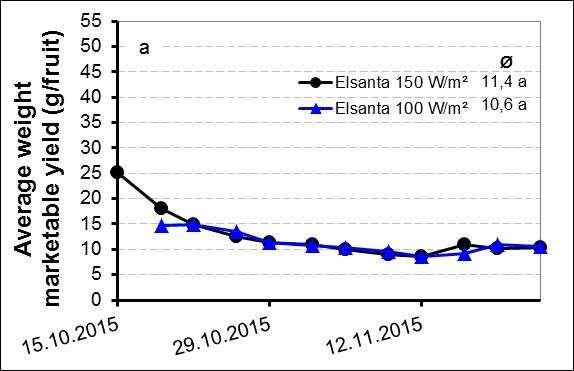
“a” and “b” is the average weight of the measurement plants, “c” and “d” the yield of the plants, where only the yield was measured.
To observe the success of flowering until harvest, flowers were marked and followed from pollination until harvest. Flowers were within 1-2 days pollinated (data not shown). Due to the fact, that nearly all Sonata flowers in the higher light intensity were pollinated directly after flower opening, was it only possible to mark very few flowers. Number of days from pollination to harvest was about 37-55 days (average: 41 days for the higher light intensity and 43 days for the lower light intensity) in part A (Fig. 19a) and about 33-56 days (average: 42 / 46 days (Elsanta / Sonata) for the higher light intensity and 44 / 44 days (Elsanta / Sonata) for the lower light intensity in part B (Fig. 19b). No relationship was found between the number of days from pollination to harvest and the weight of the fruit.
26
Fig. 19: Number of days from pollination to harvest and weight of the harvested fruit for part A (a) and part B (b).
In the middle of the harvest were most ripe fruits per week counted compared to the beginning (about first two weeks) and the end of the harvest period (about last two weeks). In part A were weekly less than 10 fruits harvested, while in part B between 10-20 fruits when harvest reached its maximum (Fig. 20). Naturally, with the beginning of the harvest, decreased the number of open flowers and fruits. The number of “harvested and open flowers / fruits” is the sum of the harvested fruits and the number of open flowers / fruits that was registered at weekly measurements. This number was fluctuating at about 30-35 flowers / fruits in part A, while in part B 60-70 flowers / fruits were counted at the peak level and a decline to 50-60 flowers / fruits (Fig. 20a). The number of flowers / fruits was a bit higher at 150 W/m² compared to 100 W/m² (Fig. 20b1, Fig. 20b2).
27
Fig. 20: Development of open flowers / fruits, harvested fruits and their sum during the growth of the strawberries for part A (a) and part B (b1 and b2).
28
4.3.3 Outer quality of yield
Marketable yield was about 90 % (Tab. 4). The proportion of fruits in “extra class” was higher in part A than in part B. In contrast, a higher amount of 1. class fruits and smaller fruits was counted in part B. There seem to be no differences in the proportion of marketable and unmarketable yield between light intensities and varieties, except that in part A a tendentially or significantly higher extra class yield was measured with the higher light intensity. The proportion of misshaped fruits was in part B tendentially respectively significantly higher with Elsanta compared to Sonata. This was especially obvious at the lower light intensity.
Tab. 4: Proportion of marketable and unmarketable yield for part A and part B.
Treatment
Marketable yield Unmarketable yield extraclass >25mm 1.class >18mm toolittle weight moldy misshaped green
%
Part A
Elsanta150W/m2
Elsanta100W/m
%
82a 10a 1a 0 4a 3 b
77b 11a 1a 0 5a 6a
Elsanta150W/m
Part B
Elsanta150W/m
75a 15a 1a 0 3a 6a
82a 9a 1a 0 3a 5a Elsanta100W/m
45a 47a 3 b 0 3b 2a
Sonata150W/m
41a 46a 2 b 0 10a 1a
44a 48a 6a 0 1b 1a Elsanta100W/m
Sonata100W/m
43a 50a 4ab 0 2b 1a Elsanta150W/m
Sonata150W/m
Elsanta100W/m
Sonata100W/m
57a 37a 3ab 0 3b 0 b
51a 43a 4a 0 1bc 1ab
45a 45a 2 b 0 7a 1ab
54a 41a 3ab 0 1 c 1a
for the plants, where only the yield was measured Letters indicate significant differences at the end of the experiment (HSD, p ≤ 0,05).
29
–––––
–––––––––
2
2*
2*
2
2
2
2
2*
2*
2*
2*
*
4.3.4 Interior quality of yield
4.3.4.1 Sugar content
Sugar content of strawberries was measured once during the harvest period (part A: 29.10.2015, part B: 02.05.2016) and was around 8 for the higher light intensity and around 7 for the lower light intensity in part A. In contrast, in part B was a sugar content of about 7 measured in all treatments (Fig. 21).
Fig. 21: Sugar content of strawberries for part A (a) and part B (b).
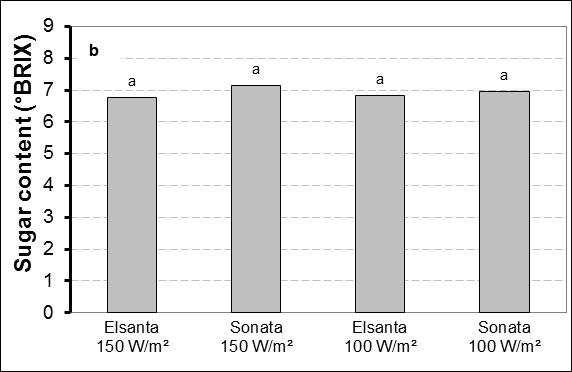
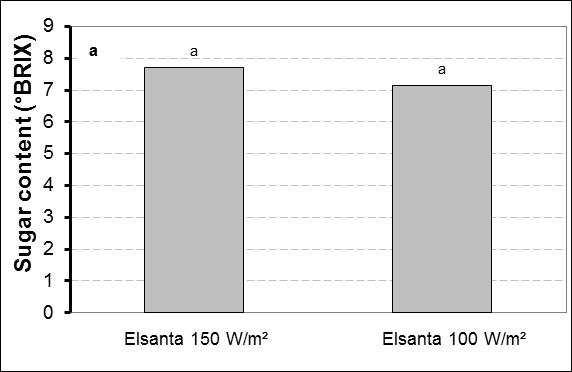
Letters indicate significant differences at the end of the experiment (HSD, p ≤ 0,05).
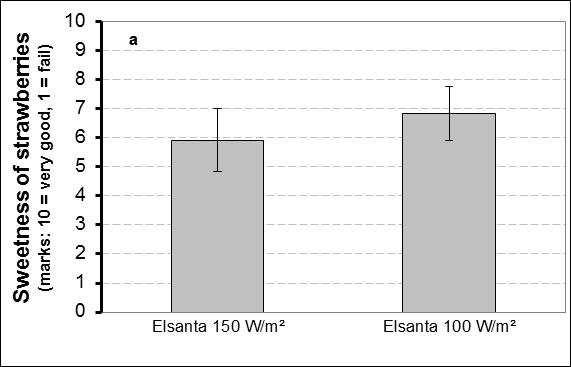
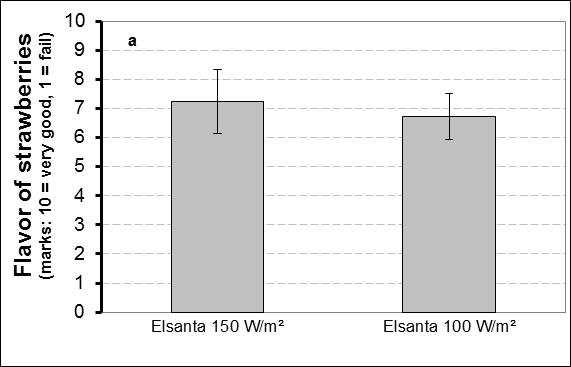
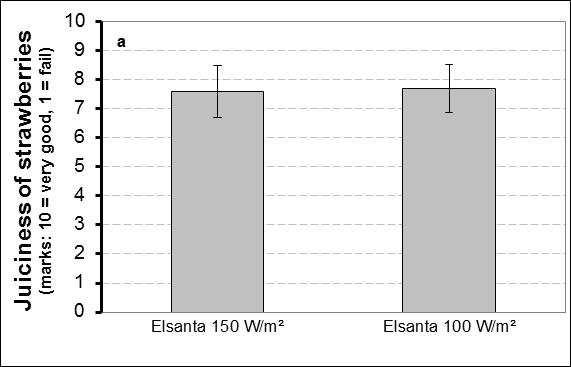
4.3.4.2 Taste of strawberries
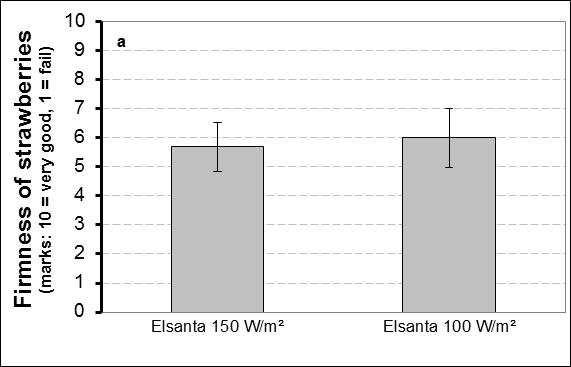
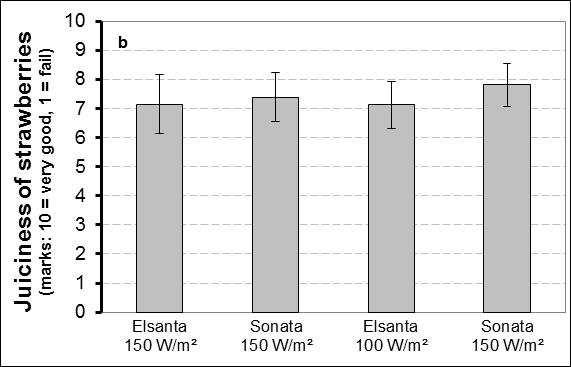
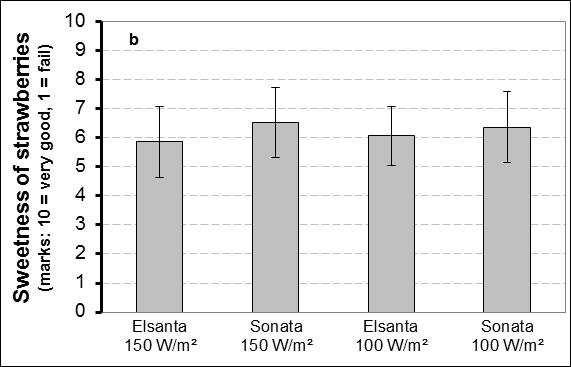
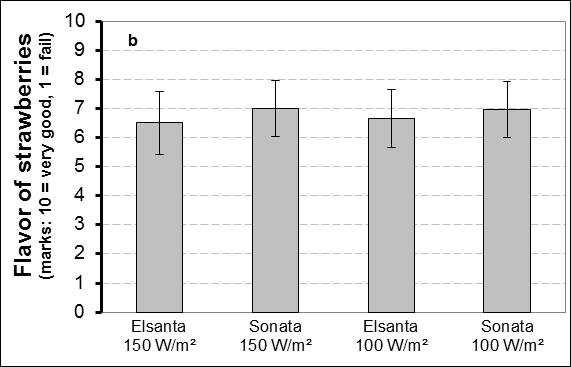
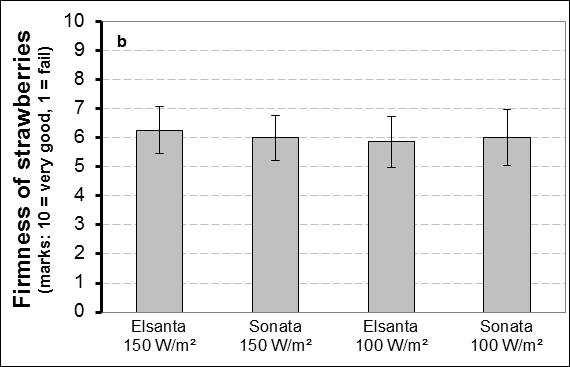
The taste of strawberries, subdivided into sweetness, flavour, juiciness and firmness was tested by untrained assessors on 30.10.2015 in part A and on 04.05.2016 in part B. The rating within the same sample was varying very much and therefore, same treatments resulted in a high standard deviation. It seems that a higher light intensity did not influence the sweetness, flavour, juiciness and firmness of strawberries (Fig. 22). However, in part A were the fruits at a lower light intensity tendentially evaluated sweeter. In contrast, it seems that Sonata got tendentially higher grades than Elsanta (Fig. 22a).
30
Fig. 22: Sweetness, flavour, juiciness and firmness of strawberries for part A (a) and part B (b).
31
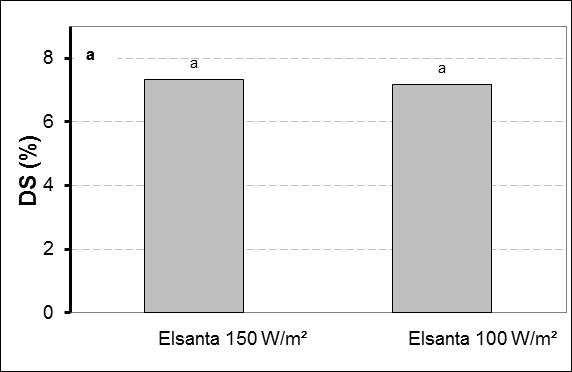
4.3.4.3 Dry substance of fruits
Dry substance (DS) of strawberries was measured once during the harvest period and amounted 7-8 % (Fig. 23). It seems that a lower light intensity had a tendentially higher dry substance content in part B, but not in part A. There seem to be no differences in the dry substance content between varieties.
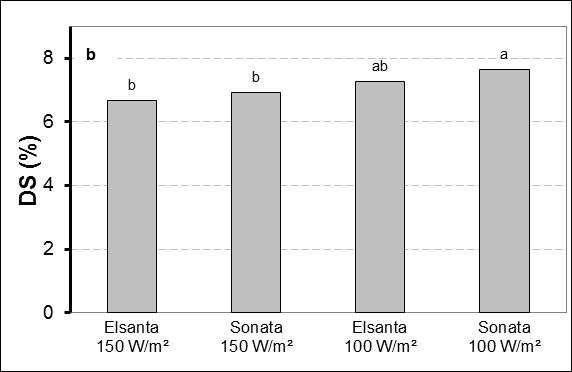
Fig. 23: Dry substance of strawberries for part A (a) and part B (b).
4.4 Economics
4.4.1 Lighting hours
The number of lighting hours is contributing to high annual costs and needs therefore special consideration to consider to decrease lighting costs per kg marketable yield. The total hours of lighting during the growth period of strawberries were both simulated and measured with dataloggers.
The simulated value was calculated according to the lighting hours written down. However, there it was not adjusted for automatic turn off, when incoming solar radiation was above a set-point (Tab. 5a, 5b). Therfore, the simulated value was especially higher in part B, where solar irradiation increased with the growth period.
The measured lighting hours were higher for the chamber with the higher light intensity, because the set-point was reached later compared to the chamber with the lower light intensity. However, in part B was the harvest at the lower light intensity about one week longer than the harvest at the higher light intensity, and resulting consequentely in a higher number of hours.
For calculation of the power, different electric consumptions were made, because the actual consumption is higher than the nominal value of the bulb: one was based on the power of the lamps (nominal Watts, 0 % more power consumption), one with 6 %
32
more power consumption and one for 10 % more power consumption. The power was higher for the measured values than for the simulated ones.
Tab. 5a: Lighting hours, power and energy in the cabinets for part A.
Treatment Hours Power Energy Energy/m2 h W kWh kWh/m2
HPS 150 W/m²
Measured values 923 212 9.777 196
Simulated values
0 % more power consumption (nominal) 980 150 7.350 147 6 % more power consumption 980 159 7.791 156 10 % more power consumption 980 165 8.085 162 HPS 100 W/m²
Measured values 899 141 6.345 127
Simulated values
0 % more power consumption (nominal) 980 100 4.900 98 6 % more power consumption 980 106 5.194 104 10 % more power consumption 980 110 5.390 108
Tab. 5b: Lighting hours, power and energy in the cabinets for part B.
Treatment Hours Power Energy Energy/m2 h W kWh kWh/m2
HPS 150 W/m²
Measured values 956 211 10.098 202
Simulated values
0 % more power consumption (nominal) 1.530 150 11.475 230 6 % more power consumption 1.530 159 12.164 243 10 % more power consumption 1.530 165 12.623 252 HPS 100 W/m²
Measured values 969 142 6.858 137
Simulated values
0 % more power consumption (nominal) 1.592 100 7.960 159 6 % more power consumption 1.592 106 8.438 169 10 % more power consumption 1.592 110 8.756 175
4.4.2 Energy prices
Since the application of the electricity law 65/2003 in 2005, the cost for electricity has been split between the monopolist access to utilities, transmission and distribution and the competitive part, the electricity itself. Most growers are, due to their location, mandatory customers of RARIK, the distribution system operator (DSO) for most of Iceland except in the Southwest and Westfjords (Eggertsson, 2009).
RARIK offers basically three types of tariffs:
33
a) energy tariffs, for smaller customers, that only pay fixed price per kWh, b) “time dependent” tariffs (tímaháður taxti, Orkutaxti TT000) with high prices during the day (09.00-20.00) at working days (Monday to Friday) but much lower during the night and weekends and summer, and c) demand based tariffs (afltaxti AT000), for larger users, who pay according to the maximum power demand.
In the report, only afltaxti is used as the two other types of tariffs are not economic. Since 2009, RARIK has offered special high voltage tariffs (“VA410” and “VA430”) for large users, that must either be located close to substation of the transmission system operator (TSO) or able to pay considerable upfront fee for the connection.
Costs for distribution are divided into an annual fee and costs for the consumption based on used energy (kWh) and maximum power demand (kW) respectively the costs at special times of usage. The annual fee is pretty low for “VA210” and “VA230” when subdivided to the growing area and is therefore not included into the calculation. However, the annual fee for “VA410” and “VA430” is much higher. Growers in an urban area in “RARIK areas” can choose between different tariffs. In the report only the possibly most used tariffs “VA210” and “VA410” in urban areas and “VA230” and “VA430” in rural areas are considered.
The government subsidises the distribution cost of growers that comply to certain criteria’s. Currently 87 % and 92 % of variable cost of distribution for urban and rural areas respectively. This amount can be expected to change in the future. Based on this percentage of subsidy and the lighting hours (Tab. 5), for the cabinets the energy costs per m2 during the time of the experiment for the growers were calculated (Tab. 6).
In part A are the energy costs per kWh for distribution after subsides around 0,92-1,01 ISK/kWh for „VA210“ and „VA230“, around 0,83-0,88 ISK/kWh for „VA410“ and 0,68-0,72 ISK/kWh for „VA430“. The energy costs for sale are for „Afltaxti“ around 7,93-8,22 ISK/kWh and for „Orkutaxti“ around 5,52-7,21 ISK/kWh.
In part B are the energy costs per kWh for distribution after subsides around 0,67-0,97 ISK/kWh for „VA210“ and „VA230“, around 0,58-0,84 ISK/kWh for „VA410“ and 0,53-0,69 ISK/kWh for „VA430“. The energy costs for sale are for „Afltaxti“ around 6,20-8,29 ISK/kWh and for „Orkutaxti“ around 5,09-7,77 ISK/kWh.
34
Cost of electricity was lower for the calculated values (Tab. 6). In general, tariffs for large users rendered lower cost.
Tab. 6a: Costs for consumption of energy for distribution and sale of energy for part A.
Costs for consumption Energy ISK/kWh
Energy costs with subsidy per m2 ISK/m2 Treatment Elsanta150W/m² Elsanta100W/m² Elsanta150W/m² Elsanta100W/m²
calculated real
DISTRIBUTION
RARIK Urban 87%subsidyfromthestate VA210
0,96 0,92 0,98 0,92 187 135 143 148 124 90 95 99 VA410 0,87 0,83 0,88 0,83 169 122 129 134 112 81 86 89
RARIK Rural 92%subsidyfromthestate VA230 1,00 0,96 1,01 0,96 195 141 150 155 129 94 100 103 VA430 0,70 0,68 0,72 0,68 138 100 106 110 91 67 71 73
SALE
Comments: The first number for the calculated value is with 0 % more power consumption, the second value with 6 % more power consumption and the last value with 10 % more power consumption.
Prices are from April 2016.
35
real
calculated real calculated real calculated
Afltaxti Orkutaxti 8,12 7,21 7,93 5,52 8,22 7,19 7,93 5,52 1.157 751 796 826 755 501 531 551
Tab. 6b: Costs for consumption of energy for distribution and sale of energy for part B.
Costs for consumption
Energy costs with subsidy per m2 ISK/m2 Treatment
Energy ISK/kWh
Elsanta150W/m² Sonata150W/m²
Elsanta100W/m² Sonata100W/m²
real calculated real
Elsanta150W/m² Sonata150W/m²
Elsanta100W/m² Sonata100W/m²
DISTRIBUTION
87%subsidyfromthestate VA210
RARIK Urban
0,93 0,69 0,93 0,67 189 157 167 173 127 107 113 117 VA410 0,84 0,60 0,83 0,58 170 137 145 151 114 92 98 102
RARIK Rural 92%subsidyfromthestate VA230 0,97 0,75 0,97 0,74 197 172 182 189 133 117 124 129 VA430 0,69 0,54 0,68 0,53 139 124 131 136 94 84 89 93
SALE
Afltaxti
Comments: The first number for the calculated value is with 0 % more power consumption, the second value with 6 % more power consumption and the last value with 10 % more power consumption.
Prices are from April 2016.
36
calculated real calculated real calculated
Orkutaxti 8,29 7,75 6,38 5,17 8,23 7,77 6,20 5,09 1.322 1.096 1.162 1.206 905 748 793 823
4.4.3 Costs of electricity in relation to yield
Costs of electricity in relation to yield for wintergrown strawberries were calculated (Tab. 7). While for the distribution several tariffs were possible, for the sale only the cheapest tariff was considered. The yield of the plants, where only the yield (and no other measurements were done) was used for the calculation, because it seems that the yield was decreased when plants and clusters were touched very often due to measurements.
The costs of electricity increased by around 30 % with a higher light intensity in part A and part B (Tab. 7).
Tab. 7a: Variable costs of electricity in relation to yield in part A.
Variable costs of electricity per kg yield ISK/kg
Treatment
Yield kg/m2
real calculated
Urban area (Distribution + Sale) VA210
Rural area (Distribution + Sale)
37
PartA
Elsanta150W/m2 Elsanta100W/m2
4,5 3,8
real calculated
297 196 208 215 228 154 163 169 VA410 293 193 204 212 225 151 160 166
VA230 299 197 209 217 230 155 164 170 VA430 286 188 199 207 220 148 156 162
Tab. 7b: Variable costs of electricity in relation to yield in part B. Variable costs of electricity per kg yield ISK/kg
PartB
Treatment Elsanta
Yield kg/m
calculated
Urban area (Distribution + Sale) VA210 169 141 149 155 151 126 133 138 126 105 111 115 116 96 102 106 VA410 167 138 147 152 150 124 131 136 125 103 109 113 114 94 100 104
Rural area (Distribution + Sale) VA230 170 142 151 156 152 127 135 140 127 106 112 116 116 97 103 107 VA430 164 137 145 150 146 122 130 134 122 102 108 112 112 93 99 103
4.4.4 Profit margin
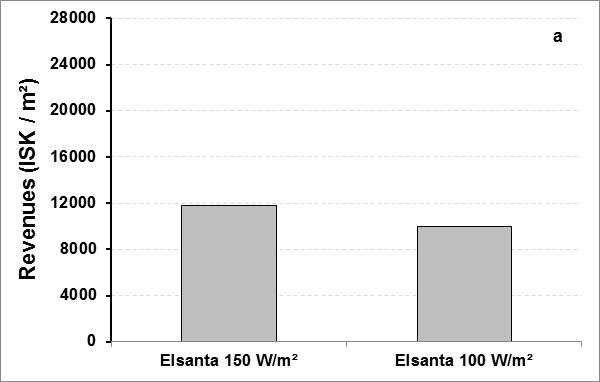
The profit margin is a parameter for the economy of growing a crop. It is calculated by substracting the variable costs from the revenues. The revenues itself, is the product of the price of the sale of the berries and kg yield. For each kg of strawberries, growers are getting about 2.600 ISK from Sölufélag garðyrkjumanna (SfG). Therefore, the revenues increased with more yield (Fig. 24). In part A was the revenues much lower compared to part B. Also, a higher light intensity increased the revenues and Sonata had higher revenues than Elsanta.
When considering the results of previous chapter, one must keep in mind that there are other cost drivers in growing strawberries than electricity alone (Tab. 6). Among others, this are e.g. the costs for the plant itself (≈ 1.500 ISK/m2), soil (≈ 550 ISK/m2), gutters and other material (≈ 50 ISK/m2), costs for plant protection
38
150W/m2 Sonata 150W/m2 Elsanta 100W/m2 Sonata 100W/m2
2 8,9 10,0 8,2 8,9 real
real calculated real calculated real calculated
Fig. 24: Revenues at different treatments for part A (a) and part B (b). (
350 ISK/m2), plant nutrition (
200-300 ISK/m2) and beneficial organism (
100 ISK/m2), CO2 transport (
150 ISK/m2), liquid CO2 (
950 ISK/m2), the rent of the tank (
100-200 ISK/m2), material for packing (
150 ISK/m2), the rent of the green box (
200-500 ISK/m2) and transport costs from SfG (
150 ISK/m2) (Fig. 25).
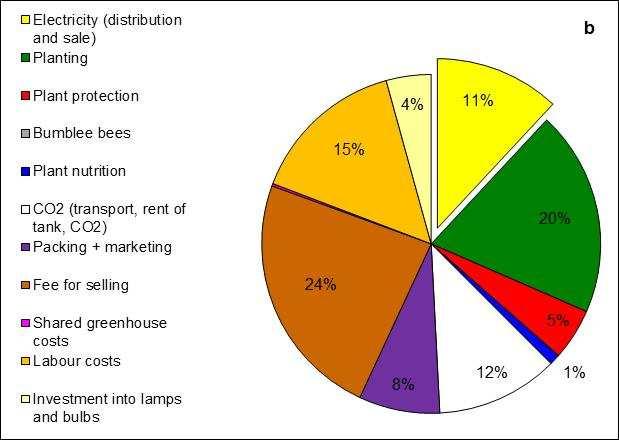
However, in Fig. 25 four of the biggest cost drivers are not included and these are the investment in lamps and bulbs, electricity, labour costs and the fee for SfG for selling the strawberries. These costs are also included in Fig. 26 and it is obvious, that especially the fee for selling the strawberries, the electricity as well as the labour costs are contributing much to the variable and fixed costs beside the costs for planting and CO2 costs. The proportion of the fee for selling the strawberries on the total costs is especially high at high yielding strawberries (part B) and contributing to ¼ of the costs. In contrast, the costs for planting decreased from ¼ with a low yield (part A) to ⅕ with a high yield (part B). A detailed composition of the variable costs at each treatment is shown in Tab. 8.
39
≈
≈
≈
≈
≈
≈
≈
≈
≈
25: Variable and fixed costs (without lighting and labour costs) for part A (a) and part B (b).
40 Fig.
2 2 2 2
26: Division of variable and fixed costs for part A (a) and part B (b).
41 Fig.
2 2 2 2
Sales
margin of
Part A
at
Part B
Variable and fixed costs (ISK/m
PionerNPKRed9-5-30
Potassiumsulfate
PionerIronChelate
Monopotassiumphosphate
42 Tab. 8: Profit
strawberries
different light treatments for part A and part B (urban area, VA210).
Treatment Elsanta 150 W/m2 Elsanta 100 W/m2 Elsanta 150 W/m2 Sonata 150 W/m2 Elsanta 100 W/m2 Sonata 100 W/m2 Marketable yield kg/m2 4,5 3,8 8,9 10,0 8,2 8,9
SfG(ISK/kg) 1 2.600 2.600 2.600 2.600 2.600 2.600 Revenues (ISK/m2) 11.762 9.997 23.184 25.942 21.258 23.166
2) Electricitydistribution 2 187 124 189 189 127 127 Electricitysale 1.157 755 1.322 1.322 905 905 Strawberryplants 3 1.500 1.500 1.500 1.500 1.500 1.500 Soilforstrawberries 4 550 550 550 550 550 550 Pots 5 7 7 7 7 7 7 Tape 6 4 4 4 4 4 4 Gutters 7 28 28 28 28 28 28 Loker 8 28 28 28 28 28 28 Paraat 9 291 291 146 146 146 146 Savonasoap 10 13 13 13 13 Beneficialorganismn 11 378 378 336 336 336 336 Bumblebees 12 6 6 6 6 6 6 Calciumnitrate 13 22 22 21 19 20 21
14 62 62 PionerNPKYellow10-4-25 15 14 14
16 10 10 2 2 2 2 PionerMikroPlus 17 25 25
EDDHA 6 % 18 5 5 Fe-DTPA3%vlb 19 16 16 16 17
20 23 22 22 24 Magnesiumsulphate 21 12 11 11 12 Potassiumnitrate 22 30 29 29 31 Micronutrients 23 2 2 2 2 CO2 transport 24 146 146 146 146 146 146 LiquidCO2 25 960 960 960 960 960 960 RentofCO2 tank 26 140 140 140 140 140 140 RentofboxfromSfG 27 94 80 186 208 170 186 Packingmaterial 28 240 204 474 530 434 473 FeeforSfG 29 1.267 1.077 2.497 2.794 2.289 2.495 TransportfromSfG 30 79 67 156 175 143 156 Sharedfixedcosts 31 24 24 24 24 24 24 Lamps 32 357 238 357 357 238 238 Bulbs 33 190 127 190 190 127 127 ∑ variable costs 7.771 6.872 9.365 9.752 8.423 8.702 Revenues -∑ variable costs 3.991 3.125 13.820 16.190 12.835 14.464 Workinghours(h/m2) 0,71 0,66 1,04 1,11 0,98 1,04 Salary(ISK/h) 1.525 1.525 1.525 1.525 1.525 1.525 Labourcosts(ISK/m2) 1.088 1.012 1.581 1.700 1.498 1.580 Profit margin (ISK/m2) 2.903 2.113 12.239 14.490 11.337 12.884
price winter 2015/2016: 2.600 ISK/kg
assumption: urban area, tariff “VA210”, no annual fee (according to datalogger values)
100 ISK / strawberry plant
66.000 ISK / 4,5 m3 soil
54 ISK / pot; assumption: 10 years life time, 3 circles / year
4.500 ISK / bund of tape; assumption: 10 years life time, 3 circles / year
660 ISK / m gutter; assumption: 10 years life time, 3 circles / year
25.500 ISK / 5 l Loker; assumption: spraying once per week (~8 times per growing season)
34.950 ISK / bund Paraat; assumption: spraying twice (part A) / once (part B) per growing season, 400 ml / pot
8.800 ISK / 5 l Savona soap; assumption: spraying three times (part B) per growing season
beneficials: 7876 ISK / unit Aphidius ervi (parasitic wasp) 4850 ISK / unit Orius laevigatus (predatory bug)
2050 ISK / unit Aphidius colemani (parasitic wasp)
3490 ISK / unit mix of the parasitic wasp species Aphidius colemani, Aphidius ervi, Aphelinus abdominalis, Praon volucre and Ephedrus cerasicola
4.900 ISK / unit bumble bees
2.750 ISK / 25 kg Calcium nitrate
6.950 ISK / 25 kg Pioner NPK Red 9-5-30
7.300 ISK / 25 kg Pioner NPK Yellow 10-4-25
3.550 ISK / 25 kg Potassium sulphate
13.000 ISK / 20 kg Pioner Mikro Plus
19.475 ISK / 5 kg Iron Chelate EDDHA 6 %
17.050 ISK / 25 kg Fe-DTPA 3% vlb 18
7.050 ISK / 25 kg Monopotassium phosphate
1.700 ISK / 25 kg Magnesium sulfate
4.175 ISK / 25 kg Potassium nitrate
33.900 ISK / 5 kg micronutrients
CO2 transport from Rvk to Hveragerði / Flúðir: 8,0 ISK/kg CO2
liquid CO2: 42,0 ISK/kg CO2
rent for 6 t tank: 70.000 ISK/month, assumption: rent in relation to 1.000 m2 lightened area
90 ISK / box
packing costs (material): costs for packing of strawberries (0,20 kg): box: 4 ISK / 0,20 kg, lid: 5 ISK / 0,20 kg, label: 2 ISK / 0,20 kg
fee for SfG for selling the strawberries: 56 ISK / 0,20 kg
transport costs from SfG: 2.652 ISK / board
94 ISK/m2/year for common electricity, real property and maintenance
HPS lights: 30.000 ISK/lamp, life time: 8 years
HPS bulbs: 4.000 ISK/bulb, life time: 2 years
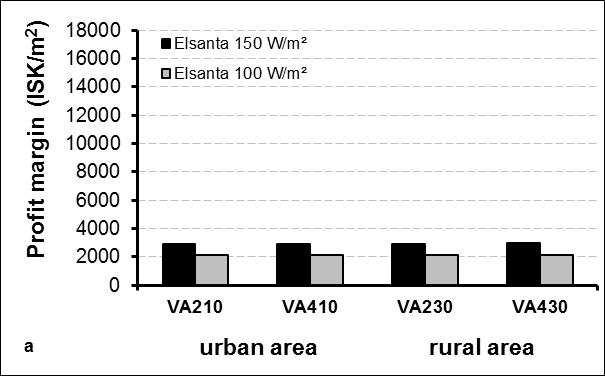
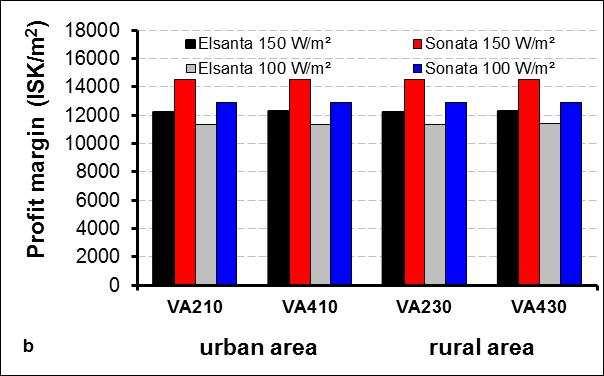
The profit margin was dependent on the treatment (Fig. 27). In part A, the profit margin for Elsanta was with about 2.900 ISK/m2 highest with the higher light intensity and about 800 ISK/m2 lower for the lower light intensity. Again, in part B was the
43 1
2
3
4
5
6
7
8
9
10
11
12
13
14
15
16
17
18
19
20
21
22
23
24
24
25
26
27
28
29
30
31
32
Fig. 27: Profit margin in relation to tariff and treatment for part A (a) and part B (b).
profit margin for Elsanta with about 12.200 ISK/m2 highest at the higher light intensity and about 900 ISK/m2 lower for the lower light intensity. And for Sonata with about 11.300 ISK/m2 highest at the higher light intensity and about 1.600 ISK/m2 lower for the lower light intensity. That means an increase of the light intensity by 50 W/m2 ,
44
from 100 W/m2 to 150 W/m2, roose the profit margin by 800-900 ISK/m2 for Elsanta and by 1.600 ISK/m2 for Sonata. Also, the use of Sonata instead of Elsanta increased the profit margin by 2.300 ISK/m2 at the higher light intensity and by 1.500 ISK/m2 at the lower light intensity. For both, part A and part B, a larger use (higher tariff: “VA 410” compared to “VA 210”, “VA 430” compared to “VA 230”), did not influence the profit margin. Also, it did not matter if the greenhouse is situated in an urban or rural area, the profit margin was comparable (Fig. 27).
5 DISCUSSION
5.1 Yield in dependence of the light intensity
Strawberry plants need to have strong vegetative growth in order to flower and to produce berries. In winter production is flower induction highly dependent on the supplemental light. At the two tested light intensities was the number of flowers of Elsanta and Sonata increased at the higher light intensity, which resulted in the possibility to enhance strawberry productivity to a quite big extent by distributing a higher amount of light intensity. Also, Stadler (2016) counted a higher number of flowers of Sonata at 150 W/m2 compared to 100 W/m2 . Marcelis et al. (2006) reported the general rule, that 1 % increase of light intensity results in a yield increase of 0,7-1,0 % for fruit vegetables, 0,8-1,0 % for soil grown vegetables, 0,6-1,0 % for cut flowers, 0,25-1,25 % for bulb flowers, 0,5-1,0 % for flowering pot plants and 0,65 % for non-flowering pot plants. No values were indicated for berries. In the present findings were values of 0,2-0,6 % for Elsanta and 0,2-0,3 % for Sonata found and are with that much lower than the above mentioned ones. Also, Stadler (2016) mentioned values of 0,3-0,4 % for Sonata. The reason for the higher yield of about more than 10 % at the higher light intensity was a tendentially increased number of harvested fruits. Either the extra class fruits or the 1st and 2nd class fruits were higher. In addition, for Elsanta the marketable fruits at the higher light intensity were 0,8-1,8 g heavier than at the lower light intensity. In contrast, for Sonata were 0,5 g heavier fruits found at the lower light intensity, but due to more harvested fruits at the higher light intensity was also here more than 10 % marketable yield reached. Also, Stadler (2016) reported that the reason for the higher yield at 150 W/m2 compared to 100 W/m2 was an increased number of harvested extra class strawberries and in addition in the spring / summer experiment,
45
to a smaller extend, a higher average weight of strawberries, while no effect of light intensity on average weight was observed in the winter / spring experiment. Again, for fruit vegetables the reason for the higher yield at a higher light intensity was attributed to more, rather than heavier fruits of sweet pepper (Stadler, 2010) and tomatoes (Stadler, 2013a; Stadler 2013b).
However, in the literature there are also other explanations for a higher yield. For example, pulled Lorenzo & Castilla (1995) in their conclusion a higher LAI together with a higher yield; i.e. higher values of LAI in the high density treatment lead to an improved radiation interception and, subsequently, to higher biomass and yield of sweet pepper than in the low density treatment. Also, Hidaka et al. (2013) concluded that accelerated photosynthesis promoted plant growth, as manifested by increases in leaf weight and LAI, leading to increased fruits weight, number of fruits and marketable yield. The LAI was not observed in the presented experiment, but the number of leaves was tendentially higher at the higher light intensity. However, more factors than only light intensity might have influenced yield: The higher light intensity resulted in a slightly higher air, soil and leaf temperature and might also have been contributed to a yield increase, but the influence of each factor is unknown. Indeed, Van Delm et al. (2016) reported that the total yield of strawberries in Belgium decreased with lower light intensities or reduced operation hours and concluded that the regulation of temperature and lighting strategy seems to be important for plant balance between earliness and total yield.
Van Delm et al. (2016) hypothesized that when total yield of strawberries was comparable between lighted and unlighted plants, was the advancement of the harvest more pronounced. When there is a strong increase in yield between lighted and unlighted plants is the difference in earliness smaller. This is fitting to the results of the presented study, as a more than 10 % higher yield was reached at the higher light intensity, but in contrast was there only a small difference of few days in the earliness of the ripening of the strawberries between light intensities.
In tomatoes, it was found that a higher light intensity decreased pollination with about one fruit less pollinated compared to the lower light intensity (Stadler, 2013a). However, in the presented experiment were flowers pollinated after 1-2 days, independent of the light intensity. For Elsanta it seems that the unmarketable yield was slightly higher for the lower light intensity, while with a higher light intensity a
46
bigger amount of fruits in “extra class” were counted. For Sonata seems to be no differences within light intensities.
The importance of the photoperiod is shown by studies from Verheul et al. (2007), where a daily photoperiod of 12 h or 13 h resulted in the highest number of strawberry plants with emerged flowers and a photoperiod of 14 h or more reduced this number, while no flowers emerged at a photoperiod of 16 h, 20 h or 24 h (Verheul et al., 2006). Furtheron, interactions between photoperiod, temperature, duration of short-day treatment and plant age on flowering were documented from Verheul et al. (2006). In contrast, the presented experiment was conducted with a photoperiod of 18 h, which induced good flowering of strawberries.
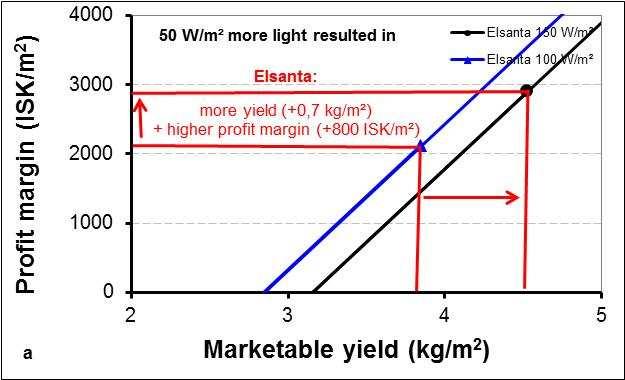
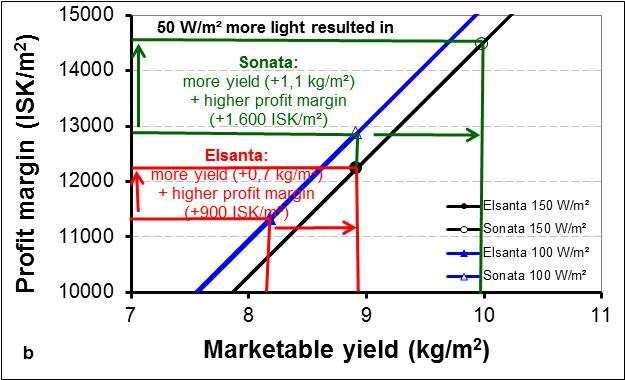
Using a higher light intensity is associated with higher expenses for the electricity. Thus, it is necessary that the higher use of electricity is paying off by obtaining a higher yield. The higher light intensity resulted in a higher profit margin than the lower light intensity, meaning that the additional yield was high enough to pay off for the higher use of electricity. An increase of the light intensity from 100 W/m² to 150 W/m² resulted in a yield increase of 0,7 kg/m² for Elsanta and this was reflected in an increase of profit margin of 800-900 ISK/m². For Sonata resulted an increase of 50 W/m² in a yield increase of 1,1 kg/m² and this was reflected in an increase of profit margin of 1.600 ISK/m².
When the yield of the higher light intensity would have been 0,4 kg lower for Elsanta in part A and part B, profit margin would have been comparable to the one at the lower light intensity. That means it is only worth to use 50 W/m2 more light if this would result in an almost 0,5 kg/m2 higher yield for Elsanta at 150 W/m2 compared to 100 W/m2 (Fig. 28a, Fig. 28b).
When the yield of the higher light intensity would have been 0,8 kg lower for Sonata in part B, profit margin would have been comparable to the one at the lower light intensity. That means it is only worth to use 50 W/m2 more light if this would result in an almost 0,9 kg/m2 higher yield for Sonata at 150 W/m2 compared to 100 W/m2 (Fig. 28b).
In part B were the lights often automatically turned off due to high solar radiation. That resulted in lower expenses for sale and distribution of energy. However, due to the fact that plants were put directly into the experimental chamber and not during the first four weeks into a different chamber were expenses for sale and distribution
47
of energy comparable between part A and part B (the used energy was only measured in the experimental chambers).
Fig. 28: Profit margin in relation to yield with light intensity – calculation scenarios (urban area, VA210) in part A (a) and part B (b1 and b2).
48
Stadler (2010) studied the effect of light intensity at low solar irradiation: A high light intensity significantly increased marketable yield of sweet pepper during periods of low natural light level, the gain decreased with increasing natural light level and the yield was at high natural light level not different within light intensities. However, this was not confirmed at the presented experiments with strawberries as there was also a gain in yield determined by using a higher light intensity at increasing natural light level. This was also confirmed by Stadler (2016), however the use of energy was very low at high natural light level in the spring / summer experiment and therefore may have other factors than the amount of supplemental light contributed to the higher yield at 150 W/m2 when compared to 100 W/m2
A further yield increase of strawberries might be possible with a higher plant density. For example found Paranjpe et al. (2008) that early and total marketable yield increased linearly with increasing plant densities (8,8; 9,5; 10,4; 11,4; 17,6; 19,1; 20,8; 22,9 plants/m²). These yield increases were achieved without adversely affecting mean fruit size.
In addition, at higher light intensity was in the autumn / winter crop a tendentially higher sugar content measured, while in the winter / spring crop no differences were found.
5.2 Yield in dependence of the variety
It is known, that different varieties of strawberries naturally result in different yield levels. Elsanta and Sonata are the most used varieties for winter greenhouse cultivation under lights in Iceland.
Tendentially more flowers developed for Sonata compared to Elsanta at 100 W/m2 , while there seem to be no differences between varieties in the number of flowers at 150 W/m2. The same patten was also reflected in the number of harvested fruits. In contrast, Proefcentrum Hoogstraten (2016) counted more flowers at Elsanta (41,5) compared to Sonata (38,5) at 90 W/m2
Strawberries of Elsanta were few days earlier ripe than Sonata. However, Elsanta plants were developed further when planted and therefore, this might be reflected in the differences in the harvest time and might not be related to differences between varieties. Indeed, at the low light intensity were both varieties ripe after 44 days from
49
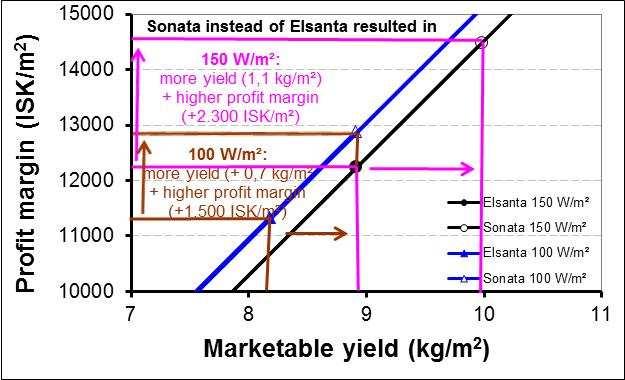
flowering. At the higher light intensity seem Elsanta to be earlier ripe, but there were only very few data available for Sonata and therefore, this data can not be really evaluated. However, in a variety test at the Research Centre Hoogstraten in Belgium were strawberries grown during winter under lights and Elsanta was about one week earlier ripe than Sonata (Proefcentrum Hoogstraten, 2016). Sonata had tendentially more leaves, while Elsanta produced more runners. At the production side gave Sonata a tendentially 10 % higher yield compared to Elsanta. Therefore, by the selection of Sonata instead of Elsanta can the yield and the profit margin be increased: At the lower light intensity resulted the use of Sonata in a 0,7 kg/m2 higher yield, which was reflected in a 1.500 ISK/m² higher profit margin. Again, when a higher light intensity together with Sonata instead of Elsanta is selected, is a 1,1 kg/m2 higher yield and a 2.300 ISK/m2 higher profit margin possible. This means, it is not only paying of to select a higher light intensity, but also to choose a high yielding variety like Sonata. The advantage of Sonata compared to Elsanta was especially paying of at a higher light intensity.
Fig. 29: Profit margin in relation to yield with different varieties – calculation scenarios (urban area, VA210) in part A (a) and part B (b1 and b2).
However, in Belgium showed a variety test with 90 W/m2 and a plant density of 12,3 plants/m2, that Elsanta gave the highest yield with 5,11 kg/m2, while Sonata was just
50
giving 4,34 kg/m2 (Proefcentrum Hoogstraten, 2016). In addition had Elsanta bigger fruits (Elsanta: 41% fruits larger than 31 mm, 50 % fruits smaller then 31 mm; Sonata: 36 % fruits larger than 31 mm, 61 % fruits smaller then 31 mm). In contrast, at the presented results seems to be an advantage of a bigger fruit size for Sonata at the lower light intensity. But, at the higher light intensity seems Elsanta to have a bigger fruit size. As well as in Belgium (Proefcentrum Hoogstraten, 2016) were also in the experiment in Iceland more misshapened fruits at Elsanta. Van Delm et al. (2016) even mentioned that Elsanta was susceptible to malformation due to forcing. Especially HPS lighting (83 W/m2) increased the percentage of misshaped fruits compared to unlighted strawberries. They concluded that the varieties Clery and Sonata seem to be better suited for forcing by lighting (and temperature) than Elsanta.
However, not only the variety is of importance, also the condition of the plant. In part A was only a very low yield of Elsanta reached, while the yield in part B was much higher. This is highlighting, that only plants that can encourage a high yield level should be planted.
Proefcentrum Hoogstraten (2016) measured an increasing sugar content from 7,4 to 8,7 with an average of 7,6°Brix for Sonata, while the Brix content decreased to the middle of the harvest period and increased again to the end of the harvest period and with an average of 6,3°Brix. The changes in the Brix content might also be the reason, why in the present experiment were no differences found between Sonata and Elsanta. This makes it necessary to take more regulary samples in further experiments to be able to detect possible differences in the sugar content between varieties.
In the presented experiment were Sonata tendentially given higher grades in the tasting experiment. Also, Proefcentrum Hoogstraten (2016) evaluated the flavour of Sonata with higher grades than Elsanta. In total got the fruit assessment of Sonata a higher score (Sonata: 82,3 %, Elsanta: 68,8 %), with higher grades particularly at “bruising skin”, “colouring” and “regularity (shape)”. In contrast, in the shelf life was Elsanta in total evaluated better than Elsanta and got mainly higher grades in the “brilliance” and “rot” than Sonata, while Sonata scored mainly better in “freshness of calyx”.
51
5.3
Future speculations concerning energy prices
In terms of the economy of lighting it is also worth to make some future speculations about possible developments. So far, the lighting costs (electricity + bulbs) are contributing to about 1/6 (part A) / 1/7 (part B) of the production costs of strawberries. In the past and present there have been and there are still a lot of discussions concerning the energy prices. Therefore, it is necessary to highlight possible changes in the energy prices (Fig. 30).
The white columns are representing the profit margin according to Fig. 27. Where to be assumed, that growers would get no subsidy from the state for the distribution of the energy, that would result in a profit margin of 2.100-2.900 ISK/m2 in part A and of 11.300-14.500 ISK/m2 in part B (black columns, Fig. 30). Without the subsidy of the state, probably less Icelandic grower would produce strawberries over the winter months. When it is assumed that the energy costs, both in distribution and sale, would increase by 25 %, but growers would still get the subsidy, then the profit margin would range between 1.900-2.600 ISK/m2 in part A and between 11.10014.100 ISK/m2 in part B (dotted columns). When it is assumed, that growers have to pay 25 % less for the energy, the profit margin would increase to 2.300-3.200 ISK/m2 in part A and in part B to 11.600-14.900 ISK/m2 (gray columns). From these scenarios it can be concluded that from the grower’s side it would be preferable to get subsidy to be able to get a higher profit margin and grow strawberries over the winter. It is also showing clearly, that it is only paying of to produce strawberries during the winter in Iceland, when a high yield is guarantied.
52
Fig. 30: Profit margin in relation to treatment – calculation scenarios (urban area, VA210) for part A and part B.
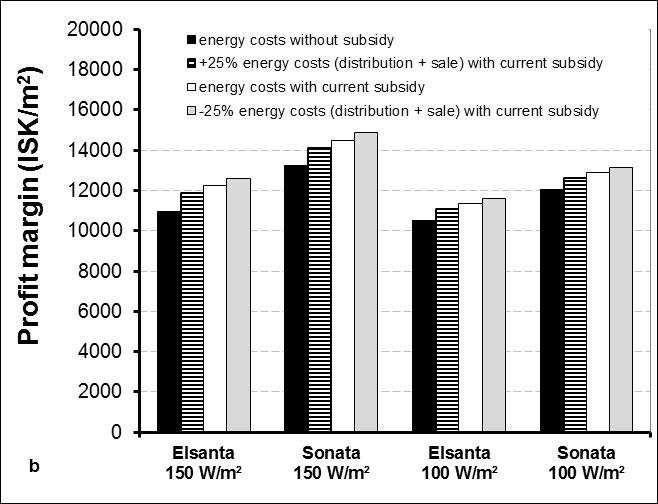
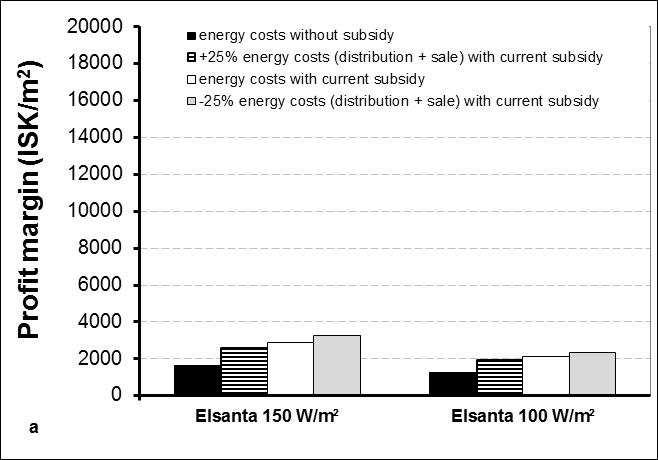
53
5.4
Recommendations for increasing profit margin
The current economic situation for growing strawberries necessitate for reducing production costs to be able to heighten profit margin for strawberry production. On the other hand side, growers have to think, if strawberries should be grown during low solar irradiation and much use of electricity.
It can be suggested, that growers can improve their profit margin of strawberries by:
1. Getting higher price for the berries
It may be expected to get a higher price, when consumers would be willing to pay even more for Icelandic berries than imported ones. Growers could also get a higher price for the fruits with direct marketing to consumers (which is of course difficult for large growers). They could also try to find other channels of distribution (e.g. selling directly to the shops and not over SfG). In doing so, growers could save the very high expences of the fee to SfG for selling the strawberries. This is especially important when a high yield is expected, because then the proportion of the fee for selling the strawberries through SfG is contributing to ¼ of the production costs. Therefore, it would be profitable for the grower to choose other channels of distribution.
2. Lower planting costs
The price for the strawberry plant is quite high. By using the strawberry plant not only once, but twice, could costs be decreased. By that, also the costs for the soil would be lowered. However, it is necessary that the yield is staying at a high value when same plants are used more than once.
It might also be possible to decrease the planting costs, by using everbearers. Everbearing strawberry plants produce strawberries not only during six weeks, but throughout an entire growing season and with that making it unnecessary to plant strawberries in about three months intervalls. However, to make this economicaly feasible, also a comparable high yield is necessary.
3 Selection of a good plants
Not only the variety, but also within a variety yield differences are possible. Therefore, it is necessary to select first of all plants with a high yield guaranty. Beside that is the choose of the variety also important and can result in a profit margin that is more than 1.500 ISK/m2 higher.
54
3. Decrease plant nutrition costs
Growers can decrease their plant nutrition costs by mixing their own fertilizer. When growers would buy different nutrients separately for a lower price and mix out of this their own composition, they would save fertilizer costs. However, this takes more time and it is more difficult to perform this task by employees.
4. Lower CO2 costs
The costs of CO2 are pretty high. Therefore, the question arises, if it is worth to use that much CO2 or if it would be better to use less and get a lower yield but all together have a possible higher profit margin. The CO2 selling company has currently a monopoly and a competition might be good.
5. Decrease packing costs
The costs for packing (material) from SfG and the costs for the rent of the box are high. Costs could be decreased by using cheaper packing materials.
6. Efficient employees
The efficiency of each employee has to be checked regularly and growers will have an advantage to employ faster workers. Growers should also check the user-friendliness of the working place to perform only minimal manual operations. Very often operations can be reduced by not letting each employee doing each task, but to distribute tasks over employees. In total, employees will work more efficiently due to the specialisation.
7. Decrease energy costs
- Lower prices for distribution and sale of energy (which is not realistic)
- Growers should decrease artificial light intensity at increased solar irradiation, because this would possibly result in no lower yield (Stadler et al., 2010).
- Growers should check if they are using the right RARIK tariff and the cheapest energy sales company tariff. Unfortunately, it is not so easy, to say, which is the right tariff, because it is grower dependent.
- Growers should check if they are using the power tariff in the right way to be able to get a lowered peak during winter nights and summer (max.
55
power -30 %). It is important to use not so much energy when it is expensive, but have a high use during cheap times.
- Growers can save up to 8 % of total energy costs when they would divide the winter lighting over all the day. That means growers should not let all lamps be turned on at the same time. This would be practicable, when they would grow in different independent greenhouses. Of course, this is not so easy realisable, when greenhouses are connected together, but can also be solved there by having different switches for the lamps to be able to turn one part of the lamps off at a given time. Then, plants in one compartment of the greenhouse would be lightened only during the night. When yield would be not more than 2 % lower with lighting at nights compared to the usual lighting time, dividing the winter lighting over all the day would pay off. However, a tomato experiment showed that the yield was decreased by about 15 % when tomatoes got from the beginning of November to the end of February light during nights and weekends (Stadler, 2012). This resulted in a profit margin that was about 18 % lower compared to the traditional lighting system and therefore, normal lighting times are recommended.
- For large growers, that are using a minimum of 2 GWh it could be recommended to change to “stórnotendataxti” in RARIK and save up to 35 % of distribution costs.
- It is expected, that growers are cleaning their lamps to make it possible, that all the light is used effectively and that they are replacing their bulbs before the expensive season is starting.
- Aikman (1989) suggests to use partially reflecting material to redistribute the incident light by intercepting material to redistribute the incident light by intercepting direct light before it reaches those leaves facing the sun, and to reflect some light back to shaded foliage to give more uniform leaf irradiance.
56
CONCLUSIONS
The strawberry yield was positively influenced by a higher light intensity. The high increase in energy costs by lighting when increasing light intensity from 100 W/m2 to 150 W/m2 was accompanied by a yield increase of 0,7 kg/m2 for Elsanta and an increase of profit margin of 800-900 ISK/m2 and a yield increase of 1,1 kg/m2 and and increase of profit margin of 1.600 ISK/m2 for Sonata. Therefore, from the economic side it seems to be recommended to provide 50 W/m2 more light and use the variety Sonata. However, from the look of the plant a lower light intensity would be recommended.
Growers should pay attention to possible reduction in their production costs for strawberries other than energy costs.
57 6
REFERENCES
AIKMAN DP, 1989: Potential increase in photosynthetic efficiency from the redistribution of solar radiation in a crop. J. Exp. Bot. 40, 855-864.
DEMERS DA, DORAIS M, WIEN CH, GOSSELIN A, 1998a: Effects of supplemental light duration on greenhouse tomato (Lycopersicon esculentum Mill.) plants and fruit yields. Sci. Hortic. 74, 295-306.
DEMERS DA, GOSSELIN A, WIEN HC, 1998b: Effects of supplemental light duration on greenhouse sweet pepper plants and fruit yields. J. Amer. Hort. Sci. 123, 202-207.
EGGERTSSON H, 2009: Personal communication (Notice in writing) from Haukur Eggertsson, Orkustofnun, October 2009.
HAO X, PAPADOPOULOS AP, 1999: Effects of supplemental lighting and cover materials on growth, photosynthesis, biomass partitioning, early yield and quality of greenhouse cucumber. Sci. Hortic. 80, 1-18.
HIDAKA K, DAN K, IMAMURA H, MIYOSHI Y, TAKAYAMA T, SAMESHIMA K, KITANO M, OKIMURA M, 2013: Effect of supplemental lighting from different light sources on growth and yield of strawberry. Environ. Control Biol. 51, 41-47.
LORENZO P, CASTILLA N, 1995: Bell pepper response to plant density and radiation in unheated plastic greenhouse. Acta Hort. 412, 330-334.
MARCELIS LFM, BROEKHUIJSEN AGM, MEINEN E, NIJS EHFM, RAAPHORST MGM, 2006: Quantification for the growth response to light quality of greenhouse grown crops. Acta Hort. 711, 97-104.
PARANJPE A, CANTLIFFE DJ, STOFFELLA PJ, LAMB EM, POWELL CA, 2008: Relationship of plant density to fruit yield of ‘Sweet Charli’ strawberry grown in a pine bark soilless medium in a high-roof passively ventilated greenhouse. Sci. Hortic. 115, 117-123.
PROEFCENTRUM HOOGSTRATEN VZW., 2016: Screening trail of new strawberry cultivars 2016.
58 7
STADLER C, 2010: Effects of plant density, interlighting, light intensity and light quality on growth, yield and quality of greenhouse sweet pepper. Final report, Rit LbhÍ nr. 30.
STADLER C, 2012: Effects of lighting time and light intensity on growth, yield and quality of greenhouse tomato. Final report, Rit LbhÍ nr. 40.
STADLER C, 2013a: Áhrif ljósstyrks, rótarbeðsefnis, vökvunar og umhirðu á vöxt, uppskeru og gæði gróðurhúsatómata. Final report, Rit LbhÍ nr. 43.
STADLER C, HELGADÓTTIR Á, ÁGÚSTSSON, M, RIIHIMÄKI MA, 2010: How does light intensity, placement of lights and stem density affect yield of wintergrown sweet pepper? Fræðaþing landbúnaðarins, 227-232.
STADLER C., 2013b: Áhrif ljósstyrks, ágræðslu og umhverfis á vöxt, uppskeru og gæði gróðurhúsatómata. Final report, Rit LbhÍ nr. 45.
STADLER, C., 2016: Áhrif ljósstyrks á vöxt, uppskeru og gæði gróðurhúsajarðarberja að vetri. Final report, Rit LbhÍ nr. 63.
VAN DELM T, MELIS P, STOFFELS K, VANDERBRUGGEN R, BAETS W, 2016: Advancing the strawberry season in Belgian glasshouses with supplemental assimilation lighting. Acta Hortic. 1134, 147-154.
VERHEUL M, SØNSTEBY A, GRIMSTAD S, 2006: Interactions of photoperiod, temperature, duration of short-day treatment and plant age on flowering of Fragaria x ananasa Duch. cv. Korona. Sci. Hortic. 107, 164-170.
VERHEUL M, SØNSTEBY A, GRIMSTAD S, 2007: Influences of day and night temperatures on flowering of Fragaria x ananassa Duch., cvs. Korona and Elsanta, at different photoperiods. Sci. Hortic. 112, 200-206.
59
150 W/m² 100 W/m²
Chamber for the first 4 weeks Emails/ phone calls with advisors Date tasks observations / problems tasks observations / problems tasks
21.ágú plantsarrivedat Reykir
removingbadleaves, plantingstrawberries
Paraat
Paraat
17 8 APPENDIX
22.ágú 23.ágú 24.ágú
25.ágú 26.ágú 27.ágú 28.ágú
29.ágú 30.ágú 31.ágú 1.sep 2.sep 3.sep 4.sep 5.sep 6.sep 7.sep
8.sep 9.sep 10.sep 11.sep 12.sep 60
150 W/m²
100 W/m²
Date tasks observations / problems tasks observations / problems tasks
Chamber for the first 4 weeks Emails/ phone calls with advisors
13.sep 14.sep 15.sep 16.sep 17.sep planting planting 18.sep 19.sep 20.sep 21.sep measurements measurements 22.sep newhives newhivesdead 23.sep 24.sep Loker Loker 25.sep 26.sep 27.sep 28.sep measurements manyrunners measurements
29.sep newhives newhives
30.sep
1.okt Loker Loker 2.okt 3.okt 4.okt
5.okt measurements measurements
6.okt Aphidiuservi Aphidiuservi 7.okt
manyrunners,fruits seemtobebigger thaninchamber5
18
61
150 W/m²
100 W/m²
Date tasks observations / problems tasks observations / problems tasks
8.okt Loker Loker
9.okt firstcolouringfruit, manyfruitswhite
10.okt
11.okt
12.okt measurements morefruitscolouring measurements fruitscolouring
13.okt
14.okt Loker Loker
15.okt firstharvest 16.okt 17.okt 18.okt
19.okt harvest aphidshaveincreased, hardtopickberries harvest aphidsincreased, 2bulbsnotworking 20.okt 21.okt 22.okt harvest,Loker harvest,Loker 23.okt 24.okt 25.okt
26.okt harvest harvest 27.okt
Oriuslaevigatus, Aphidiuscolemani, Aphidiuservi
Oriuslaevigatus, Aphidiuscolemani, Aphidiuservi
29.okt Loker Loker 30.okt
Chamber for the first 4 weeks Emails/ phone calls with advisors
19
28.okt
62
150 W/m²
100 W/m²
Date tasks observations / problems tasks observations / problems tasks
Chamber for the first 4 weeks Emails/ phone calls with advisors
31.okt
1.nóv
2.nóv harvest harvest
3.nóv
4.nóv
5.nóv Loker,harvest Loker,harvest
6.nóv
harvest harvest
harvest harvest
harvest harvest
harvest harvest
lastharvest lastharvest
20
7.nóv 8.nóv 9.nóv
10.nóv 11.nóv 12.nóv
13.nóv 14.nóv 15.nóv 16.nóv
17.nóv 18.nóv 19.nóv
20.nóv 21.nóv 22.nóv 23.nóv
24.nóv 25.nóv 26.nóv 63
150 W/m²
100 W/m²
Date tasks observations / problems tasks observations / problems tasks
Chamber for the first 4 weeks Emails/ phone calls with advisors
1.jan 2.jan 3.jan 4.jan
5.jan plantsarrivedatReykir plantsarrivedatReykir
6.jan 7.jan planting planting 8.jan 9.jan 10.jan 11.jan 12.jan Paraat Paraat 13.jan 14.jan 15.jan 16.jan 17.jan 18.jan changingbadpots changingbadpots 19.jan 20.jan 21.jan 22.jan Paraat Paraat 23.jan 24.jan 25.jan changingbadpots, decision:plantingnew Elsantastartsto flower changingbadpots, decision:plantingnew Elsantastartsto flower 26.jan
21
64
150 W/m²
100 W/m²
Date tasks observations / problems tasks observations / problems tasks
Chamber for the first 4 weeks Emails/ phone calls with advisors
27.jan halfofnewplants arrivedatReykir
28.jan
29.jan 30.jan 31.jan
planting,2waterings perdayfor3min, 16°Cday,10°Cnight
halfofnewplants arrivedatReykir
planting,2waterings perdayfor3min, 16°Cday,10°Cnight
1.feb newleafesdeveloped
newleafes developed 2.feb 3.feb 4.feb 5.feb Paraat Paraat 6.feb 7.feb 8.feb
equalplants,2 Sonataplantsstarts toflower 9.feb 10.feb 11.feb soilcheckedwith moistermeter soilcheckedwith moistermeter
13.feb 14.feb
equalplants,1Sonata plantstartstoflower
22
12.feb
65
150 W/m²
100 W/m²
Date tasks observations / problems tasks observations / problems tasks
Chamber for the first 4 weeks Emails/ phone calls with advisors
15.feb 1wateringfor3min
plantshavenot developedmuchsince lastMonday,some wet,othersdry
1wateringfor3min
16.feb 17.feb 18.feb 19.feb 20.feb 2wateringsfor3min 1wateringfor3min 21.feb
22.feb 2hoursbetween waterings,wateringfor 3min
plantshavedeveloped muchmoresincelast Monday
2hoursbetween waterings,watering for3min
23.feb 24.feb 25.feb Loker Loker 26.feb 27.feb 28.feb 29.feb
plantshavenot developedmuchsince lastMonday,some wet,othersdry
plantshavedeveloped muchmoresincelast Monday
1.mar
potswithphytophtora changedtotheshelter bed,newhives,Orius laevigatus,Aphiscout
firstplantswith Phytophtora,first flowersopen,roots withgraymold (becauseoftoomuch watering?)
potswithphytophtora changedtotheshelter bed,newhives,Orius laevigatus,Aphiscout
firstplantswith Phytophtora(lessthan inchamber5),first flowersopen,roots withgraymold (becauseoftoomuch watering?)
23
66
150 W/m²
100 W/m²
Date tasks observations / problems tasks observations / problems tasks
2.mar
3.mar Loker Loker
4.mar 5.mar
6.mar 7.mar
potswithphytophtora changedtotheshelter bed,measurements
8.mar 1,5hbetween wateringsinElsanta, takingleaves
hiveopen,not possibletoclose (overpollination?)
potswithphytophtora changedtotheshelter bed,measurements
1,5hbetween wateringsinElsanta, takingleaves
9.mar Loker Loker 10.mar 11.mar 12.mar 13.mar
someflowersof Elsantaopen,but noneofSonata
Chamber for the first 4 weeks Emails/ phone calls with advisors
14.mar
measurements, changingexperimental pots,phytopthora plantsremoved
aphids,nearlyall flowersfromSonata overpollinated?
measurements, changingexperimental pots,phytopthora plantsremoved
15.mar 16.mar 17.mar Loker Loker 18.mar 19.mar 20.mar
24
67
150 W/m²
100 W/m²
Date tasks observations / problems tasks observations / problems tasks
Chamber for the first 4 weeks Emails/ phone calls with advisors
21.mar
measurements, phytopthoraplants removed,clusterwork
22.mar Oriuslaevigatus, Aphiscout
plantshavemuch developedsincelast week,beescanget out,buthiveisclosed
measurements, phytopthoraplants removed,
Oriuslaevigatus, Aphiscout
23.mar Loker Loker,clusterwork 24.mar 25.mar 26.mar 27.mar 28.mar 29.mar measurements powderymildew measurements 30.mar deleafing
31.mar Loker,clusterwork
1.apr changingfertilizer, clusterwork
2.apr
3.apr
Loker,deleafing, clusterwork
plantshavemuch developedsincelast week
4.apr
measurements, wateringincreasedin Elsantato1hbetween waterings
5.apr sprayedwithFlorina profformildew
6.apr
powderymildew increased,firstfruits red measurements
1hbetweenwaterings
25
68
150 W/m²
100 W/m²
Date tasks observations / problems tasks observations / problems tasks
7.apr clusterwork
8.apr clusterwork
9.apr
10.apr
11.apr measurements,first harvest powderymildew increased measurements,first harvest(onlyElsanta) powderymildew increased
12.apr
13.apr
Potassiumbicarbonat (20gin10l)sprayed againstmildew
14.apr harvest,Loker,0,5h betweenwaterings
15.apr
16.apr
17.apr
harvest,Loker,0,5h betweenwaterings
Potassiumbicarbonat (20gin10l)sprayed againstmildew
18.apr measurements,harvest measurements
19.apr Florinaprof,harvest
20.apr
21.apr harvest harvest
22.apr
23.apr sprayedwithSavona againstmildew sprayedwithSavona againstmildew
24.apr
25.apr harvest
Chamber for the first 4 weeks Emails/ phone calls with advisors
information aboutmildew
26
69
150 W/m²
100 W/m²
Date tasks observations / problems tasks observations / problems tasks
Chamber for the first 4 weeks Emails/ phone calls with advisors
26.apr Loker,measurements
Loker,measurements, harvest
27.apr removingleaves removingleaves
28.apr harvest harvest
29.apr
30.apr pHtoolow,changed intoammoniumfree pHtoolow,changed intoammoniumfree
1.maí
2.maí harvest harvest
3.maí measurements measurements
4.maí removingleaves removingleaves
5.maí harvest,Savona harvest,Savona
6.maí
7.maí
8.maí
9.maí harvest harvest
10.maí measurements measurements
11.maí removingleaves removingleaves
12.maí harvest,Savona spidermite harvest,Savona
14.maí
harvest harvest
18.maí measurements measurements
19.maí harvest E.C.1,1 harvest E.C.1,1
27
13.maí
15.maí 16.maí 17.maí
70
150 W/m²
100 W/m²
Date tasks observations / problems tasks observations / problems tasks
Chamber for the first 4 weeks Emails/ phone calls with advisors
20.maí 21.maí 22.maí 23.maí harvest harvest 24.maí 25.maí 26.maí lastharvestinthis chamber harvest 27.maí 28.maí 29.maí lastharvest
28
71


