20 minute read
Table of Figures


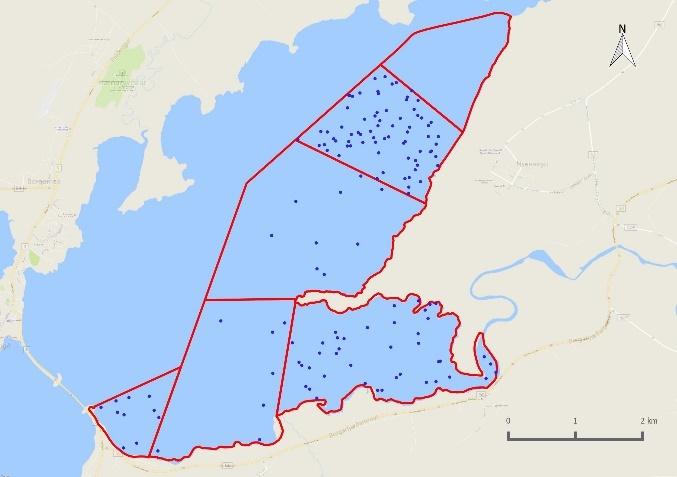
Figure 2-1. The study area in Borgarfjörður covering the estuarine part of the Andakíll Ramsar site. The subsite boundaries are show as red lines and vantage points used as green dots. The dashed black line shows the boundary of the Andakíll Ramsar site..........................................................................................................17 Figure 3-1. Number of waterbird and seabird species recorded each month during estuarine surveys in the
Andakíll Ramsar site between 12th March and 25th October 2017..............................................................22
Figure 3-2. Total number of waterbirds and seabirds recorded during weekly low tide and rising tide estuarine surveys in the Andakíll Ramsar site between 12th March and 25th October 2017. No surveys were conducted during weeks 33 and 34.............................................................................................................22 Figure 3-3. Waterbird and seabird density in each of the six subsites during weekly low tide and rising tide estuarine surveys in the Andakíll Ramsar site between 12th March and 25th October, 2017. See Figure 2-1 for subsite locations and boundaries...........................................................................................................24
Figure 3-4. Total number of bird-records in six subsites in the estuarine habitat of the Andakíll Ramsar site recorded in weekly low tide and rising tide estuarine surveys between 12th March and 25th October, 2017. .....................................................................................................................................................................24
Figure 3-5. The proportion of a) wildfowl and allies b) waders and c) seabirds recorded in four habitat zones during low tide and rising tide estuarine surveys in the Andakíll Ramsar site between 12th March and 25th
October 2017...............................................................................................................................................26
Figure 3-6. Proportion of encounters of a) wildfowl and allies b) waders and c) seabirds during low tide and rising tide estuarine surveys in the Andakíll Ramsar site between 12th March and 25th October 2017 according to their location in four habitat zones. .......................................................................................27 Figure 3-7. Location of roost sites (orange) and twelve main roosts (red) recorded during weekly rising tide estuarine surveys in the Andakíll Ramsar site in spring (12th March and 7th June 2017). ...........................30 Figure 3-8. Location of roost sites (orange) and twelve main roosts (blue) recorded during weekly rising tide estuarine surveys in the Andakíll Ramsar site in autumn (12th June and 25th October 2017).....................30 Figure 3-9. Frequency of disturbance sources recorded during weekly low tide and rising tide estuarine surveys in the Andakíll Ramsar site between 12th March and 25th October 2017....................................................32
Figure 3-10. Number of wildfowl and allies recorded during weekly low tide and rising tide estuarine surveys in the Andakíll Ramsar site between 12th March and 25th October 2017........................................................33
Figure 3-11. Number of Anser anser recorded during weekly low tide and rising tide estuarine surveys in the
Andakíll Ramsar site between 12th March and 25th October 2017..............................................................34
Figure 3-12. Relative abundance of Anser anser during weekly (a) low tide and (b) rising tide estuarine surveys in the Andakíll Ramsar site between 12th March and 25th October 2017....................................................35
Figure 3-13. Relative abundance during (a) spring and (b) autumn of Anser anser counted on twice-weekly estuarine surveys in the Andakíll Ramsar site in 2017. ...............................................................................35 Figure 3-14. Proportion of foraging and roosting Anser anser during weekly (a) low tide and (b) rising tide estuarine surveys in six subsites in the Andakíll Ramsar site between 12th March and 25th October 2017. .....................................................................................................................................................................35
Figure 3-15. Number of Anser albifrons flavirostris recorded during weekly low tide and rising tide estuarine surveys in the Andakíll Ramsar site between 12th March and 25th October 2017.......................................36
Figure 3-16. Relative abundance of Anser albifrons flavirostris during weekly (a) low tide and (b) rising tide estuarine surveys in the Andakíll Ramsar site between 12th March and 25th October 2017.......................37 Figure 3-17. Relative abundance during (a) spring and (b) autumn of Anser albifrons flavirostris counted on twice-weekly estuarine surveys in the Andakíll Ramsar site in 2017. .........................................................37 Figure 3-18. Proportion of foraging and roosting Anser albifrons flavirostris during weekly (a) low tide and (b) rising tide estuarine surveys in six subsites in the Andakíll Ramsar site between 12th March and 25th
October 2017...............................................................................................................................................37
Figure 3-19. Number of Cygnus cygnus recorded during weekly low tide and rising tide estuarine surveys in the Andakíll Ramsar site between 12th March and 25th October 2017..............................................................38
Figure 3-20. Relative abundance of Cygnus cygnus during weekly (a) low tide and (b) rising tide estuarine surveys in the Andakíll Ramsar site between 12th March and 25th October 2017.......................................38 Figure 3-21. Relative abundance during (a) spring and (b) autumn of Cygnus Cygnus counted on twice-weekly estuarine surveys in the Andakíll Ramsar site in 2017. ...............................................................................39 Figure 3-22. Proportion of foraging and roosting Cygnus cygnus during weekly (a) low tide and (b) rising tide estuarine surveys in six subsites in the Andakíll Ramsar site between 12th March and 25th October 2017. .....................................................................................................................................................................39
Figure 3-23. Number of Tadorna tadorna recorded during weekly low tide and rising tide estuarine surveys in the Andakíll Ramsar site between 12th March and 25th October 2017........................................................40
Figure 3-24. Relative abundance of Tadorna tadorna during weekly (a) low tide and (b) rising tide estuarine surveys in the Andakíll Ramsar site between 12th March and 25th October 2017.......................................41 Figure 3-25. Relative abundance during (a) spring and (b) autumn of Tadorna tadorna counted on twice-weekly estuarine surveys in the Andakíll Ramsar site in 2017. ...............................................................................41 Figure 3-26. Proportion of foraging and roosting Tadorna tadorna during weekly (a) low tide and (b) rising tide estuarine surveys in six subsites in the Andakíll Ramsar site between 12th March and 25th October 2017. .....................................................................................................................................................................41
Figure 3-27. Number of Mareca penelope recorded during weekly low tide and rising tide estuarine surveys in the Andakíll Ramsar site between 12th March and 25th October 2017........................................................42
Figure 3-28. Relative abundance of Mareca penelope during weekly (a) low tide and (b) rising tide estuarine surveys in the Andakíll Ramsar site between 12th March and 25th October 2017.......................................42 Figure 3-29. Relative abundance during (a) spring and (b) autumn of Mareca penelope counted on twiceweekly estuarine surveys in the Andakíll Ramsar site in 2017. ...................................................................43 Figure 3-30. Proportion of foraging and roosting Mareca penelope during weekly (a) low tide and (b) rising tide estuarine surveys in six subsites in the Andakíll Ramsar site between 12th March and 25th October 2017. .....................................................................................................................................................................43
Figure 3-31. Number of Anas platyrhynchos recorded during weekly low tide and rising tide estuarine surveys in the Andakíll Ramsar site between 12th March and 25th October 2017....................................................44
Figure 3-32. Relative abundance of Anas platyrhynchos during weekly (a) low tide and (b) rising tide estuarine surveys in the Andakíll Ramsar site between 12th March and 25th October 2017.......................................44 Figure 3-33. Relative abundance during (a) spring and (b) autumn of Anas platyrhynchos counted on twiceweekly estuarine surveys in the Andakíll Ramsar site in 2017. ...................................................................45
Figure 3-34. Proportion of foraging and roosting Anas platyrhynchos during weekly (a) low tide and (b) rising tide estuarine surveys in six subsites in the Andakíll Ramsar site between 12th March and 25th October 2017.............................................................................................................................................................45
Figure 3-35. Number of Anas crecca recorded during weekly low tide and rising tide estuarine surveys in the
Andakíll Ramsar site between 12th March and 25th October 2017..............................................................46
Figure 3-36. Relative abundance of Anas crecca during weekly (a) low tide and (b) rising tide estuarine surveys in the Andakíll Ramsar site between 12th March and 25th October 2017....................................................46
Figure 3-37. Relative abundance during (a) spring and (b) autumn of Anas crecca counted on twice-weekly estuarine surveys in the Andakíll Ramsar site in 2017. ...............................................................................47 Figure 3-38.Proportion of foraging and roosting Anas crecca during weekly (a) low tide and (b) rising tide estuarine surveys in six subsites in the Andakíll Ramsar site between 12th March and 25th October 2017. .....................................................................................................................................................................47
Figure 3-39. Number of Aythya marila recorded during weekly low tide and rising tide estuarine surveys in the Andakíll Ramsar site between 12th March and 25th October 2017..............................................................48
Figure 3-40. Relative abundance of Aythya marila during weekly (a) low tide and (b) rising tide estuarine surveys in the Andakíll Ramsar site between 12th March and 25th October 2017.......................................48 Figure 3-41. Relative abundance during (a) spring and (b) autumn of Aythya marila counted on twice-weekly estuarine surveys in the Andakíll Ramsar site in 2017. ...............................................................................49 Figure 3-42. Number of Somateria mollissima recorded during weekly low tide and rising tide estuarine surveys in the Andakíll Ramsar site between 12th March and 25th October 2017.......................................49 Figure 3-43. Relative abundance of Somateria mollissima during weekly (a) low tide and (b) rising tide estuarine surveys in the Andakíll Ramsar site between 12th March and 25th October 2017.......................50 Figure 3-44. Number of Clangula hyemalis recorded during weekly low tide and rising tide estuarine surveys in the Andakíll Ramsar site between 12th March and 25th October 2017........................................................50
Figure 3-45. Relative abundance of Clangula hyemalis during weekly (a) low tide and (b) rising tide estuarine surveys in the Andakíll Ramsar site between 12th March and 25th October 2017.......................................51 Figure 3-46. Proportion of foraging and roosting Clangula hyemalis during weekly (a) low tide and (b) rising tide estuarine surveys in six subsites in the Andakíll Ramsar site between 12th March and 25th October 2017.............................................................................................................................................................51
Figure 3-47. Number of Mergus merganser recorded during weekly low tide and rising tide estuarine surveys in the Andakíll Ramsar site between 12th March and 25th October 2017........................................................52
Figure 3-48. Relative abundance of Mergus merganser during weekly (a) low tide and (b) rising tide estuarine surveys in the Andakíll Ramsar site between 12th March and 25th October 2017.......................................52 Figure 3-49. Proportion of foraging and roosting Mergus merganser during weekly (a) low tide and (b) rising tide estuarine surveys in six subsites in the Andakíll Ramsar site between 12th March and 25th October 2017.............................................................................................................................................................53
Figure 3-50. Number of Mergus serrator recorded during weekly low tide and rising tide estuarine surveys in the Andakíll Ramsar site between 12th March and 25th October 2017........................................................53
Figure 3-51. Relative abundance of Mergus serrator during weekly (a) low tide and (b) rising tide estuarine surveys in the Andakíll Ramsar site between 12th March and 25th October 2017.......................................54
Figure 3-52. Relative abundance during (a) spring and (b) autumn of Mergus serrator counted on twice-weekly estuarine surveys in the Andakíll Ramsar site in 2017. ...............................................................................54 Figure 3-53. Proportion of foraging and roosting Mergus serrator during weekly (a) low tide and (b) rising tide estuarine surveys in six subsites in the Andakíll Ramsar site between 12th March and 25th October 2017. .....................................................................................................................................................................54
Figure 3-54. Number of Gavia stellata recorded during weekly low tide and rising tide estuarine surveys in the
Andakíll Ramsar site between 12th March and 25th October 2017..............................................................55
Figure 3-55. Relative abundance of Gavia stellata during weekly (a) low tide and (b) rising tide estuarine surveys in the Andakíll Ramsar site between 12th March and 25th October 2017.......................................55 Figure 3-56. Proportion of foraging and roosting Gavia stellata during weekly (a) low tide and (b) rising tide estuarine surveys in six subsites in the Andakíll Ramsar site between 12th March and 25th October 2017. .....................................................................................................................................................................56
Figure 3-57. Number of Gavia immer recorded during weekly low tide and rising tide estuarine surveys in the
Andakíll Ramsar site between 12th March and 25th October 2017..............................................................57
Figure 3-58. Relative abundance of Gavia immer during weekly (a) low tide and (b) rising tide estuarine surveys in the Andakíll Ramsar site between 12th March and 25th October 2017....................................................57
Figure 3-59. Number of Phalacrocorax carbo recorded during weekly low tide and rising tide estuarine surveys in the Andakíll Ramsar site between 12th March and 25th October 2017....................................................58
Figure 3-60. Relative abundance of Phalacrocorax carbo during weekly (a) low tide and (b) rising tide estuarine surveys in the Andakíll Ramsar site between 12th March and 25th October 2017.......................................58 Figure 3-61. Number of waders recorded during weekly low tide and rising tide estuarine surveys in the
Andakíll Ramsar site between 12th March and 25th October 2017..............................................................59
Figure 3-62. Number of Haematopus ostralegus recorded during weekly low tide and rising tide estuarine surveys in the Andakíll Ramsar site between 12th March and 25th October 2017.......................................60 Figure 3-63. Relative abundance of Haematopus ostralegus during weekly (a) low tide and (b) rising tide estuarine surveys in the Andakíll Ramsar site between 12th March and 25th October 2017.......................60 Figure 3-64. Relative abundance during (a) spring and (b) autumn of Haematopus ostralegus counted on twiceweekly estuarine surveys in the Andakíll Ramsar site in 2017. ...................................................................61 Figure 3-65. Proportion of foraging and roosting Haematopus ostralegus during weekly (a) low tide and (b) rising tide estuarine surveys in six subsites in the Andakíll Ramsar site between 12th March and 25th
October 2017...............................................................................................................................................61
Figure 3-66.Number of Pluvialis apricaria recorded during weekly low tide and rising tide estuarine surveys in the Andakíll Ramsar site between 12th March and 25th October 2017........................................................62
Figure 3-67. Relative abundance of Pluvialis apricaria during weekly (a) low tide and (b) rising tide estuarine surveys in the Andakíll Ramsar site between 12th March and 25th October 2017.......................................62 Figure 3-68. Relative abundance during (a) spring and (b) autumn of Pluvialis apricaria counted on twiceweekly estuarine surveys in the Andakíll Ramsar site in 2017. ...................................................................63 Figure 3-69. Proportion of foraging and roosting Pluvialis apricaria during weekly (a) low tide and (b) rising tide estuarine surveys in six subsites in the Andakíll Ramsar site between 12th March and 25th October 2017. .....................................................................................................................................................................63
Figure 3-70. Number of Charadrius hiaticula recorded during weekly low tide and rising tide estuarine surveys in the Andakíll Ramsar site between 12th March and 25th October 2017....................................................64
Figure 3-71. Relative abundance of Charadrius hiaticula during weekly (a) low tide and (b) rising tide estuarine surveys in the Andakíll Ramsar site between 12th March and 25th October 2017.......................................64 Figure 3-72. Relative abundance during (a) spring and (b) autumn of Charadrius hiaticula counted on twiceweekly estuarine surveys in the Andakíll Ramsar site in 2017. ...................................................................65 Figure 3-73. Proportion of foraging and roosting Charadrius hiaticula during weekly (a) low tide and (b) rising tide estuarine surveys in six subsites in the Andakíll Ramsar site between 12th March and 25th October 2017.............................................................................................................................................................65
Figure 3-74.Number of Limosa limosa recorded during weekly low tide and rising tide estuarine surveys in the
Andakíll Ramsar site between 12th March and 25th October 2017..............................................................66
Figure 3-75. Relative abundance of Limosa limosa during weekly (a) low tide and (b) rising tide estuarine surveys in the Andakíll Ramsar site between 12th March and 25th October 2017.......................................66 Figure 3-76. Relative abundance during (a) spring and (b) autumn of Limosa limosa counted on twice-weekly estuarine surveys in the Andakíll Ramsar site in 2017. ...............................................................................67 Figure 3-77. Proportion of foraging and roosting Limosa limosa during weekly (a) low tide and (b) rising tide estuarine surveys in six subsites in the Andakíll Ramsar site between 12th March and 25th October 2017. .....................................................................................................................................................................67
Figure 3-78. Number of Numenius phaeopus recorded during weekly low tide and rising tide estuarine surveys in the Andakíll Ramsar site between 12th March and 25th October 2017....................................................68
Figure 3-79.Relative abundance of Numenius phaeopus during weekly (a) low tide and (b) rising tide estuarine surveys in the Andakíll Ramsar site between 12th March and 25th October 2017.......................................68 Figure 3-80. Proportion of foraging and roosting Numenius phaeopus during weekly (a) low tide and (b) rising tide estuarine surveys in six subsites in the Andakíll Ramsar site between 12th March and 25th October 2017.............................................................................................................................................................69
Figure 3-81.Number of Tringa totanus recorded during weekly low tide and rising tide estuarine surveys in the Andakíll Ramsar site between 12th March and 25th October 2017..............................................................70
Figure 3-82. Relative abundance of Tringa totanus during weekly (a) low tide and (b) rising tide estuarine surveys in the Andakíll Ramsar site between 12th March and 25th October 2017.......................................71 Figure 3-83. Relative abundance during (a) spring and (b) autumn of Tringa totanus counted on twice-weekly estuarine surveys in the Andakíll Ramsar site in 2017. ...............................................................................71 Figure 3-84. Proportion of foraging and roosting Tringa totanus during weekly (a) low tide and (b) rising tide estuarine surveys in six subsites in the Andakíll Ramsar site between 12th March and 25th October 2017. .....................................................................................................................................................................71
Figure 3-85.Number of Arenaria interpres recorded during weekly low tide and rising tide estuarine surveys in the Andakíll Ramsar site between 12th March and 25th October 2017........................................................72
Figure 3-86. Relative abundance of Arenaria interpres during weekly (a) low tide and (b) rising tide estuarine surveys in the Andakíll Ramsar site between 12th March and 25th October 2017.......................................73 Figure 3-87. Relative abundance during (a) spring and (b) autumn of Arenaria interpres counted on twiceweekly estuarine surveys in the Andakíll Ramsar site in 2017. ...................................................................73
Figure 3-88. Proportion of foraging and roosting Arenaria interpres during weekly (a) low tide and (b) rising tide estuarine surveys in six subsites in the Andakíll Ramsar site between 12th March and 25th October 2017.............................................................................................................................................................73
Figure 3-89.Number of Calidris canutus recorded during weekly low tide and rising tide estuarine surveys in the Andakíll Ramsar site between 12th March and 25th October 2017........................................................74
Figure 3-90. Relative abundance of Calidris canutus during weekly (a) low tide and (b) rising tide estuarine surveys in the Andakíll Ramsar site between 12th March and 25th October 2017.......................................74 Figure 3-91. Number of Calidris alpina recorded during weekly low tide and rising tide estuarine surveys in the
Andakíll Ramsar site between 12th March and 25th October 2017..............................................................75
Figure 3-92. Relative abundance of Calidris alpina during weekly (a) low tide and (b) rising tide estuarine surveys in the Andakíll Ramsar site between 12th March and 25th October 2017.......................................75 Figure 3-93.Relative abundance during (a) spring and (b) autumn of Calidris alpina counted on twice-weekly estuarine surveys in the Andakíll Ramsar site in 2017. ...............................................................................76 Figure 3-94. Proportion of foraging and roosting Calidris alpina during weekly (a) low tide and (b) rising tide estuarine surveys in six subsites in the Andakíll Ramsar site between 12th March and 25th October 2017. .....................................................................................................................................................................76
Figure 3-95. Number of Calidris maritima recorded during weekly low tide and rising tide estuarine surveys in the Andakíll Ramsar site between 12th March and 25th October 2017........................................................77
Figure 3-96. Relative abundance of Calidris maritima during weekly (a) low tide and (b) rising tide estuarine surveys in the Andakíll Ramsar site between 12th March and 25th October 2017.......................................77 Figure 3-97. Relative abundance during (a) spring and (b) autumn of Calidris maritima counted on twiceweekly estuarine surveys in the Andakíll Ramsar site in 2017. ...................................................................78 Figure 3-98. Proportion of foraging and roosting Calidris maritima during weekly (a) low tide and (b) rising tide estuarine surveys in six subsites in the Andakíll Ramsar site between 12th March and 25th October 2017. .....................................................................................................................................................................78
Figure 3-99. Number of Phalaropus lobatus recorded during weekly low tide and rising tide estuarine surveys in the Andakíll Ramsar site between 12th March and 25th October 2017....................................................79
Figure 3-100. Number of seabirds recorded during weekly low tide and rising tide estuarine surveys in the
Andakíll Ramsar site between 12th March and 25th October 2017..............................................................80
Figure 3-101. Number of Fulmarus glacialis recorded during weekly low tide and rising tide estuarine surveys in the Andakíll Ramsar site between 12th March and 25th October 2017....................................................81
Figure 3-102. Relative abundance of Fulmarus glacialis during weekly (a) low tide and (b) rising tide estuarine surveys in the Andakíll Ramsar site between 12th March and 25th October 2017.......................................81 Figure 3-103. Number of Chroicocephalus ridibundus recorded during weekly low tide and rising tide estuarine surveys in the Andakíll Ramsar site between 12th March and 25th October 2017.......................................82 Figure 3-104. Relative abundance of Chroicocephalus ridibundus during weekly (a) low tide and (b) rising tide estuarine surveys in the Andakíll Ramsar site between 12th March and 25th October 2017.......................82 Figure 3-105. Relative abundance during (a) spring and (b) autumn of Chroicocephalus ridibundus counted on twice-weekly estuarine surveys in the Andakíll Ramsar site in 2017. .........................................................83
Figure 3-106. Proportion of foraging and roosting Chroicocephalus ridibundus during weekly (a) low tide and (b) rising tide estuarine surveys in six subsites in the Andakíll Ramsar site between 12th March and 25th
October 2017...............................................................................................................................................83
Figure 3-107. Number of Larus canus recorded during weekly low tide and rising tide estuarine surveys in the
Andakíll Ramsar site between 12th March and 25th October 2017..............................................................84
Figure 3-108. Relative abundance of Larus canus during weekly (a) low tide and (b) rising tide estuarine surveys in the Andakíll Ramsar site between 12th March and 25th October 2017....................................................84
Figure 3-109. Relative abundance during (a) spring and (b) autumn of Larus canus counted on twice-weekly estuarine surveys in the Andakíll Ramsar site in 2017. ...............................................................................85 Figure 3-110. Proportion of foraging and roosting Larus canus during weekly (a) low tide and (b) rising tide estuarine surveys in six subsites in the Andakíll Ramsar site between 12th March and 25th October 2017. .....................................................................................................................................................................85
Figure 3-111. Number of Larus marinus recorded during weekly low tide and rising tide estuarine surveys in the Andakíll Ramsar site between 12th March and 25th October 2017........................................................86
Figure 3-112. Relative abundance of Larus marinus during weekly (a) low tide and (b) rising tide estuarine surveys in the Andakíll Ramsar site between 12th March and 25th October 2017.......................................86 Figure 3-113. Relative abundance during (a) spring and (b) autumn of Larus marinus counted on twice-weekly estuarine surveys in the Andakíll Ramsar site in 2017. ...............................................................................87 Figure 3-114. Proportion of foraging and roosting Larus marinus during weekly (a) low tide and (b) rising tide estuarine surveys in six subsites in the Andakíll Ramsar site between 12th March and 25th October 2017. .....................................................................................................................................................................87
Figure 3-115. Number of Larus hyperboreus recorded during weekly low tide and rising tide estuarine surveys in the Andakíll Ramsar site between 12th March and 25th October 2017....................................................88
Figure 3-116. Relative abundance of Larus hyperboreus during weekly (a) low tide and (b) rising tide estuarine surveys in the Andakíll Ramsar site between 12th March and 25th October 2017.......................................88 Figure 3-117. Relative abundance of Larus hyperboreus during autumn (6th September– 25th October), counted on twice-weekly estuarine surveys in the Andakíll Ramsar site in 2017. ....................................................89 Figure 3-118. Proportion of foraging and roosting Larus hyperboreus during weekly (a) low tide and (b) rising tide estuarine surveys in six subsites in the Andakíll Ramsar site between 12th March and 25th October 2017.............................................................................................................................................................89
Figure 3-119. Number of Larus glaucoides recorded during weekly low tide and rising tide estuarine surveys in the Andakíll Ramsar site between 12th March and 25th October 2017........................................................90
Figure 3-120. Relative abundance of Larus glaucoides during weekly (a) low tide and (b) rising tide estuarine surveys in the Andakíll Ramsar site between 12th March and 25th October 2017.......................................90 Figure 3-121. Number of Larus hyperboreus/glaucoides recorded during weekly low tide and rising tide estuarine surveys in the Andakíll Ramsar site between 12th March and 25th October 2017.......................91 Figure 3-122. Relative abundance of Larus hyperboreus/glaucoides during weekly (a) low tide and (b) rising tide estuarine surveys in the Andakíll Ramsar site between 12th March and 25th October 2017. ..............91
Figure 3-123. Proportion of foraging and roosting Larus hyperboreus/glaucoides during weekly (a) low tide and (b) rising tide estuarine surveys in six subsites in the Andakíll Ramsar site between 12th March and 25th
October 2017...............................................................................................................................................92
Figure 3-124. Number of Larus argentatus recorded during weekly low tide and rising tide estuarine surveys in the Andakíll Ramsar site between 12th March and 25th October 2017. ....................................................92
Figure 3-125. Relative abundance of Larus argentatus during weekly (a) low tide and (b) rising tide estuarine surveys in the Andakíll Ramsar site between 12th March and 25th October 2017.......................................93 Figure 3-126. Proportion of foraging and roosting Larus argentatus during weekly (a) low tide and (b) rising tide estuarine surveys in six subsites in the Andakíll Ramsar site between 12th March and 25th October 2017.............................................................................................................................................................93
Figure 3-127. Number of Larus fuscus recorded during weekly low tide and rising tide estuarine surveys in the
Andakíll Ramsar site between 12th March and 25th October 2017..............................................................94
Figure 3-128. Relative abundance of Larus fuscus during weekly (a) low tide and (b) rising tide estuarine surveys in the Andakíll Ramsar site between 12th March and 25th October 2017.......................................95 Figure 3-129. Relative abundance during (a) spring and (b) autumn of Larus fuscus counted on twice-weekly estuarine surveys in the Andakíll Ramsar site in 2017. ...............................................................................95 Figure 3-130. Proportion of foraging and roosting Larus fuscus during weekly (a) low tide and (b) rising tide estuarine surveys in six subsites in the Andakíll Ramsar site between 12th March and 25th October 2017. .....................................................................................................................................................................95
Figure 3-131. Number of Sterna paradisaea recorded during weekly low tide and rising tide estuarine surveys in the Andakíll Ramsar site between 12th March and 25th October 2017....................................................96
Figure 3-132. Relative abundance of Sterna paradisaea during weekly (a) low tide and (b) rising tide estuarine surveys in the Andakíll Ramsar site between 12th March and 25th October 2017.......................................97 Figure 3-133. Relative abundance during (a) spring and (b) autumn of Sterna paradisaea counted on twiceweekly estuarine surveys in the Andakíll Ramsar site in 2017. ...................................................................97 Figure 3-134. Proportion of foraging and roosting Sterna paradisaea during weekly (a) low tide and (b) rising tide estuarine surveys in six subsites in the Andakíll Ramsar site between 12th March and 25th October 2017.............................................................................................................................................................97
Figure 3-135. Number of Stercorarius parasiticus recorded during weekly low tide and rising tide estuarine surveys in the Andakíll Ramsar site between 12th March and 25th October 2017.......................................98 Figure 3-136. Relative abundance of Stercorarius parasiticus during weekly (a) low tide and (b) rising tide estuarine surveys in the Andakíll Ramsar site between 12th March and 25th October 2017.......................98