3 minute read
Common Shelduck


Common Shelduck
Tadorna tadorna Brandönd
Shelduck were present on the estuary during all surveys. Numbers rose during March and there were c. 200 birds present throughout April. Numbers rose again throughout May and June and peaked at 1,368 in the last week of June. Numbers gradually declined throughout August, September and October, and there were 100 birds recorded on the last survey of the season, on 25th October. In 2019, two additional surveys on 12th and 18th October resulted in totals of 1,176 and 1,025 birds, respectively. These counts are unprecedented, both in scale and timing. This disparity in October numbers between 2017 and 2019 suggest considerable interannual differences in migratory behaviour.
While Shelduck were recorded in each of the six subsites during low tide and rising tide surveys, greatest numbers were routinely found in Kistufjörđur (Est 2) and Ásgarđshöfđi (Est 4). There was increased usage of Ásgarđshöfđi (Est 4) in the autumn, compared to the spring. It is not clear whether this expansion (into Ásgarđshöfđi (Est 4)) was driven by new, seasonal availability of food there, increased feeding competition in Kistufjörđur (Est 2), immigration of new birds into the estuary, or other factors. Birds were most often recorded as foraging during low tide surveys and roosting during rising tide surveys, with the exception of Ásgarđshöfđi (Est 4), where birds were more frequently recorded as foraging during rising tide surveys.
The Ramsar site supports the biggest aggregations of Shelduck in Iceland and an estimated 158 breeding pairs (Tierney et al. 2020).
Low-tide Rising-tide
Numebr of individuals 1600 1400 1200 1000 800 600 400 200 0

10 11 12 13 14 15 16 17 18 19 20 21 22 23 24 25 26 27 28 29 30 31 32 33 34 35 36 37 38 39 40 41 42 43 Mar Apr May Jun Jul Aug Sep Oct Week number and month
Figure 3-23. Number of Tadorna tadorna recorded during weekly low tide and rising tide estuarine surveys in the Andakíll Ramsar site between 12th March and 25th October 2017.
(a) Low tide (b) Rising tide
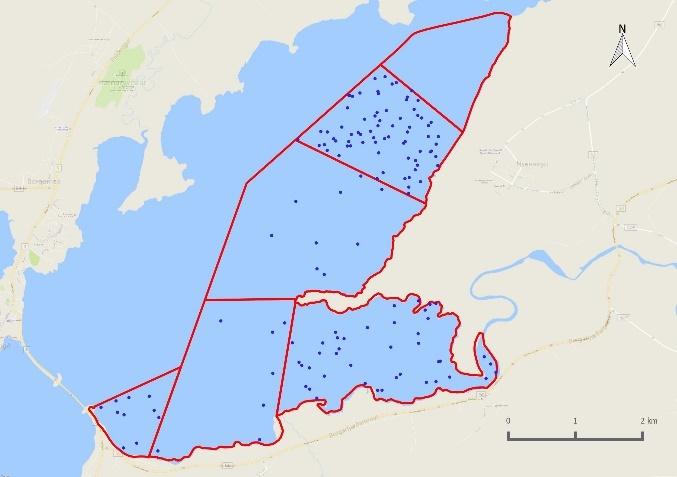
Figure 3-24. Relative abundance of Tadorna tadorna during weekly (a) low tide and (b) rising tide estuarine surveys in the Andakíll Ramsar site between 12th March and 25th October 2017. Dots are randomly positioned within each subsite. While each dot refers to a single bird, it refers to the bird’s presence in that subsite only, and not the bird’s actual location.

Figure 3-25. Relative abundance during (a) spring and (b) autumn of Tadorna tadorna counted on twiceweekly estuarine surveys in the Andakíll Ramsar site in 2017. Spring = 12th March - 7th June; Autumn = 12th June - 25

(a) Spring (b) Autumn

th October. The number of dots in each subsite refers to the total number of bird-records (from weekly low tide and rising tide surveys) in spring and autumn, adjusted for the length of the season, and reflects the species’ abundance in that season, not the specific location of birds. Figure 3-26. Proportion of foraging and roosting Tadorna tadorna during weekly (a) low tide and (b) rising tide estuarine surveys in six subsites in the Andakíll Ramsar site between 12th March and 25th October 2017.

(a) Low tide (b) Rising tide