2 minute read
Ruddy Turnstone


Ruddy Turnstone
Arenaria interpres Tildra
Turnstone was first recorded on 28th March, and the last record was on 9th October. Numbers in spring peaked at 112 birds on 24th April, but there were generally less than 50 birds per survey during April and May. The first record after the breeding season was of five birds on 10th July. Numbers increased from then onwards to peak at 218 on 6th August. Numbers during autumn low tide surveys were generally between 100 and 200. The number of birds recorded on rising tide surveys was generally lower than on low tide surveys, and no large high tide roosts were located, suggesting that at least some of the birds sought high tide refuges outside the Andakíll Ramsar site.
During both low tide and rising tide surveys, Turnstone displayed a preference for the three southernmost subsites: Grjóteyrarklakkur (Est 1), Kistufjörđur (Est 2), and Flæðhöfðasker (Est 6)). The general pattern is that the birds foraged during low tides and roosted during rising tides. Occasionally, c. 50 birds were recorded roosting on the promontory delineating the boundary between Grjóteyrarklakkur (Est 1) and Kistufjörđur (Est 2), but as high tide observations were not conducted, it is not known whether this roost was used throughout the high tide period or if the rising water pushed the birds elsewhere.
Number of individuals 250 200 150 100 50 0 Low-tide Rising-tide

10 11 12 13 14 15 16 17 18 19 20 21 22 23 24 25 26 27 28 29 30 31 32 33 34 35 36 37 38 39 40 41 42 43 Mar Apr May Jun Jul Aug Sep Oct Week number and month
Figure 3-85.Number of Arenaria interpres recorded during weekly low tide and rising tide estuarine surveys in the Andakíll Ramsar site between 12th March and 25th October 2017.
(a) Low tide (b) Rising tide
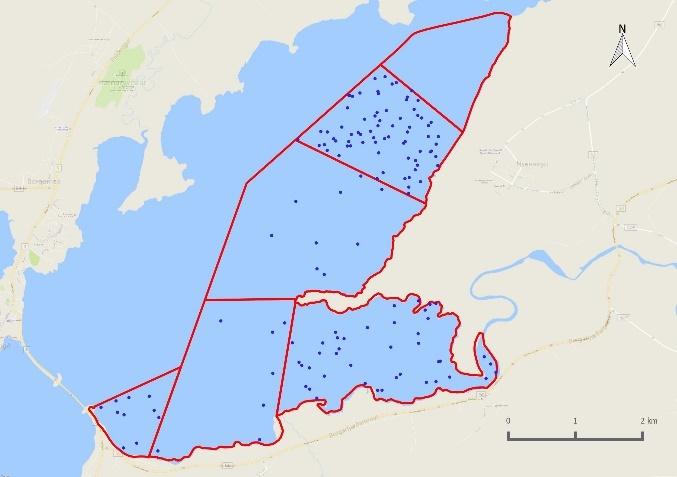
Figure 3-86. Relative abundance of Arenaria interpres during weekly (a) low tide and (b) rising tide estuarine surveys in the Andakíll Ramsar site between 12th March and 25th October 2017. Dots are randomly positioned within each subsite. While each dot refers to a single bird, it refers to the bird’s presence in that subsite only, and not the bird’s actual location.

Figure 3-87. Relative abundance during (a) spring and (b) autumn of Arenaria interpres counted on twiceweekly estuarine surveys in the Andakíll Ramsar site in 2017. Spring = 12th March - 7th June; Autumn = 12

(a) Spring (b) Autumn

th June - 25th
October. The number of dots in each subsite refers to the total number of bird-records (from weekly low tide and rising tide surveys) in spring and autumn, adjusted for the length of the season, and reflects the species’ abundance in that season, not the specific location of birds.
Figure 3-88. Proportion of foraging and roosting Arenaria interpres during weekly (a) low tide and (b) rising tide estuarine surveys in six subsites in the Andakíll Ramsar site between 12th March and 25th October 2017.

(a) Low tide (b) Rising tide