5 minute read
How Variability Within and Between Natural and Synthetic Athletic Fields Impacts Athlete Safety and


How Variability Within and Between Natural and Synthetic Athletic Fields Impacts Athlete Safety and Performance
By Ava Veith Graduate Student, Virginia Tech
Introduction
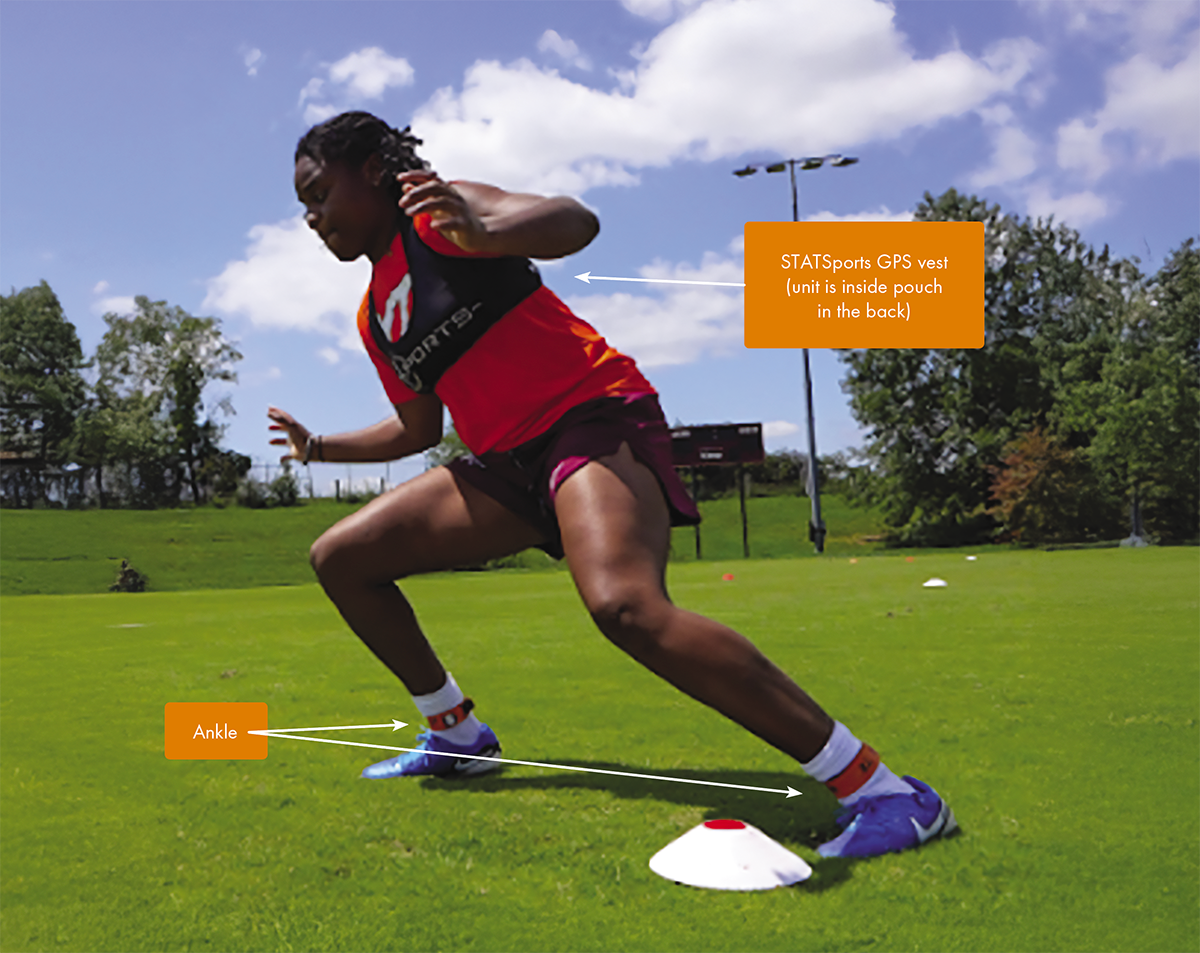
This study assesses how variations among natural and synthetic turf surfaces affect athlete safety and performance. Key metrics such as surface hardness, rotational resistance, soil moisture, thatch depth, and infill depth (synthetic fields) influence athlete-surface interactions and were used in this study to further characterize fields. Additionally, ankle inertial measurement units (IMUs) and STATSports GPS units are wearable technological devices that were used to quantify how varying surfaces affect athletes during performance of specific drills. Surveys captured athletes’ perceptions of the fields before and after performance to understand how they believe surface quality impacts their performance.
Athletic Fields Tested
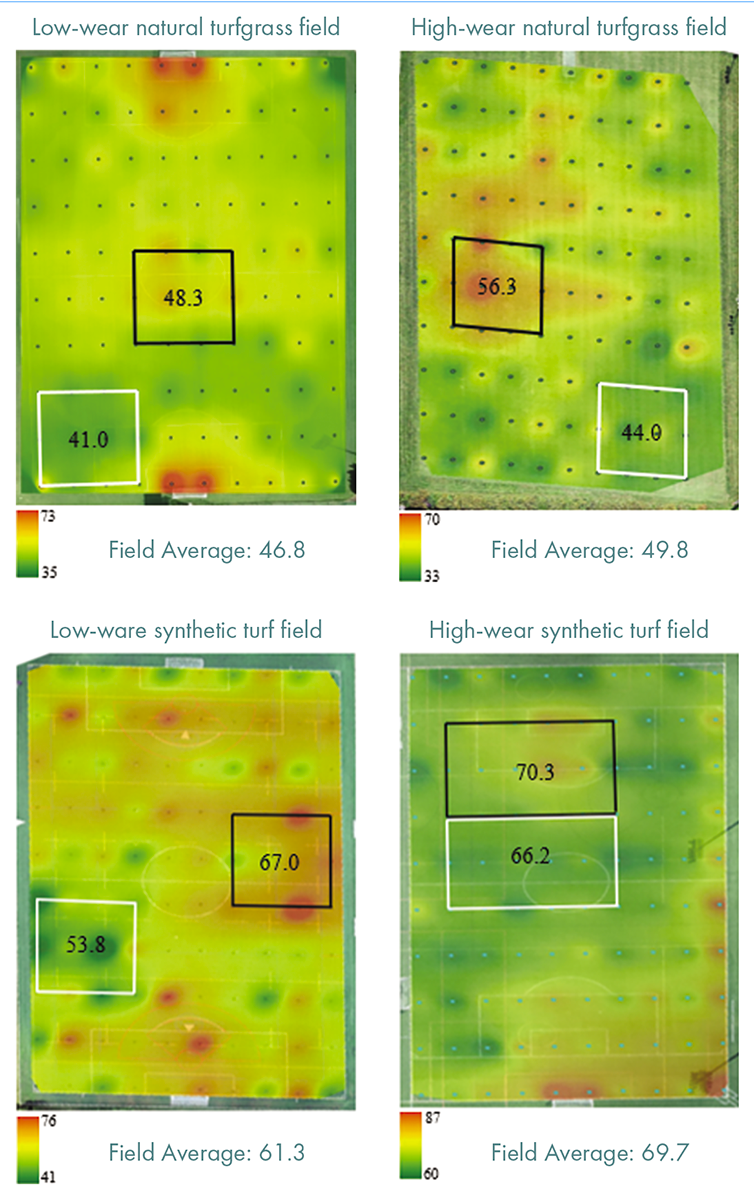
In August 2024, a study was conducted on four athletic fields at Virginia Tech in Blacksburg, Virginia. Two fields were natural turfgrass (bermudagrass), categorized as ‘low wear’ or ‘high wear’ based on traffic frequency. The other two were synthetic, with one field installed early 2015 and heavily used (high wear), and the other installed in summer 2023 with minimal traffic (low wear) (Figure 1).
Preliminary Data Collection
Before involving live athletes, surface hardness was measured across all four fields using a Clegg hammer, collecting 100 measurements per field. These data were analyzed with ArcGIS Pro to create surface hardness heatmaps. These heatmaps identified areas within each field with varying hardness levels, aiding in the selection of specific locations for drills with participating athletes. One location was slightly softer when compared to the rest of the field, while the other slightly harder (Figure 1). Additionally, 20 rotational resistance, thatch depth, soil moisture, and infill depth measurements in both softer and harder areas were taken to further understand the relationship between surface conditions and athlete performance.
Athlete Participation
14 female athletes participated in the study, wearing standardized cleats and equipped with ankle IMUs and STATSports GPS devices to quantify their movements during drills (Figure 2). The athletes performed three drills—drop landing, T-drill, and modified acceleration-deceleration—designed to simulate common athletic movements. Each drill was repeated three times in both the harder and softer areas identified within the fields. Pre-performance surveys evaluated athletes’ perceptions of the fields, and post-performance surveys assessed their perceived quality of the surfaces and impact on performance.
Results
As shown in figure 1, both natural turfgrass fields exhibited lower surface hardness compared to the synthetic fields. Additionally, high wear fields were harder than low wear fields for both natural and synthetic fields.
Metrics from the ankle IMU’s include average intensity and bone stimulus. Average intensity is defined as the average impact intensity for each step propagated into the left or right leg, while bone stimulus is an estimate of the mechanical stimulus that would cause the bone to respond and remodel (iMeasureU). Our data suggests that athletes showed significantly higher average intensity and bone stimulus on synthetic fields versus natural fields when performing the T-drill and acceleration-deceleration drill, as well as significantly higher average intensity and bone stimulus on the high wear fields versus the low wear fields when performing the T-drill. Further, athletes experienced significantly higher average intensity on synthetic fields when performing the drop jump. Additionally, athletes experienced significantly higher average intensity and bone stimulus on the harder areas within each field when performing the acceleration-deceleration drill versus the softer areas within each field, and average intensity on the hard and soft areas within synthetic fields were significantly higher than the hard and soft areas within natural fields during the acceleration-deceleration drill. Specifically, athletes recorded the lowest average intensity on the softer areas within natural fields.
Before performing drills, athletes perceived the quality of the low wear natural field and low wear synthetic field similarly, however both were rated higher than the high wear fields. Post-drill surveys indicated that athletes ranked the low wear natural field significantly higher than all other fields, with the low wear synthetic, high wear synthetic, and high wear natural fields following in quality ranking. Athletes felt that both high wear natural and synthetic fields negatively impacted their performance compared to the low wear options.
Conclusion
This study utilized advanced technology and methodologies to evaluate how different athletic field surfaces impact the performance of athletes. Our data suggests there is surface hardness variability both within and between natural and synthetic fields, and this variability impacts the athlete’s average intensity and bone stimulus. By analyzing the relationship between field conditions and athlete feedback, the study lays the groundwork for optimizing athletic training environments. Research is ongoing.
Citation
“iMeasureU Support.” iMeasureU, www.support.imeasureu.com. Accessed 31 Oct. 2024.