SUSTAINABILITY
ENVIRONMENTAL, SOCIAL AND GOVERNANCE

Our goal is to create the world’s most efficient and sustainable value chain for seafood by 2025.
If something is to be sustainable, it must meet the requirements within 3 different areas:
ENVIRONMENTAL – We must protect the environment. Every activity impacts the environment but, to be able to operate from an eternal perspective, we must ensure that the environment will return to its original state afterwards.
SOCIAL – We must protect people and local communities. This means safeguarding the human rights of employees directly or indirectly involved in our value chain and making a positive contribution to the local communities around us.
GOVERNANCE – We must comply with laws and regulations, protect our reputation and operate profitably.
What does ESG actually mean?
• E for Environmental
• S for Social
• G for Governance
BÆREKRAFTIG SUSTAINABLE
– in other words, a catch-all for sustainability SOCIAL
ACHIEVABLE
We work to reduce our impact on the environment in all operations throughout the value chain:
• Smolt production
• Feed production
• Fish for consumption
• Wild catch
• Industry
• VAP
• Distribution
• Customers and society
Environmental
• Fish health and fish welfare
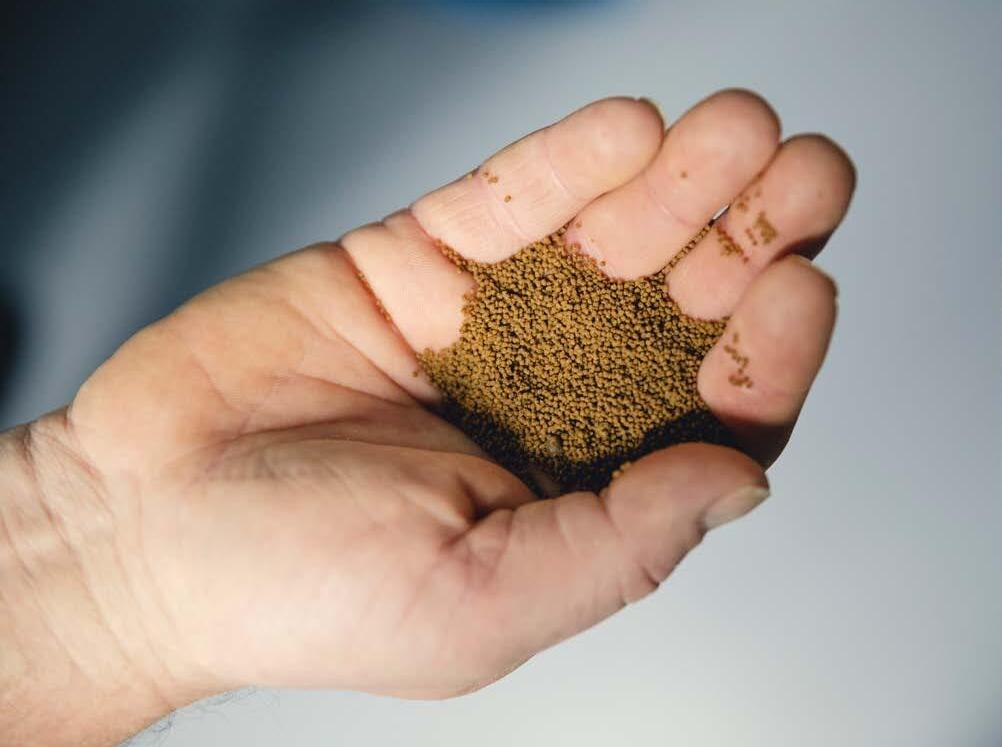
• Raw materials for fish feed
• Climate change and risk
• Greenhouse gas emissions
• Electrification
• Energy efficiency measures
• Biodiversity and loss of nature
• Resource depletion
• Waste and pollution
• Circular economy
Governance
• Anti-corruption
• Anti-money laundering
• Tax
• Local communities
• Fair adjustment
• HSE
• Diversity, inclusion and equality
• Working environment and employment terms
• Education and training
• Health benefits of seafood
• Food safety
• Protection of personal data
• Supplier follow-up
• Whistleblowing system
• Corporate governance
• Traceability
• Compliance with internal and external laws and regulations
• Compliance with Lerøy’s Code of Conduct and policies
• Earnings for owners
Which areas must we focus on to achieve our goals?
FARMING
Fish welfare
Greenhouse gas emissions from electricity, diesel and petrol, etc.
Greenhouse gas emissions from raw materials used in fish feed
Land use Lice, escapes and wild fish
Survival Feed waste and waste management
Effective routines
HSE
Local employment and skills
Working environment and rights
Improvement potential
Diversity and anti-discrimination
Significant improvement potential
Corruption Compliance with internal and external rules and routines
Compliance with Code of Conduct and policies
Supplier management
Emissions from marine gas oil
Overfishing
Damage to seabed conditions
Unwanted by-catch
Loss of fishing gear
HSE
Local employment and skills
Working environment and rights
Diversity and anti-discrimination
Transport of products
Greenhouse gas emissions from electricity, diesel and petrol, etc.
Packaging waste
Land use
Increase the use of fish cuttings and byproducts/fish on floor for human consumption
HSE
Local employment and skills
Working environment and rights
Diversity and anti-discrimination
Corruption Compliance with internal and external rules and routines
Compliance with Code of Conduct and policies
Supplier management
Corruption Compliance with internal and external rules and routines
Compliance with Code of Conduct and policies
Supplier management

At Lerøy, we have set ourselves a number of general goals relating to sustainability. The following tables show some of them.
• Environmental
Social • Governance
The goals have been set at Group level, and the individual segments and companies also have their own goals.
*H1: Frequency of injuries involving absence in relation to number of hours worked. Reported

Use of fossil fuels such as petrol, marine gas oil, diesel, gas.
(Scope 1)
88% 11% 1%
Use of energy such as electricity, nuclear power.
(Scope 2)
The fossil fuels and energy our suppliers use to produce the goods they supply to Lerøy.
(Scope 3) 17
(figures for 2021)
We have set ourselves ambitious goals for greenhouse gas emissions based on the Paris Agreement. We shall reduce our emissions by 46% by 2030 (base year 2019).
By focusing on fish feed and transport, we can make a significant impact on our climate goals for 2030.
Sustainable fish feed
Airfreight
Fish feed accounts for approx. 80% of Lerøy’s greenhouse gas emissions. Our ambition is that we WILL achieve the 1.5 degrees goal, and it is therefore extremely important to replace the feedstuffs we currently use with alternatives that generate lower greenhouse gas emissions. To achieve the goal we have set ourselves, we:
• Were the first to use sustainable microalgae in feed as an alternative to fish oil
• Implemented internal projects on the production and use of mussel meal
• Purchased more than 60% of all the new alternative feedstuffs that were available in 2020
• Worked to increase utilisation of cuttings from whitefish and pelagic fish
The graph shows how we need to reduce our greenhouse gas emissions for fish feed in the coming years in order to achieve the goals we have set ourselves.
how
Airfreight
Minimising weight, and alternative solutions
• CO2 transport calculator that calculates the best logistical solution for our products with respect to the climate
• Using dry ice to reduce transport weight
• Replacing sales of whole fish with processed goods
Alternative fuel sources
R&D and electrification
• Participation in the Green Shipping Programme on the development of alternative fuel sources
• Developing onshore charging stations
• Electrifying locations
• Blending MGO with biogas to reduce emissions
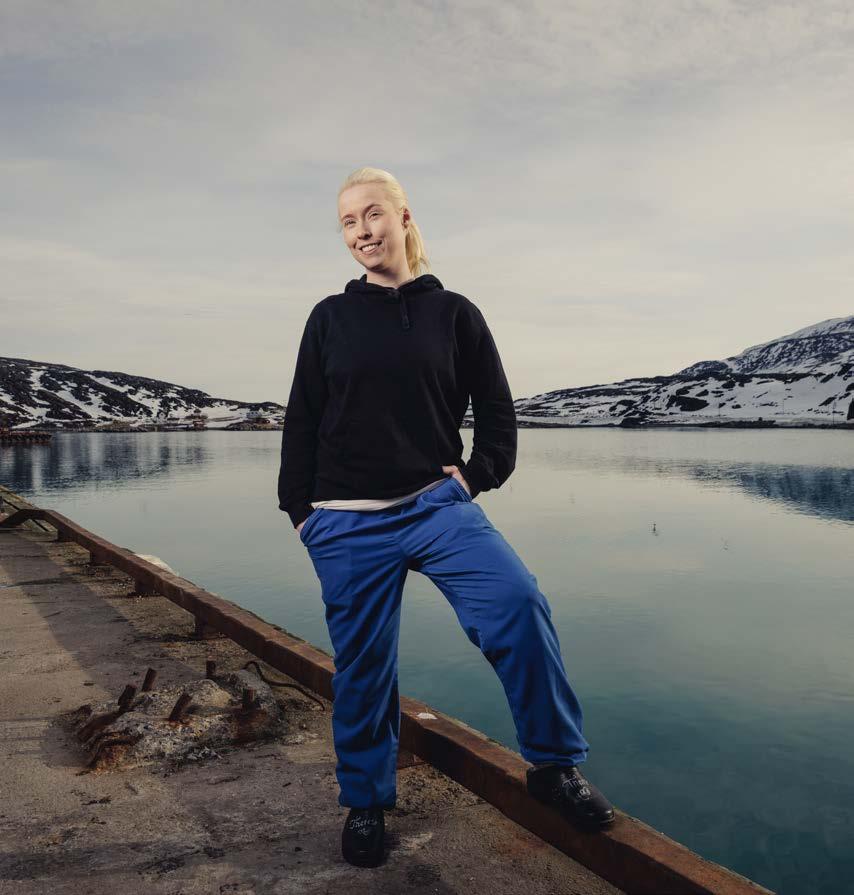
OUR 5,500 EMPLOYEES ARE CRUCIAL TO OUR SUCCESS
• 98 trainees and 355 apprentices (2019–2021)
• Work experience placements and collaboration with educational institutions
• 162 managers had completed leadership development courses as of September 2022
• 110 new managers in all parts of our value chain registered for new courses
• 100% of all managers shall complete the training programme in all countries
• Motimate e-learning
• Opportunities for internal mobility
• Seafood Next skills development programme

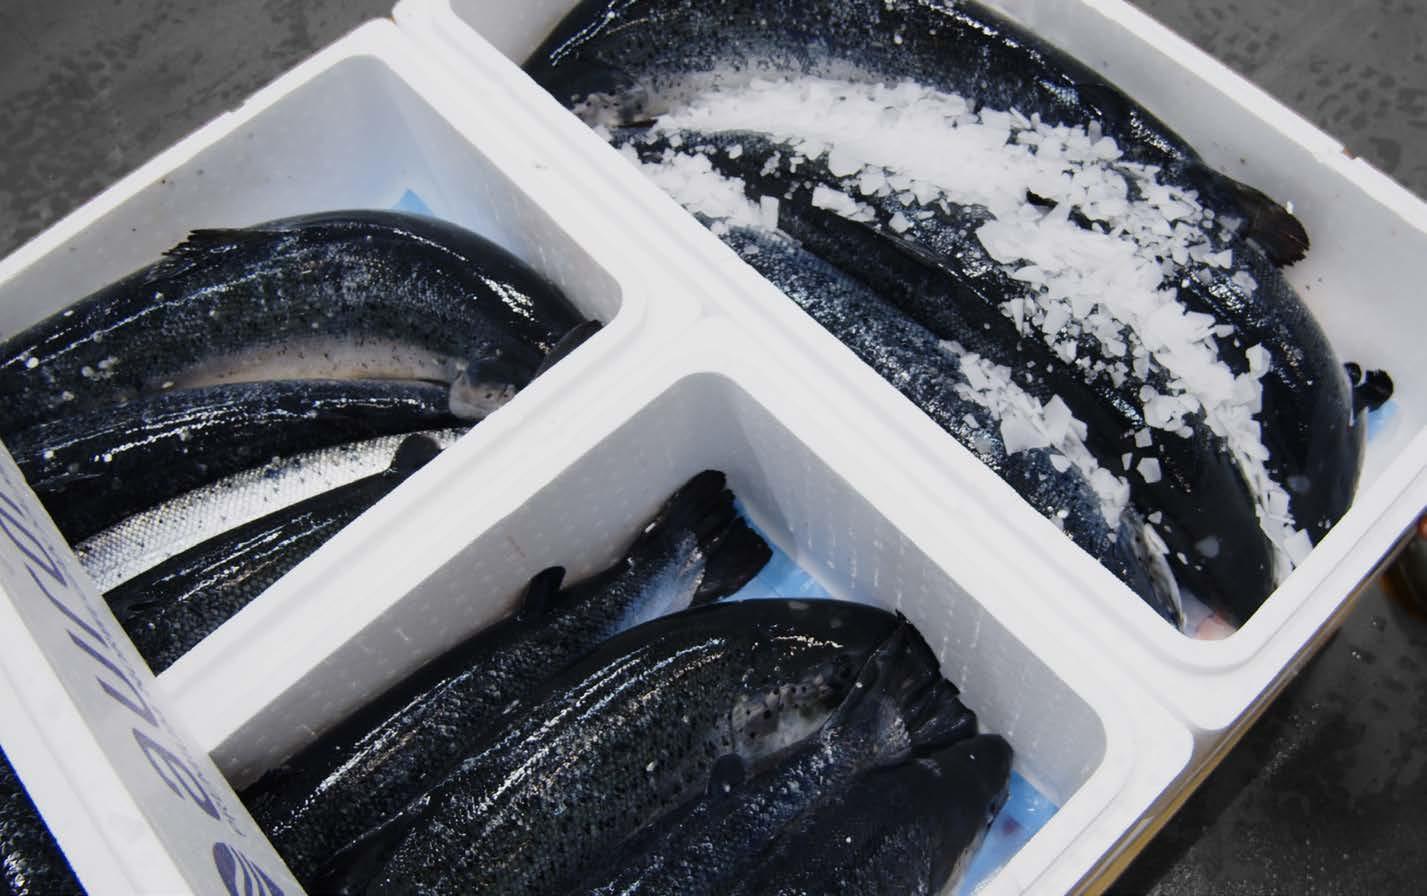
Fish fillets are intrinsically sterile, but all handling increases the risk of contamination. Each stage of the value chain is responsible for supplying safe products to its customers. How can you play your part in food safety?
Remember that everyone can make a difference, so always provide feedback on possible improvements.
Handle the fish as little as possible, quickly and carefully, and ensure it is chilled quickly
Handle and store chemicals so as to avoid contamination of the fish
– Observe sluicing routines and zones
– Wash your hands
– Wear clean and appropriate clothing
– Handle the fish carefully and as little as possible
– Ensure that the fish is always kept at a low temperature
Ensure correct registration, updated specifications and logistics solutions that do not degrade the product
– Observe enclosure routines and zones
– Wash your hands
– Wear clean and appropriate clothing
– Handle the fish carefully and as little as possible
– Ensure that the fish is always kept at a low temperature
We all have a responsibility to read the Group’s Code of Conduct. The Code of Conduct guides the decisions we make in our day-to-day work at Lerøy.
Wherever you are in our value chain, there are laws and regulations that we must abide by in our day-to-day work. It is your responsibility to ensure these are followed.
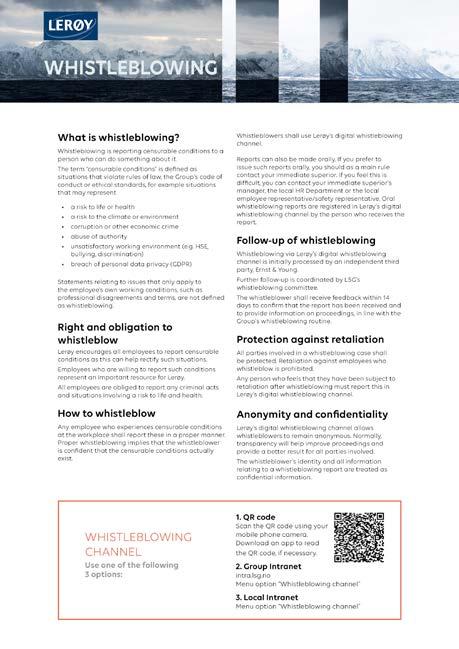
At Lerøy, we have routines for both internal and external whistleblowing. Third parties who wish to whistleblow something they have observed at Lerøy can do so via our website, www. leroyseafood.com
Employees who wish to whistleblow censurable conditions can do so by following the guidelines set out in the whistleblowing poster.
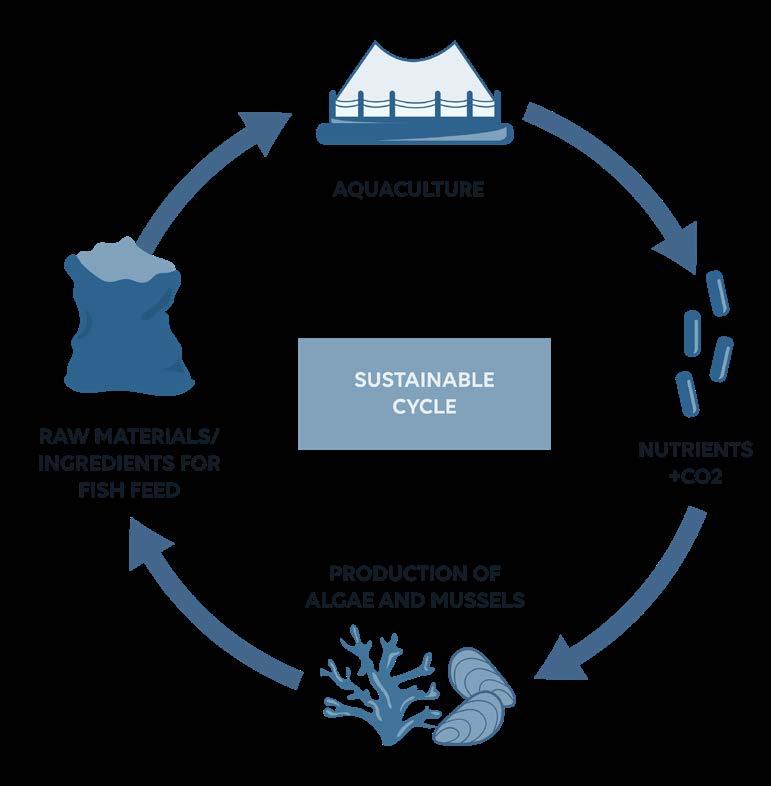
• Collecting mud from smolt plants and fish for consumption
• Recycling nets and other waste
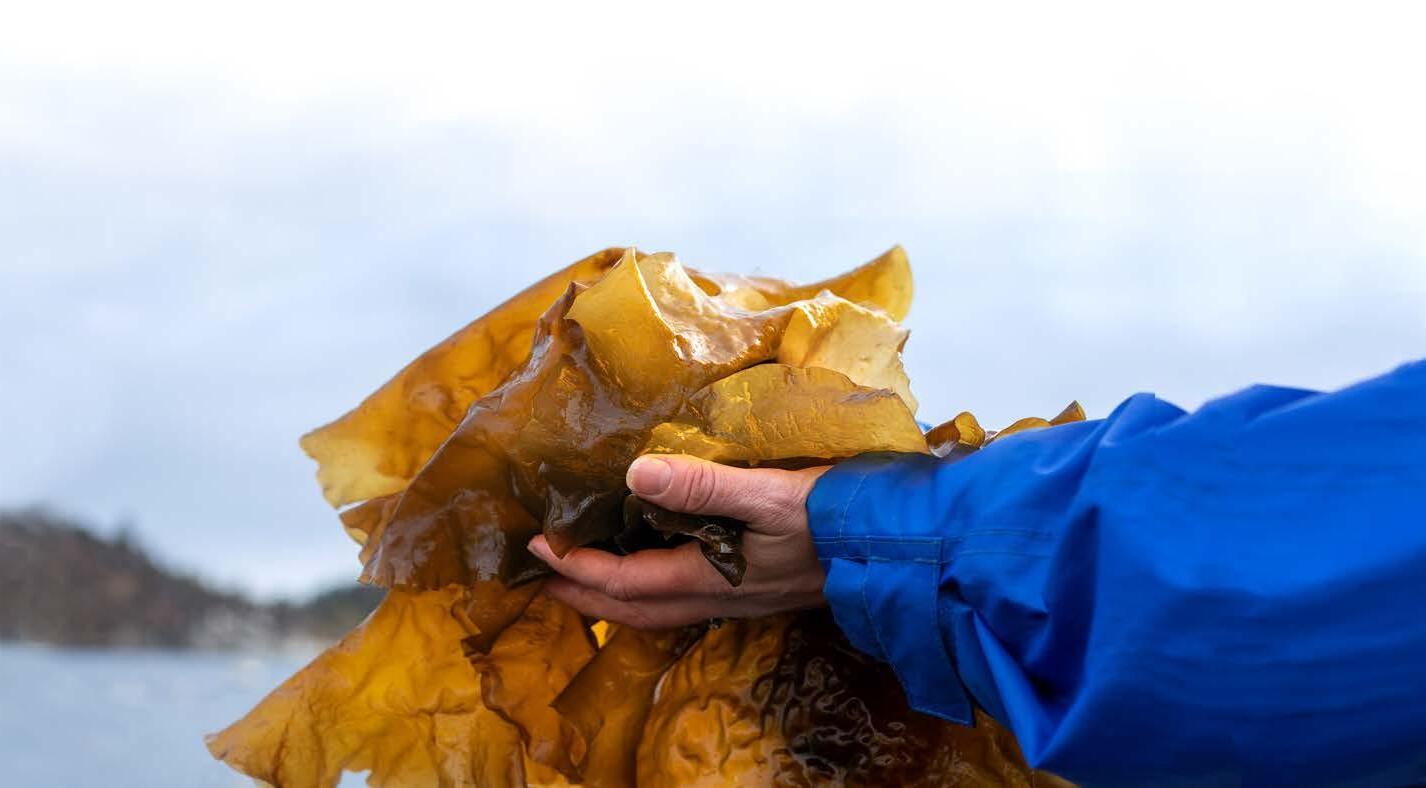
• Producing protein from seaweed and mussels
Nutrient salts N and P and CO2 from the production of salmon and trout are part of the food chain for seaweed and mussels
Ambition for 2030: Production volume of 100,000 tons
seaweed


hadde et lavt antall fisk som rømte også i 2021. Tallet var 4 fisk, en reduksjon på 208 stk fisk fra 2020.
Number of fish escaped per year, salmon and trout
Survival for salmon and trout in the sea, rolling 12 months
Percent
Survival on land”, rolling 12 months Percent
Nøkkeltall miljø forts.
Average MOM B score (seabed samples)
Kilogram of industrial fish per kilo of salmon produced used in the fishmeal and oil in fish feed
CO2e emissions for fish are in general low. When compared with other types of proteins we eat, fish is one of the proteins with the lowest footprint .
CO2e-utslippene for fisk er generelt lave. Sammenlignet proteiner med lavest fotavtrykk.
The level of fully grown lice has been relatively stable in recent years.
* Se side 90 for mer informasjon.
Antibiotika Bruk av antibiotika er nesten fraværende i norsk havbruksnæring. Lerøy Seafood Group er svært restriktiv i sin bruk av antibiotika og benytter dette kun unntaksvis og av hensyn til fiskevelferd.
18,99*
0,00
* Se side 90 for mer informasjon.
Antibiotika brukt i sjø, kg aktivt virkestoff
2.309
0,00
18,99*
0,00
2.555
Antibiotika brukt på land, kg aktivt virkestoff
0,00
3.273
0,00
0,00
ble benyttet på en lokalitet utifra hensyn til fiskevelferd
Places in municipal kindergartens
Key figures, Social
equivalents
Places in nursing homes
10,396,607 * 1,034,087 *
Taxes
Value creation
* Affected by prevailing market prices
Value creation = Gross production value minus intermediate consumption.
* Net tax from employees and tax paid in 2020 by Lerøy Seafood Group
Places in municipal kindergartens
In 2021, Lerøy Seafood Group had more than 4,500 different suppliers nationwide.
3,116 municipal kindergartens
Full-time equivalents
982
Full-time equivalents Places in nursing homes
Places in nursing homes
5,806 Places in municipal kindergartens
Places in municipal kindergartens
Purchases made by our Norwegian companies from Norwegian suppliers in 2021 (invoiced in 2021)
Purchases from Group companies
External purchases
60 municipalities
We had own operations in approx. 60 municipalities in Norway.
NOK 12.8
We purchased goods and services worth NOK 12.8 billion excluding internal purchases from more than 280 different Norwegian municipalities.
NOK 647.5 million
Our employees paid tax to different municipalities amounting to NOK 647.5 million.
Development in Group's operating profit LSG Group*
Figures
* Before fair value adjustments related to biological assets
You can find more information about how we work on sustainability at Lerøy in our sustainability library https://www.leroyseafood.com/en/sustainability/ sustainability-library-2021/
NORDICSWAN ECOLABEL