
Aloha and welcome to The Oahu Quarterly Luxury Market Report from List Sotheby’s International Realty, where we take a closer look at the most recent real estate activity here on Oahu.
The Oahu luxury home market report is broken down into four singlefamily home categories and two condominium price segments.
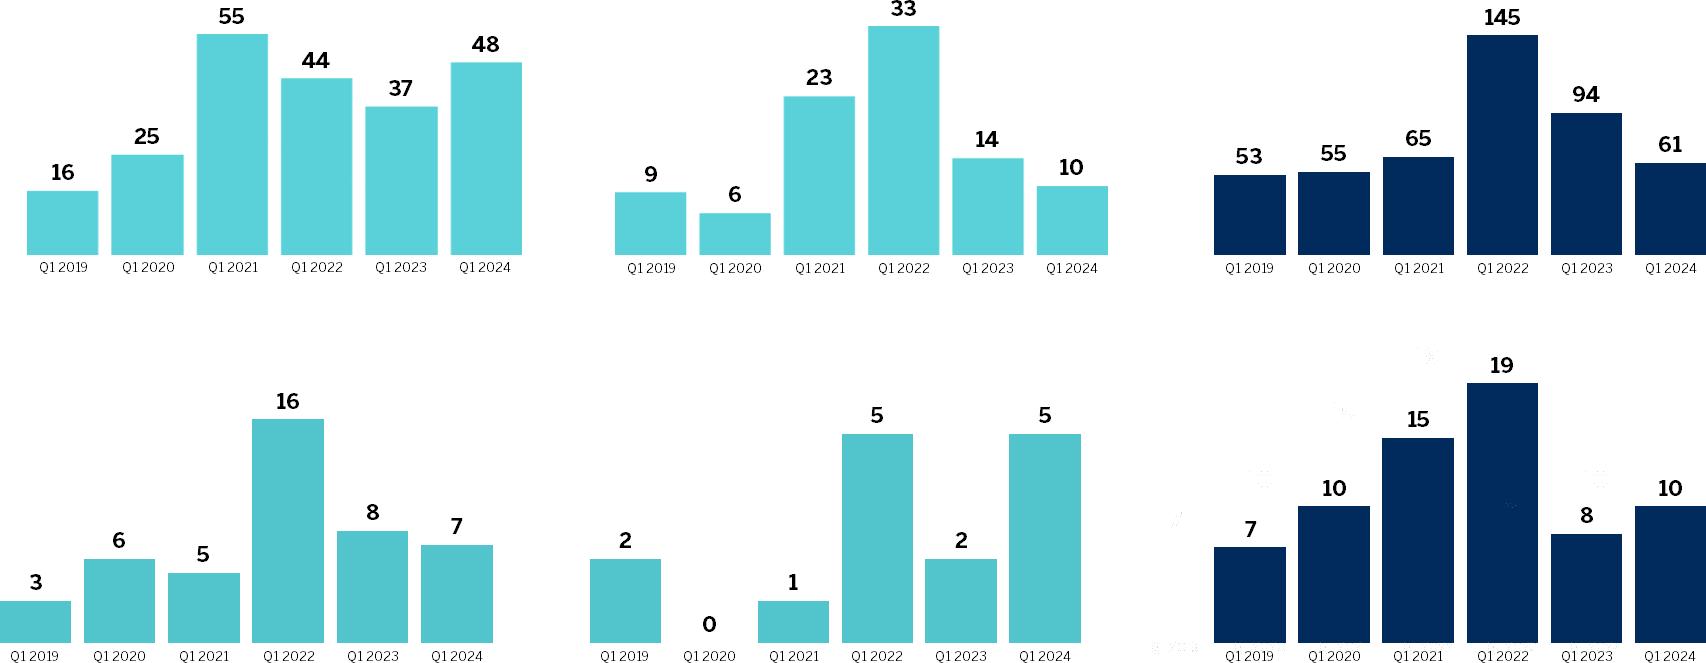
Single-family home sales for Q1 2024 priced from $2 to $3 million increased 29.7% compared to Q1 2023, with 48 homes sold in the quarter as compared to 37 homes in the same period a year ago. Months’ supply of inventory increased 67.4% compared to last year, rising to 7.2 months in Q1 2024 from 4.3 months in Q1 2023.
For single-family homes in the $3 to $5 million range, sales fell from 14 in Q1 2023 to 10 in Q1 2024, decreasing 28.6% from the same time last year. Months’ supply of inventory increased 42.5% to 11.4 months from eight months last year.
In the $5 to $10 million range, seven single-family homes sold in Q1 2024, one fewer than the eight homes sold during the same quarter last year. Months’ supply of inventory decreased 35.7% to 11.7 months from 18.2 months in Q1 2023.
There were five single-family homes sold at or above $10 million in Q1 2024, 150% more than the two homes sold in Q1 2023. These sales included one in Kahala, two on the North Shore, one in Diamond Head and one in Beachside. The top sale was at $14,400,000 for a home on the North Shore. Months’ supply of inventory decreased 16.8%, declining from 13.7 months in Q1 2023 to 11.4 months in the first quarter of 2024.
Condo sales in the $1 to $2.5 million range decreased 35.1% in Q1 2024 from Q1 2023, with 61 closed sales in first quarter this year versus 94 closed sales in the first quarter last year. Months’ supply of inventory increased 27.7% to 10.6 months from 8.3 months in Q1 2023. Continued
Visit www.ListSothebysRealty.com | 1 All Data from the HiCentral MLS, Ltd. Report © 2024 ShowingTime.
2
on Page
FOREIGN INVESTMENT Source: Title Guaranty Hawaii, through December 2023. 2021 # $ JAPAN 64 $86,855,832 CANADA 11 $14,210,150 KOREA 7 $10,389,250 UNITED KINGDOM 6 $7,684,475 SINGAPORE 5 $7,255,150 $1 - $2 MILLION $2 MILLION + 2020 # $ JAPAN 13 $48,241,333 CANADA 4 $11,755,000 SINGAPORE 2 $11,800,000 GUAM 2 $6,925,000 NEW ZEALAND 2 $5,800,000 2020 # $ JAPAN 9 $14,331,133 KOREA 3 $3,689,000 HONG KONG 2 $3,030,000 CANADA 1 $1,925,000 TAIWAN 1 $1,803,100 2022 # $ JAPAN 49 $65,003,850 KOREA 21 $28,081,200 CANADA 15 $20,052,650 TAIWAN 3 $3,389,000 GUAM 2 $2,315,000 2023 # $ JAPAN 92 $120.686.450 KOREA 8 $11.082.400 CANADA 6 $7.360.800 CHINA 4 $4,294,650 AMERICAN SAMOA 2 $2,700,000 2021 # $ JAPAN 19 $80,643,283 KOREA 4 $20,150,000 CANADA 4 $14,175,200 HONG KONG 2 $10,150,000 TAIWAN 1 $4,050,000 2022 # $ JAPAN 13 $40,011,000 KOREA 4 $15,750,000 HONG KONG 3 $8,613,600 CHINA 2 $11,550,000 TAIWAN 1 $9,200,000 2023 # $ JAPAN 26 $102,572,000 CAYMAN ISLANDS 1 $27,500,000 KOREA 3 $7,338,000 TAIWAN 2 $6,000,000 PUERTO RICO 1 $2,800,000
Continued from Page 1
Sales for condos priced at $2.5 million and higher rose slightly in Q1 2024 to ten, compared to eight sales in Q1 2023, an increase of 25%. Months’ supply of inventory increased 12.4% compared to Q1 2023, to 17.2 months, from 15.3 months the same quarter last year.
One condo sold at or above $5 million in Q1. It was a unit at Waiea that sold for $7,000,000.
Remember that every home and situation is unique. For guidance with your current or future home, visit listsothebysrealty.com and contact one of our experienced agents.
That’s the Oahu Quarterly Luxury Market Report for this quarter. Check back soon for the latest.
OAHU
Visit www.ListSothebysRealty.com | 2 All Data from the HiCentral MLS, Ltd. Report © 2024 ShowingTime.
dash = no sales in the time period Sign up for our monthly market newsletter and more at: www.ListSothebysRealty.com or www.ListHawaii-mls.com
FIRST QUARTER 2024
LUXURY NEIGHBORHOOD DETAIL FOR SINGLE FAMILY HOMES THROUGH
Neighborhoods Q-1 2024 Median Sales Price Q-1 2023 Median Sales Price Q-1 2022 Median Sales Price Q-1 2021 Median Sales Price Q-1 2020 Median Sales Price Q-1 2019 Median Sales Price Aina Haina Beach Beachside $8,337,500 $6,475,000 $3,500,000 $2,900,000 $2,795,000 $2,810,000 Black Point $2,350,000 $6,325,000 Diamond Head $7,650,000 $5,000,000 $5,100,000 $2,318,390 $3,962,500 $8,650,000 Dowsett $1,240,000 $1,161,500 $1,770,000 $1,507,500 $1,250,000 Hawaii Loa Ridge $2,600,000 $3,100,000 $2,800,000 $2,569,000 $1,980,000 $2,060,000 Hillcrest $2,250,000 $1,222,500 Kahala Area $2,588,000 $3,580,000 $3,350,000 $3,525,000 $2,130,000 $3,250,000 Kakaako Kamehame Ridge $2,150,000 $1,390,000 $1,205,000 $1,828,888 Koko Kai $4,100,000 $3,342,500 $3,600,000 $1,975,000 $2,992,500 Lanikai $3,300,000 $5,500,000 $5,000,000 $1,862,500 $2,091,500 $1,644,500 Makiki Heights $4,987,500 $4,000,000 $1,472,500 $1,300,000 $1,368,000 Manoa Area $1,600,000 $1,510,700 $1,717,000 $1,597,500 $1,407,142 $1,404,000 Manoa-Woodlawn $1,488,888 $1,625,000 $1,865,000 $1,600,000 $1,062,500 $1,450,000 Maunalani Heights $1,450,000 $1,774,000 $2,227,500 $1,230,000 $1,211,000 $1,212,500 Napali Haweo $2,625,000 $1,995,000 $2,287,500 $1,450,000 Niu Beach $6,500,000 $2,600,000 $3,250,000 $2,537,500 North Shore $800,000 $950,000 $1,355,000 $812,500 $920,000 $840,000 Pacific Heights $905,000 $2,145,491 $1,810,000 $1,057,500 Paiko Lagoon $2,699,500 $3,112,500 $1,273,500 Portlock $5,746,500 $8,250,000 $3,540,000 $2,425,000 $3,450,000 $2,525,000 Puupanini $1,825,000 $1,840,000 $1,999,999 $987,500 $1,450,000 Tantalus $1,908,000 $1,055,000 Triangle $1,491,500 $1,810,000 $1,650,000 $1,275,000 $784,500 $1,700,000 Waialae Golf Course $2,162,500 $2,750,000 $2,050,000 Waialae Iki $1,800,000 $1,890,000 $2,325,000 $2,408,750 $1,500,000 $1,692,500 Waialae Nui Ridge $2,150,000 $1,999,999 $1,165,000 $1,300,000 Wailupe Area $3,000,000
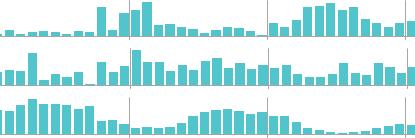
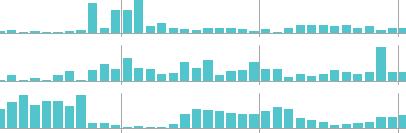
Visit www.ListSothebysRealty.com | 3 All Data from the HiCentral MLS, Ltd. Report © 2024 ShowingTime. Metric Year $2-3 Million $3-5 Million $5-10 Million $10 Million + $1-2.5 Million $2.5 Million + CLOSED SALES Q1-2019 16 9 3 2 53 7 Q1-2020 25 6 6 0 55 10 Q1-2021 55 23 5 1 65 15 Q1-2022 44 33 16 5 145 19 Q1-2023 37 14 8 2 94 8 Q1-2024 48 10 7 5 61 10 MEDIAN SALES PRICE (in millions) Q1-2019 $2.30 $3.50 $5.28 $11.58 $1.25 $3.98 Q1-2020 $2.30 $3.28 $6.88 $1.30 $3.75 Q1-2021 $2.38 $3.50 $6.10 $10.40 $1.21 $3.07 Q1-2022 $2.40 $3.66 $5.65 $17.00 $1.30 $3.74 Q1-2023 $2.35 $3.40 $6.49 $12.65 $1.30 $6.23 Q1-2024 $2.30 $3.62 $5.60 $12.00 $1.29 $2.83 MONTHS SUPPLY OF INVENTORY Q1-2019 11.9 15.4 28.7 14.0 11.6 23.0 Q1-2020 11.0 18.9 24.1 25.0 10.0 18.1 Q1-2021 6.2 8.9 14.2 21.0 12.7 22.8 Q1-2022 4.4 4.2 8.5 11.3 5.9 8.4 Q1-2023 4.3 8.0 18.2 13.7 8.3 15.3 Q1-2024 7.2 11.4 11.7 11.4 10.6 17.2 SINGLE-FAMILY CONDO $ 1 Million + Q1 2021 Q1 2022 Q1 2023 Q1 2024 Closed Sales Median Sales Price Months Supply of Inventory $1 Million + Q1 2021 Q1 2022 Q1 2023 Q1 2024 Closed Sales Median Sales Price Months Supply of Inventory SALES ACTIVITY SINGLE FAMILY & CONDO HISTORICAL GRAPH CONDOMINIUM HISTORICAL GRAPH
$1-2.5 MILLION
Visit www.ListSothebysRealty.com | 4 All Data from the HiCentral MLS, Ltd. Report © 2024 ShowingTime. SINGLE FAMILY CONDOMINIUM
$2-3 MILLION
List Sotheby’s International Realty 4211 Waialae Avenue, Suite 8060 | Honolulu, HI 96816 (808) 735-2411 ARTFULLY UNITING EXCEPTIONAL HAWAII HOMES WITH EXTRAORDINARY LIVES SALES ACTIVITY
$3-5 MILLION
