Executive Summary


O‘ahu’s housing market remained sluggish in February, with closed sales of single-family homes and condos down 28.2% and 33.1%, respectively. However, single-family home sales rose 15.3%, and condo sales increased by 18.2% compared to January 2023.

Median sales prices in both markets declined, dipping 12.3% for single-family homes from $1,125,000 to $987,000 compared to 2022. The condo market experienced a modest 3.4% decline from $497,000 to $480,000. Roughly 189 O‘ahu properties sold for under $500,000 in February.
In February 2023, single-family homes nearly quadrupled the median days on market, skyrocketing to 47 days compared to 13 days in February 2022. The median days on market for condos doubled to 28 days compared to 14 days a year ago.
The share of single-family homes sold above the original asking price fell dramatically from a year ago, accounting for just 19% of sales this February, compared to 55% in February 2022. From another perspective, only 32% of single-family home sales received full asking price or more compared to 73% last February. In the condo market, the share of sales closing above the original list price shrank only 15% this February compared to 37% in February 2022. Of the sales this month, 36% received full asking price or more compared to 56% of sales last year.
Though there were 233 new single-family home listings and 463 new condo listings this past month, this was well below the number of listings brought to market in February 2022, down 36.5% for single-family homes and 37.3% for condos. Both markets added active inventory at various price points, though the most significant increase in the single-family home market was in the $999,999 and below price range, with twice as many properties up for sale compared to 2022. For condos, the most significant increase occurred in the $600,000 to $799,999 price range, with 50% more active condos than a year ago.
Most price points for single-family homes experienced fewer sales this February, with the largest drop in sales volume occurring in the $900,000 to $1,099,999 price range, down 47.4% year-over-year. The ‘Ewa Plain region experienced the largest decline in sales volume, falling 40.4% year-over-year, followed by the Metro region, declining 55.2%.

Most price points for condos saw a decline in sales, with the most notable change occurring in the $800,000 to $1,999,999 price range, down 60% year-over-year, and in the $500,000 to $699,999 range, falling 42.7%. The Kailua region was the only area where condo sales were even with last year, with 10 condos sold. All other regions saw fewer sales compared to the same time last year, with the ‘Ewa Plain falling 45.7% and the Metro region decreasing 30.1%.


MONTHLY
REPORT FEBRU
STATS
ARY 2 02 3

Page 1 of 34
Monthly Indicators
*seefootnotesonpages9-12regardingmethodologyupdatesYoY%chg=year-over-yearpercentchangecomparingcurrentmonthtothesamemonthlastyear. MoM%chg=month-over-monthpercentchangecomparingcurrentmonthtothepreviousmonth.
*seefootnotesonpages9-12regardingmethodologyupdates1-yr%chg=percentchangecomparingthecurrentYTDtimeperiodtothesameYTDtimeperiodoneyearago. 2-yr%chg=percentchangecomparingthecurrentYTDtimeperiodtothesameYTDtimeperiodtwoyearsago.
SOURCE: Honolulu Board of REALTORS®, residential resales compiled from MLS data. ©2023.HonoluluBoardofREALTORS®.AllRightsReserved.Informationhereindeemedreliablebutnotguaranteed.
February 2023 Feb-23 Feb-22YoY %chgJan-23MoM %chg Feb-23 Feb-22YoY %chgJan-23MoM %chg Closed Sales 173 241-28.2%15015.3% 325 486-33.1%27518.2% Median Sales Price $987,000 $1,125,000-12.3%$970,0001.8% $480,000 $497,000-3.4%$495,000-3.0% Average Sales Price $1,427,864 $1,486,088-3.9%$1,139,29425.3% $592,131 $583,3671.5%$633,441-6.5% Median Days on Market 47 13261.5%2495.8% 28 14100.0%2416.7% Percent of Orig. List Price Received 96.0% 100.8%-4.8%95.9%0.1% 98.0% 100.0%-2.0%98.4%-0.4% New Listings 233 367-36.5%268-13.1% 463 739-37.3%523-11.5% Pending Sales* 217 316-31.3%267-18.7% 399 643-37.9%3785.6% Active Inventory* 547 34857.2%551-0.7% 1,177 98919.0%1,196-1.6% Total Inventory in Escrow* 386 544-29.0%3762.7% 592 946-37.4%52313.2% Months Supply of Active Inventory* 2.0 0.9122.2%2.00.0% 2.4 1.650.0%2.40.0%
OAHU, HAWAII
Year-to-Date YTD-2023 YTD-20221-yr %chgYTD-20212-yr %chg YTD-2023 YTD-20221-yr %chgYTD-20212-yr %chg Closed Sales 323 567-43.0%551-41.4% 600 1,038-42.2%838-28.4% Median Sales Price $980,000 $1,084,250-9.6%$895,0009.5% $485,000 $500,000-3.0%$455,0006.6% Average Sales Price $1,293,853 $1,364,912-5.2%$1,106,81016.9% $609,016 $605,0090.7%$522,41216.6% Median Days on Market 35 12191.7%9288.9% 26 1485.7%1752.9% Percent of Orig. List Price Received 95.9% 101.2%-5.2%100.3%-4.4% 98.1% 100.0%-1.9%98.8%-0.7% New Listings 501 687-27.1%687-27.1% 986 1,405-29.8%1,282-23.1% Pending Sales* 484 631-23.3%694-30.3% 777 1,217-36.2%1,106-29.7%
Single-Family Homes Condos Single-Family Homes Condos
Page 2 of 34
Closed Sales
February 2023
OAHU, HAWAII
(Acountofpropertiesthathaveclosedinagivenmonth)
Mo-Yr Single-Family HomesCondosTotal
Feb-20247316563
Mar-20303410713
Apr-20248343591
May-20248254502
Jun-20302312614
Jul-20361426787
Aug-20370409779
Sep-20391456847
Oct-20345480825
Nov-20338407745
Dec-20420514934
Jan-21291392683
Feb-21260446706
Mar-21361626987
Apr-213756451,020
May-214055981,003
Dec-21378593971 Monthly Closed Sales Year-to-Date Closed Sales Jan-22326552878FebruarySFHYoY%chgCNDYoY%chgFebruaryYTDSFHYoY%chgYTDCNDYoY%chg Feb-2224148672720212605.3%44641.1%20215517.6%83820.6% Mar-223216729932022241-7.3%4869.0%20225672.9%1,03823.9% Apr-223656721,037 2023173-28.2%325-33.1% 2023323-43.0%600-42.2% May-223446881,032 Jun-22357626983 Jul-22312518830 Aug-22314508822 Sep-22278496774 Oct-22222435657 Nov-22192340532 Dec-22202360562 Jan-23150275425 Feb-23173 325 498
Jun-214517301,181 Jul-214046711,075 Aug-214256751,100 Sep-214246151,039 Oct-21381611992 Nov-21371601972
Sales 202120222023 Closed Sales SFH(YTD) 202120222023 Closed Sales CND(YTD) 202120222023 Closed Sales SFH(Feb) 202120222023 Closed Sales CND(Feb)
Page 3 of 34
SOURCE: Honolulu Board of REALTORS®, residential resales compiled from MLS data. ©2023.HonoluluBoardofREALTORS®.AllRightsReserved.Informationhereindeemedreliablebutnotguaranteed.
Median Sales Price
February 2023
OAHU, HAWAII
(Themediansalespriceofallclosedpropertiesinagivenmonth)
Mo/Yr Single-Family HomesCondos
Feb-20$765,000$430,000
Mar-20$810,000$435,000
Apr-20$809,000$450,000
May-20$797,000$399,000
Jun-20$770,000$421,500
Jul-20$815,000$440,000
Aug-20$839,000$430,000
Sep-20$880,000$445,000
Oct-20$865,000$439,500
Nov-20$872,500$420,000
Dec-20$870,000$455,000
Jan-21$883,000$452,000
Feb-21$917,500$457,500
Mar-21$950,000$451,000
Apr-21$928,000$450,000
May-21$978,000$457,750
Jun-21$979,000$460,000
Jul-21$992,500$475,000
Aug-21$1,050,000$500,000
Sep-21$1,050,000$478,000
Oct-21$1,000,000$500,000
Nov-21$1,050,000$500,000 Dec-21$1,050,000$485,000
SOURCE: Honolulu Board of REALTORS®, residential resales compiled from MLS data. ©2023.HonoluluBoardofREALTORS®.AllRightsReserved.Informationhereindeemedreliablebutnotguaranteed.
Monthly Median Sales Price Year-to-Date
Sales Price Jan-22$1,050,000$510,000FebruarySFHYoY%chgCNDYoY%chgFebruaryYTDSFHYoY%chgYTDCNDYoY%chg Feb-22$1,125,000$497,0002021$917,50019.9%$457,5006.4%2021$895,00016.6%$455,0005.9% Mar-22$1,150,000$515,5002022$1,125,00022.6%$497,0008.6%2022$1,084,25021.1%$500,0009.9% Apr-22$1,105,000$510,000 2023$987,000-12.3%$480,000-3.4% 2023$980,000-9.6%$485,000-3.0%
Median
May-22$1,153,500$516,500 Jun-22$1,100,000$534,000 Jul-22$1,107,944$500,000 Aug-22$1,125,500$498,500 Sep-22$1,100,000$502,500 Oct-22$1,050,000$520,000 Nov-22$1,149,500$480,000 Dec-22$1,049,500$502,500 Jan-23$970,000$495,000 Feb-23$987,000$480,000
Price ($) 202120222023 Price ($) SFH(YTD) 202120222023 Price ($) CND(YTD) 202120222023 Price ($) SFH(Feb) 202120222023 Price ($) CND(Feb)
Page 4 of 34
Average Sales Price
February 2023
OAHU, HAWAII
(Theaveragesalespriceofallclosedpropertiesinagivenmonth)
Mo/Yr Single-Family HomesCondos
Feb-20$974,283$527,836
Mar-20$972,367$528,606
Apr-20$941,708$521,484
May-20$1,003,419$453,220
Jun-20$899,271$481,220
Jul-20$1,016,491$475,346
Aug-20$1,022,449$527,573
Sep-20$1,073,692$545,367
Oct-20$1,065,594$479,736
Nov-20$1,084,834$472,726
Dec-20$1,113,076$504,222
Jan-21$1,050,263$496,296
Feb-21$1,172,804$545,629
Mar-21$1,226,827$530,257
Apr-21$1,194,150$520,192
May-21$1,246,611$555,798
Jun-21$1,225,011$557,302
Jul-21$1,265,382$544,064
Aug-21$1,316,681$618,612
Sep-21$1,289,510$558,002
Oct-21$1,335,171$582,509
Nov-21$1,296,551$559,007
Dec-21$1,303,481$604,749 Monthly Average Sales Price Year-to-Date Average Sales Price Jan-22$1,277,309$623,928FebruarySFHYoY%chgCNDYoY%chgFebruaryYTDSFHYoY%chgYTDCNDYoY%chg Feb-22$1,486,088$583,3672021$1,172,80420.4%$545,6293.4%2021$1,106,81018.4%$522,4121.0% Mar-22$1,570,668$623,6842022$1,486,08826.7%$583,3676.9%2022$1,364,91223.3%$605,00915.8% Apr-22$1,404,481$613,189 2023$1,427,864-3.9%$592,1311.5% 2023$1,293,853-5.2%$609,0160.7% May-22$1,450,008$625,327 Jun-22$1,382,559$631,822 Jul-22$1,329,023$590,934 Aug-22$1,341,958$547,319 Sep-22$1,307,249$607,502 Oct-22$1,243,960$676,988 Nov-22$1,387,685$594,444 Dec-22$1,325,156$576,689 Jan-23$1,139,294$633,441 Feb-23$1,427,864$592,131
Price ($) 202120222023 Price ($) SFH(YTD) 202120222023 Price ($) CND(YTD) 202120222023 Price ($) SFH(Feb) 202120222023 Price ($) CND(Feb)
Page 5 of 34
SOURCE: Honolulu Board of REALTORS®, residential resales compiled from MLS data. ©2023.HonoluluBoardofREALTORS®.AllRightsReserved.Informationhereindeemedreliablebutnotguaranteed.
Median Days on Market
February 2023
OAHU, HAWAII
(DaysonMarketrepresentsthenumberofdaysfromwhenapropertyisfirstlistedtowhenanofferisaccepted;theMedianDaysonMarketrepresentsthemedianofallsalesinagivenmonth)
Mo/Yr Single-Family HomesCondos
Feb-203534
Mar-201523
Apr-201927
May-201323
Jun-202040
Jul-201326
Aug-201523
SOURCE:
Jul-21911 Aug-21912 Sep-21911 Oct-211011 Nov-21119 Dec-211113 Monthly Median Days on Market Year-to-Date Median Days on Market Jan-221214FebruarySFHYoY%chgCNDYoY%chgFebruaryYTDSFHYoY%chgYTDCNDYoY%chg Feb-22131420219-74.3%18-47.1%20219-74.3%17-48.5% Mar-229920221344.4%14-22.2%20221233.3%14-17.6% Apr-221012 202347261.5%28100.0% 202335191.7%2685.7% May-221010 Jun-221011 Jul-221112 Aug-221313 Sep-221814 Oct-221919 Nov-221818 Dec-222521 Jan-232424 Feb-2347 28
Sep-20921 Oct-201018 Nov-201016 Dec-201019 Jan-21918 Feb-21918 Mar-21914 Apr-21913 May-21812 Jun-21811
Days on Market 202120222023 Days on Market SFH(YTD) 202120222023 Days on Market CND(YTD) 202120222023 Days on Market SFH(Feb) 202120222023 Days on Market CND(Feb)
Page 6 of 34
Honolulu Board of REALTORS®, residential resales compiled from MLS data. ©2023.HonoluluBoardofREALTORS®.AllRightsReserved.Informationhereindeemedreliablebutnotguaranteed.
Percent of Original List Price Received
February 2023
OAHU, HAWAII
(Thepercentagefoundwhendividingaproperty'ssalespricebytheoriginallistprice;reportedpercentageisthemedianofallsalesfortheperiodindicated)
Mo/Yr Single-Family HomesCondos
Feb-2098.3%97.3%
Mar-2098.7%98.1%
Apr-2098.9%98.1%
May-2099.0%97.8%
Jun-2098.7%97.7%
Jul-2098.8%97.9%
Aug-2098.7%98.3%
Sep-20100.0%98.6%
Oct-20100.0%98.3%
Nov-20100.0%99.0%
Dec-20100.0%98.5%
Jan-21100.7%98.8%
Feb-21100.0%98.8%
Mar-21100.4%99.1%
Apr-21101.9%99.6%
May-21101.4%100.0%
Jun-21104.2%100.0%
Jul-21103.9%100.0%
Aug-21103.0%100.0%
Monthly Percent of Original List Price Received Year-to-Date Percent of Original List Price Received
Dec-21102.1%100.0%
Jan-22101.6%100.0%FebruarySFHYoY%chgCNDYoY%chgFebruaryYTDSFHYoY%chgYTDCNDYoY%chg Feb-22100.8%100.0%2021100.0%1.7%98.8%1.5%2021100.3%2.5%98.8%1.3% Mar-22102.0%100.0%2022100.8%0.8%100.0%1.2%2022101.2%0.9%100.0%1.2% Apr-22102.6%100.0% 202396.0%-4.8%98.0%-2.0% 202395.9%-5.2%98.1%-1.9% May-22102.2%100.0% Jun-22102.0%100.0% Jul-22100.0%100.0% Aug-22100.0%100.0% Sep-2299.2%100.0% Oct-2299.8%99.0% Nov-2298.4%98.8% Dec-2296.7%98.5% Jan-2395.9%98.4% Feb-2396.0%98.0% Percent Received 202120222023 Percent Received SFH(YTD) 202120222023 Percent Received CND(YTD) 202120222023 Percent Received SFH(Feb) 202120222023 Percent Received CND(Feb)
Sep-21103.1%100.0% Oct-21102.2%100.0% Nov-21102.2%100.0%
Page 7 of 34
SOURCE: Honolulu Board of REALTORS®, residential resales compiled from MLS data. ©2023.HonoluluBoardofREALTORS®.AllRightsReserved.Informationhereindeemedreliablebutnotguaranteed.
New Listings
February 2023
OAHU, HAWAII
(Acountofpropertiesthathavebeennewlylistedonthemarketinagivenmonth)
Mo-Yr Single-Family HomesCondosTotal
Feb-203996391,038
Mar-203906101,000
Apr-20290440730
May-20345509854
Jun-20392598990
Jul-204226571,079
Aug-203876961,083
Sep-20368576944
Oct-203806641,044
Nov-20379561940
Dec-20264466730
Jan-213656591,024
Feb-21322623945
Mar-214397151,154
Apr-214597061,165
May-214306831,113
Jun-214827841,266
Jul-214696641,133
Aug-214607211,181
Sep-214127381,150
Oct-213767171,093
Nov-21358639997
Dec-21245527772
Monthly
Year-to-Date
Jan-22320666986FebruarySFHYoY%chgCNDYoY%chgFebruaryYTDSFHYoY%chgYTDCNDYoY%chg Feb-223677391,1062021322-19.3%623-2.5%2021687-16.9%1,282-4.0% Mar-224127141,126202236714.0%73918.6%20226870.0%1,4059.6% Apr-224247221,146 2023233-36.5%463-37.3% 2023501-27.1%986-29.8% May-224456871,132 Jun-223916861,077
New Listings
New Listings
Jul-223866161,002 Aug-22381608989
Jan-23268523791 Feb-23233 463 696
Sep-22304601905 Oct-22285532817 Nov-22289526815 Dec-22164371535
Listings 202120222023 Closed Sales SFH(YTD) 202120222023 Closed Sales CND(YTD) 202120222023 New Listings SFH(Feb) 202120222023 Closed Sales CND(Feb)
Page 8 of 34
SOURCE: Honolulu Board of REALTORS®, residential resales compiled from MLS data. ©2023.HonoluluBoardofREALTORS®.AllRightsReserved.Informationhereindeemedreliablebutnotguaranteed.
Pending Sales*
February 2023
OAHU, HAWAII
(Ameasureofcontractactivityrepresentedbyacountofpropertiesthathavehadoffersacceptedonthemduringagivenmonth)
Mo/Yr Single-Family HomesCondosTotal
Feb-20357449806
Mar-20316379695
Apr-20274234508
May-20337329666
Jun-20423454877
Jul-20422483905
Aug-20410493903
Sep-20389451840
Oct-20358484842
Nov-20394470864
Dec-20315438753
Jan-21329534863
Feb-21365572937
Mar-213706561,026
Apr-214507271,177
May-214316991,130
Jun-214226661,088
Jul-214336581,091
Aug-214156171,032
Sep-213986291,027
Oct-214006301,030
Nov-21367573940
Dec-21287511798
Jun-22305501806
Jul-22297484781
Aug-22312475787
Sep-22224436660
Oct-22198342540
Nov-22198359557
Dec-22168289457
Jan-23267378645
Feb-23217 399 616
*Methodologyupdatedasof2021toreflectacountofpropertiesthatenteredcontractwithinthegivenmonthandremaininescrowstatusattheendofthemonth(alsoappliedtohistoricaldatashownabove). PendingSales,inreportspriorto2021,reflectacountofalllistingsthatheldaPending(P)statusthroughoutthegivenmo nth.
SOURCE: Honolulu Board of REALTORS®, residential resales compiled from MLS data. ©2023.HonoluluBoardofREALTORS®.AllRightsReserved.Informationhereindeemedreliablebutnotguaranteed.
Monthly
Sales Year-to-Date
Feb-2231664395920213652.2%57227.4%20216941.3%1,10629.5% Mar-223846911,0752022316-13.4%64312.4%2022631-9.1%1,21710.0% Apr-223666631,029 2023217-31.3%399-37.9% 2023484-23.3%777-36.2%
Pending
Pending Sales Jan-22315574889FebruarySFHYoY%chgCNDYoY%chgFebruaryYTDSFHYoY%chgYTDCNDYoY%chg
May-22356601957
Listings 202120222023 Pending Sales SFH(YTD) 202120222023 Pending Sales CND(YTD) 202120222023 Pending Sales SFH(Feb) 202120222023 Pending Sales CND(Feb)
Page 9 of 34
Active Inventory*
February 2023
OAHU, HAWAII
(ThenumberofpropertiesinActive(A)statusattheendofthegivenmonth)
Mo/Yr Single-Family HomesCondosTotal
Feb-208141,7842,598
Mar-208251,8452,670
Apr-208041,8602,664
May-207971,8582,655
Jun-206831,8152,498
Jul-206421,8132,455
Aug-205651,7922,357
Sep-205291,7422,271
Oct-205211,7152,236
Nov-205031,6452,148
Dec-204191,4591,878
Jan-214171,3961,813
Feb-213501,3321,682
Mar-213791,2571,636
Apr-213811,1331,514
May-213379831,320
Jun-213771,0251,402
Jul-214159691,384
Aug-214169501,366
Jan-223119671,278
Feb-223489891,337
Mar-223609191,279
Apr-223959171,312
May-224719391,410
Jun-225279981,525
Jul-225761,0501,626
Aug-225961,0731,669
Sep-226291,1411,770
Oct-226561,1941,850
Nov-226821,2441,926
Dec-225971,1701,767
Jan-235511,1961,747
Feb-23547 1,1771,724
*Indicatormodifiedasof2021toreflectActivestatuslistingsonlyandappliedtohistoricalmonthlydatashownabove.Previousreportindicator,referredtoasActiveListings,reflectedallactivelymarketedlistingsinAandCstatus.
SOURCE: Honolulu Board of REALTORS®, residential resales compiled from MLS data. ©2023.HonoluluBoardofREALTORS®.AllRightsReserved.Informationhereindeemedreliablebutnotguaranteed.
Active Inventory
Sep-214371,0301,467FebruarySFHYoY%chgCNDYoY%chg Oct-214011,0391,4402021350-57.0%1,332-25.3% Nov-213661,0331,3992022348-0.6%989-25.8% Dec-213099461,255 202354757.2%1,17719.0%
Total Active Inventory: Single-Family Homes + Condos
Listings
Listings
Listings
Active202120222023
SFH(Feb) Active202120222023
CND(Feb)
Page 10 of 34
Total Inventory In Escrow*
February 2023
OAHU, HAWAII
(Thenumberofpropertiesundercontractattheendofthegivenmonth/combinedlistingsinCandPstatus)
Mo/Yr Single-Family HomesCondosTotal
Feb-206087101,318
Mar-205696001,169
Apr-20543455998
May-206255251,150
Jun-207036821,385
Jul-207427141,456
Aug-207487971,545
Sep-207027691,471
Oct-206937571,450
Nov-207118001,511
Dec-205757031,278
Jan-215968371,433
Feb-216979601,657
Mar-216919791,670
Apr-217391,0301,769
May-217931,1571,950
Jun-217541,0681,822
Jul-217351,0261,761
Aug-217279791,706
Total Inventory In Escrow
Total Inventory In Escrow: Single-Family Homes + Condos
Feb-225449461,490
Mar-226039801,583
Apr-225929561,548
May-225838561,439
Jun-225097281,237
Jul-224796761,155
Aug-224626541,116
Sep-22388590978
Oct-22345506851
Nov-22319512831
Dec-22278430708
Jan-23376523899
Feb-23386 592 978
*Newindicatoraddedtoreportsasof2021,includingapplicablehistoricaldata.
SOURCE:
Oct-216639351,598202169714.6%96035.2% Nov-216378991,5362022544-22.0%946-1.5% Dec-215287841,312 2023386-29.0%592-37.4% Jan-224987971,295
Sep-216609511,611FebruarySFHYoY%chgCNDYoY%chg
Listings 202120222023 Listings SFH(Feb) 202120222023 Listings CND(Feb)
Page 11 of 34
Honolulu Board of REALTORS®, residential resales compiled from MLS data. ©2023.HonoluluBoardofREALTORS®.AllRightsReserved.Informationhereindeemedreliablebutnotguaranteed.
Months Supply of Active Inventory*
February 2023
OAHU, HAWAII
(Comparesactiveinventorytoarolling12-monthaverageclosedsales)
Mo/Yr Single-Family HomesCondos
Feb-202.63.9
Mar-202.64.1
Apr-202.64.2
May-202.64.5
Jun-202.24.5
Jul-202.14.6
Aug-201.84.6
Sep-201.74.5 Oct-201.74.4
Nov-201.64.3
Dec-201.33.7
Jan-211.33.6
Aug-211.11.7 Months Supply of Active Inventory Active Inventory vs. Closed Sales Sep-211.21.8FebruarySFHYoY%chgCNDYoY%chg
Months202120222023 of Inventory
Jul-221.61.7
Aug-221.71.8
Sep-221.92.0
Oct-222.12.1
Nov-222.22.3
Dec-222.12.2
Jan-232.02.4
Feb-232.0 2.4
Months202120222023 of Inventory
*Methodologyupdatedasof2021(alsoappliedtohistoricaldatashownonthischart). MonthsofInventory,inreportspriorto2021,reflectacomparisonofactivelistingstoaveragependingsales.
SOURCE: Honolulu Board of REALTORS®, residential resales compiled from MLS data. ©2023.HonoluluBoardofREALTORS®.AllRightsReserved.Informationhereindeemedreliablebutnotguaranteed.
Feb-211.13.3 Mar-211.23.0 Apr-211.12.5 May-211.02.1 Jun-211.02.0 Jul-211.11.8
Oct-211.11.820211.1-57.7%3.3-15.4% Nov-211.01.720220.9-18.2%1.6-51.5% Dec-210.81.6 20232.0122.2%2.450.0% Jan-220.81.6 Feb-220.91.6 Mar-221.01.5 Apr-221.11.5
May-221.31.5 Jun-221.51.6
Months of Inventory
SFH(Feb)
CND(Feb)
Page 12 of 34
Housing Supply Overview
February 2023
OAHU, HAWAII
(Ayear-over-yearoverviewoftheavailabilityandsalesofpropertiesinagivenmonth,bypricerange)
SOURCE: Honolulu Board of REALTORS®, residential resales compiled from MLS data. ©2023.HonoluluBoardofREALTORS®.AllRightsReserved.Informationhereindeemedreliablebutnotguaranteed.
Single-Family HomesFeb-23Feb-22%chgFeb-23Feb-22%chgFeb-23Feb-22%chgFeb-23Feb-22%chgFeb-23Feb-22%chgFeb-23Feb-22%chgFeb-23Feb-22 %chgFeb-23Feb-22%chg $449,999 and below 30-34--102.6%--02-100.0%10-3250.0%67-14.3%1.50.5200.0% $450,000 - $599,999 67-14.3%7713492.3%91.9%100.0%-8.1%10911.1%17-85.7%219133.3%721-66.7%3.50.8337.5% $600,000 - $699,999 9812.5%5910490.0%97.1%100.0%-2.9%11837.5%12933.3%248200.0%221822.2%2.70.4575.0% $700,000 - $799,999 211540.0%759733.3%91.3%102.3%-10.8%1539-61.5%1828-35.7%383218.8%2946-37.0%1.80.8125.0% $800,000 - $899,999 28280.0%14137.7%98.9%103.7%-4.6%2541-39.0%2740-32.5%6619247.4%5266-21.2%1.90.3533.3% $900,000 - $999,999 2136-41.7%6014328.6%98.4%101.0%-2.6%3450-32.0%3353-37.7%493063.3%5983-28.9%1.30.6116.7% $1,000,000 - $1,499,999 4384-48.8%5212333.3%96.5%100.7%-4.2%64132-51.5%7598-23.5%1319735.1%122162-24.7%1.30.862.5% $1,500,000 - 1,999,999 1335-62.9%1113-15.4%97.5%100.0%-2.5%3442-19.0%2241-46.3%734273.8%4067-40.3%2.31.1109.1% $2,000,000 - $2,999,999 171241.7%5610460.0%91.1%105.2%-13.4%2530-16.7%1522-31.8%574235.7%2637-29.7%3.21.788.2% $3,000,000 and above 1216-25.0%353112.9%91.5%100.0%-8.5%15147.1%1318-27.8%856726.9%2337-37.8%6.54.544.4% All Single-Family Homes173241-28.2%4713261.5%96.0%100.8%-4.8%233367-36.5%217316-31.3%54734857.2%386544-29.0%2.00.9122.2% Condos Feb-23Feb-22%chgFeb-23Feb-22%chgFeb-23Feb-22%chgFeb-23Feb-22%chgFeb-23Feb-22%chgFeb-23Feb-22%chgFeb-23Feb-22%chgFeb-23Feb-22%chg $149,999 and below 1021-52.4%21210.0%95.2%97.1%-2.0%20195.3%1617-5.9%413517.1%2633-21.2%2.91.681.3% $150,000 - $299,999 4169-40.6%282040.0%97.5%98.9%-1.4%5198-48.0%4269-39.1%144169-14.8%61107-43.0%2.41.833.3% $300,000 - $399,999 6673-9.6%321968.4%98.0%100.0%-2.0%67110-39.1%65116-44.0%1231211.7%92164-43.9%1.61.233.3% $400,000 - $499,999 6782-18.3%271850.0%99.0%100.0%-1.0%87127-31.5%65116-44.0%15912230.3%95173-45.1%1.81.163.6% $500,000 - $599,999 3859-35.6%357400.0%97.4%100.0%-2.6%64102-37.3%60102-41.2%1079413.8%90140-35.7%1.41.040.0% $600,000 - $699,999 2958-50.0%3110210.0%98.4%101.5%-3.1%4382-47.6%4869-30.4%1228937.1%7194-24.5%2.31.376.9% $700,000 - $999,999 4879-39.2%231291.7%98.4%100.7%-2.3%81123-34.1%6397-35.1%21514746.3%97143-32.2%2.51.747.1% $1,000,000 - $1,499,999 1430-53.3%604825.0%95.9%97.2%-1.3%2539-35.9%1830-40.0%1078525.9%3351-35.3%4.52.955.2% $1,500,000 - $1,999,999 58-37.5%543650.0%91.8%98.9%-7.2%1321-38.1%1415-6.7%725238.5%1722-22.7%9.06.538.5% $2,000,000 and above 770.0%5261-14.8%100.0%93.6%6.8%1218-33.3%812-33.3%877516.0%1019-47.4%9.78.316.9% All Condos 325486-33.1%2814100.0%98.0%100.0%-2.0%463739-37.3%399643-37.9%1,17798919.0%592946-37.4%2.41.650.0% Active Inventory Active Inventory Closed SalesMedian Days on Market Percent of Original List Price ReceivedPending Sales Closed SalesMedian Days on Market Percent of Original List Price ReceivedPending Sales New Listings New Listings In Escrow Months Supply of Active Inventory Total Inventory In Escrow Months Supply of Active Inventory Total Inventory
Page 13 of 34
Closed Sales by Price Range: Single-Family Homes
February 2023
OAHU, HAWAII
(Acountofpropertiesthathaveclosedinagivenmonth) Single-Family


$449,999andbelow30-2851-45.1%
$450,000-$599,99967-14.3%69138-50.0%
$600,000-$699,9999812.5%104256-59.4%
$700,000-$799,999211540.0%247486-49.2%
$800,000-$899,99928280.0%412656-37.2%
$900,000-$999,9992136-41.7%448610-26.6% $1,000,000-$1,499,9994384-
$2,000,000-$2,999,999171241.7%215295-27.1%
$3,000,000andabove1216-25.0%150184-18.5%
All Single-Family Homes 173241-28.2%3,2304,542-28.9% This12-monthperiodreflectstheconsecutive12-monthperiodupthroughthecurrentmonth,whilelastperiod reflectsthesame12-monthperiodoneyearprior.
SOURCE: Honolulu Board of REALTORS®, residential resales compiled from MLS data. ©2023.HonoluluBoardofREALTORS®.AllRightsReserved.Informationhereindeemedreliablebutnotguaranteed.
HomesFeb-23Feb-22%chg 12-mth Total This Period 12-mth Total Last Period %chg
48.8%1,1701,381-15.3%
$1,500,000-1,999,9991335-62.9%387485-20.2%
Page 14 of 34
Closed Sales by Price Range: Condos
February 2023
OAHU, HAWAII
(Acountofpropertiesthathaveclosedinagivenmonth)
$149,999andbelow1021-52.4%168260-35.4%
$150,000-$299,9994169-40.6%7201,129-36.2%
$300,000-$399,9996673-9.6%9481,183-19.9%
$400,000-$499,9996782-18.3%1,0301,324-22.2%
$500,000-$599,9993859-35.6%8821,076-18.0%
$600,000-$699,9992958-50.0%640843-24.1%
$700,000-$999,9994879-39.2%1,0241,038-1.3%
$1,000,000-$1,499,9991430-53.3%292344-15.1%
$1,500,000-$1,999,99958-37.5%101938.6%
$2,000,000andabove770.0%110113-2.7%
All Condos 325486-33.1%5,9157,403-20.1% This12-monthperiodreflectstheconsecutive12-monthperiodupthroughthecurrentmonth,whilelastperiod reflectsthesame12-monthperiodoneyearprior.
SOURCE: Honolulu Board of REALTORS®, residential resales compiled from MLS data. ©2023.HonoluluBoardofREALTORS®.AllRightsReserved.Informationhereindeemedreliablebutnotguaranteed.
Condos Feb-23Feb-22%chg 12-mth Total This Period 12-mth Total Last Period %chg
Page 15 of 34
Median Days on Market by Price Range: Single-Family Homes
February 2023
OAHU, HAWAII
(Themediannumberofdaysfromwhenapropertyisfirstlistedtowhenanofferisaccepted)
$449,999andbelow34--1015-33.3%
$450,000-$599,9997713492.3%16977.8%
$600,000-$699,9995910490.0%181080.0%
$700,000-$799,999759733.3%189100.0%
$800,000-$899,99914137.7%12933.3%
$900,000-$999,9996014328.6%11922.2%
$1,000,000-$1,499,9995212333.3%111010.0%
$1,500,000-1,999,9991113-15.4%121020.0%
$2,000,000-$2,999,9995610460.0%13128.3%
$3,000,000andabove353112.9%2833-15.2%
All Single-Family Homes 4713261.5%121020.0%
This12-monthperiodreflectstheconsecutive12-monthperiodupthroughthecurrentmonth,whilelastperiod reflectsthesame12-monthperiodoneyearprior.
SOURCE: Honolulu Board of REALTORS®, residential resales compiled from MLS data. ©2023.HonoluluBoardofREALTORS®.AllRightsReserved.Informationhereindeemedreliablebutnotguaranteed.
12-mth Median This Period 12-mth Median Last Period %chg
Single-Family HomesFeb-23Feb-22%chg
Page 16 of 34
Median Days on Market by Price Range: Condos
February 2023
OAHU, HAWAII
(Themediannumberofdaysfromwhenapropertyisfirstlistedtowhenanofferisaccepted) Condos
$149,999andbelow21210.0%2735-22.9%
$150,000-$299,999282040.0%1824-25.0%
$300,000-$399,999321968.4%1314-7.1%
$400,000-$499,999271850.0%121020.0%
$500,000-$599,999357400.0%11922.2%
$600,000-$699,9993110210.0%12933.3%
$700,000-$999,999231291.7%111010.0%
$1,000,000-$1,499,999604825.0%21205.0%
$1,500,000-$1,999,999543650.0%3237-13.5%
$2,000,000andabove5261-14.8%3846-17.4%
All Condos 2814100.0%131118.2%
This12-monthperiodreflectstheconsecutive12-monthperiodupthroughthecurrentmonth,whilelastperiod reflectsthesame12-monthperiodoneyearprior.
SOURCE: Honolulu Board of REALTORS®, residential resales compiled from MLS data. ©2023.HonoluluBoardofREALTORS®.AllRightsReserved.Informationhereindeemedreliablebutnotguaranteed.

Feb-23Feb-22%chg 12-mth Median This Period 12-mth Median Last Period %chg
Page 17 of 34
Median
Percent of

February 2023
OAHU, HAWAII
Original List Price
Received by Price Range: Single-Family Homes
(Thepercentagefoundwhendividingaproperty'ssalespricebytheoriginallistprice;reportedpercentageisthemedianofallsalesfortheperiodandpricerangeindicated)
SOURCE: Honolulu Board of REALTORS®, residential resales compiled from MLS data. ©2023.HonoluluBoardofREALTORS®.AllRightsReserved.Informationhereindeemedreliablebutnotguaranteed.
Single-Family HomesFeb-23Feb-22%chg 12-mth Median This Period 12-mth Median Last Period %chg $449,999andbelow102.6%--100.0%100.0%0.0% $450,000-$599,99991.9%100.0%-8.1%97.4%100.9%-3.5% $600,000-$699,99997.1%100.0%-2.9%100.0%101.0%-1.0% $700,000-$799,99991.3%102.3%-10.8%100.0%103.0%-2.9% $800,000-$899,99998.9%103.7%-4.6%100.0%103.5%-3.4% $900,000-$999,99998.4%101.0%-2.6%100.2%102.9%-2.6% $1,000,000-$1,499,99996.5%100.7%-4.2%100.0%103.0%-2.9% $1,500,000-1,999,99997.5%100.0%-2.5%100.1%101.7%-1.6% $2,000,000-$2,999,99991.1%105.2%-13.4%100.0%100.0%0.0% $3,000,000andabove91.5%100.0%-8.5%97.3%97.0%0.3% All Single-Family Homes
96.0%100.8%-4.8%100.0%102.2%-2.2% This12-monthperiodreflectstheconsecutive12-monthperiodupthroughthecurrentmonth,whilelastperiod reflectsthesame12-monthperiodoneyearprior.
Page 18 of 34
Median Percent of Original List Price Received by Price Range: Condos
February 2023
OAHU, HAWAII
(Thepercentagefoundwhendividingaproperty'ssalespricebytheoriginallistprice;reportedpercentageisthemedianofallsalesfortheperiodandpricerangeindicated)

All Condos 98.0%100.0%-2.0%100.0%100.0%0.0% This12-monthperiodreflectstheconsecutive12-monthperiodupthroughthecurrentmonth,whilelastperiod reflectsthesame12-monthperiodoneyearprior.
SOURCE: Honolulu Board of REALTORS®, residential resales compiled from MLS data. ©2023.HonoluluBoardofREALTORS®.AllRightsReserved.Informationhereindeemedreliablebutnotguaranteed.
Condos Feb-23Feb-22%chg 12-mth Median This Period 12-mth Median Last Period %chg $149,999andbelow95.2%97.1%-2.0%96.1%95.7%0.4% $150,000-$299,99997.5%98.9%-1.4%98.7%98.0%0.7% $300,000-$399,99998.0%100.0%-2.0%100.0%99.2%0.8% $400,000-$499,99999.0%100.0%-1.0%100.0%100.0%0.0% $500,000-$599,99997.4%100.0%-2.6%100.0%100.0%0.0% $600,000-$699,99998.4%101.5%-3.1%100.0%101.2%-1.2% $700,000-$999,99998.4%100.7%-2.3%100.0%100.0%0.0%
$1,000,000-$1,499,99995.9%97.2%-1.3%97.6%98.2%-0.6% $1,500,000-$1,999,99991.8%98.9%-7.2%97.0%96.1%0.9% $2,000,000andabove100.0%93.6%6.8%95.7%96.0%-0.3%
Page 19 of 34
New Listings by Price Range: Single-Family Homes
February 2023
OAHU, HAWAII
(Acountofpropertiesthathavebeennewlylistedonthemarketinagivenmonth)
$449,999andbelow02-100.0%2750-46.0%
$450,000-$599,99910911.1%77161-52.2%
$600,000-$699,99911837.5%163305-46.6%
$700,000-$799,9991539-61.5%298557-46.5%
$800,000-$899,9992541-39.0%506691-26.8%
$900,000-$999,9993450-32.0%566667-15.1%
$1,000,000-$1,499,99964132-51.5%1,2501,306-4.3%
$1,500,000-1,999,9993442-19.0%5095001.8%
$2,000,000-$2,999,9992530-16.7%308310-0.6%
$3,000,000andabove15147.1%2782703.0%
All Single-Family Homes233367-36.5%3,9824,817-17.3%
This12-monthperiodreflectstheconsecutive12-monthperiodupthroughthecurrentmonth,whilelastperiod reflectsthesame12-monthperiodoneyearprior.
SOURCE: Honolulu Board of REALTORS®, residential resales compiled from MLS data. ©2023.HonoluluBoardofREALTORS®.AllRightsReserved.Informationhereindeemedreliablebutnotguaranteed.
12-mth Total This Period 12-mth Total Last Period %chg
Single-Family HomesFeb-23Feb-22%chg
Page 20 of 34
New Listings by Price Range: Condos February 2023
OAHU, HAWAII
(Acountofpropertiesthathavebeennewlylistedonthemarketinagivenmonth)
$149,999andbelow20195.3%186248-25.0%
$150,000-$299,9995198-48.0%8521,173-27.4%
$300,000-$399,99967110-39.1%1,0671,370-22.1%
$400,000-$499,99987127-31.5%1,1531,467-21.4%
$500,000-$599,99964102-37.3%9591,176-18.5%
$600,000-$699,9994382-47.6%776935-17.0%
$700,000-$999,99981123-34.1%1,2651,13611.4%
$1,000,000-$1,499,9992539-35.9%413421-1.9%
$1,500,000-$1,999,9991321-38.1%19016813.1%
$2,000,000andabove1218-33.3%188205-8.3%
All Condos 463739-37.3%7,0498,299-15.1% This12-monthperiodreflectstheconsecutive12-monthperiodupthroughthecurrentmonth,whilelastperiod reflectsthesame12-monthperiodoneyearprior.
SOURCE: Honolulu Board of REALTORS®, residential resales compiled from MLS data. ©2023.HonoluluBoardofREALTORS®.AllRightsReserved.Informationhereindeemedreliablebutnotguaranteed.
Condos Feb-23Feb-22%chg 12-mth Total This Period 12-mth Total Last Period %chg
Page 21 of 34
Pending Sales by Price Range: Single-Family Homes
February 2023
OAHU, HAWAII
(Ameasureofcontractactivity/acountofpropertiesthathavehadoffersacceptedontheminagivenmonth)

$449,999andbelow10-3356-41.1%
$450,000-$599,99917-85.7%72172-58.1%
$600,000-$699,99912933.3%156334-53.3%
$700,000-$799,9991828-35.7%287532-46.1%
$800,000-$899,9992740-32.5%456692-34.1%
$900,000-$999,9993353-37.7%484676-28.4%
$2,000,000-$2,999,9991522-31.8%208254-18.1%
$3,000,000andabove1318-27.8%134185-27.6%
All Single-Family Homes 217316-31.3%3,2924,604-28.5%
This12-monthperiodreflectstheconsecutive12-monthperiodupthroughthecurrentmonth,whilelastperiod reflectsthesame12-monthperiodoneyearprior.
SOURCE: Honolulu Board of REALTORS®, residential resales compiled from MLS data. ©2023.HonoluluBoardofREALTORS®.AllRightsReserved.Informationhereindeemedreliablebutnotguaranteed.
Single-Family HomesFeb-23Feb-22%chg 12-mth Total This Period 12-mth Total Last Period %chg
23.5%1,1151,241-10.2% $1,500,000-1,999,9992241-46.3%347462-24.9%
$1,000,000-$1,499,9997598-
Page 22 of 34
Pending Sales by Price Range: Condos
February 2023
OAHU, HAWAII
(Ameasureofcontractactivity/acountofpropertiesthathavehadoffersacceptedontheminagivenmonth)

$300,000-$399,99965116-44.0%9521,320-27.9%
$400,000-$499,99965116-44.0%9851,418-30.5%
$500,000-$599,99960102-41.2%7931,091-27.3%
$600,000-$699,9994869-30.4%649869-25.3%
$700,000-$999,9996397-35.1%912958-4.8%
$1,000,000-$1,499,9991830-40.0%259329-21.3%
$1,500,000-$1,999,9991415-6.7%99112-11.6%
$2,000,000andabove812-33.3%97126-23.0%
All Condos 399643-37.9%5,6187,583-25.9% This12-monthperiodreflectstheconsecutive12-monthperiodupthroughthecurrentmonth,whilelastperiod reflectsthesame12-monthperiodoneyearprior.
SOURCE: Honolulu Board of REALTORS®, residential resales compiled from MLS data. ©2023.HonoluluBoardofREALTORS®.AllRightsReserved.Informationhereindeemedreliablebutnotguaranteed.
Condos Feb-23Feb-22%chg 12-mth Total This Period 12-mth Total Last Period %chg
$149,999andbelow1617-5.9%171258-33.7%
$150,000-$299,9994269-39.1%7011,102-36.4%
Page 23 of 34
Active Inventory* by Price Range: Single-Family Homes
February 2023
OAHU, HAWAII
(Thenumberofpropertiesactiveonmarketattheendofagivenmonth)
Single-Family HomesFeb-23Feb-22YOY chg
$449,999andbelow3250.0%
$450,000-$599,999219133.3%
$600,000-$699,999248200.0%
$700,000-$799,999383218.8%
$800,000-$899,9996619247.4%
$900,000-$999,999493063.3%
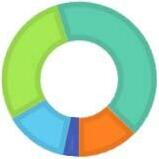
Active Inventory - Percent Share by Price Range (portionoftotalactivestatuslistingsrepresentedbyagivenpricerange)
$1,000,000-$1,499,9991319735.1%
$1,500,000-1,999,999734273.8%
$2,000,000-$2,999,999574235.7%
$3,000,000andabove856726.9%
All Single-Family Homes 54734857.2%
*Indicatormodifiedasof2021toreflectActivestatuslistingsonlyandappliedtohistoricalmonthlydatashownabove.Previousreportindicator,referredtoasActiveListings,reflectedallactivelymarketedlistingsinAandCstatus.
SOURCE: Honolulu Board of REALTORS®, residential resales compiled from MLS data. ©2023.HonoluluBoardofREALTORS®.AllRightsReserved.Informationhereindeemedreliablebutnotguaranteed.
Page 24 of 34
Active Inventory* by Price Range: Condos
February 2023
OAHU, HAWAII
(Thenumberofpropertiesactiveonmarketattheendofagivenmonth)
Condos Feb-23Feb-22YOY chg
$149,999andbelow413517.1%
$150,000-$299,999144169-14.8%
$300,000-$399,9991231211.7%
$400,000-$499,99915912230.3%
$500,000-$599,9991079413.8%
$600,000-$699,9991228937.1%
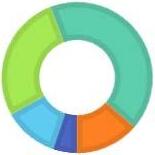
Active Inventory - Percent Share by Price Range (portionoftotalactivestatuslistingsrepresentedbyagivenpricerange)
$700,000-$999,99921514746.3%
$1,000,000-$1,499,9991078525.9%
$1,500,000-$1,999,999725238.5%
$2,000,000andabove877516.0%
All Condos 1,17798919.0%
*Indicatormodifiedasof2021toreflectActivestatuslistingsonlyandappliedtohistoricalmonthlydatashownabove.Previousreportindicator,referredtoasActiveListings,reflectedallactivelymarketedlistingsinAandCstatus.
SOURCE: Honolulu Board of REALTORS®, residential resales compiled from MLS data. ©2023.HonoluluBoardofREALTORS®.AllRightsReserved.Informationhereindeemedreliablebutnotguaranteed.
Page 25 of 34
Listings Lisings


Condos
*Indicatormodifiedasof2021toreflectActivestatuslistingsonlyandappliedtohistoricalmonthlydatashownabove.Previousreportindicator,referredtoasActiveListings,reflectedallactivelymarketedlistingsinAandCstatus.
SOURCE: Honolulu Board of REALTORS®, residential resales compiled from MLS data. ©2023.HonoluluBoardofREALTORS®.AllRightsReserved.Informationhereindeemedreliablebutnotguaranteed.
Single-Family Homes 350379381337377415416437401366309311348360395471527576596629656682597551547
Active Inventory*: Single-Family Homes and Condos February 2023 OAHU, HAWAII
Page 26 of 34
Total Inventory In Escrow* by Price Range: Single-Family Homes February 2023
OAHU, HAWAII
(Thenumberofpropertiesinanescrowstatusattheendofagivenmonth)
Single-Family HomesFeb-23Feb-22YOY chg
$449,999andbelow67-14.3%
$450,000-$599,999721-66.7%
$600,000-$699,999221822.2%
$700,000-$799,9992946-37.0%
$800,000-$899,9995266-21.2%
$900,000-$999,9995983-28.9%
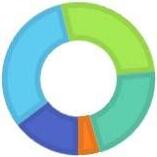
Total Inventory In Escrow - Percent Share by Price Range
(portionoftotalinventoryinescrowrepresentedbyagivenprice range)
$1,000,000-$1,499,999122162-24.7%
$1,500,000-1,999,9994067-40.3%
$2,000,000-$2,999,9992637-29.7%
$3,000,000andabove2337-37.8%
All Single-Family Homes 386544-29.0%
*Newindicatoraddedtoreportsasof2021,includingapplicablehistoricaldata.
SOURCE: Honolulu Board of REALTORS®, residential resales compiled from MLS data. ©2023.HonoluluBoardofREALTORS®.AllRightsReserved.Informationhereindeemedreliablebutnotguaranteed.
Page 27 of 34
Total Inventory In Escrow* by Price Range: Condos
February 2023
OAHU, HAWAII
(Thenumberofpropertiesinanescrowstatusattheendofagivenmonth)
Condos Feb-23Feb-22YOY chg
$149,999andbelow2633-21.2%
$150,000-$299,99961107-43.0%
$300,000-$399,99992164-43.9%
$400,000-$499,99995173-45.1%
$500,000-$599,99990140-35.7%
$600,000-$699,9997194-24.5%
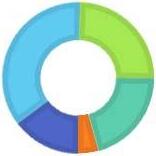
Total Inventory In Escrow - Percent Share by Price Range
(portionoftotalinventoryinescrowrepresentedbyagivenprice range)
$700,000-$999,99997143-32.2%
$1,000,000-$1,499,9993351-35.3%
$1,500,000-$1,999,9991722-22.7%
$2,000,000andabove1019-47.4%
All Condos 592946-37.4%
*Newindicatoraddedtoreportsasof2021,includingapplicablehistoricaldata.
SOURCE: Honolulu Board of REALTORS®, residential resales compiled from MLS data. ©2023.HonoluluBoardofREALTORS®.AllRightsReserved.Informationhereindeemedreliablebutnotguaranteed.

Page 28 of 34
Months Supply of Active Inventory by Price Range: Single-Family Homes
February 2023
OAHU, HAWAII
(Comparesactiveinventorytoarolling12-monthaverageclosedsales)
Single-Family HomesFeb-23Feb-22YOY chg
$449,999andbelow1.50.5200.0%
$450,000-$599,9993.50.8337.5%
$600,000-$699,9992.70.4575.0%
$700,000-$799,9991.80.8125.0%
$800,000-$899,9991.90.3533.3%
$900,000-$999,9991.30.6116.7%
$1,000,000-$1,499,9991.30.862.5%
$1,500,000-1,999,9992.31.1109.1%
$2,000,000-$2,999,9993.21.788.2%
Months of Inventory
$3,000,000andabove6.54.544.4%
All Single-Family Homes 2.00.9122.2%
SOURCE: Honolulu Board of REALTORS®, residential resales compiled from MLS data. ©2023.HonoluluBoardofREALTORS®.AllRightsReserved.Informationhereindeemedreliablebutnotguaranteed.
Page 29 of 34
Months Supply of Active Inventory by Price Range: Condos
February 2023
OAHU, HAWAII
(Comparesactiveinventorytoarolling12-monthaverageclosedsales)
Condos Feb-23Feb-22YOY chg
$149,999andbelow2.91.681.3%
$150,000-$299,9992.41.833.3%
$300,000-$399,9991.61.233.3%
$400,000-$499,9991.81.163.6%
$500,000-$599,9991.41.040.0%
$600,000-$699,9992.31.376.9%
$700,000-$999,9992.51.747.1%
$1,000,000-$1,499,9994.52.955.2%
$1,500,000-$1,999,9999.06.538.5%
Months of Inventory
$2,000,000andabove9.78.316.9%
All Condos 2.41.650.0%
SOURCE: Honolulu Board of REALTORS®, residential resales compiled from MLS data. ©2023.HonoluluBoardofREALTORS®.AllRightsReserved.Informationhereindeemedreliablebutnotguaranteed.
Page 30 of 34
Page 31 of 34
Page 32 of 34

Page 33 of 34
Page 34 of 34
