Oahu Monthly Housing Statistics
March 2023

Monthly Indicators 2 Median Sales Price YoY %chg Price Graphs 3-4 $1,083,750-5.8% Closed Sales 5 Closed Sales YoY %chg Median Sales Price6 Average Sales Price 7 236 -26.5% Median Days on Market 8 Percent of Original List Price Received 9 Average Sales Price YoY %chg New Listings10 Pending Sales 11 $1,391,538-11.4% Active Inventory 12 Total Inventory In Escrow 13 Months Supply of Active Inventory 14 Housing Supply Overview 15 Median Sales Price YoY %chg Closed Sales (by price range)16-17 Median Days on Market (by price range) 18-19 $536,000+4.0% Percent of Original List Price Received (by price range)20-21 New Listings (by price range) 22-23 Closed Sales YoY %chg Pending Sales (by price range)24-25 Active Inventory (by price range) 26-27 444 -33.9% Active Inventory History 28 Total Inventory In Escrow (by price range) 29-30 Average Sales Price YoY %chg Months Supply of Active Inventory (by price range)31-32 $651,630+4.5% Historical Graphs 33-34 YoY % chg = year-over-year percent change comparing current month to the same month last year. SOURCE: Honolulu Board of REALTORS®, residential resales data compiled from HiCentral MLS, Ltd.® ©2023. Honolulu Board of REALTORS®. All Rights Reserved. Information herein deemed reliable but not guaranteed. CONTENTS: CONDOS
SINGLE-FAMILY HOMES
Monthly Indicators OAHU, HAWAII
*seefootnotesonpages9-12regardingmethodologyupdatesYoY%chg=year-over-yearpercentchangecomparingcurrentmonthtothesamemonthlastyear. MoM%chg=month-over-monthpercentchangecomparingcurrentmonthtothepreviousmonth.
*seefootnotesonpages9-12regardingmethodologyupdates1-yr%chg=percentchangecomparingthecurrentYTDtimeperiodtothesameYTDtimeperiodoneyearago. 2-yr%chg=percentchangecomparingthecurrentYTDtimeperiodtothesameYTDtimeperiodtwoyearsago.
SOURCE: Honolulu Board of REALTORS®, residential resales compiled from MLS data. ©2023.HonoluluBoardofREALTORS®.AllRightsReserved.Informationhereindeemedreliablebutnotguaranteed.
March 2023 Mar-23 Mar-22YoY %chgFeb-23MoM %chg Mar-23 Mar-22YoY %chgFeb-23MoM %chg Closed Sales 236 321-26.5%17336.4% 444 672-33.9%32536.6% Median Sales Price $1,083,750 $1,150,000-5.8%$987,0009.8% $536,000 $515,5004.0%$480,00011.7% Average Sales Price $1,391,538 $1,570,668-11.4%$1,427,864-2.5% $651,630 $623,6844.5%$592,13110.0% Median Days on Market 36 9300.0%47-23.4% 24 9166.7%28-14.3% Percent of Orig. List Price Received 96.7% 102.0%-5.2%96.0%0.7% 98.5% 100.0%-1.5%98.0%0.5% New Listings 293 412-28.9%23325.8% 530 714-25.8%46314.5% Pending Sales* 258 384-32.8%21718.9% 444 691-35.7%39911.3% Active Inventory* 541 36050.3%547-1.1% 1,152 91925.4%1,177-2.1% Total Inventory in Escrow* 393 603-34.8%3861.8% 602 980-38.6%5921.7% Months Supply of Active Inventory* 2.1 1.0110.0%2.05.0% 2.4 1.560.0%2.40.0%
Year-to-Date YTD-2023 YTD-20221-yr %chgYTD-20212-yr %chg YTD-2023 YTD-20221-yr %chgYTD-20212-yr %chg Closed Sales 559 888-37.0%912-38.7% 1,044 1,710-38.9%1,464-28.7% Median Sales Price $1,025,000 $1,100,000-6.8%$915,00012.0% $500,000 $510,000-2.0%$455,0009.9% Average Sales Price $1,335,094 $1,437,670-7.1%$1,154,14115.7% $627,071 $612,6422.4%$525,56319.3% Median Days on Market 36 11227.3%9300.0% 25 11127.3%1747.1% Percent of Orig. List Price Received 96.5% 101.5%-4.9%100.4%-3.9% 98.3% 100.0%-1.7%98.9%-0.6% New Listings 794 1,099-27.8%1,126-29.5% 1,516 2,119-28.5%1,997-24.1% Pending Sales* 742 1,015-26.9%1,064-30.3% 1,221 1,908-36.0%1,762-30.7%
Single-Family Homes Condos Single-Family Homes Condos

1 4 15 14 32 32 21 22 15 16 9 8 10 1 4 6 16 10 3 6 5 12 44 54 26 21 21 22 21 13 7 9 5 9 16 27 0 10 20 30 40 50 60 Closed Sales Sold Price ($) Single-Family Homes Sold March 2023 vs. March 2022 2023 2022 SOURCE: Honolulu Board of REALTORS®, compiled from MLS data. ©2023. Honolulu Board of REALTORS®. All Rights Reserved. Information herein deemed reliable but not guaranteed. Page 3 of 34
9 19 31 54 80 66 64 39 14 16 46 6 4 28 61 96 122 113 67 70 28 21 49 13 0 20 40 60 80 100 120 140 Closed Sales Sold Price ($) Condos Sold March 2023 vs. March 2022 2023 2022 SOURCE: Honolulu Board of REALTORS®, compiled from MLS data. ©2023. Honolulu Board of REALTORS®. All Rights Reserved. Information herein deemed reliable but not guaranteed. Page 4 of 34
Closed Sales
March 2023
OAHU,
(Acountofpropertiesthathaveclosedinagivenmonth)

Mo-Yr
Mar-20303410713
Apr-20248343591
May-20248254502
Jun-20302312614
Jul-20361426787
Aug-20370409779
Sep-20391456847
Oct-20345480825
Nov-20338407745
Dec-20420514934
Jan-21291392683
Feb-21260446706
Mar-21361626987
Apr-213756451,020
May-214055981,003
Jun-214517301,181
Jul-214046711,075
Aug-214256751,100
Sep-214246151,039
SOURCE: Honolulu Board of REALTORS®, residential resales compiled from MLS data. ©2023.HonoluluBoardofREALTORS®.AllRightsReserved.Informationhereindeemedreliablebutnotguaranteed.
HAWAII
Single-Family HomesCondosTotal
Jan-22326552878 Monthly Closed Sales Year-to-Date Closed Sales Feb-22241486727MarchSFHYoY%chgCNDYoY%chgMarchYTDSFHYoY%chgYTDCNDYoY%chg Mar-22321672993202136119.1%62652.7%202191211.9%1,46432.5% Apr-223656721,0372022321-11.1%6727.3%2022888-2.6%1,71016.8% May-223446881,032 2023236-26.5%444-33.9% 2023 559-37.0%1,044-38.9% Jun-22357626983 Jul-22312518830 Aug-22314508822 Sep-22278496774 Oct-22222435657 Nov-22192340532 Dec-22202360562 Jan-23150275425 Feb-23173325498 Mar-23236 444 680
Oct-21381611992 Nov-21371601972 Dec-21378593971
0 100 200 300 400 500 600 700 800 Sales Closed Sales Single-Family Homes Condos 0 200 400 600 800 1,000 202120222023 Closed Sales SFH(YTD) 0 500 1,000 1,500 2,000 202120222023 Closed Sales CND(YTD) 0 100 200 300 400 202120222023 Closed Sales SFH(Mar) 0 200 400 600 800 202120222023 Closed Sales CND(Mar)
Median Sales Price
March 2023
OAHU, HAWAII
(Themediansalespriceofallclosedpropertiesinagivenmonth)
Mo/Yr Single-Family HomesCondos
Mar-20$810,000$435,000
Apr-20$809,000$450,000
May-20$797,000$399,000
Jun-20$770,000$421,500
Jul-20$815,000$440,000
Aug-20$839,000$430,000
Sep-20$880,000$445,000
Oct-20$865,000$439,500
Nov-20$872,500$420,000
Dec-20$870,000$455,000
Jan-21$883,000$452,000
Feb-21$917,500$457,500
Mar-21$950,000$451,000
Apr-21$928,000$450,000
May-21$978,000$457,750
Jun-21$979,000$460,000
Jul-21$992,500$475,000
Aug-21$1,050,000$500,000
Sep-21$1,050,000$478,000
Oct-21$1,000,000$500,000
Nov-21$1,050,000$500,000
Dec-21$1,050,000$485,000
Jan-22$1,050,000$510,000 Monthly Median Sales Price
SOURCE: Honolulu Board of REALTORS®, residential resales compiled from MLS data. ©2023.HonoluluBoardofREALTORS®.AllRightsReserved.Informationhereindeemedreliablebutnotguaranteed.
Year-to-Date Median Sales Price
Feb-22$1,125,000$497,000MarchSFHYoY%chgCNDYoY%chgMarchYTDSFHYoY%chgYTDCNDYoY%chg Mar-22$1,150,000$515,5002021$950,00017.3%$451,0003.7%2021$915,00017.3%$455,0005.8% Apr-22$1,105,000$510,0002022$1,150,00021.1%$515,50014.3%2022$1,100,00020.2%$510,00012.1% May-22$1,153,500$516,500 2023$1,083,750-5.8%$536,0004.0% 2023 $1,025,000-6.8%$500,000-2.0% Jun-22$1,100,000$534,000 Jul-22$1,107,944$500,000 Aug-22$1,125,500$498,500 Sep-22$1,100,000$502,500 Oct-22$1,050,000$520,000 Nov-22$1,149,500$480,000 Dec-22$1,049,500$502,500 Jan-23$970,000$495,000 Feb-23$987,000$480,000 Mar-23$1,083,750$536,000
$0 $200,000 $400,000 $600,000 $800,000 $1,000,000 $1,200,000 $1,400,000 Price ($) Median Sales Price
0K 200K 400K 600K 800K 1.0M 1.2M 202120222023 Price ($) SFH(YTD) 0K 100K 200K 300K 400K 500K 600K 202120222023 Price ($) CND(YTD) 0K 500K 1.0M 1.5M 202120222023 Price ($) SFH(Mar) 0K 100K 200K 300K 400K 500K 600K 202120222023 Price ($) CND(Mar)
Single-Family Homes Condos
Average Sales Price
March 2023
OAHU, HAWAII
(Theaveragesalespriceofallclosedpropertiesinagivenmonth)
Mo/Yr Single-Family HomesCondos
Mar-20$972,367$528,606
Apr-20$941,708$521,484
May-20$1,003,419$453,220
Jun-20$899,271$481,220
Jul-20$1,016,491$475,346
Aug-20$1,022,449$527,573
Sep-20$1,073,692$545,367
Oct-20$1,065,594$479,736
Nov-20$1,084,834$472,726
Dec-20$1,113,076$504,222
Jan-21$1,050,263$496,296
Feb-21$1,172,804$545,629
Mar-21$1,226,827$530,257
Apr-21$1,194,150$520,192
May-21$1,246,611$555,798
Jun-21$1,225,011$557,302
Jul-21$1,265,382$544,064
Aug-21$1,316,681$618,612
Sep-21$1,289,510$558,002
Oct-21$1,335,171$582,509
Nov-21$1,296,551$559,007
Dec-21$1,303,481$604,749
Average Sales Price
SOURCE: Honolulu Board of REALTORS®, residential resales compiled from MLS data. ©2023.HonoluluBoardofREALTORS®.AllRightsReserved.Informationhereindeemedreliablebutnotguaranteed.
Jan-22$1,277,309$623,928 Monthly Average Sales Price Year-to-Date Average Sales Price Feb-22$1,486,088$583,367MarchSFHYoY%chgCNDYoY%chgMarchYTDSFHYoY%chgYTDCNDYoY%chg Mar-22$1,570,668$623,6842021$1,226,82726.2%$530,2570.3%2021$1,154,14121.7%$525,5630.8% Apr-22$1,404,481$613,1892022$1,570,66828.0%$623,68417.6%2022$1,437,67024.6%$612,64216.6% May-22$1,450,008$625,327 2023$1,391,538-11.4%$651,6304.5% 2023$1,335,094 -7.1%$627,0712.4% Jun-22$1,382,559$631,822 Jul-22$1,329,023$590,934 Aug-22$1,341,958$547,319 Sep-22$1,307,249$607,502 Oct-22$1,243,960$676,988 Nov-22$1,387,685$594,444 Dec-22$1,325,156$576,689 Jan-23$1,139,294$633,441 Feb-23$1,427,864$592,131 Mar-23$1,391,538$651,630
$0 $200,000 $400,000 $600,000 $800,000 $1,000,000 $1,200,000 $1,400,000 $1,600,000 $1,800,000 Price ($)
Single-Family Homes Condos 0K 500K 1.0M 1.5M 2.0M 202120222023 Price ($) SFH(YTD) 0K 200K 400K 600K 800K 202120222023 Price ($) CND(YTD) 0K 500K 1.0M 1.5M 2.0M 202120222023 Price ($) SFH(Mar) 0K 200K 400K 600K 800K 202120222023 Price ($) CND(Mar)
Housing Supply Overview
March 2023
OAHU,
(Ayear-over-yearoverviewoftheavailabilityandsalesofpropertiesinagivenmonth,bypricerange)
SOURCE: Honolulu Board of REALTORS®, residential resales compiled from MLS data. ©2023.HonoluluBoardofREALTORS®.AllRightsReserved.Informationhereindeemedreliablebutnotguaranteed.

HAWAII
Single-Family HomesMar-23Mar-22%chgMar-23Mar-22%chgMar-23Mar-22%chgMar-23Mar-22%chgMar-23Mar-22%chgMar-23Mar-22%chgMar-23Mar-22 %chgMar-23Mar-22%chg $449,999 and below 12-50.0%4541025.0%101.3%99.0%2.3%14-75.0%04-100.0%42100.0%59-44.4%2.00.5300.0% $450,000 - $599,999 47-42.9%4010300.0%94.9%100.0%-5.1%8714.3%13862.5%14955.6%1819-5.3%2.30.8187.5% $600,000 - $699,999 155200.0%427500.0%95.2%101.6%-6.3%1219-36.8%1219-36.8%2411118.2%1729-41.4%2.40.6300.0% $700,000 - $799,999 141216.7%288250.0%100.9%107.3%-5.9%2532-21.9%1634-52.9%452766.7%3159-47.5%2.10.7200.0% $800,000 - $899,999 3244-27.3%6110510.0%96.8%101.8%-4.9%5355-3.6%3948-18.8%7625204.0%5570-21.4%2.30.5360.0% $900,000 - $999,999 3254-40.7%249166.7%97.7%102.1%-4.3%3461-44.3%3167-53.7%512788.9%5294-44.7%1.40.5180.0% $1,000,000 - $1,499,999 83111-25.2%378362.5%96.2%103.6%-7.2%89118-24.6%92131-29.8%1188637.2%131183-28.4%1.20.771.4% $1,500,000 - 1,999,999 2943-32.6%1213-7.7%100.0%105.8%-5.5%3954-27.8%2939-25.6%735337.7%4168-39.7%2.41.384.6% $2,000,000 - $2,999,999 16160.0%4518150.0%96.3%103.0%-6.5%1330-56.7%1718-5.6%4548-6.3%2839-28.2%2.52.025.0% $3,000,000 and above 1027-63.0%754663.0%91.4%96.7%-5.5%1932-40.6%916-43.8%917226.4%1533-54.5%8.34.584.4% All Single-Family Homes236321-26.5%369300.0%96.7%102.0%-5.2%293412-28.9%258384-32.8%54136050.3%393603-34.8%2.11.0110.0% CondosMar-23Mar-22%chgMar-23Mar-22%chgMar-23Mar-22%chgMar-23Mar-22%chgMar-23Mar-22%chgMar-23Mar-22%chgMar-23Mar-22%chgMar-23Mar-22%chg $149,999 and below 17166.3%27263.8%96.0%99.3%-3.3%16160.0%1222-45.5%453336.4%2539-35.9%3.21.6100.0% $150,000 - $299,999 4277-45.5%1821-14.3%98.2%98.7%-0.5%5794-39.4%4784-44.0%138155-11.0%75114-34.2%2.41.741.2% $300,000 - $399,999 5496-43.8%2410140.0%98.6%100.0%-1.4%66114-42.1%78110-29.1%106110-3.6%106165-35.8%1.41.127.3% $400,000 - $499,999 80122-34.4%238187.5%100.0%100.2%-0.2%92121-24.0%82136-39.7%1459552.6%101182-44.5%1.80.9100.0% $500,000 - $599,999 66113-41.6%209122.2%99.3%101.7%-2.4%82101-18.8%5993-36.6%1188932.6%81133-39.1%1.71.070.0% $600,000 - $699,999 6467-4.5%239155.6%98.5%101.4%-2.9%6676-13.2%4380-46.3%1337675.0%58108-46.3%2.51.1127.3% $700,000 - $999,999 69119-42.0%249166.7%98.7%101.4%-2.7%85127-33.1%70116-39.7%20415234.2%97152-36.2%2.51.747.1% $1,000,000 - $1,499,999 3138-18.4%518537.5%95.3%100.0%-4.7%3237-13.5%31303.3%1048030.0%3349-32.7%4.32.759.3% $1,500,000 - $1,999,999 151136.4%5316231.3%95.7%100.0%-4.3%1315-13.3%11922.2%655322.6%1421-33.3%7.26.69.1% $2,000,000 and above 613-53.8%854973.5%98.4%94.0%4.7%211361.5%11110.0%947623.7%1217-29.4%10.47.636.8% All Condos444672-33.9%249166.7%98.5%100.0%-1.5%530714-25.8%444691-35.7%1,15291925.4%602980-38.6%2.41.560.0% Active Inventory Active Inventory Closed SalesMedian Days on Market Percent of Original List Price ReceivedPending Sales Closed SalesMedian Days on Market Percent of Original List Price ReceivedPending Sales New Listings New Listings In Escrow Months Supply of Active Inventory Total Inventory In Escrow Months Supply of Active Inventory Total Inventory
Closed Sales by Price Range: Single-Family Homes
March 2023
OAHU, HAWAII
(Acountofpropertiesthathaveclosedinagivenmonth)


$449,999andbelow12-50.0%2748-43.8%
$450,000-$599,99947-42.9%66127-48.0%
$600,000-$699,999155200.0%114244-53.3%
$700,000-$799,999141216.7%249447-44.3%
$800,000-$899,9993244-27.3%400631-36.6%
$900,000-$999,9993254-40.7%426623-31.6%
$1,000,000-$1,499,99983111-25.2%1,1421,399-18.4%
$1,500,000-1,999,9992943-32.6%373502-25.7%
$2,000,000-$2,999,99916160.0%215286-24.8%
$3,000,000andabove1027-63.0%133195-31.8%
All Single-Family Homes 236321-26.5%3,1454,502-30.1%
This12-monthperiodreflectstheconsecutive12-monthperiodupthroughthecurrentmonth,whilelastperiod reflectsthesame12-monthperiodoneyearprior.
SOURCE: Honolulu Board of REALTORS®, residential resales compiled from MLS data. ©2023.HonoluluBoardofREALTORS®.AllRightsReserved.Informationhereindeemedreliablebutnotguaranteed.
12-mth Total This Period 12-mth Total Last Period%chg
Single-Family HomesMar-23Mar-22%chg
0 20 40 60 80 100 120 $449,999 and below $450,000$599,999 $600,000$699,999 $700,000$799,999 $800,000$899,999 $900,000$999,999 $1,000,000$1,499,999 $1,500,0001,999,999 $2,000,000$2,999,999 $3,000,000 and above Closed Sales Sold Price Closed Sales by Price Range 1-mth Period: Single-Family Homes Mar-23 Mar-22 0 200 400 600 800 1,000 1,200 1,400 1,600 $449,999 and below $450,000$599,999 $600,000$699,999 $700,000$799,999 $800,000$899,999 $900,000$999,999 $1,000,000$1,499,999 $1,500,0001,999,999 $2,000,000$2,999,999 $3,000,000 and above Closed Sales Sold Price Closed Sales by Price Range 12-mth Period: Single-Family Homes 12-mth Total This Period 12-mth Total Last Period
Closed Sales by Price Range: Condos
March 2023
OAHU, HAWAII (Acountofpropertiesthathaveclosedinagivenmonth)
$149,999andbelow17166.3%169246-31.3%
$150,000-$299,9994277-45.5%6851,112-38.4%
$300,000-$399,9995496-43.8%9061,160-21.9%
$400,000-$499,99980122-34.4%9881,337-26.1%
$500,000-$599,99966113-41.6%8351,081-22.8%
$600,000-$699,9996467-4.5%637846-24.7%
$700,000-$999,99969119-42.0%9741,095-11.1%
$1,000,000-$1,499,9993138-18.4%285355-19.7%
$1,500,000-$1,999,999151136.4%105987.1%
$2,000,000andabove613-53.8%103119-13.4%
All Condos 444672-33.9%5,6877,449-23.7% This12-monthperiodreflectstheconsecutive12-monthperiodupthroughthecurrentmonth,whilelastperiod reflectsthesame12-monthperiodoneyearprior.
SOURCE: Honolulu Board of REALTORS®, residential resales compiled from MLS data. ©2023.HonoluluBoardofREALTORS®.AllRightsReserved.Informationhereindeemedreliablebutnotguaranteed.
Condos Mar-23Mar-22%chg 12-mth Total This Period 12-mth Total Last Period%chg
0 20 40 60 80 100 120 140 $149,999 and below $150,000$299,999 $300,000$399,999 $400,000$499,999 $500,000$599,999 $600,000$699,999 $700,000$999,999 $1,000,000$1,499,999 $1,500,000$1,999,999 $2,000,000 and above Closed Sales Sold Price Closed Sales by Price Range 1-mth Period: Condos Mar-23 Mar-22 0 200 400 600 800 1,000 1,200 1,400 1,600 $149,999 and below $150,000$299,999 $300,000$399,999 $400,000$499,999 $500,000$599,999 $600,000$699,999 $700,000$999,999 $1,000,000$1,499,999 $1,500,000$1,999,999 $2,000,000 and above Closed Sales Sold Price Closed Sales by Price Range 12-mth Period: Condos 12-mth Total This Period 12-mth Total Last Period
Median Days on Market by Price Range: Single-Family Homes
March 2023
OAHU, HAWAII
(Themediannumberofdaysfromwhenapropertyisfirstlistedtowhenanofferisaccepted) Single-Family

$449,999andbelow4541025.0%1113-15.4%
Median Days on Market by Price Range
1-mth
$450,000-$599,9994010300.0%181080.0%
$600,000-$699,999427500.0%2210120.0%
$700,000-$799,999288250.0%209122.2%
$800,000-$899,9996110510.0%14955.6%
$900,000-$999,999249166.7%12933.3%
Median Days on Market by Price Range
$1,000,000-$1,499,999378362.5%12933.3%
$1,500,000-1,999,9991213-7.7%121020.0%
$2,000,000-$2,999,9994518150.0%13128.3%
$3,000,000andabove754663.0%2832-12.5%
All Single-Family Homes 369300.0%131030.0%
This12-monthperiodreflectstheconsecutive12-monthperiodupthroughthecurrentmonth,whilelastperiod reflectsthesame12-monthperiodoneyearprior.
SOURCE: Honolulu Board of REALTORS®, residential resales compiled from MLS data. ©2023.HonoluluBoardofREALTORS®.AllRightsReserved.Informationhereindeemedreliablebutnotguaranteed.
HomesMar-23Mar-22%chg 12-mth Median This Period 12-mth Median Last Period%chg
0 10 20 30 40 50 60 70 80 $449,999 and below $450,000$599,999 $600,000$699,999 $700,000$799,999 $800,000$899,999 $900,000$999,999 $1,000,000$1,499,999 $1,500,0001,999,999 $2,000,000$2,999,999 $3,000,000 and above Days on Market Sold Price
Mar-23 Mar-22 0 5 10 15 20 25 30 35 $449,999 and below $450,000$599,999 $600,000$699,999 $700,000$799,999 $800,000$899,999 $900,000$999,999 $1,000,000$1,499,999 $1,500,0001,999,999 $2,000,000$2,999,999 $3,000,000 and above Days on Market Sold Price
Period: Single-Family Homes
12-mth Median This Period 12-mth Median Last Period
12-mth Period: Single-Family Homes
Median Days on Market by Price Range: Condos
March 2023

OAHU, HAWAII
(Themediannumberofdaysfromwhenapropertyisfirstlistedtowhenanofferisaccepted)
Median Days on Market by Price Range
$149,999andbelow27263.8%2730-10.0%
$150,000-$299,9991821-14.3%1823-21.7%
$300,000-$399,9992410140.0%14137.7%
$400,000-$499,999238187.5%12933.3%
$500,000-$599,999209122.2%12933.3%
Median
$600,000-$699,999239155.6%14955.6%
$700,000-$999,999249166.7%12933.3%
$1,000,000-$1,499,999518537.5%261844.4%

$1,500,000-$1,999,9995316231.3%3436-5.6%
$2,000,000andabove854973.5%3646-21.7%
All Condos 249166.7%141127.3%
This12-monthperiodreflectstheconsecutive12-monthperiodupthroughthecurrentmonth,whilelastperiod reflectsthesame12-monthperiodoneyearprior.
SOURCE: Honolulu Board of REALTORS®, residential resales compiled from MLS data. ©2023.HonoluluBoardofREALTORS®.AllRightsReserved.Informationhereindeemedreliablebutnotguaranteed.
Condos Mar-23Mar-22%chg 12-mth Median This Period 12-mth Median Last Period%chg
0 10 20 30 40 50 60 70 80 90 $149,999 and below $150,000$299,999 $300,000$399,999 $400,000$499,999 $500,000$599,999 $600,000$699,999 $700,000$999,999 $1,000,000$1,499,999 $1,500,000$1,999,999 $2,000,000 and above Days on Market Sold Price
1-mth Period: Condos Mar-23 Mar-22 0 5 10 15 20 25 30 35 40 45 50 $149,999 and below $150,000$299,999 $300,000$399,999 $400,000$499,999 $500,000$599,999 $600,000$699,999 $700,000$999,999 $1,000,000$1,499,999 $1,500,000$1,999,999 $2,000,000 and above Days on Market Sold Price
Period: Condos 12-mth Median This Period 12-mth Median Last Period
Days on Market by Price Range 12-mth
Median Percent of
OAHU,
Original List Price
Received by Price Range: Single-Family Homes


(Thepercentagefoundwhendividingaproperty'ssalespricebytheoriginallistprice;reportedpercentageisthemedianofallsalesfortheperiodandpricerangeindicated)
Median Percent of Original List Price Received by Price Range 1-mth Period:
$1,500,000-1,999,999100.0%105.8%-5.5%100.0%102.7%-2.6%
Median Percent of Original List Price Received by Price Range 12-mth Period: Single-Family Homes
All Single-Family Homes 96.7%102.0%-5.2%100.0%102.3%-2.2% This12-monthperiodreflectstheconsecutive12-monthperiodupthroughthecurrentmonth,whilelastperiod reflectsthesame12-monthperiodoneyearprior.
SOURCE: Honolulu Board of REALTORS®, residential resales compiled from MLS data. ©2023.HonoluluBoardofREALTORS®.AllRightsReserved.Informationhereindeemedreliablebutnotguaranteed.
2023
March
HAWAII
Single-Family HomesMar-23Mar-22%chg 12-mth Median This Period 12-mth Median Last Period%chg $449,999andbelow101.3%99.0%2.3%100.0%100.0%0.0% $450,000-$599,99994.9%100.0%-5.1%96.8%100.9%-4.1% $600,000-$699,99995.2%101.6%-6.3%98.1%101.0%-2.9% $700,000-$799,999100.9%107.3%-5.9%100.0%103.0%-2.9% $800,000-$899,99996.8%101.8%-4.9%100.0%103.6%-3.5% $900,000-$999,99997.7%102.1%-4.3%100.0%102.8%-2.7% $1,000,000-$1,499,99996.2%103.6%-7.2%100.0%103.5%-3.4%
$2,000,000-$2,999,99996.3%103.
0%-6.5%100.0%100.0%0.0% $3,000,000andabove91.4%96.7%-5.5%96.9%97.5%-0.6%
80.0% 85.0% 90.0% 95.0% 100.0% 105.0% 110.0% $449,999 and below $450,000$599,999 $600,000$699,999 $700,000$799,999 $800,000$899,999 $900,000$999,999 $1,000,000$1,499,999 $1,500,0001,999,999 $2,000,000$2,999,999 $3,000,000 and above Percent Orig. LP Received Sold Price
Mar-23 Mar-22 80.0% 85.0% 90.0% 95.0% 100.0% 105.0% $449,999 and below $450,000$599,999 $600,000$699,999 $700,000$799,999 $800,000$899,999 $900,000$999,999 $1,000,000$1,499,999 $1,500,0001,999,999 $2,000,000$2,999,999 $3,000,000 and above Percent Orig. LP Received Sold Price
Single-Family Homes
12-mth Median This Period 12-mth Median Last Period
Median Percent of Original List Price Received by Price Range: Condos
March 2023
OAHU, HAWAII
(Thepercentagefoundwhendividingaproperty'ssalespricebytheoriginallistprice;reportedpercentageisthemedianofallsalesfortheperiodandpricerangeindicated)
Median Percent of Original List Price Received by Price Range
This12-monthperiodreflectstheconsecutive12-monthperiodupthroughthecurrentmonth,whilelastperiod reflectsthesame12-monthperiodoneyearprior.
Median Percent of Original List Price Received by Price Range
SOURCE: Honolulu Board of REALTORS®, residential resales compiled from MLS data. ©2023.HonoluluBoardofREALTORS®.AllRightsReserved.Informationhereindeemedreliablebutnotguaranteed.
Condos Mar-23Mar-22%chg 12-mth Median This Period 12-mth Median Last Period%chg $149,999andbelow96.0%99.3%-3.3%96.0%96.3%-0.3% $150,000-$299,99998.2%98.7%-0.5%98.6%98.1%0.5% $300,000-$399,99998.6%100.0%-1.4%100.0%100.0%0.0% $400,000-$499,999100.0%100.2%-0.2%100.0%100.0%0.0% $500,000-$599,99999.3%101.7%-2.4%100.0%100.2%-0.2% $600,000-$699,99998.5%101.4%-2.9%100.0%101.3%-1.3% $700,000-$999,99998.7%101.4%-2.7%100.0%100.1%-0.1% $1,000,000-$1,499,99995.3%100.0%-4.7%97.1%98.5%-1.4% $1,500,000-$1,999,99995.7%100.0%-4.3%96.9%96.4%0.5% $2,000,000andabove98.4%94.0%4.7%95.8%96.0%-0.2%
Condos
90.0% 92.0% 94.0% 96.0% 98.0% 100.0% 102.0% 104.0% $149,999 and below $150,000$299,999 $300,000$399,999 $400,000$499,999 $500,000$599,999 $600,000$699,999 $700,000$999,999 $1,000,000$1,499,999 $1,500,000$1,999,999 $2,000,000 and above Percent Orig. LP Received Sold Price
All
98.5%100.0%-1.5%100.0%100.0%0.0%
1-mth Period: Condos Mar-23 Mar-22 84.0% 86.0% 88.0% 90.0% 92.0% 94.0% 96.0% 98.0% 100.0% 102.0% $149,999 and below $150,000$299,999 $300,000$399,999 $400,000$499,999 $500,000$599,999 $600,000$699,999 $700,000$999,999 $1,000,000$1,499,999 $1,500,000$1,999,999 $2,000,000 and above Percent Orig. LP Received Sold Price
12-mth Period: Condos 12-mth Median This Period 12-mth Median Last Period
New Listings by Price Range: Single-Family Homes
March 2023
OAHU, HAWAII
(Acountofpropertiesthathavebeennewlylistedonthemarketinagivenmonth) Single-Family

$449,999andbelow14-75.0%2447-48.9%
$450,000-$599,9998714.3%78151-48.3%
$600,000-$699,9991219-36.8%156282-44.7%
$700,000-$799,9992532-21.9%291522-44.3%
$800,000-$899,9995355-3.6%504681-26.0%
$900,000-$999,9993461-44.3%539672-19.8%
$1,000,000-$1,499,99989118-24.6%1,2211,326-7.9%
$1,500,000-1,999,9993954-27.8%494518-4.6%


$2,000,000-$2,999,9991330-56.7%291318-8.5%
$3,000,000andabove1932-40.6%265273-2.9%
All Single-Family Homes293412-28.9%3,8634,790-19.4%
This12-monthperiodreflectstheconsecutive12-monthperiodupthroughthecurrentmonth,whilelastperiod reflectsthesame12-monthperiodoneyearprior.
SOURCE: Honolulu Board of REALTORS®, residential resales compiled from MLS data. ©2023.HonoluluBoardofREALTORS®.AllRightsReserved.Informationhereindeemedreliablebutnotguaranteed.
HomesMar-23Mar-22%chg 12-mth Total This Period 12-mth Total Last Period %chg
0 20 40 60 80 100 120 140 $449,999 and below $450,000$599,999 $600,000$699,999 $700,000$799,999 $800,000$899,999 $900,000$999,999 $1,000,000$1,499,999 $1,500,0001,999,999 $2,000,000$2,999,999 $3,000,000 and above New Listings Original List Price New Listings by Price Range 1-mth Period: Single-Family Homes Mar-23 Mar-22 0 200 400 600 800 1,000 1,200 1,400 $449,999 and below $450,000$599,999 $600,000$699,999 $700,000$799,999 $800,000$899,999 $900,000$999,999 $1,000,000$1,499,999 $1,500,0001,999,999 $2,000,000$2,999,999 $3,000,000 and above New Listings Original List Price New Listings by Price Range 12-mth Period: Single-Family Homes 12-mth Total This Period 12-mth Total Last Period
New Listings by Price Range: Condos
March 2023
OAHU, HAWAII
(Acountofpropertiesthathavebeennewlylistedonthemarketinagivenmonth)
$149,999andbelow16160.0%186244-23.8%
$150,000-$299,9995794-39.4%8151,154-29.4%
$300,000-$399,99966114-42.1%1,0191,353-24.7%
$400,000-$499,99992121-24.0%1,1241,461-23.1%
$500,000-$599,99982101-18.8%9401,175-20.0%
$600,000-$699,9996676-13.2%766925-17.2%
$700,000-$999,99985127-33.1%1,2231,1853.2%
$1,000,000-$1,499,9993237-13.5%408434-6.0%
$1,500,000-$1,999,9991315-13.3%18816613.3%
$2,000,000andabove211361.5%196201-2.5%
All Condos 530714-25.8%6,8658,298-17.3% This12-monthperiodreflectstheconsecutive12-monthperiodupthroughthecurrentmonth,whilelastperiod reflectsthesame12-monthperiodoneyearprior.
SOURCE: Honolulu Board of REALTORS®, residential resales compiled from MLS data. ©2023.HonoluluBoardofREALTORS®.AllRightsReserved.Informationhereindeemedreliablebutnotguaranteed.
Condos Mar-23Mar-22%chg 12-mth Total This Period 12-mth Total Last Period %chg
0 20 40 60 80 100 120 140 $149,999 and below $150,000$299,999 $300,000$399,999 $400,000$499,999 $500,000$599,999 $600,000$699,999 $700,000$999,999 $1,000,000$1,499,999 $1,500,000$1,999,999 $2,000,000 and above New Listings Original List Price New Listings by
1-mth Period: Condos Mar-23 Mar-22 0 200 400 600 800 1,000 1,200 1,400 1,600 $149,999 and below $150,000$299,999 $300,000$399,999 $400,000$499,999 $500,000$599,999 $600,000$699,999 $700,000$999,999 $1,000,000$1,499,999 $1,500,000$1,999,999 $2,000,000 and above New Listings Original List Price New Listings by Price Range 12-mth Period: Condos 12-mth Total This Period 12-mth Total Last Period
Price Range
Pending Sales by Price Range: Single-Family Homes
March 2023
OAHU, HAWAII
(Ameasureofcontractactivity/acountofpropertiesthathavehadoffersacceptedontheminagivenmonth)
Pending Sales by Price Range
$449,999andbelow04-100.0%2956-48.2%
$450,000-$599,99913862.5%77162-52.5%
$600,000-$699,9991219-36.8%149312-52.2%
$700,000-$799,9991634-52.9%269509-47.2%
$800,000-$899,9993948-18.8%447684-34.6%
$900,000-$999,9993167-53.7%448694-35.4%
Pending Sales by Price Range
$1,000,000-$1,499,99992131-29.8%1,0761,285-16.3%
$1,500,000-1,999,9992939-25.6%337474-28.9%
$2,000,000-$2,999,9991718-5.6%207251-17.5%
$3,000,000andabove916-43.8%127191-33.5%
All Single-Family Homes 258384-32.8%3,1664,618-31.4% This12-monthperiodreflectstheconsecutive12-monthperiodupthroughthecurrentmonth,whilelastperiod reflectsthesame12-monthperiodoneyearprior.
SOURCE: Honolulu Board of REALTORS®, residential resales compiled from MLS data. ©2023.HonoluluBoardofREALTORS®.AllRightsReserved.Informationhereindeemedreliablebutnotguaranteed.
Single-Family HomesMar-23Mar-22%chg 12-mth Total This Period 12-mth Total Last Period%chg
0 20 40 60 80 100 120 140 $449,999 and below $450,000$599,999 $600,000$699,999 $700,000$799,999 $800,000$899,999 $900,000$999,999 $1,000,000$1,499,999 $1,500,0001,999,999 $2,000,000$2,999,999 $3,000,000 and above Pending Sales Current List Price
Period: Single-Family Homes Mar-23 Mar-22 0 200 400 600 800 1,000 1,200 1,400 $449,999 and below $450,000$599,999 $600,000$699,999 $700,000$799,999 $800,000$899,999 $900,000$999,999 $1,000,000$1,499,999 $1,500,0001,999,999 $2,000,000$2,999,999 $3,000,000 and above Pending Sales Current List Price
1-mth
12-mth Period: Single-Family Homes 12-mth Total This Period 12-mth Total Last Period
Pending Sales by Price Range: Condos
March 2023
OAHU, HAWAII
(Ameasureofcontractactivity/acountofpropertiesthathavehadoffersacceptedontheminagivenmonth)
Pending Sales by Price Range
$149,999andbelow1222-45.5%161260-38.1%
$150,000-$299,9994784-44.0%6641,083-38.7%
$300,000-$399,99978110-29.1%9201,301-29.3%
$400,000-$499,99982136-39.7%9311,417-34.3%
$500,000-$599,9995993-36.6%7591,090-30.4%
$600,000-$699,9994380-46.3%612877-30.2%
Pending Sales by Price Range
$700,000-$999,99970116-39.7%8661,017-14.8%
$1,000,000-$1,499,99931303.3%260334-22.2%
$1,500,000-$1,999,99911922.2%101111-9.0%
$2,000,000andabove11110.0%97128-24.2%
All Condos 444691-35.7%5,3717,618-29.5% This12-monthperiodreflectstheconsecutive12-monthperiodupthroughthecurrentmonth,whilelastperiod reflectsthesame12-monthperiodoneyearprior.
SOURCE: Honolulu Board of REALTORS®, residential resales compiled from MLS data. ©2023.HonoluluBoardofREALTORS®.AllRightsReserved.Informationhereindeemedreliablebutnotguaranteed.
Condos Mar-23Mar-22%chg 12-mth Total This Period 12-mth Total Last Period%chg
0 20 40 60 80 100 120 140 160 $149,999 and below $150,000$299,999 $300,000$399,999 $400,000$499,999 $500,000$599,999 $600,000$699,999 $700,000$999,999 $1,000,000$1,499,999 $1,500,000$1,999,999 $2,000,000 and above Pending Sales Current List Price
1-mth Period: Condos Mar-23 Mar-22 0 200 400 600 800 1,000 1,200 1,400 1,600 $149,999 and below $150,000$299,999 $300,000$399,999 $400,000$499,999 $500,000$599,999 $600,000$699,999 $700,000$999,999 $1,000,000$1,499,999 $1,500,000$1,999,999 $2,000,000 and above Pending Sales Current List Price
12-mth Period: Condos 12-mth Total This Period 12-mth Total Last Period
Active Inventory* by Price Range: Single-Family Homes
March 2023
OAHU, HAWAII
(Thenumberofpropertiesactiveonmarketattheendofagivenmonth)
Single-Family HomesMar-23Mar-22YOY chg
$449,999andbelow42100.0%
Active Inventory by Price Range
$450,000-$599,99914955.6%
$600,000-$699,9992411118.2%
$700,000-$799,999452766.7%
$800,000-$899,9997625204.0%
$900,000-$999,999512788.9%
$1,000,000-$1,499,9991188637.2%
Active Inventory - Percent Share by Price Range (portionoftotalactivestatuslistingsrepresentedbyagivenpricerange)
$1,500,000-1,999,999735337.7%
$2,000,000-$2,999,9994548-6.3% $3,000,000andabove917226.4%
All Single-Family Homes 54136050.3%
*Indicatormodifiedasof2021toreflectActivestatuslistingsonlyandappliedtohistoricalmonthlydatashownabove.Previousreportindicator,referredtoasActiveListings,reflectedallactivelymarketedlistingsinAandC status.

SOURCE: Honolulu Board of REALTORS®, residential resales compiled from MLS data. ©2023.HonoluluBoardofREALTORS®.AllRightsReserved.Informationhereindeemedreliablebutnotguaranteed.
0 20 40 60 80 100 120 140 $449,999 and below $450,000$599,999 $600,000$699,999 $700,000$799,999 $800,000$899,999 $900,000$999,999 $1,000,000$1,499,999 $1,500,0001,999,999 $2,000,000$2,999,999 $3,000,000 and above Active Listings Current List Price
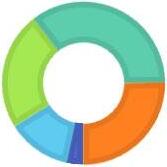
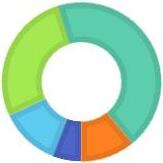
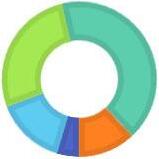
Single-Family Homes Mar-23 Mar-22 3% 11% 14% 39% 33% MAR-22 $599,999 and below $600,000 to $799,999 $800,000 to $999,999 $1,000,000 to $1,999,999 $2,000,000 and above 3% 13% 24% 35% 25% MAR-23 $599,999 and below $600,000 to $799,999 $800,000 to $999,999 $1,000,000 to $1,999,999 $2,000,000 and above
Active Inventory* by Price Range: Condos
March 2023

OAHU, HAWAII
(Thenumberofpropertiesactiveonmarketattheendofagivenmonth)
Condos Mar-23Mar-22YOY chg
$149,999andbelow453336.4%
Active Inventory by Price Range
$150,000-$299,999138155-11.0%
$300,000-$399,999106110-3.6%
$400,000-$499,9991459552.6%
$500,000-$599,9991188932.6%
$600,000-$699,9991337675.0%
$700,000-$999,99920415234.2%
Active Inventory - Percent Share by Price Range (portionoftotalactivestatuslistingsrepresentedbyagivenpricerange)
$1,000,000-$1,499,9991048030.0%
$1,500,000-$1,999,999655322.6%
$2,000,000andabove947623.7%
All Condos 1,15291925.4% *Indicatormodifiedasof2021toreflectActivestatuslistingsonlyandappliedtohistoricalmonthlydatashownabove.Previousreportindicator,referredtoasActiveListings,reflectedallactivelymarketedlistingsinAandC status.
SOURCE: Honolulu Board of REALTORS®, residential resales compiled from MLS data. ©2023.HonoluluBoardofREALTORS®.AllRightsReserved.Informationhereindeemedreliablebutnotguaranteed.
0 50 100 150 200 250 $149,999 and below $150,000$299,999 $300,000$399,999 $400,000$499,999 $500,000$599,999 $600,000$699,999 $700,000$999,999 $1,000,000$1,499,999 $1,500,000$1,999,999 $2,000,000 and above Active Listings Current List Price
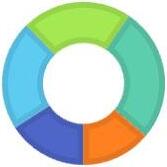
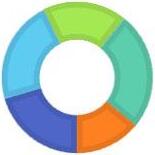
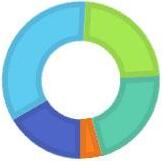
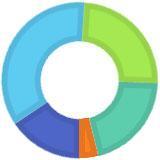
Condos Mar-23 Mar-22 21% 22% 18% 25% 14% MAR-22 $299,999 and below $300,000 to $499,999 $500,000 to $699,999 $700,000 to $1,499,999 $1,500,000 and above 16% 22% 22% 26% 14% MAR-23 $299,999 and below $300,000 to $499,999 $500,000 to $699,999 $700,000 to $1,499,999 $1,500,000 and above
Active Inventory*: Single-Family Homes and Condos

March 2023
OAHU, HAWAII
iousreportindicator,referredtoasActiveListings,reflectedallactivelymarketedlistingsinAandCstatus.

SOURCE: Honolulu Board of REALTORS®, residential resales compiled from MLS data. ©2023.HonoluluBoardofREALTORS®.AllRightsReserved.Informationhereindeemedreliablebutnotguaranteed.

Single-Family Homes
$599,999 and below 241922162015131813138111110141512810141615122418 $600,000 to $799,999 42432436334339393424224038273846595764809467656269 $800,000 to $999,999 55614460717078625444544952719399113128133157148143121115127 $1,000,000 to $1,999,999 119121105126146145165155135101111139139160193218226236251243251216207204191 $2,000,000 and above 139137142139145143142127130127116109120127133149166167171162173156146142136 Total 379381337377415416437401366309311348360395471527576596629656682597551547541 Condos
$299,999 and below 371313271253227217227218205198188204188194187199188176184183189185179185183 $300,000 to $499,999 335316259280272266298302275248250243205194219229238243263267292261277282251 $500,000 to $699,999 178159132161145142152158189158183183165161162171172196250274272245243229251 $700,000 to $1,499,999 212204180193187191206218227203216232232240253271328330317325340318329322308 $1,500,000 and above 161141141138138134147143137139130127129128118128124128127145151161168159159 Total 1,2571,1339831,0259699501,0301,0391,0339469679899199179399981,0501,0731,1411,1941,2441,1701,1961,1771,152 *Indicatormodifiedasof2021toreflectActivestatuslistingsonlyandappliedtohistoricalmonthlydatashownabove.Prev
0 50 100 150 200 250 300 Mar-21 Mar-22 Mar-23 Listings Active Inventory Single-Family Homes $599,999 and below $600,000 to $799,999 $800,000 to $999,999 $1,000,000 to $1,999,999 $2,000,000 and above 0 50 100 150 200 250 300 350 400 Mar-21 Mar-22 Mar-23 Lisings Active Inventory Condos $299,999 and below $300,000 to $499,999 $500,000 to $699,999 $700,000 to $1,499,999 $1,500,000 and above
M-21A-21M-21J-21J-21A-21S-21O-21N-21D-21J-22F-22M-22A-22M-22J-22J-22A-22S-22O-22N-22D-22J-23F-23M-23
M-21A-21M-21J-21J-21A-21S-21O-21N-21D-21J-22F-22M-22A-22M-22J-22J-22A-22S-22O-22N-22D-22J-23F-23M-23
Total Inventory In Escrow* by Price Range: Single-Family Homes March
2023
OAHU, HAWAII
(Thenumberofpropertiesinanescrowstatusattheendofagivenmonth)
Single-Family HomesMar-23Mar-22YOY chg
$449,999andbelow59-44.4%
Total Inventory In Escrow by Price Range Single-Family
$450,000-$599,9991819-5.3%
$600,000-$699,9991729-41.4%
$700,000-$799,9993159-47.5%
$800,000-$899,9995570-21.4%
$900,000-$999,9995294-44.7%
Total Inventory In Escrow - Percent Share by Price Range
(portionoftotalinventoryinescrowrepresentedbyagivenprice range)
$1,000,000-$1,499,999131183-28.4%
$1,500,000-1,999,9994168-39.7%
$2,000,000-$2,999,9992839-28.2%
*Newindicatoraddedtoreportsasof2021,includingapplicablehistoricaldata.
SOURCE: Honolulu Board of REALTORS®, residential resales compiled from MLS data. ©2023.HonoluluBoardofREALTORS®.AllRightsReserved.Informationhereindeemedreliablebutnotguaranteed.
$3,000,000andabove1533-54.5% All Single-Family Homes 393603-34.8%
0 20 40 60 80 100 120 140 160 180 200 $449,999 and below $450,000$599,999 $600,000$699,999 $700,000$799,999 $800,000$899,999 $900,000$999,999 $1,000,000$1,499,999 $1,500,0001,999,999 $2,000,000$2,999,999 $3,000,000 and above Active Listings Current List Price
Homes Mar-23 Mar-22 5% 14% 27% 42% 12% MAR-22 $599,999 and below $600,000 to
$800,000 to $999,999 $1,000,000
$2,000,000 and
6% 12% 27% 44% 11% MAR-23 $599,999 and below $600,000 to $799,999 $800,000 to $999,999 $1,000,000 to $1,999,999 $2,000,000 and above
$799,999
to $1,999,999
above
Total Inventory In Escrow* by Price Range: Condos
March 2023

OAHU, HAWAII
(Thenumberofpropertiesinanescrowstatusattheendofagivenmonth)
Condos Mar-23Mar-22YOY chg
Total Inventory In Escrow by Price Range
$149,999andbelow2539-35.9%
$150,000-$299,99975114-34.2%
$300,000-$399,999106165-35.8%
$400,000-$499,999101182-44.5%
$500,000-$599,99981133-39.1%
$600,000-$699,99958108-46.3%
Total Inventory In Escrow - Percent Share by Price Range
(portionoftotalinventoryinescrowrepresentedbyagivenprice range)
$700,000-$999,99997152-36.2%
$1,000,000-$1,499,9993349-32.7%
$1,500,000-$1,999,9991421-33.3%
$2,000,000andabove1217-29.4%
All Condos 602980-38.6%
*Newindicatoraddedtoreportsasof2021,includingapplicablehistoricaldata.
SOURCE: Honolulu Board of REALTORS®, residential resales compiled from MLS data. ©2023.HonoluluBoardofREALTORS®.AllRightsReserved.Informationhereindeemedreliablebutnotguaranteed.
0 20 40 60 80 100 120 140 160 180 200 $149,999 and below $150,000$299,999 $300,000$399,999 $400,000$499,999 $500,000$599,999 $600,000$699,999 $700,000$999,999 $1,000,000$1,499,999 $1,500,000$1,999,999 $2,000,000 and above Active Listings Current List Price
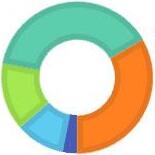
Condos Mar-23 Mar-22 16% 35% 25% 20% 4% MAR-22 $299,999 and below $300,000 to $499,999 $500,000 to $699,999 $700,000 to $1,499,999 $1,500,000 and above 17% 34% 23% 22% 4% MAR-23 $299,999 and below $300,000 to $499,999 $500,000 to $699,999 $700,000 to $1,499,999 $1,500,000 and above
Months Supply of Active Inventory by Price Range: Single-Family Homes March 2023
OAHU, HAWAII
(Comparesactiveinventorytoarolling12-monthaverageclosedsales)


Single-Family HomesMar-23Mar-22YOY chg
Months Supply of Inventory by Price Range
$449,999andbelow2.00.5300.0%
$450,000-$599,9992.30.8187.5%
$600,000-$699,9992.40.6300.0%
$700,000-$799,9992.10.7200.0%
$800,000-$899,9992.30.5360.0%
$900,000-$999,9991.40.5180.0%
Months Supply of Inventory
SOURCE:
$1,000,000-$1,499,9991.20.771.4% $1,500,000-1,999,9992.41.384.6%
$3,000,000andabove8.34.584.4% All Single-Family Homes 2.11.0110.0% 0 3 6 9 $449,999 and below $450,000$599,999 $600,000$699,999 $700,000$799,999 $800,000$899,999 $900,000$999,999 $1,000,000$1,499,999 $1,500,0001,999,999 $2,000,000$2,999,999 $3,000,000 and above Months of Inventory Current List Price
$2,000,000-$2,999,9992.52.025.0%
Single-Family Homes Mar-23 Mar-22 0 2 4 6 8 Mar-21Mar-22Mar-23 Months of Inventory
Single-Family Homes $599,999 and below $600,000 to $799,999 $800,000 to $999,999 $1,000,000
$1,999,999 $2,000,000
to
and above
Honolulu Board of REALTORS®, residential resales compiled from MLS data. ©2023.HonoluluBoardofREALTORS®.AllRightsReserved.Informationhereindeemedreliablebutnotguaranteed.
Months Supply of Active Inventory by Price Range: Condos
March 2023

OAHU, HAWAII
(Comparesactiveinventorytoarolling12-monthaverageclosedsales)
Condos Mar-23Mar-22YOY chg
Months Supply of Inventory by Price Range
$149,999andbelow3.21.6100.0%
$150,000-$299,9992.41.741.2%
$300,000-$399,9991.41.127.3%
$400,000-$499,9991.80.9100.0%
$500,000-$599,9991.71.070.0%
$600,000-$699,9992.51.1127.3%
Months Supply of Inventory
$700,000-$999,9992.51.747.1%
$1,000,000-$1,499,9994.32.759.3%
SOURCE: Honolulu Board of REALTORS®, residential resales compiled from MLS data. ©2023.HonoluluBoardofREALTORS®.AllRightsReserved.Informationhereindeemedreliablebutnotguaranteed.
All Condos 2.41.560.0% 0 3 6 9 12 $149,999 and below $150,000$299,999 $300,000$399,999 $400,000$499,999 $500,000$599,999 $600,000$699,999 $700,000$999,999 $1,000,000$1,499,999 $1,500,000$1,999,999 $2,000,000 and above Months of Inventory Current List Price
$1,500,000-$1,999,9997.26.69.1% $2,000,000andabove10.47.636.8%
Condos Mar-23 Mar-22 0 2 4 6 8 10 12 14 16 18 20 22 24 26 Mar-21Mar-22Mar-23 Months of Inventory
Condos $299,999 and below $300,000 to $499,999 $500,000 to $699,999 $700,000
$1,499,999 $1,500,000
to
and above

Single-Family Homes and Condos OAHU, HAWAII: Jan 1987 to the Present 0 100 200 300 400 500 600 700 800 900 1987198819891990199119921993199419951996199719981999200020012002200320042005200620072008200920102011201220132014201520162017201820192020202120222023 Closed Sales SFH Closed Sales CONDO SOURCE: Honolulu Board of REALTORS®, compiled from MLS data. ©2023. Honolulu Board of REALTORS®. All Rights Reserved. Information herein deemed reliable but not guaranteed.
Closed Sales