Oahu Monthly Housing Statistics
August 2023

Monthly Indicators 2 Median Sales Price YoY %chg Price Graphs 3-4 $1,110,000-1.4% Closed Sales 5 Closed Sales YoY %chg Median Sales Price 6 Average Sales Price 7 252 -19.7% Median Days on Market 8 Percent of Original List Price Received 9 Average Sales Price YoY %chg New Listings 10 Pending Sales 11 $1,427,996+6.4% Active Inventory 12 Total Inventory In Escrow 13 Months Supply of Active Inventory 14 Housing Supply Overview 15 Median Sales Price YoY %chg Closed Sales (by price range) 16-17 Median Days on Market (by price range) 18-19 $515,000+3.3% Percent of Original List Price Received (by price range)20-21 New Listings (by price range) 22-23 Closed Sales YoY %chg Pending Sales (by price range) 24-25 Active Inventory (by price range) 26-27 422 -16.9% Active Inventory History 28 Total Inventory In Escrow (by price range) 29-30 Average Sales Price YoY %chg Months Supply of Active Inventory (by price range)31-32 $628,127+14.8% Historical Graphs 33-34 YoY % chg = year-over-year percent change comparing current month to the same month last year. SOURCE: Honolulu Board of REALTORS®, residential resales data compiled from HiCentral MLS, Ltd.® ©2023. Honolulu Board of REALTORS®. All Rights Reserved. Information herein deemed reliable but not guaranteed. CONTENTS: CONDOS
SINGLE-FAMILY HOMES Page 1 of 34
Monthly Indicators OAHU,
*seefootnotesonpages9-12regardingmethodologyupdatesYoY%chg=year-over-yearpercentchangecomparingcurrentmonthtothesamemonthlastyear. MoM%chg=month-over-monthpercentchangecomparingcurrentmonthtothepreviousmonth.
*seefootnotesonpages9-12regardingmethodologyupdates1-yr%chg=percentchangecomparingthecurrentYTDtimeperiodtothesameYTDtimeperiodoneyearago. 2-yr%chg=percentchangecomparingthecurrentYTDtimeperiodtothesameYTDtimeperiodtwoyearsago.
SOURCE: Honolulu Board of REALTORS®, residential resales compiled from MLS data. ©2023.HonoluluBoardofREALTORS®.AllRightsReserved.Informationhereindeemedreliablebutnotguaranteed.
August 2023 Aug-23 Aug-22YoY %chgJul-23MoM %chg Aug-23 Aug-22YoY %chgJul-23MoM %chg Closed Sales 252 314-19.7%22412.5% 422 508-16.9%4220.0% Median Sales Price $1,110,000 $1,125,500-1.4%$1,090,0001.8% $515,000 $498,5003.3%$500,0003.0% Average Sales Price $1,427,996 $1,341,9586.4%$1,270,42112.4% $628,127 $547,31914.8%$617,6831.7% Median Days on Market 18 1338.5%1612.5% 18 1338.5%1612.5% Percent of Orig. List Price Received 99.1% 100.0%-0.9%100.0%-0.9% 99.6% 100.0%-0.4%98.8%0.8% New Listings 330 381-13.4%27520.0% 549 608-9.7%5215.4% Pending Sales* 267 312-14.4%2478.1% 425 475-10.5%4211.0% Active Inventory* 598 5960.3%5911.2% 1,146 1,0736.8%1,154-0.7% Total Inventory in Escrow* 391 462-15.4%3832.1% 590 654-9.8%5860.7% Months Supply of Active Inventory* 2.7 1.758.8%2.63.8% 2.8 1.855.6%2.80.0%
HAWAII
Year-to-Date YTD-2023 YTD-20221-yr %chgYTD-20212-yr %chg YTD-2023 YTD-20221-yr %chgYTD-20212-yr %chg Closed Sales 1,753 2,580-32.1%2,972-41.0% 3,216 4,722-31.9%4,783-32.8% Median Sales Price $1,050,000 $1,113,500-5.7%$960,0009.4% $502,000 $510,000-1.6%$465,0008.0% Average Sales Price $1,325,916 $1,406,359-5.7%$1,220,7548.6% $616,397 $607,9321.4%$549,33312.2% Median Days on Market 23 10130.0%9155.6% 20 1181.8%1353.8% Percent of Orig. List Price Received 98.3% 101.2%-2.9%101.9%-3.5% 98.7% 100.0%-1.3%100.0%-1.3% New Listings 2,324 3,126-25.7%3,426-32.2% 4,235 5,438-22.1%5,555-23.8% Pending Sales* 2,016 2,651-24.0%3,215-37.3% 3,427 4,632-26.0%5,129-33.2%
Single-Family Homes Condos Single-Family Homes Condos
Page 2 of 34


3 5 13 21 35 36 12 14 21 13 15 7 9 10 5 1 17 15 5 7 8 23 30 46 25 31 22 24 12 12 10 10 7 5 25 12 0 5 10 15 20 25 30 35 40 45 50 Closed Sales Sold Price ($)
Homes
August 2023 vs. August 2022 2023 2022 SOURCE: Honolulu Board of REALTORS®, compiled from MLS data. ©2023. Honolulu Board of REALTORS®. All Rights Reserved. Information herein deemed reliable but not guaranteed. Page 3 of 34
Single-Family
Sold

8 16 34 62 75 76 55 33 18 12 26 7 11 31 44 75 97 83 61 41 21 12 27 5 0 20 40 60 80 100 120 Closed Sales Sold Price ($) Condos Sold August 2023 vs. August 2022 2023 2022 SOURCE: Honolulu Board of REALTORS®, compiled from MLS data. ©2023. Honolulu Board of REALTORS®. All Rights Reserved. Information herein deemed reliable but not guaranteed. Page 4 of 34

HAWAII
of properties that have closed in a given month) Mo-Yr Single-Family HomesCondosTotal Aug-20370 409 779 Sep-20391 456 847 Oct-20345 480 825 Nov-20338 407 745 Dec-20420 514 934 Jan-21291 392 683 Feb-21260 446 706 Mar-21361 626 987 Apr-21375 645 1,020 May-21405 598 1,003 Jun-21451 730 1,181 Jul-21404 671 1,075 Aug-21425 675 1,100 Sep-21424 615 1,039 Oct-21381 611 992 Nov-21371 601 972 Dec-21378 593 971 Jan-22326 552 878 Feb-22241 486 727 Mar-22321 672 993 Apr-22365 672 1,037 May-22344 688 1,032 Jun-22357 626 983 Monthly Closed Sales Year-to-Date Closed Sales Jul-22312 518 830 AugustSFHYoY %chgCNDYoY %chg AugustYTD SFHYoY %chgYTD CNDYoY %chg Aug-22314 508 822 202142514.9%67565.0% 20212,97226.8%4,78367.9% Sep-22278 496 774 2022314-26.1%508-24.7% 20222,580-13.2%4,722-1.3% Oct-22222 435 657 2023252-19.7%422-16.9% 2023 1,753-32.1%3,216-31.9% Nov-22192 340 532 Dec-22202 360 562 Jan-23150 275 425 Feb-23173 325 498 Mar-23236 444 680 Apr-23208 420 628 May-23262 438 700 Jun-23248 470 718 Jul-23224 422 646 Aug-23252 422 674
0 100 200 300 400 500 600 700 800 Sales Closed Sales Single-Family Homes Condos 0 1,000 2,000 3,000 4,000 202120222023 Closed Sales SFH (YTD) 0 1,000 2,000 3,000 4,000 5,000 6,000 202120222023 Closed Sales CND (YTD) 0 100 200 300 400 500 202120222023 Closed Sales SFH (Aug) 0 200 400 600 800 202120222023 Closed Sales CND (Aug)
August 2023 OAHU,
(A count
Closed Sales
Board of
Page 5 of 34
SOURCE: Honolulu Board of REALTORS®, residential resales compiled from MLS data. ©2023.
Honolulu
REALTORS®. All Rights Reserved. Information herein deemed reliable but not guaranteed.
Median Sales Price
August 2023
OAHU, HAWAII
Mo/Yr Single-Family HomesCondos
Aug-20$839,000$430,000
Sep-20$880,000$445,000
Oct-20$865,000$439,500
Nov-20$872,500$420,000
Dec-20$870,000$455,000
Jan-21$883,000$452,000
Feb-21$917,500$457,500
Mar-21$950,000$451,000
Apr-21$928,000$450,000
May-21$978,000$457,750
Jun-21$979,000$460,000
Jul-21$992,500$475,000
Aug-21$1,050,000$500,000
Sep-21$1,050,000$478,000
Oct-21$1,000,000$500,000
Nov-21$1,050,000$500,000
Dec-21$1,050,000$485,000
Jan-22$1,050,000$510,000
Feb-22$1,125,000$497,000
Mar-22$1,150,000$515,500
Apr-22$1,105,000$510,000
May-22$1,153,500$516,500
Jun-22$1,100,000$534,000
Median Sales Price
SOURCE: Honolulu Board of REALTORS®, residential resales compiled from MLS data. ©2023. Honolulu
(The median sales price of all closed properties in a given month)
Monthly Median Sales Price Year-to-Date Median Sales Price Jul-22$1,107,944$500,000 AugustSFHYoY %chgCNDYoY %chg AugustYTD SFHYoY %chgYTD CNDYoY %chg Aug-22$1,125,500$498,500 2021$1,050,00025.1%$500,00016.3% 2021$960,00020.2%$465,0008.1% Sep-22$1,100,000$502,500 2022$1,125,5007.2%$498,500-0.3% 2022$1,113,50016.0%$510,0009.7% Oct-22$1,050,000$520,000 2023$1,110,000-1.4%$515,0003.3% 2023 $1,050,000-5.7%$502,000-1.6% Nov-22$1,149,500$480,000 Dec-22$1,049,500$502,500 Jan-23$970,000$495,000 Feb-23$987,000$480,000 Mar-23$1,083,750$536,000 Apr-23$999,995$500,000 May-23$1,109,000$505,000 Jun-23$1,050,000$510,000 Jul-23$1,090,000$500,000 Aug-23$1,110,000$515,000
$0 $200,000 $400,000 $600,000 $800,000 $1,000,000 $1,200,000 $1,400,000 Price ($)
0K 200K 400K 600K 800K 1.0M 1.2M 202120222023 Price ($) SFH (YTD) 0K 100K 200K 300K 400K 500K 600K 202120222023 Price ($) CND (YTD) 0K 200K 400K 600K 800K 1.0M 1.2M 202120222023 Price ($) SFH (Aug) 0K 100K 200K 300K 400K 500K 600K 202120222023 Price ($) CND (Aug)
Single-Family Homes Condos
Page 6 of 34
Board of REALTORS®. All Rights Reserved. Information herein deemed reliable but not guaranteed.
Average Sales Price
August 2023
OAHU, HAWAII
(The average sales price of all closed properties in a given month)
Mo/Yr Single-Family HomesCondos
Aug-20$1,022,449$527,573
Sep-20$1,073,692$545,367
Oct-20$1,065,594$479,736
Nov-20$1,084,834$472,726
Dec-20$1,113,076$504,222
Jan-21$1,050,263$496,296
Feb-21$1,172,804$545,629
Mar-21$1,226,827$530,257
Apr-21$1,194,150$520,192
May-21$1,246,611$555,798
Jun-21$1,225,011$557,302
Jul-21$1,265,382$544,064
Aug-21$1,316,681$618,612
Sep-21$1,289,510$558,002
Oct-21$1,335,171$582,509
Nov-21$1,296,551$559,007
Dec-21$1,303,481$604,749
Jan-22$1,277,309$623,928
Feb-22$1,486,088$583,367
Mar-22$1,570,668$623,684
Apr-22$1,404,481$613,189
Average Sales Price
SOURCE: Honolulu Board of REALTORS®, residential resales compiled from MLS data.
Reserved.
herein deemed reliable but not guaranteed.
May-22$1,450,008$625,327 Jun-22$1,382,559$631,822 Monthly Average Sales Price Year-to-Date Average Sales Price Jul-22$1,329,023$590,934 AugustSFHYoY %chgCNDYoY %chg AugustYTD SFHYoY %chgYTD CNDYoY %chg Aug-22$1,341,958$547,319 2021$1,316,68128.8%$618,61217.3% 2021$1,220,75426.0%$549,3338.9% Sep-22$1,307,249$607,502 2022$1,341,9581.9%$547,319-11.5% 2022$1,406,35915.2%$607,93210.7% Oct-22$1,243,960$676,988 2023$1,427,9966.4%$628,12714.8% 2023$1,325,916 -5.7%$616,3971.4% Nov-22$1,387,685$594,444 Dec-22$1,325,156$576,689 Jan-23$1,139,294$633,441 Feb-23$1,427,864$592,131 Mar-23$1,391,538$651,630 Apr-23$1,223,383$603,795 May-23$1,355,804$623,748 Jun-23$1,300,456$589,597 Jul-23$1,270,421$617,683 Aug-23$1,427,996$628,127
$0 $200,000 $400,000 $600,000 $800,000 $1,000,000 $1,200,000 $1,400,000 $1,600,000 $1,800,000 Price ($)
Single-Family Homes Condos 0K 500K 1.0M 1.5M 202120222023 Price ($) SFH (YTD) 0K 200K 400K 600K 800K 202120222023 Price ($) CND (YTD) 0K 500K 1.0M 1.5M 202120222023 Price ($) SFH (Aug) 0K 200K 400K 600K 800K 202120222023 Price ($) CND (Aug)
©2023. Honolulu Board of
All Rights
Page 7 of 34
REALTORS®.
Information
Housing Supply Overview
August 2023
OAHU, HAWAII
(Ayear-over-yearoverviewoftheavailabilityandsalesofpropertiesinagivenmonth,bypricerange)

- $999,999 6374-14.9%231291.7%100.0%100.0%0.0%78117-33.3%7386-15.1%198219-9.6%99121-18.2%3.12.147.6%
- $1,499,999 1823-21.7%1727-37.0%97.8%98.0%-0.2%3033-9.1%25250.0%103111-7.2%352825.0%5.23.644.4%
SOURCE: Honolulu Board of REALTORS®, residential resales compiled from MLS data. ©2023.HonoluluBoardofREALTORS®.AllRightsReserved.Informationhereindeemedreliablebutnotguaranteed.
Single-Family HomesAug-23Aug-22%chgAug-23Aug-22%chgAug-23Aug-22%chgAug-23Aug-22%chgAug-23Aug-22%chgAug-23Aug-22%chgAug-23Aug-22 %chgAug-23Aug-22%chg $449,999 and below 24-50.0%5410440.0%98.7%102.9%-4.1%110.0%330.0%4333.3%58-37.5%2.01.0100.0% $450,000 - $599,999 68-25.0%3814171.4%93.0%97.8%-4.9%5425.0%8560.0%135160.0%171513.3%2.60.7271.4% $600,000 - $699,999 13862.5%4316168.8%94.6%98.6%-4.1%15887.5%1214-14.3%312240.9%1725-32.0%3.11.782.4% $700,000 - $799,999 2123-8.7%23224.5%99.2%99.2%0.0%312810.7%3031-3.2%393511.4%4748-2.1%2.11.361.5% $800,000 - $899,999 353016.7%191618.8%100.0%99.5%0.5%4356-23.2%3648-25.0%6976-9.2%5365-18.5%2.11.816.7% $900,000 - $999,999 3646-21.7%261485.7%98.4%100.0%-1.6%4152-21.2%2939-25.6%585211.5%4360-28.3%2.11.0110.0% $1,000,000 - $1,499,999 75114-34.2%13128.3%100.0%100.0%0.0%99119-16.8%92107-14.0%146158-7.6%130148-12.2%2.01.353.8% $1,500,000 - 1,999,999 3244-27.3%14140.0%100.3%98.9%1.4%5054-7.4%29290.0%927817.9%4043-7.0%3.71.8105.6% $2,000,000 - $2,999,999 1725-32.0%1012-16.7%100.0%100.0%0.0%2440-40.0%1427-48.1%5768-16.2%2033-39.4%4.13.132.3% $3,000,000 and above 151225.0%6220210.0%96.0%98.9%-2.9%211910.5%14955.6%8999-10.1%191711.8%9.95.870.7% All Single-Family Homes252314-19.7%181338.5%99.1%100.0%-0.9%330381-13.4%267312-14.4%5985960.3%391462-15.4%2.71.758.8% Condos Aug-23Aug-22%chgAug-23Aug-22%chgAug-23Aug-22%chgAug-23Aug-22%chgAug-23Aug-22%chgAug-23Aug-22%chgAug-23Aug-22%chgAug-23Aug-22%chg $149,999 and below 1423-39.1%784669.6%84.9%94.0%-9.7%89-11.1%141216.7%4417158.8%1920-5.0%3.11.0210.0% $150,000 - $299,999 4463-30.2%1314-7.1%99.8%98.5%1.3%6571-8.5%4860-20.0%126159-20.8%8186-5.8%2.62.123.8% $300,000 - $399,999 6275-17.3%171154.5%100.0%100.0%0.0%8197-16.5%5884-31.0%13911520.9%81111-27.0%2.11.361.5% $400,000 - $499,999 7597-22.7%14140.0%100.0%100.0%0.0%1051005.0%7582-8.5%14812815.6%103115-10.4%2.11.275.0% $500,000 - $599,999 7683-8.4%191172.7%100.0%100.0%0.0%947623.7%725530.9%1329834.7%908012.5%2.21.1100.0% $600,000 - $699,999 5561-9.8%181163.6%99.2%100.0%-0.8%6374-14.9%4352-17.3%1119813.3%6266-6.1%2.31.553.3%
$1,500,000 - $1,999,999 84100.0%332437.5%93.2%95.8%-2.7%111010.0%10825.0%5859-1.7%1012-16.7%7.36.610.6% $2,000,000 and above 7540.0%3580-56.3%96.6%99.6%-3.0%1421-33.3%711-36.4%876926.1%1015-33.3%10.97.741.6% All Condos 422508-16.9%181338.5%99.6%100.0%-0.4%549608-9.7%425475-10.5%1,1461,0736.8%590654-9.8%2.81.855.6% Active Inventory Active Inventory Closed SalesMedian Days on Market Percent of Original List Price Received Pending Sales Closed SalesMedian Days on Market Percent of Original List Price Received Pending Sales New Listings New Listings In Escrow Months Supply of Active Inventory Total Inventory In Escrow Months Supply of Active Inventory Total Inventory
$700,000
$1,000,000
Page 15 of 34
Closed Sales by Price Range: Single-Family Homes
August 2023
OAHU, HAWAII
(Acountofpropertiesthathaveclosedinagivenmonth)


$449,999andbelow24-50.0%2833-15.2%
$450,000-$599,99968-25.0%5886-32.6%
$600,000-$699,99913862.5%118151-21.9%
$700,000-$799,9992123-8.7%233327-28.7%
$800,000-$899,999353016.7%398508-21.7%
$900,000-$999,9993646-21.7%338602-43.9%
$1,000,000-$1,499,99975114-34.2%8921,449-38.4%
$1,500,000-1,999,9993244-27.3%305514-40.7%
$2,000,000-$2,999,9991725-32.0%173264-34.5%
$3,000,000andabove151225.0%104200-48.0%
All Single-Family Homes 252314-19.7%2,6474,134-36.0%
This12-monthperiodreflectstheconsecutive12-monthperiodupthroughthecurrentmonth,whilelastperiod reflectsthesame12-monthperiodoneyearprior.
SOURCE: Honolulu Board of REALTORS®, residential resales compiled from MLS data. ©2023.HonoluluBoardofREALTORS®.AllRightsReserved.Informationhereindeemedreliablebutnotguaranteed.
HomesAug-23Aug-22%chg 12-mth Total This Period 12-mth Total Last Period%chg
Single-Family
0 20 40 60 80 100 120 $449,999 and below $450,000$599,999 $600,000$699,999 $700,000$799,999 $800,000$899,999 $900,000$999,999 $1,000,000$1,499,999 $1,500,0001,999,999 $2,000,000$2,999,999 $3,000,000 and above Closed Sales Sold Price Closed Sales by Price Range 1-mth Period: Single-Family Homes Aug-23 Aug-22 0 200 400 600 800 1,000 1,200 1,400 1,600 $449,999 and below $450,000$599,999 $600,000$699,999 $700,000$799,999 $800,000$899,999 $900,000$999,999 $1,000,000$1,499,999 $1,500,0001,999,999 $2,000,000$2,999,999 $3,000,000 and above Closed Sales Sold Price Closed Sales by Price
12-mth Period: Single-Family Homes 12-mth Total This Period 12-mth Total Last Period
Range
Page 16 of 34
Closed Sales by Price Range: Condos August 2023
OAHU, HAWAII
(Acountofpropertiesthathaveclosedinagivenmonth)

$149,999andbelow1423-39.1%162209-22.5%
$150,000-$299,9994463-30.2%589922-36.1%
$300,000-$399,9996275-17.3%7961,078-26.2%
$400,000-$499,9997597-22.7%8311,272-34.7%
$500,000-$599,9997683-8.4%7161,076-33.5%
$600,000-$699,9995561-9.8%574783-26.7%
$700,000-$999,9996374-14.9%7521,223-38.5%
$1,000,000-$1,499,9991823-21.7%239367-34.9%
$1,500,000-$1,999,99984100.0%91104-12.5%
$2,000,000andabove7540.0%97108-10.2%
All Condos 422508-16.9%4,8477,142-32.1% This12-monthperiodreflectstheconsecutive12-monthperiodupthroughthecurrentmonth,whilelastperiod reflectsthesame12-monthperiodoneyearprior.
SOURCE: Honolulu Board of REALTORS®, residential resales compiled from MLS data. ©2023.HonoluluBoardofREALTORS®.AllRightsReserved.Informationhereindeemedreliablebutnotguaranteed.
Condos Aug-23Aug-22%chg 12-mth Total This Period 12-mth Total Last Period%chg
0 20 40 60 80 100 120 $149,999 and below $150,000$299,999 $300,000$399,999 $400,000$499,999 $500,000$599,999 $600,000$699,999 $700,000$999,999 $1,000,000$1,499,999 $1,500,000$1,999,999 $2,000,000 and above Closed Sales Sold Price Closed Sales by Price Range 1-mth Period: Condos Aug-23 Aug-22 0 200 400 600 800 1,000 1,200 1,400 $149,999 and below $150,000$299,999 $300,000$399,999 $400,000$499,999 $500,000$599,999 $600,000$699,999 $700,000$999,999 $1,000,000$1,499,999 $1,500,000$1,999,999 $2,000,000 and above Closed Sales Sold Price Closed Sales by
12-mth Period: Condos 12-mth Total This Period 12-mth Total Last Period
Price Range
Page 17 of 34
Median Days on Market by Price Range: Single-Family Homes August 2023
OAHU, HAWAII
(Themediannumberofdaysfromwhenapropertyisfirstlistedtowhenanofferisaccepted)
Median Days on Market by Price Range
1-mth Period: Single-Family Homes
$449,999andbelow5410440.0%261752.9%
$450,000-$599,9993814171.4%4613253.8%
$600,000-$699,9994316168.8%3710270.0%
$700,000-$799,99923224.5%299222.2%
$800,000-$899,999191618.8%2610160.0%
Median Days on Market by Price Range
$900,000-$999,999261485.7%2110110.0%
$1,000,000-$1,499,99913128.3%181080.0%
$1,500,000-1,999,99914140.0%141040.0%
$2,000,000-$2,999,9991012-16.7%161233.3%
$3,000,000andabove6220210.0%462770.4%
All Single-Family Homes 181338.5%2110110.0%

This12-monthperiodreflectstheconsecutive12-monthperiodupthroughthecurrentmonth,whilelastperiod reflectsthesame12-monthperiodoneyearprior.
SOURCE: Honolulu Board of REALTORS®, residential resales compiled from MLS data. ©2023.HonoluluBoardofREALTORS®.AllRightsReserved.Informationhereindeemedreliablebutnotguaranteed.
HomesAug-23Aug-22%chg 12-mth Median This Period 12-mth Median Last Period%chg
Single-Family
0 10 20 30 40 50 60 70 $449,999 and below $450,000$599,999 $600,000$699,999 $700,000$799,999 $800,000$899,999 $900,000$999,999 $1,000,000$1,499,999 $1,500,0001,999,999 $2,000,000$2,999,999 $3,000,000 and above Days on Market Sold Price
Aug-23 Aug-22 0 5 10 15 20 25 30 35 40 45 50 $449,999 and below $450,000$599,999 $600,000$699,999 $700,000$799,999 $800,000$899,999 $900,000$999,999 $1,000,000$1,499,999 $1,500,0001,999,999 $2,000,000$2,999,999 $3,000,000 and above Days on Market Sold Price
12-mth Median This Period 12-mth Median Last Period
12-mth Period: Single-Family Homes
Page 18 of 34
Median Days on Market by Price Range: Condos
August 2023
OAHU, HAWAII
(Themediannumberofdaysfromwhenapropertyisfirstlistedtowhenanofferisaccepted)
Median Days on Market by Price Range
$149,999andbelow784669.6%28280.0%

$150,000-$299,9991314-7.1%201811.1%
$300,000-$399,999171154.5%191258.3%
$400,000-$499,99914140.0%151050.0%
$500,000-$599,999191172.7%16977.8%
Median Days on Market by Price Range
$600,000-$699,999181163.6%209122.2%
$700,000-$999,999231291.7%2110110.0%
$1,000,000-$1,499,9991727-37.0%301866.7% $1,500,000-$1,999,999332437.5%4217147.1%
$2,000,000andabove3580-56.3%3348-31.3%
All Condos 181338.5%191172.7%
This12-monthperiodreflectstheconsecutive12-monthperiodupthroughthecurrentmonth,whilelastperiod reflectsthesame12-monthperiodoneyearprior.
SOURCE: Honolulu Board of REALTORS®, residential resales compiled from MLS data. ©2023.HonoluluBoardofREALTORS®.AllRightsReserved.Informationhereindeemedreliablebutnotguaranteed.
Condos Aug-23Aug-22%chg 12-mth Median This Period 12-mth Median Last Period%chg
0 10 20 30 40 50 60 70 80 90 $149,999 and below $150,000$299,999 $300,000$399,999 $400,000$499,999 $500,000$599,999 $600,000$699,999 $700,000$999,999 $1,000,000$1,499,999 $1,500,000$1,999,999 $2,000,000 and above Days on Market Sold Price
1-mth Period: Condos Aug-23 Aug-22 0 10 20 30 40 50 60 $149,999 and below $150,000$299,999 $300,000$399,999 $400,000$499,999 $500,000$599,999 $600,000$699,999 $700,000$999,999 $1,000,000$1,499,999 $1,500,000$1,999,999 $2,000,000 and above Days on Market Sold Price
Period: Condos 12-mth Median This Period 12-mth Median Last Period
12-mth
Page 19 of 34
Median Percent of
OAHU,
Original List Price
Received by Price Range: Single-Family Homes


(Thepercentagefoundwhendividingaproperty'ssalespricebytheoriginallistprice;reportedpercentageisthemedianofallsalesfortheperiodandpricerangeindicated)
Median Percent of Original List Price Received by Price Range
Median Percent of Original List Price Received by Price Range
$1,500,000-1,999,999100.3%98.9%1.4%100.0%101.8%-1.8% $2,000,000-$2,999,999100.0%100.0%0.0%97.7%100.0%-2.3% $3,000,000andabove96.0%98.9%-2.9%95.4%97.4%-2.1%
All Single-Family Homes 99.1%100.0%-0.9%98.4%101.6%-3.1% This12-monthperiodreflectstheconsecutive12-monthperiodupthroughthecurrentmonth,whilelastperiod reflectsthesame12-monthperiodoneyearprior.
SOURCE: Honolulu Board of REALTORS®, residential resales compiled from MLS data. ©2023.HonoluluBoardofREALTORS®.AllRightsReserved.Informationhereindeemedreliablebutnotguaranteed.
August 2023
HAWAII
Single-Family HomesAug-23Aug-22%chg 12-mth Median This Period 12-mth Median Last Period%chg $449,999andbelow98.7%102.9%-4.1%97.2%97.1%0.1% $450,000-$599,99993.0%97.8%-4.9%96.8%100.0%-3.2% $600,000-$699,99994.6%98.6%-4.1%96.6%100.8%-4.2% $700,000-$799,99999.2%99.2%0.0%98.0%102.0%-3.9% $800,000-$899,999100.0%99.5%0.5%98.8%102.2%-3.3% $900,000-$999,99998.4%100.0%-1.6%98.9%102.2%-3.2% $1,000,000-$1,499,999100.0%100.0%0.0%98.4%102.2%-3.7%
80.0% 85.0% 90.0% 95.0% 100.0% 105.0% $449,999 and below $450,000$599,999 $600,000$699,999 $700,000$799,999 $800,000$899,999 $900,000$999,999 $1,000,000$1,499,999 $1,500,0001,999,999 $2,000,000$2,999,999 $3,000,000 and above Percent Orig. LP Received Sold Price
1-mth Period: Single-Family Homes Aug-23 Aug-22 80.0% 85.0% 90.0% 95.0% 100.0% 105.0% $449,999 and below $450,000$599,999 $600,000$699,999 $700,000$799,999 $800,000$899,999 $900,000$999,999 $1,000,000$1,499,999 $1,500,0001,999,999 $2,000,000$2,999,999 $3,000,000 and above Percent Orig. LP Received Sold Price
12-mth
Single-Family Homes 12-mth Median This Period 12-mth Median Last Period
Period:
Page 20 of 34
Median Percent of Original List Price Received by Price Range: Condos
August 2023
OAHU, HAWAII
(Thepercentagefoundwhendividingaproperty'ssalespricebytheoriginallistprice;reportedpercentageisthemedianofallsalesfortheperiodandpricerangeindicated)
Median Percent of Original List Price Received by Price Range
$1,000,000-$1,499,99997.8%98.0%-0.2%96.3%98.3%-2.0%
Median Percent of Original List Price Received by Price Range
$1,500,000-$1,999,99993.2%95.8%-2.7%95.5%98.8%-3.3%
$2,000,000andabove96.6%99.6%-3.0%96.6%95.3%1.4%
All Condos 99.6%100.0%-0.4%98.8%100.0%-1.2% This12-monthperiodreflectstheconsecutive12-monthperiodupthroughthecurrentmonth,whilelastperiod reflectsthesame12-monthperiodoneyearprior.
SOURCE: Honolulu Board of REALTORS®, residential resales compiled from MLS data. ©2023.HonoluluBoardofREALTORS®.AllRightsReserved.Informationhereindeemedreliablebutnotguaranteed.
Condos Aug-23Aug-22%chg 12-mth Median This Period 12-mth Median Last Period%chg $149,999andbelow84.9%94.0%-9.7%95.2%96.7%-1.6% $150,000-$299,99999.8%98.5%1.3%98.2%98.6%-0.4%
$300,000-$399,999100.0%100.0%0.0%99.0%100.0%-1.0% $400,000-$499,999100.0%100.0%0.0%100.0%100.0%0.0% $500,000-$599,999100.0%100.0%0.0%100.0%100.2%-0.2% $600,000-$699,99999.2%100.0%-0.8%98.6%100.8%-2.2% $700,000-$999,999100.0%100.0%0.0%98.8%100.1%-1.3%
75.0% 80.0% 85.0% 90.0% 95.0% 100.0% 105.0% $149,999 and below $150,000$299,999 $300,000$399,999 $400,000$499,999 $500,000$599,999 $600,000$699,999 $700,000$999,999 $1,000,000$1,499,999 $1,500,000$1,999,999 $2,000,000 and above Percent Orig. LP Received Sold Price
1-mth Period: Condos Aug-23 Aug-22 84.0% 86.0% 88.0% 90.0% 92.0% 94.0% 96.0% 98.0% 100.0% 102.0% $149,999 and below $150,000$299,999 $300,000$399,999 $400,000$499,999 $500,000$599,999 $600,000$699,999 $700,000$999,999 $1,000,000$1,499,999 $1,500,000$1,999,999 $2,000,000 and above Percent Orig. LP Received Sold Price
12-mth Period: Condos 12-mth Median This Period 12-mth Median Last Period
Page 21 of 34
New Listings by Price Range: Single-Family Homes
August 2023
OAHU, HAWAII
(Acountofpropertiesthathavebeennewlylistedonthemarketinagivenmonth)

New Listings by Price Range
$449,999andbelow110.0%2129-27.6%
$450,000-$599,9995425.0%7991-13.2%
$600,000-$699,99915887.5%139187-25.7%
$700,000-$799,999312810.7%269382-29.6%
$800,000-$899,9994356-23.2%456597-23.6%
$900,000-$999,9994152-21.2%432659-34.4%
$1,000,000-$1,499,99999119-16.8%1,0231,420-28.0%
$1,500,000-1,999,9995054-7.4%466532-12.4%

$2,000,000-$2,999,9992440-40.0%241331-27.2%
$3,000,000andabove211910.5%240289-17.0%
All Single-Family Homes330381-13.4%3,3664,517-25.5%
This12-monthperiodreflectstheconsecutive12-monthperiodupthroughthecurrentmonth,whilelastperiod reflectsthesame12-monthperiodoneyearprior.
SOURCE: Honolulu Board of REALTORS®, residential resales compiled from MLS data. ©2023.HonoluluBoardofREALTORS®.AllRightsReserved.Informationhereindeemedreliablebutnotguaranteed.
Single-Family HomesAug-23Aug-22%chg 12-mth Total This Period 12-mth Total Last Period %chg
0 20 40 60 80 100 120 140 $449,999 and below $450,000$599,999 $600,000$699,999 $700,000$799,999 $800,000$899,999 $900,000$999,999 $1,000,000$1,499,999 $1,500,0001,999,999 $2,000,000$2,999,999 $3,000,000 and above New Listings Original List Price
1-mth Period: Single-Family Homes Aug-23 Aug-22 0 200 400 600 800 1,000 1,200 1,400 1,600 $449,999 and below $450,000$599,999 $600,000$699,999 $700,000$799,999 $800,000$899,999 $900,000$999,999 $1,000,000$1,499,999 $1,500,0001,999,999 $2,000,000$2,999,999 $3,000,000 and above New Listings Original List Price
12-mth Period: Single-Family Homes 12-mth Total This Period 12-mth Total Last Period
New Listings by Price Range
Page 22 of 34
New Listings by Price Range: Condos August 2023
OAHU, HAWAII
(Acountofpropertiesthathavebeennewlylistedonthemarketinagivenmonth)
$149,999andbelow89-11.1%193198-2.5%
$150,000-$299,9996571-8.5%7141,038-31.2%
$300,000-$399,9998197-16.5%9381,216-22.9%
$400,000-$499,9991051005.0%1,0101,386-27.1%
$500,000-$599,999947623.7%9091,132-19.7%
$600,000-$699,9996374-14.9%733903-18.8%
$700,000-$999,99978117-33.3%9861,362-27.6%
$1,000,000-$1,499,9993033-9.1%388455-14.7%

$1,500,000-$1,999,999111010.0%1901815.0%
$2,000,000andabove1421-33.3%2041888.5%
All Condos 549608-9.7%6,2658,059-22.3%
This12-monthperiodreflectstheconsecutive12-monthperiodupthroughthecurrentmonth,whilelastperiod reflectsthesame12-monthperiodoneyearprior.
SOURCE: Honolulu Board of REALTORS®, residential resales compiled from MLS data. ©2023.HonoluluBoardofREALTORS®.AllRightsReserved.Informationhereindeemedreliablebutnotguaranteed.
Condos Aug-23Aug-22%chg 12-mth Total This Period 12-mth Total Last Period %chg
0 20 40 60 80 100 120 140 $149,999 and below $150,000$299,999 $300,000$399,999 $400,000$499,999 $500,000$599,999 $600,000$699,999 $700,000$999,999 $1,000,000$1,499,999 $1,500,000$1,999,999 $2,000,000 and above New Listings Original List Price
Listings by Price Range 1-mth Period: Condos Aug-23 Aug-22 0 200 400 600 800 1,000 1,200 1,400 1,600 $149,999 and below $150,000$299,999 $300,000$399,999 $400,000$499,999 $500,000$599,999 $600,000$699,999 $700,000$999,999 $1,000,000$1,499,999 $1,500,000$1,999,999 $2,000,000 and above New Listings Original List Price New Listings by Price Range 12-mth Period: Condos 12-mth Total This Period 12-mth Total Last Period
New
Page 23 of 34
Pending Sales by Price Range: Single-Family Homes
August 2023
OAHU, HAWAII
(Ameasureofcontractactivity/acountofpropertiesthathavehadoffersacceptedontheminagivenmonth)

Pending Sales by Price Range
$449,999andbelow330.0%2931-6.5%
$450,000-$599,9998560.0%71103-31.1%
$600,000-$699,9991214-14.3%130198-34.3%
$700,000-$799,9993031-3.2%261375-30.4%
$800,000-$899,9993648-25.0%431565-23.7%
$900,000-$999,9992939-25.6%362646-44.0%
Pending Sales by Price Range
$1,000,000-$1,499,99992107-14.0%9101,320-31.1%
$1,500,000-1,999,99929290.0%308446-30.9%
$2,000,000-$2,999,9991427-48.1%174245-29.0%
$3,000,000andabove14955.6%128174-26.4%
All Single-Family Homes 267312-14.4%2,8044,103-31.7%
This12-monthperiodreflectstheconsecutive12-monthperiodupthroughthecurrentmonth,whilelastperiod reflectsthesame12-monthperiodoneyearprior.
SOURCE: Honolulu Board of REALTORS®, residential resales compiled from MLS data. ©2023.HonoluluBoardofREALTORS®.AllRightsReserved.Informationhereindeemedreliablebutnotguaranteed.
Single-Family HomesAug-23Aug-22%chg 12-mth Total This Period 12-mth Total Last Period%chg
0 20 40 60 80 100 120 $449,999 and below $450,000$599,999 $600,000$699,999 $700,000$799,999 $800,000$899,999 $900,000$999,999 $1,000,000$1,499,999 $1,500,0001,999,999 $2,000,000$2,999,999 $3,000,000 and above Pending Sales Current List Price
1-mth Period: Single-Family Homes Aug-23 Aug-22 0 200 400 600 800 1,000 1,200 1,400 $449,999 and below $450,000$599,999 $600,000$699,999 $700,000$799,999 $800,000$899,999 $900,000$999,999 $1,000,000$1,499,999 $1,500,0001,999,999 $2,000,000$2,999,999 $3,000,000 and above Pending Sales Current List Price
12-mth Period: Single-Family Homes 12-mth Total This Period 12-mth Total Last Period
Page 24 of 34
Pending Sales by Price Range: Condos
August 2023
OAHU, HAWAII
(Ameasureofcontractactivity/acountofpropertiesthathavehadoffersacceptedontheminagivenmonth)
Pending Sales by Price Range
$149,999andbelow141216.7%156208-25.0%
$150,000-$299,9994860-20.0%589896-34.3%
$300,000-$399,9995884-31.0%8111,152-29.6%
$400,000-$499,9997582-8.5%8301,302-36.3%
$500,000-$599,999725530.9%718992-27.6%
$600,000-$699,9994352-17.3%602792-24.0%
Pending Sales by Price Range
$700,000-$999,9997386-15.1%7241,078-32.8%
$1,000,000-$1,499,99925250.0%233333-30.0%
$1,500,000-$1,999,99910825.0%94107-12.1%
$2,000,000andabove711-36.4%96115-16.5%
All Condos 425475-10.5%4,8536,975-30.4% This12-monthperiodreflectstheconsecutive12-monthperiodupthroughthecurrentmonth,whilelastperiod reflectsthesame12-monthperiodoneyearprior.
SOURCE: Honolulu Board of REALTORS®, residential resales compiled from MLS data. ©2023.HonoluluBoardofREALTORS®.AllRightsReserved.Informationhereindeemedreliablebutnotguaranteed.
Condos Aug-23Aug-22%chg 12-mth Total This Period 12-mth Total Last Period%chg
0 10 20 30 40 50 60 70 80 90 100 $149,999 and below $150,000$299,999 $300,000$399,999 $400,000$499,999 $500,000$599,999 $600,000$699,999 $700,000$999,999 $1,000,000$1,499,999 $1,500,000$1,999,999 $2,000,000 and above Pending Sales Current List Price
1-mth Period: Condos Aug-23 Aug-22 0 200 400 600 800 1,000 1,200 1,400 $149,999 and below $150,000$299,999 $300,000$399,999 $400,000$499,999 $500,000$599,999 $600,000$699,999 $700,000$999,999 $1,000,000$1,499,999 $1,500,000$1,999,999 $2,000,000 and above Pending Sales Current List Price
12-mth Period: Condos 12-mth Total This Period 12-mth Total Last Period
Page 25 of 34
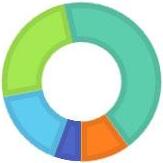
Active Inventory* by Price Range: Single-Family Homes
August 2023
OAHU, HAWAII
(Thenumberofpropertiesactiveonmarketattheendofagivenmonth)
Single-Family HomesAug-23Aug-22YOY chg
$449,999andbelow4333.3%
Active Inventory by Price Range
$450,000-$599,999135160.0%
$600,000-$699,999312240.9%
$700,000-$799,999393511.4%
$800,000-$899,9996976-9.2%
$900,000-$999,999585211.5%
$1,000,000-$1,499,999146158-7.6%
Active Inventory - Percent Share by Price Range (portionoftotalactivestatuslistingsrepresentedbyagivenpricerange)
$1,500,000-1,999,999927817.9%
$2,000,000-$2,999,9995768-16.2%
$3,000,000andabove8999-10.1%
All Single-Family Homes 5985960.3%
*Indicatormodifiedasof2021toreflectActivestatuslistingsonlyandappliedtohistoricalmonthlydatashownabove.Previousreportindicator,referredtoasActiveListings,reflectedallactivelymarketedlistingsinAandC status.

SOURCE: Honolulu Board of REALTORS®, residential resales compiled from MLS data. ©2023.HonoluluBoardofREALTORS®.AllRightsReserved.Informationhereindeemedreliablebutnotguaranteed.
0 20 40 60 80 100 120 140 160 180 $449,999 and below $450,000$599,999 $600,000$699,999 $700,000$799,999 $800,000$899,999 $900,000$999,999 $1,000,000$1,499,999 $1,500,0001,999,999 $2,000,000$2,999,999 $3,000,000 and above Active Listings Current List Price
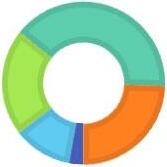
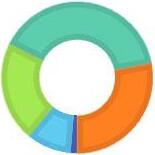
Single-Family Homes Aug-23 Aug-22 1%10% 21% 40% 28% AUG-22 $599,999 and below $600,000 to $799,999 $800,000 to $999,999 $1,000,000 to $1,999,999 $2,000,000 and above 3% 12% 21% 40% 24% AUG-23 $599,999 and below $600,000 to $799,999 $800,000 to $999,999 $1,000,000 to $1,999,999 $2,000,000 and above
Page 26 of 34
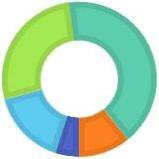
Active Inventory* by Price Range: Condos August 2023
OAHU, HAWAII
(Thenumberofpropertiesactiveonmarketattheendofagivenmonth)
Condos Aug-23Aug-22YOY chg
$149,999andbelow4417158.8%
Active Inventory by Price Range
$150,000-$299,999126159-20.8%
$300,000-$399,99913911520.9%
$400,000-$499,99914812815.6%
$500,000-$599,9991329834.7%
$600,000-$699,9991119813.3%
$700,000-$999,999198219-9.6%
Active Inventory - Percent Share by Price Range (portionoftotalactivestatuslistingsrepresentedbyagivenpricerange)
$1,000,000-$1,499,999103111-7.2%
$1,500,000-$1,999,9995859-1.7%
$2,000,000andabove876926.1%

All Condos 1,1461,0736.8% *Indicatormodifiedasof2021toreflectActivestatuslistingsonlyandappliedtohistoricalmonthlydatashownabove.Previousreportindicator,referredtoasActiveListings,reflectedallactivelymarketedlistingsinAandC status.
SOURCE: Honolulu Board of REALTORS®, residential resales compiled from MLS data. ©2023.HonoluluBoardofREALTORS®.AllRightsReserved.Informationhereindeemedreliablebutnotguaranteed.
0 50 100 150 200 250 $149,999 and below $150,000$299,999 $300,000$399,999 $400,000$499,999 $500,000$599,999 $600,000$699,999 $700,000$999,999 $1,000,000$1,499,999 $1,500,000$1,999,999 $2,000,000 and above Active Listings
List Price
Current
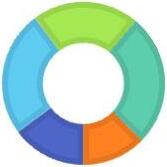
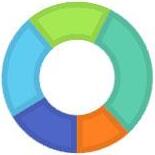
Condos Aug-23 Aug-22 16% 23% 18% 31% 12% AUG-22 $299,999 and below $300,000 to $499,999 $500,000 to $699,999 $700,000 to $1,499,999 $1,500,000 and above 15% 25% 21% 26% 13% AUG-23 $299,999 and below $300,000 to $499,999 $500,000 to $699,999 $700,000 to $1,499,999 $1,500,000 and above
Page 27 of 34
Active Inventory*: Single-Family Homes and Condos

August 2023 OAHU, HAWAII
iousreportindicator,referredtoasActiveListings,reflectedallactivelymarketedlistingsinAandCstatus.

SOURCE: Honolulu Board of REALTORS®, residential resales compiled from MLS data. ©2023.HonoluluBoardofREALTORS®.AllRightsReserved.Informationhereindeemedreliablebutnotguaranteed.

Single-Family Homes A-21S-21O-21N-21D-21J-22F-22M-22A-22M-22J-22J-22A-22S-22O-22N-22D-22J-23F-23M-23A-23M-23J-23J-23A-23 $599,999 and below 151318131381111101415128101416151224181513182117 $600,000 to $799,999 43393934242240382738465957648094676562695560666870 $800,000 to $999,999 7078625444544952719399113128133157148143121115127117117130121127 $1,000,000 to $1,999,999 145165155135101111139139160193218226236251243251216207204191201209240229238 $2,000,000 and above 143142127130127116109120127133149166167171162173156146142136147144151152146 Total 416437401366309311348360395471527576596629656682597551547541535543605591598 Condos
$299,999 and below 217227218205198188204188194187199188176184183189185179185183182184177177170 $300,000 to $499,999 266298302275248250243205194219229238243263267292261277282251251252273272287 $500,000 to $699,999 142152158189158183183165161162171172196250274272245243229251244236252233243 $700,000 to $1,499,999 191206218227203216232232240253271328330317325340318329322308307289309323301 $1,500,000 and above 134147143137139130127129128118128124128127145151161168159159160157148149145 Total 9501,0301,0391,0339469679899199179399981,0501,0731,1411,1941,2441,1701,1961,1771,1521,1441,1181,1591,1541,146 *Indicatormodifiedasof2021toreflectActivestatuslistingsonlyandappliedtohistoricalmonthlydatashownabove.Prev
0 50 100 150 200 250 300 Aug-21 Aug-22 Aug-23 Listings Active Inventory Single-Family Homes $599,999 and below $600,000 to $799,999 $800,000 to $999,999 $1,000,000 to $1,999,999 $2,000,000 and above 0 50 100 150 200 250 300 350 400 Aug-21 Aug-22 Aug-23 Lisings Active Inventory Condos $299,999 and below $300,000 to $499,999 $500,000 to $699,999 $700,000 to $1,499,999 $1,500,000 and above
A-21S-21O-21N-21D-21J-22F-22M-22A-22M-22J-22J-22A-22S-22O-22N-22D-22J-23F-23M-23A-23M-23J-23J-23A-23
Page 28 of 34
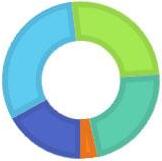
Total Inventory In Escrow* by Price Range: Single-Family Homes August 2023
OAHU, HAWAII
(Thenumberofpropertiesinanescrowstatusattheendofagivenmonth)
Single-Family HomesAug-23Aug-22YOY chg
Total Inventory In Escrow by Price Range
$449,999andbelow58-37.5%
$450,000-$599,999171513.3%
$600,000-$699,9991725-32.0%
$700,000-$799,9994748-2.1%
$800,000-$899,9995365-18.5%
$900,000-$999,9994360-28.3%
Total Inventory In Escrow - Percent Share by Price Range
(portionoftotalinventoryinescrowrepresentedbyagivenprice range)
$1,000,000-$1,499,999130148-12.2%
$1,500,000-1,999,9994043-7.0%
$2,000,000-$2,999,9992033-39.4% $3,000,000andabove191711.8% All Single-Family Homes 391462-15.4%
*Newindicatoraddedtoreportsasof2021,includingapplicablehistoricaldata.

SOURCE: Honolulu Board of REALTORS®, residential resales compiled from MLS data. ©2023.HonoluluBoardofREALTORS®.AllRightsReserved.Informationhereindeemedreliablebutnotguaranteed.
0 20 40 60 80 100 120 140 160 $449,999 and below $450,000$599,999 $600,000$699,999 $700,000$799,999 $800,000$899,999 $900,000$999,999 $1,000,000$1,499,999 $1,500,0001,999,999 $2,000,000$2,999,999 $3,000,000 and above Active Listings Current List Price
Single-Family Homes Aug-23 Aug-22 5% 16% 27% 41% 11% AUG-22 $599,999 and below $600,000 to $799,999 $800,000 to $999,999 $1,000,000 to $1,999,999 $2,000,000 and above 6% 16% 25% 43% 10% AUG-23 $599,999 and below $600,000 to $799,999 $800,000 to $999,999 $1,000,000 to $1,999,999 $2,000,000 and above
Page 29 of 34
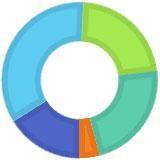
Total Inventory In Escrow* by Price Range: Condos August 2023
OAHU, HAWAII
(Thenumberofpropertiesinanescrowstatusattheendofagivenmonth)
Condos Aug-23Aug-22YOY chg
Total Inventory In Escrow by Price Range
$149,999andbelow1920-5.0%
$150,000-$299,9998186-5.8%
$300,000-$399,99981111-27.0%
$400,000-$499,999103115-10.4%
$500,000-$599,999908012.5%
$600,000-$699,9996266-6.1%
$700,000-$999,99999121-18.2%
Total Inventory In Escrow - Percent Share by Price Range
$1,000,000-$1,499,999352825.0%
$1,500,000-$1,999,9991012-16.7%
$2,000,000andabove1015-33.3%
All Condos 590654-9.8%
*Newindicatoraddedtoreportsasof2021,includingapplicablehistoricaldata.

SOURCE: Honolulu Board of REALTORS®, residential resales compiled from MLS data. ©2023.HonoluluBoardofREALTORS®.AllRightsReserved.Informationhereindeemedreliablebutnotguaranteed.
(portionoftotalinventoryinescrowrepresentedbyagivenprice range) 0 20 40 60 80 100 120 140 $149,999 and below $150,000$299,999 $300,000$399,999 $400,000$499,999 $500,000$599,999 $600,000$699,999 $700,000$999,999 $1,000,000$1,499,999 $1,500,000$1,999,999 $2,000,000 and above Active Listings Current List Price
Condos Aug-23 Aug-22 16% 35% 22% 23% 4% AUG-22 $299,999 and below $300,000 to $499,999 $500,000 to $699,999 $700,000 to $1,499,999 $1,500,000 and above 17% 31% 26% 23% 3% AUG-23 $299,999 and below $300,000 to $499,999 $500,000 to $699,999 $700,000 to $1,499,999 $1,500,000 and above
Page 30 of 34
Months Supply of Active Inventory by Price Range: Single-Family Homes August 2023
OAHU, HAWAII
(Comparesactiveinventorytoarolling12-monthaverageclosedsales)

Single-Family HomesAug-23Aug-22YOY chg
Months Supply of Inventory by Price Range
$449,999andbelow2.01.0100.0%
$450,000-$599,9992.60.7271.4%
$600,000-$699,9993.11.782.4%
$700,000-$799,9992.11.361.5%
$800,000-$899,9992.11.816.7%
$900,000-$999,9992.11.0110.0%
Months Supply of Inventory
SOURCE:
$3,000,000andabove9.95.870.7% All Single-Family Homes 2.71.758.8% 0 3 6 9 12 $449,999 and below $450,000$599,999 $600,000$699,999 $700,000$799,999 $800,000$899,999 $900,000$999,999 $1,000,000$1,499,999 $1,500,0001,999,999 $2,000,000$2,999,999 $3,000,000 and above Months of Inventory Current List Price
$1,000,000-$1,499,9992.01.353.8% $1,500,000-1,999,9993.71.8105.6% $2,000,000-$2,999,9994.13.132.3%
Single-Family Homes Aug-23 Aug-22 0 2 4 6 8 Aug-21 Aug-22 Aug-23 Months of Inventory
Single-Family Homes $599,999 and below $600,000 to $799,999 $800,000
$999,999 $1,000,000
$2,000,000
to
to $1,999,999
and above
Page 31 of 34
Honolulu Board of REALTORS®, residential resales compiled from MLS data. ©2023.HonoluluBoardofREALTORS®.AllRightsReserved.Informationhereindeemedreliablebutnotguaranteed.
Months Supply of Active Inventory by Price Range: Condos August 2023
OAHU, HAWAII
(Comparesactiveinventorytoarolling12-monthaverageclosedsales)

Condos Aug-23Aug-22YOY chg
Months Supply of Inventory by Price Range
$149,999andbelow3.11.0210.0%
$150,000-$299,9992.62.123.8%
$300,000-$399,9992.11.361.5%
$400,000-$499,9992.11.275.0%
$500,000-$599,9992.21.1100.0%
$600,000-$699,9992.31.553.3%
Months Supply of Inventory
$700,000-$999,9993.12.147.6%
$1,000,000-$1,499,9995.23.644.4%
$1,500,000-$1,999,9997.36.610.6% $2,000,000andabove10.97.741.6%
SOURCE: Honolulu Board of REALTORS®, residential resales compiled from MLS data. ©2023.HonoluluBoardofREALTORS®.AllRightsReserved.Informationhereindeemedreliablebutnotguaranteed.
All Condos 2.81.855.6% 0 3 6 9 12 $149,999 and below $150,000$299,999 $300,000$399,999 $400,000$499,999 $500,000$599,999 $600,000$699,999 $700,000$999,999 $1,000,000$1,499,999 $1,500,000$1,999,999 $2,000,000 and above Months of Inventory Current List Price
Condos Aug-23 Aug-22 0 2 4 6 8 10 12 Aug-21 Aug-22 Aug-23 Months of Inventory
Condos $299,999 and below $300,000 to $499,999 $500,000 to $699,999 $700,000
$1,499,999 $1,500,000 and
to
above
Page 32 of 34

Closed
Single-Family Homes and Condos OAHU, HAWAII: Jan 1987 to the Present 0 100 200 300 400 500 600 700 800 900 1987198819891990199119921993199419951996199719981999200020012002200320042005200620072008200920102011201220132014201520162017201820192020202120222023 Closed Sales SFH Closed Sales CONDO SOURCE: Honolulu Board of REALTORS®, compiled from MLS data. ©2023. Honolulu Board of REALTORS®. All Rights Reserved. Information herein deemed reliable but not guaranteed. Page 33 of 34
Sales