Oahu Monthly Housing Statistics
May 2023

Monthly Indicators 2 Median Sales Price YoY %chg Price Graphs 3-4 $1,109,000-3.9% Closed Sales 5 Closed Sales YoY %chg Median Sales Price 6 Average Sales Price 7 262 -23.8% Median Days on Market 8 Percent of Original List Price Received 9 Average Sales Price YoY %chg New Listings 10 Pending Sales 11 $1,355,804-6.5% Active Inventory 12 Total Inventory In Escrow 13 Months Supply of Active Inventory 14 Housing Supply Overview 15 Median Sales Price YoY %chg Closed Sales (by price range) 16-17 Median Days on Market (by price range) 18-19 $505,000-2.2% Percent of Original List Price Received (by price range)20-21 New Listings (by price range) 22-23 Closed Sales YoY %chg Pending Sales (by price range) 24-25 Active Inventory (by price range) 26-27 438 -36.3% Active Inventory History 28 Total Inventory In Escrow (by price range) 29-30 Average Sales Price YoY %chg Months Supply of Active Inventory (by price range)31-32 $623,748-0.3% Historical Graphs 33-34 YoY % chg = year-over-year percent change comparing current month to the same month last year. SOURCE: Honolulu Board of REALTORS®, residential resales data compiled from HiCentral MLS, Ltd.® ©2023. Honolulu Board of REALTORS®. All Rights Reserved. Information herein deemed reliable but not guaranteed. CONTENTS: CONDOS
SINGLE-FAMILY HOMES Page 1 of 34
Monthly Indicators
*seefootnotesonpages9-12regardingmethodologyupdatesYoY%chg=year-over-yearpercentchangecomparingcurrentmonthtothesamemonthlastyear. MoM%chg=month-over-monthpercentchangecomparingcurrentmonthtothepreviousmonth.
*seefootnotesonpages9-12regardingmethodologyupdates1-yr%chg=percentchangecomparingthecurrentYTDtimeperiodtothesameYTDtimeperiodoneyearago. 2-yr%chg=percentchangecomparingthecurrentYTDtimeperiodtothesameYTDtimeperiodtwoyearsago.
SOURCE: Honolulu Board of REALTORS®, residential resales compiled from MLS data. ©2023.HonoluluBoardofREALTORS®.AllRightsReserved.Informationhereindeemedreliablebutnotguaranteed.
May 2023 May-23 May-22YoY %chgApr-23MoM %chg May-23 May-22YoY %chgApr-23MoM %chg Closed Sales 262 344-23.8%20826.0% 438 688-36.3%4204.3% Median Sales Price $1,109,000 $1,153,500-3.9%$999,99510.9% $505,000 $516,500-2.2%$500,0001.0% Average Sales Price $1,355,804 $1,450,008-6.5%$1,223,38310.8% $623,748 $625,327-0.3%$603,7953.3% Median Days on Market 21 10110.0%24-12.5% 20 10100.0%200.0% Percent of Orig. List Price Received 98.7% 102.2%-3.4%98.3%0.4% 99.0% 100.0%-1.0%98.7%0.3% New Listings 309 445-30.6%2925.8% 582 687-15.3%5329.4% Pending Sales* 258 356-27.5%271-4.8% 507 601-15.6%43815.8% Active Inventory* 543 47115.3%5351.5% 1,118 93919.1%1,144-2.3% Total Inventory in Escrow* 418 583-28.3%435-3.9% 686 856-19.9%62310.1% Months Supply of Active Inventory* 2.2 1.369.2%2.14.8% 2.6 1.573.3%2.54.0%
OAHU, HAWAII
Year-to-Date YTD-2023 YTD-20221-yr %chgYTD-20212-yr %chg YTD-2023 YTD-20221-yr %chgYTD-20212-yr %chg Closed Sales 1,029 1,597-35.6%1,692-39.2% 1,902 3,070-38.0%2,707-29.7% Median Sales Price $1,049,500 $1,115,000-5.9%$935,00012.2% $500,000 $510,000-2.0%$454,00010.1% Average Sales Price $1,319,079 $1,440,993-8.5%$1,184,79011.3% $621,029 $617,6600.5%$531,09116.9% Median Days on Market 27 10170.0%9200.0% 23 11109.1%1464.3% Percent of Orig. List Price Received 97.6% 101.8%-4.1%100.9%-3.3% 98.5% 100.0%-1.5%99.2%-0.7% New Listings 1,395 1,968-29.1%2,015-30.8% 2,630 3,528-25.5%3,386-22.3% Pending Sales* 1,271 1,737-26.8%1,945-34.7% 2,166 3,172-31.7%3,188-32.1%
Single-Family Homes Condos Single-Family Homes Condos
Page 2 of 34


5 2 6 28 37 29 19 30 33 10 11 6 9 5 2 0 17 13 1 5 11 22 37 41 31 33 27 30 20 17 8 7 6 5 25 18 0 5 10 15 20 25 30 35 40 45 Closed Sales Sold Price ($)
Homes Sold May 2023 vs. May 2022 2023 2022 SOURCE: Honolulu Board of REALTORS®, compiled from MLS data. ©2023. Honolulu Board of REALTORS®. All Rights Reserved. Information herein deemed reliable but not guaranteed. Page 3 of 34
Single-Family

7 22 43 62 80 73 51 36 22 11 24 7 11 21 67 107 111 112 65 78 43 12 47 14 0 20 40 60 80 100 120 Closed Sales Sold Price ($) Condos Sold May 2023 vs. May 2022 2023 2022 SOURCE: Honolulu Board of REALTORS®, compiled from MLS data. ©2023. Honolulu Board of REALTORS®. All Rights Reserved. Information herein deemed reliable but not guaranteed. Page 4 of 34
Closed Sales

2023 OAHU, HAWAII
May
in a given month) Mo-Yr Single-Family HomesCondosTotal May-20248 254 502 Jun-20302 312 614 Jul-20361 426 787 Aug-20370 409 779 Sep-20391 456 847 Oct-20345 480 825 Nov-20338 407 745 Dec-20420 514 934 Jan-21291 392 683 Feb-21260 446 706 Mar-21361 626 987 Apr-21375 645 1,020 May-21405 598 1,003 Jun-21451 730 1,181 Jul-21404 671 1,075 Aug-21425 675 1,100 Sep-21424 615 1,039 Oct-21381 611 992 Nov-21371 601 972 Dec-21378 593 971 Jan-22326 552 878 Feb-22241 486 727 Mar-22321 672 993 Monthly Closed Sales Year-to-Date Closed Sales Apr-22365 672 1,037 MaySFHYoY %chgCNDYoY %chg MayYTD SFHYoY %chgYTD CNDYoY %chg May-22344 688 1,032 202140563.3%598135.4% 20211,69229.1%2,70759.0% Jun-22357 626 983 2022344-15.1%68815.1% 20221,597-5.6%3,07013.4% Jul-22312 518 830 2023262-23.8%438-36.3% 2023 1,029-35.6%1,902-38.0% Aug-22314 508 822 Sep-22278 496 774 Oct-22222 435 657 Nov-22192 340 532 Dec-22202 360 562 Jan-23150 275 425 Feb-23173 325 498 Mar-23236 444 680 Apr-23208 420 628 May-23262 438 700
(A count of properties that have closed
0 100 200 300 400 500 600 700 800 Sales Closed Sales Single-Family Homes Condos 0 500 1,000 1,500 2,000 202120222023 Closed Sales SFH (YTD) 0 1,000 2,000 3,000 4,000 202120222023 Closed Sales CND (YTD) 0 100 200 300 400 500 202120222023 Closed Sales SFH (May) 0 200 400 600 800 202120222023 Closed Sales CND (May)
Page 5 of 34
SOURCE: Honolulu Board of REALTORS®, residential resales compiled from MLS data. ©2023. Honolulu Board of REALTORS®. All Rights Reserved. Information herein deemed reliable but not guaranteed.
Median Sales Price
May 2023
OAHU, HAWAII
Mo/Yr Single-Family HomesCondos
May-20$797,000$399,000
Jun-20$770,000$421,500
Jul-20$815,000$440,000
Aug-20$839,000$430,000
Sep-20$880,000$445,000
Oct-20$865,000$439,500
Nov-20$872,500$420,000
Dec-20$870,000$455,000
Jan-21$883,000$452,000
Feb-21$917,500$457,500
Mar-21$950,000$451,000
Apr-21$928,000$450,000
May-21$978,000$457,750
Jun-21$979,000$460,000
Jul-21$992,500$475,000
Aug-21$1,050,000$500,000
Sep-21$1,050,000$478,000
Oct-21$1,000,000$500,000
Nov-21$1,050,000$500,000
Dec-21$1,050,000$485,000
Jan-22$1,050,000$510,000
Feb-22$1,125,000$497,000
Mar-22$1,150,000$515,500
(The median sales price of all closed properties in a given month)
Monthly Median Sales Price Year-to-Date Median Sales Price Apr-22$1,105,000$510,000 MaySFHYoY %chgCNDYoY %chg MayYTD SFHYoY %chgYTD CNDYoY %chg May-22$1,153,500$516,500 2021$978,00022.7%$457,75014.7% 2021$935,00018.5%$454,0005.8% Jun-22$1,100,000$534,000 2022$1,153,50017.9%$516,50012.8% 2022$1,115,00019.3%$510,00012.3% Jul-22$1,107,944$500,000 2023$1,109,000-3.9%$505,000-2.2% 2023$1,049,500-5.9%$500,000-2.0% Aug-22$1,125,500$498,500 Sep-22$1,100,000$502,500 Oct-22$1,050,000$520,000 Nov-22$1,149,500$480,000 Dec-22$1,049,500$502,500 Jan-23$970,000$495,000 Feb-23$987,000$480,000 Mar-23$1,083,750$536,000 Apr-23$999,995$500,000 May-23$1,109,000$505,000
$0 $200,000 $400,000 $600,000 $800,000 $1,000,000 $1,200,000 $1,400,000 Price ($)
Sales Price
0K 200K 400K 600K 800K 1.0M 1.2M 202120222023 Price ($) SFH (YTD) 0K 100K 200K 300K 400K 500K 600K 202120222023 Price ($) CND (YTD) 0K 500K 1.0M 1.5M 202120222023 Price ($) SFH (May) 0K 100K 200K 300K 400K 500K 600K 202120222023 Price ($) CND (May)
Median
Single-Family Homes Condos
Page 6 of 34
SOURCE: Honolulu Board of REALTORS®, residential resales compiled from MLS data. ©2023. Honolulu Board of REALTORS®. All Rights Reserved. Information herein deemed reliable but not guaranteed.
Average Sales Price
OAHU, HAWAII
(The average sales price of all closed properties in a given month)
May-20$1,003,419$453,220
Jun-20$899,271$481,220
Jul-20$1,016,491$475,346
Aug-20$1,022,449$527,573
Sep-20$1,073,692$545,367
Oct-20$1,065,594$479,736
Nov-20$1,084,834$472,726
Dec-20$1,113,076$504,222
Jan-21$1,050,263$496,296
Feb-21$1,172,804$545,629
Mar-21$1,226,827$530,257
Apr-21$1,194,150$520,192
May-21$1,246,611$555,798
Jun-21$1,225,011$557,302
Jul-21$1,265,382$544,064
Aug-21$1,316,681$618,612
SOURCE: Honolulu Board of REALTORS®, residential resales compiled from MLS data. ©2023. Honolulu Board of REALTORS®. All Rights Reserved. Information herein deemed reliable but not guaranteed.
Average Sales Price
May 2023
Mo/Yr Single-Family HomesCondos
Mar-22$1,570,668$623,684 Monthly Average Sales Price Year-to-Date Average Sales Price Apr-22$1,404,481$613,189 MaySFHYoY %chgCNDYoY %chg MayYTD SFHYoY %chgYTD CNDYoY %chg May-22$1,450,008$625,327 2021$1,246,61124.2%$555,79822.6% 2021$1,184,79023.7%$531,0914.0% Jun-22$1,382,559$631,822 2022$1,450,00816.3%$625,32712.5% 2022$1,440,99321.6%$617,66016.3% Jul-22$1,329,023$590,934 2023$1,355,804-6.5%$623,748-0.3% 2023$1,319,079-8.5%$621,0290.5% Aug-22$1,341,958$547,319 Sep-22$1,307,249$607,502 Oct-22$1,243,960$676,988 Nov-22$1,387,685$594,444 Dec-22$1,325,156$576,689 Jan-23$1,139,294$633,441 Feb-23$1,427,864$592,131 Mar-23$1,391,538$651,630 Apr-23$1,223,383$603,795 May-23$1,355,804$623,748
Sep-21$1,289,510$558,002 Oct-21$1,335,171$582,509 Nov-21$1,296,551$559,007 Dec-21$1,303,481$604,749 Jan-22$1,277,309$623,928 Feb-22$1,486,088$583,367
$0 $200,000 $400,000 $600,000 $800,000 $1,000,000 $1,200,000 $1,400,000 $1,600,000 $1,800,000 Price ($)
Single-Family Homes Condos 0K 500K 1.0M 1.5M 2.0M 202120222023 Price ($) SFH (YTD) 0K 200K 400K 600K 800K 202120222023 Price ($) CND (YTD) 0K 500K 1.0M 1.5M 2.0M 202120222023 Price ($) SFH (May) 0K 200K 400K 600K 800K 202120222023 Price ($) CND (May)
Page 7 of 34
Housing Supply Overview
May 2023
(Ayear-over-yearoverviewoftheavailabilityandsalesofpropertiesinagivenmonth,bypricerange)
SOURCE: Honolulu Board of REALTORS®, residential resales compiled from MLS data. ©2023.HonoluluBoardofREALTORS®.AllRightsReserved.Informationhereindeemedreliablebutnotguaranteed.

OAHU, HAWAII
Single-Family HomesMay-23May-22%chgMay-23May-22%chgMay-23May-22%chgMay-23May-22%chgMay-23May-22%chgMay-23May-22%chgMay-23May-22 %chgMay-23May-22%chg $449,999 and below 40-237--62.8%--06-100.0%23-33.3%46-33.3%511-54.5%2.02.00.0% $450,000 - $599,999 36-50.0%3514150.0%100.5%100.0%0.5%57-28.6%56-16.7%9812.5%1319-31.6%1.50.966.7% $600,000 - $699,999 611-45.5%678737.5%93.7%101.5%-7.7%920-55.0%1018-44.4%221546.7%1727-37.0%2.40.9166.7% $700,000 - $799,999 282227.3%219133.3%99.7%103.7%-3.9%2833-15.2%2229-24.1%382365.2%3850-24.0%1.90.7171.4% $800,000 - $899,999 37370.0%229144.4%100.0%103.2%-3.1%4556-19.6%4653-13.2%583565.7%7786-10.5%1.80.7157.1% $900,000 - $999,999 2941-29.3%258212.5%97.3%103.3%-5.8%4468-35.3%3857-33.3%59581.7%5094-46.8%1.81.250.0% $1,000,000 - $1,499,999 103141-27.0%181080.0%99.5%103.3%-3.7%95148-35.8%77107-28.0%129134-3.7%120166-27.7%1.51.136.4% $1,500,000 - 1,999,999 2243-48.8%229144.4%99.1%101.2%-2.1%45434.7%3642-14.3%805935.6%5566-16.7%3.01.3130.8% $2,000,000 - $2,999,999 1725-32.0%14137.7%97.7%100.4%-2.7%1736-52.8%1527-44.4%514610.9%2642-38.1%3.22.060.0% $3,000,000 and above 1318-27.8%533551.4%95.5%96.4%-0.9%2128-25.0%714-50.0%93876.9%1722-22.7%10.35.1102.0% All Single-Family Homes262344-23.8%2110110.0%98.7%102.2%-3.4%309445-30.6%258356-27.5%54347115.3%418583-28.3%2.21.369.2% Condos May-23May-22%chgMay-23May-22%chgMay-23May-22%chgMay-23May-22%chgMay-23May-22%chgMay-23May-22%chgMay-23May-22%chgMay-23May-22%chg $149,999 and below 1720-15.0%1120-45.0%100.0%100.0%0.0%1821-14.3%1618-11.1%473727.0%2327-14.8%3.41.888.9% $150,000 - $299,999 5579-30.4%201625.0%97.5%100.0%-2.5%7476-2.6%6984-17.9%137150-8.7%90116-22.4%2.61.752.9% $300,000 - $399,999 62107-42.1%161233.3%100.0%100.0%0.0%90103-12.6%7582-8.5%1171142.6%103121-14.9%1.71.241.7% $400,000 - $499,999 80111-27.9%17988.9%100.0%100.0%0.0%87113-23.0%7996-17.7%13510528.6%110145-24.1%1.80.9100.0% $500,000 - $599,999 73112-34.8%15966.7%99.8%101.8%-2.0%96933.2%7586-12.8%1268155.6%98124-21.0%2.00.9122.2% $600,000 - $699,999 5165-21.5%189100.0%99.3%100.8%-1.5%6375-16.0%6872-5.6%1108135.8%9293-1.1%2.21.283.3% $700,000 - $999,999 69133-48.1%3610260.0%98.6%100.7%-2.1%88130-32.3%83116-28.4%1771629.3%111153-27.5%2.51.656.3% $1,000,000 - $1,499,999 1531-51.6%2425-4.0%96.0%98.3%-2.3%3554-35.2%2530-16.7%1129123.1%3446-26.1%5.32.982.8% $1,500,000 - $1,999,999 916-43.8%4314207.1%96.9%100.0%-3.1%11110.0%9812.5%59565.4%1116-31.3%7.46.219.4% $2,000,000 and above 714-50.0%14712022.5%95.4%94.6%0.8%201181.8%89-11.1%986258.1%1415-6.7%12.35.6119.6% All Condos 438688-36.3%2010100.0%99.0%100.0%-1.0%582687-15.3%507601-15.6%1,11893919.1%686856-19.9%2.61.573.3% In Escrow Months Supply of Active Inventory Total Inventory In Escrow Months Supply of Active Inventory Total Inventory Active Inventory Active Inventory Closed SalesMedian Days on Market Percent of Original List Price Received Pending Sales Closed SalesMedian Days on Market Percent of Original List Price Received Pending Sales New Listings New Listings
Page 15 of 34
Closed Sales by Price Range: Single-Family Homes
OAHU, HAWAII
(Acountofpropertiesthathaveclosedinagivenmonth)


$449,999andbelow40-2839-28.2%
$450,000-$599,99936-50.0%67112-40.2%
$600,000-$699,999611-45.5%110207-46.9%
$700,000-$799,999282227.3%236395-40.3%
$800,000-$899,99937370.0%399598-33.3%
$900,000-$999,9992941-29.3%394601-34.4%
$3,000,000andabove1318-27.8%113206-45.1%
All Single-Family Homes 262344-23.8%2,9064,431-34.4%
This12-monthperiodreflectstheconsecutive12-monthperiodupthroughthecurrentmonth,whilelastperiod reflectsthesame12-monthperiodoneyearprior.
SOURCE: Honolulu Board of REALTORS®, residential resales compiled from MLS data. ©2023.HonoluluBoardofREALTORS®.AllRightsReserved.Informationhereindeemedreliablebutnotguaranteed.
May 2023
HomesMay-23May-22%chg 12-mth Total This Period 12-mth Total Last Period%chg
Single-Family
$1,000,000-$1,499,999103141-27.0%1,0371,470-29.5% $1,500,000-1,999,9992243-48.8%329522-37.0% $2,000,000-$2,999,9991725-32.0%193281-31.3%
0 20 40 60 80 100 120 140 160 $449,999 and below $450,000$599,999 $600,000$699,999 $700,000$799,999 $800,000$899,999 $900,000$999,999 $1,000,000$1,499,999 $1,500,0001,999,999 $2,000,000$2,999,999 $3,000,000 and above Closed Sales Sold Price Closed Sales by Price Range 1-mth Period: Single-Family Homes May-23 May-22 0 200 400 600 800 1,000 1,200 1,400 1,600 $449,999 and below $450,000$599,999 $600,000$699,999 $700,000$799,999 $800,000$899,999 $900,000$999,999 $1,000,000$1,499,999 $1,500,0001,999,999 $2,000,000$2,999,999 $3,000,000 and above Closed Sales Sold Price Closed Sales by Price Range 12-mth Period: Single-Family Homes 12-mth Total This Period 12-mth Total Last Period
Page 16 of 34
Closed Sales by Price Range: Condos May 2023
OAHU, HAWAII (Acountofpropertiesthathaveclosedinagivenmonth)
$149,999andbelow1720-15.0%168249-32.5%
$150,000-$299,9995579-30.4%6351,060-40.1%
$300,000-$399,99962107-42.1%8321,146-27.4%
$400,000-$499,99980111-27.9%9001,335-32.6%
$500,000-$599,99973112-34.8%7681,109-30.7%
$600,000-$699,9995165-21.5%588826-28.8%
$700,000-$999,99969133-48.1%8491,230-31.0%
$1,000,000-$1,499,9991531-51.6%255375-32.0%
$1,500,000-$1,999,999916-43.8%95110-13.6%
$2,000,000andabove714-50.0%95126-24.6%
All Condos 438688-36.3%5,1857,566-31.5% This12-monthperiodreflectstheconsecutive12-monthperiodupthroughthecurrentmonth,whilelastperiod reflectsthesame12-monthperiodoneyearprior.
SOURCE: Honolulu Board of REALTORS®, residential resales compiled from MLS data. ©2023.HonoluluBoardofREALTORS®.AllRightsReserved.Informationhereindeemedreliablebutnotguaranteed.
Condos May-23May-22%chg 12-mth Total This Period 12-mth Total Last Period%chg
0 20 40 60 80 100 120 140 $149,999 and below $150,000$299,999 $300,000$399,999 $400,000$499,999 $500,000$599,999 $600,000$699,999 $700,000$999,999 $1,000,000$1,499,999 $1,500,000$1,999,999 $2,000,000 and above Closed Sales Sold Price Closed Sales by Price Range 1-mth Period: Condos May-23 May-22 0 200 400 600 800 1,000 1,200 1,400 1,600 $149,999 and below $150,000$299,999 $300,000$399,999 $400,000$499,999 $500,000$599,999 $600,000$699,999 $700,000$999,999 $1,000,000$1,499,999 $1,500,000$1,999,999 $2,000,000 and above Closed Sales Sold Price Closed Sales by Price Range 12-mth Period: Condos 12-mth Total This Period 12-mth Total Last Period
Page 17 of 34
Median Days on Market by Price Range: Single-Family Homes May 2023
OAHU, HAWAII
(Themediannumberofdaysfromwhenapropertyisfirstlistedtowhenanofferisaccepted)
Median Days on Market by Price Range
1-mth Period: Single-Family Homes
$449,999andbelow237--141127.3%
$450,000-$599,9993514150.0%2411118.2%
$600,000-$699,999678737.5%2510150.0%
$700,000-$799,999219133.3%259177.8%
$800,000-$899,999229144.4%199111.1%
Median Days on Market by Price Range
$900,000-$999,999258212.5%151050.0%
$1,000,000-$1,499,999181080.0%151050.0%
$1,500,000-1,999,999229144.4%121020.0% $2,000,000-$2,999,99914137.7%13130.0%
$3,000,000andabove533551.4%382931.0%
All Single-Family Homes 2110110.0%161060.0%

This12-monthperiodreflectstheconsecutive12-monthperiodupthroughthecurrentmonth,whilelastperiod reflectsthesame12-monthperiodoneyearprior.
12-mth
SOURCE: Honolulu Board of REALTORS®, residential resales compiled from MLS data. ©2023.HonoluluBoardofREALTORS®.AllRightsReserved.Informationhereindeemedreliablebutnotguaranteed.
12-mth Median This Period 12-mth Median Last Period%chg
Single-Family HomesMay-23May-22%chg
0 50 100 150 200 250 $449,999 and below $450,000$599,999 $600,000$699,999 $700,000$799,999 $800,000$899,999 $900,000$999,999 $1,000,000$1,499,999 $1,500,0001,999,999 $2,000,000$2,999,999 $3,000,000 and above Days on Market Sold Price
May-23 May-22 0 5 10 15 20 25 30 35 40 $449,999 and below $450,000$599,999 $600,000$699,999 $700,000$799,999 $800,000$899,999 $900,000$999,999 $1,000,000$1,499,999 $1,500,0001,999,999 $2,000,000$2,999,999 $3,000,000 and above Days on Market Sold Price
12-mth Median This Period 12-mth Median Last Period
Period: Single-Family Homes
Page 18 of 34
Median Days on Market by Price Range: Condos
May 2023
OAHU, HAWAII
(Themediannumberofdaysfromwhenapropertyisfirstlistedtowhenanofferisaccepted)
Median Days on Market by Price Range
$149,999andbelow1120-45.0%27270.0%
$150,000-$299,999201625.0%1921-9.5%
$300,000-$399,999161233.3%151315.4%
$400,000-$499,99917988.9%131030.0%
$500,000-$599,99915966.7%14955.6%
Median
$600,000-$699,999189100.0%17988.9%
$700,000-$999,9993610260.0%16977.8%
$1,000,000-$1,499,9992425-4.0%301687.5%
$1,500,000-$1,999,9994314207.1%3537-5.4%

$2,000,000andabove14712022.5%3646-21.7%
All Condos 2010100.0%161145.5%
This12-monthperiodreflectstheconsecutive12-monthperiodupthroughthecurrentmonth,whilelastperiod reflectsthesame12-monthperiodoneyearprior.
SOURCE: Honolulu Board of REALTORS®, residential resales compiled from MLS data. ©2023.HonoluluBoardofREALTORS®.AllRightsReserved.Informationhereindeemedreliablebutnotguaranteed.
Condos May-23May-22%chg 12-mth Median This Period 12-mth Median Last Period%chg
0 20 40 60 80 100 120 140 160 $149,999 and below $150,000$299,999 $300,000$399,999 $400,000$499,999 $500,000$599,999 $600,000$699,999 $700,000$999,999 $1,000,000$1,499,999 $1,500,000$1,999,999 $2,000,000 and above Days on Market Sold Price
1-mth Period: Condos May-23 May-22 0 5 10 15 20 25 30 35 40 45 50 $149,999 and below $150,000$299,999 $300,000$399,999 $400,000$499,999 $500,000$599,999 $600,000$699,999 $700,000$999,999 $1,000,000$1,499,999 $1,500,000$1,999,999 $2,000,000 and above Days on Market Sold Price
Period: Condos 12-mth Median This Period 12-mth Median Last Period
Days on Market by Price Range 12-mth
Page 19 of 34
Median Percent of
OAHU,
Original List Price
Received by Price Range: Single-Family Homes

(Thepercentagefoundwhendividingaproperty'ssalespricebytheoriginallistprice;reportedpercentageisthemedianofallsalesfortheperiodandpricerangeindicated)

Median Percent of Original List Price Received by Price Range
$1,500,000-1,999,99999.1%101.2%-2.1%100.0%102.6%-2.5%
Median Percent of Original List Price Received by Price Range 12-mth Period:
$2,000,000-$2,999,99997.7%100.4%-2.7%98.7%100.0%-1.3%
$3,000,000andabove95.5%96.4%-0.9%96.3%96.9%-0.6%
All Single-Family Homes 98.7%102.2%-3.4%99.8%102.5%-2.6% This12-monthperiodreflectstheconsecutive12-monthperiodupthroughthecurrentmonth,whilelastperiod reflectsthesame12-monthperiodoneyearprior.
SOURCE: Honolulu Board of REALTORS®, residential resales compiled from MLS data. ©2023.HonoluluBoardofREALTORS®.AllRightsReserved.Informationhereindeemedreliablebutnotguaranteed.
May 2023
HAWAII
Single-Family HomesMay-23May-22%chg 12-mth Median This Period 12-mth Median Last Period%chg $449,999andbelow62.8%--100.0%100.0%0.0% $450,000-$599,999100.5%100.0%0.5%97.1%100.4%-3.3% $600,000-$699,99993.7%101.5%-7.7%97.1%101.5%-4.3% $700,000-$799,99999.7%103.7%-3.9%98.6%103.2%-4.5% $800,000-$899,999100.0%103.2%-3.1%99.0%103.7%-4.5% $900,000-$999,99997.3%103.3%-5.8%100.0%102.9%-2.8% $1,000,000-$1,499,99999.5%103.3%-3.7%100.0%103.7%-3.6%
80.0% 85.0% 90.0% 95.0% 100.0% 105.0% $449,999 and below $450,000$599,999 $600,000$699,999 $700,000$799,999 $800,000$899,999 $900,000$999,999 $1,000,000$1,499,999 $1,500,0001,999,999 $2,000,000$2,999,999 $3,000,000 and above Percent Orig. LP Received Sold Price
1-mth Period: Single-Family Homes May-23 May-22 80.0% 85.0% 90.0% 95.0% 100.0% 105.0% $449,999 and below $450,000$599,999 $600,000$699,999 $700,000$799,999 $800,000$899,999 $900,000$999,999 $1,000,000$1,499,999 $1,500,0001,999,999 $2,000,000$2,999,999 $3,000,000 and above Percent Orig. LP Received Sold Price
Single-Family Homes 12-mth Median This Period 12-mth Median Last Period
Page 20 of 34
Median Percent of Original List Price Received by Price Range: Condos
OAHU, HAWAII
(Thepercentagefoundwhendividingaproperty'ssalespricebytheoriginallistprice;reportedpercentageisthemedianofallsalesfortheperiodandpricerangeindicated)
Median Percent of Original List Price Received by Price Range
All Condos 99.0%100.0%-1.0%99.4%100.0%-0.6% This12-monthperiodreflectstheconsecutive12-monthperiodupthroughthecurrentmonth,whilelastperiod reflectsthesame12-monthperiodoneyearprior.
Median Percent of Original List Price Received by Price Range
SOURCE: Honolulu Board of REALTORS®, residential resales compiled from MLS data. ©2023.HonoluluBoardofREALTORS®.AllRightsReserved.Informationhereindeemedreliablebutnotguaranteed.
May 2023
Condos May-23May-22%chg 12-mth Median This Period 12-mth Median Last Period%chg $149,999andbelow100.0%100.0%0.0%95.6%96.6%-1.0% $150,000-$299,99997.5%100.0%-2.5%98.2%98.5%-0.3% $300,000-$399,999100.0%100.0%0.0%100.0%100.0%0.0% $400,000-$499,999100.0%100.0%0.0%100.0%100.0%0.0% $500,000-$599,99999.8%101.8%-2.0%100.0%100.2%-0.2% $600,000-$699,99999.3%100.8%-1.5%99.4%101.4%-2.0% $700,000-$999,99998.6%100.7%-2.1%99.4%100.6%-1.2%
$2,000,000andabove95.4%94.6%0.8%96.6%95.6%1.0%
90.0% 92.0% 94.0% 96.0% 98.0% 100.0% 102.0% 104.0% $149,999 and below $150,000$299,999 $300,000$399,999 $400,000$499,999 $500,000$599,999 $600,000$699,999 $700,000$999,999 $1,000,000$1,499,999 $1,500,000$1,999,999 $2,000,000 and above Percent Orig. LP Received Sold Price
$1,000,000-$1,499,99996.0%98.3%-2.3%96.3%98.8%-2.5% $1,500,000-$1,999,99996.9%100.0%-3.1%95.9%97.2%-1.3%
1-mth Period: Condos May-23 May-22 84.0% 86.0% 88.0% 90.0% 92.0% 94.0% 96.0% 98.0% 100.0% 102.0% $149,999 and below $150,000$299,999 $300,000$399,999 $400,000$499,999 $500,000$599,999 $600,000$699,999 $700,000$999,999 $1,000,000$1,499,999 $1,500,000$1,999,999 $2,000,000 and above Percent Orig. LP Received Sold Price
12-mth Period: Condos 12-mth Median This Period 12-mth Median Last Period
Page 21 of 34
New Listings by Price Range: Single-Family Homes
May 2023
OAHU, HAWAII
(Acountofpropertiesthathavebeennewlylistedonthemarketinagivenmonth) Single-Family

$449,999andbelow06-100.0%1741-58.5%
$450,000-$599,99957-28.6%71124-42.7%
$600,000-$699,999920-55.0%139249-44.2%
$700,000-$799,9992833-15.2%280470-40.4%
$800,000-$899,9994556-19.6%479651-26.4%
$900,000-$999,9994468-35.3%478696-31.3%
$1,000,000-$1,499,99995148-35.8%1,1221,398-19.7%
$1,500,000-1,999,99945434.7%486532-8.6%


$2,000,000-$2,999,9991736-52.8%274322-14.9%
$3,000,000andabove2128-25.0%249287-13.2%
All Single-Family Homes309445-30.6%3,5954,770-24.6%
This12-monthperiodreflectstheconsecutive12-monthperiodupthroughthecurrentmonth,whilelastperiod reflectsthesame12-monthperiodoneyearprior.
SOURCE: Honolulu Board of REALTORS®, residential resales compiled from MLS data. ©2023.HonoluluBoardofREALTORS®.AllRightsReserved.Informationhereindeemedreliablebutnotguaranteed.
HomesMay-23May-22%chg 12-mth Total This Period 12-mth Total Last Period %chg
0 20 40 60 80 100 120 140 160 $449,999 and below $450,000$599,999 $600,000$699,999 $700,000$799,999 $800,000$899,999 $900,000$999,999 $1,000,000$1,499,999 $1,500,0001,999,999 $2,000,000$2,999,999 $3,000,000 and above New Listings Original List Price
1-mth Period: Single-Family Homes May-23 May-22 0 200 400 600 800 1,000 1,200 1,400 1,600 $449,999 and below $450,000$599,999 $600,000$699,999 $700,000$799,999 $800,000$899,999 $900,000$999,999 $1,000,000$1,499,999 $1,500,0001,999,999 $2,000,000$2,999,999 $3,000,000 and above New Listings Original List Price New Listings by Price Range 12-mth Period: Single-Family Homes 12-mth Total This Period 12-mth Total Last Period
New Listings by Price Range
Page 22 of 34
New Listings by Price Range: Condos May 2023
OAHU, HAWAII
(Acountofpropertiesthathavebeennewlylistedonthemarketinagivenmonth)
$149,999andbelow1821-14.3%191236-19.1%
$150,000-$299,9997476-2.6%7671,124-31.8%
$300,000-$399,99990103-12.6%9891,297-23.7%
$400,000-$499,99987113-23.0%1,0641,436-25.9%
$500,000-$599,99996933.2%9181,181-22.3%
$600,000-$699,9996375-16.0%734927-20.8%
$700,000-$999,99988130-32.3%1,1081,293-14.3%
$1,000,000-$1,499,9993554-35.2%395468-15.6%
$1,500,000-$1,999,99911110.0%19516915.4%
$2,000,000andabove201181.8%20918711.8%
All Condos 582687-15.3%6,5708,318-21.0%
This12-monthperiodreflectstheconsecutive12-monthperiodupthroughthecurrentmonth,whilelastperiod reflectsthesame12-monthperiodoneyearprior.
SOURCE: Honolulu Board of REALTORS®, residential resales compiled from MLS data. ©2023.HonoluluBoardofREALTORS®.AllRightsReserved.Informationhereindeemedreliablebutnotguaranteed.
Condos May-23May-22%chg 12-mth Total This Period 12-mth Total Last Period %chg
0 20 40 60 80 100 120 140 $149,999 and below $150,000$299,999 $300,000$399,999 $400,000$499,999 $500,000$599,999 $600,000$699,999 $700,000$999,999 $1,000,000$1,499,999 $1,500,000$1,999,999 $2,000,000 and above New Listings Original List Price
Listings
1-mth Period: Condos May-23 May-22 0 200 400 600 800 1,000 1,200 1,400 1,600 $149,999 and below $150,000$299,999 $300,000$399,999 $400,000$499,999 $500,000$599,999 $600,000$699,999 $700,000$999,999 $1,000,000$1,499,999 $1,500,000$1,999,999 $2,000,000 and above New Listings Original List Price
Listings
12-mth Period: Condos 12-mth Total This Period 12-mth Total Last Period
New
by Price Range
New
by Price Range
Page 23 of 34
Pending Sales by Price Range: Single-Family Homes
May 2023
OAHU, HAWAII
(Ameasureofcontractactivity/acountofpropertiesthathavehadoffersacceptedontheminagivenmonth)
Pending Sales by Price Range
$449,999andbelow23-33.3%2946-37.0%
$450,000-$599,99956-16.7%71136-47.8%
$600,000-$699,9991018-44.4%134268-50.0%
$700,000-$799,9992229-24.1%263444-40.8%
$800,000-$899,9994653-13.2%444646-31.3%
$900,000-$999,9993857-33.3%399693-42.4%
Pending Sales by Price Range
$1,000,000-$1,499,99977107-28.0%1,0041,305-23.1%
$1,500,000-1,999,9993642-14.3%318477-33.3%
$2,000,000-$2,999,9991527-44.4%188255-26.3%
$3,000,000andabove714-50.0%123189-34.9%
All Single-Family Homes 258356-27.5%2,9734,459-33.3% This12-monthperiodreflectstheconsecutive12-monthperiodupthroughthecurrentmonth,whilelastperiod reflectsthesame12-monthperiodoneyearprior.
SOURCE: Honolulu Board of REALTORS®, residential resales compiled from MLS data. ©2023.HonoluluBoardofREALTORS®.AllRightsReserved.Informationhereindeemedreliablebutnotguaranteed.
Single-Family HomesMay-23May-22%chg 12-mth Total This Period 12-mth Total Last Period%chg
0 20 40 60 80 100 120 $449,999 and below $450,000$599,999 $600,000$699,999 $700,000$799,999 $800,000$899,999 $900,000$999,999 $1,000,000$1,499,999 $1,500,0001,999,999 $2,000,000$2,999,999 $3,000,000 and above Pending Sales Current List Price
Period: Single-Family Homes May-23 May-22 0 200 400 600 800 1,000 1,200 1,400 $449,999 and below $450,000$599,999 $600,000$699,999 $700,000$799,999 $800,000$899,999 $900,000$999,999 $1,000,000$1,499,999 $1,500,0001,999,999 $2,000,000$2,999,999 $3,000,000 and above Pending Sales Current List Price
1-mth
12-mth Period: Single-Family Homes 12-mth Total This Period 12-mth Total Last Period
Page 24 of 34
Pending Sales by Price Range: Condos May 2023
OAHU, HAWAII
(Ameasureofcontractactivity/acountofpropertiesthathavehadoffersacceptedontheminagivenmonth)
Pending Sales by Price Range
$149,999andbelow1618-11.1%162232-30.2%
$150,000-$299,9996984-17.9%6141,022-39.9%
$300,000-$399,9997582-8.5%8721,233-29.3%
$400,000-$499,9997996-17.7%8871,364-35.0%
$500,000-$599,9997586-12.8%7141,079-33.8%
$600,000-$699,9996872-5.6%597858-30.4%
Pending Sales by Price Range
$700,000-$999,99983116-28.4%7841,086-27.8%
$1,000,000-$1,499,9992530-16.7%233359-35.1%
$1,500,000-$1,999,9999812.5%96106-9.4%
$2,000,000andabove89-11.1%93117-20.5%
All Condos 507601-15.6%5,0527,456-32.2% This12-monthperiodreflectstheconsecutive12-monthperiodupthroughthecurrentmonth,whilelastperiod reflectsthesame12-monthperiodoneyearprior.
SOURCE: Honolulu Board of REALTORS®, residential resales compiled from MLS data. ©2023.HonoluluBoardofREALTORS®.AllRightsReserved.Informationhereindeemedreliablebutnotguaranteed.
Condos May-23May-22%chg 12-mth Total This Period 12-mth Total Last Period%chg
0 20 40 60 80 100 120 140 $149,999 and below $150,000$299,999 $300,000$399,999 $400,000$499,999 $500,000$599,999 $600,000$699,999 $700,000$999,999 $1,000,000$1,499,999 $1,500,000$1,999,999 $2,000,000 and above Pending Sales Current List Price
1-mth Period: Condos May-23 May-22 0 200 400 600 800 1,000 1,200 1,400 1,600 $149,999 and below $150,000$299,999 $300,000$399,999 $400,000$499,999 $500,000$599,999 $600,000$699,999 $700,000$999,999 $1,000,000$1,499,999 $1,500,000$1,999,999 $2,000,000 and above Pending Sales Current List Price
12-mth Period: Condos 12-mth Total This Period 12-mth Total Last Period
Page 25 of 34
Active Inventory* by Price Range: Single-Family Homes May 2023
OAHU, HAWAII
(Thenumberofpropertiesactiveonmarketattheendofagivenmonth)
Single-Family HomesMay-23May-22YOY chg
$449,999andbelow46-33.3%
Active Inventory by Price Range
$450,000-$599,9999812.5%
$600,000-$699,999221546.7%
$700,000-$799,999382365.2%
$800,000-$899,999583565.7%
$900,000-$999,99959581.7%
$1,000,000-$1,499,999129134-3.7%
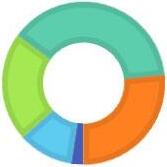
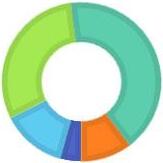
Active Inventory - Percent Share by Price Range (portionoftotalactivestatuslistingsrepresentedbyagivenpricerange)
$1,500,000-1,999,999805935.6%
$2,000,000-$2,999,999514610.9%
$3,000,000andabove93876.9%
All Single-Family Homes 54347115.3%
*Indicatormodifiedasof2021toreflectActivestatuslistingsonlyandappliedtohistoricalmonthlydatashownabove.Previousreportindicator,referredtoasActiveListings,reflectedallactivelymarketedlistingsinAandC status.

SOURCE: Honolulu Board of REALTORS®, residential resales compiled from MLS data. ©2023.HonoluluBoardofREALTORS®.AllRightsReserved.Informationhereindeemedreliablebutnotguaranteed.
0 20 40 60 80 100 120 140 160 $449,999 and below $450,000$599,999 $600,000$699,999 $700,000$799,999 $800,000$899,999 $900,000$999,999 $1,000,000$1,499,999 $1,500,0001,999,999 $2,000,000$2,999,999 $3,000,000 and above Active Listings Current List Price
Single-Family Homes May-23 May-22 3% 8% 20% 41% 28% MAY-22 $599,999 and below $600,000 to $799,999 $800,000 to $999,999 $1,000,000 to $1,999,999 $2,000,000 and above 2% 11% 22% 38% 27% MAY-23 $599,999 and below $600,000 to $799,999 $800,000 to $999,999 $1,000,000 to $1,999,999 $2,000,000 and above
Page 26 of 34
Active Inventory* by Price Range: Condos May 2023
OAHU, HAWAII
(Thenumberofpropertiesactiveonmarketattheendofagivenmonth)

Condos May-23May-22YOY chg
$149,999andbelow473727.0%
Active Inventory by Price Range
$150,000-$299,999137150-8.7%
$300,000-$399,9991171142.6%
$400,000-$499,99913510528.6%
$500,000-$599,9991268155.6%
$600,000-$699,9991108135.8%
$700,000-$999,9991771629.3%
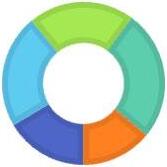
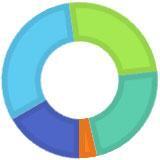
Active Inventory - Percent Share by Price Range (portionoftotalactivestatuslistingsrepresentedbyagivenpricerange)
$1,000,000-$1,499,9991129123.1%
$1,500,000-$1,999,99959565.4%
$2,000,000andabove986258.1%

All Condos 1,11893919.1% *Indicatormodifiedasof2021toreflectActivestatuslistingsonlyandappliedtohistoricalmonthlydatashownabove.Previousreportindicator,referredtoasActiveListings,reflectedallactivelymarketedlistingsinAandC status.
SOURCE: Honolulu Board of REALTORS®, residential resales compiled from MLS data. ©2023.HonoluluBoardofREALTORS®.AllRightsReserved.Informationhereindeemedreliablebutnotguaranteed.
0 20 40 60 80 100 120 140 160 180 200 $149,999 and below $150,000$299,999 $300,000$399,999 $400,000$499,999 $500,000$599,999 $600,000$699,999 $700,000$999,999 $1,000,000$1,499,999 $1,500,000$1,999,999 $2,000,000 and above Active Listings Current List Price
Condos May-23 May-22 20% 23% 17% 27% 13% MAY-22 $299,999 and below $300,000 to $499,999 $500,000 to $699,999 $700,000 to $1,499,999 $1,500,000 and above 16% 23% 21% 26% 14% MAY-23 $299,999 and below $300,000 to $499,999 $500,000 to $699,999 $700,000 to $1,499,999 $1,500,000 and above
Page 27 of 34
Active Inventory*: Single-Family Homes and Condos

May 2023
OAHU, HAWAII
iousreportindicator,referredtoasActiveListings,reflectedallactivelymarketedlistingsinAandCstatus.

SOURCE: Honolulu Board of REALTORS®, residential resales compiled from MLS data. ©2023.HonoluluBoardofREALTORS®.AllRightsReserved.Informationhereindeemedreliablebutnotguaranteed.

Single-Family Homes
$599,999 and below 221620151318131381111101415128101416151224181513 $600,000 to $799,999 24363343393934242240382738465957648094676562695560 $800,000 to $999,999 4460717078625444544952719399113128133157148143121115127117117 $1,000,000 to $1,999,999 105126146145165155135101111139139160193218226236251243251216207204191201209 $2,000,000 and above 142139145143142127130127116109120127133149166167171162173156146142136147144 Total 337377415416437401366309311348360395471527576596629656682597551547541535543 Condos
$299,999 and below 271253227217227218205198188204188194187199188176184183189185179185183182184 $300,000 to $499,999 259280272266298302275248250243205194219229238243263267292261277282251251252 $500,000 to $699,999 132161145142152158189158183183165161162171172196250274272245243229251244236 $700,000 to $1,499,999 180193187191206218227203216232232240253271328330317325340318329322308307289 $1,500,000 and above 141138138134147143137139130127129128118128124128127145151161168159159160157 Total 9831,0259699501,0301,0391,0339469679899199179399981,0501,0731,1411,1941,2441,1701,1961,1771,1521,1441,118 *Indicatormodifiedasof2021toreflectActivestatuslistingsonlyandappliedtohistoricalmonthlydatashownabove.Prev
0 50 100 150 200 250 300 May-21 May-22 May-23 Listings Active Inventory Single-Family Homes $599,999 and below $600,000 to $799,999 $800,000 to $999,999 $1,000,000 to $1,999,999 $2,000,000 and above 0 50 100 150 200 250 300 350 400 May-21 May-22 May-23 Lisings Active Inventory Condos $299,999 and below $300,000 to $499,999 $500,000 to $699,999 $700,000 to $1,499,999 $1,500,000 and above
M-21J-21J-21A-21S-21O-21N-21D-21J-22F-22M-22A-22M-22J-22J-22A-22S-22O-22N-22D-22J-23F-23M-23A-23M-23
M-21J-21J-21A-21S-21O-21N-21D-21J-22F-22M-22A-22M-22J-22J-22A-22S-22O-22N-22D-22J-23F-23M-23A-23M-23
Page 28 of 34
Total Inventory In Escrow* by Price Range: Single-Family Homes May 2023
OAHU, HAWAII
(Thenumberofpropertiesinanescrowstatusattheendofagivenmonth)
Single-Family HomesMay-23May-22YOY chg
$449,999andbelow511-54.5%
Total Inventory In Escrow by Price Range Single-Family
$450,000-$599,9991319-31.6%
$600,000-$699,9991727-37.0%
$700,000-$799,9993850-24.0%
$800,000-$899,9997786-10.5%
$900,000-$999,9995094-46.8%
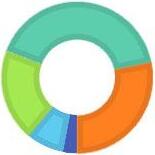
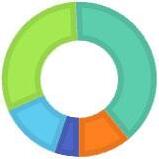
Total Inventory In Escrow - Percent Share by Price Range
(portionoftotalinventoryinescrowrepresentedbyagivenprice range)
$1,000,000-$1,499,999120166-27.7%
$1,500,000-1,999,9995566-16.7%
$2,000,000-$2,999,9992642-38.1%
$3,000,000andabove1722-22.7% All Single-Family Homes 418583-28.3%
*Newindicatoraddedtoreportsasof2021,includingapplicablehistoricaldata.

SOURCE: Honolulu Board of REALTORS®, residential resales compiled from MLS data. ©2023.HonoluluBoardofREALTORS®.AllRightsReserved.Informationhereindeemedreliablebutnotguaranteed.
0 20 40 60 80 100 120 140 160 180 $449,999 and below $450,000$599,999 $600,000$699,999 $700,000$799,999 $800,000$899,999 $900,000$999,999 $1,000,000$1,499,999 $1,500,0001,999,999 $2,000,000$2,999,999 $3,000,000 and above Active Listings Current List Price
Homes May-23 May-22 5% 13% 31% 40% 11% MAY-22 $599,999 and below $600,000 to $799,999 $800,000 to $999,999 $1,000,000
$1,999,999 $2,000,000 and above 4% 13% 31% 42% 10% MAY-23 $599,999 and below $600,000 to $799,999 $800,000 to $999,999 $1,000,000 to $1,999,999 $2,000,000 and above
to
Page 29 of 34
Total Inventory In Escrow* by Price Range: Condos May 2023
OAHU, HAWAII
(Thenumberofpropertiesinanescrowstatusattheendofagivenmonth)
Condos May-23May-22YOY chg
Total Inventory In Escrow by Price Range
$149,999andbelow2327-14.8%
$150,000-$299,99990116-22.4%
$300,000-$399,999103121-14.9%
$400,000-$499,999110145-24.1%
$500,000-$599,99998124-21.0%
$600,000-$699,9999293-1.1%
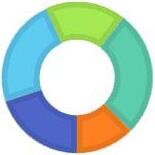
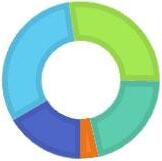
Total Inventory In Escrow - Percent Share by Price Range
(portionoftotalinventoryinescrowrepresentedbyagivenprice range)
$700,000-$999,999111153-27.5%
$1,000,000-$1,499,9993446-26.1%
$1,500,000-$1,999,9991116-31.3%
$2,000,000andabove1415-6.7%
All Condos 686856-19.9%
*Newindicatoraddedtoreportsasof2021,includingapplicablehistoricaldata.

SOURCE: Honolulu Board of REALTORS®, residential resales compiled from MLS data. ©2023.HonoluluBoardofREALTORS®.AllRightsReserved.Informationhereindeemedreliablebutnotguaranteed.
0 20 40 60 80 100 120 140 160 180 $149,999 and below $150,000$299,999 $300,000$399,999 $400,000$499,999 $500,000$599,999 $600,000$699,999 $700,000$999,999 $1,000,000$1,499,999 $1,500,000$1,999,999 $2,000,000 and above Active Listings Current List Price
Condos May-23 May-22 17% 31% 25% 23% 4% MAY-22 $299,999 and below $300,000 to $499,999 $500,000 to $699,999 $700,000 to $1,499,999 $1,500,000 and above 16% 31% 28% 21% 4% MAY-23 $299,999 and below $300,000 to $499,999 $500,000 to $699,999 $700,000 to $1,499,999 $1,500,000 and above
Page 30 of 34
Months Supply of Active Inventory by Price Range: Single-Family Homes May 2023
OAHU, HAWAII
(Comparesactiveinventorytoarolling12-monthaverageclosedsales)

Single-Family HomesMay-23May-22YOY chg
Months Supply of Inventory by Price Range
$449,999andbelow2.02.00.0%
$450,000-$599,9991.50.966.7%
$600,000-$699,9992.40.9166.7%
$700,000-$799,9991.90.7171.4%
$800,000-$899,9991.80.7157.1%
$900,000-$999,9991.81.250.0%
Months Supply of Inventory
SOURCE:
$1,000,000-$1,499,9991.51.136.4% $1,500,000-1,999,9993.01.3130.8%
$3,000,000andabove10.35.1102.0% All Single-Family Homes 2.21.369.2% 0 3 6 9 12 $449,999 and below $450,000$599,999 $600,000$699,999 $700,000$799,999 $800,000$899,999 $900,000$999,999 $1,000,000$1,499,999 $1,500,0001,999,999 $2,000,000$2,999,999 $3,000,000 and above Months of Inventory Current List Price
$2,000,000-$2,999,9993.22.060.0%
Single-Family Homes May-23 May-22 0 2 4 6 May-21 May-22 May-23 Months of Inventory
Single-Family Homes $599,999 and below $600,000 to $799,999 $800,000
$999,999 $1,000,000
$2,000,000
to
to $1,999,999
and above
Page 31 of 34
Honolulu Board of REALTORS®, residential resales compiled from MLS data. ©2023.HonoluluBoardofREALTORS®.AllRightsReserved.Informationhereindeemedreliablebutnotguaranteed.
Months Supply of Active Inventory by Price Range: Condos May 2023
OAHU, HAWAII
(Comparesactiveinventorytoarolling12-monthaverageclosedsales)
Condos May-23May-22YOY chg
Months Supply of Inventory by Price Range
$149,999andbelow3.41.888.9%
$150,000-$299,9992.61.752.9%
$300,000-$399,9991.71.241.7%
$400,000-$499,9991.80.9100.0%
$500,000-$599,9992.00.9122.2%
$600,000-$699,9992.21.283.3%
Months Supply of Inventory
$700,000-$999,9992.51.656.3% $1,000,000-$1,499,9995.32.982.8%
SOURCE: Honolulu Board of REALTORS®, residential resales compiled from MLS data. ©2023.HonoluluBoardofREALTORS®.AllRightsReserved.Informationhereindeemedreliablebutnotguaranteed.
All Condos 2.61.573.3% 0 3 6 9 12 15 $149,999 and below $150,000$299,999 $300,000$399,999 $400,000$499,999 $500,000$599,999 $600,000$699,999 $700,000$999,999 $1,000,000$1,499,999 $1,500,000$1,999,999 $2,000,000 and above Months of Inventory Current List Price
$1,500,000-$1,999,9997.46.219.4% $2,000,000andabove12.35.6119.6%
Condos May-23 May-22 0 2 4 6 8 10 12 14 16 18 May-21 May-22 May-23 Months of Inventory
Condos $299,999 and below $300,000 to $499,999 $500,000 to $699,999 $700,000
$1,500,000
to $1,499,999
and above
Page 32 of 34

Closed
Single-Family Homes and Condos OAHU, HAWAII: Jan 1987 to the Present 0 100 200 300 400 500 600 700 800 900 1987198819891990199119921993199419951996199719981999200020012002200320042005200620072008200920102011201220132014201520162017201820192020202120222023 Closed Sales SFH Closed Sales CONDO SOURCE: Honolulu Board of REALTORS®, compiled from MLS data. ©2023. Honolulu Board of REALTORS®. All Rights Reserved. Information herein deemed reliable but not guaranteed. Page 33 of 34
Sales