Telluride MARKET UPDATE


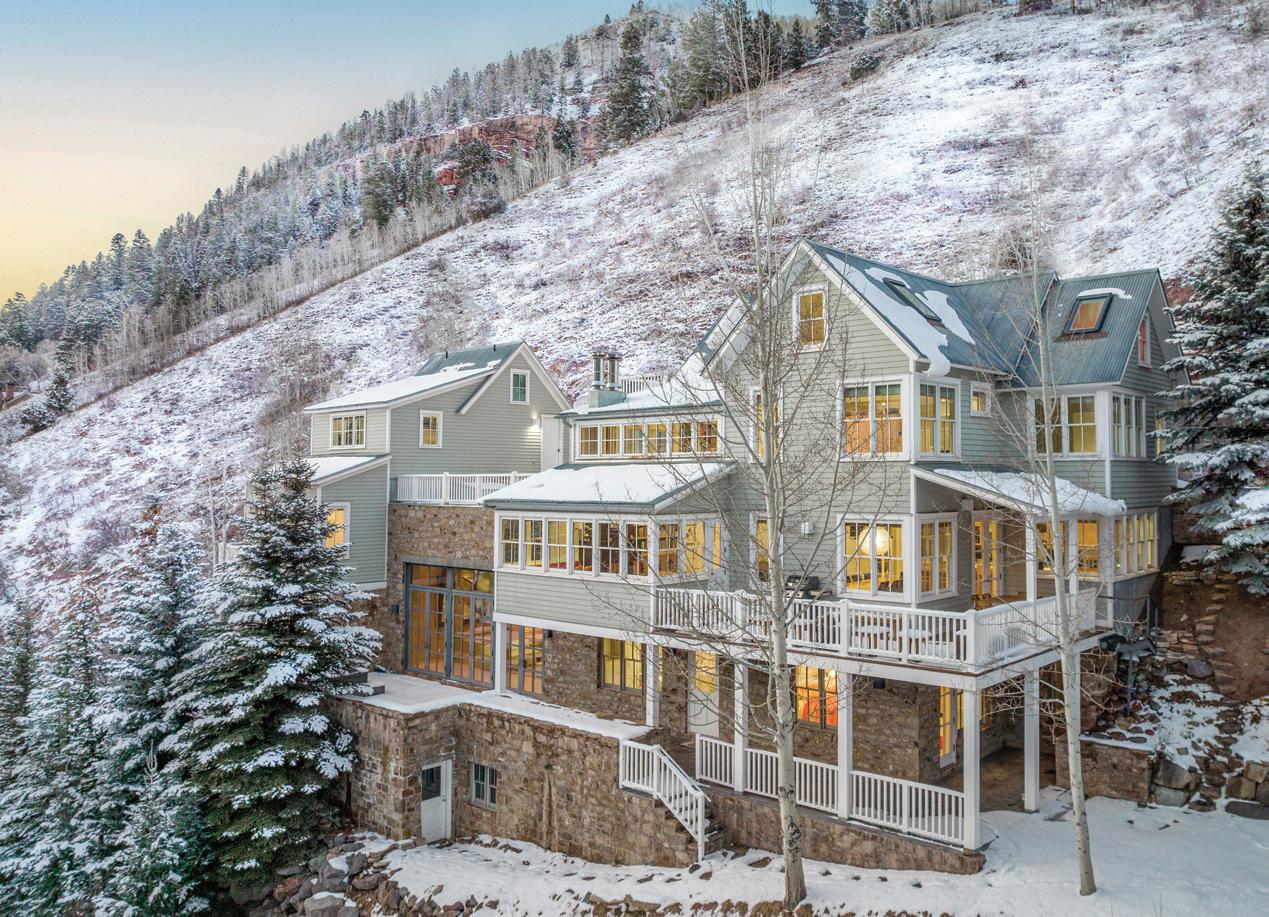
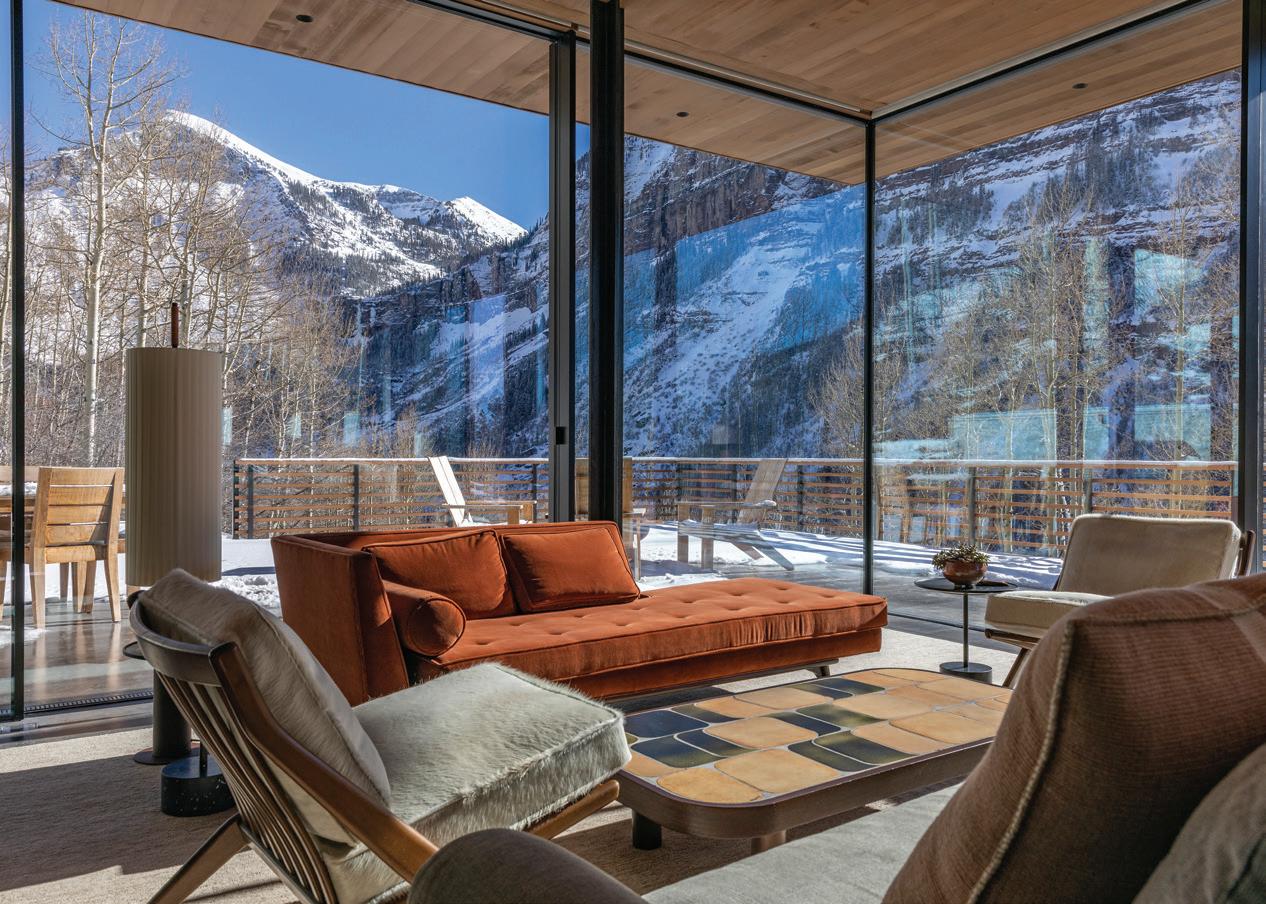
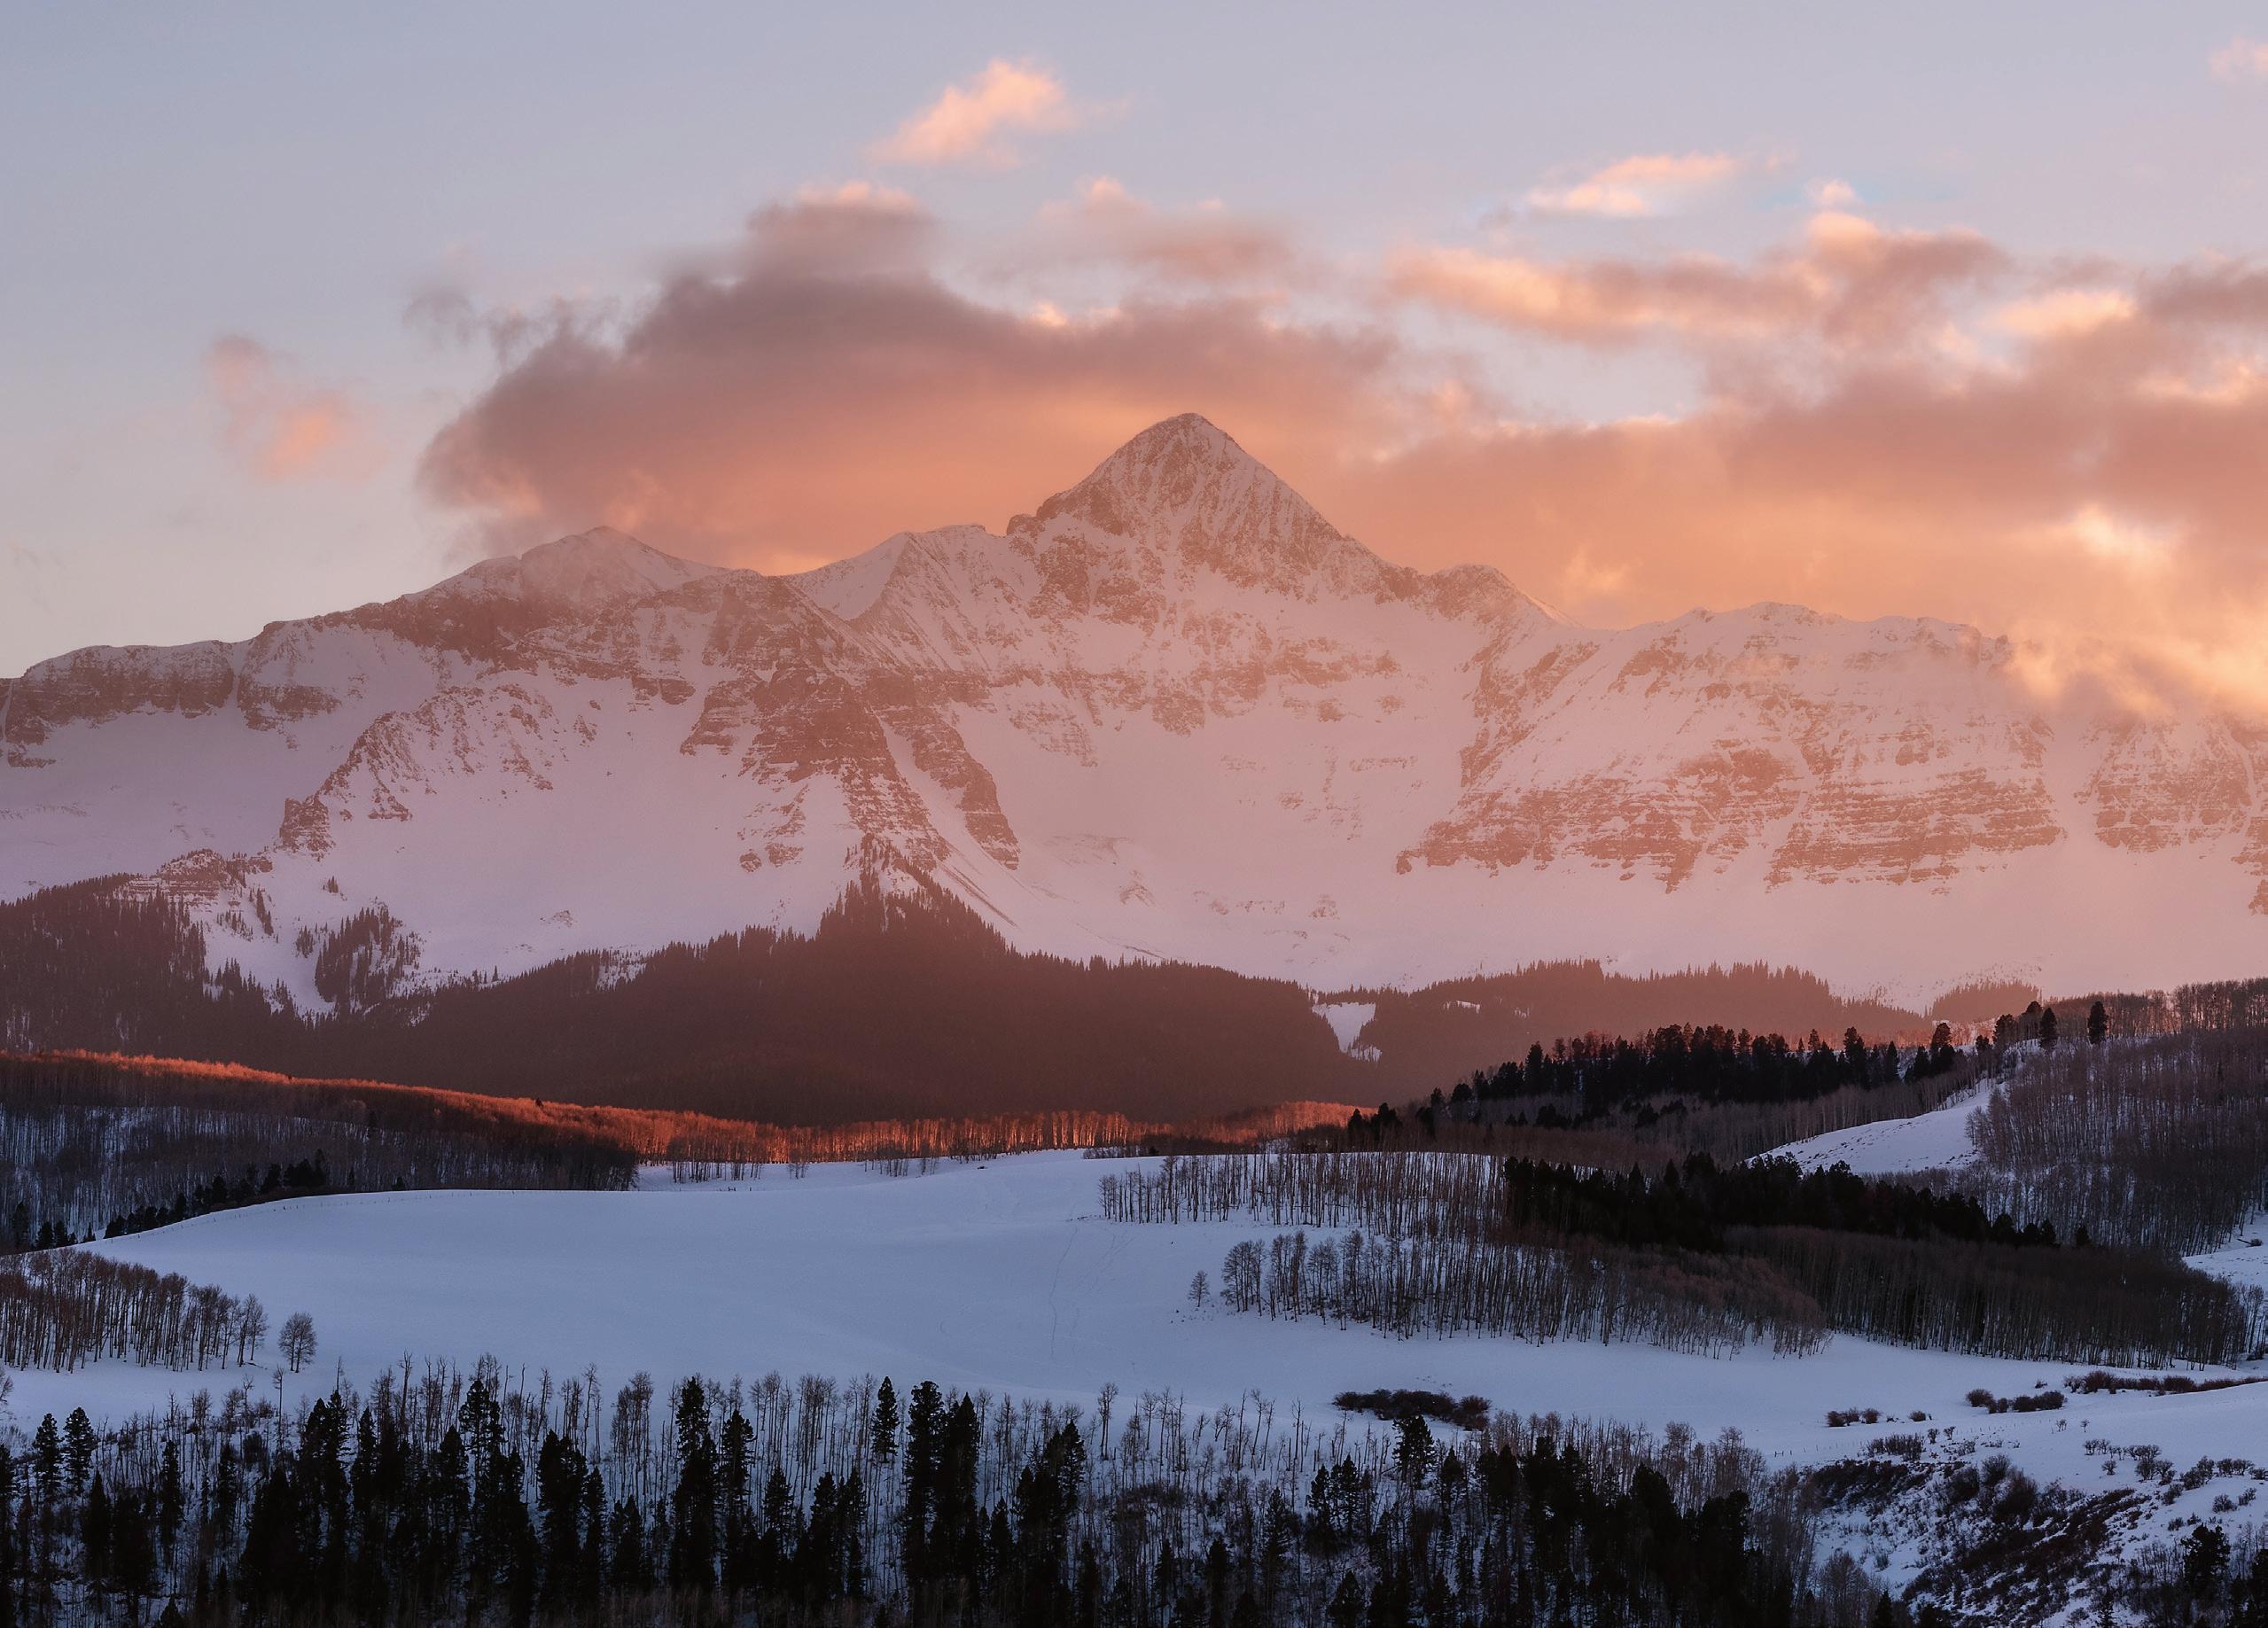
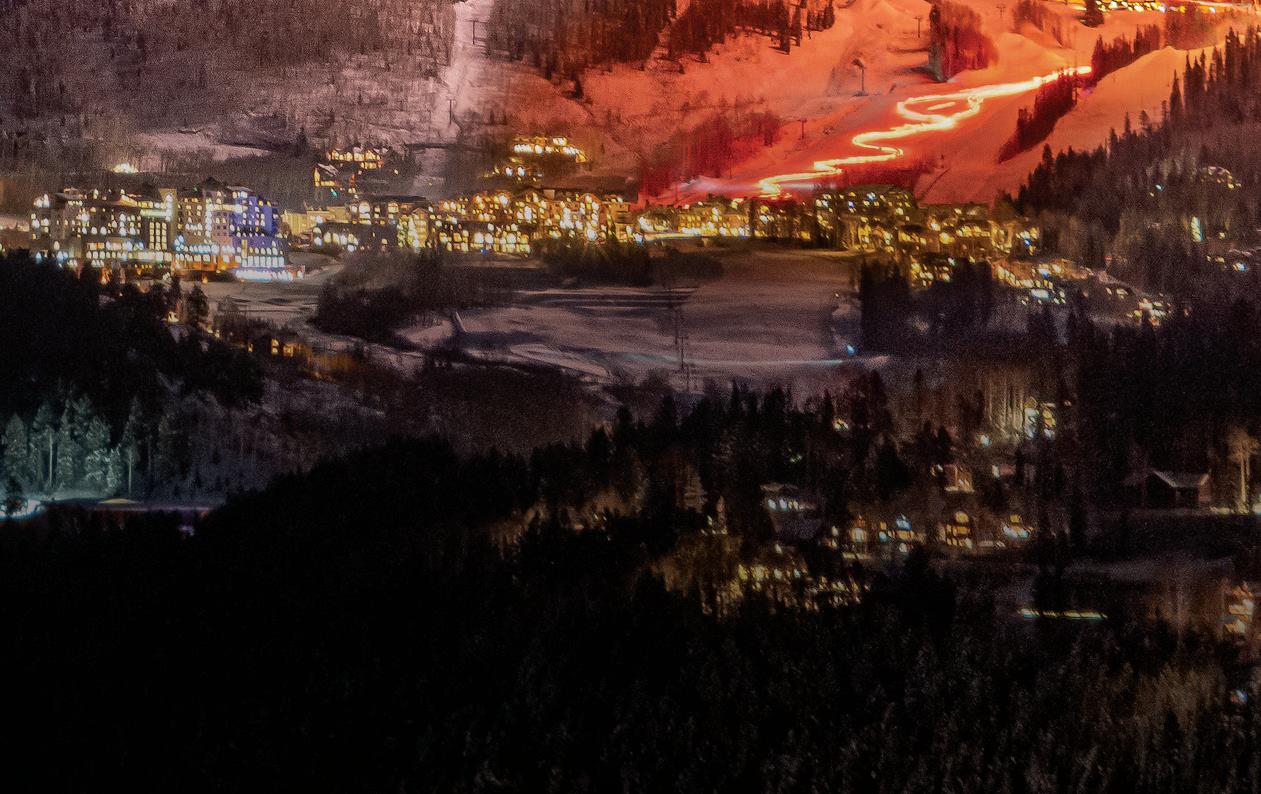
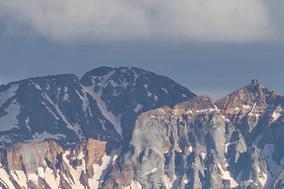
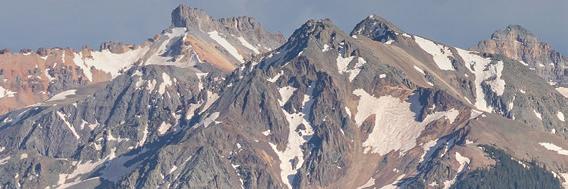
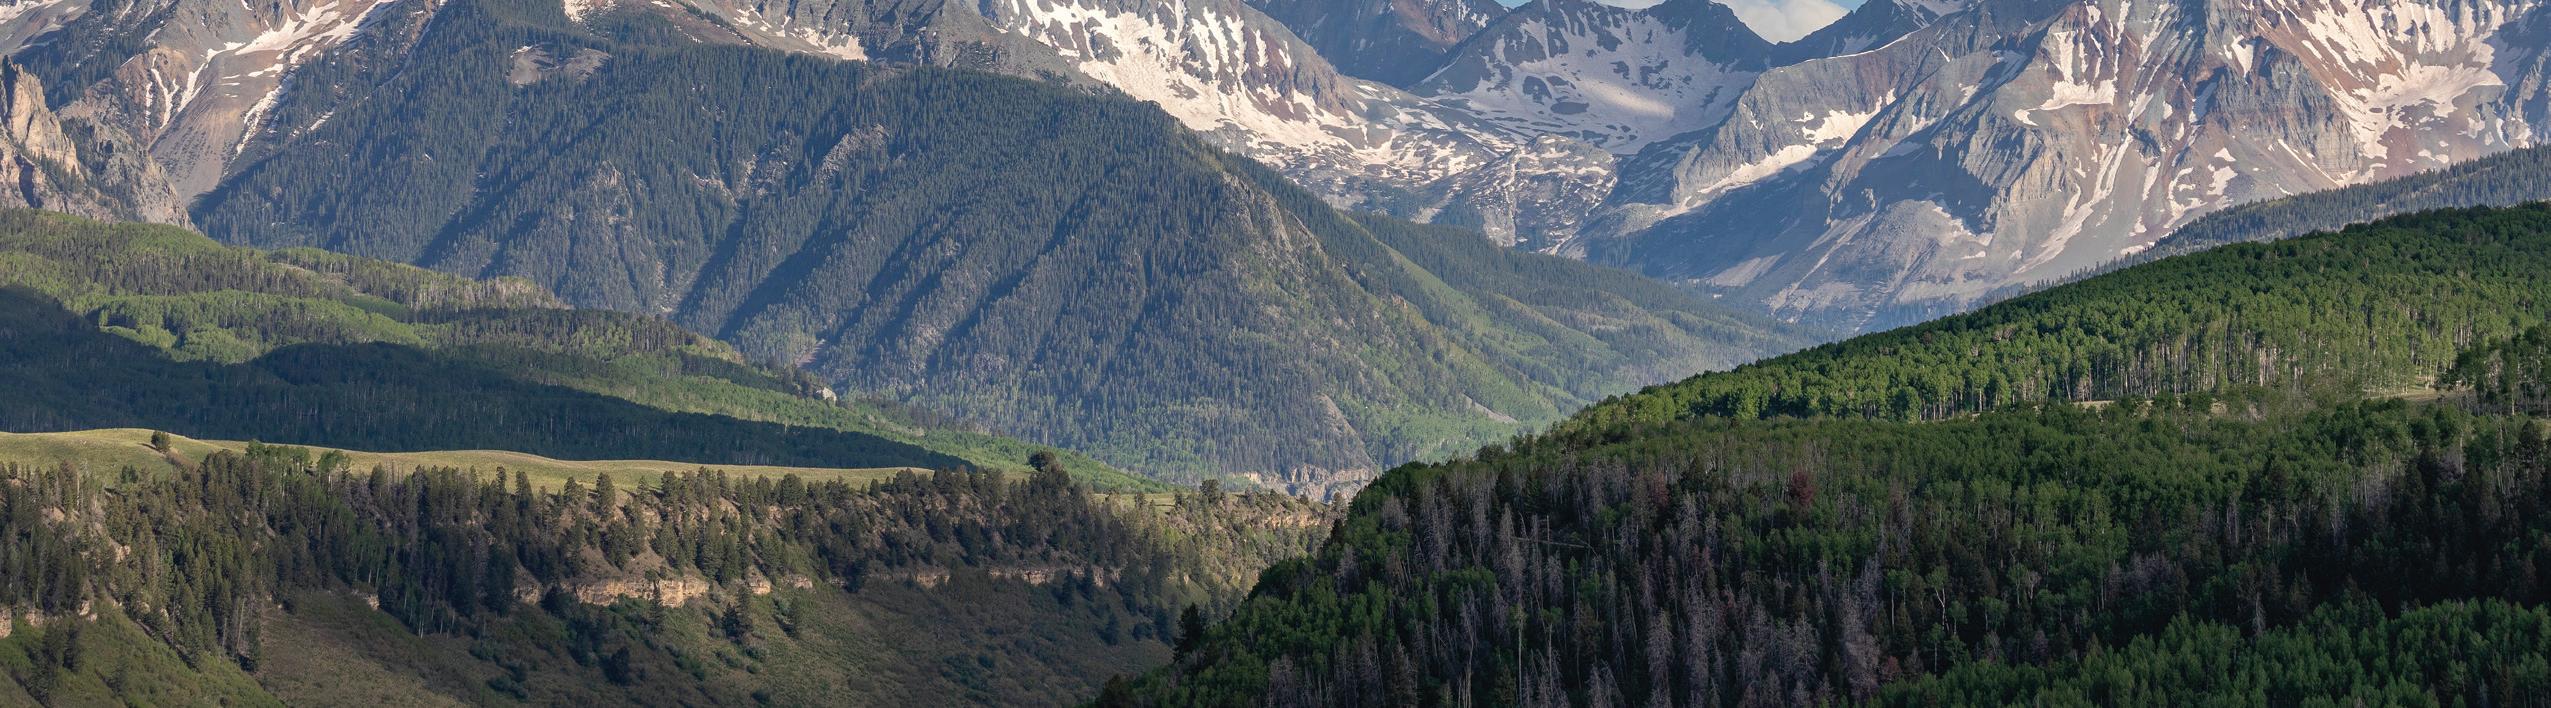
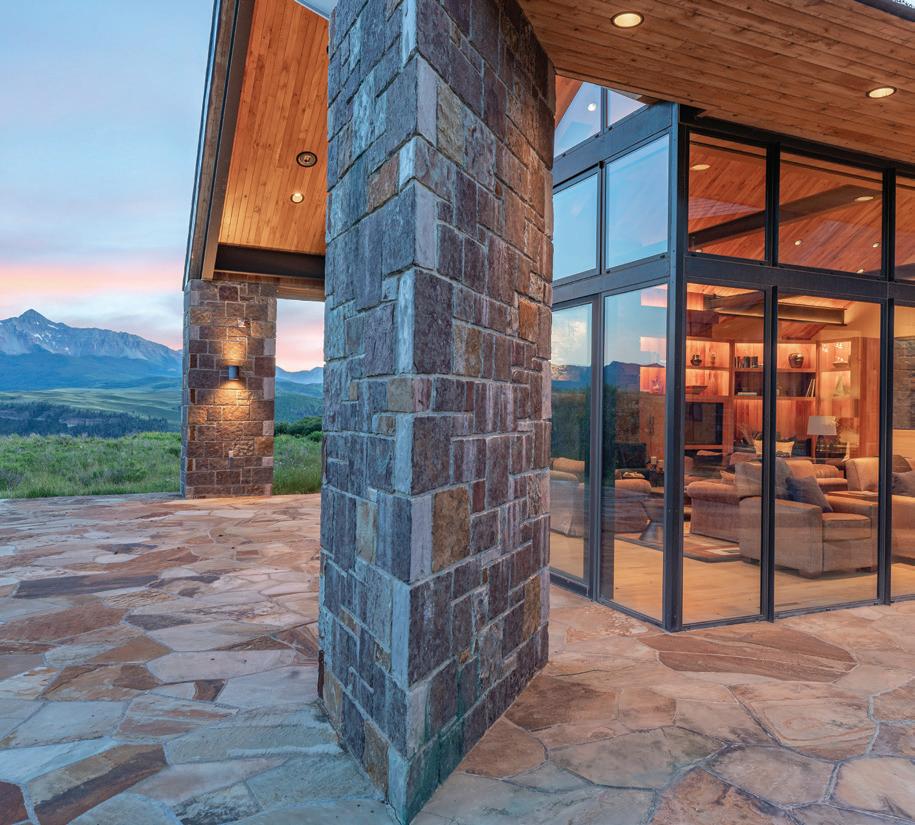
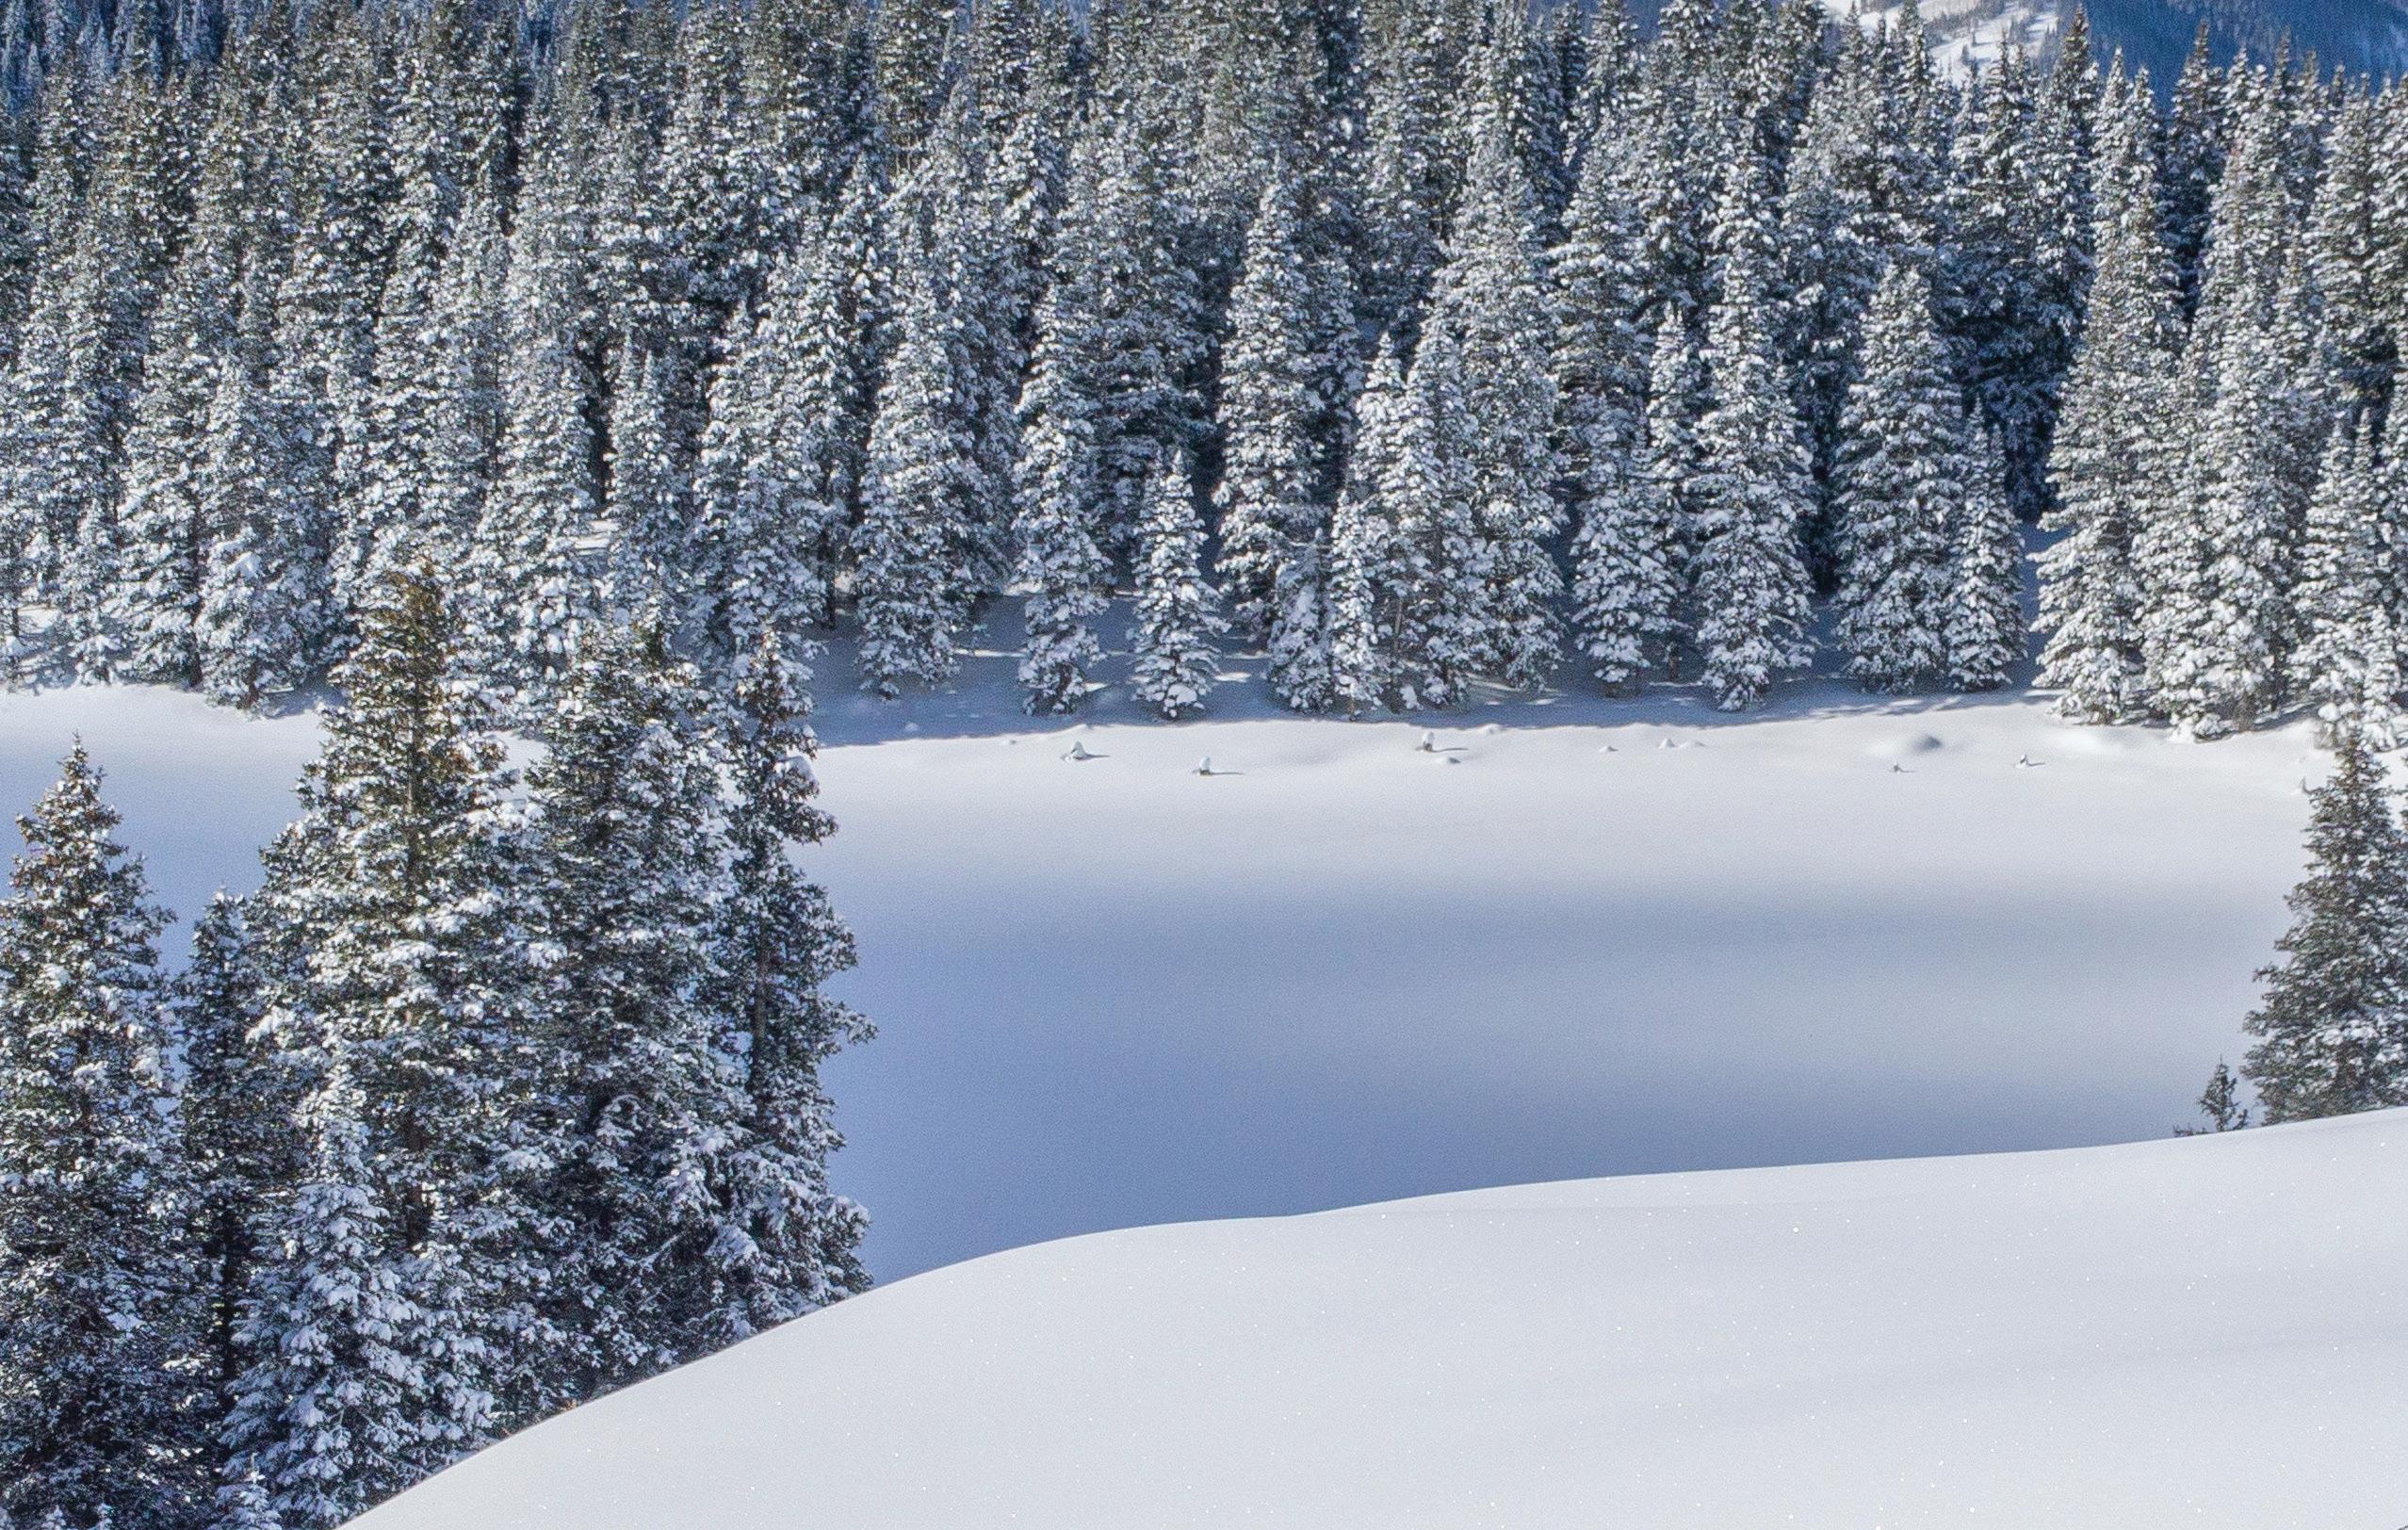
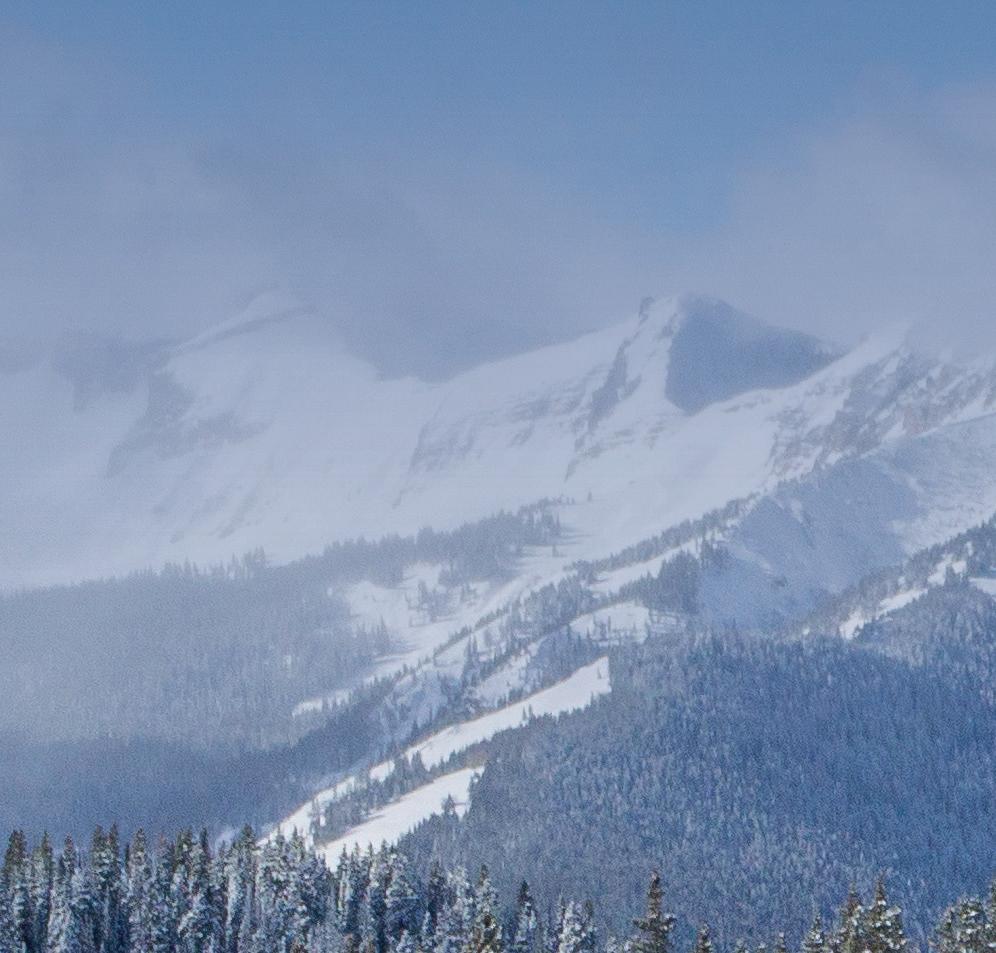
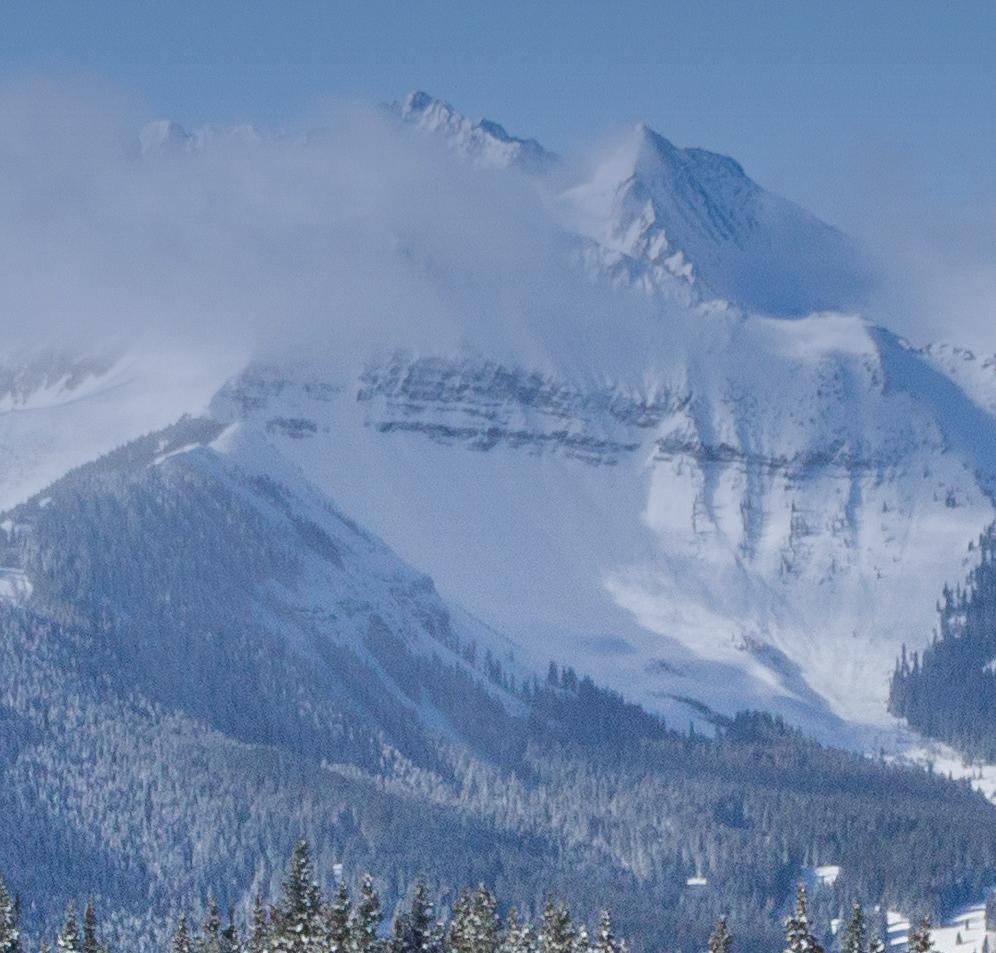
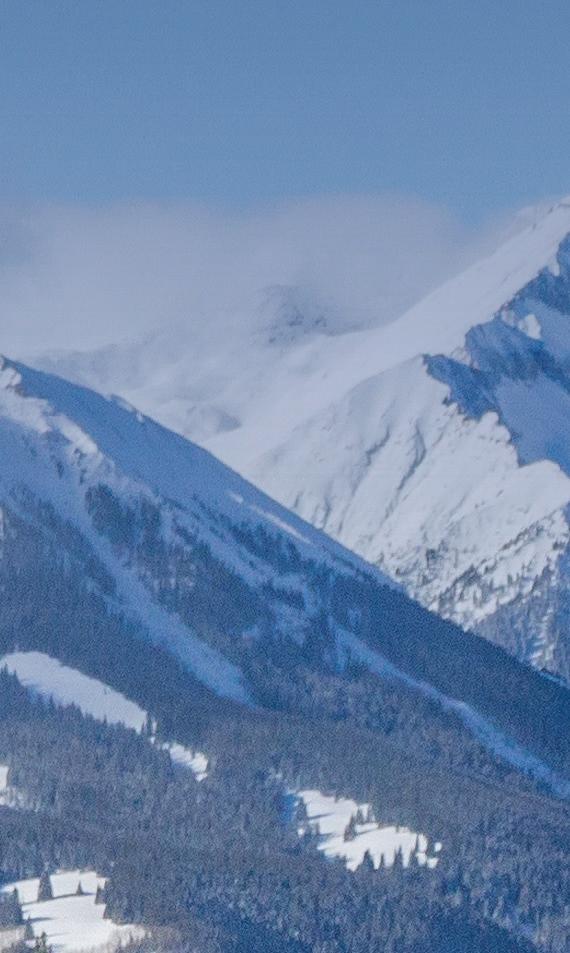
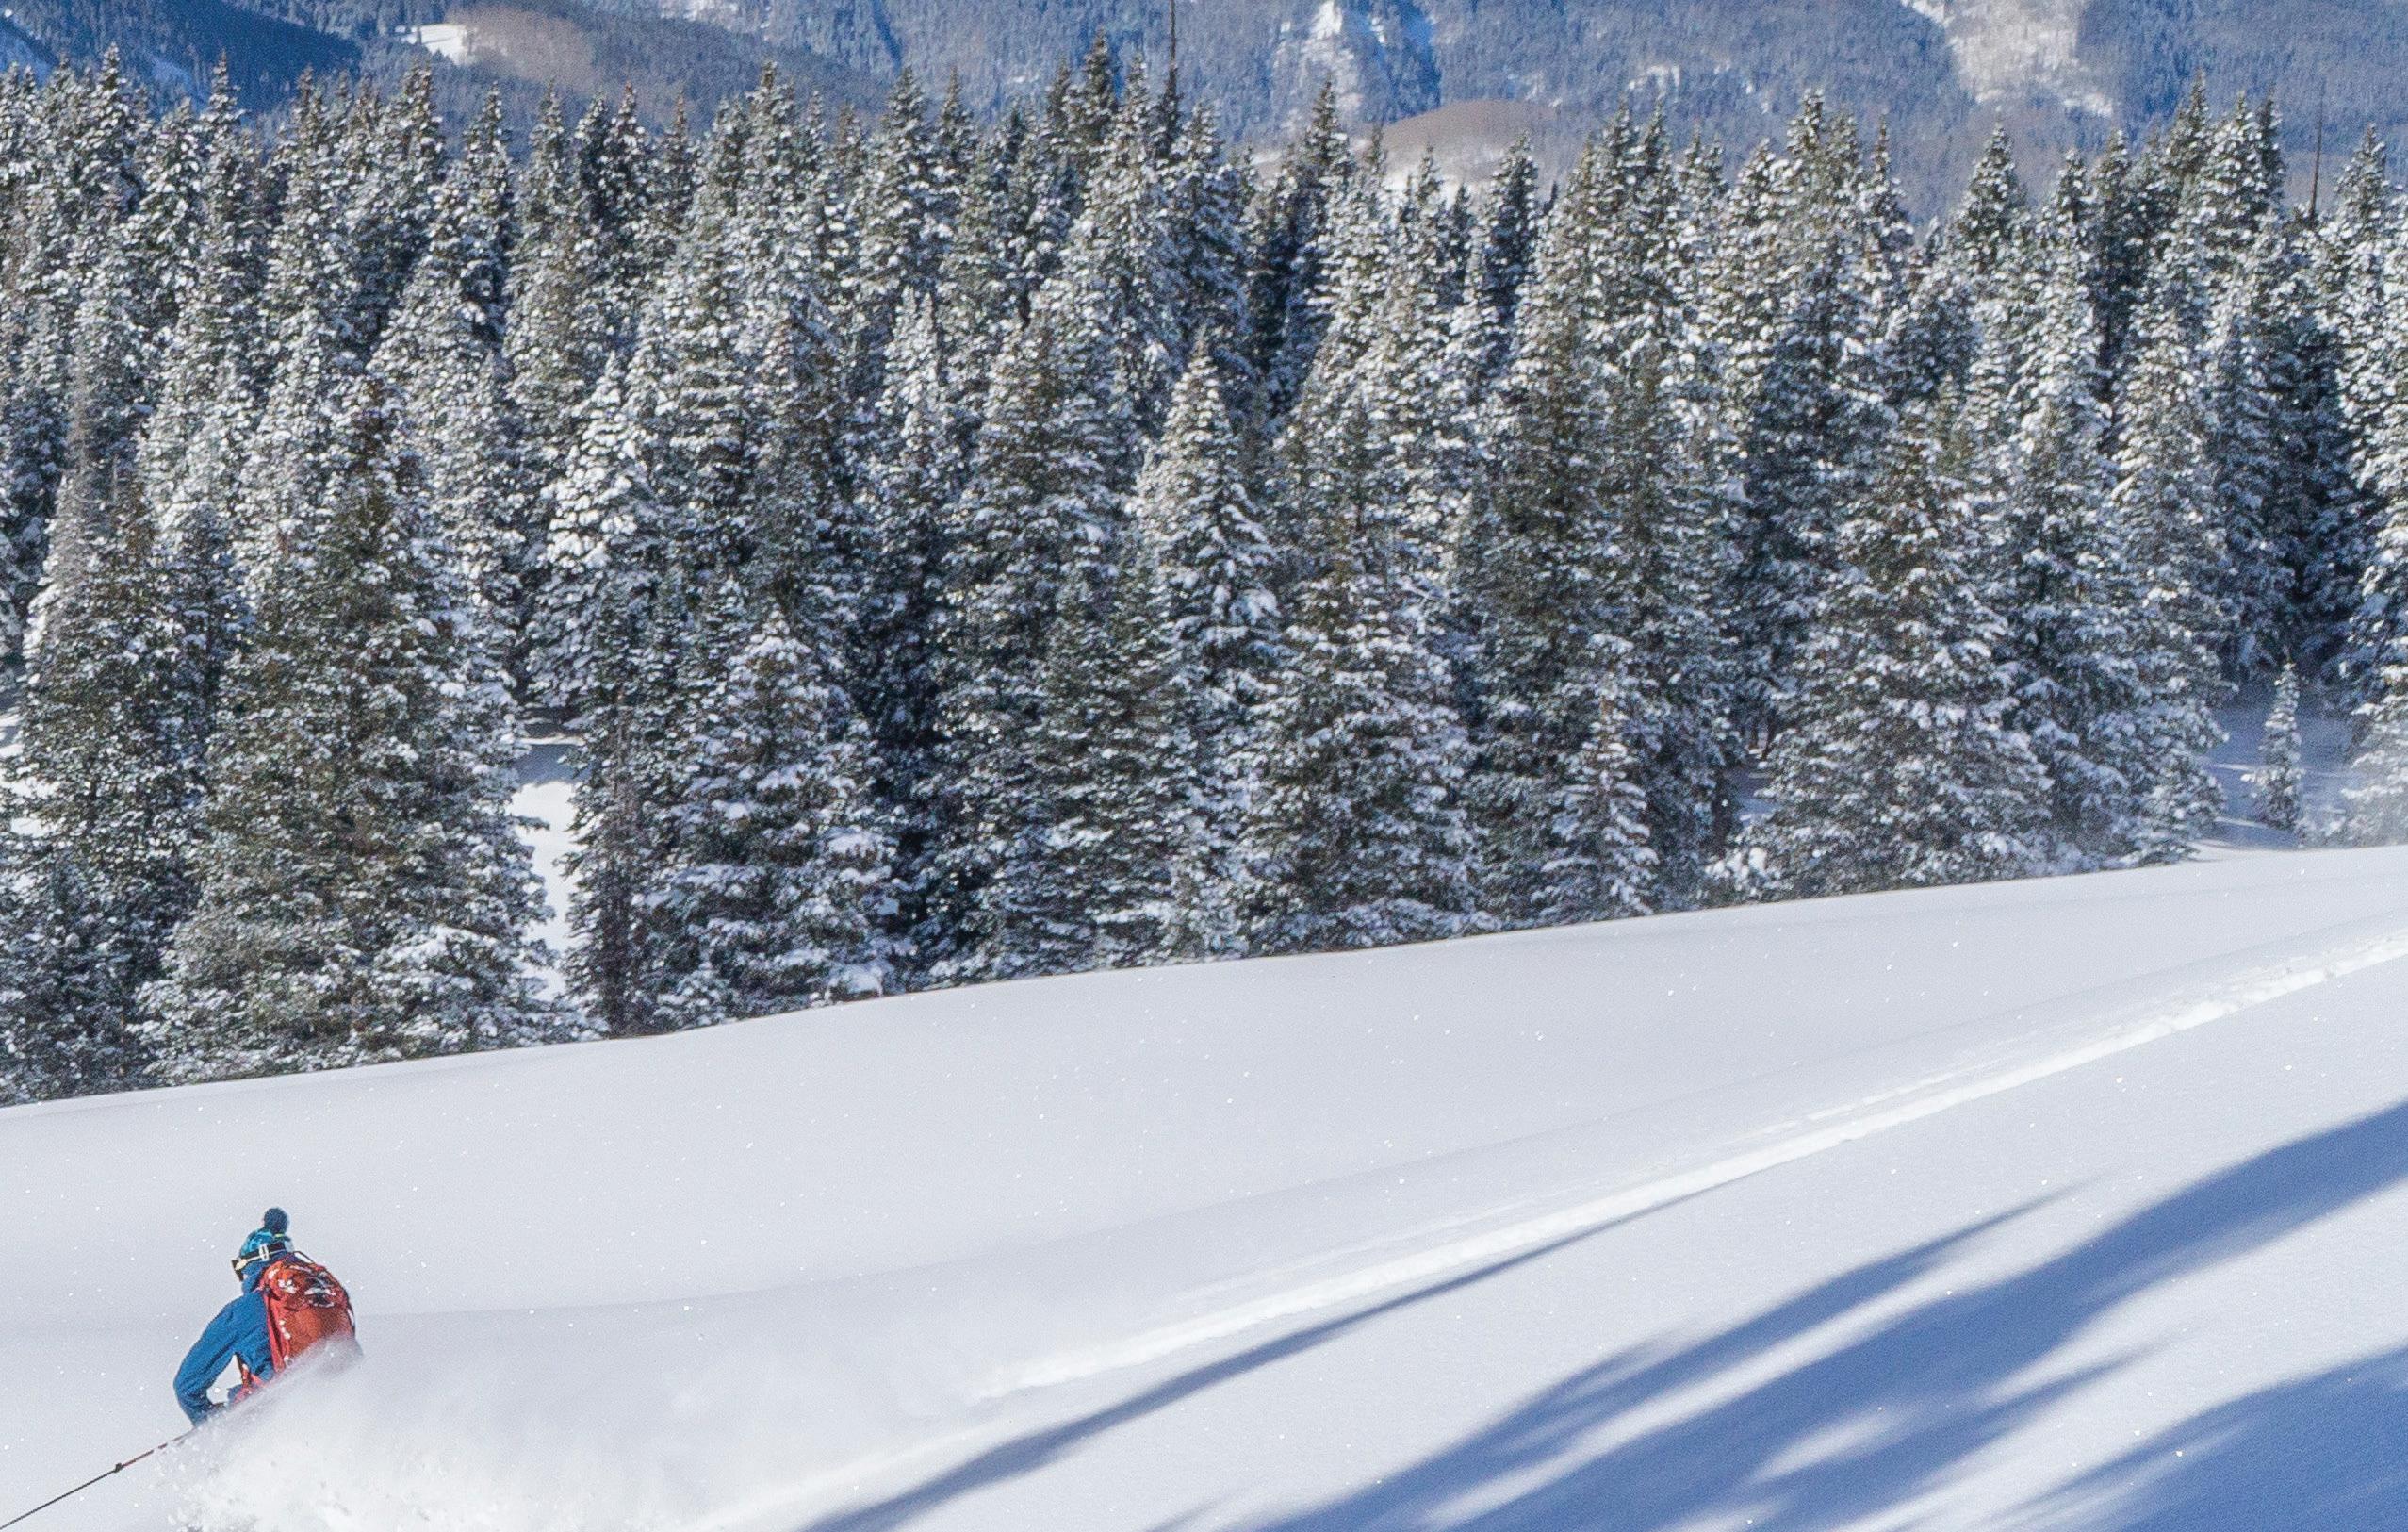
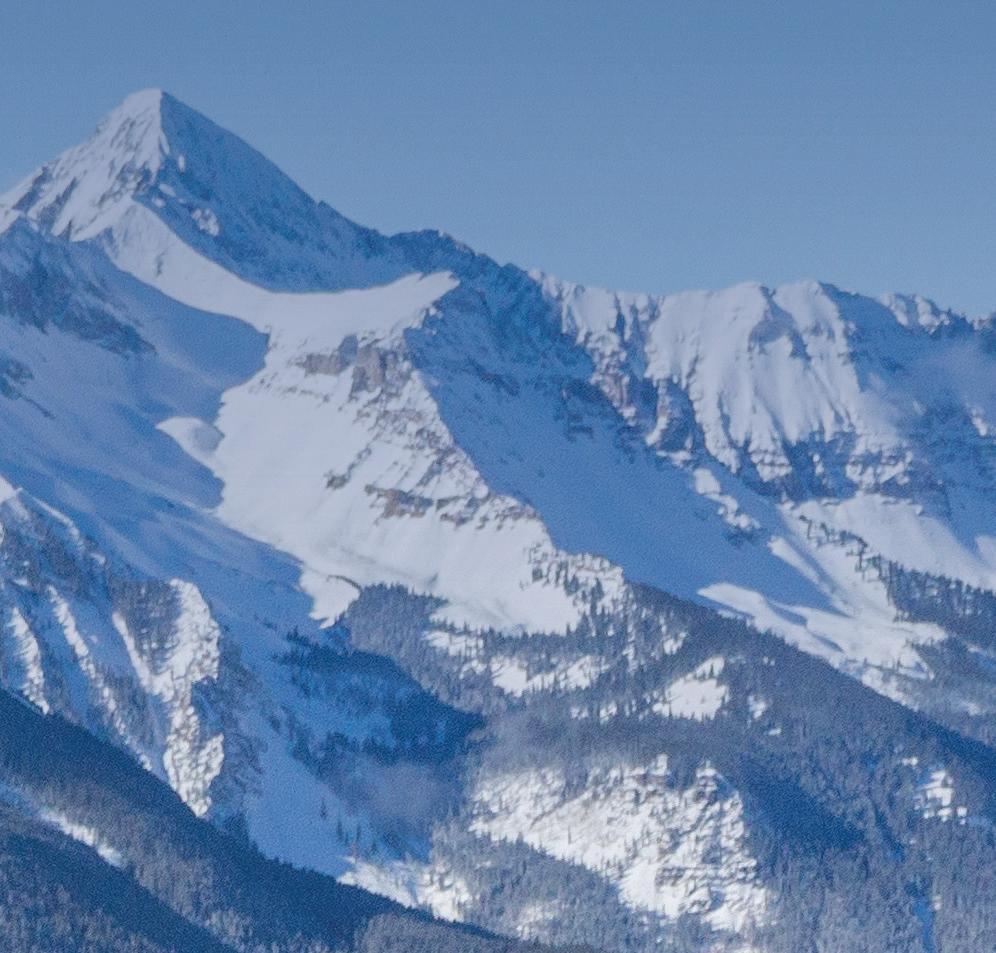
Boasting some of Colorado’s most stunning scenery and surrounded by 13,000- to 14,000-foot peaks, Telluride is off the beaten path in the San Juan Mountains and offers historical buildings that speak to its mining heritage in the 1800s. With a year-round population of just 2,600 residents, Telluride is an escape from fast-paced city life and offers outdoor recreation and a charming pedestrian-friendly downtown.

After red-hot real estate sales volume in 20202021, San Miguel County saw some stabilization in 2022. The average sale price throughout the County continues to climb, up 19.8% to $3.05 million. However, the overall sales volume dipped 22% which reflected the decrease in inventory.
Properties in the Town of Telluride had an average price per square foot of $1,841, up almost 18% from 2021. The average sale price in the Town of Telluride was $2.89 million, an increase of 8% from
the previous year. Mountain Village remains a desirable area for buyers, with an average sale price of $3.8 million, a healthy 40% increase over the prior year. The average price per square foot was $1,266, up 41.8% from $893 in 2021.


Telluride offers the combination of stunning vistas, access to recreation, and an historic downtown district which proves to be desirable for buyers looking for luxury in remote southwestern Colorado.
SAN MIGUEL COUNTY


coloradomicroreports.com
Based on Information from flexmls/Telluride Association of Realtors®. This representation is based in whole or in part on data supplied by flexmls/Telluride Association of Realtors®. flexmls/Telluride Association of Realtors does not guarantee nor is in any way responsible for its accuracy. Data maintained by flexmls/Telluride Association of Realtors may not reflect all real estate activity in the market.
January through December 2021 2022 % Change Sold Listings (All Properties) 418 280 -33.0% Sold Single Family 189 131 -30.7% Sold Condos/TH/DP 229 149 -34.9% Average Days on Market 182 116 -36.3% Average Sold Price $2,543,993 $3,048,192 19.8% % Sold Price to List Price 97.2% 96.1% -1.1% Total Sales Volume $1,094,401,497 $853,493,813 -22.0% All Residential Properties
MICRO MARKET REPORT | Telluride JANUARY - DECEMBER 2022 • COLORADOMICROREPORTS.COM livsothebysrealty.com
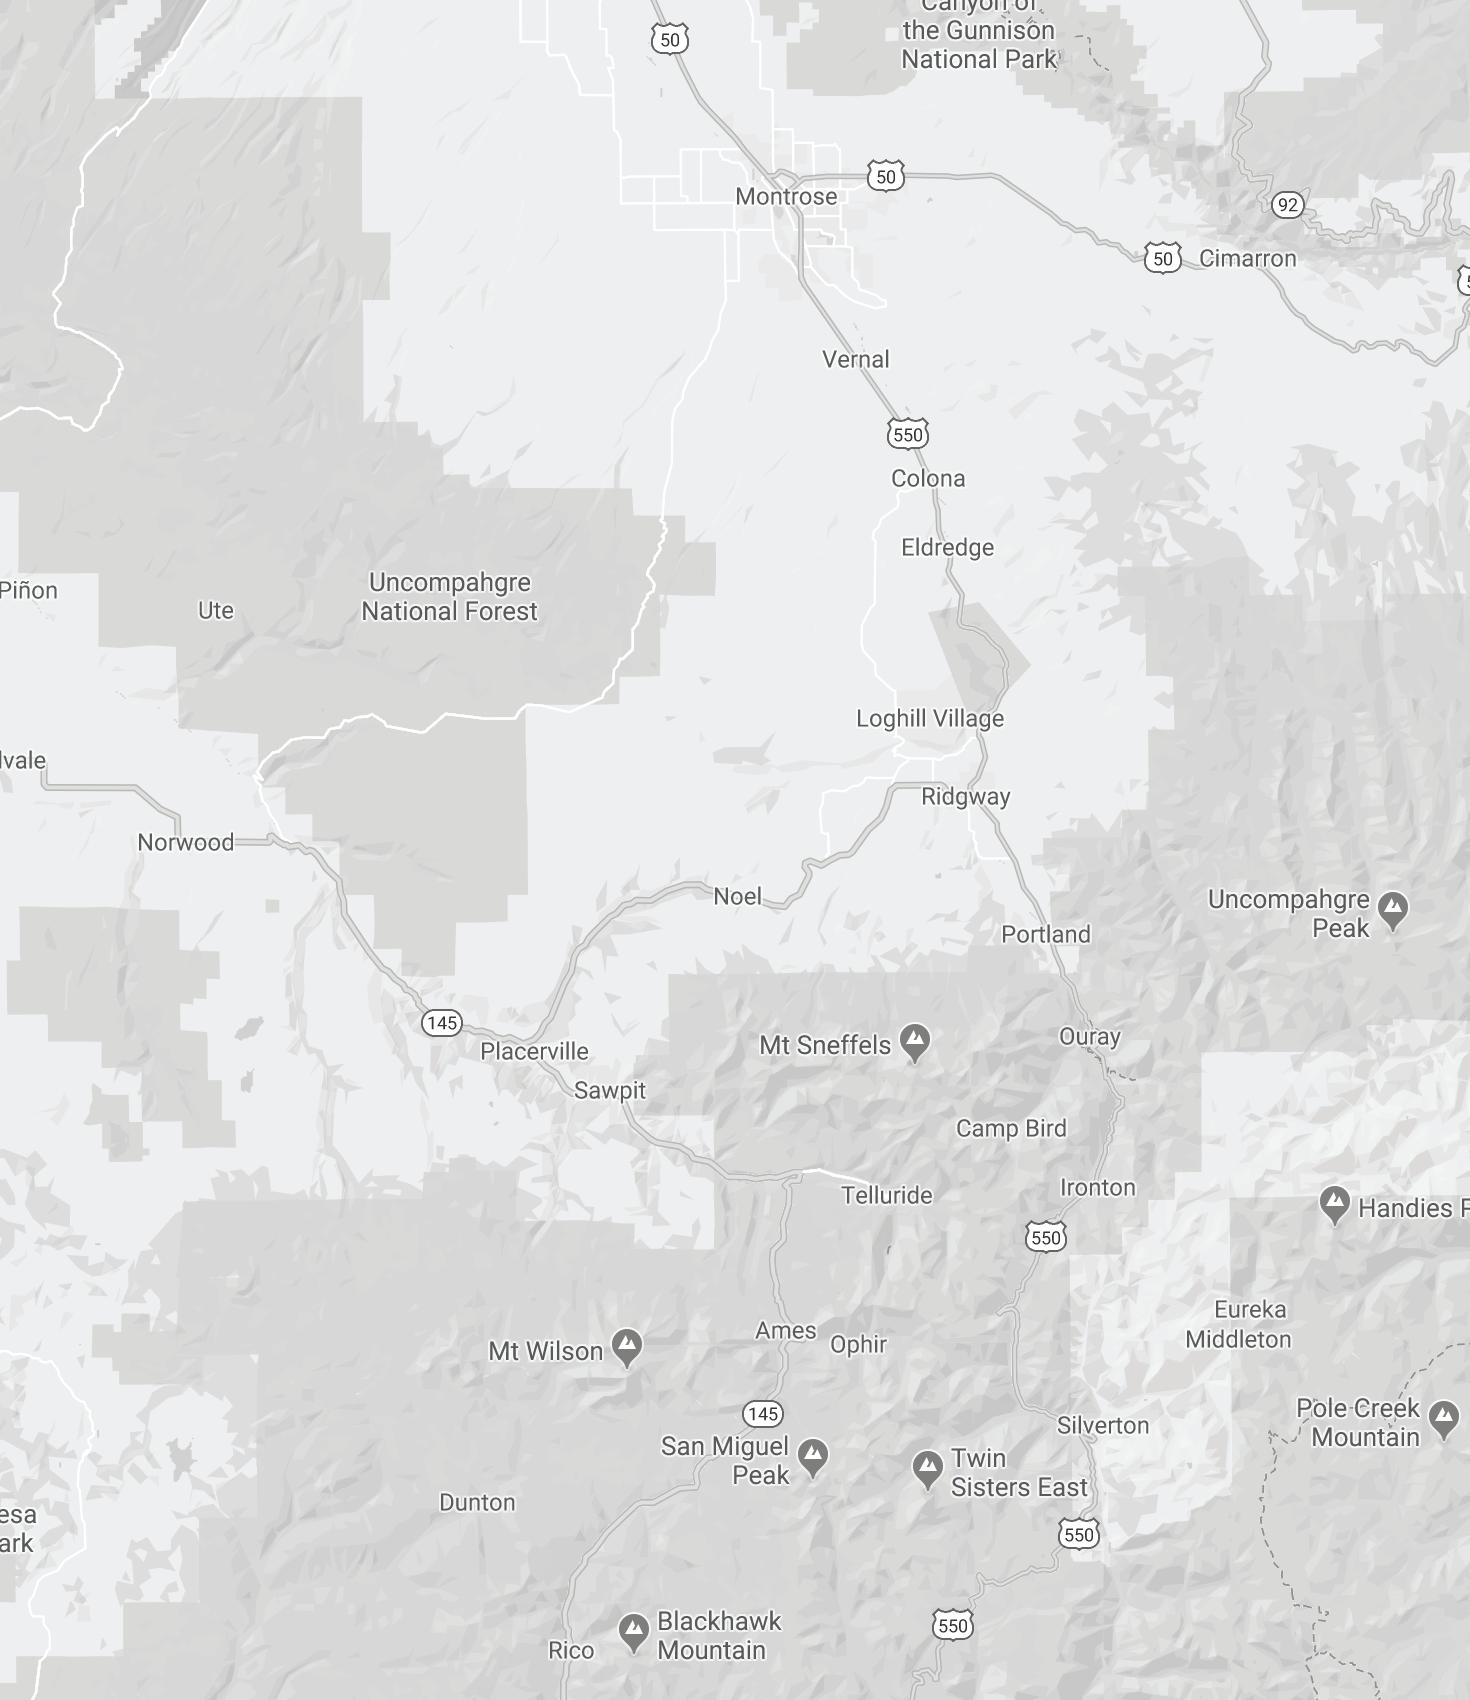
TELLURIDE NEIGHBORHOODS
4 3 2 1
1. Telluride 2. Mountain Village 3. Norwood 4. Ridgway
6.9%
The average sold price for single family homes in the Town of Telluride decreased by 6.9% January through December 2022 compared to that of 2021.
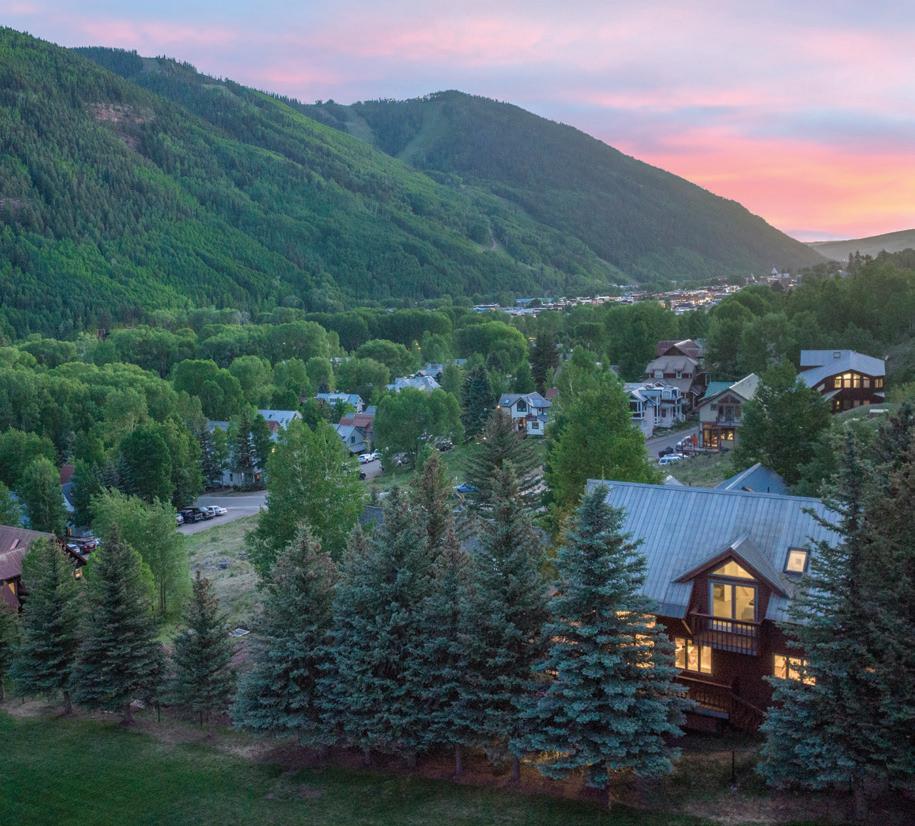
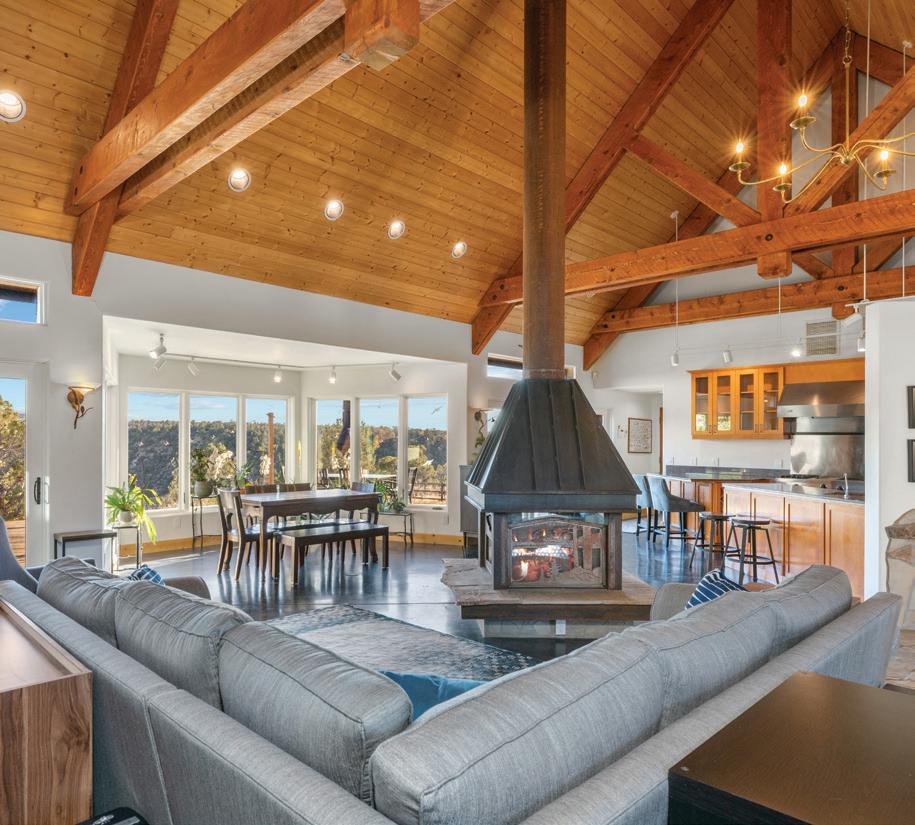
The historic Town of Telluride , designated as a National Historic Landmark District in 1964, is near the end of a picturesque box canyon surrounded by incredible 13,000 and 14,000-foot peaks. Just 12 blocks long by eight blocks wide, the town is a menagerie of colorful Victorian homes, superb restaurants, historic buildings, and independent boutiques, galleries and outfitters.
TOWN OF TELLURIDE Condominiums, Townhomes, Duplexes and Triplexes January through December 2021 2022 % Change Average Sold Price $1,726,735 $1,936,874 12.2% Average Price per Square Foot $1,402 $1,764 25.8% Average Days on Market 111 91 -18.0% Highest Price $7,567,500 $6,250,000 -17.4% Properties Sold 95 63 -33.7% % Sold Price to List Price 98.0% 97.5% -0.5% All Residential Properties January through December 2021 2022 % Change Average Sold Price $2,679,841 $2,893,401 8.0% Average Price per Square Foot $1,562 $1,841 17.9% Average Days on Market 124 114 -8.1% Highest Price $28,000,000 $14,500,000 -48.2% Properties Sold 124 87 -29.8% % Sold Price to List Price 97.1% 97.9% 0.8% Single Family Homes January through December 2021 2022 % Change Average Sold Price $5,802,085 $5,404,284 -6.9% Average Price per Square Foot $2,084 $2,042 -2.0% Average Days on Market 167 $177 6.0% Highest Price $28,000,000 $14,500,000 -48.2% Properties Sold 29 24 -17.2% % Sold Price to List Price 96.0% 98.0% 2.1% Land January through December 2021 2022 % Change Average Sold Price $1,729,240 $2,250,000 30.1% Average Days on Market 434 198 -54.4% Highest Price $4,725,000 $3,400,000 -28.0% Properties Sold 25 6 -76.0% % Sold Price to List Price 102.8% 96.6% -6.0%
The average sold price of single family homes in Mountain Village increased by 34.6% January through December 2022 compared to that of 2021.
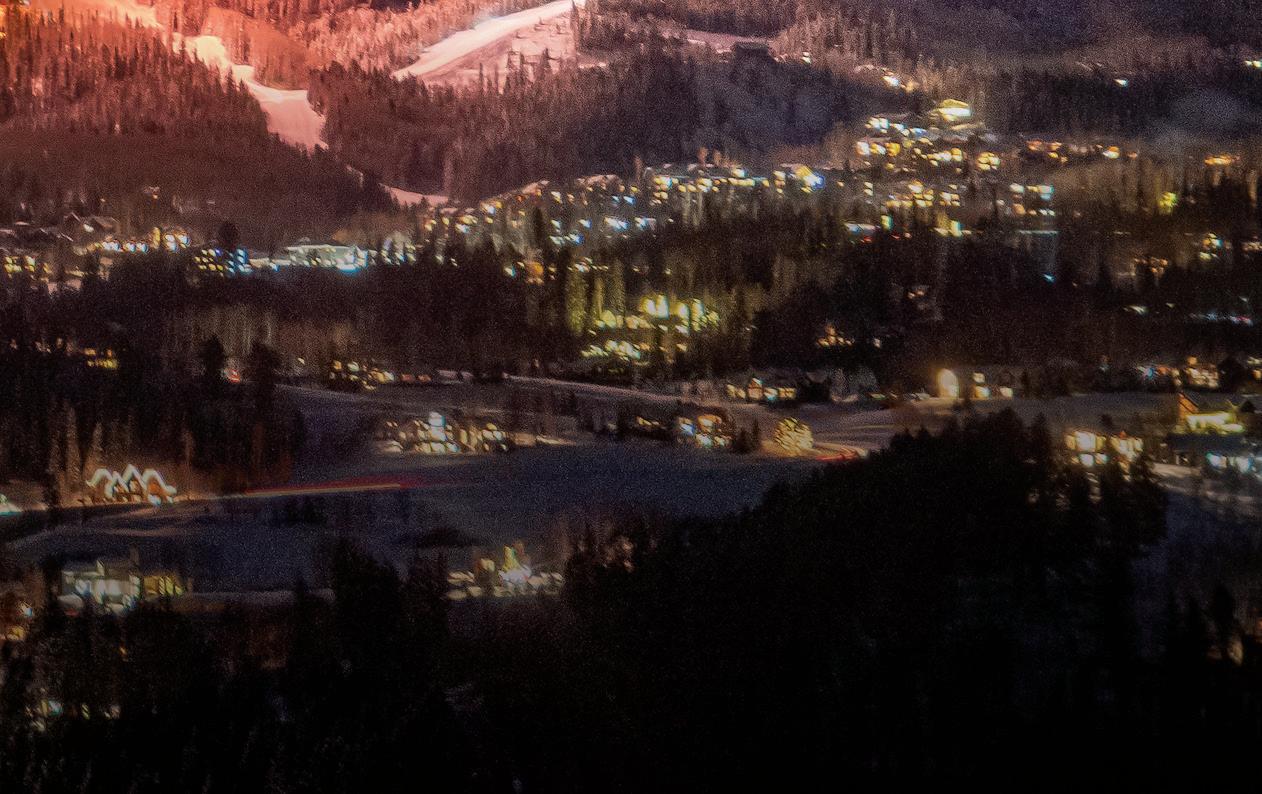
Founded in 1986 and incorporated in 1995, the Town of Mountain Village was inspired by modern ski villages in Europe with cobblestone plazas, European architectural accents and a mix of residential and commercial structures. At over 9,500 feet in elevation, the town sits on the north end of sunny Turkey Creek Mesa and consists of over 2,100 acres of land.
Single Family Homes January through December 2021 2022 % Change Average Sold Price $5,418,546 $7,292,411 34.6% Average Price per Square Foot $924 $1,329 43.7% Average Days on Market 331 174 -47.4% Highest Price $17,000,000 $17,100,000 0.6% Properties Sold 49 29 -40.8% % Sold Price to List Price 97.4% 97.4% 0.0% All Residential Properties January through December 2021 2022 % Change Average Sold Price $2,718,710 $3,806,774 40.0% Average Price per Square Foot $893 $1,266 41.8% Average Days on Market 214 108 -49.5% Highest Price $17,000,000 $17,100,000 0.6% Properties Sold 175 109 -37.7% % Sold Price to List Price 97.6% 97.6% 0.0% MOUNTAIN VILLAGE
Condominiums, Townhomes, Duplexes and Triplexes January through December 2021 2022 % Change Average Sold Price $1,668,774 $2,543,230 52.4% Average Price per Square Foot $881 $1,243 41.2% Average Days on Market 168 85 -49.4% Highest Price $5,900,000 $11,000,000 86.4% Properties Sold 126 80 -36.5% % Sold Price to List Price 97.9% 97.9% 0.0% Land January through December 2021 2022 % Change Average Sold Price $1,051,735 $1,488,391 41.5% Average Days on Market 557 350 -37.2% Highest Price $10,500,000 $4,250,000 -59.5% Properties Sold 72 23 -68.1% % Sold Price to List Price 94.3% 89.8% -4.8%
34.6%
The average sold price for all residential properties in Surrounding Mesas increased by 10.2% January through December 2022 compared that of 2021.
The Town of Norwood, about a 40-minute drive from Telluride, is located on a western plateau and is primarily agricultural in nature featuring ranch lands, cattle and other livestock operations. Outdoor activities are plentiful, with no shortage of options for hunting, shing, hiking and mountain biking nearby.
SURROUNDING MESAS All Residential Properties - Deep Creek Mesa, Hastings Mesa, Iron Springs/ Horse y Mesa, Specie Mesa, Sunshine Mesa, Turkey Creek Mesa, Wilson Mesa January through December 2021 2022 % Change Average Sold Price $3,608,776 $3,976,509 10.2% Average Price per Square Foot $919 $1,123 22.2% Average Days on Market 256 161 -37.1% Highest Price $39,500,000 $24,500,000 -38.0% Properties Sold 48 39 -18.8% % Sold Price to List Price 96.6% 89.7% -7.1% Land January through December 2021 2022 % Change Average Sold Price $419,961 $175,410 -58.2% Average Days on Market 190 163 -14.2% Highest Price $11,000,000 $565,000 -94.9% Properties Sold 45 10 -77.8% % Sold Price to List Price 98.0% 87.8% -10.4% Land - Deep Creek Mesa, Hastings Mesa, Iron Springs/Horse y Mesa, Specie Mesa, Sunshine Mesa, Turkey Creek Mesa, Wilson Mesa January through December 2021 2022 % Change Average Sold Price $902,740 $1,816,321 101.2% Average Days on Market 395 227 -42.5% Highest Price $15,400,000 $32,000,000 107.8% Properties Sold 97 49 -49.5% % Sold Price to List Price 90.1% 95.0% 5.4% All Residential Properties January through December 2021 2022 % Change Average Sold Price $351,852 $366,117 4.1% Average Price per Square Foot $225 $249 10.6% Average Days on Market 149 76 -49.0% Highest Price $880,000 $700,000 -20.5% Properties Sold 27 21 -22.2% % Sold Price to List Price 98.0% 96.2% -1.8%
NORWOOD
10.2%
The average sold price for all residential properties in Ridgway increased by 25.1% January through December 2022 compared to that of 2021.
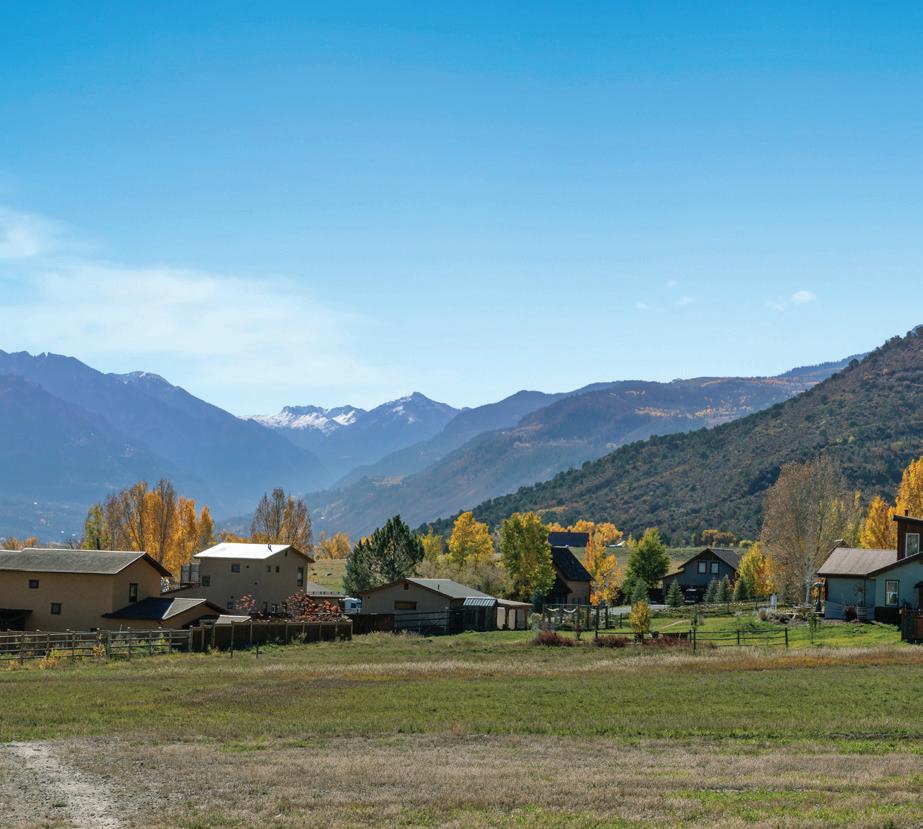
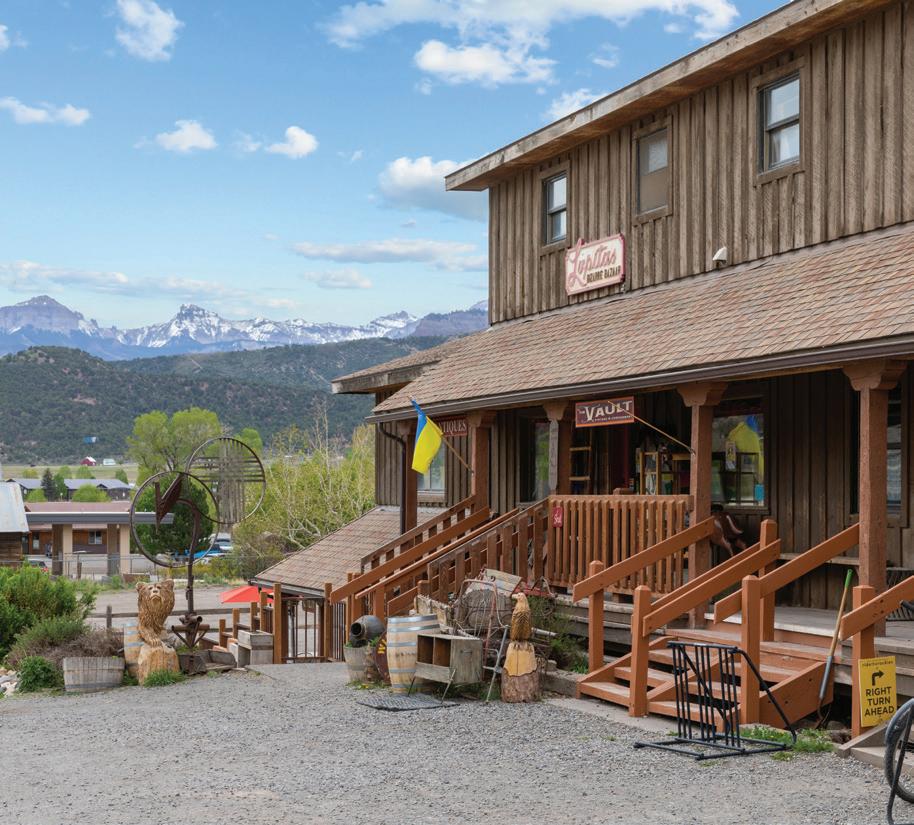
A 30-minute drive north of Telluride, and set in the beautiful Uncompahgre Valley, is the Town of Ridgway. Often referred to as the “Gateway to the San Juans,” Ridgway is a close-knit community with a picture-perfect downtown as well as several outlying subdivisions and the expansive Log Hill Mesa.
RIDGWAY: OURAY COUNTY Land January through December 2021 2022 % Change Average Sold Price $213,695 $483,732 126.4% Average Days on Market 306 140 -54.2% Highest Price $2,650,000 $7,500,000 183.0% Properties Sold 59 34 -42.4% % Sold Price to List Price 94.9% 93.3% -1.7% All Residential Properties January through December 2021 2022 % Change Average Sold Price $891,394 $1,115,128 25.1% Average Price per Square Foot $355 $457 28.8% Average Days on Market 171 153 -10.5% Highest Price $3,250,000 $3,000,000 -7.7% Properties Sold 50 45 -10.0% % Sold Price to List Price 96.1% 97.2% 1.1% Single Family Homes January through December 2021 2022 % Change Average Sold Price $927,760 $1,173,835 26.5% Average Price per Square Foot $358 $462 29.2% Average Days on Market 176 159 -9.7% Highest Price $3,250,000 $3,000,000 -7.7% Properties Sold 47 41 -12.8% % Sold Price to List Price 96.0% 93.9% -2.2%
Condominiums, Townhomes, Duplexes and Triplexes
25.1%
January through December 2021 2022 % Change Average Sold Price $321,667 $513,375 59.6% Average Price per Square Foot $316 $409 29.4% Average Days on Market 87 98 12.6% Highest Price $340,000 $829,000 143.8% Properties Sold 3 4 33.3% % Sold Price to List Price 99.1% 99.1% 0.0%
04 07 28 NATIONAL PARKS MOUNTAIN RANGES SKI AREAS & RESORTS
WHY COLORADO?
AVG DAYS OF SUNSHINE ANNUALY CRAFT BREWERIES 300 350+
MICRO MARKET REPORT | Telluride JANUARY - DECEMBER 2022 • COLORADOMICROREPORTS.COM