2 Table of Contents EXECUTIVE SUMMARY 4 AN OVERVIEW OF OUR COMMUNITY: SECONDARY DATA ANALYSIS 10 Our Community 10 Population Demographics 10 A Deep Dive into the Inland Empire 13 Exploring Population Health in the Inland Empire 21 Length and Quality of Life 21 Access to Clinical Care 24 Mental Health Crisis 28 Social and Economic Factors 29 Physical Environment 35 COVID-19 Pandemic 37 Regional Collaborations 39 Regional Community Health Needs Assessment 39 Community Vital Signs 41 The LLUH Service Area 42 LLUH Health System 42 SAC Health System 44 THE VOICES OF OUR COMMUNITY: FRESH QUALITATIVE & QUANTITATIVE FINDINGS 45 Qualitative and Quantitative Methodologies Defined 46 Part 1: Qualitative Research Study 46 Part 2: Quantitative Research Study 50 Integrated Findings from Qualitative and Quantitative Studies 52 Our Community’s Assets 52 How do people feel about their community? 53 What gives community members hope? 53 Our Community’s Top Needs 53 Who is most affected by priority health and mental health challenges? 56 What is contributing to these health challenges? 57 How has the COVID-19 Pandemic contributed to these challenges? 62 What our Community Needs for Equitable Health and Wellbeing 65
3 PRIORITIZATION OF COMMUNITY NEEDS 68 Looking Ahead: Addressing Community Health Needs 68 EVALUATION OF THE LLUH 2020-2022 IMPLEMENTATION STRATEGY 69 Update on Past Implementation Plans 69 How LLUH Responded to the COVID-19 Pandemic 79 Community Benefit Spending and Investments 81 Total Community Benefit Spending during FY 2020-2022 81 Community-Based Partner Investments 82 APPENDICES 84 A. Acknowledgements 84 B. Health Equity Framework Guiding the CHNA 85 C. References 86
Executive Summary
Loma Linda University Health (LLUH) is committed to engaging in deep and transformative relationships with San Bernardino and Riverside County residents to address the root causes of health challenges and inequities. Decades of research have confirmed that no individual and by extension, no family nor social community can thrive without adequate and reliable sources of income, the educational opportunities necessary to secure meaningful employment, the availability of affordable, sanitary and safe housing, or access to health care services during times of mental and physical crisis. Moreover, the social determinants of health extend beyond these forms of poverty to encompass other indices, such as: the social fabric of local community relations, the nature of the built environment, the quality of air, food and water available, and a host of other biological, social, environmental and behavioral risk factors. At LLUH, our focus on the social determinants of health ensures our system is meeting the needs and leveraging the assets of our community today as we invest in the health of tomorrow.
Purpose of the Community Health Needs Assessment (CHNA)
The Affordable Care Act requires health care institutions to conduct a Community Health Needs Assessment (CHNA) every three years in communities where they have licensed facilities, submit the report to the Internal Revenue Service, and post the report publicly on the hospital website by the last day of the fiscal year in which the CHNA is conducted (June 30 for LLUH).
The purpose of this Community Health Needs Assessment is to help LLUH’s licensed hospitals meet and exceed state and federal regulations on surveying the extended community’s health needs. It aims to identify key strategic areas of potential community investment that can optimize the overall health and well-being in our region. We seek to better understand the needs of the most vulnerable community members in our hospitals’ primary and secondary service regions which include both San Bernardino and Riverside counties. Despite the regulatory requirements, this process allows our Health System to go beyond our hospital walls and continue to fulfill our institutional mission: to further the teaching and healing ministry of Jesus Christ to make man whole. The findings of this assessment are meant to be used as our “North Star” in addressing unmet health needs in the community and promoting health equity within the region.
Regional Trends, Challenges and Strengths
LLUH’s primary service area can be defined broadly as California’s San Bernardino, Riverside, and Ontario metropolitan areas. The Riverside-San Bernardino-Ontario metro area is expected to grow from 4.6 million to 7.2 million people during the next 30 years, which would make it one of the top 10 most populous metropolitan areas in the United States. Though the Inland Empire is among the largest and fastest growing metro areas in California, the region faces severe problems with health disparities and poor health outcomes.
4
Residents of the “Inland Empire” the rapidly growing community that LLUH strives to serve in partnership with other creatively engaged community and non-profit organizations have experienced, on average, deeper and more persistent degrees of poverty and environmental risks than residents of other regions of California. The region’s historical grounding in agricultural production has shifted rapidly in recent years toward warehousing and truck, train, and plane-based delivery systems; contains proportionately large minority populations as well as local county governments that recognize and are actively grappling with racial disparities in health outcomes The ongoing COVID19 pandemic has been a daunting public health crisis that drastically affected our region and exposed inequities in our communities. While state and local measures were enacted to keep the community informed, initiate safety protocols, and roll out vaccination efforts, the pandemic has taken a heavy toll on the region. Despite these challenges, our community remains resilient, diverse, and beautiful as embodied by its unique landscape. Our community consistently shows the strength of the surrounding mountain ranges, the beauty of the nearby desert, and the fluidity of the ocean, all of which sit less than one hour from the heart of our region. While inequities continue to exist, the communities’ strengths –including a deep sense of community and collaborative nature – allow our region to grow forward together and to provide much needed hope
Faced with such daunting regional complexities, this research report aspires to identify and optimize strategies to better serve our region and ensure that equity stands at the forefront of all we do. With such a unique region comes the need for innovative solutions that drive change, address systemic racism and ensure critical access to quality health outcomes for every individual. This report seeks to provide a deeper understanding of our region through academic research, highlight community voices as central to the theory of change, and present ways to address critical health disparities.
Our Approach
This report integrates two distinct types of data that together sharpen LLUH’s understanding of the evolving disease burdens and health disparities affecting our community and allows us to engage with local community partners and members to help create a healthier, more equitable future for everyone. These two principal research approaches include:
• A macro-level review of secondary data gleaned from county, state and national sources that provides a historically dynamic view of the behavioral, physical, social, economic and environmental factors that contribute to health status. This section also aims to better understand differences between San Bernardino and Riverside Counties, as well as how they compare to the state of California.
• A novel community-participatory study, based on our long-standing relationship with the community, that deepens our insights into the community’s perceptions and experiences of their most pressing health challenges and provides direction for how LLUH can best collaborate in improving local health outcomes.
5
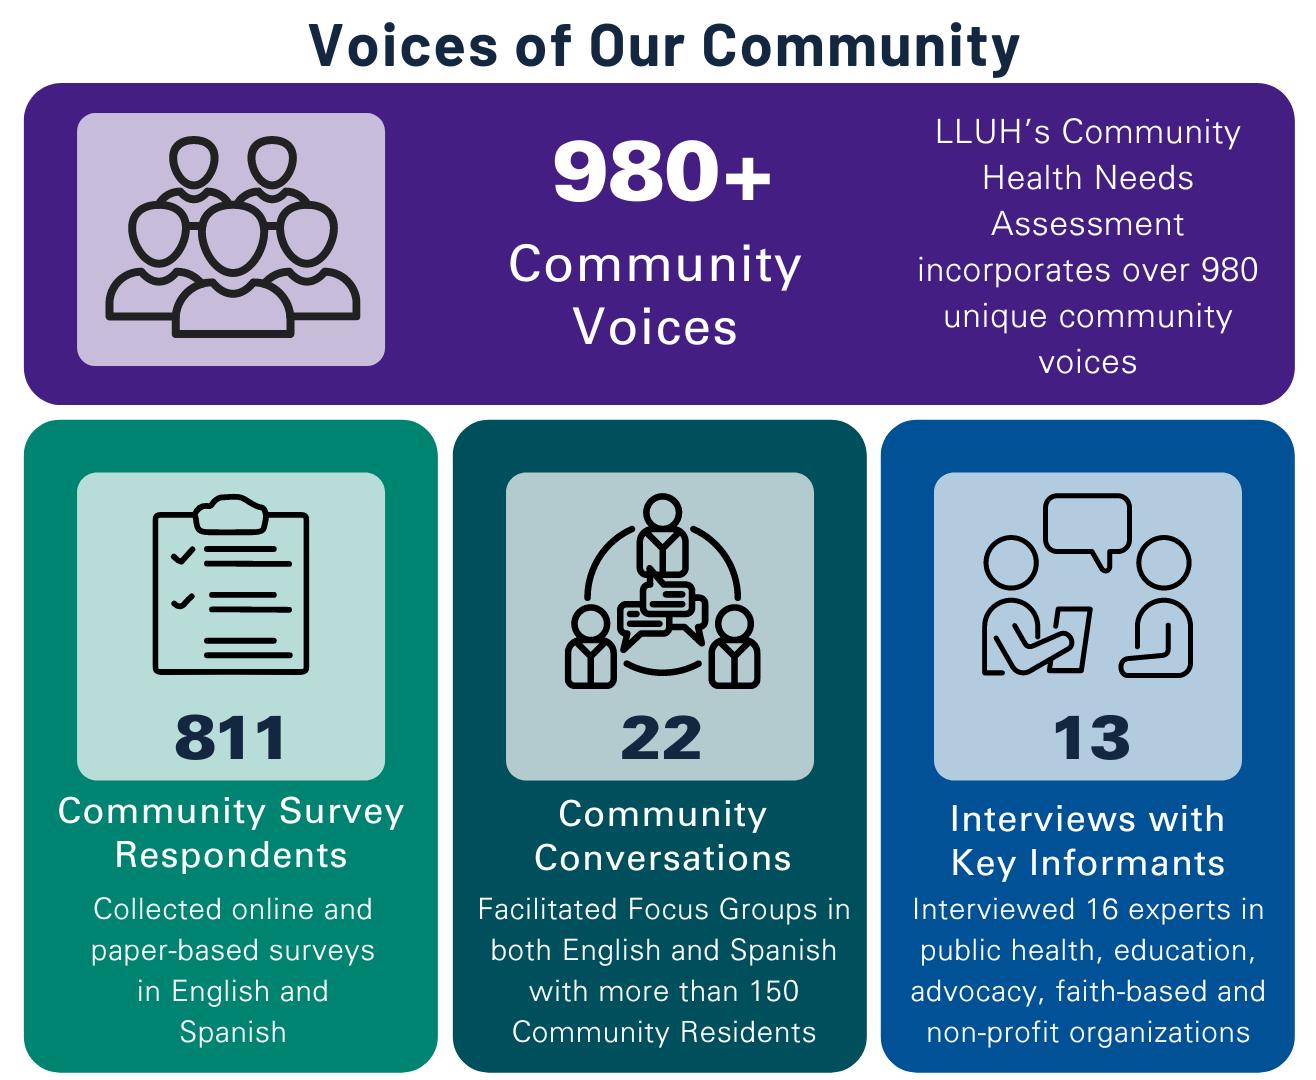
These two types of data complement each other in several key ways. The macro-level secondary data offers insight into how our community has been changing over the past decade, including shifting health needs and geographical and demographic disparities. The primary data collected from “community conversations” (focus groups), interviews with regional leaders (key informant interviews), and through written surveys represent a broad diversity of community voices that closely align with regional demographics. This assessment analyzes findings from 811 community survey respondents, 22 focus groups in English (17) and Spanish (5) with 150 community residents; and 13 interviews with 16 regional leaders active in public health, education, advocacy, faith-based and/or non-profit organizations with deep knowledge of our community’s most vulnerable populations. This community-participatory approach provides a decision-making process that garners community contributions and support for the assessment findings. Together, this mixed-method approach to our analysis provides a more holistic understanding of our community’s health needs and how we can best move forward to address the root causes underlying our health challenges.
Collaborations
Because inequities are so deeply rooted in our social systems and structures, a diverse team approach is required. LLUH partners with organizations throughout the Inland Empire to have a greater collective impact. LLUH also participates in two large regional strategic health assessment and planning groups:
• Regional Community Health Assessment: A broad coalition of hospitals, community-based organizations, health plans working together to address health challenges in the Inland Empire.
• Community Vital Signs: An interdisciplinary coalition of organizations seeking to assess the health challenges and implement strategies to improve the health of San Bernardino County residents
The goal of these collaborations is to develop coordinated strategies as well as solutions that can achieve results. The priorities listed in this report draw upon and align closely with findings from these regional efforts We also aim to draw upon LLUH’s unique strengths to contribute to regional goals For example, Loma Linda University Children’s Health is the Inland Empire’s only dedicated children’s hospital – caring for more than 800 NICU babies each year and providing high-risk pregnancy care. We are in a unique position to have an outsized impact in regional efforts related to maternal and child health.
In addition, LLUH recognized the importance of a more robust and academic approach to our CHNA process. This led to a critical collaboration with the Loma Linda University School of Public Health (SPH) that provided an impartial lens to the collection, analysis and reporting of the most critical health needs in our region. This high-level expertise brought to the table by the SPH team ensured a valid and useful analysis to identify the most important priorities to improve health outcomes in our region.
6
The Priorities
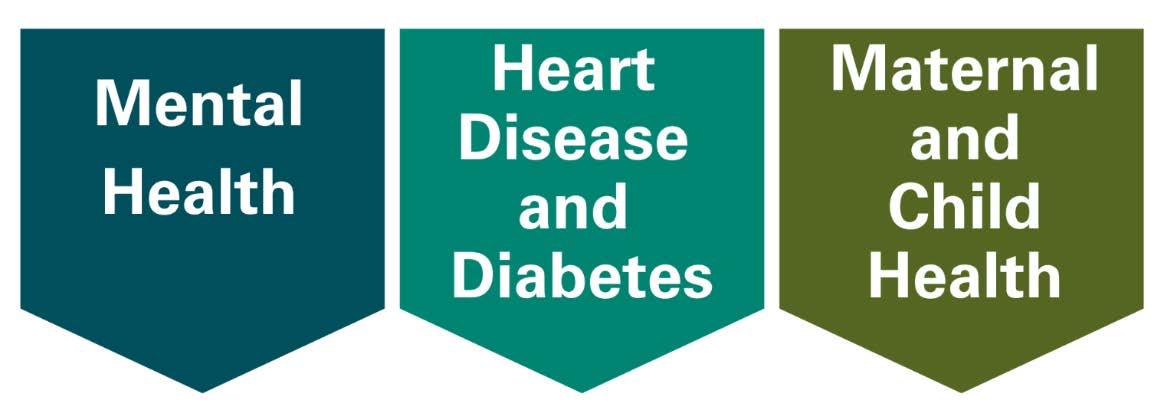
The health challenges that emerged across the community we serve are:
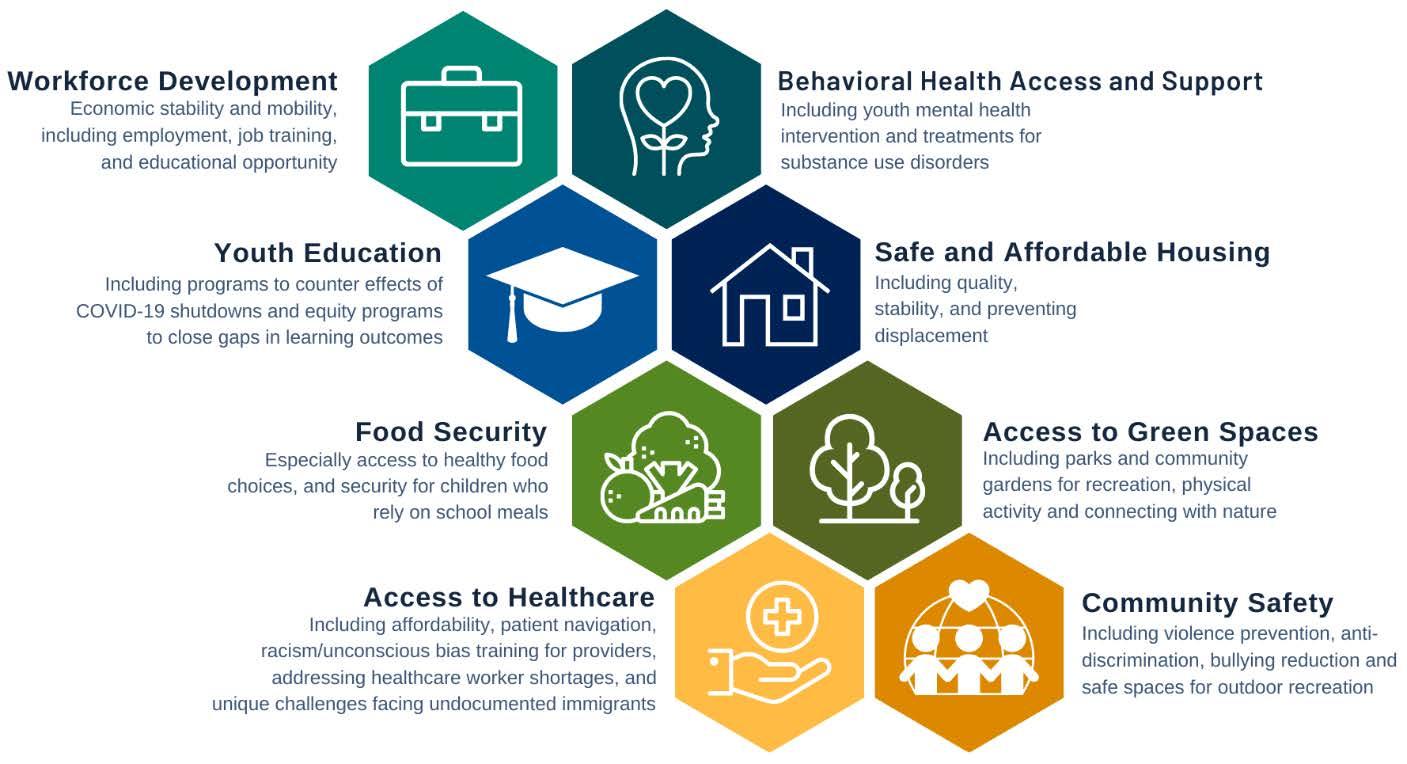
To improve health equity most effectively in our region, LLUH’s implementation strategy must include the root causes of social and health inequities. The community identified the following social and environmental conditions with the greatest impact on health locally:
7
Next Steps
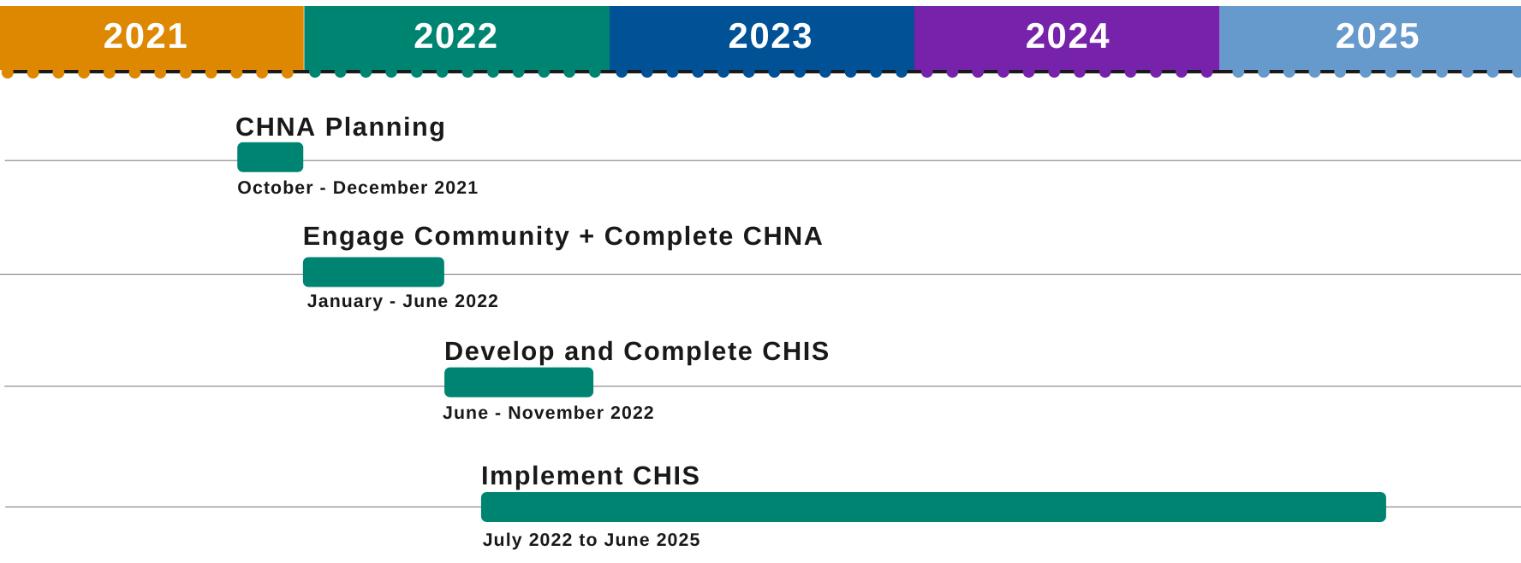
Our LLUH Community Benefit efforts will take findings from our 2022 CHNA to create our FY 20232025 Community Health Implementation Strategy (CHIS). This document which informs the priority areas for LLUH will be posted by fall of 2022. The CHIS is a 3-year plan that will outline goals, strategies, and metrics for evaluating outcomes and impact for each of our Community Benefit efforts.
In addition, we want to be sure to reflect before moving forward. Celebrating success and highlighting opportunities for growth over the course of the last 3-year cycle allows us to understand ways to continue to support our region. LLUH is committed to better health outcomes in our region and has made a conscious effort to invest in our focus areas of the previous cycle, despite the challenges posed by COVID-19. This included a continued priority focus on Workforce Development (Poverty / Access to the Essentials) and a secondary focus on Health and Wellness (Green Spaces, Behavioral Health, Access to Healthcare). We are proud to highlight job creation, pipeline investments and support for our nonprofit partners as major wins in improving health outcomes in our region.
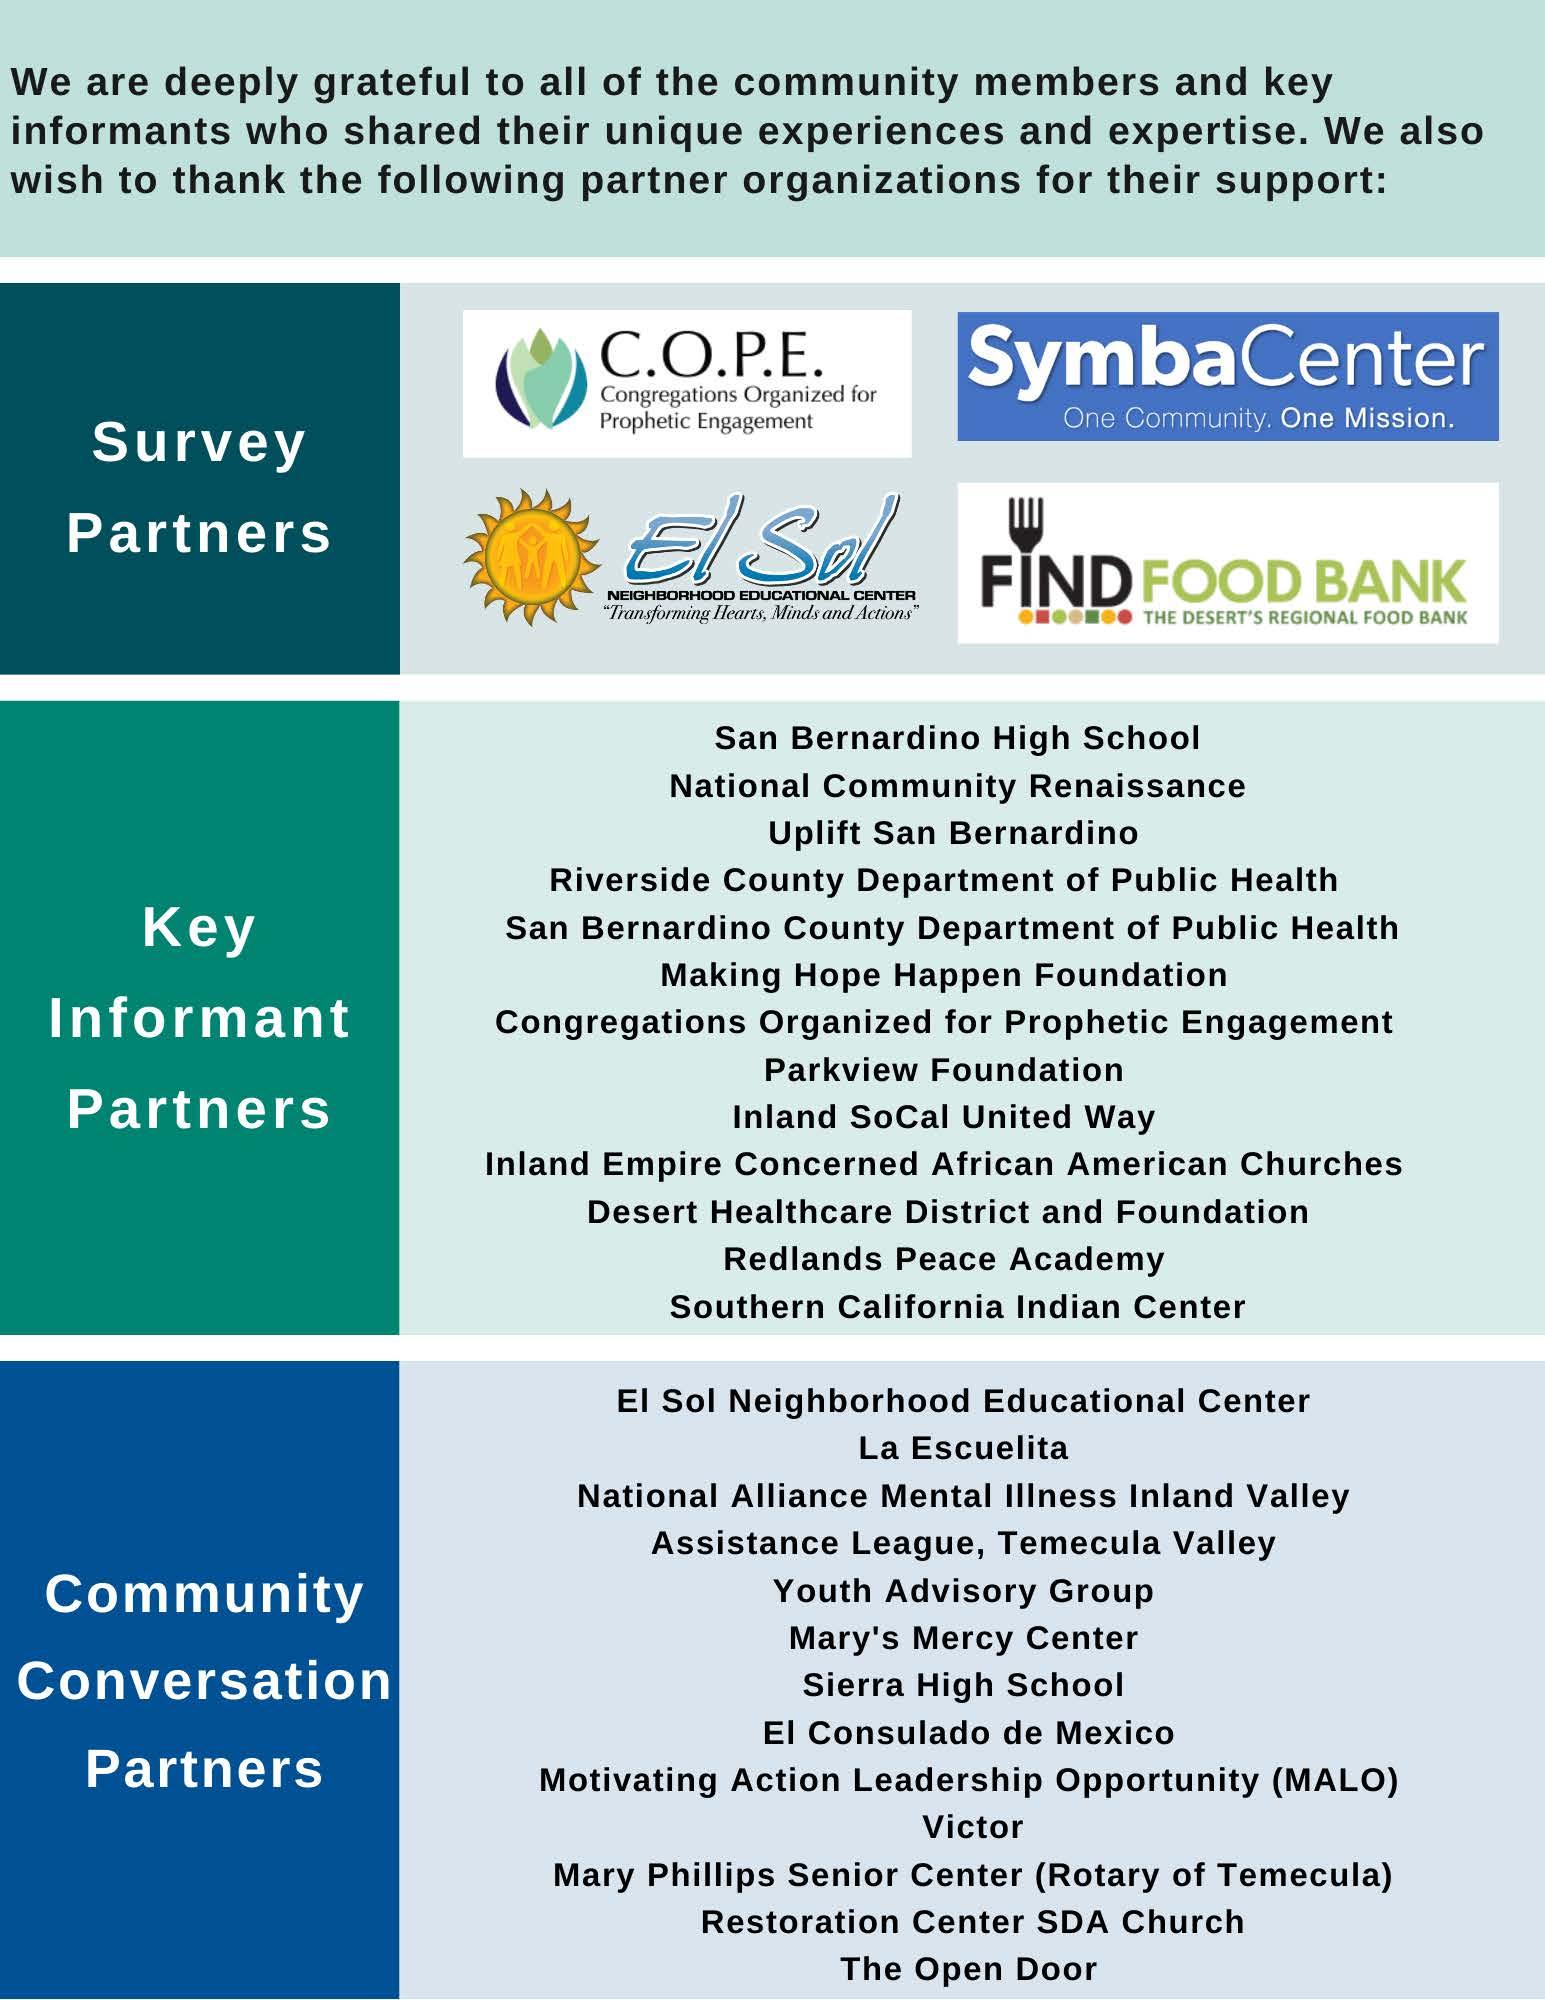
Our Community Partners
Finally, we want to thank our community partners that have been critical in ensuring that our community is seen, heard and given a space to share authentically. We are proud to state that a wide range of diverse perspectives are represented due to the trust and relationships that our partners have in and with our community. We want to thank the more than 20 partner organizations that were directly involved and allowed us to highlight the voices of nearly 1,000 individuals in our region in our CHNA Thank you, Xièxiè y Gracias to all of our valued partners and community members for sharing your time, energy and voice so that we can better understand how to serve you during the next 3-year cycle. We are better together.
8
9
An Overview of Our Community: Secondary Data Analysis
Our Community
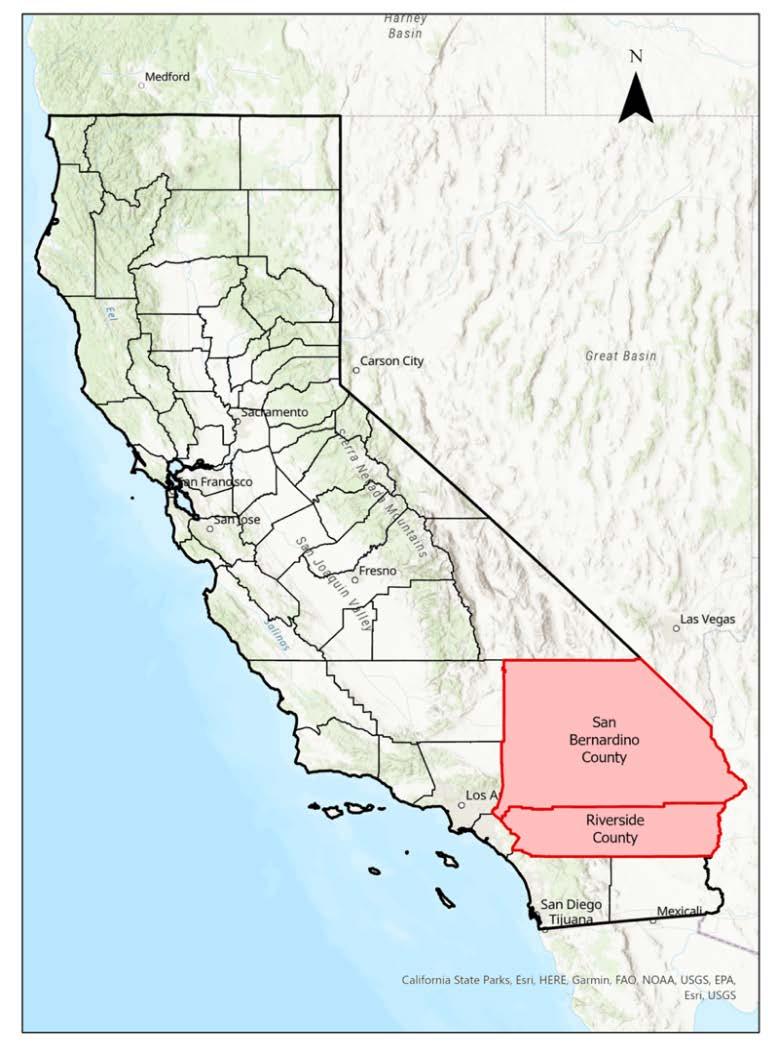
San Bernardino and Riverside counties make up the geographic area historically named “the Inland Empire” due to the region’s rich diversity of native peoples and agricultural history. Situated approximately 60 miles east from the Los Angeles metropolitan area and the Pacific Ocean, the Inland Empire is home to over 4.5 million people, is the third (3rd) most populous metropolitan area in the State of California and the 13th most populous metropolitan area in the United States. San Bernardino and Riverside Counties total over 27,000 square miles, representing more than 16% of California’s total landmass. The Inland Empire is home to diverse topography and national outdoor recreation treasures, including Joshua Tree and Death Valley National Parks.
The Inland Empire’s population has grown rapidly in recent years According to new census data, from July 2020 to July 2021, San Bernardino and Riverside Counties added about 47,601 people to the region, making it the fifth-fastest growing region among the 50 largest United States metro areas [1] Many people from Los Angeles County and other coastal regions have moved inland in search of more affordable living.
Population Demographics
Our survey of statistics reveal that the Inland Empire region differs from the state of California in several distinct ways. In contrast to statewide averages, the two-county region has:
• Majority Hispanic/Latino residents
• A higher proportion of non-Hispanic Black residents
• A larger Native American population
• A Younger population (higher proportion under 18)
• More people living in poverty
• A rapidly growing population
• A large and fast-growing supply chain sector (warehousing, transportation)
10
These trends are more pronounced in San Bernardino County, compared to Riverside County. While San Bernardino and Riverside have much in common, understanding their unique differences creates opportunities for well-targeted interventions for improving community health.
The two counties are home to some of the most diverse people in California. Hispanic populations now represent most of the population with the region being slightly higher than the state average for people below age 18. While population growth has experienced some of the highest rates in the nation over the past decade, a report by the United States Conference of Mayors found that this trend will continue. The Riverside-San Bernardino-Ontario metro area is expected to grow from 4.6 million to 7.2 million people during the next 30 years, which is expected to make it one of the top 10 most populous metropolitan areas in the United States. Currently, 41% of all people migrating to the Inland Empire are from the Los Angeles metro area [2]
Being the largest county in the US, San Bernardino County (SBC) consists of a highly diverse population of 2.18 million, including approximately 54% Hispanic/Latino, and 8% African American. This diverse population consists of 44% who speak a language other than English, 21% of residents who were born outside of the US (compared to 13% nationally), and approximately 127,000 undocumented immigrants [3, 4].
As indicated in Table 1, Riverside County has approximately 300,000 more residents than San Bernardino County and shares a similar demographic profile. Compared to San Bernardino County, Riverside County has a higher proportion of senior citizens and lower proportion of Non-Hispanic Black residents [5]. Riverside County has approximately 132,000 undocumented immigrants, similar to San Bernardino County [4].
11
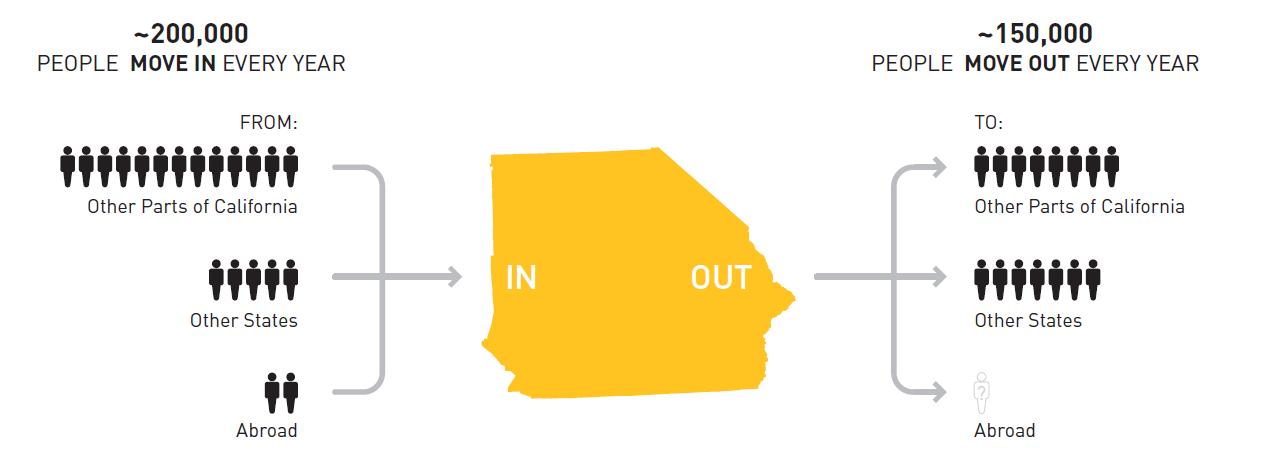
Figure 1: The Inland Empire experienced rapid population growth from 2015-2019 [2]
Though the Inland Empire is the largest and fastest growing metro area in California, the region faces severe problems with health disparities and poor health outcomes. According to a US News report on the healthiest communities, San Bernardino County scored in the 49th percentile (State Average is 56th percentile) in a county ranking system that looks at areas such as population health, equity, education, economy, housing, food/nutrition, environment public safety, community vitality and infrastructure [6]
12
Demographics: 2022 San Bernardino County Riverside County State of California Population 2,189,183 2,489,188 39,368,078 % Below 18 Years of Age 26.0% 24.6% 22.3% % 65 and Older 12.2% 15.2% 15.2% % Non-Hispanic Black 8.1% 6.3% 5.6% % American Indian & Alaskan Native 2.1% 2.0% 1.7% % Asian 8.4% 7.4% 15.8% % Native Hawaiian/Other Pacific Islander 0.5% 0.5% 0.5% % Hispanic 54.9% 50.6% 39.5% % Non-Hispanic White 26.4% 33.2% 35.9% Estimated number of Undocumented 127,000 132,000 2,739,000
Table 1: Inland Empire Demographics (2022)
A Deep Dive into the Inland Empire
Measure of America: Highlights from the Regional Report: A Portrait of California 2021–2022: Spotlight on the Inland Empire [2]
Parkview Legacy Foundation in its efforts to advance equity, partnered with Measure of America and several key players in the Inland Empire to create a report that would help foster transformative collaborations across sectors with the goal of making an impact on initiatives and policies. Partners include:
• Center for Social Innovation at the University of California, Riverside
• Loma Linda University Health
• First 5 Riverside County
• Inland Empire Health Plan
• Loma Linda University Health
• Inland SoCal United Way
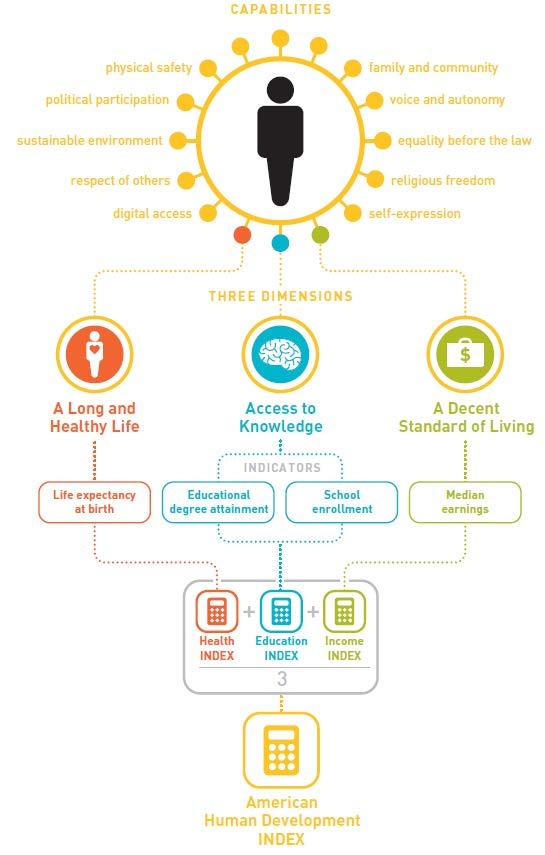
The Human Development Framework values people’s dignity and their freedom to make decisions and live the way they want to live. This framework is people centered and focuses on the social, environmental, and economic factors that shapes people’s decisions. Human development is a vast construct with several measures that shape people’s lives. Understandably a single index cannot capture all facets of this construct; therefore, three areas were identified by the United Nations as having a significant impact on human development [7]. These measures are a long and healthy life, access to knowledge, and a decent standard of living referred to as the Human Development Index (HDI) which uses a scale of 0 to 10 to provide a snapshot of community wellbeing while revealing inequalities among groups. The composite measures are broken down by race, ethnicity and gender using the census tract.
13
In the 2021-2022 Portrait of California’s Regional Report, the Inland Empire scored as follows:
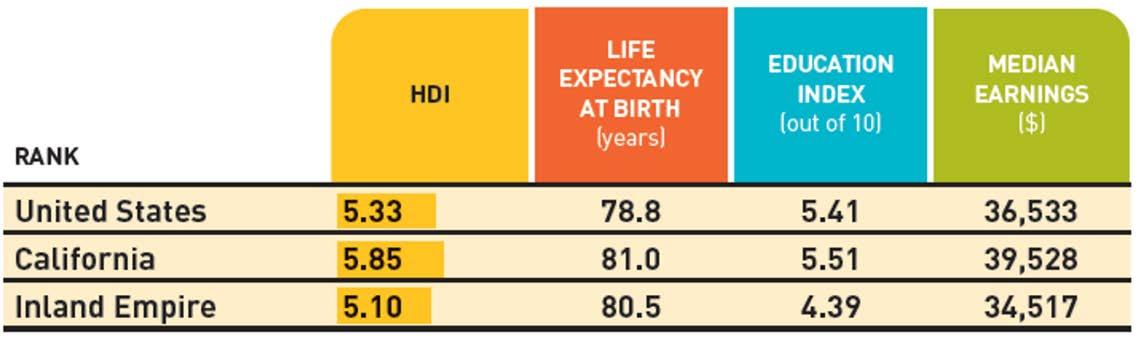
HDI Score
Today’s Inland Empire residents are more likely to attain high school diplomas and bachelor’s degrees, have about $7,000 more income, and live more than two years longer than those in 2009. However, well-being is disproportionate by place across the Inland Empire, including across counties. San Bernardino County residents have a slightly lower educational attainment and live 2.1 fewer years than their neighbors in Riverside County. Riverside County’s Human Development Index score is 0.43 higher than that of its neighbor, San Bernardino County.
While the Inland Empire’s HDI score remains lower than California overall, it has risen at a faster rate During the past 10 years, the Inland Empire’s HDI score improved by .52, compared to a .39 increase for California. However, this overall improvement masks significant disparities across racial and ethnic groups in the Inland Empire. During the past decade, the Latino HDI score experienced the most dramatic increase – jumping by 0.88 from 3.86 to 4.74 (a 22.8% increase over 2009). In contrast, the Asian American score increased by only 0.14, the Black score by 0.27, and the white score by 0.35.
The HDI scores also display disparities in the lines gender and place. For example, women within San Bernardino and Riverside Counties have a higher HDI score (5.30) than men who have a score of 4.93. This disproportion could be attributed to women’s 7.2-year higher life expectancy as well as somewhat higher levels of educational degree attainment. On the other hand, men in the Inland Empire greatly out-earn women, with $11,000 higher median individual income.
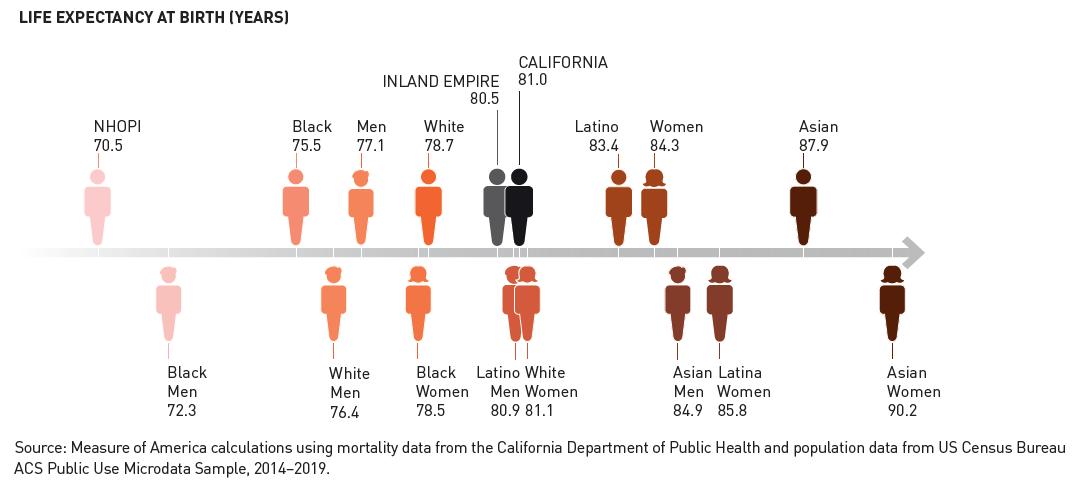
Life Expectancy
Residents in the Inland Empire have a slightly shorter life expectancy of 80.5 years compared to California at 81 years. Life expectancy in Riverside County is 81 years, having increased by 0.4 years during the past decade. San Bernardino County residents’ life expectancy is 78.9 years and has stayed the same. Among Inland Empire census tracts, life expectancy ranges from a high of 87.3 years in Census Tract 451.15 (the south of Palm Desert in Riverside County) to 68.8 years in Census Tract 62.04, (in the Del Rosa neighborhood of San Bernardino).
Asians have the longest life expectancy followed by Latino residents. Black residents have a lower life expectancy of 75.5 years – five years less than the average resident in the Inland Empire. Native Hawaiian and Other Pacific Islander (NHOPI) residents have the shortest overall life expectancy: 70.5
14
years. Also, NHOPI residents have a life expectancy that is about two years shorter than other NHOPI residents across the state of California.
Education
Having an education can lead to better job opportunities, higher earnings, and an overall better quality of life. Research increasingly shows education is associated with positive health outcomes and living longer).
In the Inland Empire, 82.1 percent of adults have at least a high school diploma, similar to California and the national average; however, only 22.9 percent have a bachelor’s degree and 8.2 percent have a graduate degree. Girls and young women have slightly higher school enrollment rates than boys and men.
According to the latest findings, Asians have the highest rates of school enrollment including at the bachelor’s and graduate degree level. About seven out of 10 Latino adults completed high school but have the lowest rates of bachelor’s and graduate degree attainment, at 11.7 and 3.3 percent, respectively. There are also large educational disparities between neighborhoods within the Inland Empire. For example, more than 10 times as many residents living in the Redlands Heights neighborhood in San Bernardino County hold at least a Bachelor’s degree compared to the Norco neighborhood of Riverside County.
15
Figure 2: Life Expectancy by Gender and by Race and Ethnicity in the Inland Empire [2]
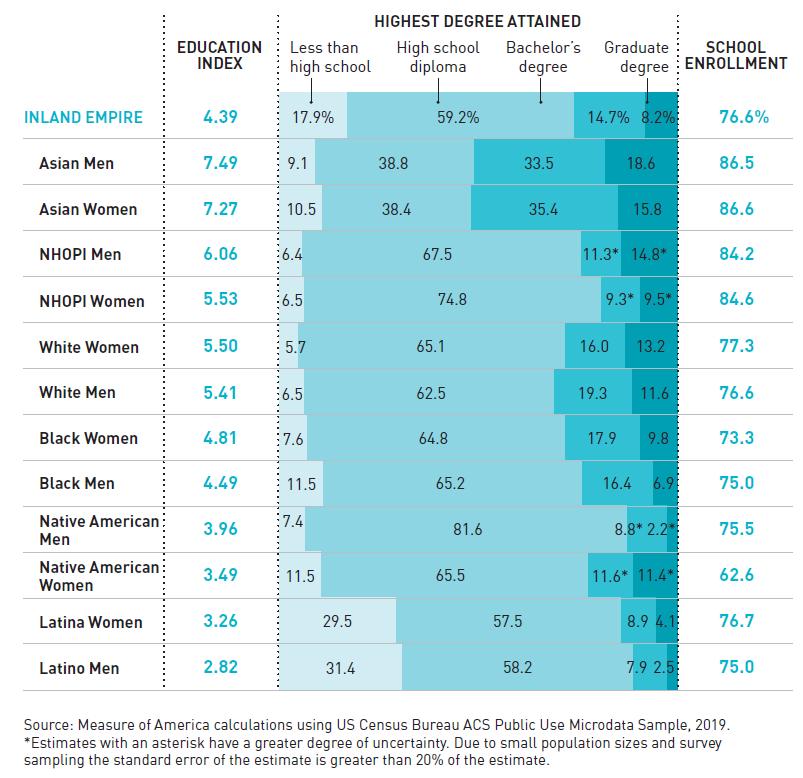
Looking at the table above, when comparing Asian, Native American, and NHOPI men, they have an Education Index higher than women of these groups, while Black, Latina, and white women have higher index scores than men from those groups.
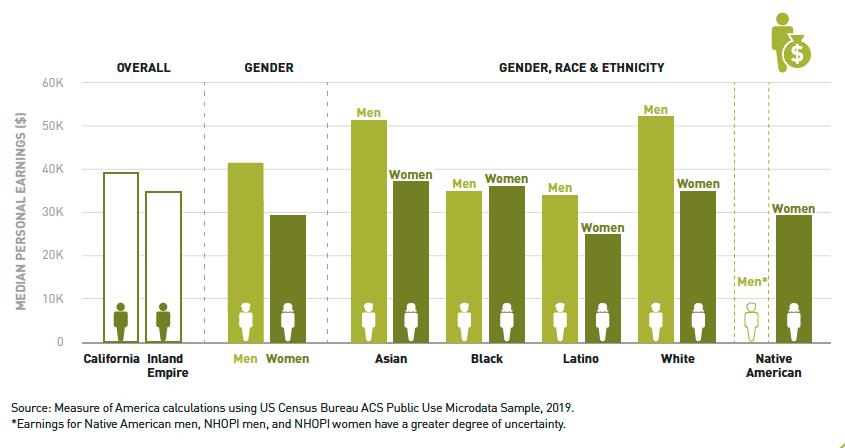
Median Earnings
Having an adequate level of financial resources, while not the only factor, can lead to better living conditions and allow persons more options in the choices they make for themselves, including healthcare and education decisions. According to the below findings, white and Asian Men earn considerably more than other groups and are well above state and county averages. Black, White, and Asian women share similar earnings and are comparable to the average earnings in the Inland Empire. Native American and Latino men and women early significantly lower earnings, less than the Inland Empire and State earnings. It is important to note that there are income disparities within racial and ethnic groups. For example, within Asian subgroup, Japanese and Indian residents earn nearly twice as much as Hmong and Laotian residents.
16
Figure 3: Education Index by Race and Ethnicity and by Gender
Low Wage Workers in the Inland Empire
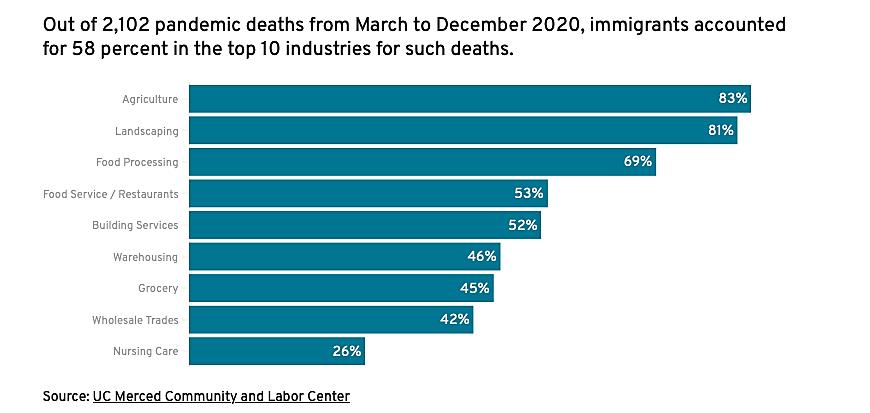
Logistics, including warehousing and transportation, is the fastest growing industry in the Inland Empire. From 2010-2019, this sector experienced the highest employment growth of any industry sectors. Warehouses often pay above the state’s minimum wage but offer a large number of temporary or contract jobs with no benefits. In California, warehouse workers had the highest statewide increase in pandemic-related deaths at 57% during 2020 [8].
Approximately 20% of undocumented workers who are Latinos and Asians work in the tourism and service sectors and often get exploited. Despite paying taxes, because they are undocumented, workers are not eligible for social services.
According to CalMatters, during the Pandemic, undocumented workers were vulnerable as they did not have any source of wage replacement benefits or safeguards in place if they fell ill or lost their job [9]. Moreover, immigrants are over-represented in frontline “essential worker” roles, making them more vulnerable to COVID-19 infection and death.
17
Figure 4 : White and Asian Men Earn Significantly More than Other Groups
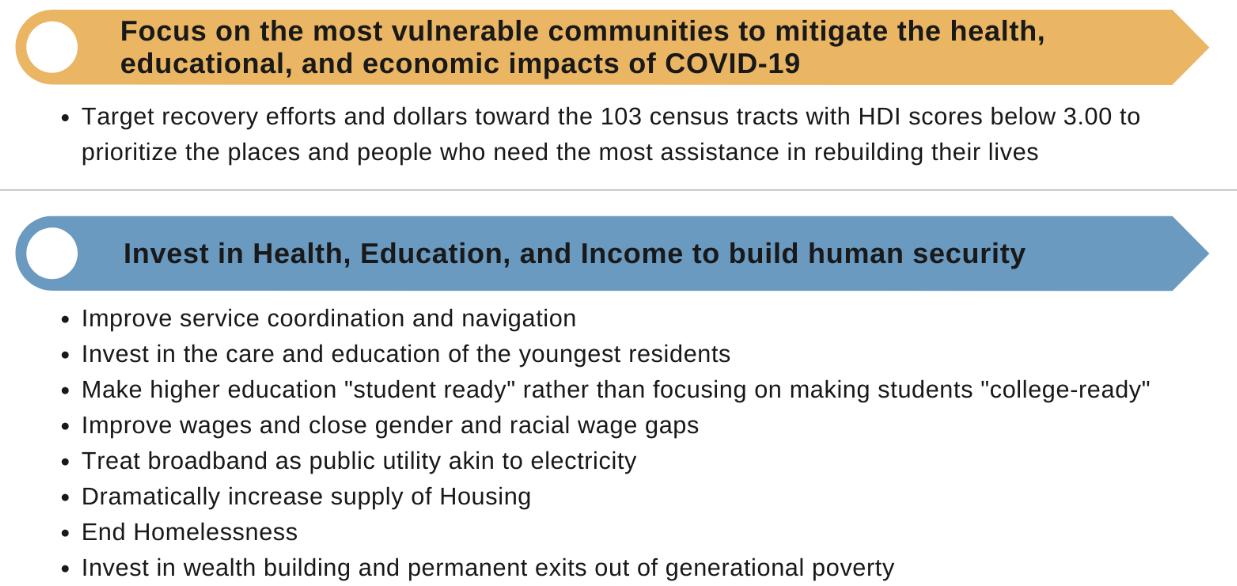
Report Recommendations
The Spotlight on the Inland Empire report recommends the following strategies to advance equitable distribution of well-being across the region [2]:
18
Figure 5: Immigrants made up the majority of pandemic related deaths in California’s highest-risk industries.
United Way’s Real Cost Measure – Inland Empire
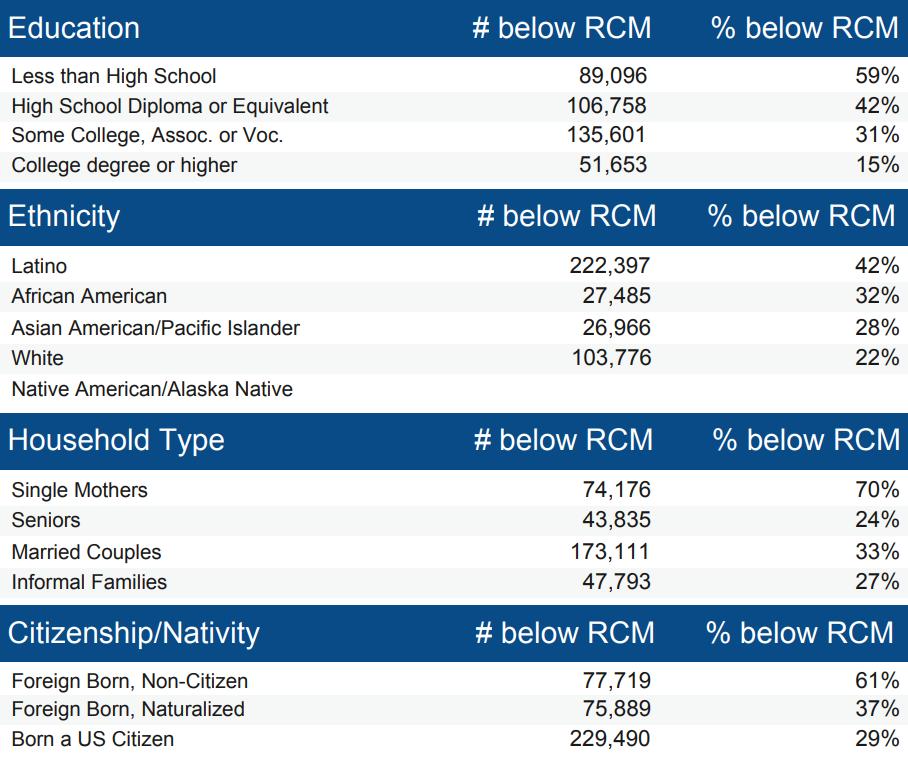
In 2021, United Ways of California partnered with 29 local United Ways’ throughout the State to release, “Struggling to Move Up: The Real Cost Measure in California 2021”. This was the 4th study conducted by United Ways of California to take a deeper look into what it what it takes households to meet basic needs in California. This study looked into the costs of housing, health care, childcare, transportation, and other basic needs, to reveal what it really costs to live in California [10].
Specifically, the Real Cost Measure for the Inland Empire 2021 found that 383,098 (or 34%) of all households fall below the Real Cost Measure. In addition, African Americans and Latinos have a disproportionate number of households with incomes below the standard as 222,397 of the 383,098 are Latino. This economic burden grows even further when analyzing families with children, as 59% of households with children under six, struggle. This number expands to 70% when looking specifically at single mothers. A key contributor to our region’s problems in meeting the “Real Costs” is the cost of housing as 37% of all households spend more than 30% of their income on housing.
Racism is a Public Health Crisis
Before jumping into population health data in the Inland Empire, it’s important to note that both San Bernardino and Riverside County have declared racism to be a public health crisis that results in health, economic, educational, public safety, criminal justice, and housing disparities. On June 23, 2020, The San Bernardino County Board of Supervisors became the first county in California to make the declaration and was soon followed by Riverside County in August of 2020. This declaration helped
19
Figure 6: Real Cost Measures for Households in the Inland Empire [11]
form the Equity Element Group of the Countywide Vision project to promote and increase equity in San Bernardino County by convening community members and experts in healthcare, education, economic development, law/justice and other fields to increase equity within the county.
The issue of racism as a public health crisis came to the forefront following the global response to the 2020 killing of George Floyd. San Bernardino County highlighted local statistics showing that:
• Infant mortality rates within San Bernardino County’s Black population are more than double the rate for the County as a whole.
• Black people account for less than 9% of the County’s population, but almost 19% of County jail bookings and 38% of County Juvenile detention bookings.
• More than 21% of the County’s homeless population is Black.
• Black homeownership is less than 43% in San Bernardino County compared to 60% average for the County;
• Only 17% of Black students in San Bernardino County are proficient at math compared to 31% of all students and less than 35% are proficient in English/Language Arts compared to almost 45% of all students.
• College and career readiness rate is 30% for Black students compared to 44% for all students and suspension/expulsion rates are more than double.
Each of these glaring statistics have been recognized and are being addressed by the County’s declaration of Racism as a Public Health Crisis and by the active involvement of the Equity Element Group [12].
In Riverside County, the Board of Supervisors made this same declaration on a 5-0 vote. This declaration publicly affirmed that systemic racism causes persistent racial discrimination in housing, education, employment, transportation and criminal justice. Planned actions for this resolution include:
• Agreement to seek more diversity in the county’s workforce and in leadership positions
• Implementing solutions to eliminate systemic inequality in all external services provided to the county
• Enhance public education to increase understanding and awareness of systemic inequality and its impact [13].
It alwayscomesdowntoracism. There was a black womanwithMultipleSclerosis whowasn't beinglistenedto.One[clinic staff member]thought shewasbeingrude just becauseofthewayshetalks,sotheybouncedheroff to anotherclinic.They kept bouncingheraroundtoclinics. There was no one that would take her because [staff]werejust lookingat herprevious medicalnoteswithout actuallyseeingand meetingher. Shewasn't gettingwhat sheneededandwewerehavingtolook everywheretofindaspecialist who wouldn't onlylook at herpreviousnotes.So, racismalways,youknow?

– Community Member


20
Exploring Population Health in the Inland Empire
Length and Quality of Life
Life expectancy in comparison to national and state averages is slightly lower for Riverside County but San Bernardino County has an average of 77.6 years, 3.4 years lower than California. Both Riverside and San Bernardino County 6,400 and 7,700, respectively, have higher premature deaths than California [5]
Quality of Life
When it comes to overall health, San Bernardino County is among the least healthy counties in California (Lowest 0%-25%). An estimated 24% of San Bernardino County and 22% of Riverside County residents experience fair or poor overall health, compared with 18% of California. Adult obesity (33%, 33%) and physical inactivity (30%, 26%) are likely some of the contributors to poor health experienced by San Bernardino and Riverside Counties residents, respectively.
Poor mental health days are much higher in Riverside and San Bernardino Counties than observed for the state. The average number of unhealthy mental health days in the last 30 days is 4.3 and 4.2 for San Bernardino and Riverside Counties, respectively and 3.9 for the State. It is likely these numbers will increase across the board as the pandemic waves continue [14, 15]
21
Length of Life, 2022 Riverside County San Bernardino County State of California COVID-19 Age Adjusted Mortality (# of deaths occurring per 100,000 population) 93 132 69 Life Expectancy 80.0 77.6 81.0 Premature age adjusted mortality 330 390 290 Premature Death 6,400 7,700 5,700 Child Mortality 30 50 40 Infant Mortality 4 4 4
Table 2: Length of Life Measures for Riverside County, San Bernardino County and California
Leading Causes of Death
The top 5 leading cause of deaths for those under the age of 75 in both Riverside and San Bernardino counties are: malignant neoplasms, heart disease, accidents, COVID-19 deaths, and diabetes.
Leading causes of death among children are distinct and important to understand in order to identify strategies that will improve life expectancy of this population. According to the CDC, the most common cause of death for youth by age group in the US is as follows [17]:
22
Quality of Life, 2022 Riverside County San Bernardino County State of California Poor of fair health 22% 24% 18% Poor physical health days 4.1 4.2 3.7 Poor mental health days 4.2 4.3 3.9 Low birth weight 7% 8% 7%
Table 3: Quality of Life Measures for Riverside County, San Bernardino County and California
Riverside County San Bernardino County Leading Causes of Death under Age 75 Deaths Age-Adjusted Rate per 100,000 Deaths Age-Adjusted Rate per 100,000 Malignant neoplasms 6,236 74.7 5,720 83.5 Diseases of the heart 5,240 62.3 4,443 65.2 Accidents 2,904 40.8 2,484 39.2 COVID-19 1,440 17.7 1,637 24.5 Chronic lower respiratory diseases 1,074 12.3 1,372 20.1
Table 4: Leading Causes of Death under age 75 in Riverside and San Bernardino Counties [16]
Age Breakdown 1st 2nd 3rd 0-1 year Developmental and genetic conditions that were present at birth Conditions due to premature birth (short gestation) Health problems of the mother during pregnancy 1-4 years Accidents (unintentional injuries) Congenital abnormalities Homicide 5-9 years Accidents (unintentional injuries) Malignant neoplasms Congenital abnormalities 10-14 years: Unintentional injuries Suicide Malignant neoplasms 15-24 years Unintentional injuries Suicide Homicide
Table 5: Leading Cause of Death by Age Group Ranking in the US
Similar to national trends, the leading cause of death in California for most age groups from 2014-2016 is unintentional injuries, with the highest rater per 100,00 being among ages 15-19 and 20-24, 13.1 and 26.8, respectively. For Ages 5-14 cancer was the leading cause of death followed by unintentional injuries [18]. For San Bernardino County, children under 5 have similar causes of death to what is reported in the national rankings.
Age Breakdown 1st
Under age 1
Congenital defect/chromosomal abnormalities
2nd
Prematurity/low birth weight
1-4 years Accidents (unintentional injuries) Congenital defect/chromosomal abnormalities
Maternal and Infant Health
3rd
Maternal pregnancy complications affecting newborn
Signs/Symptoms and abnormal clinical findings
Disparities among people of color have been a long-standing issue in the US despite medical advancements; this also extends to maternal and infant health. In 2017, an issue brief by the Common Wealth Foundation reported that world-wide maternal mortality rates were declining except for the US, which was one of only two countries to report a significant increase in its maternal mortality ratio [19]. There continues to be an increase in maternal mortality rates even in 2019 and 2020, 23.8 deaths per 100,000 live births compared with a rate of 20.1 deaths per 100,000 live births in 2019. Mortality rates are higher among women of color, especially non-Hispanic Black women who were 2.9 times likely to die compared to non-Hispanic White women [20]. US hospitals have put great effort in addressing this issue and have experienced declines in maternal mortality but more needs to be done within a community setting as more women died at home from pregnancy related deaths [21]
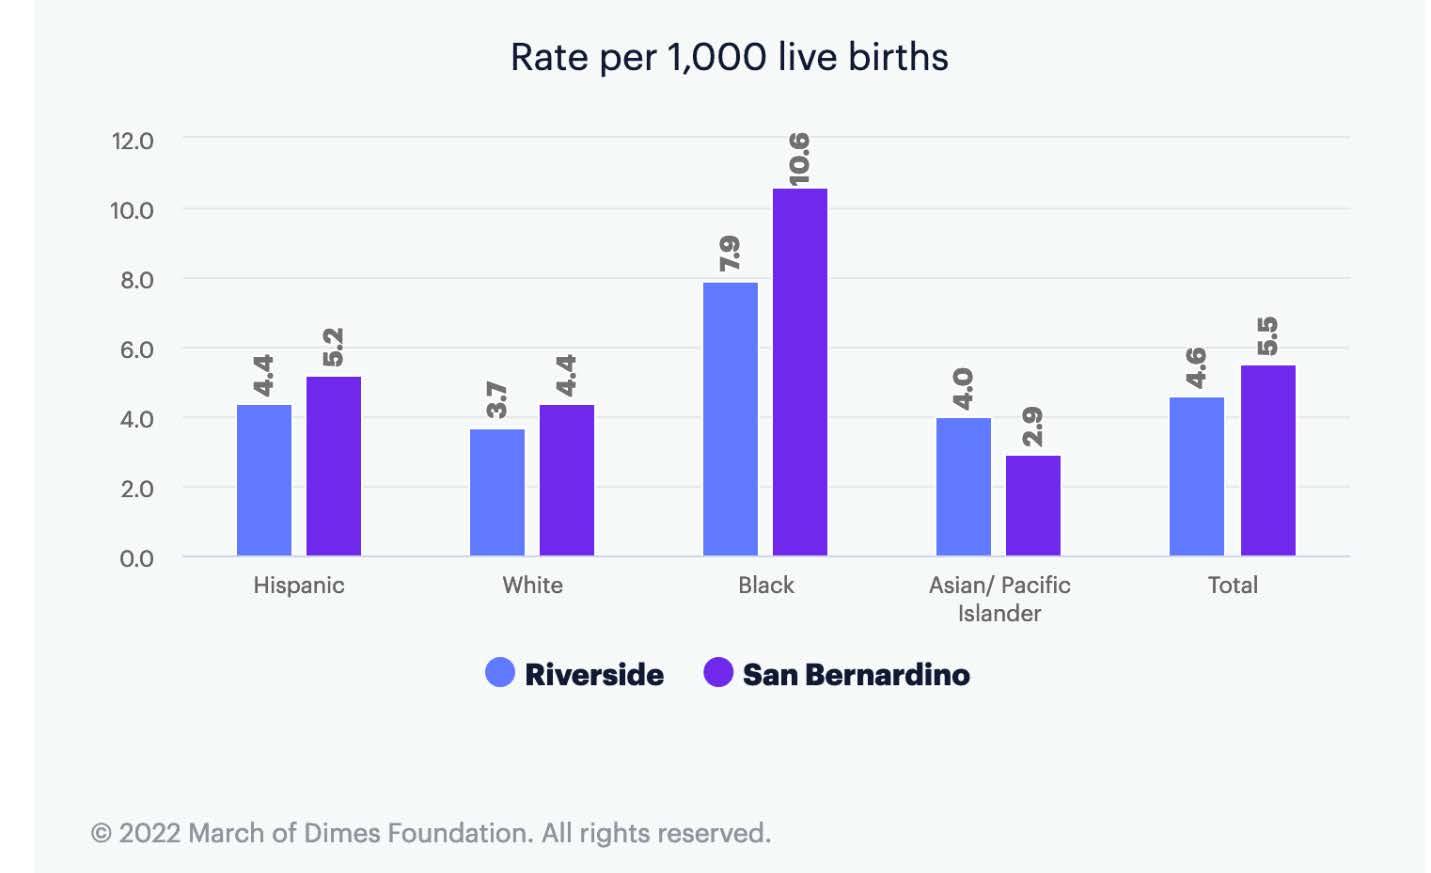
The infant mortality rates in the US is 5.6 deaths per 1,000 live births [22] In comparison to the national average, California’s rates are lower at 3.69 deaths per 1,000 live births [23]. While the State is doing better in improving infant mortality rates overall, both San Bernardino and Riverside Counties report higher rates than the state [24]. San Bernardino county has an infant mortality rate of 5.5 per 1,000 live births, while Riverside County has an infant mortality rate of 4.8 per 1,000 live births [24]
Significant disparities continue to exist in both counties especially among Blacks and Hispanics. In San Bernardino and Riverside counties, Blacks experience higher infant mortality rates, 10.6 and 7.9, respectively followed by Hispanics, 5.2 and 4.4, respectively in comparison to other races such as Whites, 4.4 and 3.7, respectively and Asian/Pacific Islanders, 2.9 and 4.0, respectively [25]
23
Table 6: Leading Cause of Death by Age Group Rankings in San Bernardino County
According to data reported by the March of Dimes, in 2020 [26], 1 in 10 babies (9.7% of live births) was born preterm in San Bernardino, a rate which is greater than that of the state of California 8.8%. There are significant racial and ethnic disparities in regards to pre-term births in San Bernardino County as the rate is highest for American Indian/Alaska Native infants (17.2%), followed by Blacks (13.1%), Hispanics (9.5%), Whites (9.1%) and Asian/Pacific Islanders (8.7%).
Prenatal care has been shown to be critically important in reducing adverse birth outcomes. However, for San Bernardino County, pregnant women may not be obtaining or are obtaining late prenatal care. In San Bernardino County, 68.3% of live births were to women receiving adequate/adequate plus prenatal care, 20.5% were to women receiving intermediate care, and 11.2% were to women receiving inadequate care. In 2020, about 1 in 9 infants (11.2% of live births) were born to a woman receiving inadequate prenatal care in San Bernardino, compared with a lowered rate of 9.6% at the state level [27]
Access to Clinical Care
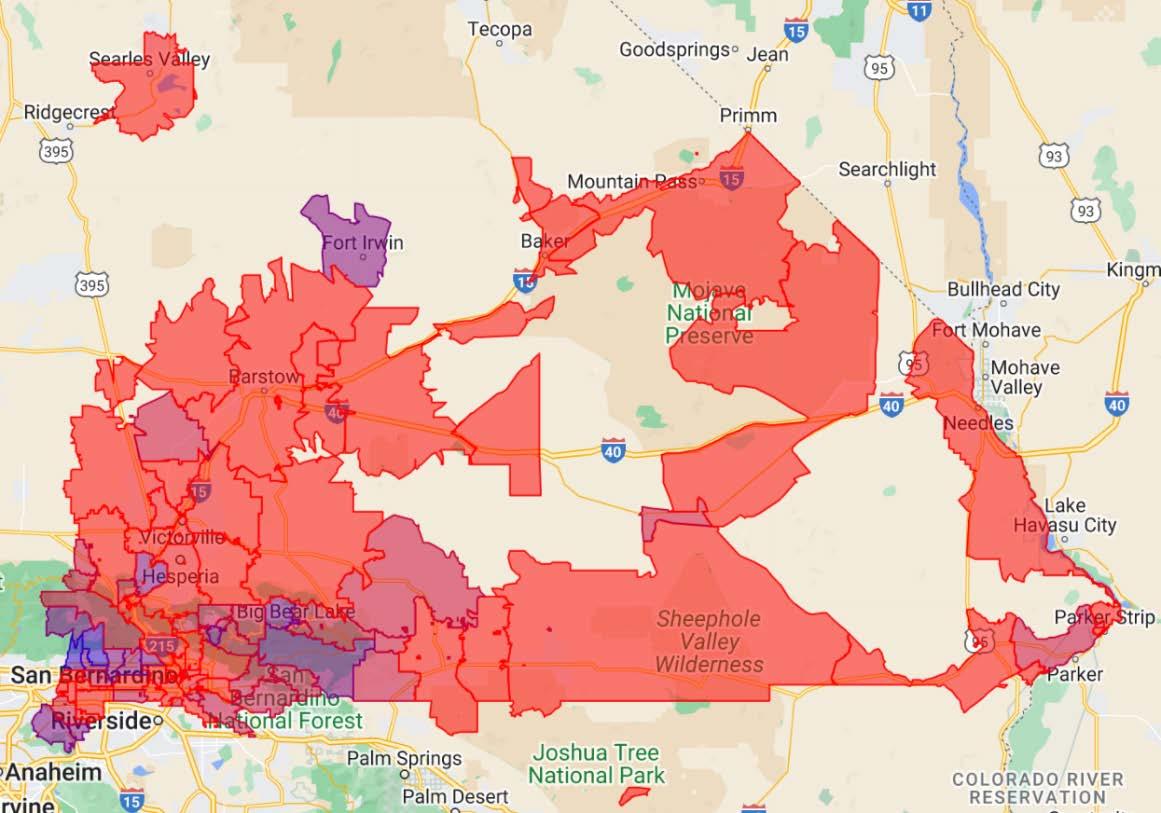
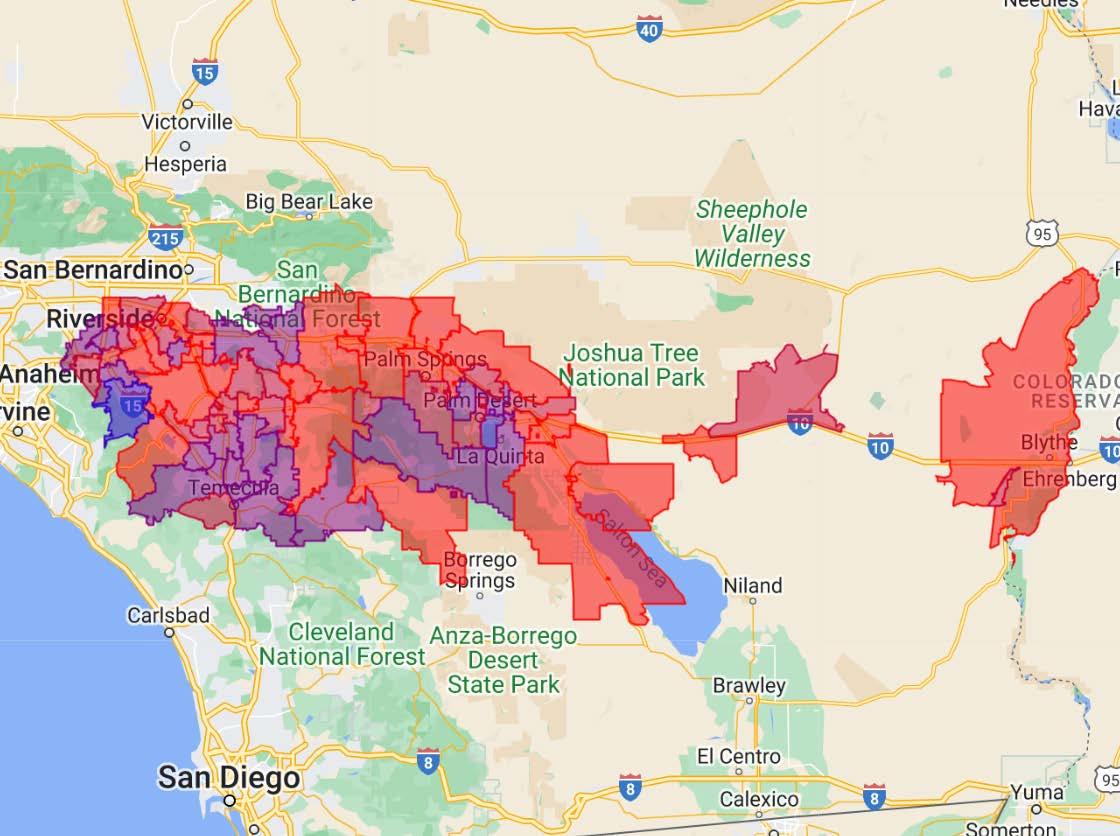
Community Need Index
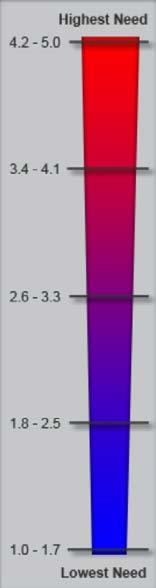
Community Need Index (CNI) is based on demographic and economic statistics, the CNI provides a score for every populated ZIP code in the United States on a scale of 1.0 to 5.0. A score of 1.0 indicates a ZIP code with the least need, while a score of 5.0 represents a ZIP code with the most need compared to the US national average (score of 3.0). The CNI is strongly linked to variations in community
24
Figure 7: Infant Mortality rates by race/ethnicity: Riverside and San Bernardino, 2017-2019
healthcare needs and is a good indicator of a community’s demand for a range of healthcare services. In both Riverside and San Bernardino counties, there is a high need for healthcare services [28]

25
Figure 8: Community Need Index for San Bernardino County
Figure 9: Community Need Index for Riverside County
The Uninsured
The uninsured rate in the Inland Empire has dropped dramatically over the past decade thanks to the expansion of Medi-Cal and other health coverage provisions created by the Affordable Care Act. More than 12% of the Inland Empire’s population have gained health coverage since 2010, when 21.6% of residents were uninsured. Still, approximately 10% of San Bernardino and Riverside Counties remain uninsured, compared with 9% uninsured for the state [5]. Moreover, the region has seen a concerning uptick in the uninsured rate in recent years According to San Bernardino County 2019 data on community health indicators, 9.1% of San Bernardino County residents were uninsured, an increase from 2018 when 8.7% of residents were uninsured [29]. At 12.1%, Latino residents are the racial or ethnic group most likely to be uninsured. This is followed by Asian residents (7.1%). Only 3.4% of Native American residents in San Bernardino County are uninsured.
It is not yet clear how the COVID-19 pandemic has impacted the uninsured rate. On the one hand, some residents experiencing job losses have lost employer-sponsored coverage. On the other hand, the federal Public Health Emergency order has protected many Medi-Cal beneficiaries from disenrollment during the past few years. When the Public Health Emergency expires, thousands of Medi-Cal beneficiaries could be at risk of losing coverage if they do not complete the Medi-Cal redetermination paperwork required for continued coverage. During the pandemic, many residents moved homes. The Counties may not have up-to-date contact information for these clients to inform them of the need to renew their Medi-Cal.
Healthcare Workforce Shortages
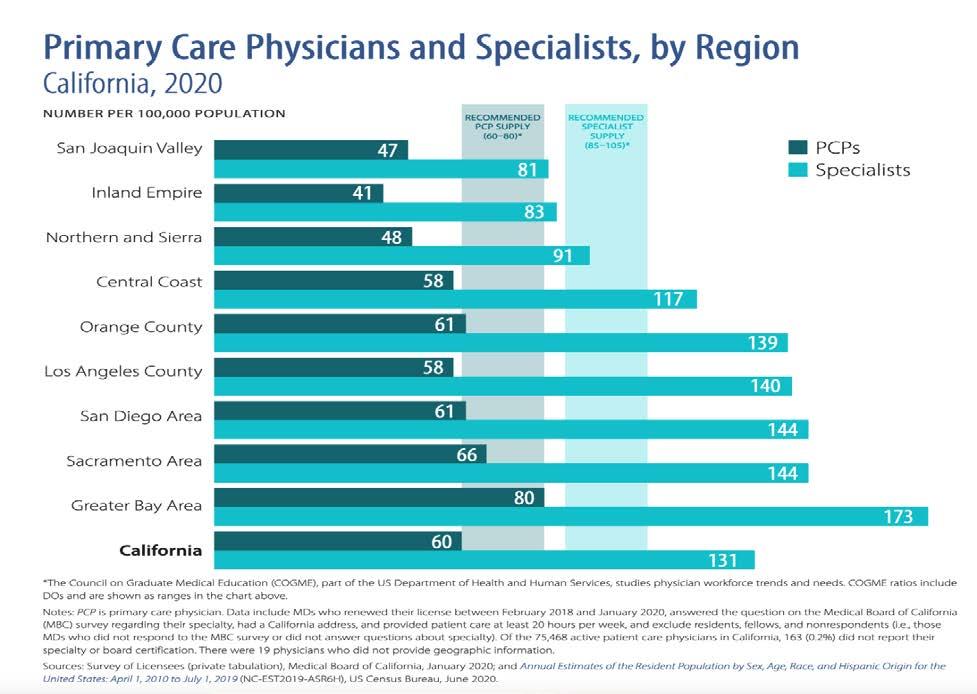
The three-year trends of the healthcare workforce ratios indicate there remains a shortage of both primary care and mental health providers in comparison to the US and California. According to the 2022 County Health Rankings data, San Bernardino County has an estimated 1,700 patients for each primary care provider and Riverside even fewer physicians with 2,270 patients per provider compared to 1,240 patients per provider for the overall state of California [5]. The Inland Empire has the greatest shortage of primary care physicians and second-largest shortage of specialty physicians compared with other regions in California [30]
26
The data indicate there are 380 patients per mental health provider for San Bernardino County, 420 in Riverside County and 240 per mental health provider at the state level. For dentist in the regions, 1,360 and 1,870 patients per dentist for San Bernardino and Riverside Counties respectively are fewer dentists than observed at the state level of 1,130 patients per dentist.
Wedon't haveenoughhealth providers.Forexample,in mentalhealth,findingoneis reallychallenging.

- CommunityMember


One thing that is not readily apparent is that the distribution of the providers is not uniform. According to California Healthcare Foundation, an estimated 1,368,178 people in Riverside and San Bernardino Counties live in an area that has a shortage of primary care providers (including physicians, nurse practitioners, physician assistants, and certified nurse midwives) [31] People living in less populated areas experience the health provider shortage more acutely.
27
Figure 10: Primary Care Physicians and Specialists by Region
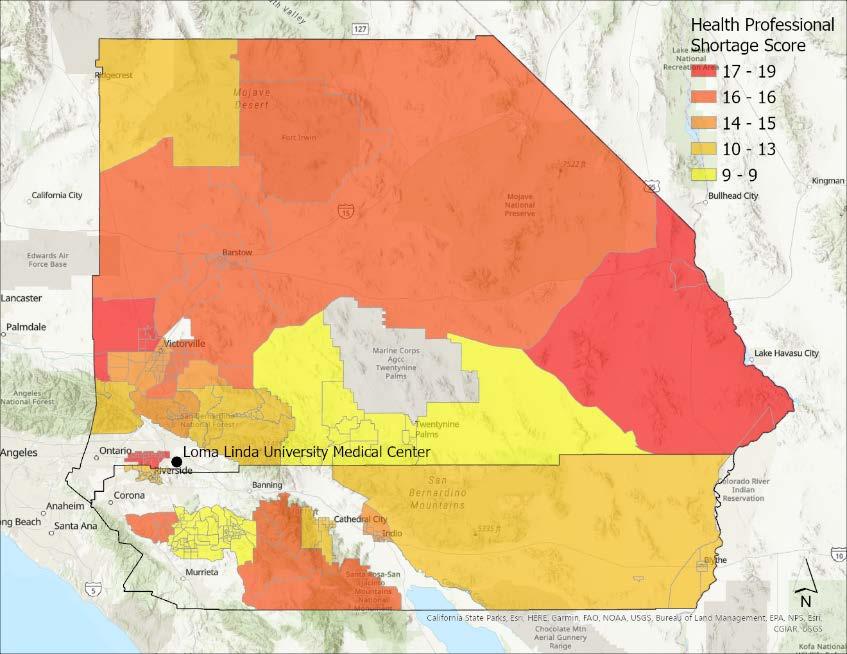
Areas with higher scores have a greater shortage of primary, dental or mental health care providers.
It is also quite possible that the pandemic may have caused some of the providers to retire, quit or are on the verge of burnout. The next few years will be important in determining how many providers remain in practice and are able to care for communities. Some of the areas hit hardest by the pandemic, may be most at risk for provider retirement or burnout as physicians and health care providers recover from the trauma of the pandemic.
Mental Health Crisis
The COVID-19 pandemic has dramatically exacerbated the mental health crisis across the United States. Loneliness and isolation, coupled with economic challenges such as financial hardship, housing and food insecurity, have contributed to huge increases in anxiety and depression. In one study conducted by Mental Health America, researchers identified a 62% increase in people screening positive for depression in 2020 compared with 2019 [32].
28
Figure 11: Map of Health Professional Shortage Areas.
The effects of the COVID-19 pandemic on mental health have not been felt evenly across populations. Youth, especially those who identify as LGBTQ+, reported high rates of suicidal ideation. Black, indigenous, and people of color have been disproportionately impacted. Black or African Americans had the highest average increase over time for both anxiety and depression. Native Americans reported the highest average increase for suicidal ideation [32].
During the first year and a half of the pandemic, an estimated 140,000 children living in the United States lost a primary caregiver from the COVID-19 related illness. Sixty-five percent were children of racial and ethnic minorities [33]. The loss of a parent/caregiver has significant implications as it relates to adverse childhood experiences (ACEs). Mental health problems, lower self-esteem, an increased risk of substance abuse, suicide, and violence have been linked to ACEs.
Suicide
Suicide is one of the top 9 leading causes of death in the United States for both adults and adolescents, ages 10-64; however it is the second leading cause of death for ages 10-14 and 25-34 [34]. Moreover, national studies indicate that suicidal ideation has continues to increase among adults in the U.S. 4.58% of adults report having serious thoughts of suicide [35]
We'relosingtoomanyteensto tragicself-harm. I can't even use the word suicide when I talk about children.
- KeyInformant
Opioid overdose

With respect to race and ethnicity, non-Hispanic American Indian/Alaska Native and non-Hispanic White populations are at highest risk. While suicide rates increased by 30% between 2000-2018, there was a slight decline in 2019 and 2020 with a total of 45,979 deaths in 2020. It is hard to tell if these numbers have gone up since the pandemic. Nonetheless, prevention efforts using a comprehensive public health approach is been advanced by the CDC that can be applied on entire populations regardless of risk. The Healthy People 2030 national health target is to reduce the suicide rate to 12.8 deaths per 100,000 population [36].


In 2020, San Bernardino County experienced 12.9% Opioid overdoses (13.5% for California statewide), which accounted for 28.7% ED visits [37]. From 2020-2021, Riverside County experienced an increase in ED visits especially among those ages 15-44. In addition, there was a 42% increase in opioid, fentanyl related overdoses [38] The CDC indicates opioid overdose across the nation has increased 28.5% in just over one year (2020-21) [39]. Clearly, the nation’s drug overdose epidemic has worsened and may be further driven by the COVID-19 pandemic. The Opioid epidemic now appears to be predominantly driven by illicit fentanyl, fentanyl analogs, methamphetamine, and cocaine. Alarmingly, the recent deaths associated with fentanyl laced drugs include children.
Social and Economic Factors
According to the County Health Rankings Framework, the social and economic environment (I.e., income, education, employment, social support) provides important implications for how long we live
29
as it can impact the ability to make healthy choices as well as access healthcare services [40]. In assessing these rankings and creating strategies to improve the outcome, research has shown this can have a greater impact on health over time.
Poverty
Poverty is one of the greatest threats to health. Poverty impacts health at all stages of life and influences not only quality of life, but life expectancy [41]. Published results from Data USA indicated that an estimated 16% of the population (334k out of 2.09M people) in San Bernardino County and 13.7% in Riverside County live below the poverty line, a number that is higher than the national average of 12.3%. The largest demographic group living in poverty is females ages 25-34 years, followed by females 35-44 years of age for both Riverside and San Bernardino Counties. Both of these groups may likely have young families they are caring for in their homes, making the impact not only for the females, but also for the households which they care for. The most common racial/ethnic group living below the poverty line is Hispanics followed by whites for both counties. According to government census data, medium household income is highest for State of California ($78,672) and lower for both Riverside ($70,732) and San Bernardino Counties ($65,761) [42].
Indicative of the overall poverty faced by San Bernardino County is the proportion of the population eligible for free school meals based on household income and family size. A total of 67.2% of students are eligible or enrolled for free or reduced meals at school, compared with 57.8% of students statewide in California, indicating potential need for additional food security measures within San Bernardino County. Within San Bernardino County Unified School District, many schools have more than 90% of their students eligible for free or reduced school meals. Clearly, there is a financial need for securing food for families during the pandemic and likely beyond [43]
Access to livable wage jobs and predictable hours is by far one of the most important socioeconomic factors for people living in the two-county region, especially those in San Bernardino County. The socioeconomic status of the region’s people provides an important context to the social determinants of health identified by community health assessments, as poverty remains one of the root cause factors for people in both counties [44].
30


Research examining the COVID-19 pandemic’s impact on poverty reveals important differences between urban and rural regions [45]. Notably, researchers discovered that the effects of COVID-19 on rural populations have been more severe, with significant negative impacts on unemployment, overall life satisfaction, mental health, and economic outlook. With San Bernardino County being the largest land wise county in the US, the county has considerable rural regions and concern for the long-term impact of COVID-19 on poverty and health recovery, especially among rural regions.
As the pandemic continues into the third year, the full impact on poverty may not be felt for years to come. Poverty data typically comes from household surveys, which many who are struggling with necessities and stable housing will not be able to participate in. Thus, there may already be an undercounting of the number of individuals who have fallen into poverty.
Housing
I think it comes back to access to affordableplacesto live and to opportunitiestohaveajobthat sustainslifeandthatpaysahigh enoughwage.
- KeyInformant


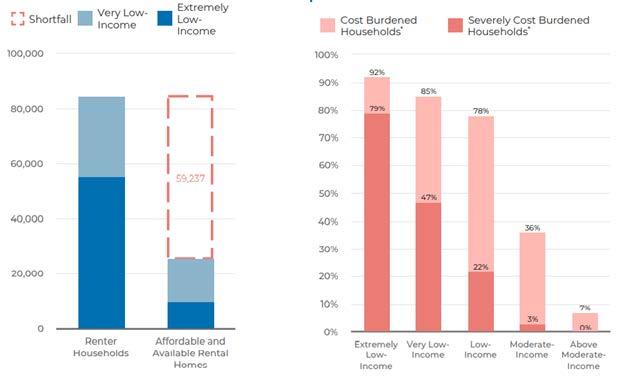
A basic necessity for a healthy life is access to an affordable and safe place to live. Unfortunately, a total of 59,237 low-income renter households in San Bernardino County do not have access to an affordable home. Low-Income Housing Tax Credit production and preservation in the county decreased by 36% since 2016 while state production and preservation decreased 13%. Approximately 79% of extremely low-income households are spending more than half of their income on housing costs compared to just 3% of moderate-income households, clearly a model that is not sustainable.
According to the 2020 Census data, the number of housing units is 731,400 and percent of owner occupied is 60.1%, which is lower than the national average of 64.1%. The median housing rent is $1,338, with 14.3% of individuals living in poverty. The median property value in San Bernardino County was
31
Figure 12: Population Living in Poverty by Age
$369,900 in 2019, which is 1.54 times larger than the national average of $240,500. Between 2018 and 2019 the median property value increased from $353,400 to $369,900, a 4.67% increase [46]. Housing prices in the Inland Empire have consistently grown at a faster rate than in both the greater Los Angeles region and in California as a whole [2]
Renters need to earn 2.2 times the minimum wage to afford the average two-bedroom asking rent in San Bernardino County.
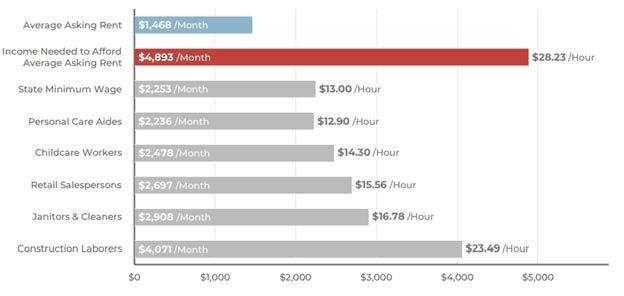
32
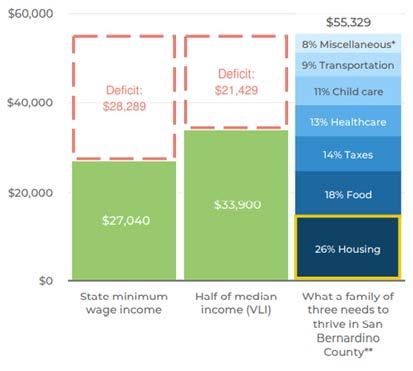
After paying the high cost of housing, very low-income households in San Bernardino County are short $21,429 annually for basic needs, which contributes to adverse health and equity outcomes [47].
Homelessness Data
Just prior to the outbreak of COVID-19, data from the U.S. Department of Housing and Urban Development’s (HUD) 2020 Annual Homeless Assessment Report (AHAR) to Congress (Part 1) found that 580,466 people nationwide were counted as homeless during the 2020 Point-in-Time count, representing a 2.2% increase over 2019. This marks the fourth consecutive annual increase in homelessness across the nation. These findings give an indication that homelessness was on the rise across the nation, and likely only further increased by the pandemic and thus may have implications for both Riverside and San Bernardino Counties [48].
According to San Bernardino County data, in 2020, San Bernardino County identified 3,125 homeless individuals, including 2,390 who were unsheltered, meaning they had slept the night before in a private or public place not designed as a regular sleeping accommodation, and 735 who were sheltered [49]. According to county data describing the homeless population, 29% were chronically homeless, and 20% had a mental health or substance abuse disorder. The pandemic has heightened the number of homeless. For children, the homeless data is even more concerning. Approximately 1-in-14 school age students had insecure housing. Without secure housing, the child may have even greater difficulty with food security, school attendance, and graduation to list a few potential negative impacts. In the 2019/20 school year, 30,270 San Bernardino County K-12 students were identified as homeless or lacking secure housing, representing 7.0% of total enrollment. Among homeless and housing insecure students, 91% were living doubled- or tripled-up in a home due to economic hardship, 4% lived in motels, 2% lived in shelters, and 2% lived unsheltered in cars, parks, or campgrounds.
33
and 2020
The states with the highest severe housing cost burden, or the percentage of households that spend 50% or more of their household income on housing payments, included California, New York, and Hawaii. For individuals in these situations, increased pressure on health and hunger services may have put even more pressure on their already-strapped budgets, perhaps even forcing some people into homelessness during this pandemic.
School-related Outcomes
Asthma is the leading chronic condition cause of school absenteeism. A growing body of scientific studies identified an association of exposure to transportation-related air pollution with increased respiratory symptoms, asthma related emergency room (ER) visits, and asthma-related hospitalizations [50-52]. Environmental exposures that not only hinder children’s health, but adversely impact academic achievement as well, in essence creates a “double jeopardy” situation for children, with the potential for lifelong adverse consequences.
School absenteeism is linked to poor academic performance [53] which likely leads to affected students who miss more days of school also scoring lower on standardized tests, pitting them at risk for disengaging in school and for drop out [54].
According to the California Department of Education, San Bernardino County exhibits a 76.1% graduation rate which is much lower than the overall state rate 86.8%. Poor school performance and subsequent drop-out, results in limited employment opportunities as an adult and inevitably reduces economic earning potential [55]. San Bernardino County experienced 21.3% chronic absenteeism compared with a 14.3% prevalence for the state of California for the 2020-21 school year, with African Americans experiencing some of the highest rates (33.7%) of absenteeism, followed by Pacific Islanders (29.0%), American Indians (25.8%), and Hispanics (22.5%) [43, 56-58].
34
Figure 13: Number of Sheltered, Unsheltered and Chronically Homeless by County, 2019 and 2020
687 735 766 729 1,920 2,390 2,045 2,155 703 681 804 519 0 500 1000 1500 2000 2500 3000 3500 4000 2019 2020 2019 2020 San Bernadino County Riverside County
Number of Sheltered, Unsheltered, and Chronically Homeless by County 2019
Childcare services
Additionally, finding childcare is a challenge for many families in San Bernardino County. A 2020 KidsData report, estimated that spaces were available for only 16.3% of children needing daycare [59]. The California Department of Education provides data on zip codes within each county where needs are unmet for childcare. For example, a priority 1 indicates a zip code that qualifies where there are 50% or more eligible children unserved and more than 1,500 eligible children unserved. A total of 26 zip codes within San Bernardino County were prioritized with level 1, indicating tremendous unmet need for childcare [60].
Physical Environment
Air Pollution Challenges
Oneofthethingsforeveryonetoreally stopandthink about are the effects of warehousegrowthinSanBernardino andtheInlandEmpire Thecongestion of traffic and added trailers in our communityandourareacontributesto airpollutionandalsogoesinhandwith environmental racism.
- CommunityMember

Once home to vast stretches of farmland and open space, the Inland Empire has seen a surge in commercial and light industrial development over the last twenty years. It is now a central hub and home to the largest concentration (over 20 million square feet) of warehousing and logistics spaces anywhere in the world and growing [61]. This explosive growth has resulted in a significant rise in truck traffic and an increase in diesel pollution, which has caused severe harm to the health of residents. In the Inland Valley, the prevailing winds transport air pollutants eastward from Los Angeles into communities. The air quality problem has become exacerbated, especially considering the development of major warehouses in the area.


Air pollution trapped by the mountains surrounding the inland region, coupled with the routinely stagnant air and temperature inversions, leads to high concentrations of pollutants. Thus, our region is regularly at or near the bottom of United States air quality rankings for ozone (O3) and fine particulate (PM2.5) air pollution in the United States according to the US Environmental Protection Agency (EPA) and the American Lung Association (ALA) [62, 63]. According to published EPA data for 2021, San Bernardino and Riverside counties were the top one and two counties respectively among all counties in California for the greatest number of unhealthy air quality days. The percentage of unhealthy air days rose from 14.7% in 2019 to 16.7% in 2021. Diesel and gas emissions – the main source of pollution warehouses attract – contain a large number of toxic chemicals such as nitrogen oxides, particulates, carbon monoxide, and benzene [64]. The growing air pollution will only worsen with climate change as temperatures heat up the pollutants making them more reactive and more toxic.
35
Climate models also predict increasing temperatures and sea level and an increase in the frequency and intensity of extreme weather events such as droughts and fires. These hazards and impacts are likely to have a disproportionate effect on lower-income communities of color. In our target community, extreme heat, wildfires, and air quality are climate hazards routinely faced. The region is also home to some of the most underserved, marginalized communities anywhere in the country. The communities with which we work tend to be overwhelmingly Latino, working poor, and immigrant. One glaring statistic from the Healthiest Communities Ranking by US News and World Report, is that San Bernardino County’s overall score was 49/100 a number driven in part by tremendous toxic exposures and poverty [6].
The Healthy Communities Report shows how nearly 3,000 U.S. counties and county equivalents perform in 84 metrics across 10 health and health-related categories. In addition, nearly 20,000 residents in San Bernardino County are children under the age of five and another 20,000 are over the age of 65, which are the populations most vulnerable to the impacts of climate change. Current health impacts experienced by our target communities are high rates of asthma among children as well as heart disease, respiratory illnesses, and cancers among the elderly. These types of adverse health conditions will significantly worsen without strategic interventions addressing climate change and promoting equitable community resilience [65].
Childhood Asthma
Asthma is a major challenge for children, especially those who live in areas with poor air quality such as San Bernardino and Riverside Counties Impacting approximately 7.1 million children nationally, asthma has become the third leading cause of hospitalization and one of the most common causes of emergency room visits [66]. The strength of this association is directly related to the increasing proximity to major roadways any [45, 50, 67, 68] In addition to exacerbating asthmatic symptoms and
36
Table 7: Physical Environment
Physical Environment Riverside and San Bernardino Counties 2022 Physical Environment, 2022 Riverside County San Bernardino County State of California Air pollution – particulate matter 14.3% 17.6 12.9 Drinking water violations Yes Yes Severe housing problems 25% 26% 26% Driving alone to work 78% 78% 72% Long commute – driving alone 47% 44% 42% Traffic volume 625 930 1,991 Homeownership 68% 60% 55% Severe housing cost burden 19% 18% 19% Broadband access 89% 87% 89%
Riverside and San Bernardino Counties 2022
increasing the demand for health care services, air pollutants have been identified as promoting the initial development of childhood asthma [69]. Riverside and San Bernardino Counties experience some of the highest asthma prevalence rates in all of California. According to 2018 Kidsdata report, both Riverside and San Bernardino Counties are among the top 15 California counties for children ever diagnosed with asthma [70]
San Bernardino County has a childhood asthma prevalence reported of 15%, though this statistic likely underreports the true prevalence given the environmental conditions faced and previous research conducted. Evidence is mounting on the adverse health effects in children related to proximity to roadways including low birth weight, premature births, delayed lung development and functional deficits, and asthma occurrence and exacerbations. In a research study conducted by Loma Linda University School of Public health, researchers found that a school near a major freight railyard had a 42% prevalence of asthma when combined with parents reporting asthma or screening at high risk for asthma [71]. Over 70% of those with parents reporting an asthma condition had signs/symptoms that asthma was not well managed. Clearly, local sources of major pollution (like freeways and railyards) as well as the background regional air pollution levels, make managing asthma a tremendous challenge.
COVID-19 Pandemic
The COVID-19 pandemic has been an ongoing public health crisis that has hit the Inland Empire region particularly hard. The pandemic affected every aspect of life and highlighted drastic inequities. As of June 17, 2022, there were a reported 595,157 diagnosed COVID-19 cases and 7,705 deaths in San Bernardino County as well as 627,334 diagnosed cases and 6,549 deaths in Riverside County [72, 73]. People of color are overrepresented in the more severe cases (hospitalized, ICU, ventilator), with alarming death rates among Latinos (51%). Since the rollout of vaccinations under Emergency Use Authorization (EUA) in December 2020, 1,164,176 eligible residents (57.8% of population) in San Bernardino County and 1,463,656 (59.1%) in Riverside County have received at least two doses of the COVID-19 vaccine Of those, 565,594 eligible residents in San Bernardino County have received at least one booster vaccination and 712,189 eligible Riverside County residents have received a booster Vaccination rates are not uniformly distributed, with lower income, BIPOC, and isolated populations being vaccinated at lower rates. Given the rapid emergence of new COVID-19 variants and the high rate of mortality among our diverse population, there is a critical need for a more strategic promotion of vaccination among the region’s vulnerable groups.
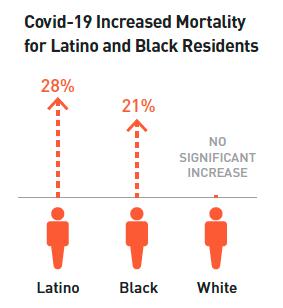
According to, A Portrait of California, 2021-2022 Regional Report Series: Spotlight on the Inland Empire, from January-August 2020 mortality rates were higher for Latino and Black residents than the 2015-2019 average, whereas white residents remained unchanged [2]. This indicates a significant racial disparity in COVID-19 mortality rates.
37
Within San Bernardino County, approximately 10.9% of the deaths due to COVID-19, were among adults ages 2045 years of age. Within this age group, there is a greater likelihood that they may have young children in the home. A study published in the Lancet journal (2021) by researchers in UK, indicates that the US is number 4 in the world for most orphaned children due to COVID-19, behind Mexico, India, and Brazil [74] And as data has shown throughout the pandemic, more men have died from the disease than women in nearly every country and this is true for San Bernardino County (59% of COVID-19 deaths were among males).
Based on what researchers have learned from the Ebola and HIV epidemics, orphaned children face high risks of short- and long-term negative effects on their health, safety, and well-being after losing caregivers. Potential consequences include poverty, mental health problems, sexual violence, teenage pregnancy and higher risks of suicide, heart disease, diabetes, cancer or stroke. The COVID-19 pandemic also drastically impacted access to public education, chronic absenteeism rates, and mental health outcomes for children as mentioned previously. Children may experience a significant number of these secondary COVID-19 impacts for years to come, therefore COVID-19 may be classified as an adverse childhood experience (ACE).
Additionally, COVID-19 may have a tremendous impact on parents struggling throughout the pandemic. Among the groups hit the hardest by the pandemic are families, especially those with young children. A recent article in People Magazine “Heart Palpitations, Eczema, Judgement: Parents Speak Out on Exhausting Toll of COVID Stress”, describes what parents are feeling across the nation and including here in San Bernardino County [75]. The numbers are even more pronounced for parents of children aged 4 and younger, with 54% saying daily decision making was causing greater anxiety than pre-COVID [76]. Parents with fewer resources and lower incomes feel these burdens most acutely. Compared to parents with higher incomes, they are more likely to live in cramped housing, lack access to broadband and computers, and not have the opportunity to work from home. These conditions have put an extreme burden on low-income families and additional stress during an already difficult time.
There were several measures implemented at the state and county level to combat the COVID-19 pandemic in a manner that was culturally competent and responded to community needs. California’s COVID-19 policies have focused on prioritizing vulnerable populations by identifying communities most impacted and directing resources to where they are needed most. This has been implemented via access to testing and vaccinations, supplemental sick leave, publishing health equity data, and expanded pandemic unemployment assistance benefits. At the county level, there has also been a focus on health equity and ensuring that communities have access to vaccines no matter their legal or documentation status. These strategies made a significant impact in the response to COVID-19 in the Inland Empire and put the region ahead of many other counties across the country.
38
Regional Collaborations
LLUH actively participates on stakeholder committees for two large regional strategic health assessment and planning groups for the region: the Regional Community Health Assessment (Inland Empire) and Community Vital Signs (San Bernardino County). These collaborations seek to identify and prioritize health challenges in the community and build consensus across organizations for strategies and solutions that can achieve results. The ultimate goal is to align community initiatives, for greater collective impact.
Each of these collaborations apply an equity lens and actively engage community members in their approach. They conduct key informant interviews and community listening sessions to better understand the community’s perspective on their health needs and the inequities rooted in our social systems and structure.
The priority focus areas and strategies summarized for each of these collaborations are summarized in the sections below. By including regional community health assessment findings in this report, LLUH seeks to strengthen alignment between LLUH’s forthcoming FY 2023-2025 Community Health Implementation Strategy and the existing community-wide plans. LLUH aims to draw upon our institution’s unique strengths to contribute to regional goals.
Regional Community Health Needs Assessment
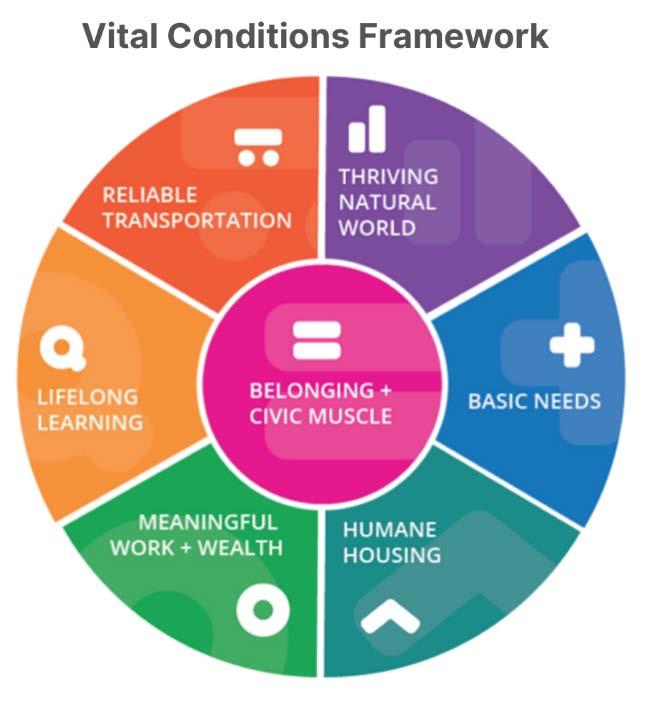
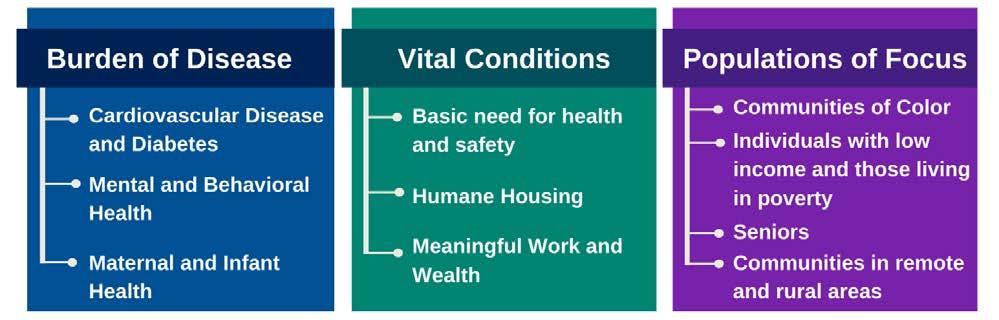
A broad coalition of local hospitals, community-based organizations, health plans, and technical assistance consulting organizations form the Regional Community Health Assessment team to address health challenges in the Inland Empire. This regional community health assessment utilizes the Burden of Disease and Vital Conditions frameworks to guide its approach [77]. This 2022 assessment utilizes burden of disease data vital conditions data and hospital utilization data along with information gathered through key informant interviews and facilitated listening sessions with community residents.
Themes emerging from during community listening sessions conducted during Spring of 2022 include [78]:
• Poor mental health (especially depression & anxiety)
• Poor Air quality
• Lack of Affordable housing
• The need for more green spaces
• Cancer and poor access/mountains
• The need to involve community/CBO's in solutions
39
Themes emerging from key informant interviews include [78]:
• Mental health - depression and anxiety
• Substance abuse
• Education - learning loss in basic math
• Financial strain - job and income loss
• Unemployment and lack of training
• Delays in preventive care services
• Digital divide and technology gaps exposed
• Housing instability and homelessness
• Safety and violence
• Convenient access to healthcare
• Lack of prenatal care in rural and remote areas
• Infant mortality, especially African American
To determine the top priorities, this regional assessment examined the severity of each health need, whether there was capacity and resources to improve it, inequities across populations, potential investment opportunities to address the needs, and the impact of COVID-19 on each focus area.
As a result, the regional collaborative selected the following top priorities and population focus areas:
40
Community Vital Signs
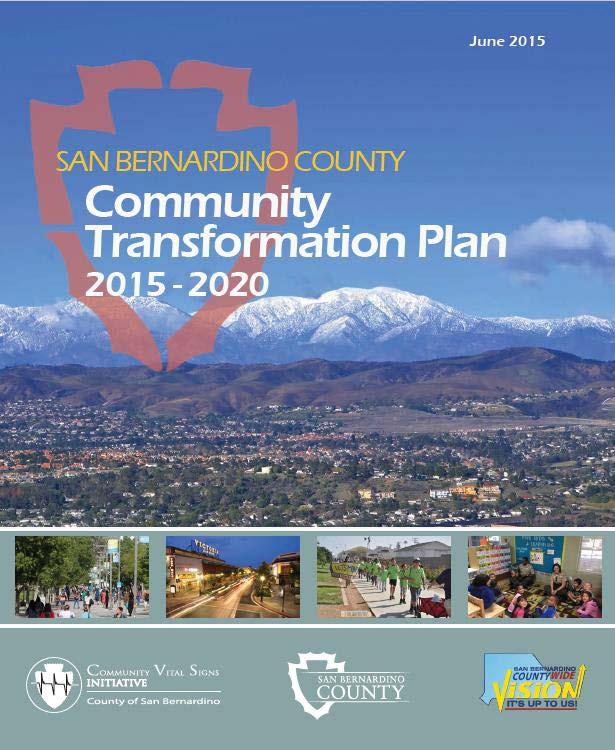
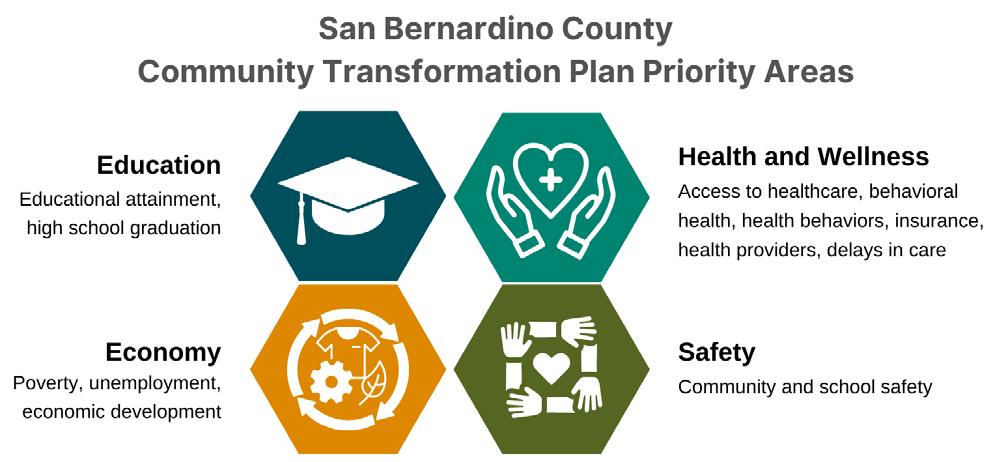
Community Vital Signs is a community health improvement framework jointly developed by San Bernardino County residents, public and private sector organizations, and government. It builds upon the Countywide Vision by setting evidence-based goals and priorities for action that encompass policy, education, environment, and systems change in addition to quality, affordable, and accessible health care and prevention services. It provides the basis for aligning and leveraging resources and efforts by diverse agencies, organizations, and institutions to empower the community to make healthy choices.
One of the greatest assets in the region is the county-wide vision in implementation in San Bernardino County and the unified effort to align priorities based on four major priority areas. Cross-sector partners continue to work towards goals set in the 2015-2020 Community Transformation Plan to improve health and the social issues that impact health.
41
The LLUH Service Area
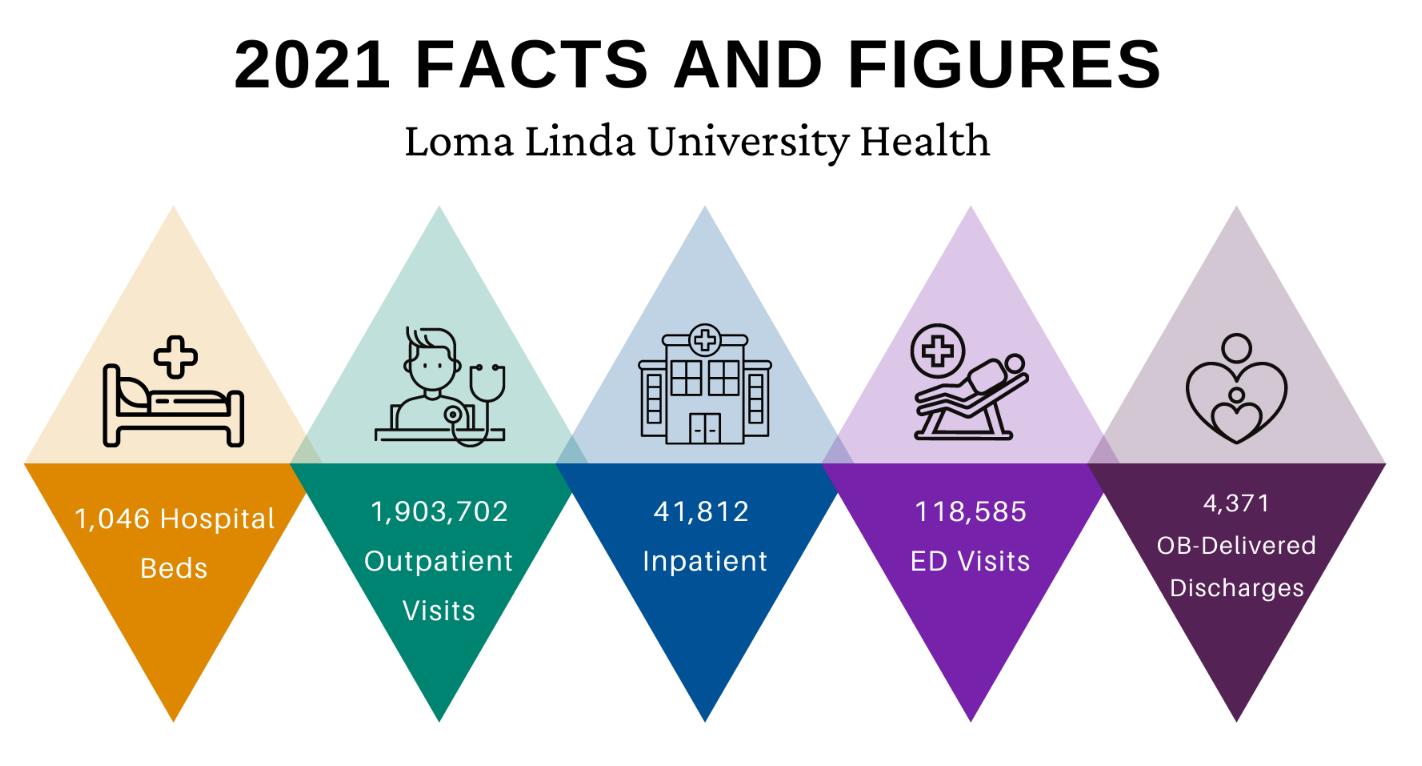
LLUH Health System
Loma Linda University Health System is a 1,046 hospital beds system and is one of the largest employers in the region, an important factor given the challenges of poverty, especially in San Bernardino. As an academic health center provider, LLUH offers primary and specialty care services and programs that are the safety-net for the people in our region. Without LLUH in the community, patients would need to travel great distances for access to the most advanced continuum of health care services, creating a major gap in community-based interventions, programs, and unique community engagement activities. LLUH invests in the community outside the traditional walls of our health care facilities. It is these programs and community engagement activities that extend access to the marginalized members of our community and how LLUH is able to address the root causes of illness. Consistent with our Christian mission of continuing the teaching and healing ministry of Jesus Christ, the LLUH health care system is honored to be an important part of the lives of people in our community, whether it is through community health investments, education and training, or direct health care.
The four non-profit hospitals in the LLUH System are:
1. Loma Linda University Medical Center (LLUMC) which includes two additional campuses: Loma Linda University Medical Center East Campus (LLUMCEC), and Loma Linda University Surgical Hospital (LLUSH),
2. Loma Linda University Children’s Hospital (LLUCH),
3. Loma Linda University Behavioral Medicine Center (LLUBMC),
4. Loma Linda University Medical Center – Murrieta (LLUMC – M).
42
The LLUH system serves a large number of people who qualify for means-tested programs like MediCal and it is core to our Christ-centered mission to serve those living near or at the poverty level, as we increase access to the full continuum of care for the most vulnerable children, families, adults, and seniors in our region with the greatest unmet health needs. People from marginalized communities or those living in difficult socioeconomic conditions account for almost 1 in every 3 patients seen at LLUH, based on patient Medi-Cal status. Loma Linda University Children’s Hospital is the Inland Empire’s only dedicated children’s hospital – caring for more than 800 NICU babies each year and providing high-risk pregnancy care. We are in a unique position to have an outsized impact in regional efforts related to maternal and infant health. As an academic health center, LLUH has the ability to go beyond serving the marginalized, and address the root causes of poverty and disease through education and training, and workforce development: it is this ability that sets LLUH apart from other hospitals. As a leader in patient care we are not only investing in a comprehensive network of care, we are dedicated to offering state-of-the-art care for the most vulnerable while working with community partners to move the needle on health in our region.
43
SAC Health System
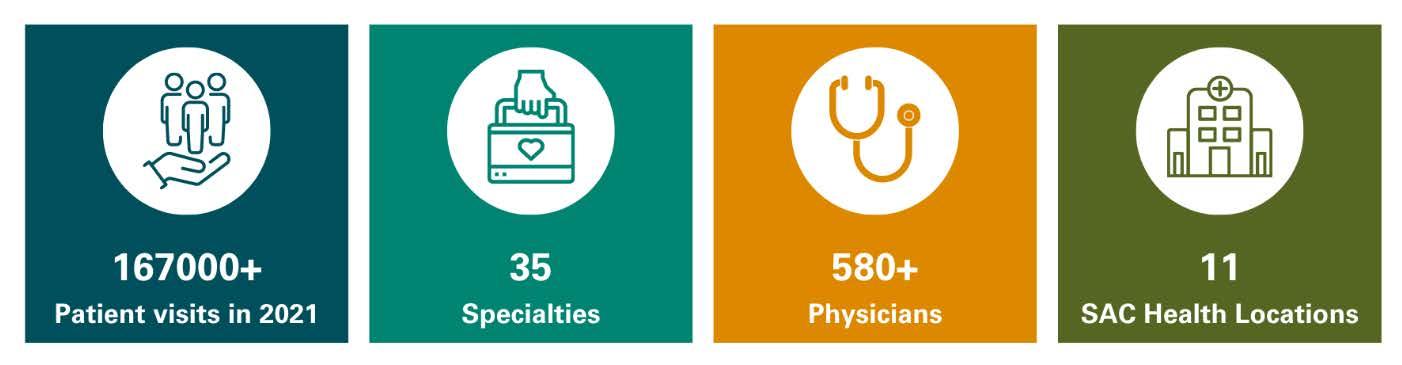
The SAC Health System is the largest federally qualified health center (FQHC) providers of primary and specialty outpatient care in our region with over 167,000 patient visits in 2021 across 11 locations The primary and secondary service regions show critical access to care from patients that come from a broad distribution of the two-county region, as SAC serves patients primarily in the East and West Valley regions of San Bernardino and the High Desert, with their secondary service region reaching patients as far as Coachella Valley (Indio Clinic) to the California State line.
SACHS is the FQHC with the most specialty services of any FQHC in the country as a patient-centered medical home for many of the residents living in vulnerable communities. The SAC Health System is recognized as a Level-3 Patient-Centered Medical Home by the National Committee for Quality Assurance (NCQA). All our physicians are affiliated with Loma Linda University Health, allowing our patients to receive world-class care from providers trained in over 35 different specialties. Consistent with its mission and values, the SAC Health System provides over 900 medical residents and students from Loma Linda University a unique opportunity to serve our most vulnerable population which allows them to continue to be leaders in our community.
As an LLUH partner in the care of the medically underserved and at-risk populations in our region, the SACHS population health data is an important data set for the evaluation of population health trends due to the degree of overlap of patients seen by both health care systems. The aggregate, public population health data published by SACHS provides important context to the chronic disease trends experienced by the people in the service regions of both institutions.
This data for 2019/2020 is available for public use at http://www.hrsa.gov/about/contact/bphc.aspx.
44
The Voices of our Community: Fresh Qualitative & Quantitative Findings
LLUH Institute for Community Partnership’s Community Benefit Office collaborated with Loma Linda University School of Public Health (SPH) to ensure a robust and academic approach to our CHNA process. SPH provided an impartial lens to the collection, analysis and reporting of the most critical health needs in our region. This high-level expertise brought to the table by the SPH team ensured a valid and useful analysis to identify the most important priorities to improve health outcomes in our region.
Community input was obtained by primary data collection that involved both quantitative and qualitative methods. Community surveys, community conversations and key informant interviews were conducted to capture the diverse perspectives and voices of a range of people from different socioeconomic and cultural backgrounds.
45
Qualitative and Quantitative Methodologies Defined
This study leverages the Health Equity Framework to conceptualize and organize complex links and associations between causes and their effects. Using a health equity framework to guide the CHNA provides a comprehensive guide to inform survey and interview questions as well as what primary and secondary data to collect for the assessment. The CHNA’s health equity framework not only considers the broad drivers of inequity in the community, including environmental health disparities, but also is focused on actions that will improve health equity as highlighted in the framework in Appendix B.
Part 1: Qualitative Research Study
The key informant interviews provided diverse views from community leaders and professionals working in healthcare, public health, community non-profit organizations, as well as community advocates from a representative sampling of people working on behalf of marginalized and vulnerable populations. Collectively, participants had expertise spanning a variety of industry sectors including housing, education, public health, faith, social and health services, and local and specialty community organizations. Pooling participants from different sectors helped to provide insights on key factors related to health equity including challenges across the social determinants that our communities are facing.
To provide additional context of community assets and strengths as well as priority needs, LLUH’s School of Public Health conducted community conversations with a diverse range of people from different socio-economic, racial/ethnic, and age groups. These community conversations provided an opportunity to listen to the community and give voice to their priorities, strengths, and concerns.
Methods
Each key informant was asked a standardized set of questions of which some, for continuity, were a replica of questions asked in the 2019 CHNA focus groups in order to assess similarities and differences of information collected. Additional questions pertaining to the impact of COVID-19 on our communities, housing challenges, and health equity were added in the 2022 CHNA with the hopes that information acquired will help to create relevant and actionable programs that are most needed. The facilitator probed certain theme areas from the set of questions, depending on the respondent's unique experiences and expertise.
The community conversations were conducted both in English and Spanish based on community members’ preference. Community members were asked a series of eight standardized open-ended questions starting with reflection on what a healthy community is, how people feel about their communities, and how communities can influence people’s health. Participants were then asked to identify physical and mental health conditions common to their community then prioritize the top 3-5 conditions. For each priority condition, community members discussed who was most likely to be affected as well as contributing factors. The conversation continued with a discussion of challenges the
46
community faces in accessing health care as well as how COVID-19 affected their community. The community members were also asked about the strengths of their communities and what gives them hope. Finally, participants were asked what one thing they would change to improve their communities. The questions were asked to all participants, irrespective of their socioeconomic status or race and ethnicity. 1 Some remarks from Key Informants and community conversations included in this report have been slightly edited for the purpose of clarity.
Participants: Key Informant Interviews
Interviews were conducted between January-April 2022 with a total of 13 interviews. Some interviews involved more than one key informant with a maximum of 3 participants so a total of 16 participants were interviewed in sessions lasting up to 90 minutes of semi-structured discussions. Interviews were video/audio recorded using Zoom and then transcribed.
Of the 16 participants, 37.5% were male and 62.5% were female. Participants were primarily Hispanic followed by White and then Black/African American. To offer a broader perspective, including hard to reach minority groups, having representation from the Native American community was specifically sought after as well as an individual who could represent under-represented faith groups.
Participants: Community Conversations
Gender and Race/Ethnicity of Key Informants
Hispanic
White
Black/African American
Middle-Eastern
South Asian
Native American
Female
Male
LLUH collaborated with trusted partner organizations to ensure that community conversation participants represented diverse perspectives that would elevate the voices and needs of our region’s most vulnerable populations. These partner organizations played an essential role in identifying medically underserved, low-income, and minority participants. Community conversation members reached included, but are not limited to:
• Community Health Workers/Promotores and Community Health Education Workers with deep knowledge of the health needs facing vulnerable communities
• Staff who work with single mothers, operate food pantries and work with foster families
• Undocumented/immigrant/migrant groups
• Unhoused individuals, including those struggling with mental health or substance use
1 Both key informant interviews and community conversations were transcribed and checked for quality prior to analysis. For the community conversations, in addition to English groups, Spanish groups were transcribed in Spanish and translated to English with quality control of both Spanish and English transcripts. Once the data was transcribed, coding and analysis of the data was done through MAXQDA, a software for qualitative data analysis. Key themes that emerged across the interviews and conversations were then categorized into findings.
47
0 1 2 3 4 5 6 7
• Individuals diagnosed with mental illness
• High School students and staff
• Asian Pacific Islanders
• Low-income senior citizens
• Human trafficking survivors
Twenty-two community conversations were conducted with a total of 150 participants. Groups ranged in size from 3 to 14 participants. A total of 17 groups with 117 participants were conducted virtually and 5 groups with 33 participants in person. Of the 22 groups conducted, 5 were in Spanish with a total of 27 participants. Demographic data (age, sex, race/ethnicity, education level, household income, health insurance and employment status), were collected from participants who were willing to fill out the anonymous forms. Groups were facilitated both in-person and virtually via Zoom, depending on the community’s preference. Facilitators asked standardized community conversation questions using a pre-approved guide that was developed for both English-speaking and Spanish-speaking participants. Participants were offered either a lunch (in-person) or gift card (virtual) as appreciation for their time. Each participant gave verbal informed consent to participate in the community conversations. A list of the community organizations that assisted in organizing the community conversations is located after.
We were able to obtain demographic information for 114 community conversation participants out of 150. The graphs below illustrate demographics of participants willing to provide information. The demographics of the sample participants closely track the demographic characteristics of our region. Some groups were over sampled (< $10,000 household income, females, Black/African American, Native Hawaiian-Pacific Islander) while other groups were under sampled (higher income households, White, Asian, Hispanic, some college). Emphasis was placed on recruiting participants from vulnerable groups within our communities to identify challenges and additional resources needed.
48
Household Income of Community Conversation Participants
Compared to County Demographics
$0 - $9,999
$10,000 - $24,999
$25,000 - $49,999
$50,000 - $74,999
$75,000 - $99,999
$100,000 - $124,999
$125,000 - $149,999
$150,000 - $199,999
$200,000+
Community Conversation Participants San
Race/Ethnicity of Community Conversation Participants
Compared to County Demographics
Black or African American
Hispanic or Latino
White Asian
Native Hawaiian or Pacific Islander
American Indian or Alaska Native
Two or More Races
Other
Community Conversation Participants San Bernardino County Riverside County
49 0% 5% 10% 15% 20% 25% 30%
Bernardino County Riverside County 0% 10% 20% 30% 40% 50%
Limitations
The goal of both key informant interviews and community conversations was to elicit responses that represent the diversity of our community, including stakeholders who serve the most vulnerable populations experiencing a disproportionate health burden. Despite our best efforts, there was limited representation from the transportation sector, environmental health services, public safety, and certain ethnic groups such as Asians and American Indians; therefore, findings should be supplemented with supporting data including community dashboards, county related strategic priority areas, and findings from secondary state and regional data sources.
Part 2: Quantitative Research Study
Similar to the qualitative approach, quantitative data collection included both primary and secondary sources and was collected during January to April 2022.
Methods
In designing the quantitative assessment, low income and health equity were the focus areas. The population of interest for surveying was the most disenfranchised and vulnerable populations, based on socioeconomic status and equity in our two-county region. To ensure that data collection represented the diversity of our region, surveys were conducted in the following areas: San Bernardino County (San Bernardino Metro area, Ontario Metro area, and High Desert) and Riverside County (Coachella Valley).
The community survey was administered both in-person and online in English and Spanish languages. The 58-question survey was completed by 811 individuals, who were contacted through 4 communitybased organizations:
● El Sol Neighborhood Educational Center
● FIND Food Bank
● Congregations Organized for Prophetic Engagement (COPE)
● Symba Center
These community partners conduct outreach services to predominantly Hispanic/Latino and African American/Black community members and have access to populations not only living in lower income areas but experiencing health inequity. Since the focus was on neighborhoods that are traditionally under-served and lower income, the surveys were not focused solely on specific ethnic groups but rather intended to identify a range of respondents from lower-income communities. Given that the 2022 CHNA is the baseline study for the next three years, any populations or regions of the counties that were not surveyed in the initial assessment will be a part of the on-going assessment strategy and priority for the fiscal year 2022-2023.
In order to gain an understanding about impacts on health, particularly the social determinants of health, the CHNA quantitative survey addressed a range of contributors to health status from
50
education to racial, ethnic, cultural, and language diversity, to income, food insecurity, housing, behavior health, community crime, immigration stress, financial literacy, health related social needs, COVID-19 pandemic, and more.
Participants: Quantitative Survey Respondents
LLUH prioritized the collection of primary data from community members through our community partners’ trusted relationships. Partner organizations played a critical role in reaching vulnerable populations using paper-based surveys. The focus was on reaching diverse and low-income community members – especially those who carry a disproportionate share of social determinant of health burdens. Community-based organizations were also able to ensure that the target populations were reached in a culturally sensitive and relevant manner, as they have established a rapport with the communities they serve. The community health and outreach workers were vital, indispensable, and the foundation of success for this assessment.
Out of 1,100 surveys distributed, 811 (84%) were returned. Survey respondents were not only racially diverse but socioeconomic and geographically diverse throughout our two-county region. The majority of the survey respondents were 45 years of age and older (59%); female (69%), and married (52%). In addition, a large majority of the participants were Hispanic (73%), with 95% as non-white. For educational attainment, 59% of survey participants had a high school degree/GED or less. A large majority of the survey participants (72%) reported having health insurance, with most having either Medi-Cal (IEHP, Molina, Other) or private insurance. Of the total survey participants, only 3% reported an income of $150,000 or more. A little over half the participants 54%, reported working either full or part time with 63% reporting an income of <$50,000.
51
Integrated Findings from Qualitative and Quantitative Studies
Our Community’s Assets
Participants shared several community strengths within the Inland Empire. When asked to identify the strengths, community participants frequently mentioned:
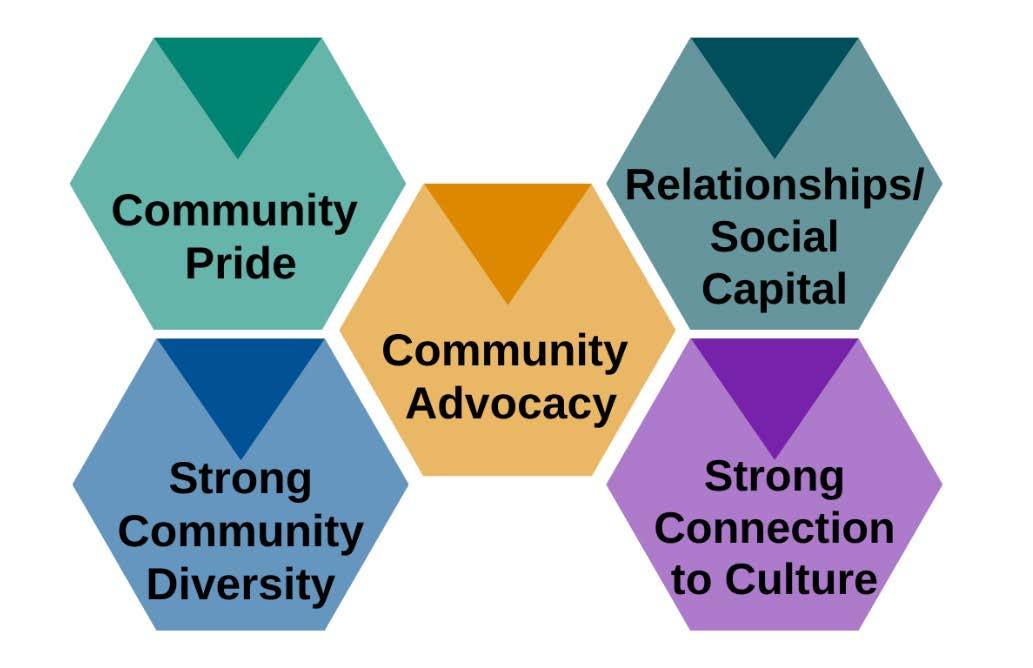
Ithink ourcommunity’s greatest strength isthat they arehelpful. Iftheyknow that thereisaneed,thentheycan work togetherandfindsome solutions.
- KeyInformant


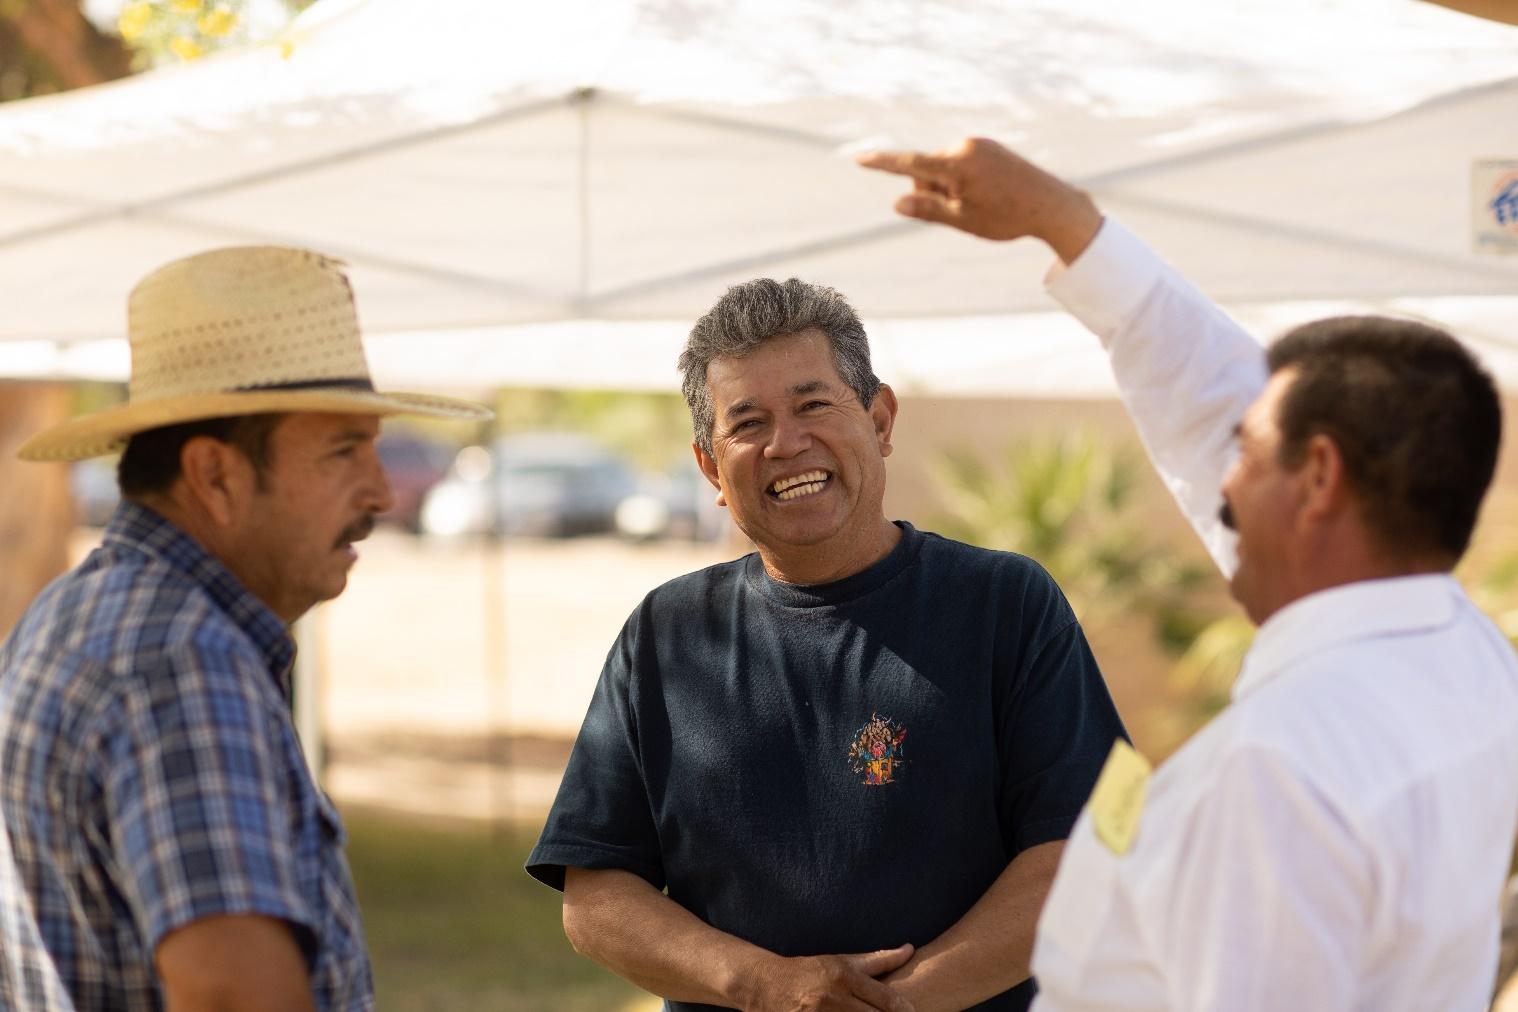
52
How do people feel about their community?
Participants shared mixed impressions when asked how people they know feel about their communities. Community members were candid in describing the following challenges:
• isolation
• disconnection
• lack of resources
• lack of voice/health equity
• hopelessness.
Yet at the same time, they described fierce sense of pride, a feeling of community among different groups within the region, and resilience in the face of adversity
What gives community members hope?
When asked what gives them hope for their communities, participants emphasized that having a voice and working together to address the challenges was a source of hope. Participants also described feeling encouraged by conversations on the systemic issues and social conditions contributing to health challenges. These conversations give them hope that more transformative improvements may take place.
Community members also spoke about their strong resilience in the face of crisis that helped them to see that the community could come together and work together to make change.
Ithink what givesmehopeareconversationslikewe'rehavingtoday: that people recognizeourpositionswithinthecommunityandcanask usforinput. Peopleare comingaroundtomakingmoresystemicchanges,whichisabigwin.
– CommunityMember


Our Community’s Top Needs
Both key informants and community members were asked about the community’s priority health challenges. In both cases, mental health was in the top three issues prioritized. Key informants prioritized mental health, chronic diseases such as diabetes and heart disease as top concerns while 4 of the top 5 concerns for community members were mental health issues such as depression, anxiety, addiction, and impact of complex trauma.
Community conversation participants were asked to list all the health and mental health challenges in their communities and then prioritize the top 3 – 5 most pressing problems. The graph below shows the communities ranking of the priority health challenges in their community.
53
% of Community Conversation Groups
Prioritizing Health Challenge
Depression
Anxiety
Substance Abuse/Addiction
Diabetes
Complex Trauma/Neglect Heart Disease/Heart Failure
PTSD
Schizophrenia
Suicidal Ideation
Obesity
High Blood Pressure
Bipolar Disorder
COVID-19
Asthma
High Cholesterol
Poor Nutrition
Cancer
Paranoia
Anger Problems/Rage
Dementia
Dental issues, vision problems
Mental Health
Mental illness and access to treatment are ranked among the top issues in the community. This was seen as stemming from trauma in the community and was most often manifested by anger and violence. Substance abuse was also seen as a way to self-medicate when mental illness was untreated. Contributing factors included:
• Housing crisis/homelessness
• Impact of COVID-19
• Living in an underserved area
The loss of family members due to COVID-19 was also highlighted as a cause of increased depression among families. An increase in anxiety and depression was noted among younger people in the community after COVID-19. Participants in a community conversation conducted in Spanish also indicated that depression had increased as a result of COVID-19.
Participants that lived in the High Desert provided organizational factors that accounted for the high rates of mental health conditions in their community. It was felt that people with mental health conditions were deliberately sent to that area to live.
54
0% 10% 20% 30% 40% 50% 60% 70% 80% 90% 100%
Everyformofmentalhealthispresent hereinthehighdesert,mainlybecause peoplecomehereforthereasonthat theyarelow socio-economic.Whentheyhave mentalhealthissuesandarenot abletoaffordhousinginotherareas,theyare shippedtothehighdesert.Soeverytypeofmentalhealth,anxiety,depression, bipolar,schizophrenia,whatevermentalhealthissueyoucouldthink of,existshere inthehighdesert.Andit’scommonthroughout theentirehighdesert,nomatter what areayou'rein.

- CommunityMember


Substance Abuse and Addiction
Substance abuse was a major concern for participants in the community conversations. They also highlighted the difficulty in finding places for treatment. Several participants mentioned that teens had easy access to alcohol and drugs. While most participants who mentioned substance abuse felt that people turn to drugs because of depression, trauma, and stress, a few felt that it was more influenced by social situations.
While substance abuse could be considered a part of the mental health burden, participants discussed the cyclic nature of using substances to deal with trauma as well as drug abuse leading to mental health challenges. Taking a whole person perspective and considering the myriad of social determinants of health that contribute to substance abuse issues would be crucial to successful interventions.
Diabetes, Obesity
Diabetes and obesity were also mentioned by key informants and community participants as prevalent and affecting the community. Several participants mentioned the need for more education for the community about diabetes and obesity and the importance of good nutrition and exercise. Participants also discussed the lack of healthy food choices in some neighborhoods and easy access to unhealthier foods. Cultural preferences and the lack of time to prepare healthier food options were also mentioned as contributing to high rates of diabetes and obesity.
Ithink sometimesifthereisarestaurant that offersabetteroptionforfood,it's probablyonthebettersideoftown.Andsometimesit ishardertoget to that side. In moreurbanneighborhoods,it'seasiertograbsomethingthat'snearerversus drivingtohaveabetterchoice.

- CommunityMember


55
Who is most affected by priority health and mental health challenges?
Key informants and community conversation participants were asked to identify which age groups were most affected by the priority health and mental health challenges identified. The figure below summarizes the challenges and contributing factors for each age group.
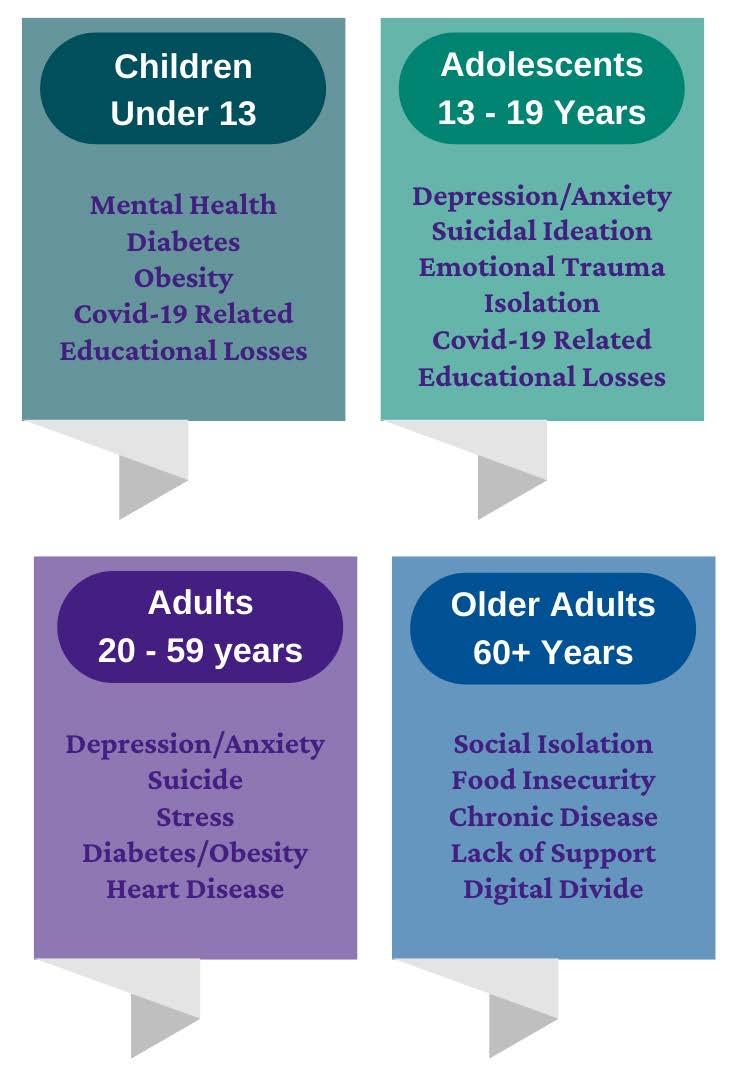
56
What is contributing to these health challenges?
Key informants and community members discussed key drivers contributing to the health challenges the community faces. Social determinants of health as depicted below were emphasized in both the structured interviews and community conversations as important for good health
Affordable Housing
While 86% of the 811 survey participants reported they have a steady place to live, 11% do not. Moreover, 9% of those who currently have housing are worried about losing it. Those who are unhoused (2%) report temporarily staying either with others, in a hotel, in a shelter, living on the street, in a car, in abandoned buildings, bus or train station, or in a park.
Of the stably housed, 42% reported safety and sanitary problems with their housing, including the presence of pests (e.g., insects, rodents), mold, lead paint, and water leaks, as well as the absence of working smoke detectors, stoves, and air conditioning.
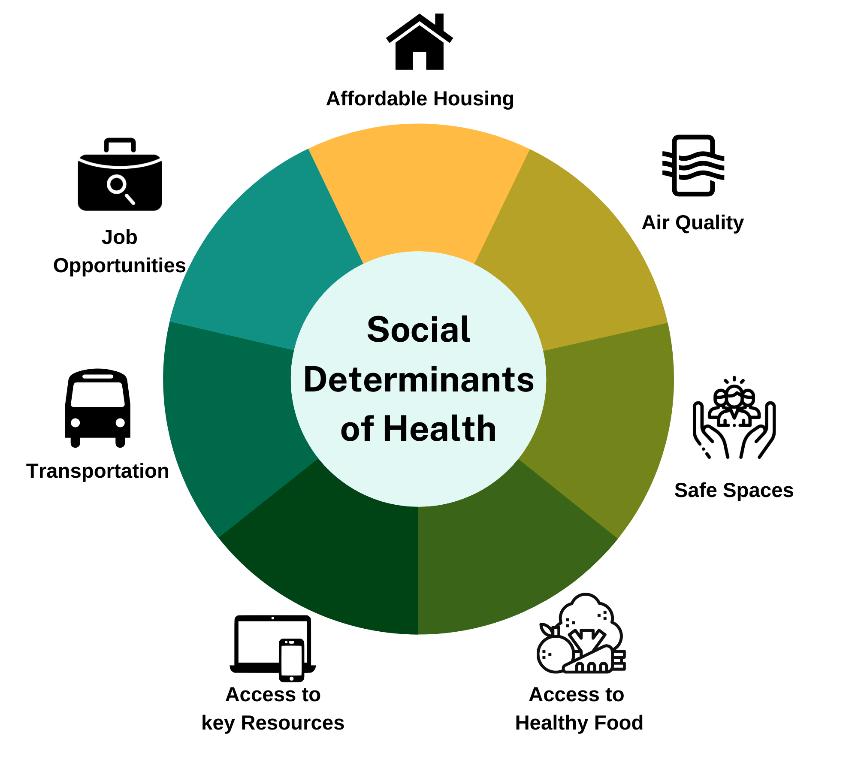
Participants of the community conversations and key informant interviews also discussed affordable housing as a problem in the region. They shared that the cost to purchase and maintain a home was high, as well as the cost of a good rental property. This was often coupled with low wages. The lack of affordable housing was mentioned as being a key stressor for many years but was exacerbated by the pandemic. During the pandemic, the rising cost of rental properties contributed to worsening of the homelessness rates. Even non-government organizations (NGO) or community-based organizations (CBO) such as Uplift were striving to help the homeless and these groups were confronted with a lack of the stock of houses available at a reasonable price.
The high rates of homelessness in the community were also linked to the mental health crisis. Many residents felt that if the high rates of homelessness in the communities were reduced then the communities would be much better off There was a great need for the homeless to be housed and mental health services be provided for them.
Ithink housingandsecurityis huge.Becausewithout housingyouknow there'llbea lot of other health issues that come from that.
- KeyInformant


57
Jobs and Workforce Development
A total of 21% of survey respondents reported needing help with finding a job and 11% (88) indicated they had limited work due to COVID-19. Most of the population surveyed are employed, whether fulltime (35%) or part-time (18%). About 8% of respondents are not employed and are looking for work.
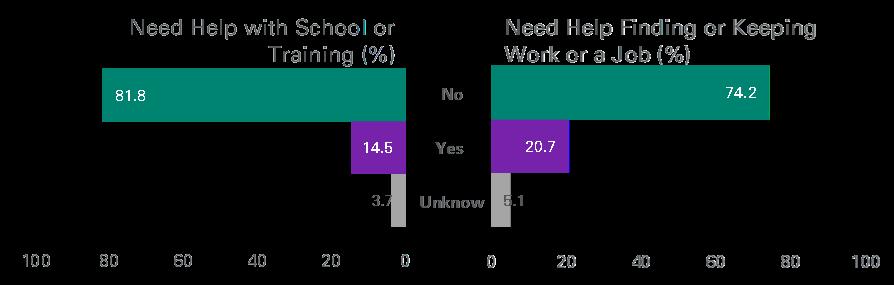
Iwouldsaybetterpay and better jobs,so families don't have to livepaycheck

Lack of employment opportunities, including the need to provide a living wage job, was highlighted by many focus group participants and key informants. Workforce development was seen as a need for the area as many recognized it is the pathway to building wealth and more security for families. Lack of living wage jobs were seen as contributing to high rates of poverty and connected to many of the priority health and mental health challenges that communities face.
Healthy Food, Food Insecurities, and Food deserts


Food insecurity and limited access to healthy foods is an ongoing concern within local communities. Nearly half (47%) of the 811 survey participants have used a free food bank within the past 12 months. Of the survey respondents, 14% have worried about food security once a week or more over the past 12 months and 10% had experienced food insecurity.
58
topaycheck. - CommunityMember
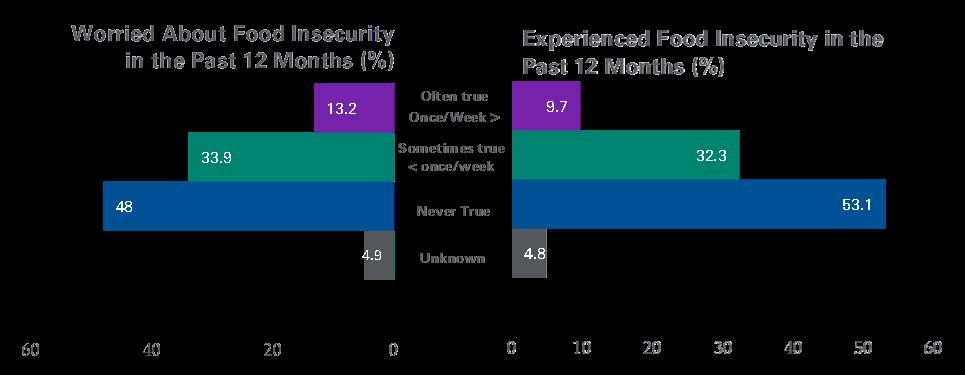
Foodinsecuritywent through theroofwhenpeoplewere isolated to their homes.

- CommunityMember


Community conversation participants and key informants identified food insecurity as a major contributing factor to chronic illnesses, especially diabetes. They highlighted both the lack of resources to buy healthy food and the dearth of healthy foods in geographic areas (e.g. food deserts) Participants also often stressed the inequities in how poorer neighborhoods have more limited options for healthy food and a higher prevalence of unhealthy fastfood chains compared to wealthier communities. Participants linked poverty, fast food consumption, and the lack of fresh foods to higher rates of diabetes and obesity. Cultural beliefs and customs around food, such as eating less healthy comfort foods at social events, were also mentioned as contributing to priority health problems.
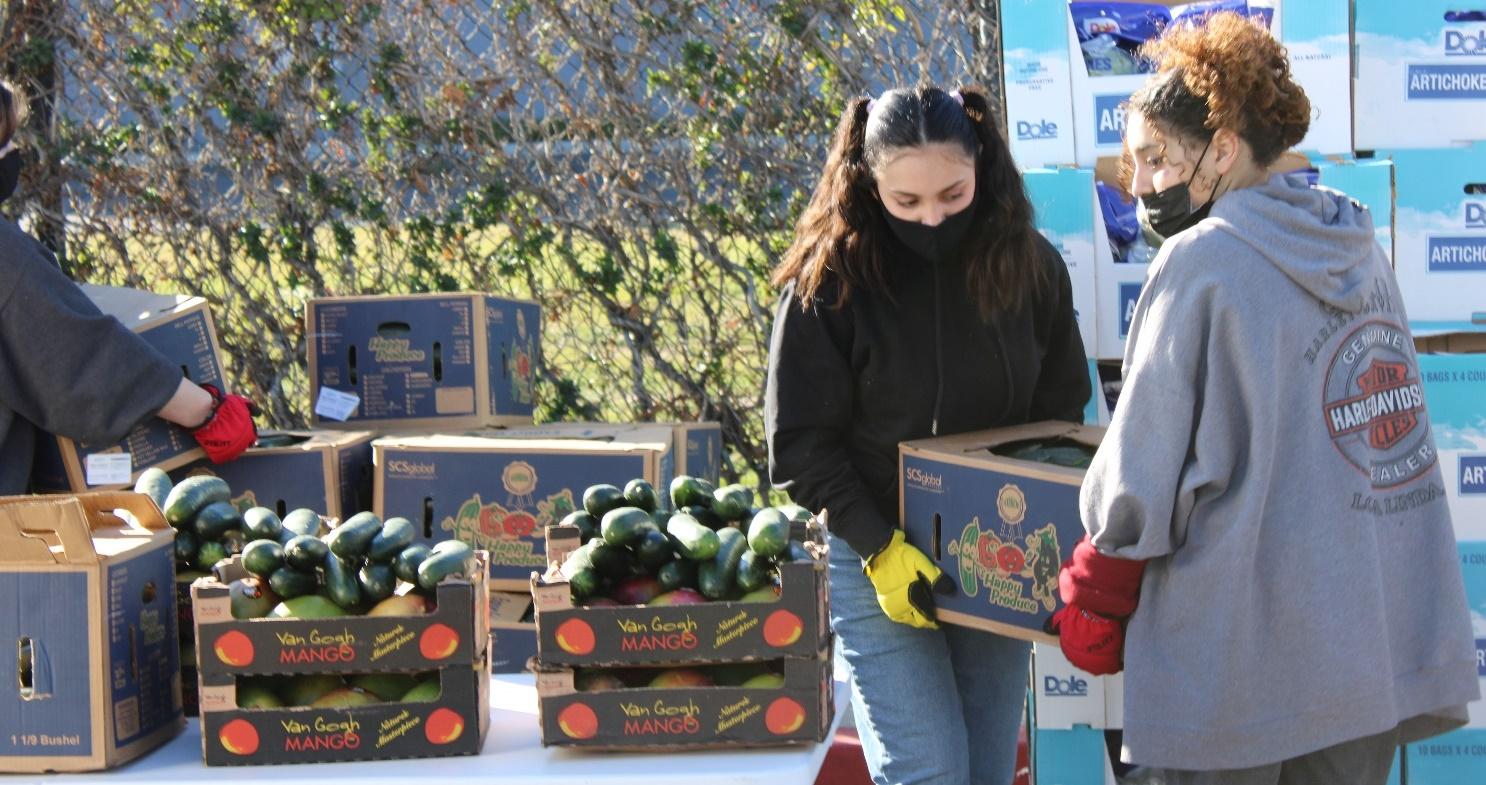
59
Community Safety
When survey participants were asked about how safe their community feels, 88% generally feel safe. Nevertheless, nearly 40% described the crime level in their community as having increased during the past two years Lack of safe spaces was often highlighted as a contributing issue to obesity and diabetes as well as mental health problems in the community because it prevented the residents from being able to exercise and socialize in ways that would lead to a better quality of life. Other reasons included:
• the fear of being shot as deterrent for walking in the neighborhood.
• the lack of recreation areas for children to play sports like basketball, baseball and football
• the lack of safe places impacted social connections in the community.
Participants talked about feeling insecure as they walked the streets. A participant in a community conversation said the crime in her community and the economic issues faced by the families impacted the ability to move to safe neighborhoods. Bullying was another prominent issue highlighted by participants. Participants felt that bullying created an unsafe environment for the children at school.
I can say that people think it's a dangerous environment outside your home and so we're not so sociallyinterconnectedanymore…it’s just changed, you know? People keeptothemselvesandstayintheirownhouseholds.

- CommunityMember


Transportation Access
Transportation and access to affordable transportation was often mentioned as a problem. The lack of transportation impacted access to health and other essential services such as grocery shopping. COVID-19 was also seen as a factor since it impacted the comfort level of the participants taking public transportation and with the costs of Lyft and Uber it made things more difficult. The difficulty in getting transportation to access specialty health services at Loma Linda University Health was mentioned as a problem experienced by participants from the High Desert.
Pollution and Air Quality
Transportationisahugefactor
because if there aren't local hospitalsandclinicsthat you canget carefrom,thenit creates a barrier for families to be able to access[care].
- CommunityMember


Asthma was also mentioned as an issue in one community. The issues with asthma were linked to air quality. A participant highlighted the industrialization of the city as the reason for reduced air quality. Fires were seen as another cause of reduced air quality along with the Santa Ana winds. Participants mentioned that their family members and neighbors struggled to access inhalers.
60
Access to Healthcare
Many community participants indicated that there was a need for improved healthcare access. This was further exacerbated by the pandemic. Community members frequently noted an unequal distribution of health care resources, especially for mental health. In addition, many low-income residents struggled to access telemedicine/telehealth resources because they lacked broadband access, digital devices, or education/experience to do so.
Community conversation participants and key informants also mentioned affordability and the cost of health care as primary barrier to accessing care. Several participants state that negotiating paperwork and navigating the health care system discouraged community members from seeking care. Undocumented immigrants were mentioned as being particularly vulnerable to a lack of access to care. Participants identified several factors complicating health care access and contributing to delays in seeking care. These included inadequate numbers of health care professionals and clinics/hospitals; language barriers; and racism and stigma.
With regards to health insurance, 26% of survey respondents reported being uninsured. Of those with health insurance, the majority were covered by Medi-Cal (IEHP, Molina) or Private insurance. In addition, 140 (17%) reported being unable to get health care within the past 12 months. Reasons listed for inability to get appointments include:
• fear
• delay in getting an appointment
• no health insurance
• unable to afford a copay
Nearly 30% of the survey respondents reported being unable to access dental care in the previous 12month period. Of those who gave a reason for not being able to access dental care, not having dental insurance was the top reason provided at 17.5%, while 6.4% cited not being able to afford the co-pay or deductible. With regards to mental health services, 10% were unable to access mental health services within past 12 months. Respondents cited not having insurance, waiting too long for an appointment, and not being able to afford co-pays or deductibles as the primary reasons for not accessing mental health services. Of the respondents, 8% were unable to help their children get medical care within the past 12 months. In addition, 4% reported not being able to access mental health services for their children with affordability given as the primary reason.
Other Contributing Factors
Other issues mentioned were increased poverty and the unequal distribution of resources and the lack of technology along with Internet access by many residents in the area. Inequality within and between communities was often mentioned as a problem. Another stressor facing communities is immigration concerns, with 15% of community survey respondents reporting fear of deportation due to undocumented status for themselves or their families.
61
How has the COVID-19 Pandemic contributed to these challenges?
The ongoing COVID-19 pandemic has impacted many different aspects of life for participants, including personal health. Roughly 38% of survey participants reported having had COVID-19 by Spring of 2022. (This number is likely underreported due to the many non-symptomatic cases that went undiagnosed). Despite the hospitalization and mortality rates, especially among those individuals not vaccinated for COVID-19, 11% (203) participants reported they had not yet received the COVID-19 vaccine. Alarmingly, 25% of surveyed adults reported dealing with long-term COVID-19, which has adversely impacted the ability of many to maintain employment.
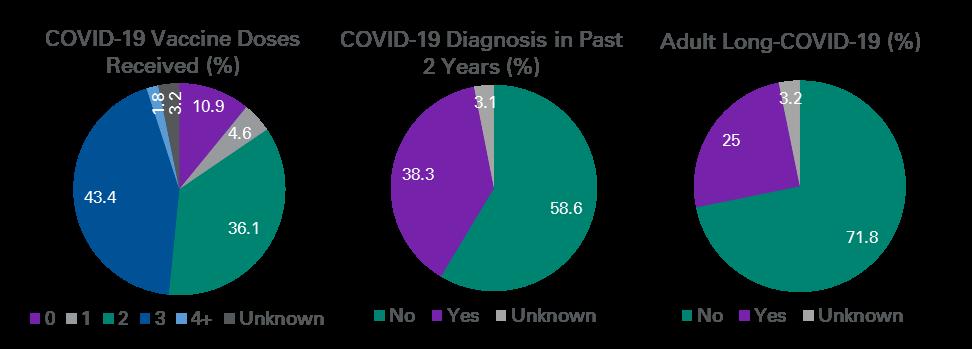
Key informants shared challenges that arose or were exacerbated from the COVID-19 pandemic. The pandemic caused stress and burnout and significantly impacted some sectors more than others. Essential service sectors were particularly impacted (i.e., the food industry, healthcare, transportation, sanitation, public health and education).
Burnout onbothsides,thecommunity isburnt out andIdon't
meanjust communitymembersat largebut also community-basedorganizations.
- Key Informant


Issues of equity became more apparent, especially in receiving timely vaccinations. Access to technology and the Internet for basic functions during the series of lockdowns was also an issue, especially in the education sector. Students did not have the proper learning space or necessary resources for optimal learning despite efforts from the schools to supply laptops and computers.
Accessing healthcare services using telehealth was an additional challenge. Loss of employment and workforce issues also caused families additional distress often leading to loss of health insurance and challenges with housing including homelessness.
Isolation impacted the mental well-being of all age groups. Community survey respondents reported some sense of disconnection and isolation with 5.8% noting feelings of loneliness or isolation fairly often or frequently. The pandemic also highlighted the lack of emergency preparedness and
62
exacerbated already existing inequities. In community conversations the most frequently mentioned issues were:
• job loss
• eviction/homelessness
• food insecurity (especially for children who rely on school meals)
• mental health challenges (isolation, fear, stress. substance abuse, and abuse)
• grief and loss due to multiple deaths in the family and among friends
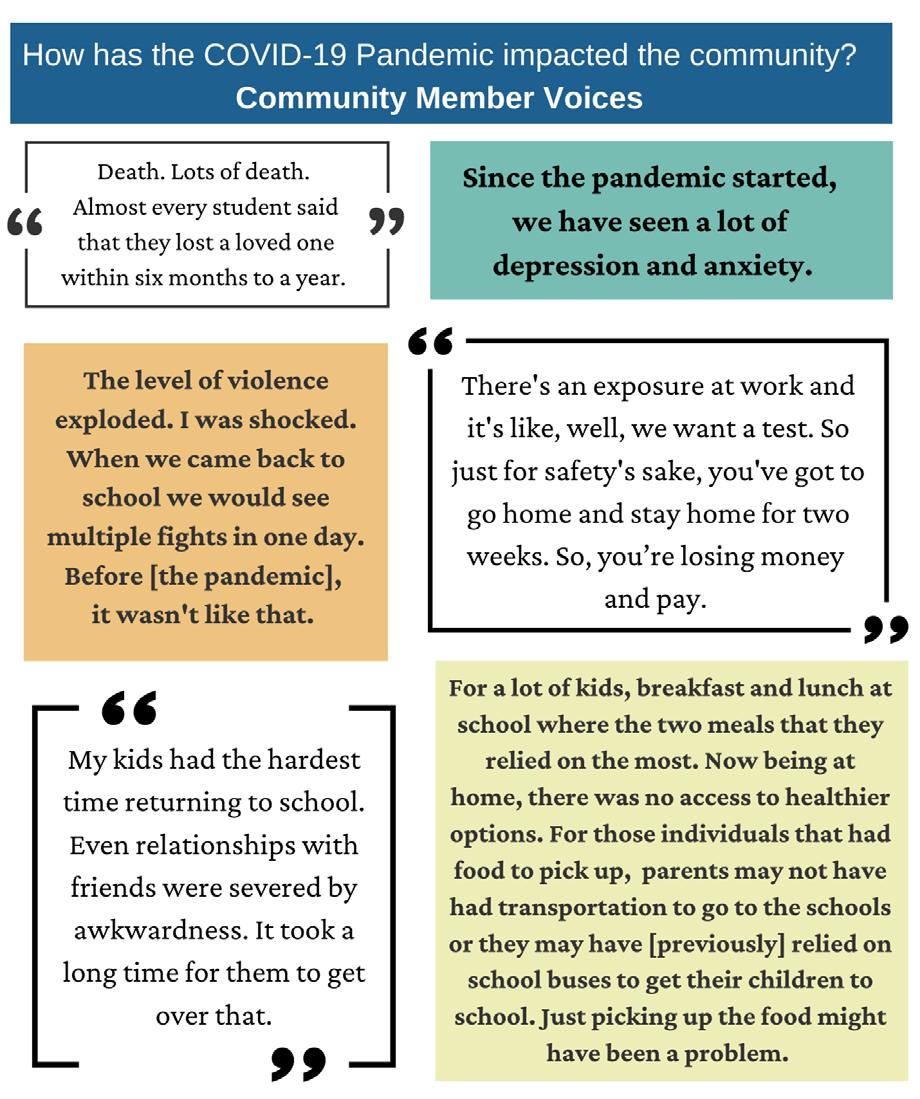
63
Some participants mentioned increased difficulty accessing medical services for both COVID-19 and other illnesses. About half of the community conversations discussed the effect on families – isolation, difficulty quarantining (because of tight quarters, job responsibilities, no sick time off), family members blaming each other for infecting others, no childcare, and managing education at home. The issues of being asked to quarantine if you were exposed were mentioned as a major economic blow.
The anxiety over mask wearing, vaccinations and listening to the news were highlighted as reasons for increases in anxiety and depression in the population. There were concerns raised about the long terms side effects of the vaccine. The loss of jobs and access to PPE was mentioned too. It was also felt that the job loss during COVID-19 contributed to food insecurity. It was felt that the level of violence increased among the school-aged population upon their return to the school environment. The lack of interaction among the school-aged population was seen as a cause of depression.
While there were many challenges during the pandemic, stakeholders also pointed out some opportunities that helped communities, including increases in funding. Increased collaboration led to some great innovations in the community. Cross-sector collaborations happened at a scale not seen before. Part of this was attributed to common goals that different sectors could rally around, such as:
• providing access to essential services and goods including food and transportation
• delivering vaccinations and testing kits
• distributing critical supplies such as personal protective equipment to communities and organizations experiencing shortages.


Funding was pouring in from government agencies which helped many community-based and local government organizations reach the most vulnerable with the services most needed.
64
Fundingcameinforcontact tracing, testing,andvaccines.Sothankfully therewereverybigdeliverableswhere wecanactuallysee[theresults].
- KeyInformant
What our Community Needs for Equitable Health and Wellbeing
What makes a community healthy? (Healthy Equitable Communities)
When asked to envision a healthy community, community members focused on access to:
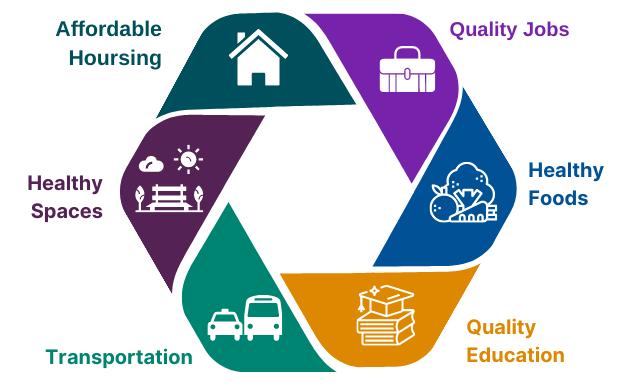
Acommunitywherethereis affordablehousing,accessto qualityjobsandaccesstofood, mental healthservices,green spaceandpeoplefeelsafe. Substance abuse is not criminalized but treated as a diseaseandtransportationis improved.Theenvironment in itstotalityishealthyand thrivingforallandnot onlyfora select few.

- KeyInformant


In addition to access, an emphasis on preventing disease and disability and safety was mentioned. In a community conversation emphasized the need for safe spaces for people to connect and socialize.
How can we improve the health of our communities and create health equity?
Interviews explored topics connected to health equity, including how best to develop healthy, equitable communities. The following key themes emerged during these discussions:
• Improving access to affordable housing
• Improving access to timely, equitable healthcare services
• Creating a clean environment and safe walking spaces
• Improving access to public services such as transportation
• Developing high-quality education systems
When stakeholders were asked the two most important problems to focus on that would improve their community, the majority identified affordable housing and mental health issues, followed by the creation of quality jobs and workforce development. A few participants discussed the need for upstream equity interventions in the form of policy.
Some stakeholders and community members mentioned specific interventions to improve equity such as health care navigator programs, sharing data to inform programs, connecting people to increase income capacity, increasing educational and technical training programs as well as internet access for all.
65
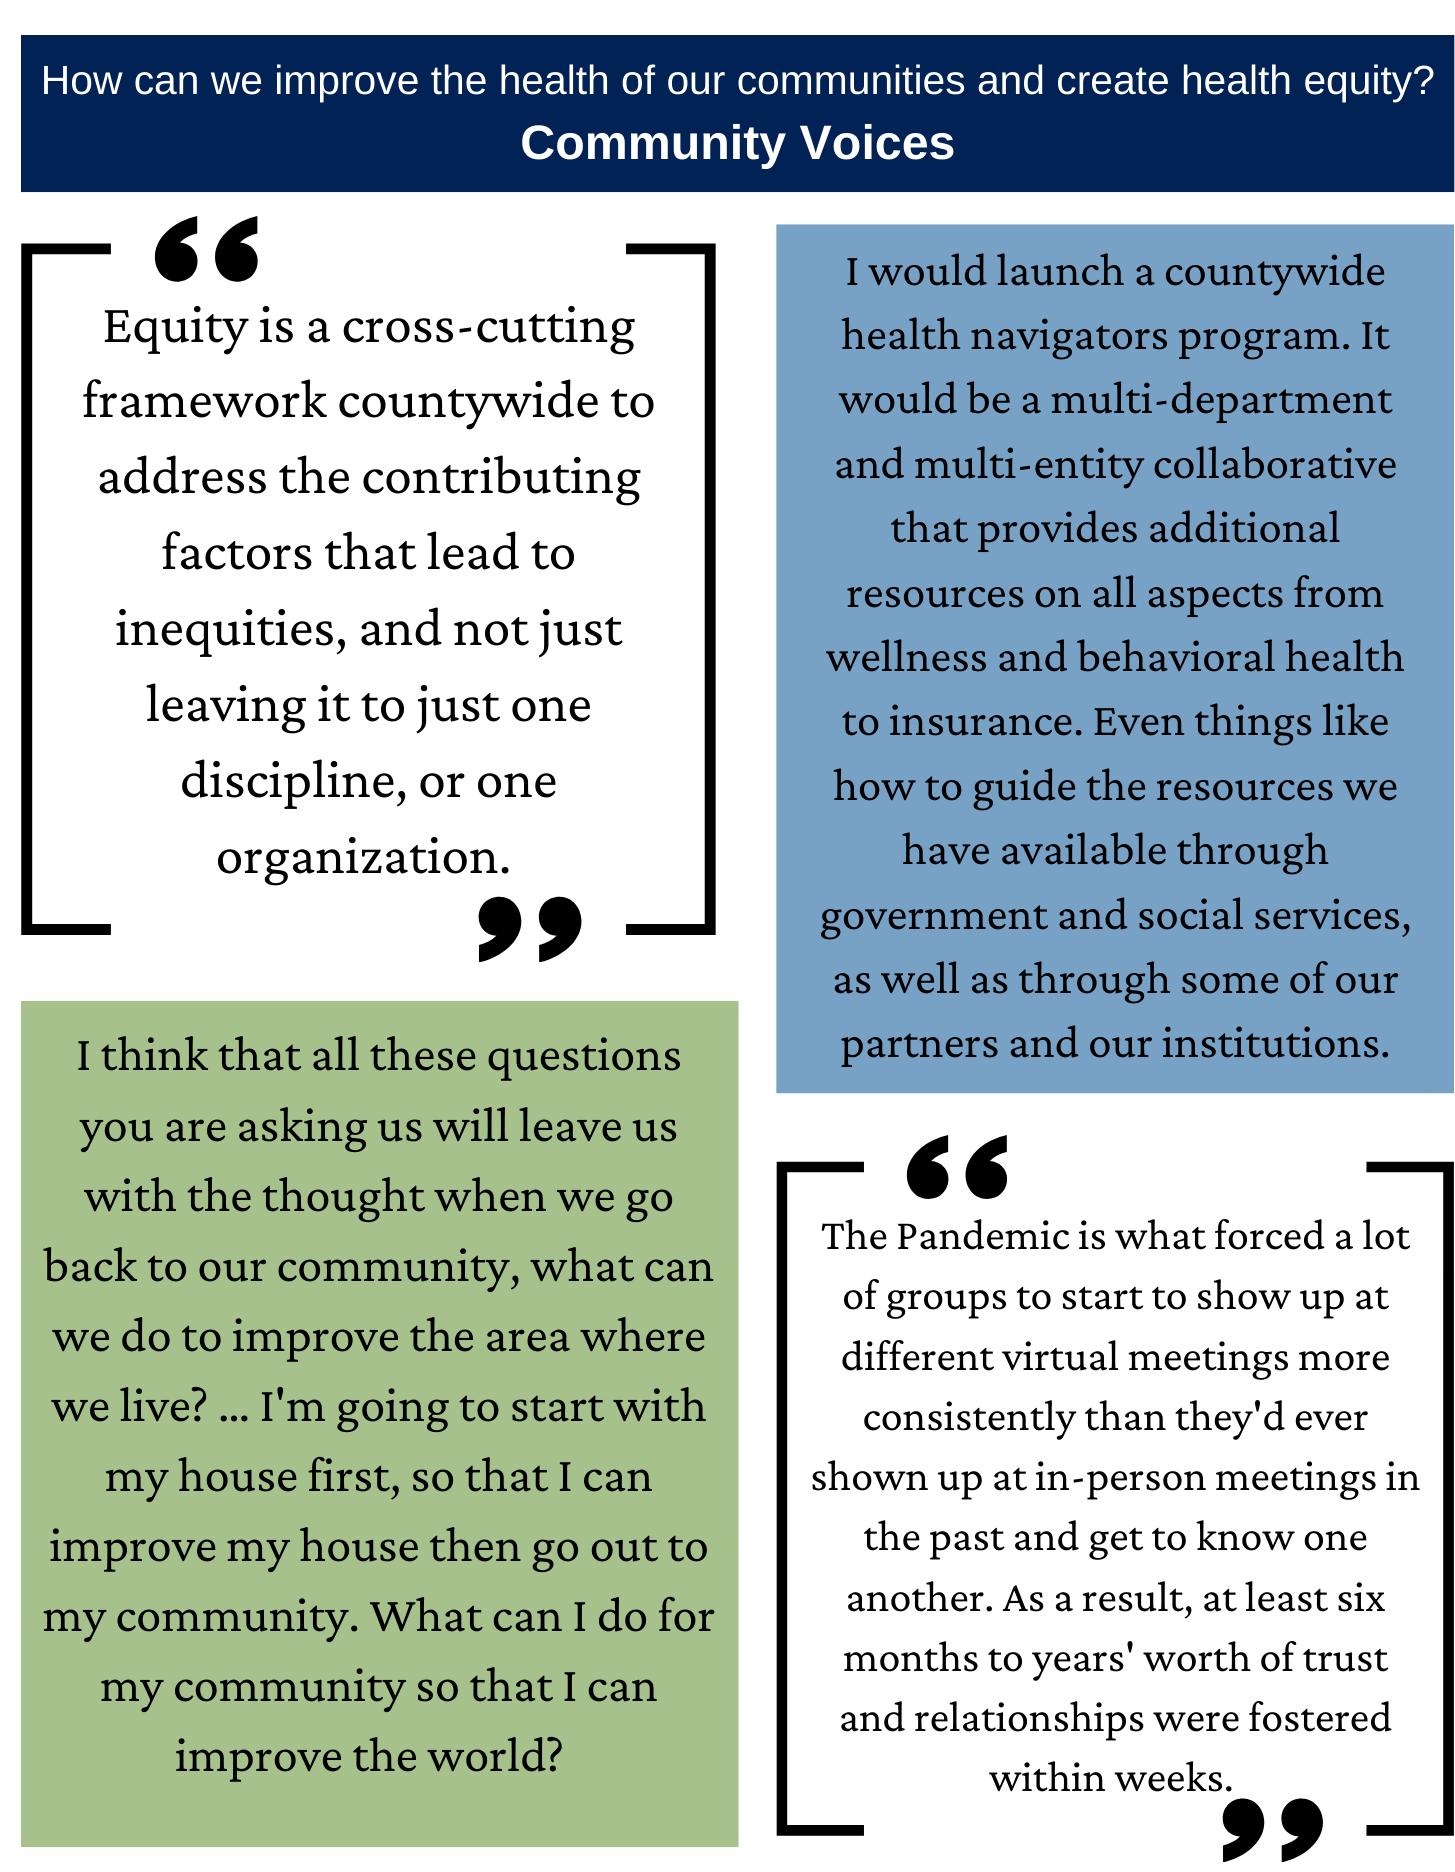
66
Cross-sector collaboration
Cross-sector collaborations are essential for increasing health equity in the community. While the pandemic brought stress to the system it also accelerated cross-sector collaboration. Resources were invested where needed most with trusted community partners, like faith-based and community-based organizations who could get the word out quickly and connect people to the resources they needed.
Virtual meetings allowed partners to meet more frequently than they may have otherwise. Stakeholders also said that they feel that progress is being made in terms of investments where it is needed most: in workforce development and affordable housing. Cross-sector partnerships and collaborations empowered communities and community-based organizations to advocate for their needs and to work together towards a common goal.
Increase community capacity to advocate for health equity
In several community conversations, community members expressed that just being consulted through the community health needs assessment gave them a voice and hope that things could improve in their communities. Talking about the hopes and strengths as well as the challenges motivated them to go out and talk with their neighbors to try to improve their communities and unite together and with others in the city to achieve healthier communities through collective action.
67
Prioritization of Community Needs
Based on the secondary data and primary data analysis, the top 3 health challenges that emerged across the community we serve are:
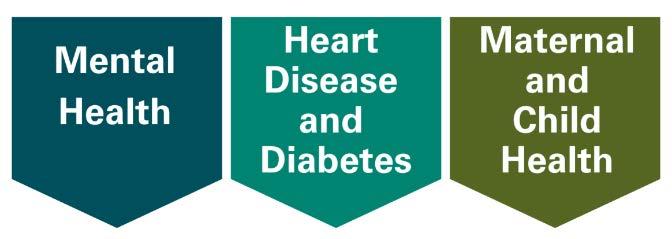
The COVID-19 pandemic has affected so much of life, including health care access, mental health outcomes, student learning, poverty, and community safety and has worsened inequities. To improve health equity most effectively in the region, LLUH’s implementation strategy must include the root causes of social and health inequities. The community identified the following social and environmental conditions with the greatest impact on health locally:
Looking Ahead: Addressing Community Health Needs
LLUH Community Benefit efforts include the implementation of our 2022 CHNA to update and inform our 2023-2025 Community Health Implementation Strategy (CHIS). This document which informs the priority areas for LLUH will be Health posted by fall of 2022. The CHIS is a 3-year plan that will outline goals, strategies, and metrics for evaluating outcomes and impact for each of our Community Benefit efforts. LLUH will select goals and strategies that build on the strengths of the hospital system, partner organizations, and the community. It will be posted on LLUH’s Community Benefit webpage at https://lluh.org/about-us/community-benefit/reports-and-resources
68
Evaluation of the LLUH 2020-2022 Implementation Strategy
Update on Past Implementation Plans
LLUH last completed Community Health Needs Assessment and Implementation Strategies in 2019. The summary below provides an update on progress made against goals from the most recent 3-year plan that aimed to leverage hospital and community partner strengths to improve health equity. For more details on progress-to-date, please view LLUH’s Community Benefit Annual Reports at https://lluh.org/about-us/community-benefit/reports-and-resources
GOAL 1 Address poverty by creating workforce opportunities.
1.1 STRATEGY Invest in workforce opportunities for adults, youth and people from marginalized or special populations.
MEASURES
• # of scholarships invested in youth going to college to transition vulnerable or at-risk youth to higher education
• # of scholarships to LLUH graduate programs for youth who meet criteria as disadvantaged or vulnerable youth.
• Investments or technical assistance with workforce development with partners to increase outreach to marginalized & specialty populations (# of people).
RESULTS
Throughout FY 20 – FY 22 LLUH remained committed to the primary focus area of workforce development and education to address a foundational root cause of poverty in the region. This included scholarships as a workforce entry strategy for adults, youth, and people from marginalized or special populations. This investment resulted in the disbursement of 121 scholarships, 34 stipends, and $481,000 into the hands of at-promise youth in the region that transitioned into higher education.
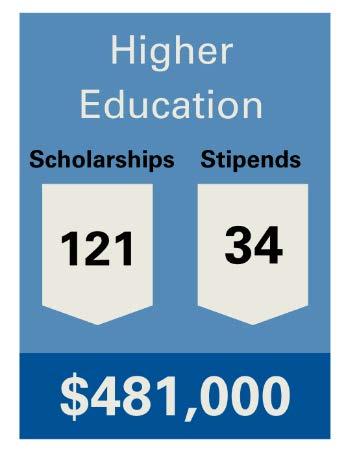
69
In addition, LLUH was committed to supporting students pursuing graduate education programs as the next generation of healthcare providers in the region. This investment included 25 scholarships totaling $143,500 to graduate students representing the fields of Nursing, Public Health, Allied Health, Behavioral Health and Pharmacy across several universities, including LLU. Investments supported minoritized students from San Bernardino and Riverside County who were committed to serving our region. Furthermore, this investment was dually leveraged as each graduate program within LLUH was required to match all Community Benefit funded dollars directly to these students or other minoritized students, which essentially doubled our investment in graduate education over the last three years.

Finally, LLUH focused on providing investments in workforce development with community-based partners to increase outreach to marginalized and specialty populations. This included investing $786,334 dollars in 22 different workforce development initiatives. Projects included support for nonprofit capacity-building, wraparound services for unhoused individuals, tattoo removal for individuals seeking employment, and youth mentorship, among others. These partnerships with key community-based organizations were vital in understanding where our investments made the greatest impact. At the state level, LLUH has contributed to several initiatives for healthcare workforce and CHW workforce development including The California Endowment Workforce Technical Advisory (2021-2022), meeting with Sacramento policy staffers (2022), the Mullen Report panel on CA Healthcare Workforce Diversity (2022), and The Children's Partnership Panel on CHW reimbursement bill (AB 2697).

70
1.2 STRATEGY Introduce underserved middle & high school students to healthcare careers and healthy lifestyle choices.
MEASURES
• # of youth served in My Campus and Discovery pipeline programs that bring underserved youth to LLUH campus for health career seminars
• # of youth served through Goal 4 Health soccer league & # of parents served through outreach at Goal 4 Health Games
• # of Pipeline students who attend college and graduate programs 2
RESULTS
The LLUH investment in Pipeline Programs seeks to introduce underserved middle and high school students to healthcare careers and healthy lifestyle choices. This investment is critical to our workforce development strategy as a way to increase future representation in healthcare fields to minoritized students in the region. The Pipeline Programs have grown considerably over the course of the last 3 years. This includes investments totaling $150,000 for the following program activities:
• Programming for over 160 students (and counting 3) for My Campus, which provides students with interactive workshops that expose them to health schools (Nursing, Dentistry, Medicine, Pharmacy, Public Health, Allied Health and Behavioral Health) and mentorship opportunities.
• Programming for over 120 students (and counting 4) for the Discovery Program (formerly called Summer Gateway), which is a 2-week opportunity for minoritized students in the region to prepare for college and explore different fields within the health professions. A select group of students are invited to participate in a third week to shadow local healthcare professionals.
• Goal 4 Health soccer league serving 225 youth and 189 families in the region with a safe outdoor activity that promotes a healthy lifestyle. 5
2 Is still being tracked and measured. Accurate reporting numbers should be available by EOY.
3 Has served 163 students as of FY 21 and final # of students served in FY 22 will be reported at the EOY.
4 Has served 124 students as of FY 21 and final # of students served in FY 22 will be reported at the EOY.
5 Due to COVID-19, Goal 4 Health was suspended in FY 20 and FY 21. Numbers reflect FY 22.
71
1.3
STRATEGY Expand Community Health Worker integration in school districts, hospital systems, and with non-profit partners.
MEASURES
• Dollars invested (direct and in-kind)
• # of CHW jobs created
• Technical assistance provided to organizations in the development of the community health workforce
RESULTS
During fiscal years 2020-2021 6 , Loma Linda University Medical Center invested $3,000,000 in San Manuel Gateway College (SMGC) to support health professional education operational costs and training as an access strategy to address workforce development and education needs of local youth. SMGC’s Promotores Academy offers several community health worker training programs and certifications including Foundational Training, Clinic-based Community Health Workers program, and School-based Community Health and Education Worker training. The Promotores Academy was established to fill the gap in CHW training in our local region and to develop a much-needed workforce that is ideal for linking the community to the social and healthcare systems. SMGC is developing the health care workforce of tomorrow while providing the bridge to help our community’s youth and adults find a path to higher education to set them on a life-long path of career development and economic advancement.
Stewarding workforce development for community health workers was a major initiative in the 20202022 CHIS cycle in order to pilot integration in school districts, hospital systems, and with non-profit partners where CHWs have traditionally not been hired in our region.
This strategy aims to use the hospital’s investment to intervene and lighten the burden of the social determinants of health through community peers who are expertly trained in recognizing and navigating system barriers that lead to inequity. The hospital-based CHWs are employed and assigned to work in the community with patients and their families who represent the priority population, as defined by community benefit parameters. LLUH system-employed Community Health Workers support patients from several hospital departments and act as a liaison to ensure access to resources and healthcare post-discharge. CHWs have reached target populations through outreach phone calls to families, goal setting, referrals to community resources, motivational interviewing, health system navigation, and were key support to mobile vaccination clinics. We expanded our health system CHW
6 The 2022 fiscal information will be available Spring of 2023 in keeping with IRS guidelines for reporting.
72
workforce from 3 CHWs to 8 during the 3-year period in review. CHWs are now integrated with key areas of the hospital, including:
• Behavioral health (4 CHWs)
• Neonatal ICU with a focus on at-risk infants and mothers, and improving Black infant health outcomes (2 CHWs)
• Emergency Department with a focus on trauma/violence-prevention and unhoused patients (1 CHW)
• Outpatient Diabetes Treatment Center, with a focus on pre-diabetic and Spanish speaking patients (1 CHW)
LLUH through the Institute for Community Partnerships (ICP) is building and supporting Community Health and Education Worker teams (CHEWs) in local school districts in order to support school districts in addressing social determinants of health and education for students and families. The CHEW Program operates via a three-way partnership between LLUH-ICP (technical assistance and oversight), El Sol Neighborhood Educational Center (hiring and supervising agency), and school districts (funder and implementation site). The CHEWs are trained to work in the education system and through relationship building, education, and home visits extend outreach, social support, linkages and accompaniments, resource support, and informal peer counseling for families. This program aims to help students who are chronically absent, face undue challenges and for those experiencing mental or behavioral health crisis have additional, intensive supportive resources. During the 3-year period in review, LLUH-ICP helped expand the workforce from a total of 6 to 11 CHEWs. These CHEWs support San Bernardino City and Chaffey Joint Union High School Districts. An additional 2 CHEW positions are scheduled to be added by August 2022. LLUH Community Benefit has invested in mental health training for CHEWs to support their work. LLUH School of Behavioral Health provides regular support groups and will provide Community Resiliency Model training in summer 2022.
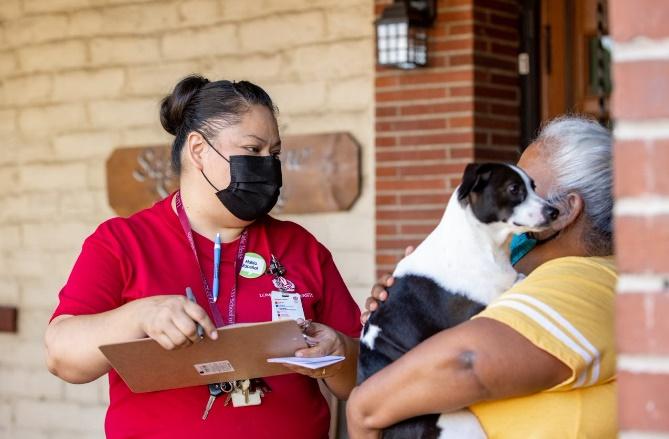
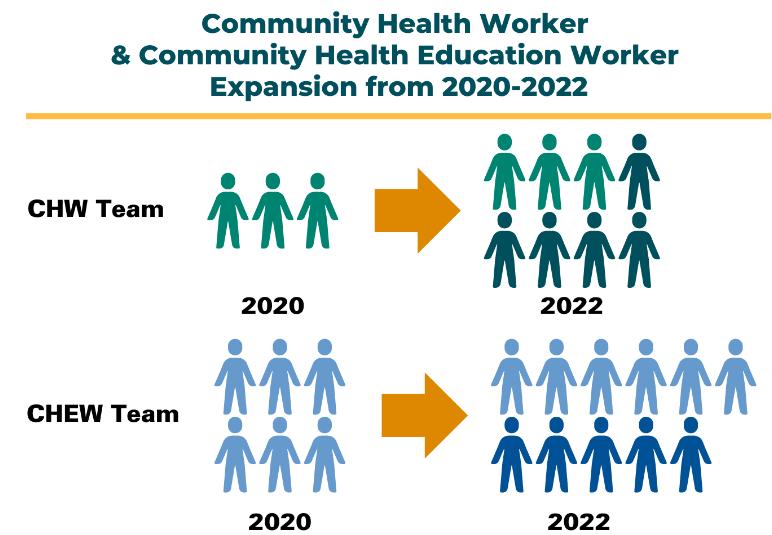
73
LLUH has also invested in funding to support a new Community Health Worker position at FIND Food Bank, a regional food distribution center serving the Inland Empire.
GOAL 2 Increase access to health and wellness resources
2.1 STRATEGY Improve food sovereignty through access to healthy and affordable food options, community gardens, and access to safe green spaces.
MEASURES
• Creation of a community garden in San Bernardino
• Technical assistance to local school districts on partnerships for land use agreements after school to open playgrounds and school yards for exercise and play in communities to increase access to green spaces.
RESULTS
In response to the 2019 CHNA results and identification of a lack of green safe spaces, LLUH created a community garden, Jardin de Salud, in the heart of San Bernardino. Over 30 families are now growing organic produce on-site, with room to grow to a total of 52 family plots. The garden is not only a healthy food access strategy, but also serves as an outdoor community center, fresh produce distribution center, and program to engage students in community service. The established community garden has been supported by Community Benefit funding totaling approximately $160,000 over the last three years.
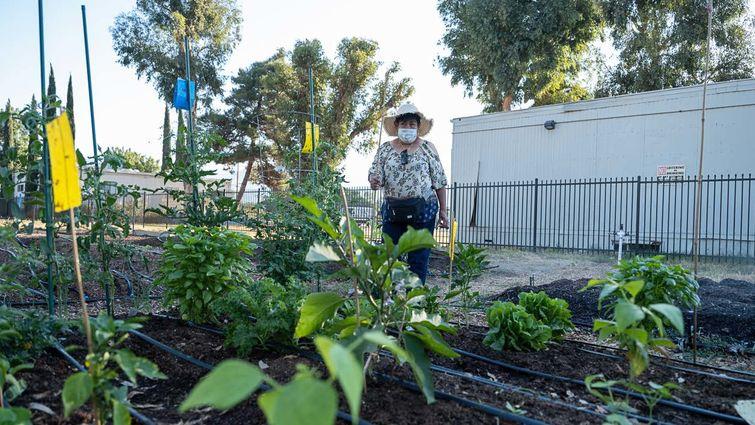
74
This has included funding for the partnership with Huerta del Valle, ongoing maintenance (trash, porta potty’s, etc.), a lighting project, fencing, storage containers and necessary materials.
In addition, LLUH committed to adding additional green spaces in the region. In collaboration with Garcia Center for the Arts, LLUH committed $35,000 to help establish an additional acre of garden space in San Bernardino for workshops and outdoor opportunities. Community partners are critical in aiding these efforts and providing safe outdoor spaces for the community to engage in local discourse and be together.
The COVID-19 pandemic played a major factor in the way the strategy looked and felt. One way it was impacted was the ability to build partnerships with schools given the extended time of school closures. Given this reality, this strategy was forced to pivot and was supplemented by an increased focus on fresh produce disbursement.
Finally, LLUH’s partnerships aided in providing healthy food options to the surrounding community. In partnership with Community Action Partnership of San Bernardino County, over 20,000 food boxes were distributed to local families, which equates to over 240,000 pounds of food. An additional partnership with IEHP led to the disbursement of approximately 2.5 tons of fresh produce (5,000 lbs.) weekly and 55 tons (110,000 lbs.) to date as an ongoing initiative to provide healthy food options and fresh produce directly in the hands of community members.
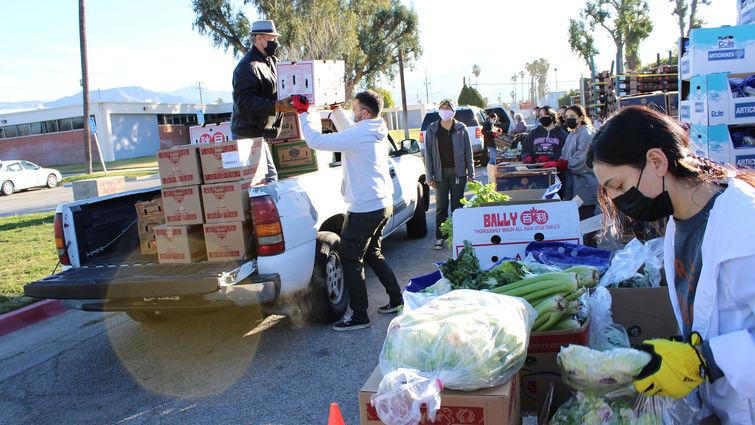
75
2.2 STRATEGY Increase community building and access to mental health resources to decrease social isolation.
MEASURES RESULTS
• # of CHWs focused on mental health
• # of mental health referrals made for community members
LLUH hired four full-time community health workers working exclusively on behavioral health under IEHP grant funding. These community health workers receive referrals from the pediatric and adult therapy teams at both the BMC and the Medical Center’s Emergency Department. Referrals are based on patient PHQ9 scores, the need for a follow-up appointment, and for assistance with Social Determinants of Health. CHWs also focus on working on goal setting as well as using peer counseling and motivational interviewing to address individual and family challenges.
The CHWs have found that there are many rewards and challenges when focusing on BH – especially in patients with acute or chronic symptoms that are uncontrolled. Therefore, a primary goal is to facilitate continued connection with the patient’s clinical teams and their recommendations.
In addition to the CHW’s focused specifically on mental health, this aspect is weaved into the work of every CHW supported by LLUH. The CHEWs who specifically serve SBCUSD and CJUHSD also provide mental health referrals for students. Between the two school districts, there were a total of 104 referrals made over the course of the last 3-year cycle. This connection to mental health support has been a valuable resource for students struggling with this extremely important aspect of overall wellness.
76
2.3 STRATEGY Support healthy lifestyle interventions that reduce chronic diseases.
MEASURES
• # of people served
• $ invested in community
RESULTS
The Parent Health Institute (PHI) is a project developed under the CHEW program to engage school district parents in educational workshops in both English and Spanish on health topics including diabetes, nutrition, and asthma, among others. Topics were selected by parents and the presentations were developed by CHEWs and preventive medicine residents to ensure information was not only factual but also delivered in a culturally competent manner. PHI engaged 136 district families during live sessions and 2,461 community members via Facebook streams.
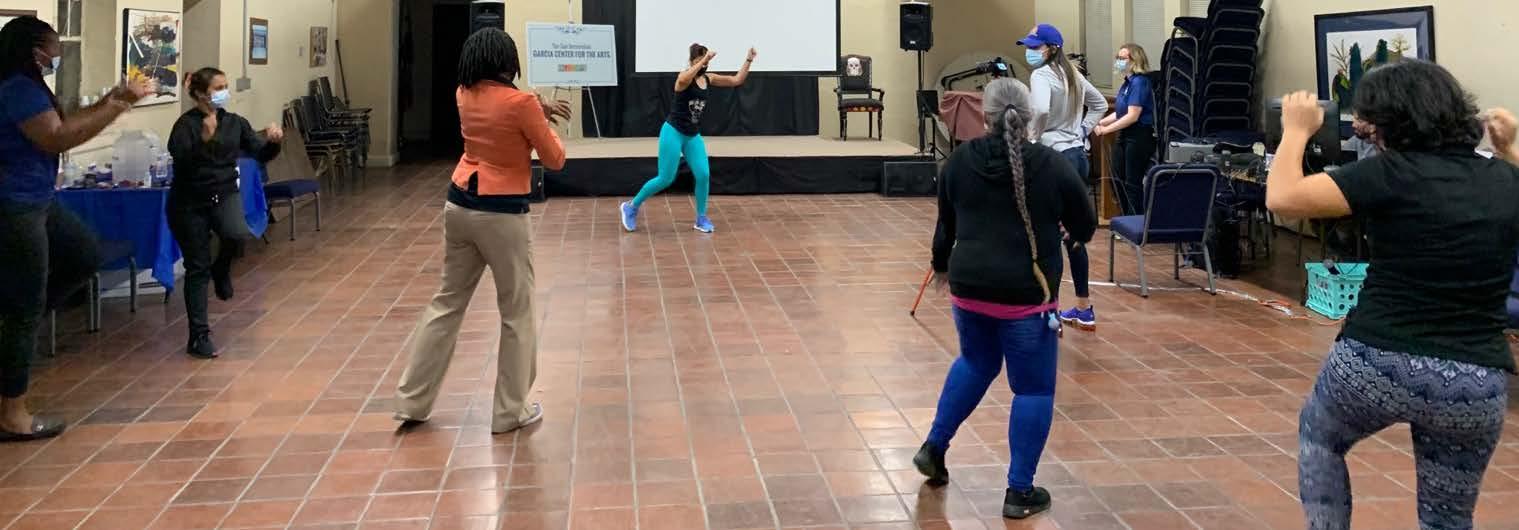
The Produce Rx program aimed to provide the resources and support system needed for community members to make sustainable lifestyle changes. This externally funded program depended on a multidisciplinary coalition building effort among key stakeholders within the community including SAC Health System, LLUH, and the Jardin de Salud. The presence of a CHW in the garden, and even further in a produce prescription program, helped empower participants to improve their health and added value to the health effectiveness of a community garden. Produce Rx supported 15 members with weekly bilingual seminars with subject matter experts, bi-weekly fresh produce boxes, and a safe green space for cooking workshops and exercise.
PossAbilities is one of LLUH’s longstanding Community Benefit programs. It provides a free community outreach program, support group, and healthy social network for individuals with
77
disabilities who were born with or suffer a permanent physical injury. Over the course of the last 3-year cycle, this program has seen record membership with nearly 7,000 members and coordinated events such as the Annual PossAbilities Triathlon, Sickle Cell Disease Support Group and Educational Series, and Limb Loss Running Clinic. Despite in-person setbacks caused by COVID-19, PossAbilities was still able to provide virtual support groups for 1,375 people, food giveaways for 780 households, virtual women’s luncheon for 60 women, sponsor 7 Paralympic athletes, and provide PPE for over 480 households during the peak of the pandemic.
The Stand up to Stigma 5K is a unique community event sponsored by the Loma Linda University Behavioral Medicine Center (LLUBMC). This event is designed to reduce the stigma of mental illness by encouraging community members to participate in the 5K. Held during May (Mental Health Awareness month), the walk creates community dialogue about mental illness to stand up to stigma. While this program faced a 2-year hiatus due to the COVID-19 pandemic, it was back in full force on May 15, 2022, and drew 631 registrants who came to support and raise funds for mental health services.

Camp Good Grief is a 3-day camp experience for children and teens ages 10 to 16 who have had a parent or sibling die. It provides a place and space for children and teens to come together to process in an atmosphere of love and acceptance. Camp activities include grief activity sessions, campfire games, art, ropes course, and group games. While in-person camping was suspended throughout the pandemic, camps are expected to resume in November 2022.
78
How LLUH Responded to the COVID-19 Pandemic
In 2019, few could have imagined the onset of a global pandemic and how lives and communities would be impacted. Relevance and responsiveness are at the core of LLUH’s community engagement. During the last few years, there was continued commitment to serving on the frontlines to help keep the community safe and to turn the tide of this pandemic. Below are some highlights of our COVID-19 pandemic response work that were not anticipated in the FY20-22 Community Health Implementation Strategy.
• We launched one of the largest community COVID-19 vaccination sites in the Inland Empire. The mass vaccination center operated five days per week, 10-12 hours per day from late January through the end of May 2021. More than 43,000 vaccine doses were administered to residents of San Bernardino County and the surrounding community. We drew on the strength of community members, students, faculty, and staff to operate the clinic in a majorityvolunteer capacity.
• LLUH commitment to COVID-19 vaccine equity meant meeting community members where they live and work. Beginning in early February of 2021, LLUH teamed up with trusted organizational partners including the Inland Empire Concerned African American Churches (IECAAC), Congregations for Prophetic Engagement (COPE), and El Sol Neighborhood Educational Center to improve access to life-saving COVID-19 vaccines in minoritized communities that have been hardest hit by the pandemic. Together, these partners have conducted 39 pop-up vaccine clinics, providing more than 3,800 vaccinations in communities across San Bernardino County.
• LLUH faculty served as expert speakers for over 20 community-focused webinars aiming to build vaccine confidence in communities of color disproportionately impacted by the virus.
• Distributed non-perishable food boxes to 20,614 food insecure families at their homes and at local food drives throughout the pandemic.
• Collected breastmilk from 20 COVID-19 positive mothers to deliver to their infants in the Neonatal Intensive Care Unit.
• Developed the Community Care Corps initiative for students, staff, and faculty to collaborate with community members to produce culturally competent COVID-19 messaging.
• We recruited and engaged over 2,500 staff, student, and community volunteers to serve at COVID-19 vaccination clinics, distribute fresh produce to food insecure families, and develop the community garden to provide a safe green space for outdoor activity. These volunteer engagement efforts harnessed the power of community and provided an opportunity to serve at a time when all of us were eager to be a part of the solution.
For a more in-depth look at Community Benefit efforts, please see the Annual Reports at https://lluh.org/about-us/community-benefit/reports-and-resources.
79
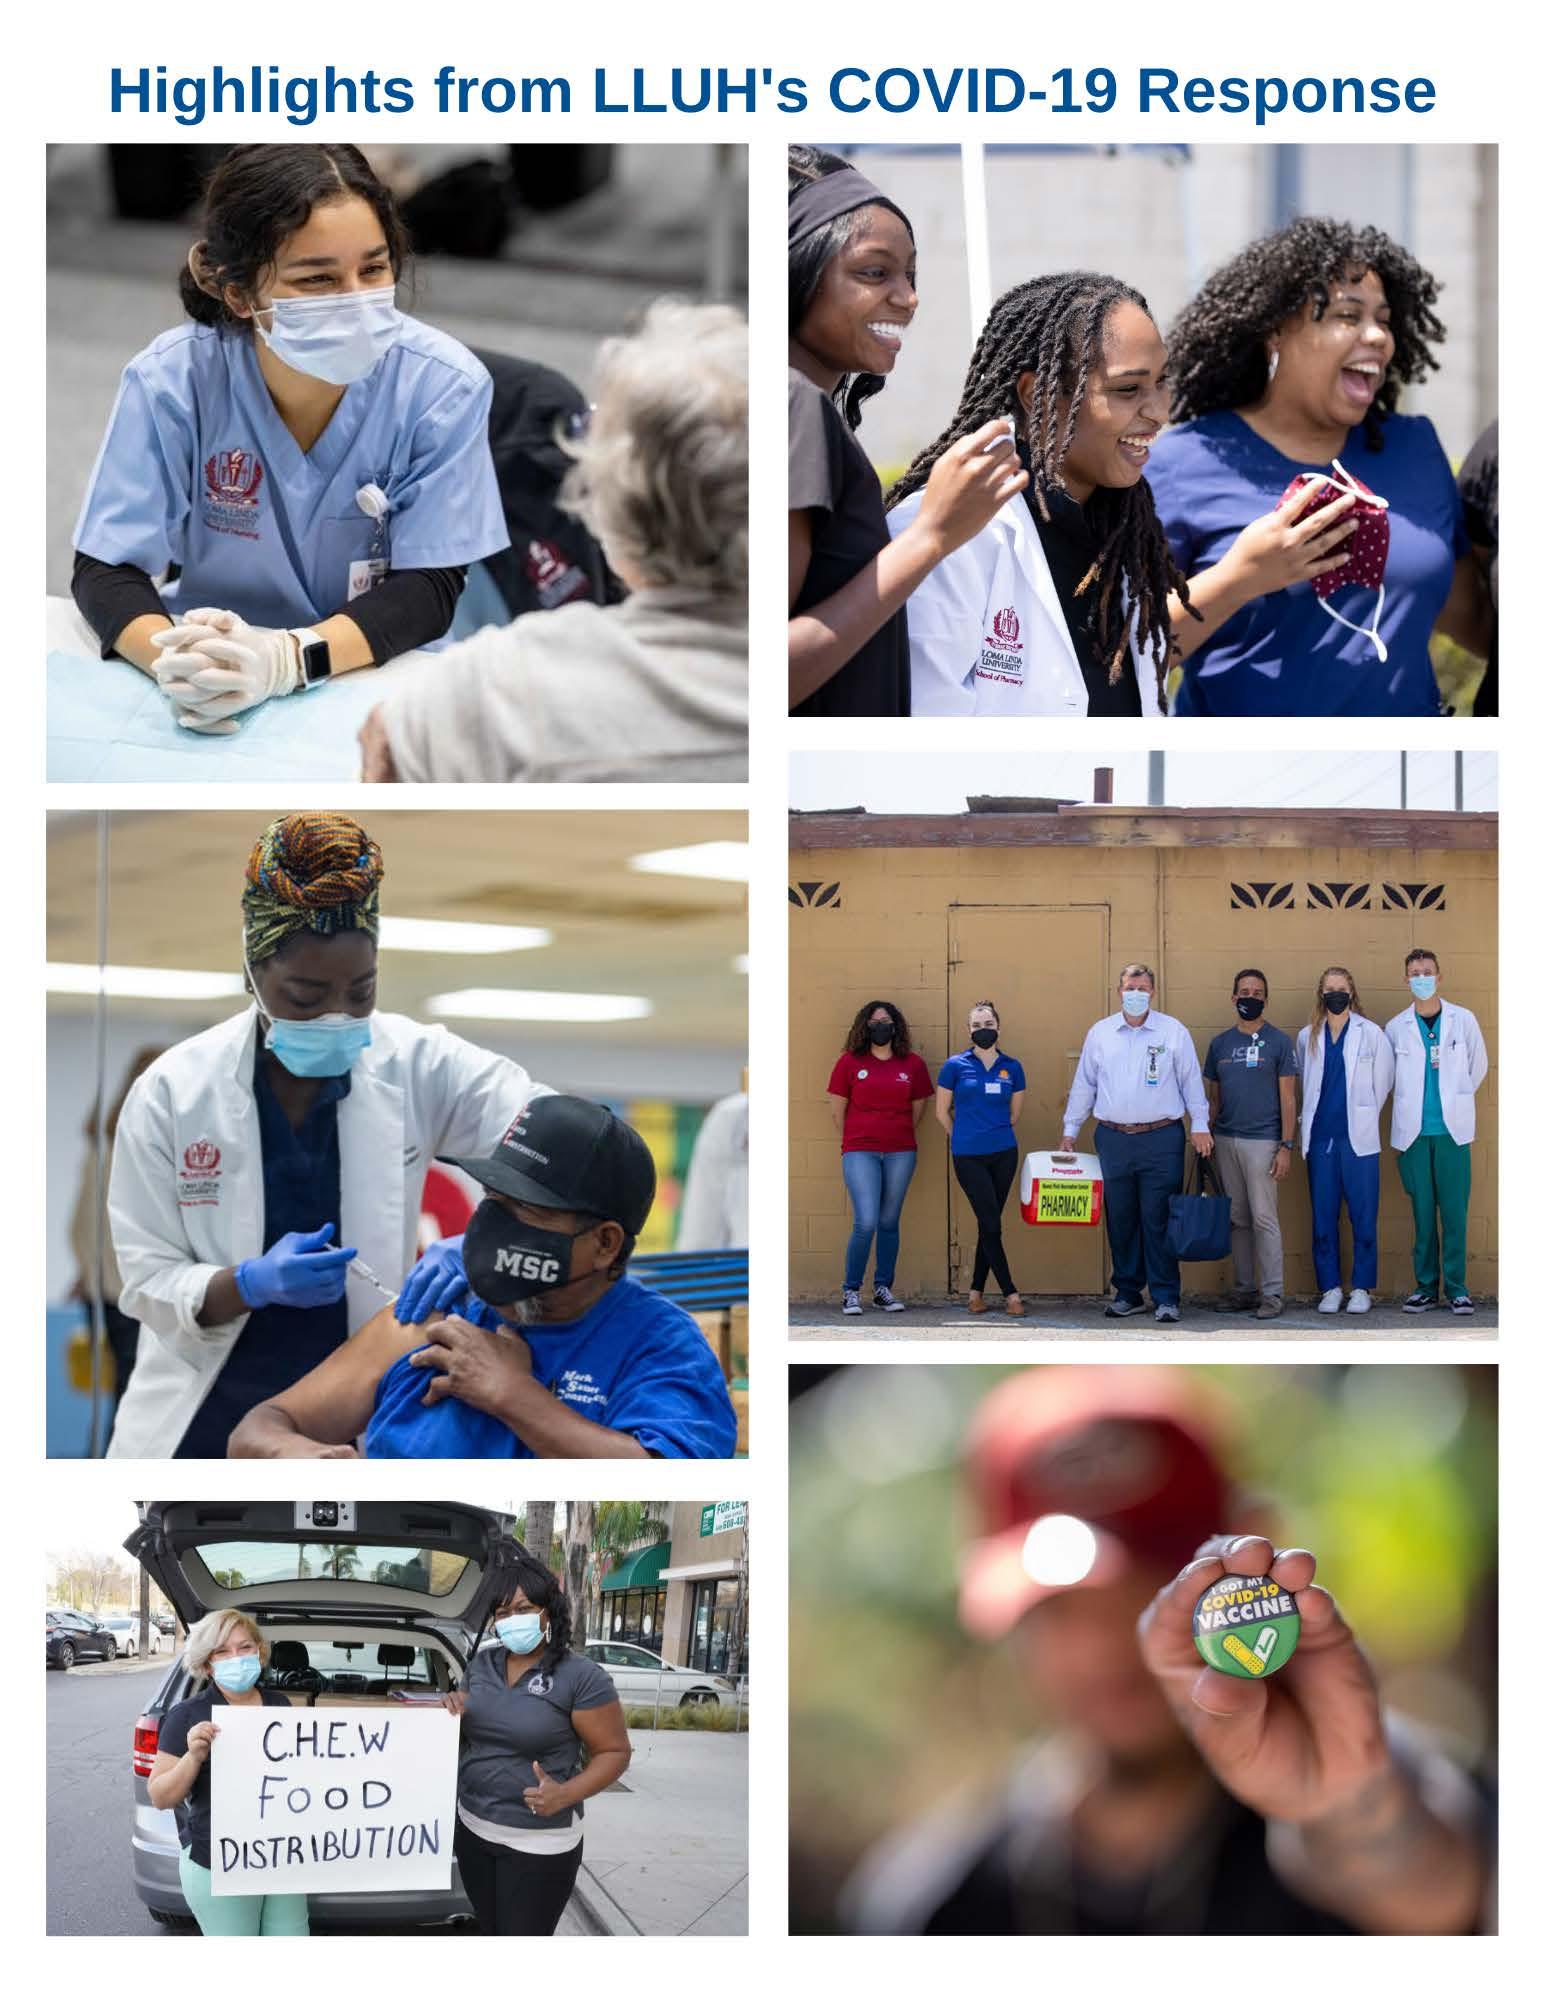
80
Community Benefit Spending and Investments
Total Community Benefit Spending during FY 2020-2022
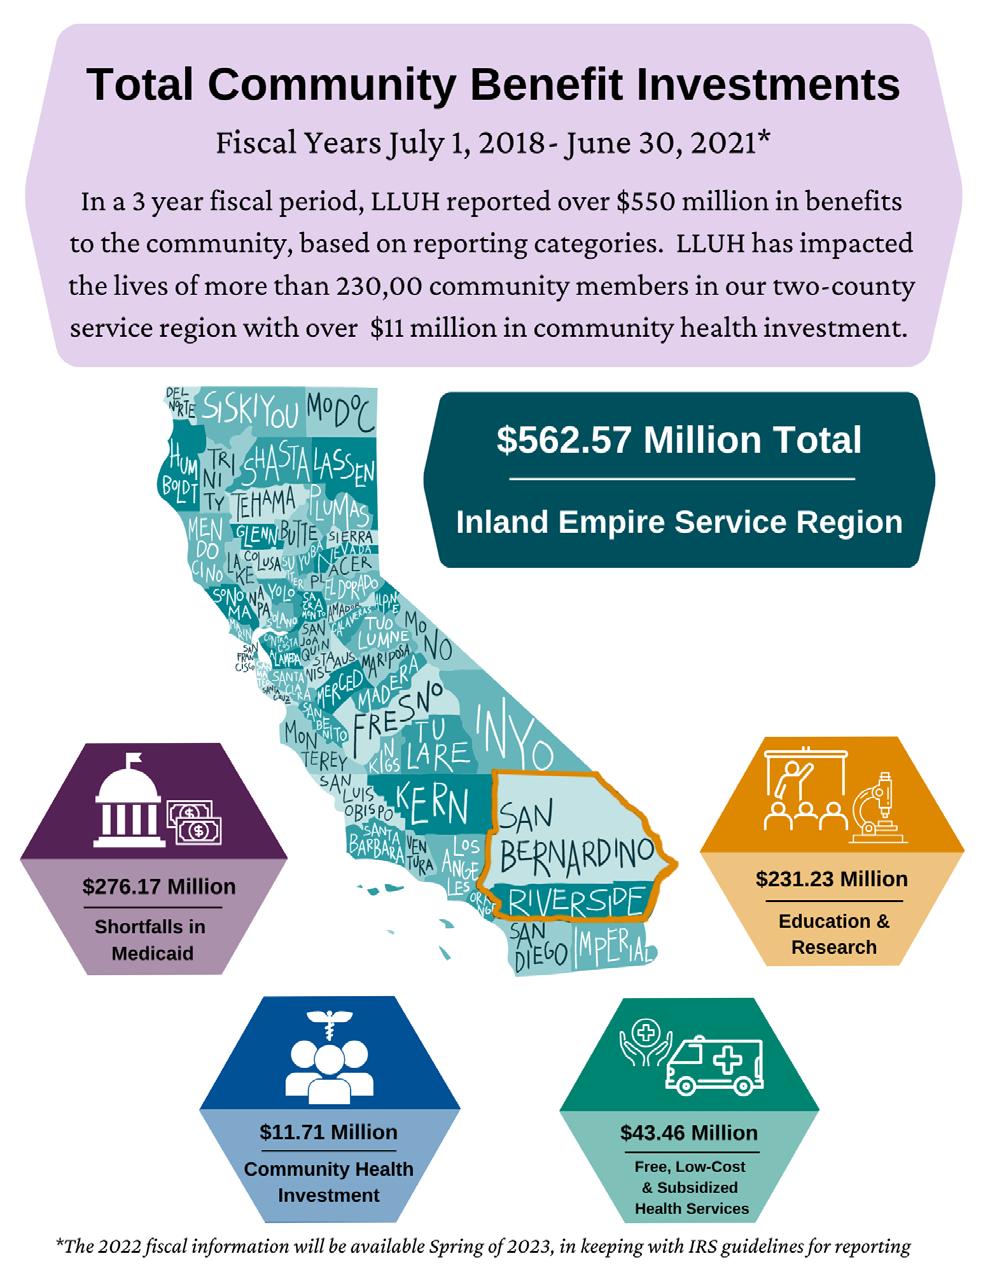
81
Community-Based Partner Investments
LLUH made significant investments in our partner organizations over the FY 2020-2022 funding cycle through grants, investments in capacity-building of local partners, and in-kind contributions of resources to support the operations of local partners who serve our primary community benefit populations.
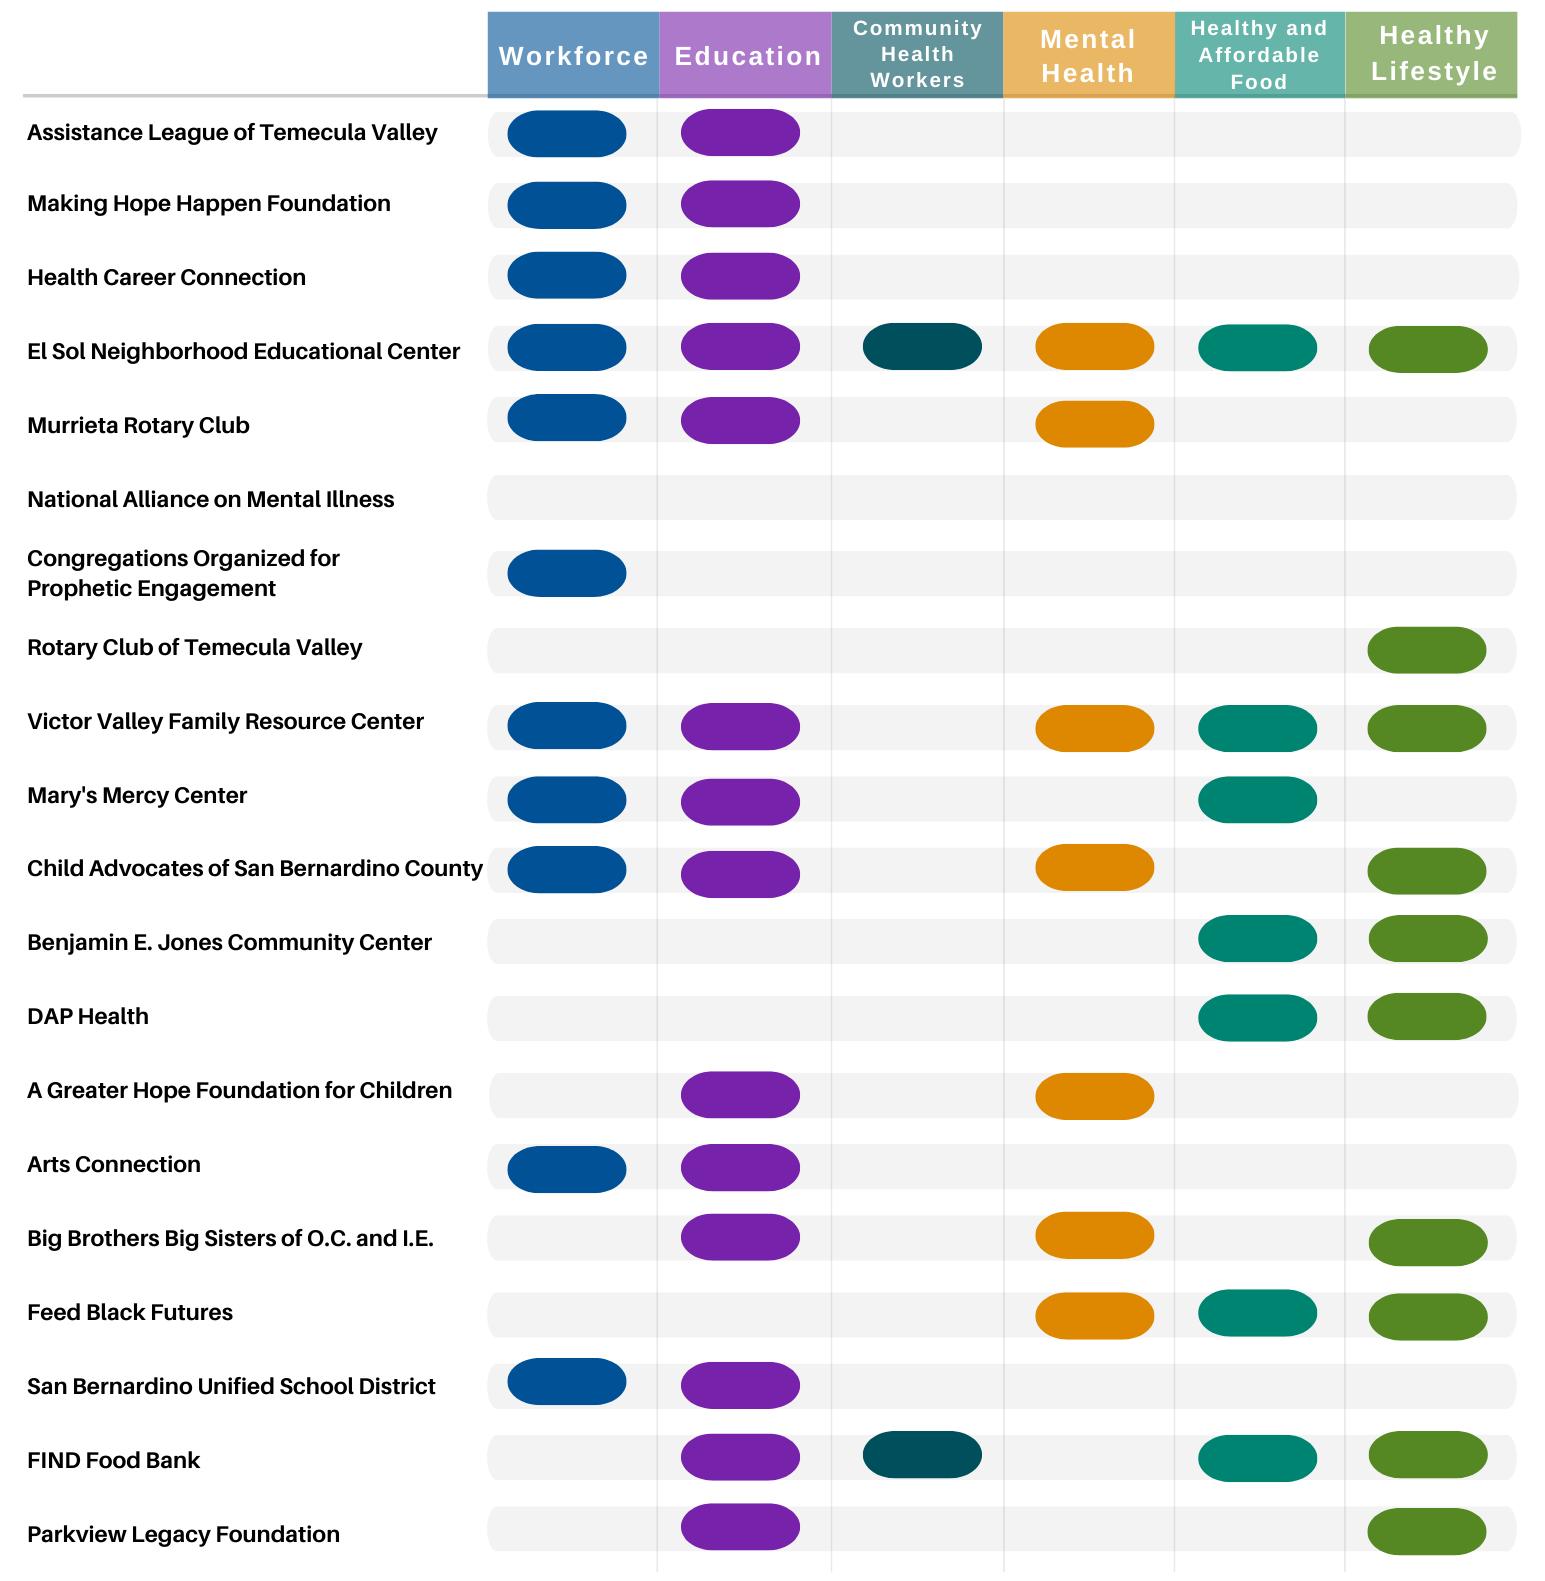
82
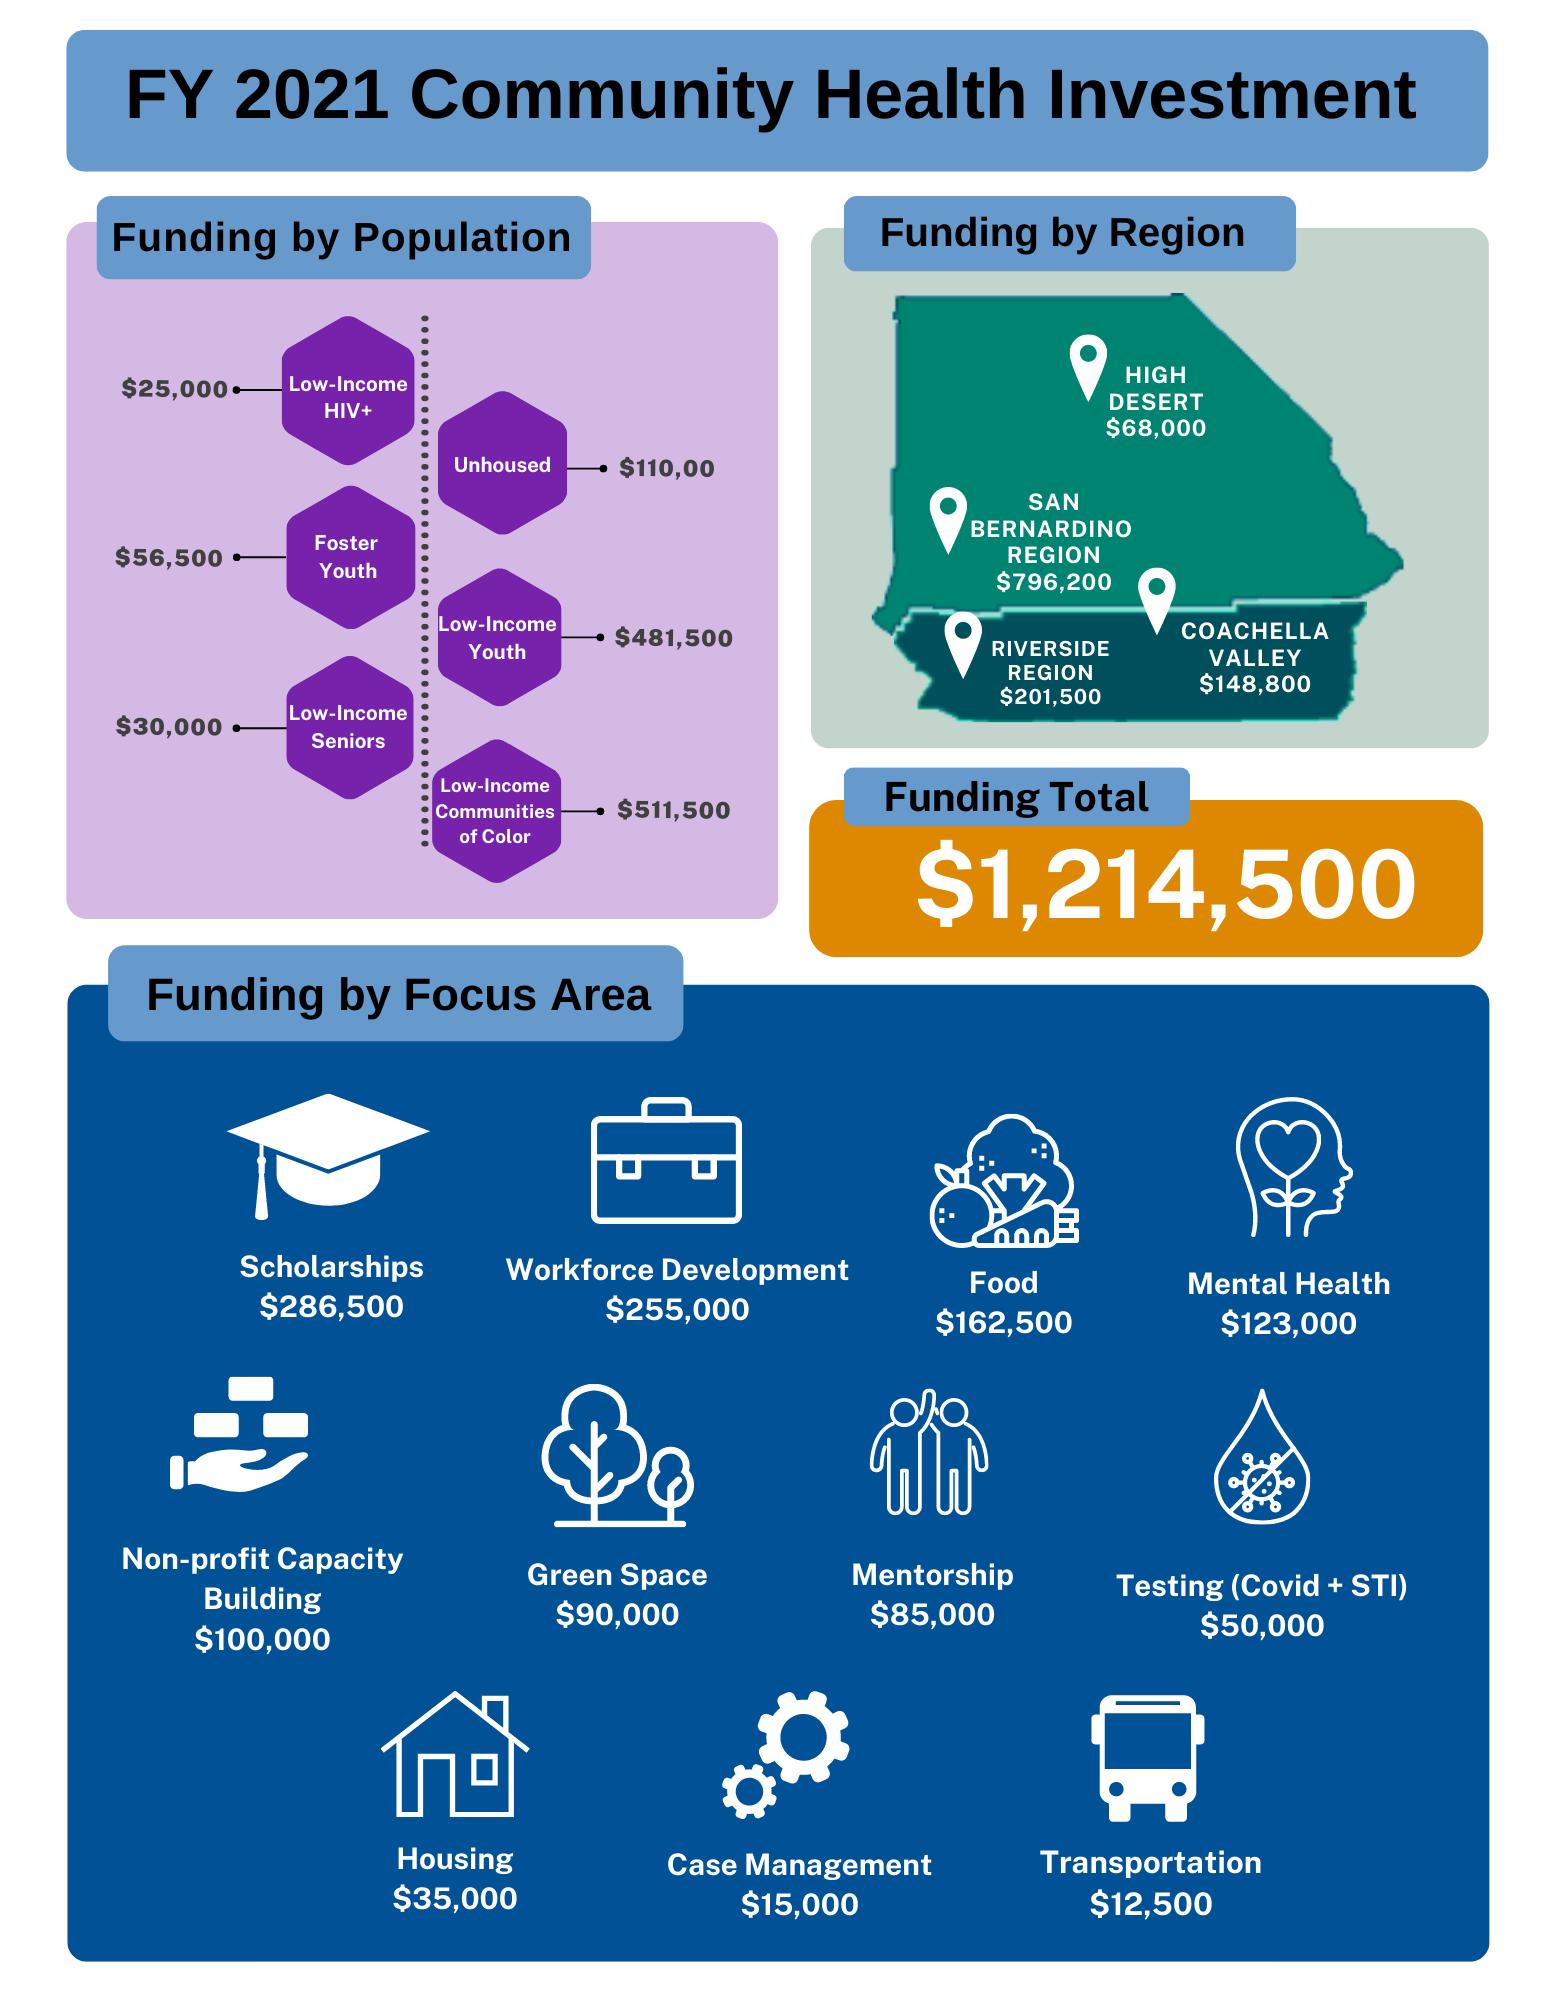
Appendices
A. Acknowledgements
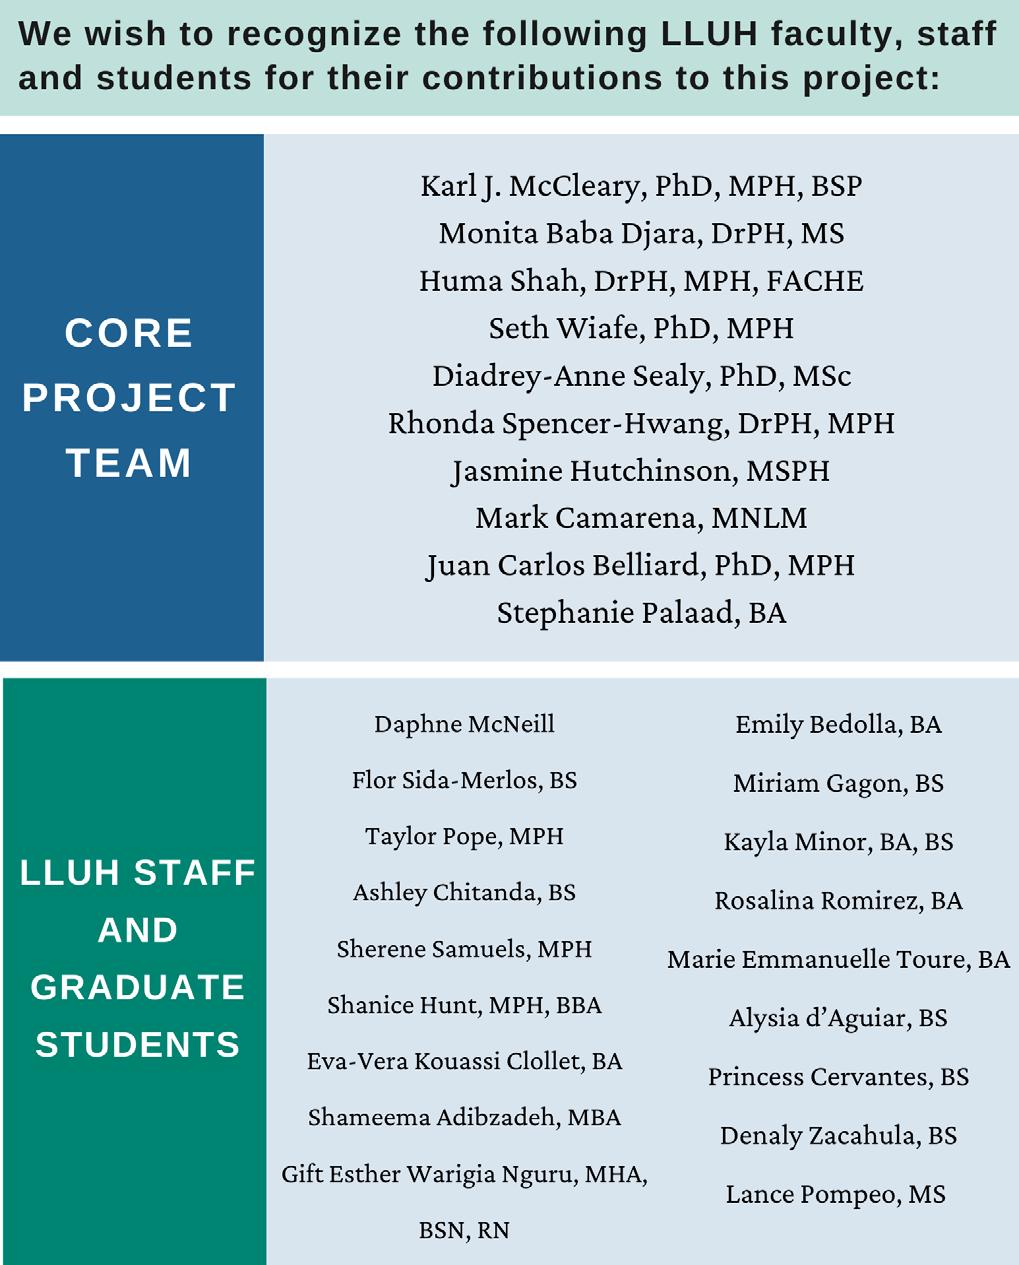
84
B. Health Equity Framework
Guiding the CHNA
CHNA Health Equity Framework [79-83] Element Definition Examples
Key areas for assessment/surveillance
Individual characteristics and behaviors
Drivers of health inequities, needs, and community assets
Biological and behavioral risk factors
Social Determinants of Health include social factors that strongly impact morbidity and mortality
Biology and genetics
Individual health-related behaviors
Housing, food security, transportation needs, economic stability, education, health and healthcare, neighborhood, built environment, social context
Priority areas for community action for achieving health equity
Mind set and Expectations
Making Health a Shared Value
Fostering Cross-Sector Collaboration
Strengthening Integration of Health Systems and Services
Increasing Community Capacity to Shape Equitable Outcomes
Addressing health inequities requires a shift from a traditional disease and health care centered approach towards well-being. Intentional actions centered in the community are essential to creating equitable conditions for health for all
Sense of Community
Civic Engagement
Number and Quality of Partnerships
Investment in Cross-Sector Collaboration
Driver: Policies that Support Collaboration
Access to Care
Consumer Experience
Balance and Integration
Leadership
Community Organizing
Ability to Develop and Sustain Interventions
Characteristics of healthy, equitable communities
Accessibility
Healthy equitable communities
Health, well-being, and equity
A community that provides means for coordinated action to address the social, physical, and mental well-being of all its residents at all stages of life
Affordability
Stability
Diversity
Safety
Equity
Markers of improved population health, well-being, and equity
The assessment and surveillance of health inequities and corresponding community action to meaningfully address inequities contributes to improved population health, equity, and wellness for all.
Enhanced Individual/Community Well-being
Managed Chronic Disease
Reduced Toxic Stress
Reduced Health Care Costs
Healthy Life Expectancy
85
C. References
1. United States Census Bureau, QuickFacts: Riverside County, Los Angeles County, San Bernardino County, CA. . 2021.
2. Lewis, K., Spotlight on the the Inland Empire, in A Portrait of California 2021-2022. 2021.
3. DATA USA, Data USA: San Bernardino County, CA. 2019, DATA USA.
4. Migration Policy Institute, Profile of the unauthorized population: San Bernardino County, CA. 2019, MPI.
5. University of Wisconsin Population Health Institute School of Medicine and School of Public Health, 2022 County Health Rankings National Findings Report. 2022.
6. US News and World Report, Overview of San Bernardino County, CA. 2022, US News.
7. United Nations Development Programme. Human Development Index. 2022; Available from: https://hdr.undp.org/data-center/human-development-index#/indicies/HDI.
8. University of California, Analysis shows the toll of the Pandemic on High-risk Workers. 2021, University of California.
9. Montalvo, M., California's new benefits for undocumented immigrants are not enough, workers say, in CalMatters. 2022, CalMatters.
10. United Ways of California. The Real Cost Measure in California 2021. Available from: https://www.unitedwaysca.org/realcost.
11. United Ways of California, The Real Cost Measure in California 2021 Inland Empire. 2021.
12. San Bernardino County Wire. Board adopts resolution declaring racism a public health crisis. 2020; Available from: https://wp.sbcounty.gov/cao/countywire/?p=7742.
13. RivCo Now County of Riverside, Board of Supervisors vote 5-0 to declare racism as a public health crisis. 2020, County of Riverside.
14. Robert Wood Johnson Foundation, County Health Rankings & Roadmaps San Bernardino, CA. 2022.
15. Robert Wood Johnson Foundation, County Health Rankings & Roadmaps: Riverside, CA. 2022.
16. Center for Disease Control and Prevention, Underlying Cause of Death. 2020, CDC.
17. Center for Disease Control and Prevention National Center for Health Statistics. 10 Leading Causes of Death by Age Group, United States. 2018; Available from: https://www.cdc.gov/injury/wisqars/pdf/leading_causes_of_death_by_age_group_2018508.pdf
18. California Department of Public Health Death Statistical Master Files. Death Rate by Age Group and Cause. 2020; Available from: https://www.kidsdata.org/topic/659/childdeathrate-agecause/table#fmt=2318&loc=1,2&tf=120&ch=1307,1309,446,1308,530,531,533,532,975,534,529&sor tColumnId=0&sortType=asc
19. The Commonwealth Fund, Maternal Mortality in the United States: A Primer. 2020.
20. Kaiser Family Foundation, Racial Disparities in Maternal and Infant Health: An Overview. 2020.
21. Burgess, A.P.H., et al., Pregnancy-related mortality in the United States, 2003–2016: Age, Race, and Place of death. 2020. 222(5): p. 489.e1-489.e8.
22. Center for Disease Control and Prevention: National Center for Chronic Disease Prevention and Health Promotion (NCCDPHP). Infant Mortality. 2021; Available from: https://www.cdc.gov/reproductivehealth/maternalinfanthealth/infantmortality.htm
86
23. Center for Disease Control and Prevention National Center for Health Statistics. Infant Mortality Rates by State. 2020; Available from: https://www.cdc.gov/nchs/pressroom/sosmap/infant_mortality_rates/infant_mortality.htm
24. March of Dimes, Mortality and Morbidity: San Bernardino. 2019, March of Dimes.
25. March of Dimes, Mortality and Morbidity: Riverside and San Bernardino. 2019.
26. March of Dimes, Preterm Birth. 2020, March of Dimes.
27. March of Dimes, Prenatal Care. 2020, March of Dimes.
28. Dignity Health, Community Need Index. 2021.
29. San Bernardino County, Community Indicators Report. 2020.
30. California Health Care Foundation, California Physicians: A Portrait of Practice. 2021.
31. California Health Care Foundation, Shortchanged: Health Workforce Gaps in Riverside & San Bernardino Counties. 2020.
32. Mental Health America, COVID-19 and Mental Health: A Growing Crisis. 2021.
33. National Institute of Health, More than 140,000 U.S. children lost a primary or secondary caregiver due to the COVID-19 pandemic. 2021, NIH.
34. Center for Disease Control and Prevention. Facts about Suicide. 2022; Available from: https://www.cdc.gov/suicide/facts/index.html.
35. Mental Health America. The State Of Mental Health In America. 2022; Available from: https://www.mhanational.org/issues/state-mental-health-america
36. Office of Disease Prevention and Health Promotion. Reduce the suicide rate - Mental Health and Mental Disorders. 2022; Available from: https://health.gov/healthypeople/objectives-anddata/browse-objectives/mental-health-and-mental-disorders/reduce-suicide-rate-mhmd-01.
37. California Department of Public Health, California Overdose Surveillance Dashboard. 2022.
38. Riverside County Overdose Data to Action, Riverside County, CA - Overdose Dashboard. 2021.
39. Center for Disease Control and Prevention National Center for Health Statistics, Drug Overdose Deaths in the U.S. Top 100,000 Annually. 2021, CDC.
40. University of Wisconsin Population Health Institute School of Medicine and School of Public Health, Social and Economic Factors. 2022.
41. United States Census Bureau, QuickFacts California; Riverside County, California; San Bernardino County, California. 2021, United States Census Bureau.
42. California Newsreel. Unnatural Causes: In Sickness and In Wealth 2008; Available from: https://unnaturalcauses.org/episode_descriptions.php?page=1.
43. Education Data Partnership. San Bernardino County. 2021; Available from: https://www.eddata.org/county/San-Bernardino/
44. United States Census Bureau, American Community Survey: Poverty Status in the Past 12 Months. 2020, United States Census Bureau.
45. McConnell, R., et al., Traffic, susceptibility, and childhood asthma. Environ Health Perspect, 2006. 114(5): p. 766-72.
46. United States Census Bureau, QuickFacts: San Bernardino County, California. 2020, United States Census Bureau,.
47. California Housing Partnership, San Bernardino County 2020 Affordable Housing Needs Report 2020.
48. The US Department of Housing and Urban Development, The 2020 Annual Homeless Assessment Report (AHAR) to Congress. 2020.
87
49. San Bernadino County, Community Indicators: Homelessness and Housing Insecurity. 2020.
50. Brauer, M., et al., Air pollution and development of asthma, allergy and infections in a birth cohort. Eur Respir J, 2007 29(5): p. 879-88.
51. Edwards, J., S. Walters, and R.K. Griffiths, Hospital admissions for asthma in preschool children: relationship to major roads in Birmingham, United Kingdom. Arch Environ Health, 1994. 49(4): p. 223-7.
52. Chen, E., et al., Chronic traffic-related air pollution and stress interact to predict biologic and clinical outcomes in asthma. Environ Health Perspect, 2008. 116(7): p. 970-5.
53. Richard Coelho, S.F., Forrest McKnight, Sam Matteson, and Travis Schwartz, The Effects of Early Chronic Absenteeism on Third-Grade Academic Achievement Measures. University of WisconsinMadison. 2015, Robert M. La Follette School of Public Affairs. University of Wisconsin - Madison. p. 42.
54. Hammond, C., et al., Dropout Risk Factors and Exemplary Programs: A Technical Report. 2007, National Dropout Prevention Center. p. 282.
55. Needham, B.L., R. Crosnoe, and C. Muller, Academic Failure in Secondary School: The Inter-Related Role of Health Problems and Educational Context. Soc Probl, 2004. 51(4): p. 569-586.
56. California Department of Education, Dashboard Additional Report - Graduation Rate : San Bernardino County Office of Education (San Bernardino County, CA). 2021.
57. San Bernadino County Superintendent of Schools, The California Schools Dashboard: San Bernardino County Districts Overview. 2021, SBCSS-ODP.
58. California Department of Education, Data and Statistics. 2020, CDE.
59. California Child Care Resource and Referral Network California Child Care Portfolio, Availability of Child Care for Working Families. 2020.
60. California Department of Education, Local Planning Councils (LPCs) Priorities: Priority Areas for Childcare. 2021, CDE.
61. Phillips, S.A., Inland Empire Warehouse Growth Map Environment. 2022, LA Times.
62. American Lung Association, State of the Air 2022.
63. Environmental Protection Agency, Air Quality Index Report. 2021, EPA.
64. Torres, I., A. Victoria, and D. Klooster, Warehouses Pollution and Social Disparities,. 2021.
65. US News and World Report, Healthiest Communities: How They Were Ranked. 2021, US News and World Report.
66. American Lung Association. American Lung Association: Asthma & Children Fact Sheet. 2011; Available from: http://www.lung.org/lung-disease/asthma/resources/facts-and-figures/asthmachildren-fact-sheet.html
67. Newcomb, P. and J. Li, Predicting admissions for childhood asthma based on proximity to major roadways. J Nurs Scholarsh, 2008. 40(4): p. 319-25.
68. Andersson, M., et al., Heavy vehicle traffic is related to wheeze among schoolchildren: a populationbased study in an area with low traffic flows. Environ Health, 2011. 10: p. 91.
69. McConnell, R., et al., Childhood incident asthma and traffic-related air pollution at home and school. Environmental health perspectives, 2010. 118(7): p. 1021-1026.
70. UCLA Center for Health Policy Research, Children Ever Diagnosed with Asthma. 2020.
71. Spencer-Hwang, R., et al., Respiratory Health Risks for Children Living Near a Major Railyard. J Community Health, 2015. 40(5): p. 1015-23.
72. San Bernardino County Public Health, COVID-19 Response. 2022, SBCPH.
88
73. Riverside University Health System, Riverside County COVID-19 Indicators. 2022.
74. Hillis, S.D., et al., Global minimum estimates of children affected by COVID-19-associated orphanhood and deaths of caregivers: a modelling study. Lancet, 2021. 398(10298): p. 391-402.
75. Shenfeld, H., Heart Palpitations, Eczema and Judgment: Parents Speak Out on 'Exhausting' Toll of COVID Stress. 2022, People.
76. San Bernadino County Public Health, Deaths. 2021, San Bernardino County Public Health.
77. Thriving. Thriving Together. 2022; Available from: https://thriving.us/
78. Barilla, D. and P. Batra, Regional Community Health Assessment: Stakeholder Meeting. 2022.
79. Givens, M.L., et al., What Do We Know About the Drivers of Health and Equity? A Narrative Review of Graphic Representations. National Library of Medicine 2020. 4(1): p. 446–462.
80. Bay Area Regional Health Inequities Initiative, Applying Social Determinants of Health Indicator Data for Advancing Health Equity: : A Guide for Local Health Department Epidemiologists and Public Health Professionals Oakland, CA. 2015.
81. A, P., M. C, and T. M. Moving Forward Together: An Update on Building and Measuring a Culture of Health. 2018; Available from: https://www.rwjf.org/en/library/research/2018/05/movingfoward-together an-update-on-building-and-measuring-a-culture-of-health.html
82. National Academies of Sciences, E., and Medicine, Communities in Action: Pathways to Health Equity, ed. A.G. James N. Weinstein, Yamrot Negussie, and Alina Baciu. 2017: The National Academies Press. 582.
83. Choudhary, T.S., et al., Health equity impact of community-initiated kangaroo mother care: a randomized controlled trial. Int J Equity Health, 2021. 20(1): p. 263.
89
