ARCHITECTURAL ENGINEERING PORTFOLIO
LUPAMUDRA CHETIA
A dynamic architectural engineer deeply passionate about energy conservation and sustainable design. With a keen focus on utilizing advanced software tools, transforming architectural concepts into environmentally responsible structures. Proficient in BIM, CFD, and energy simulation software, optimizing designs for energy efficiency. Highly self-motivated, confident and professional individual,I believe hardwork, dedication and teamwork is important to achieve success.

Date of Birth - 27 Nov, 1994
Nationality - Indian
Contact 17 Martin Luther King Close, Huntingdon, Cambridgeshire, UK
Emaillupamudra.chetia@mail.polimi.it chetialupamudra27@gmail.com
Phone+44 7741779492
LinkedInwww.linkedin.com/in/lupamudra-chetia
LUPAMUDRA CHETIA
Education
Masters in Building and Architecture Engineering
Politecnico Di Milano, Lecco, Italy
Bachelors in Architecture
National Institute of Technology, India
Relevent Experience
Teaching Assistant, SUSTAINABLE MULTIDISCIPLINARY DESIGN
PROCESS, Architectural Engineering, Politecnico Di Milano (September, 2022 - February, 2023)
Tasks and Responsibilities:
• Assisting in Classroom Management
• Grading and Assessment
• Team Management
• Assisting with Course Materials
• Proctoring Exams
• Mentoring and Advising
Top Rated Freelancer, Upwork (2021 - Present)
My work covers :
• Architectural Design
• Construction Drawings
• Interior design
• Material Specifications
• Landscape Design
• 3D Visualisation
Junior Architect, Studio Recalcati, Milan, Italy (2022)
Tasks and Responsibilities:
• Architectural Design
• 3D Visualisation
• Interior design
• Construction Drawings
Junior Architect, FTN World, Haldwani, India (2018 - 2019)
Tasks and Responsibilities:
• Architectural Design
• Site Supervision
• Dealing with Clients
• Management and procurement of materials
• Market Study
Skills and Achievements
Construction life Cycle Assesment - “One Click LCA
Construction LCA Bootcamp”One Click LCA - 2023
Leadership Certificate - Presented by Politechnico Di Milano for civic services and excellence in pursuit of personal and leadership development
“LOL Landscape Off Limits, 2021”
International Intensive Virtual Workshop,2nd edition , Piacenza post-COVID
“Collaborative and Humanitarian Mapping , 2021” under Passion In Action innovative teaching program
Exposure programme of Laurie baker Philosophy in architecture and building technology (2015)
Competitions
Andc (2014) - Entry selected in top 22
Andc (2015) - Re evolution
Entry selected for nasa, 16.
Nasa (2015) - Hudco
Awarded 2nd citation
Nasa (2016) - Hudco
Redesigning a public space
Languages
English - Advanced Level
Italian - Basic Level
Hindi - Advanced Level
Assamese - Mother tongue
Bengali - Intermediate Level
Soft Skills
Handling Leadership roles
Adaptive Agility
Innovative Problem-Solving
Collaborating within diverse group
Analytical Critical Thinking
Skilled Conflict Resolution
Clear communications
Strategic Time Management
Meticulous Attention to Detail
Softwares
Energy SoftwaresSefaira
IES
Transys
Climatestudio Grasshopper
Drafting/BIMAutocad REVIT
Modelling/ Rendering -
SketchUp
Rhino
Lumion
Twinmotion
Enscape
Unreal Engine
PresentationIndesign
Photoshop
Illustrator
Premiere Pro
OtherQGIS
Microsoft Office Suite
Kind Words
“I was looking for someone to work with on the long term and I think I found the right one! She is amazing, creative, and always accomodate to her customer’s need! I cant wait to bring in more projects!”
-Upwork Client, Canada
“Lupamudra is attentive and enthusiastic to detail. She is friendly, engaging & works to a timely schedule.”
-Upwork Client, Australia
4
CONTENTS 02. INFORMAL IS THE NEW NORMAL 01. HOME FOR LIFE 04. CONNECT 03. THE COAST
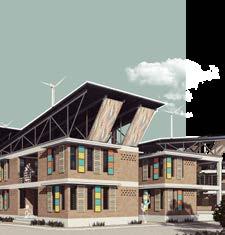
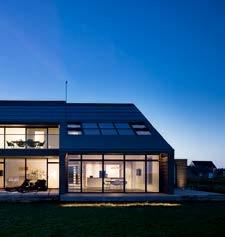
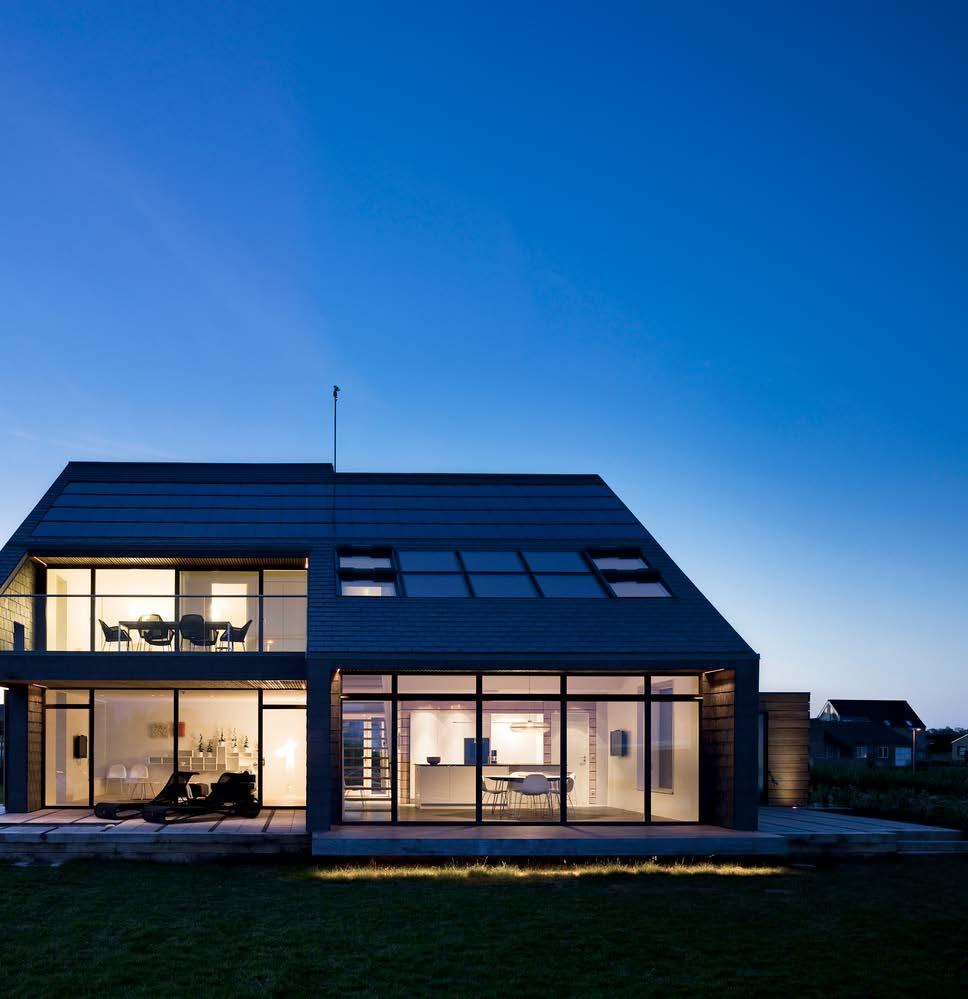
HOME FOR LIFE
ENERGY OPTIMIZATION
Location - Lystrup, Denmark
Type of Building - Residential

Functional Unit - Active House
Area - 200 sq m
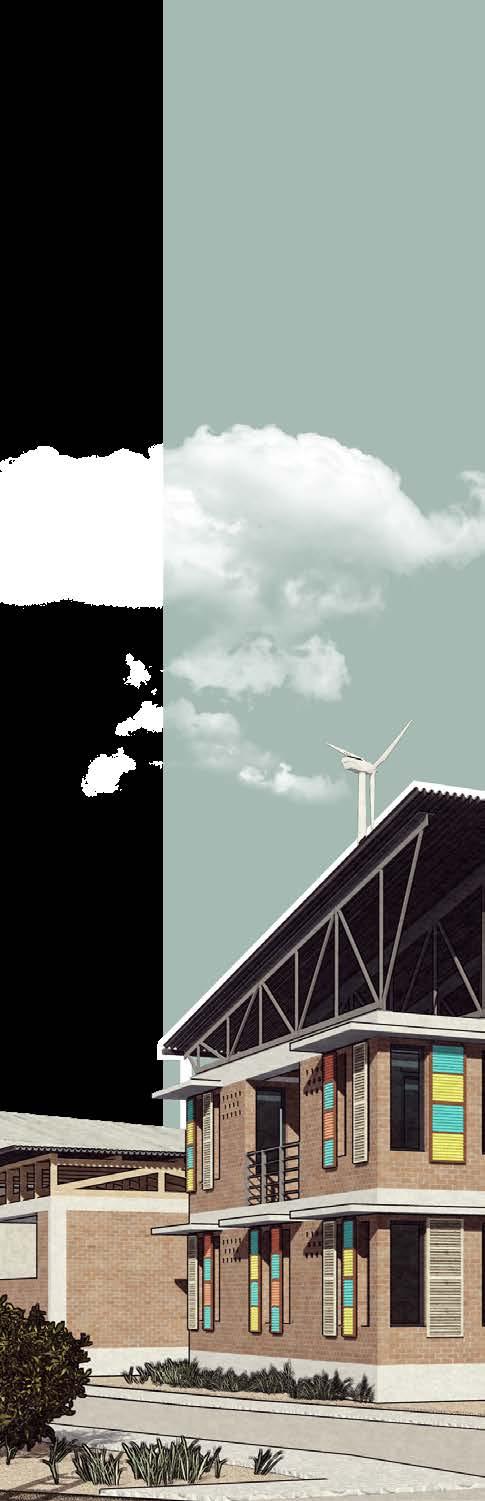
Home for Life, the case of study of this report, follows a design House principles. With its design, orientation and materials, little energy as possible and to utilise forms of renewable the local energy supply and structure. It covers all of its energy solar energy and converting it into heat and electricity through and advanced technology – making the house CO2-neutral.
The building efficiency was to be analysed based on different passive and active systems with the least possible energy consumption
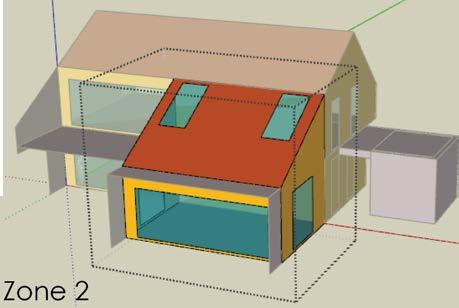
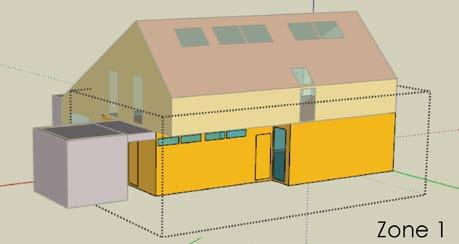
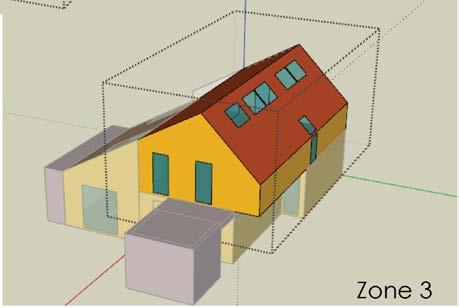
Thermal Zone 3
Thermal Zone 1
Thermal Zone 2 Thermal Zone 2
Thermal Zone 3
Thermal Zone 1
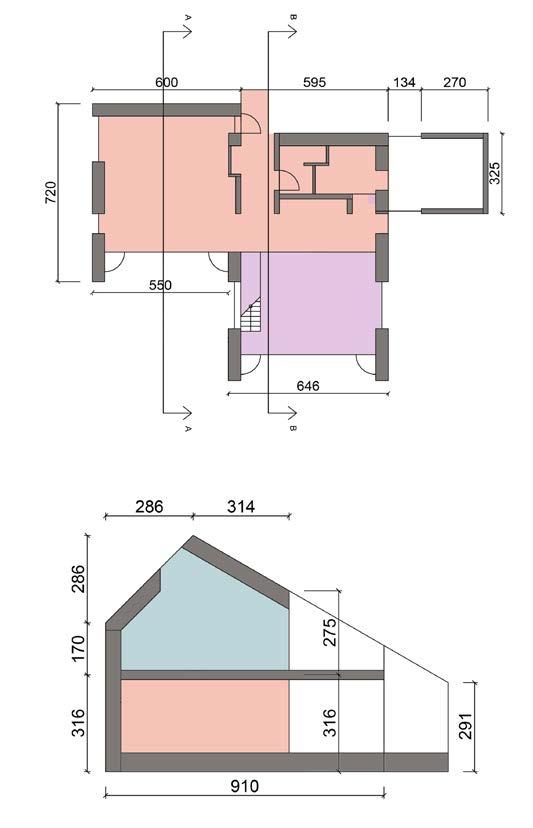
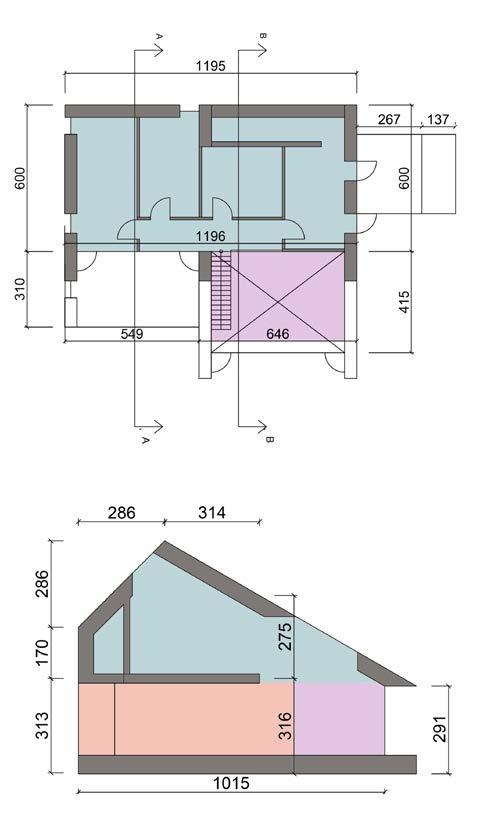
FLOOR PLANS AND SECTIONS
Thermal Zone 3
Thermal Zone 1
Thermal Zone 2
6 01
Ground Floor
Section A-A’
First Floor
Section B-B’
design process that complies the Active materials, Home for Life is optimised to use as renewable energy. The house interacts with energy requirements primarily by collecting through a combination of natural solutions CO2-neutral. different envelope, climate, and different consumption and higher Energy Class.
7
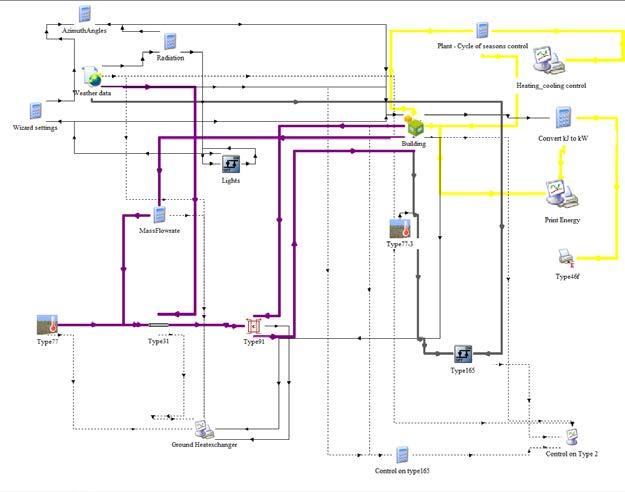
TRNSYS MODELLING
To explain the modelling process are here reported by screenshot. The first step is to use the ‘TRNSYS3D’ plugin for SketchUp. In these screenshots it is possible to see the building compeletely modeled. Thanks to the plugin it was possible to assign specific informations of the building to each technical element like: walls, roofs, floors and windows, created in trnsys zone in SketchUp as a simple surface. The model divided in three different Thermal zones , as specified in the building information. Each thermal zone has similar thermal features. For each surface of the different thermal zones it has been set-up the boundary conditions , if adjacent with other surfaces, or in contact with exterior. This allows to to the program to understand the behaviour of the different zones relating to external temperature.

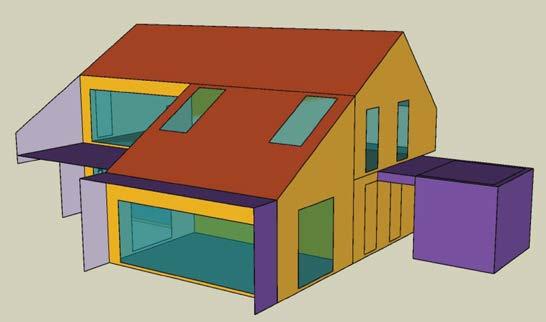
Model in Trnsys
The screenshots below show an example of workflow in TRNBuild for Dyanamic Shading + Mechanical Ventilation ( Air to Ground Heat Exchanger without Heat Recovery)
The design procedure includes identifying the input parameters which are known to the user and the parameters affecting desired design output. Once the design output is fixed, the heat transfer equations are manipulated to meet the desired output in terms of input parameters.
8
TRNSYS TRNBuild
PHASES OF SIMULATION - LOCATION : ATHENS
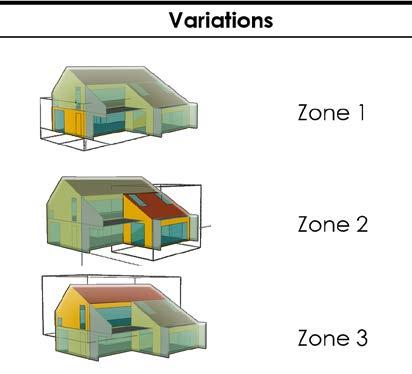
Phase 0 - Zone Selection
This simulation was conducted with the aim to understand which thermal zone influences more the energy balance, in order to focus later only on the parameters.From the analysis it emerges that the thermal Zone 2 is the most influential one. This thermal zone coincides in the volume in the front of the house, on the southern side, which is the kitchen area and the living room.
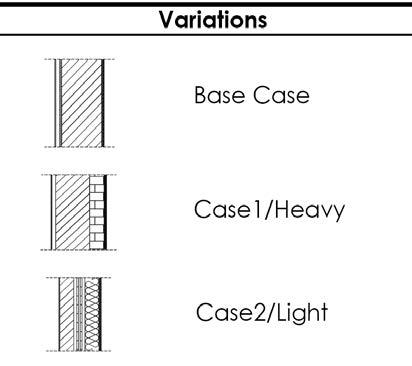
Phase 1 - Envelope Selection
The first analysis was made to compare different technologies related to the Athens climate. The three wall layerings involved are called: “Base”, “Heavy(Case1)” and “Light(Case 2)”. The base case is the default layering of the project while the heavy and light technology are diversified in terms of thermal mass, time shift and attenuation; the U values are almost identical for all the solutions. The results show the Heavy Case to be the best for the rest of the simulations.
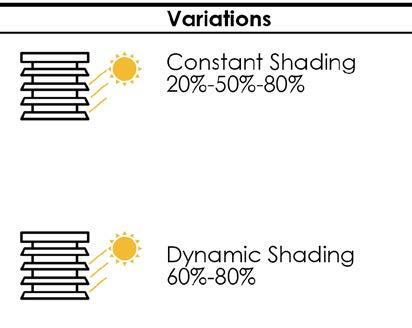
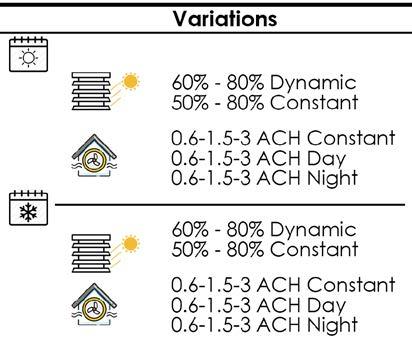
Phase 2 - Shading
The second step of the passive optimization has the aim to understand and choose the best shading system. Divided into two steps, the first being the comparison of only constant - 20%, 50% and 80% and the second step being the comparison of the best constant shading with dynamic 60% and 80%. Comparing the summer comfort - 80% dynamic shading is chosen. So, from this phase onwards the shading in summer is taken to be 80% dynamic with a schedule of 08.00-18:00.
9 2.44% 3.48% 9.50% 1.43% 2.55% 3.79% 2.69% 3.08% 4.70% 93.44% 90.89% 82.01% 0% 20% 40% 60% 80% 100% CONSTANT 50% DYNAMIC 60% DYNAMIC 80% COMFORT - COOLING SEASON CLASS-A CLASS-B CLASS-C DISCOMFORT
0.00 10.00 20.00 30.00 40.00 50.00 60.00 JAN FEB MAR APR MAY JUN JUL AUG SEP OCT NOV DEC Temperature ° C) ANNUAL TEMPERATURE OUTSIDE TEMPERATURE ZONE 1 ZONE 2 ZONE 3 0.00 10.00 20.00 30.00 40.00 50.00 60.00 70.00 80.00 JAN FEB MAR APR MAY JUN JUL AUG SEP OCT NOV DEC Relative humidity [%] ANNUAL RELATIVE HUMIDITY OUTSIDE RH ZONE 1 ZONE 2 ZONE 3 EN-15251 MODEL 12.97% 13.23% 13.14% 7.16% 7.16% 7.33% 6.39% 6.92% 6.95% 73.48% 72.69% 72.58% 0% 20% 40% 60% 80% 100% BASE CASE CASE 1- Heavy CASE 2- Light ANNUAL COMFORT CLASS A CLASS B CLASS C DISCOMFORT 0 5 10 15 20 25 30 35 40 45 50 55 60 0 5 10 15 20 25 30 35 operative room temperature [ ° C] Running mean of ambient air temperature [°C] Summer Day Winter Day 0 5 10 15 20 25 30 35 40 45 50 55 60 0 5 10 15 20 25 30 35 operative room temperature [ C] Running mean of ambient air temperature [ C] Summer Day Winter Day EN-15251 MODEL
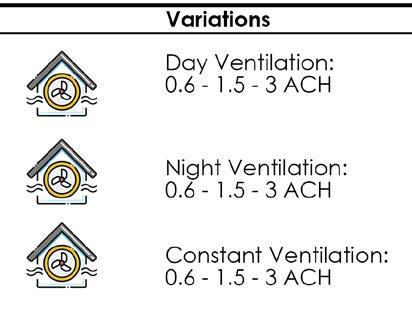
Phase 3 - Ventilation
In this phase constant, night and day ventilation of 3 ACH is compared. These graphs show the maximum percentage of comfort hours in 3ACH constant ventilation with a difference of almost 5% during cooling season. Hence with this 3 ACH constant ventilation is chosen as the best solution.
Phase 4 - Annual Passive Optimization
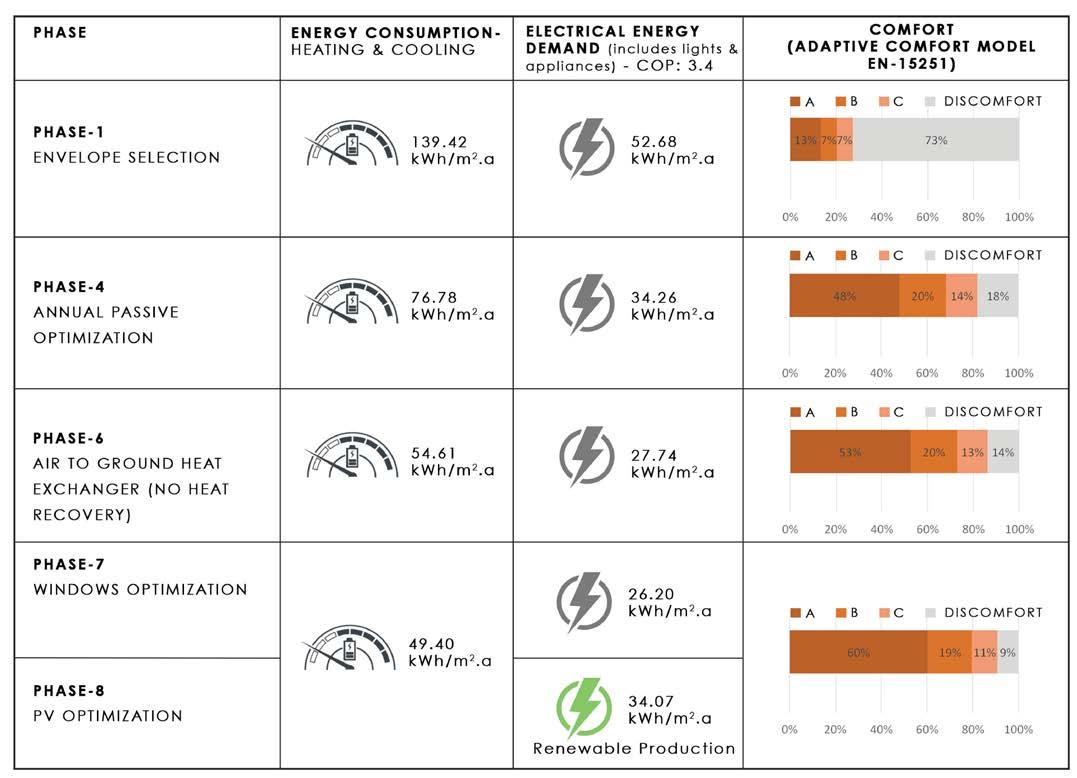
With annual passive optimization the comfort percentage for Athens has increased from 27.30% to 62.24% . The comfort percentage shall be further improved by implementing active systems.
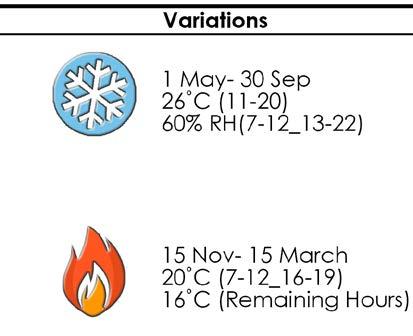
Phase 5 - Heating and Cooling
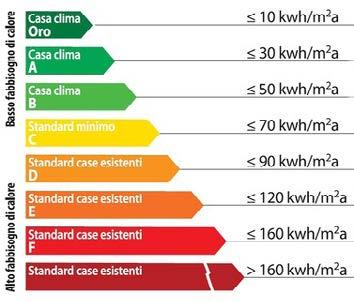
Keeping heating season from Mid November to mid March and Cooling season from May to October we get this as the best optimization for heating and cooling. The total energy consumption calculated is 76.78 kWh/m²a which resulted the building to be in Casa Clima Class C

10
13.23% 24.14% 33.62% 7.16% 11.20% 15.46% 6.92% 11.16% 13.16% 72.69% 53.50% 37.76% 0% 10% 20% 30% 40% 50% 60% 70% 80% 90% 100% ENVELOPE SELECTION SHADING VENTILATION
CLASS A CLASS B CLASS C DISCOMFORT
ANNUAL COMFORT THROUGH PHASES
0 5 10 15 20 25 30 35 40 45 50 55 60 0 5 10 15 20 25 30 35 operative room temperature [ C] Running mean of ambient air temperature [°C] Summer Day Winter Day
Area of Zone 2(Sqm) 26.81 QSENS+QLAT (kWh) 2058.51 Total Energy Consumption(kwH/sqm a) 76.78 48.04% 20.26% 13.86% 17.84% 0% 10% 20% 30% 40% 50% 60% 70% 80% 90% 100% CLASS A CLASS B CLASS C DISCOMFORT 10 15 20 25 30 35 40 45 0 5 10 15 20 25 30 35 operative room temperature [ C] Running mean of ambient air temperature [ C] Summer Day Winter Day 8.23% 4.49% 5.18% 4.98% 3.68% 3.79% 4.22% 4.04% 3.17% 82.57% 87.79% 87.86% 0% 20% 40% 60% 80% 100% CONSTANT- 3 ACH DAY-3 ACH NIGHT-3 ACH COMFORT - COOLING SEASON CLASS-A CLASS-B CLASS-C DISCOMFORT EN-15251 MODEL
EN-15251 MODEL
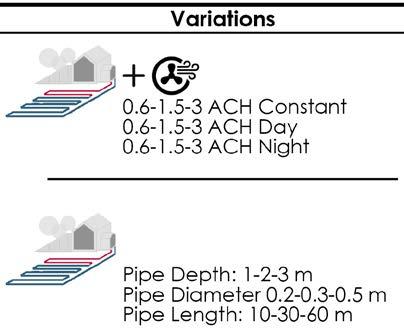
Phase 6 - Heat Exchanger
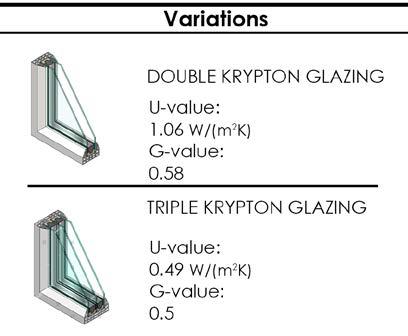
Phase 7 - Windows Optimization
In the winter period, after several analysis, it was decided to have a low ventilation, to store heat as much as possible. According to this consideration, the decision was to set the same day time winter ventilation of the system of 0.6 vol/h. For the summer period, it was decided for day venrilation at 3 ACH. The total energy consumption now calculated is 54.61 kWh/m²a which resulted the building to be in Casa Clima Class-B .
After studying the passive behavior of all the windows, we decided to conduct annual comparison of comfort and energy together to finalize the best case. It is very evident from the result that the best performing window type all year around is 3-pane Krypton resulting in the best comfort percentage of 90.90% and the least energy consumption of 49.40 kWh/m²a.
The steps below show the progressive steps leading to better optimization of building in terms of total comfort comparison according to EN15251 adaptive comfort model.
It can be clearly seen that how with step we reduced the percentage of discomfort to only 9.10% in the last phase compared to 72.69% during phase 1.
11
Area of Zone 2(Sqm) 26.81 QSENS+QLAT (kWh) 1464.04 Total Energy Consumption(kwH/sqm a) 54.61 15 17 19 21 23 25 27 29 31 33 35 0 5 10 15 20 25 30 35 operative room temperature [ ° C] Running mean of ambient air temperature [°C] Summer Day Winter Day 52.75% 20.15% 13.39% 13.71% 0% 10% 20% 30% 40% 50% 60% 70% 80% 90% 100% CLASS A CLASS B CLASS C DISCOMFORT
0 5 10 15 20 25 30 35 40 45 50 55 60 0 5 10 15 20 25 30 35 operative room temperature [ ° C] Running mean of ambient air temperature [ C] Summer Day Winter Day 60.34% 19.33% 11.23% 9.10% WINDOWS OPTIMIZATION CLASS-A CLASS-B CLASS-C DISCOMFORT TOTAL COMFORT COMPARISON 13.23% 33.62% 48.04% 52.75% 60.34% 7.16% 15.46% 20.26% 20.15% 19.33% 6.92% 13.16% 13.86% 13.39% 11.23% 72.69% 37.76% 17.84% 13.71% 9.10% 0% 10% 20% 30% 40% 50% 60% 70% 80% 90% 100% ENVELOPE SELECTION VENTILATION HEATING-COOLING HEAT EXCHANGER WINDOWS OPTIMIZATION COMFORT COMPARISON IN PHASES CLASS A CLASS B CLASS C DISCOMFORT
PV OPTIMIZATION
For the building to be under nZEB standards , the production of renewable source of energy on site was proposed. So, Roof integrated PV panels were implemented and the calculations were done with the help of online software called PVwatts to design properly the area and the type of PV. A monocrystalline panel was chosen because is the most efficient one and they can better exploit the sun irradiation. The tilt of the system is 30 degrees according to the design inclination of the roof.
Here are the results of Pv production, monthly demand and load match.The chart represents percentage of Heating, Cooling and Electricity demand for lights and appliances that were considered during the energy balance. It is evident that since Athens is a cooling dominated country the highest percentage of energy is consumed for cooling and then for electricity which is calculated through simulations.
12
168.32 183.50 254.96 279.57 316.32 346.75 363.62 344.85 311.41 237.68 152.18 146.81 0 1 2 3 4 5 6 7 8 0 50 100 150 200 250 300 350 400 JAN FEB MAR APR MAY JUN JUL AUG SEP OCT NOV DEC Solar Radiation(kWh/sqm day) Energy Production(kWh) PV PRODUCTION 168.32 183.50 254.96 279.57 316.32 346.75 363.62 344.85 311.41 237.68 152.18 146.81 15.42 24.37 2.09 0.00 85.37 229.31 353.41 370.75 227.12 0.00 0.00 16.42 0 50 100 150 200 250 300 350 400 JAN FEB MAR APR MAY JUN JUL AUG SEP OCT NOV DEC Energy (kWh) MONTHLY PV PRODUCTION AND DEMAND PV PRODUCTION(kWh) ENERGY DEMAND(kWh) 15.42 24.37 2.09 0.00 85.37 229.31 353.41 370.75 227.12 0.00 0.00 16.42 0 50 100 150 200 250 300 350 400 0 50 100 150 200 250 300 350 400 JAN FEB MAR APR MAY JUN JUL AUG SEP OCT NOV DEC Energy Demand(kwh) Energy Production(kWh) PV LOAD MATCH PV PRODUCTION(kWh) ENERGY DEMAND(kWh) 2.44% 52.99% 44.56% HEATING COOLING ELECTRICITY
The graph shows the reduction in Energy demand from Phase 1 to Phase 7 which accounted minimum consumption and the implementation of PV panels with a production of 3105.96 kWh/a helps the building to achieve the NZEB standard, with a small quantity of energy that could be sold back to the local grid. This production caters to all the energy demand for heating, cooling and electrical appliances.
The monthly energy demand vs monthly consumption was analyzed on the right chart which clearly represents overproduction in all the months except July and August because of high cooling load in Summer. However, the energy could be sold to the grid after keeping some percentage for July-Aug.
13
0 10 20 30 40 50 60 70 80 90 100 0 10 20 30 40 50 60 70 80 90 100 Energy Production(kWh/sqm a) Energy Consumption (kWh/sqm a) ENERGY
PHASE 1 PHASE 4 PHASE 6 PHASE 7 MIN PRODUCTION PHASE 8 JAN FEB MAR APR MAY JUN JUL AUG SEP OCT NOV DEC 0.00 2.00 4.00 6.00 8.00 10.00 12.00 14.00 16.00 0.00 2.00 4.00 6.00 8.00 10.00 12.00 14.00 16.00 Energy production (kWh/sq m) Energy Demand (kWh/sq m)
ANALYSIS- ATHENS
NZEB- MONTHLY ENERGY BALANCE
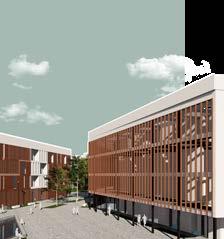
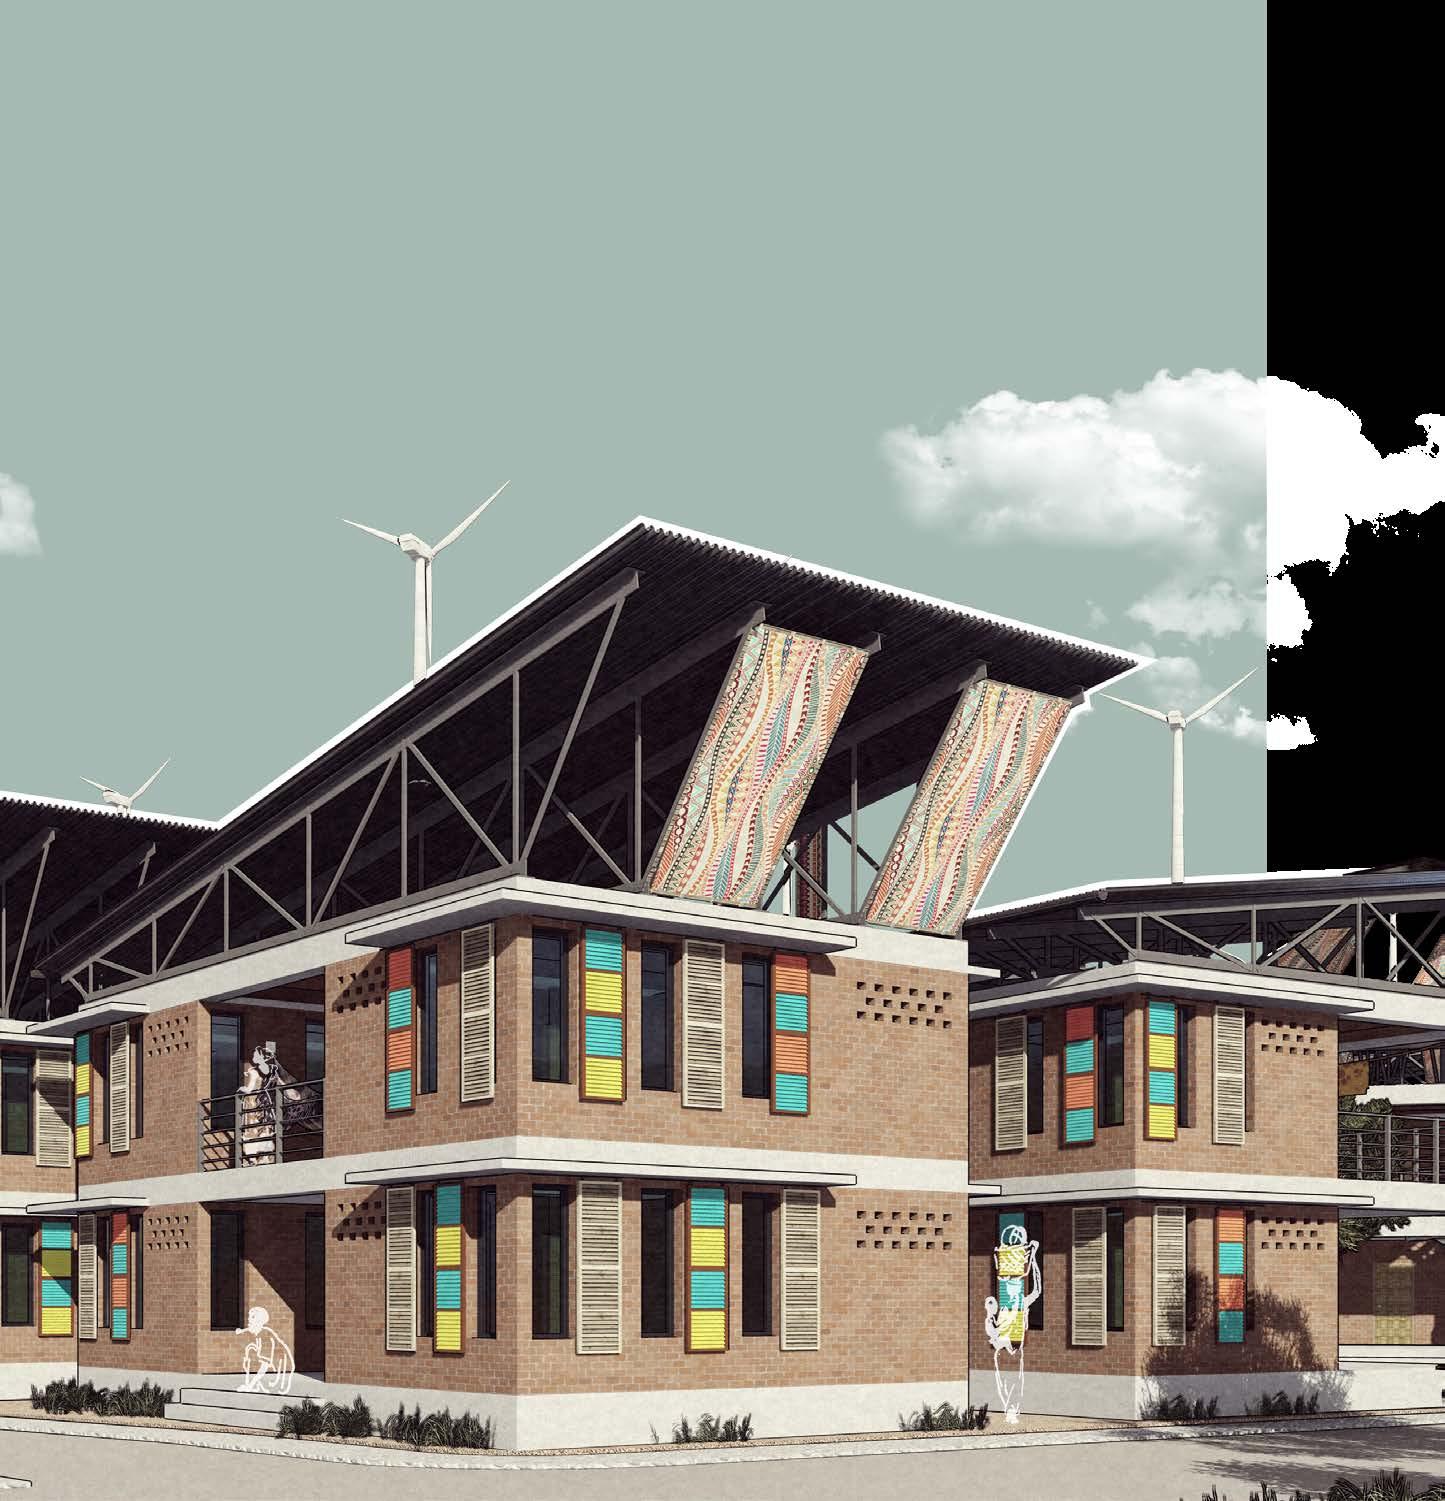
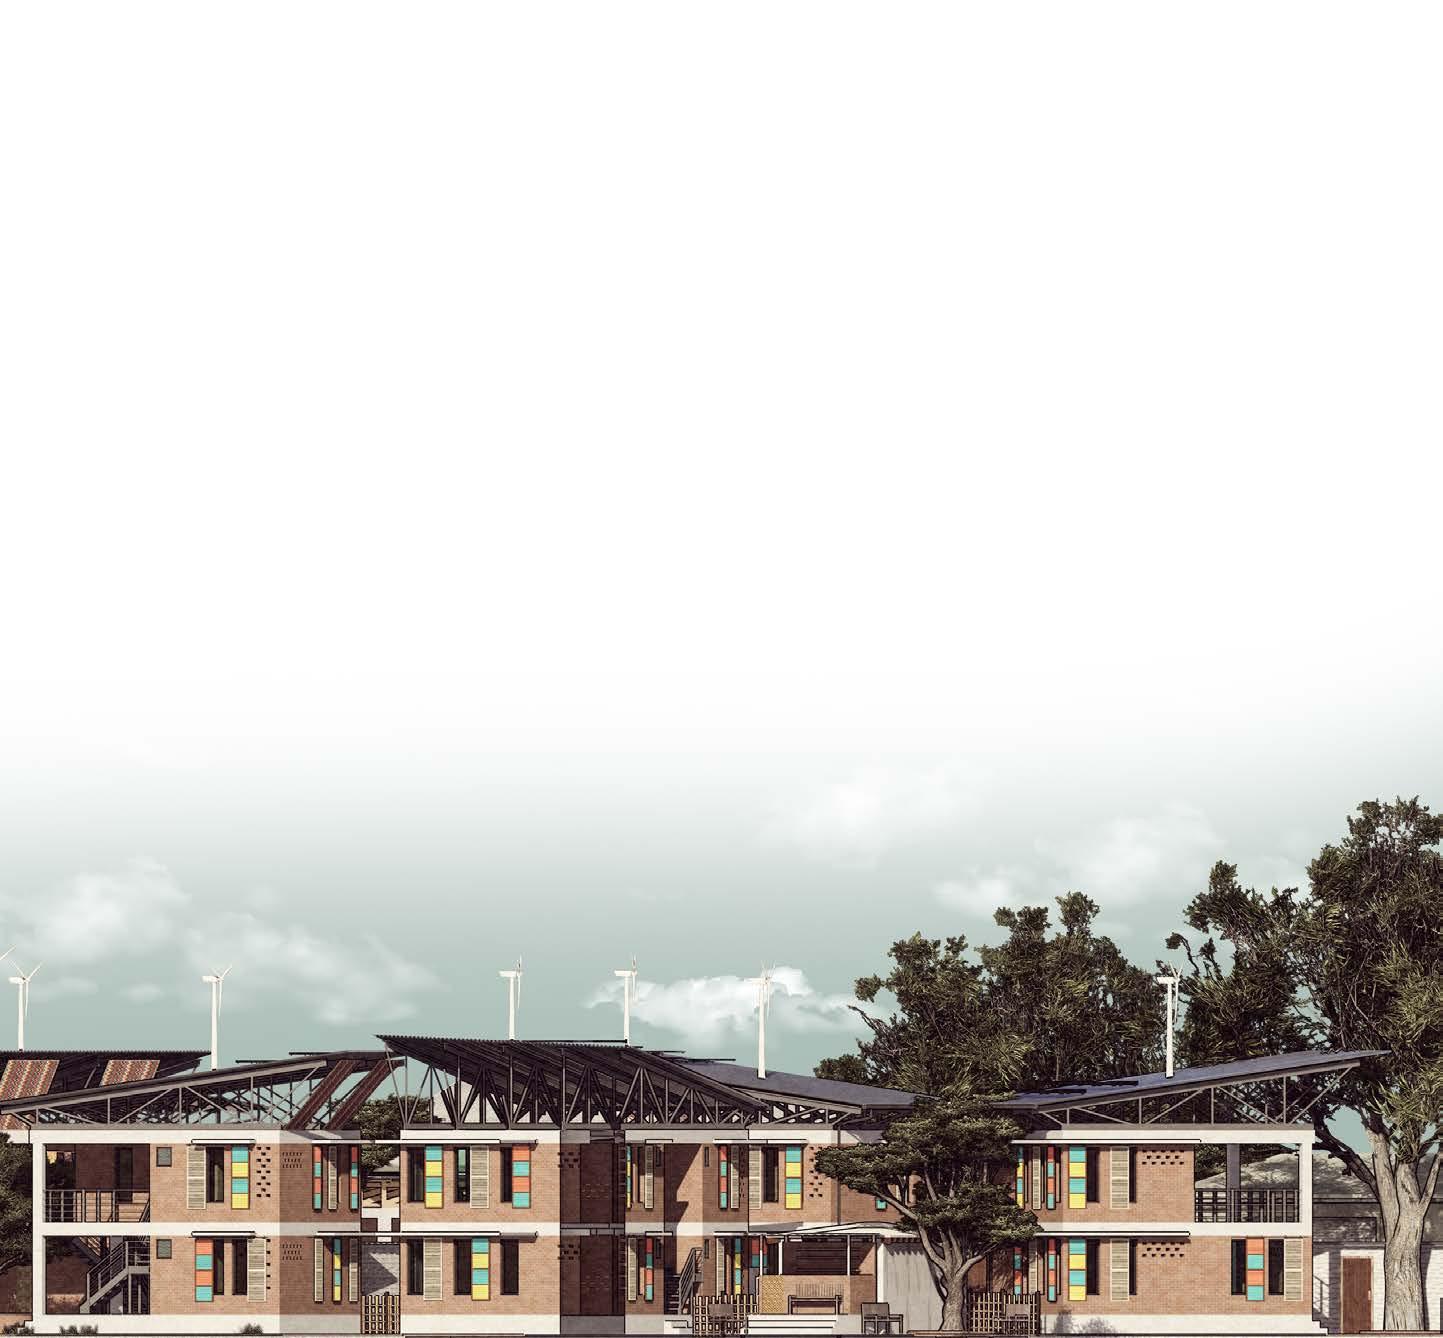
INFORMAL IS THE NEW NORMAL
SLUM REHABILITATION
Type - Slum Rehabilitation
(Integrated Modification
Chamanculo, which houses a large part of the 800,000 inhabitants living in informal settlements is one of the most populous neighborhoods of Maputo, consisting largely of informal settlements, mixed with buildings of colonial architecture. The thesis Informal is the new normal: HANDS Health AND urban Space in Chamanculo, Mozambique, aims to address the abovementioned issues from the perspective of the context itself, keeping in mind the intricacies and complexities of the issues and the people involved. Addressing the urban systems with IMM
Methodology), the approach towards the issues was in different levels, - Urban - Zonal - Cluster - Modular. The issues of housing in the area was addressed through modular system with carefully analysed and implemented voids and green spaces in the clusters. Urban facilities like Market area, community kitchen, Community toilets, Biogas digester , etc were provided to improve the living conditions of the habitats.
14 02
Location - Chamanculo C, Maputo, Mozambique
15
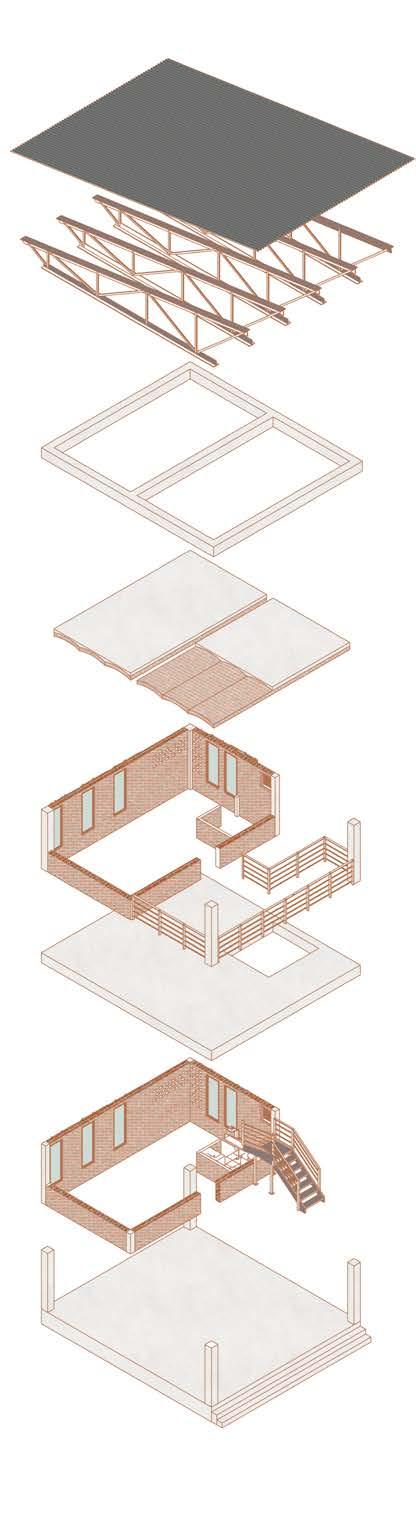
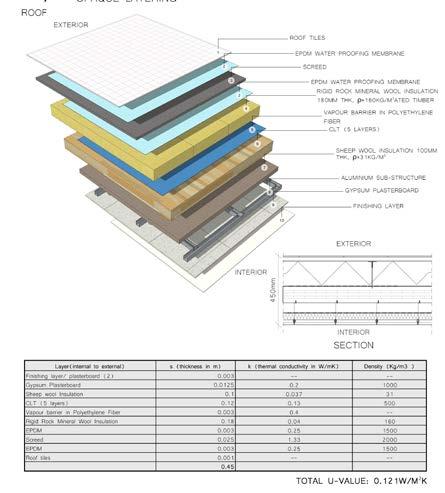
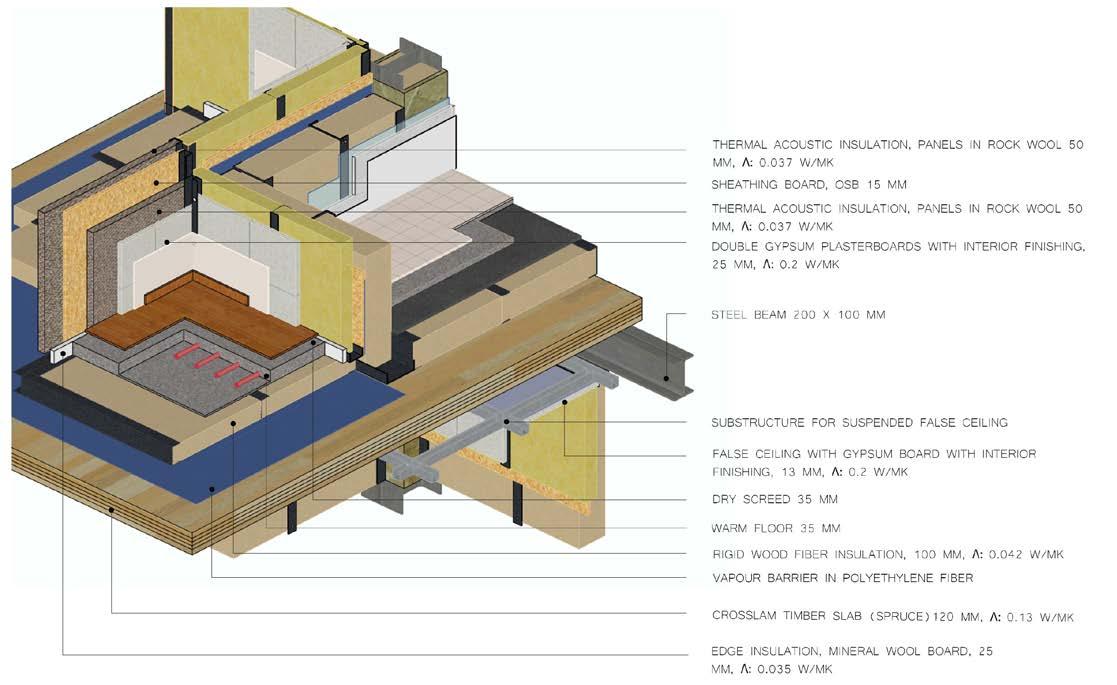
TECHNOLOGICAL DETAILS
BUILDING MATERIALS BUILDING LAYERS
Corrugated Metal Sheet
Steel Roof Truss

RCC Ceiling Frame
Cement Screed
Arched Compressed Brick Ceiling
Compressed Earth Brick Walls
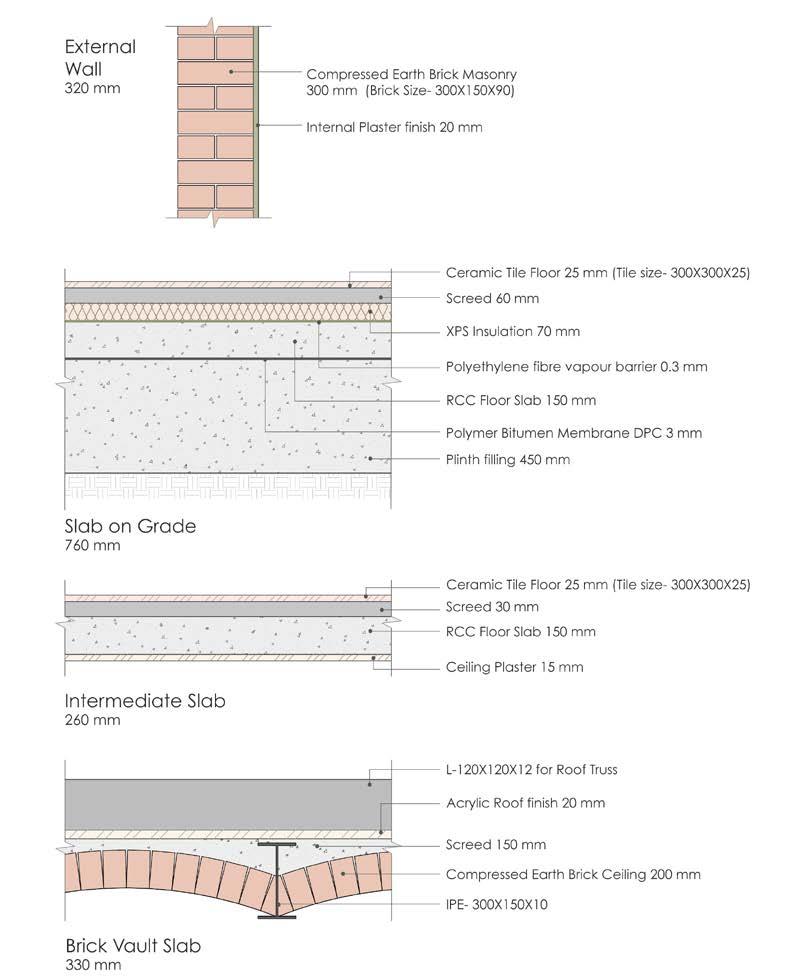
Stainless Steel Railing
RCC Intermediate Floor Slab
Double Glazed Window
Detachable Mild Steel Staircase
RCC Slab on Grade
RCC Column
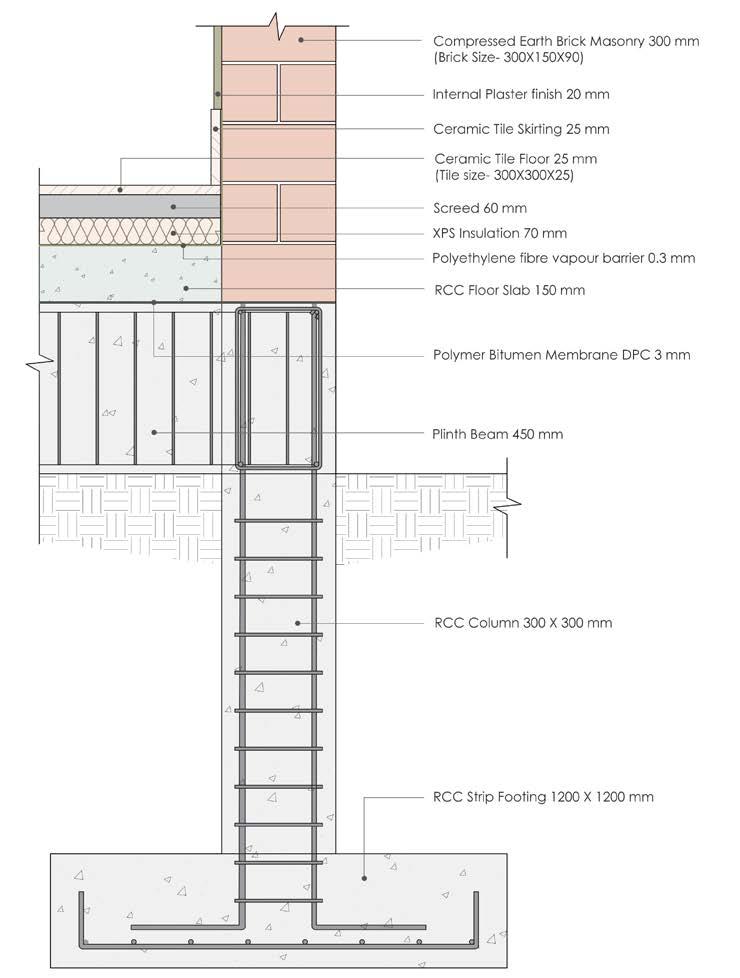
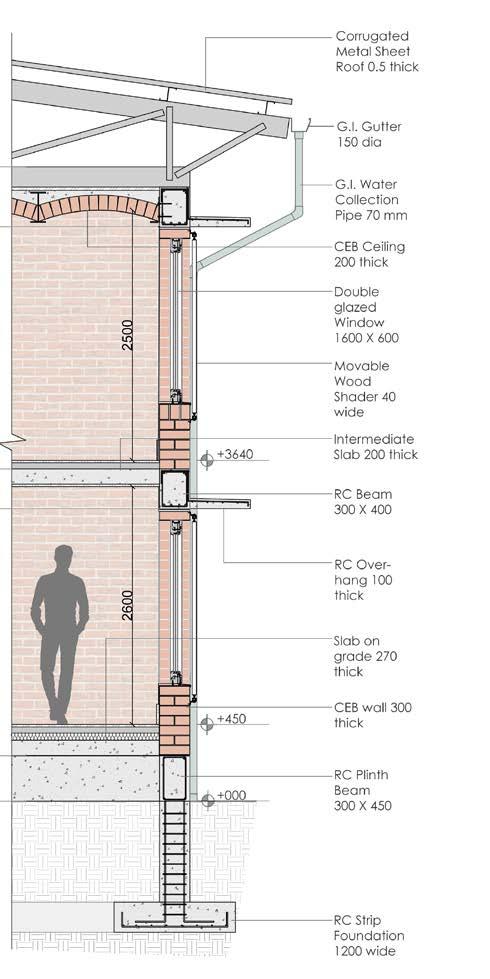
BLOWUP DETAIL
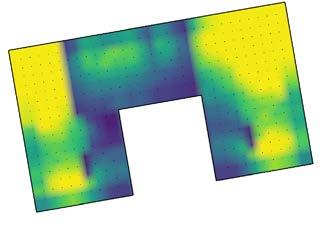
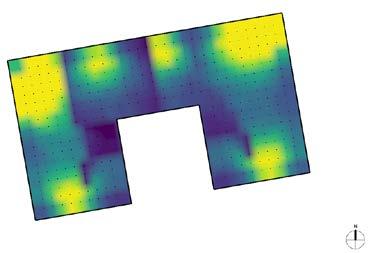
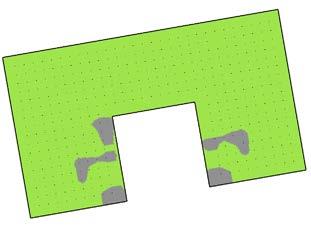
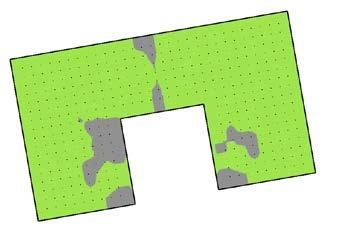
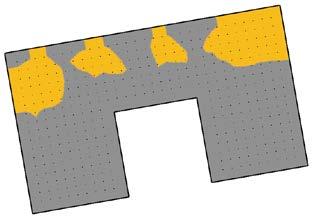
DAYLIGHT ANALYSIS
Phase 1: Form Selection
Three CasesCase 1 -Square
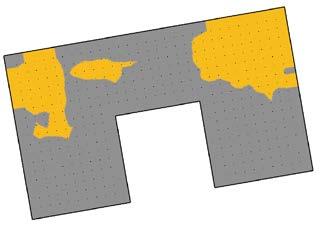
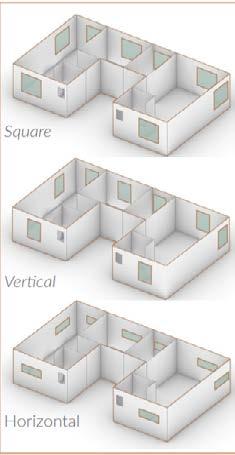
Size - 1.5 x 1.5 m
Case 2 - Vertical
Size - 0.9 x 1.5 m
Case 3 - Horizontal
Size - 1.5 x 0.6 m
For the comfort of the users daylight optimization was done using Rhino + Climatestudio . From the first stage till the last and final stage there is a significant improvement in the Daylight Factor and sDA. Although ASE is higher it still is within acceptable limits.
The entire optimization process is shown in the adjacent figure.
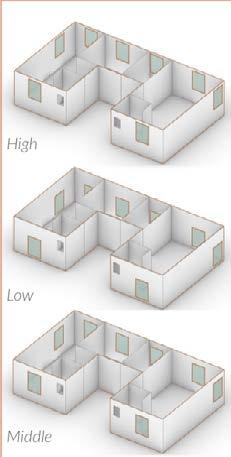
Phase 2: Position Selection
All windows size0.6 x 1.5 m
Three CasesCase 1 -High
Position- 0.8 m from floor
Case 2 - Low
Position- 0.2 m from floor
Case 3 - Middle
Position- 0.4 m from floor
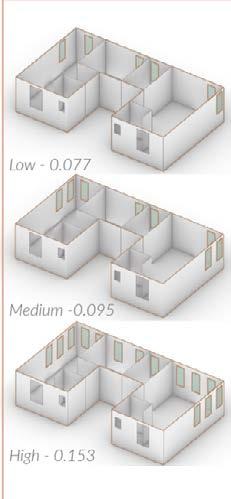
Phase 3: Window to Wall Ratio
Only North / North East Facing windows
All window size0.6 X 1.6 m
Three CasesCase 1Low WWR - 0.077
Case 2 -

Medium WWR - 0.095
Case 3High WWR - 0.153
18
DAYLIGHT FACTOR sDA ASE
2.8 3.9 0 0.5 1 1.5 2 2.5 3 3.5 4 4.5 FIRST CASE FINAL CASE DAYLIGHT FACTOR DF 90.86 94.52 23.76 30.5 0 20 40 60 80 100 FIRST CASE FINAL CASE PERCENTAGE (%) sDA / ASE SDA ASE
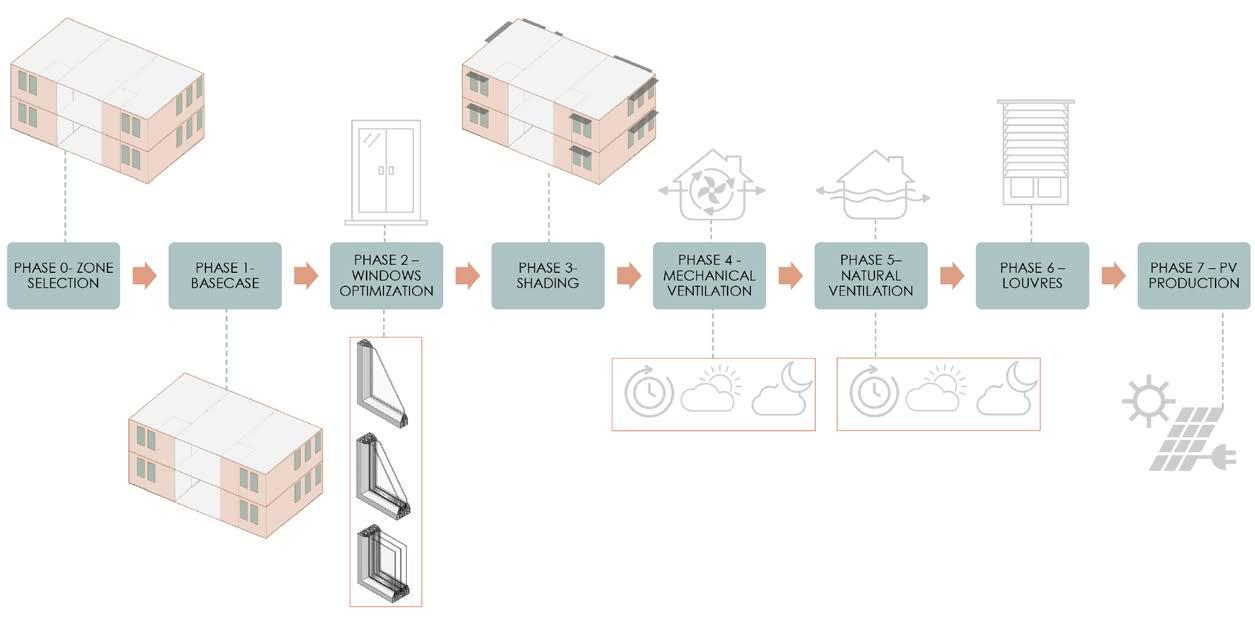
ENERGY OPTIMIZATION
To address the energy aspect of the building the below process was followed using Rhino + Climatestudio. It was all passive optimization without any use of active systems. The comfort hours are finally 70% of the entire year. With PV optimization around 110% of the demands is achieved.
19 2748 3045 3266 4695 4918 6585 6012 5715 5494 4065 3842 2175 0% 10% 20% 30% 40% 50% 60% 70% 80% 90% 100% LOUVRES NATURAL VENTILATION MECHANICAL VENTILATION SHADING WINDOW OPTIMISATION BASECASE COMFORT HOURS % DISCOMFORT % COMFORT 15 16 17 18 19 20 21 22 23 24 25 BASECASE WINDOW OPTIMISATION SHADING MECHANICAL VENTILATION NATURAL VENTILATION LOUVRES MINIMUM ROOM TEMPERATURE 30 31 32 33 34 35 36 37 38 39 40 BASECASE WINDOW OPTIMISATION SHADING MECHANICAL VENTILATION NATURAL VENTILATION LOUVRES MAXIMUM TEMPERATURE 0 50 100 150 200 250 300 350 400 450 500 JAN FEB MAR APR MAY JUN JUL AUG SEP OCT NOV DEC Energy (kWh) PV PRODUCTION AND DEMAND DEMAND PRODUCTION 4175.97 4539.89 4000 4100 4200 4300 4400 4500 4600 DEMAND PRODUCTION Energy (kWh) ANNUAL DEMAND VS PRODUCTION
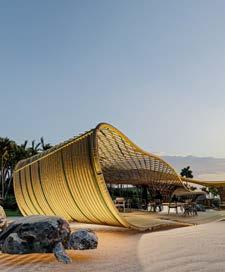
THE COAST
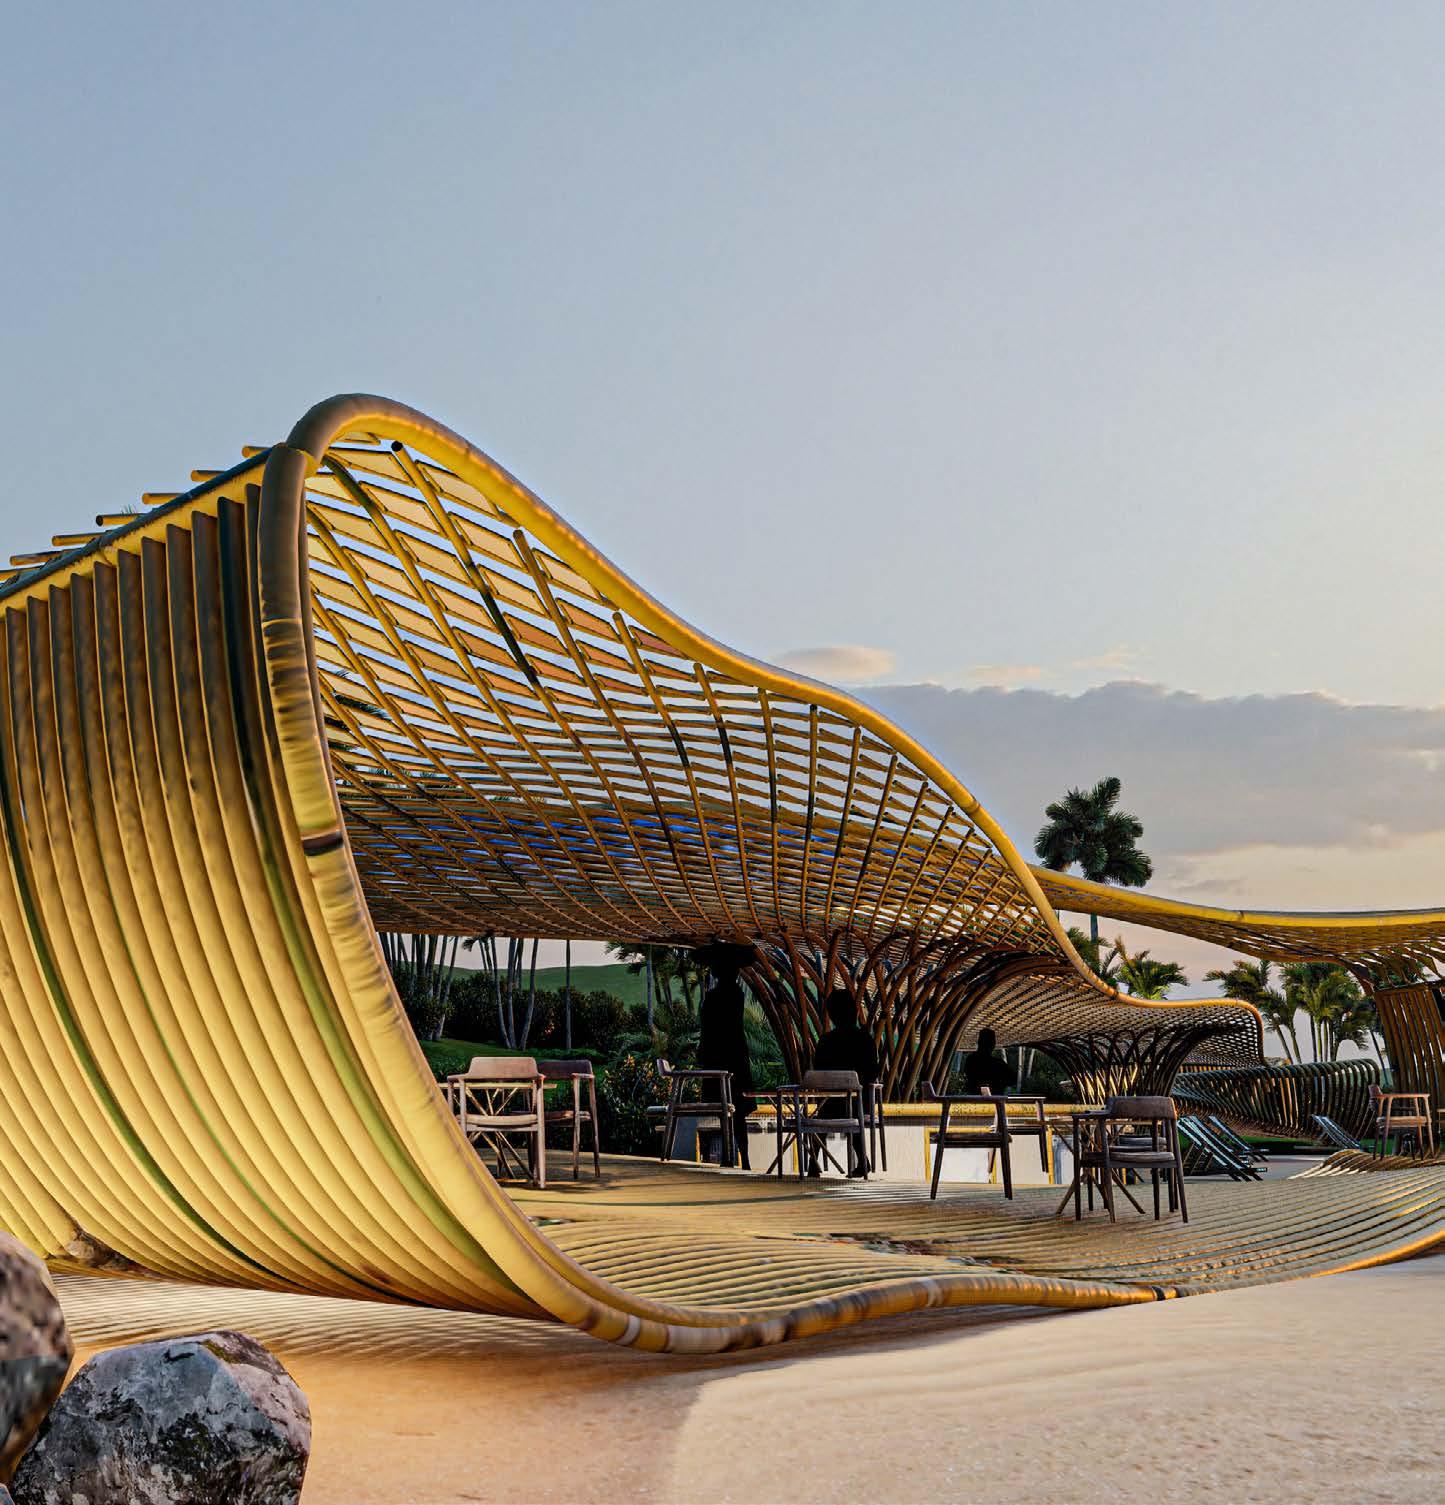
PUBLIC PAVILION
Location - West Nusa Tenggara, Lombok, Indonesia
Type - Public Pavilion
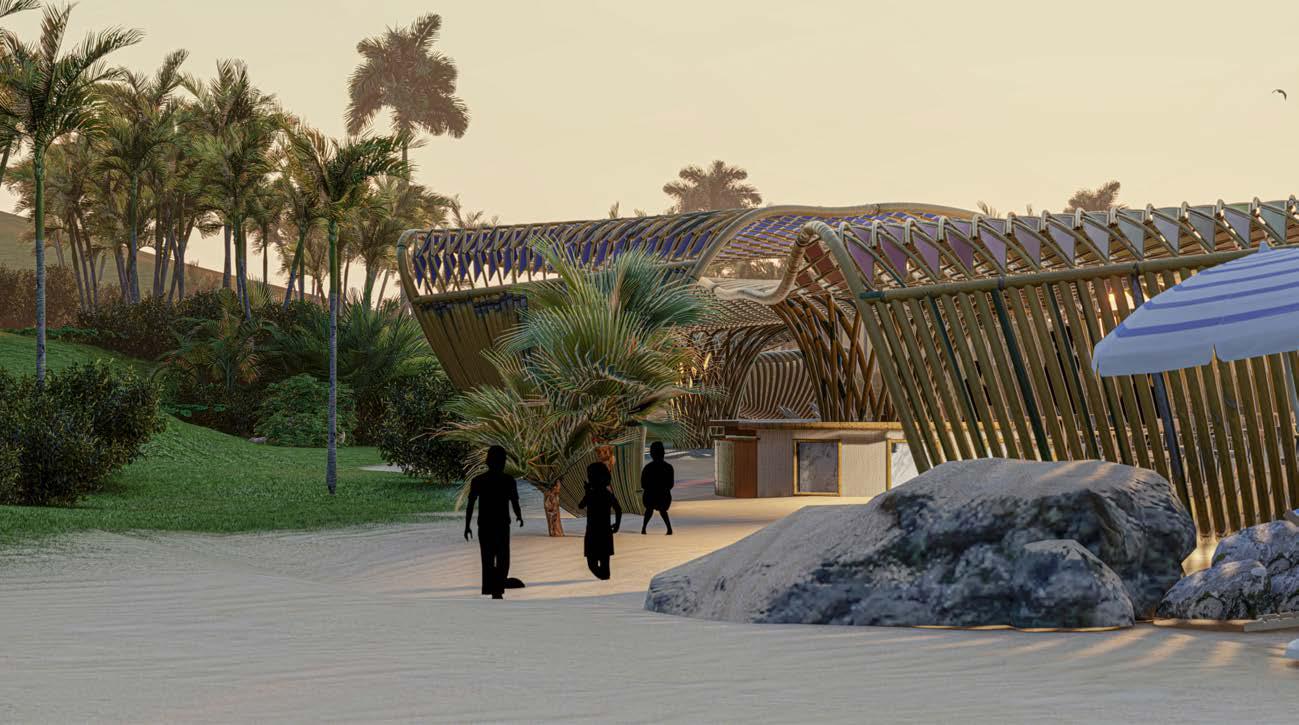
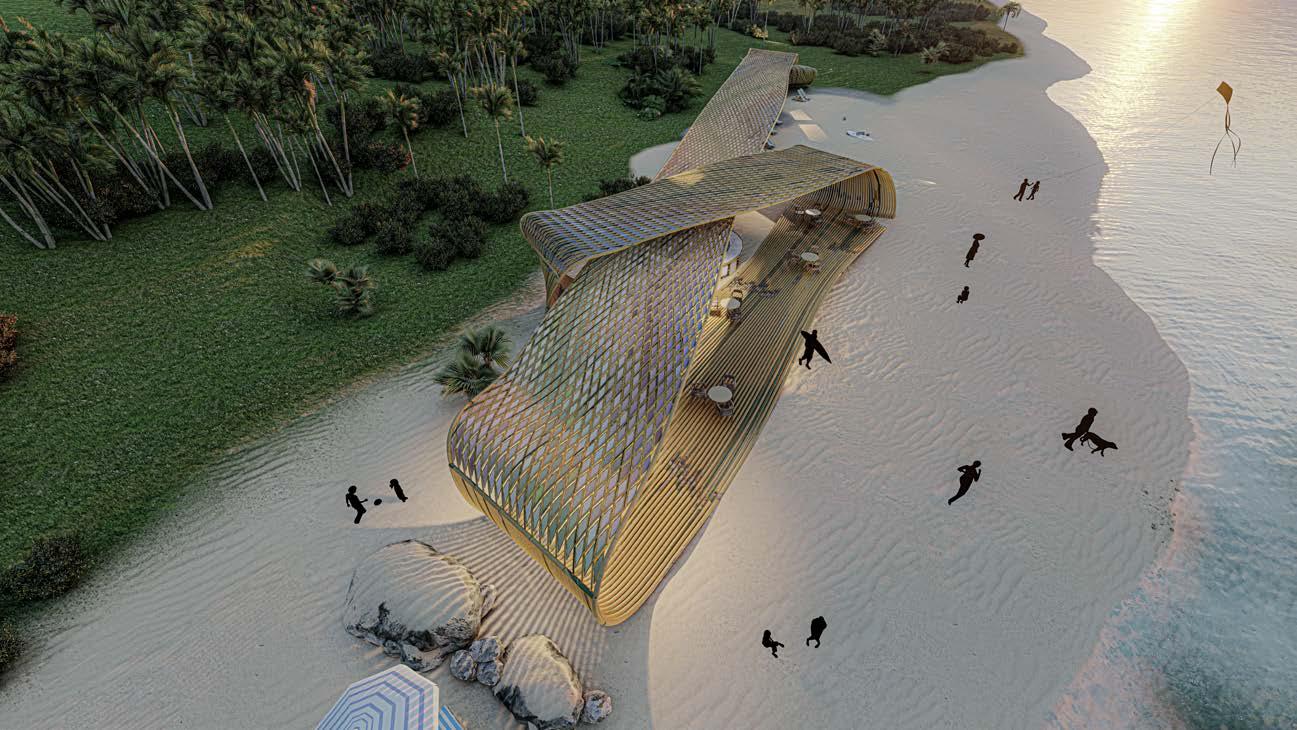
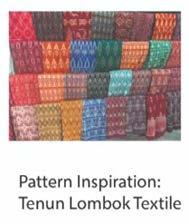
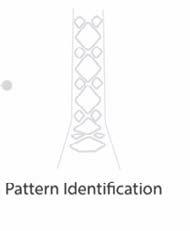
The inspiration for the pavilion comes from the motion of “Gasing Lombok” a toy for the kids in Indonesia, rotating on its axis and creating a pattern with its motion. The motion is random, and this random motion is recorded using different grasshopper plugins to create a shape which then gives us the first form for our pavilion. It is then modified and enhanced using different tools like Galapagos and grasshopper and finally the construction details for the pavilion keeping bamboo (local material to Indonesia) as the primary structural material.

PROJECT LOCATION
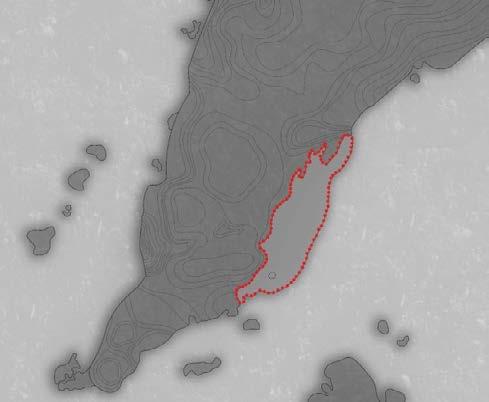
An Island coast in Indonesia, far from the Touristic spot of Bali. The location is a spot close to nature with scenic views and serenity.
Kuta, Puju, Central
Lombok
Regency, West
Nusa Tenggara, Lombok
Indonesia
20 03
21
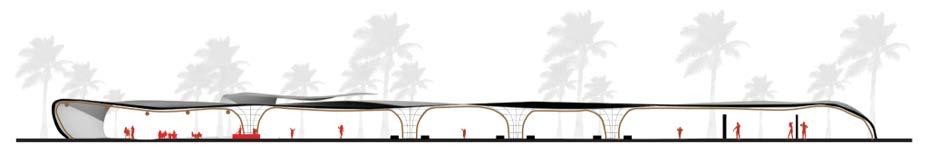
DESIGN SECTION
INSPIRATION TRACING THE MOTION FINDING THE FORM

DESIGN PLAN
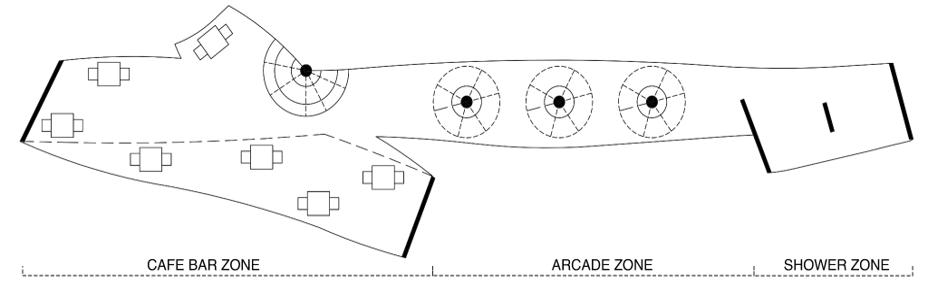


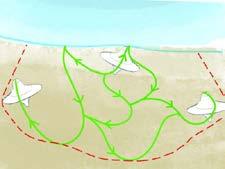
FUNCTIONS
The main function of the Pavilion is for the users arriving at beach, providing assitive spaces like Bar,, Arcade and Shower
22
FORM FINDING
23
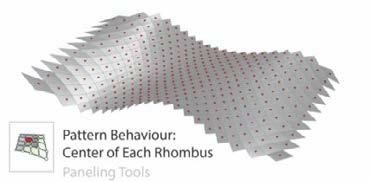
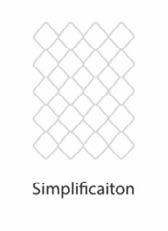
PATTERN BEHAVIOUR:
Simplification of Pattern with Rhombus and finding the centre of each rhombus.
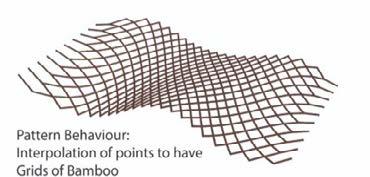
PATTERN BEHAVIOUR:

Interpolation of points to have Grids of Bamboo
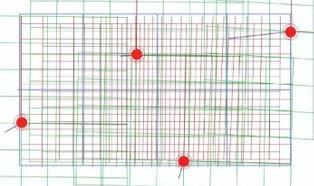
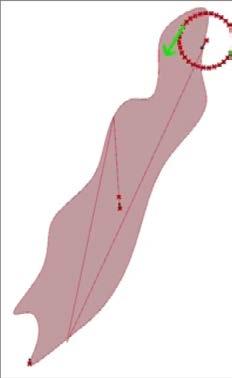
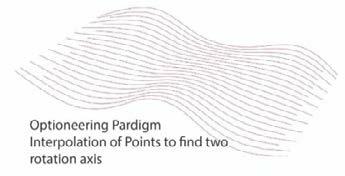
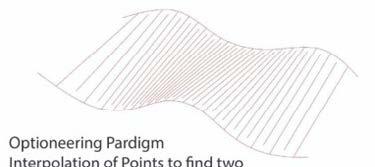
OPTIONEERING PARADIGM:
Interpolation of points to find two rotation axis
OPTIONEERING PARADIGM: Interpolation of points to find two rotation axis
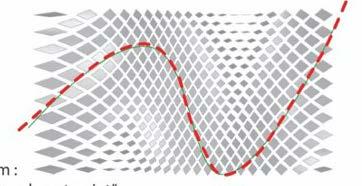
OPTIONEERING PARADIGM:

Parameterize the surface and put points on each part of surface with boundaries
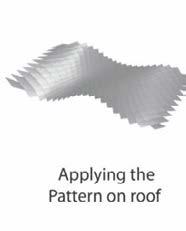
FINDING
PATTERN
OPTIMIZATION PATTERN
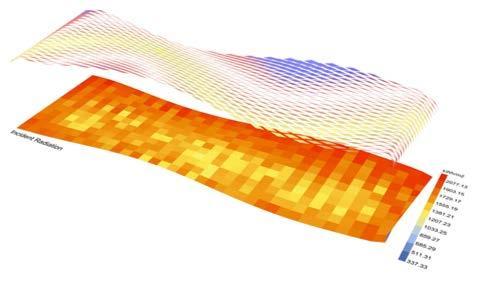
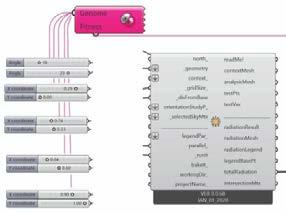
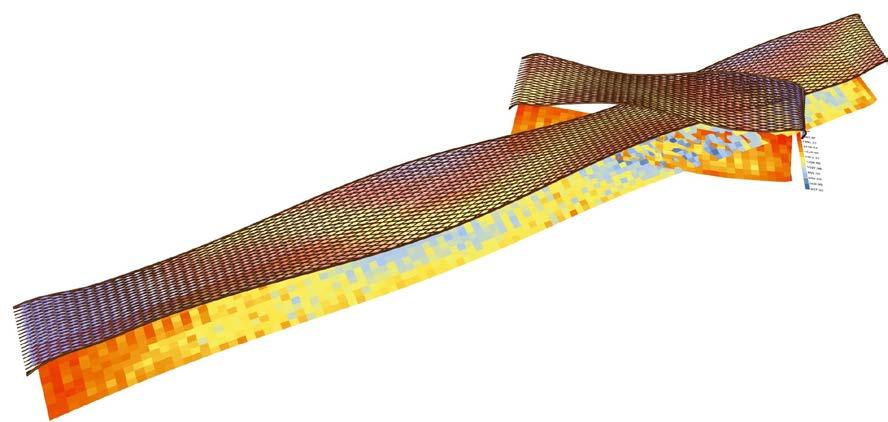
-Analysis of Irradiance under the Pavilion thanks to Ladybug - Galapagos used to reduce total irradiance
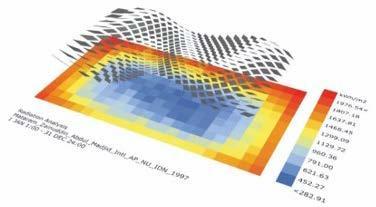
Using Galapagos to analyse different cases and optimizing, finally finding out the worst and the best case scenarios.
STRUCTURE AND FORM
THE OPTIMIZED PATTERN to get the least radiation beneath the shading, thanks to Grasshopper + Galapagos.
Tefzel ETFE sheets and film UV stabilized 1.25 thick, HT-2183, ASTM D3159 Type I, Grade 1, USP Class VI, chemically inert
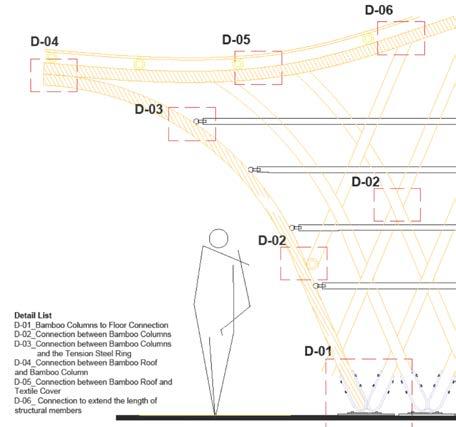
DETAIL 03
MATERIAL:
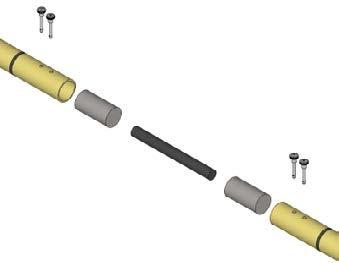
Bamboo specified by minimum diameters, wall thickness and length

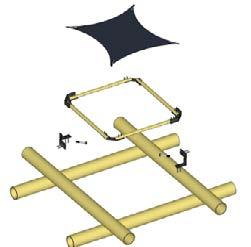
Column: 80-100mm Dia
Wall Thickness: 10-12mm Dia
Bamboo Strips to infill panels
DETAIL 01
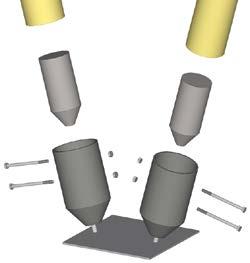
LENGTH EXTENSION CONNECTION
25
BAMBOO ROOF & COLUMN
ONNE C T C
AN INCLUSIVE LIVING
Location - Crescenzago, Milan
Type - Social Housing
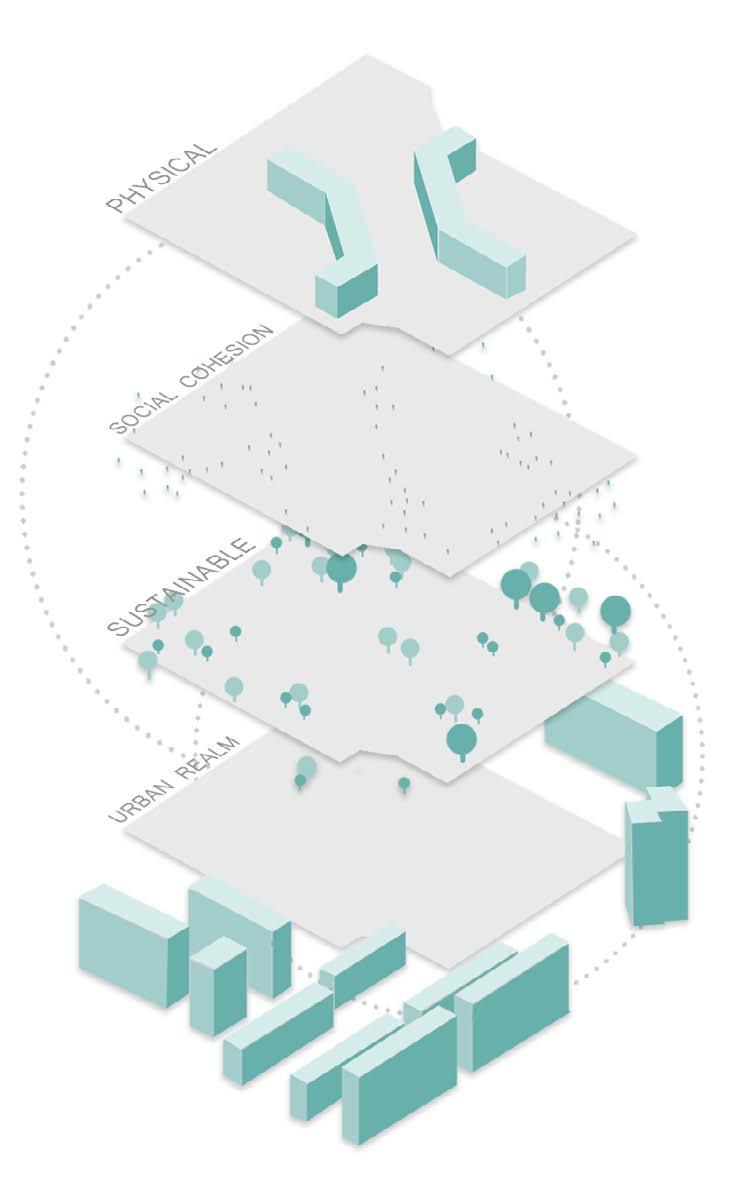
This was a project we had to address in our third semester of BAE Masters under the course of Architectural Design and Sustainable Building Technologies. The Proposal was asked for social housing and co living in Cresenzago, Milan. It needed to include a detailed design and a clear and reliable carbon assessment of the project site. The project was to be completed in total buildable land of 10.8 sq m with floor area ratio of 0.3 per sq m. The total built up was to be maximum of 3.234 sq m. We were to address the issue of affordable student housing with small rooms for 1-2 beds. Every floor had to have common areas and the ground floor had to be dedicated for coworking, gyms, laundry, services, green mobility, etc accounting for about 800 sq m. A maximum of four floors were allowed to be designed. The project had to be sustainable and have the least possible impact on the environment.
26 04
27
1. PHYSICAL
1. CONNECTION
2. COMMUNITY
3. GREENERY
2. BUILDINGS (TOO CLOSED)
4. PHYSICAL
CONCEPT :
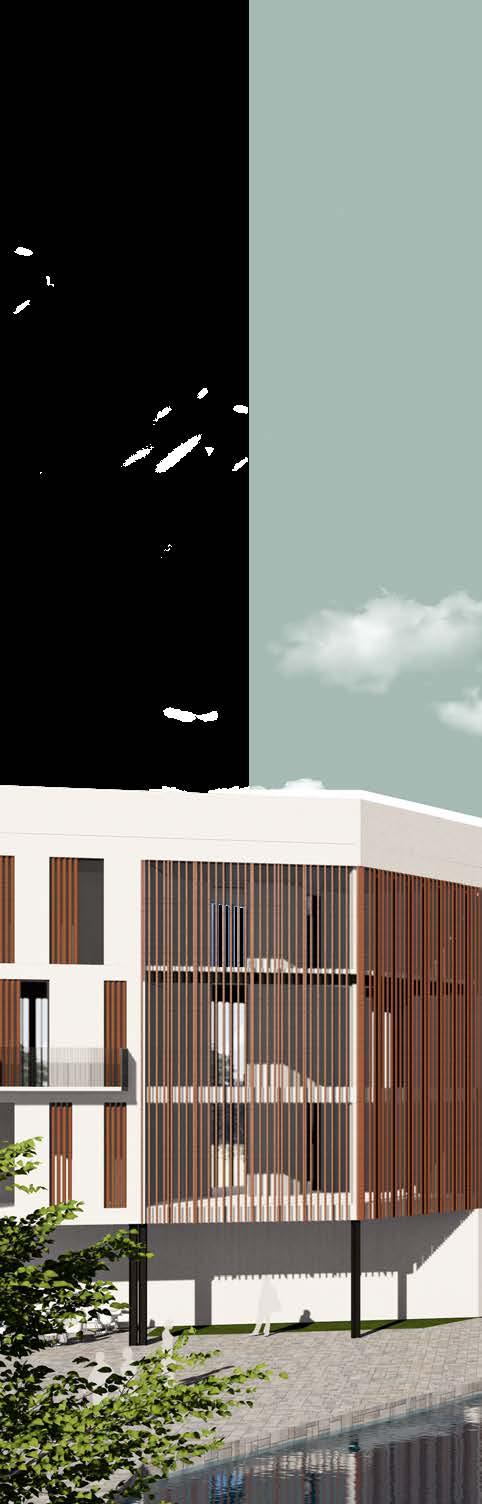
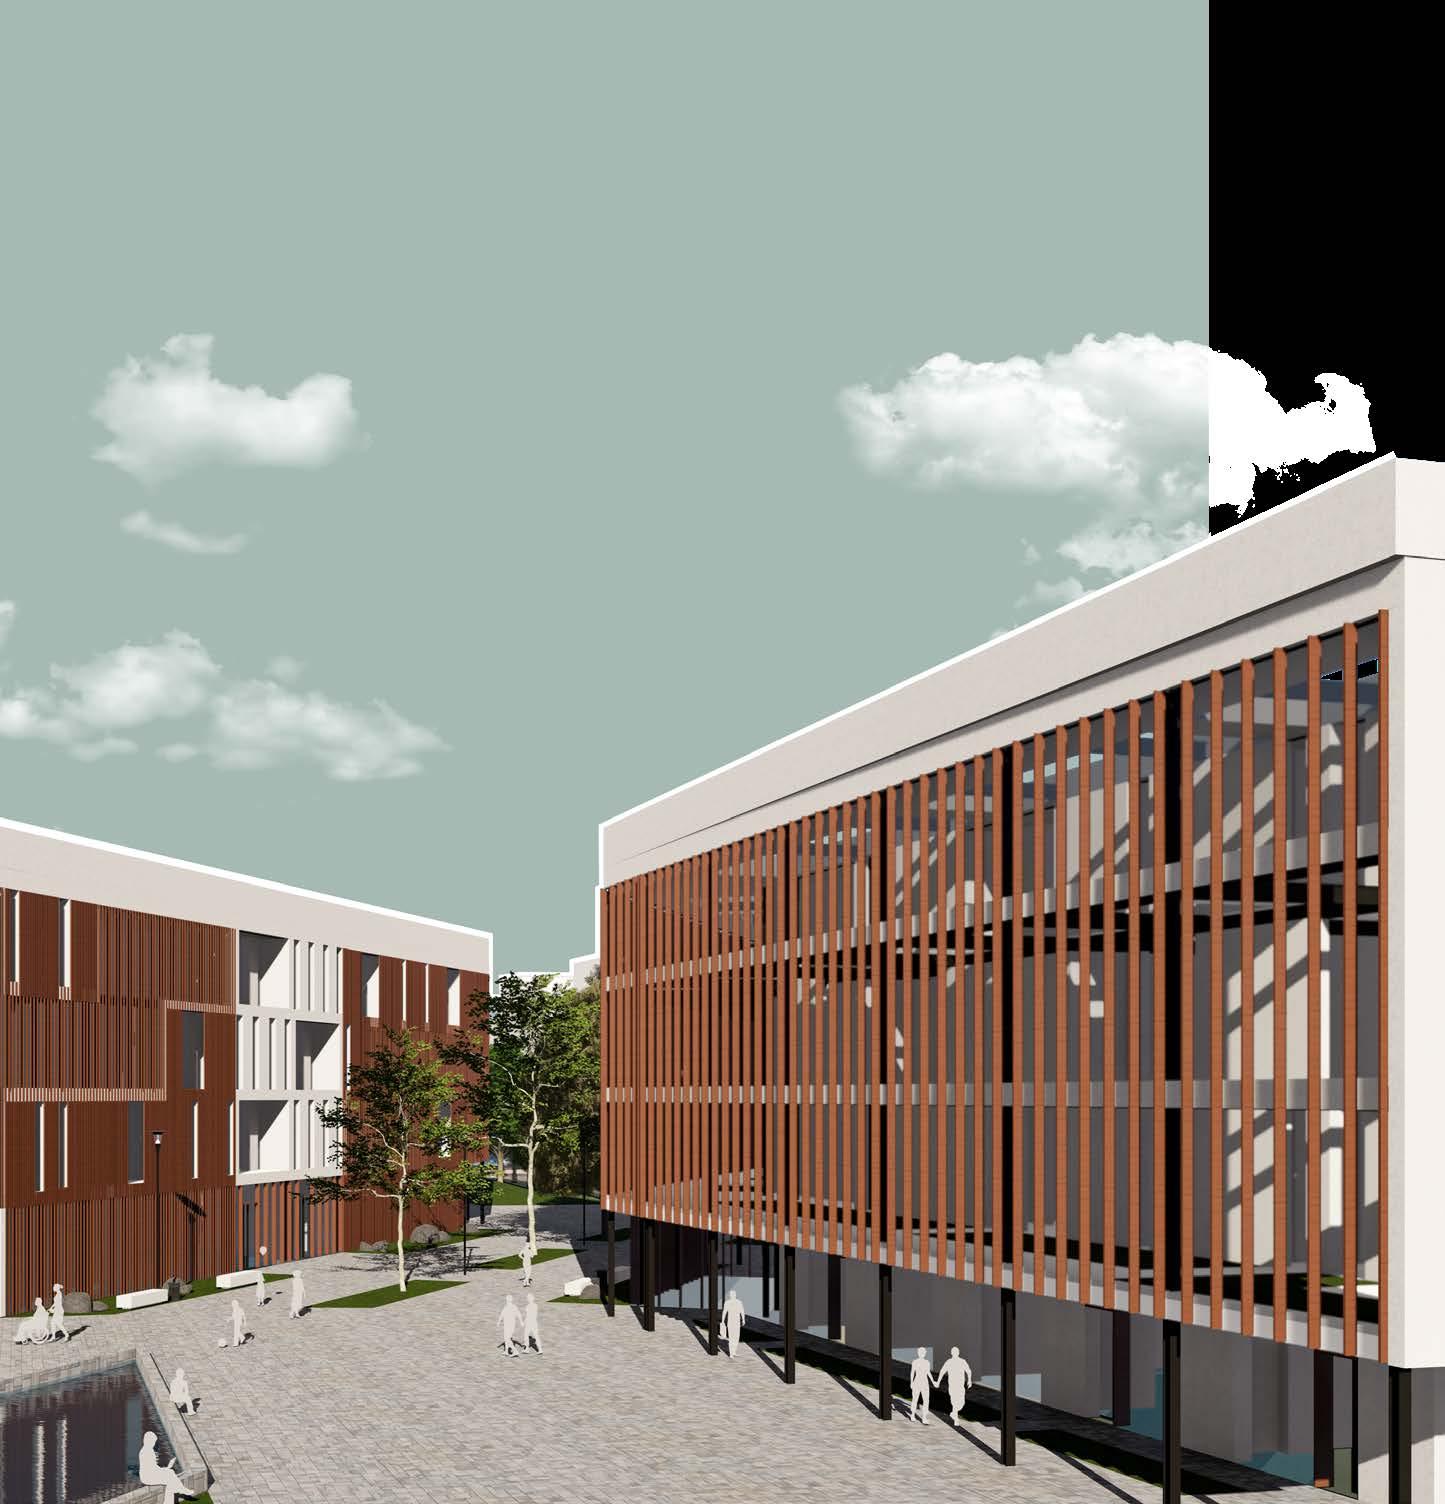
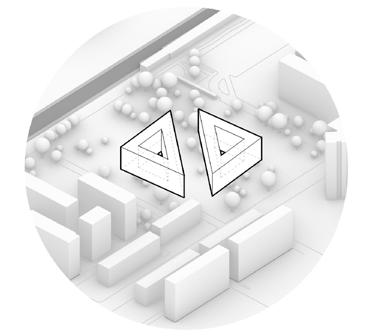
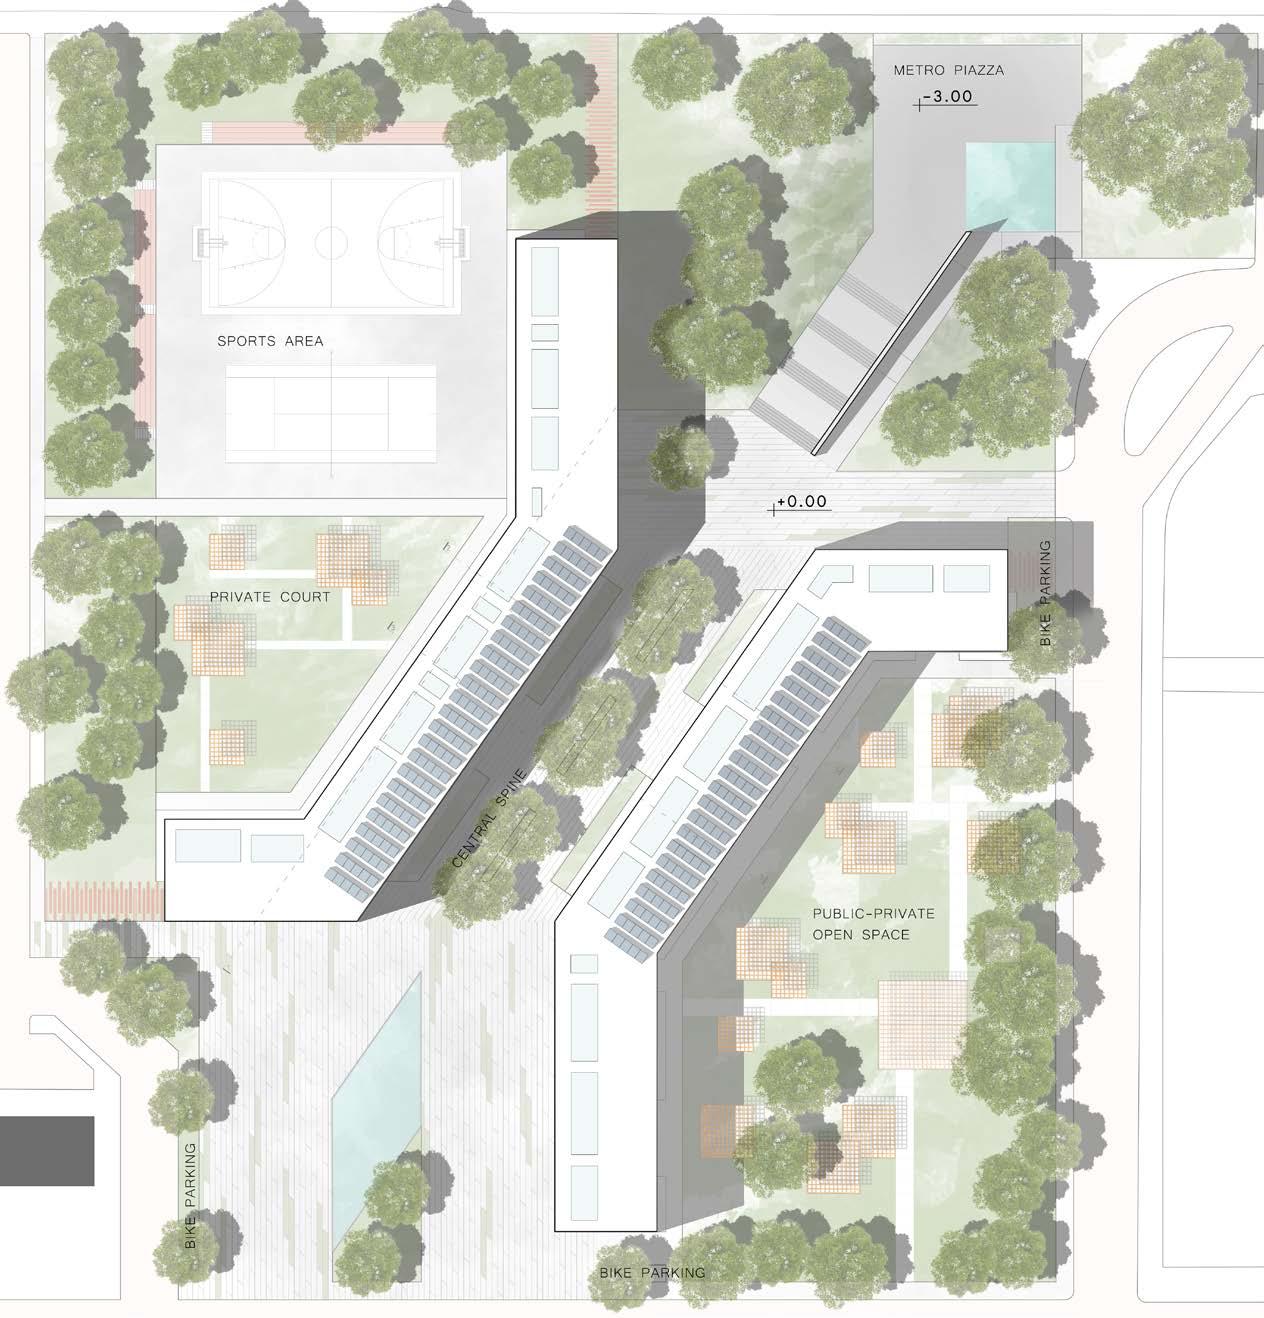
The concept is derived from the site and its surroundings where we wanted to connect them diagonally across the site. We started by implementing the rectangle on the site, and cutting it in diagonal line as mentioned before, and then opening the wings of the building which allowed us to embrace the surroundings in all ways, and derive space hierarchy around the site.
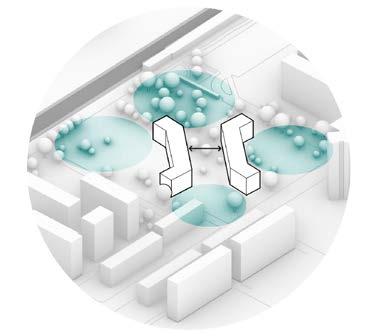

3. OPEN BUILDINGS
4. HIEARCHY OF OPEN SPACES
28
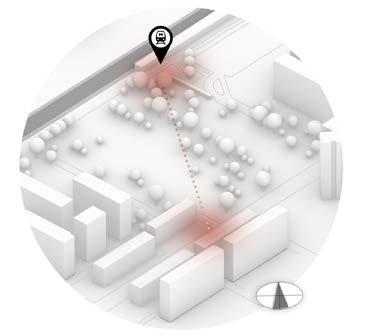
The site being close to the metro has big potentials for urban connections. The major connection of Parco Lambro through the site poses as an opportunity to bring in a network of greenery .Through the number of underpasses the two areas of Crescenzago, divided by the railways are currently connected. The existence of diverse functions near the site makes it a potential node for the community cohesion. Diversity in the residents of the area also is an opportunity to build a site which focuses on community building and urban connections.

29
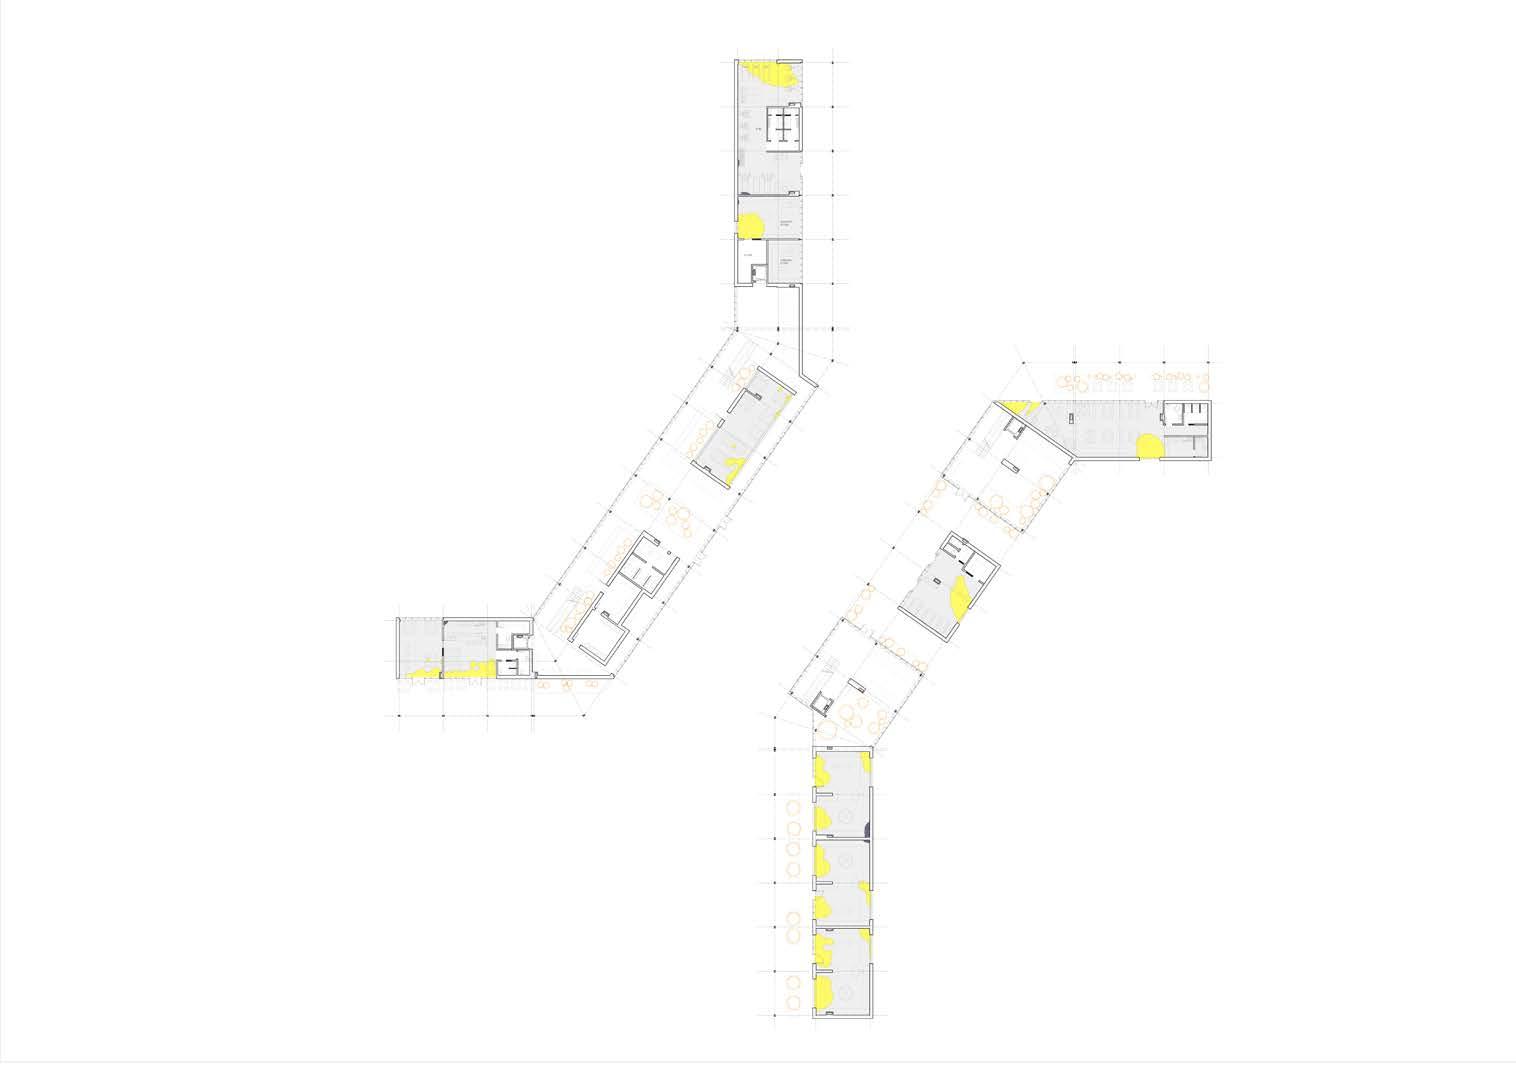
SITE PLAN:
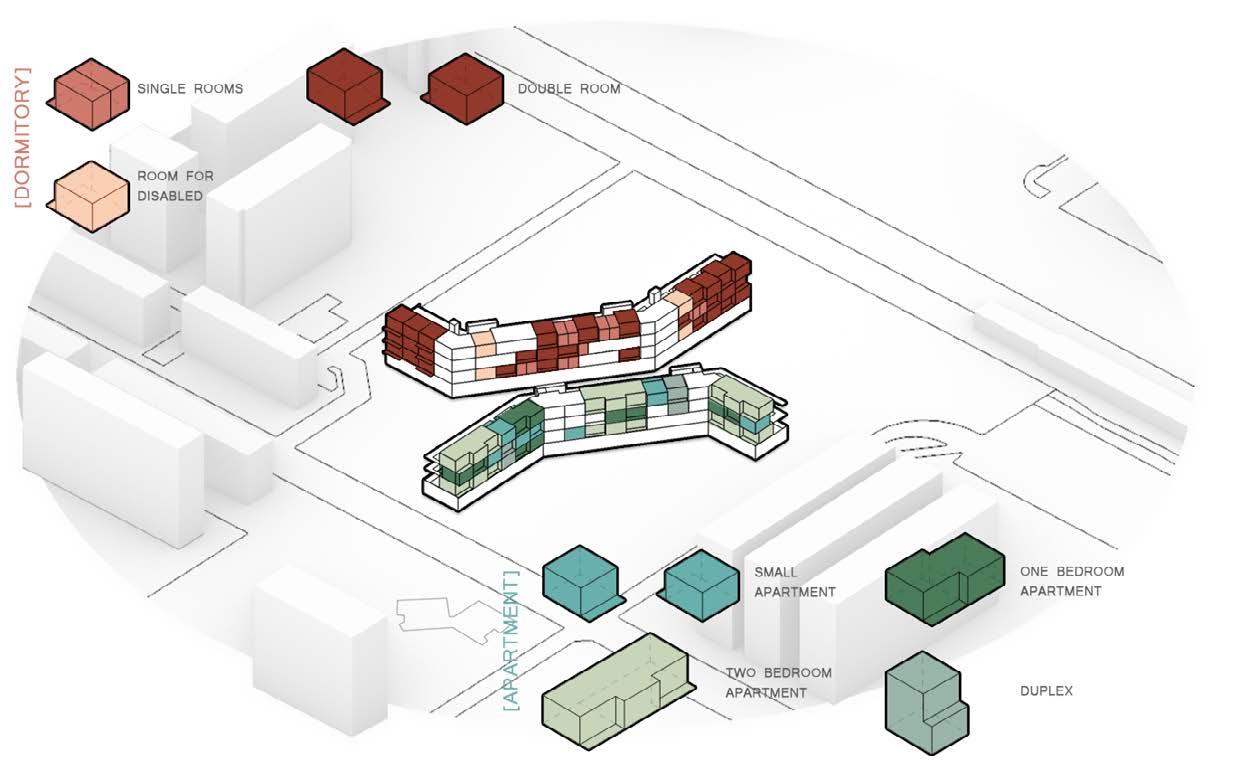
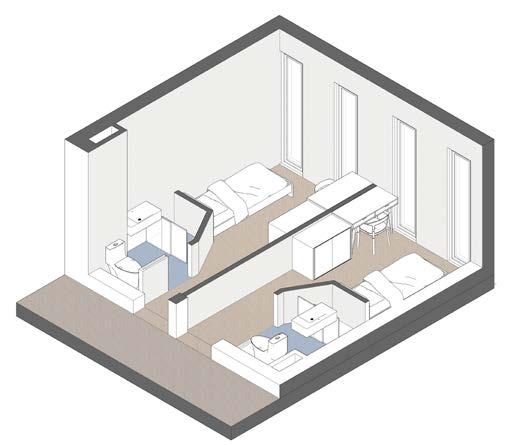
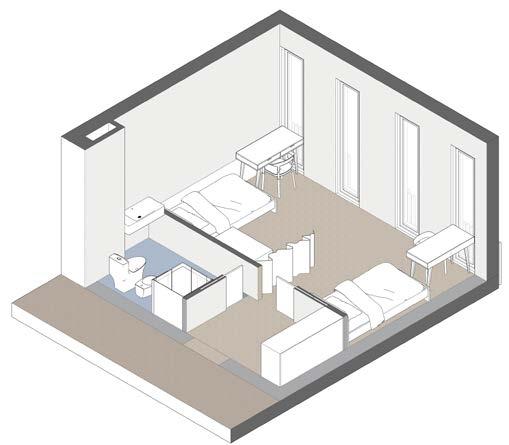
MODULES :
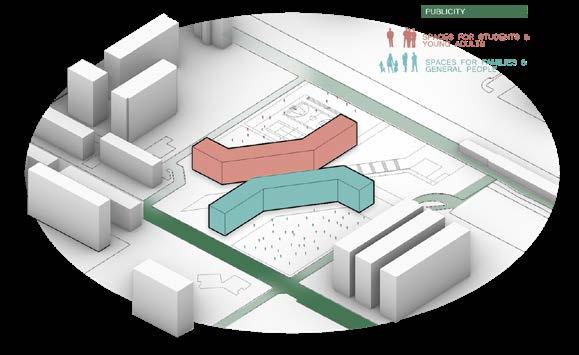
Buildings are assigned according to the levels of privacy . One is dormitary targeing for students and young adults. The other is an apartment wirh varieties of units. Both are designed in modular system as shown.
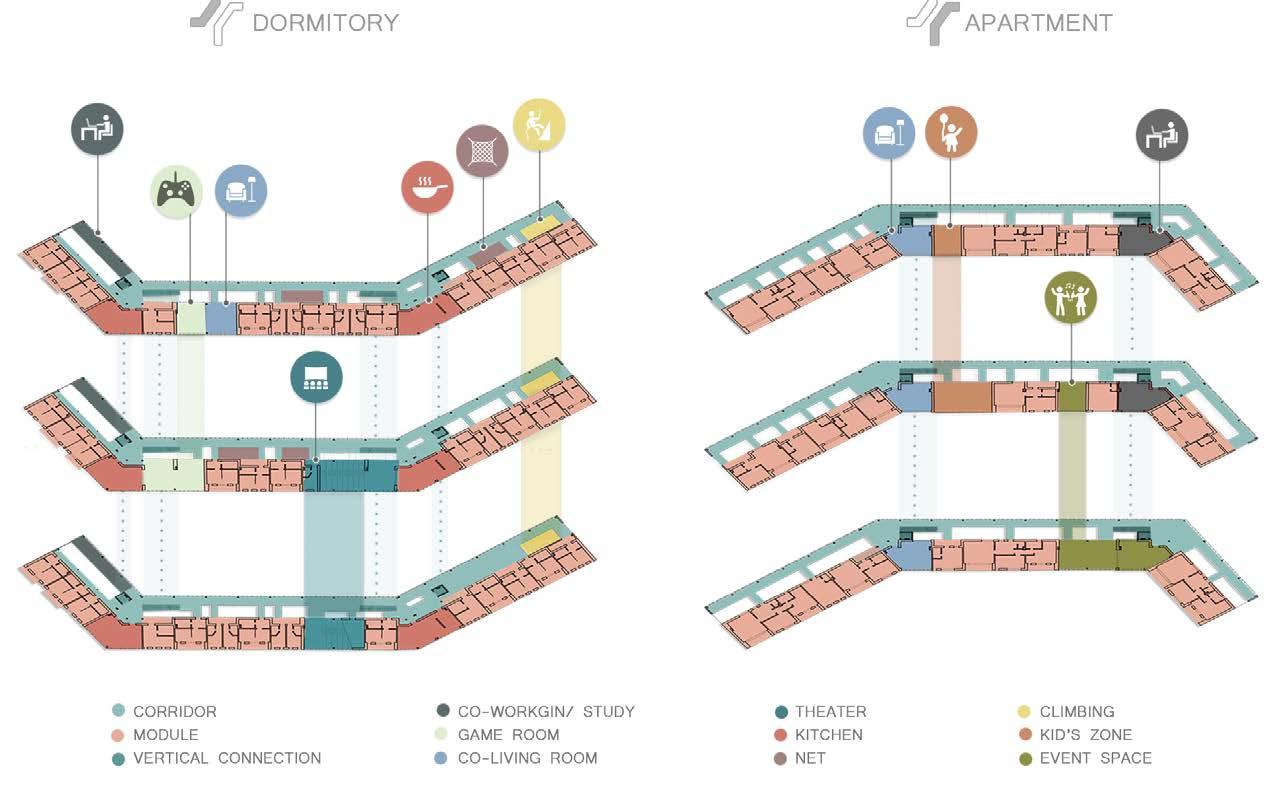
The modules were staggered to have kind of mutual shades and cross ventilation through the rooms in spring and autumn.
30
30 Double rooms, 67%
11 Single rooms, 14%
4 Handicap rooms, 9%
DOUBLE ROOM :
Terrace : Inside & Outside
Size : 24 sq m (4.9*4.9)
Occupancy : 2 person
SINGLE ROOM :
Terrace : Inside
Size : 11.76 sq m
Occupancy : 1 person
1- BEDROOM APARTMENT :
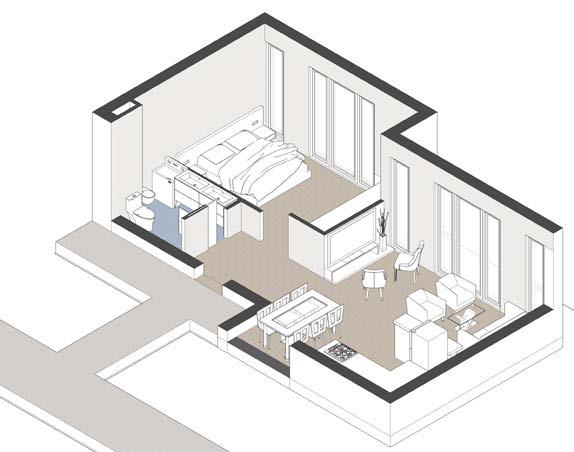
Size :48 sq m
Occupancy : 2-3 person
2- BEDROOM APARTMENT :
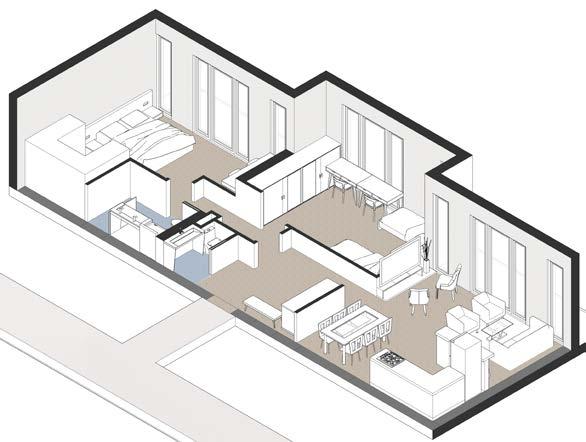
Size : 78 sq m
Occupancy : 4-5 person
31
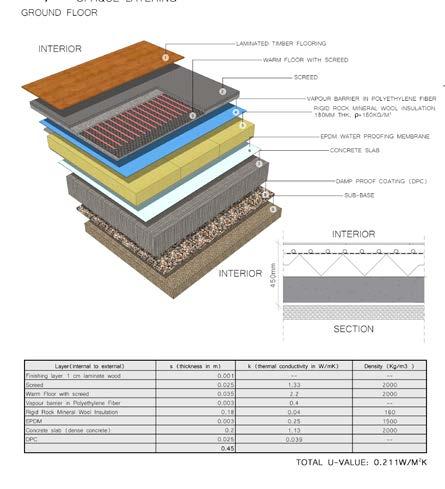
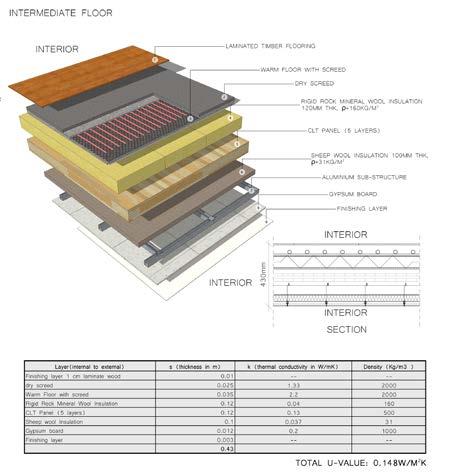
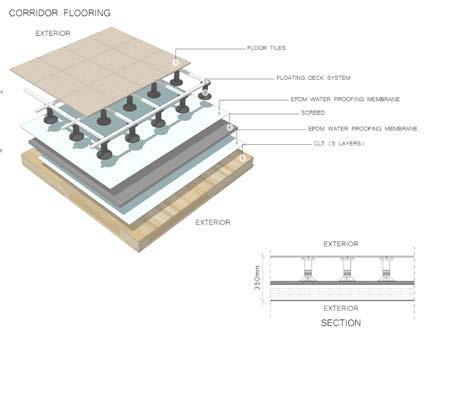
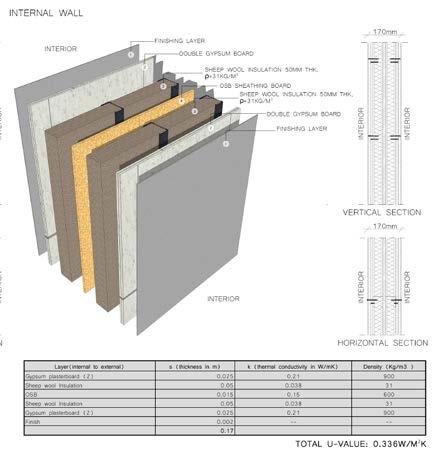
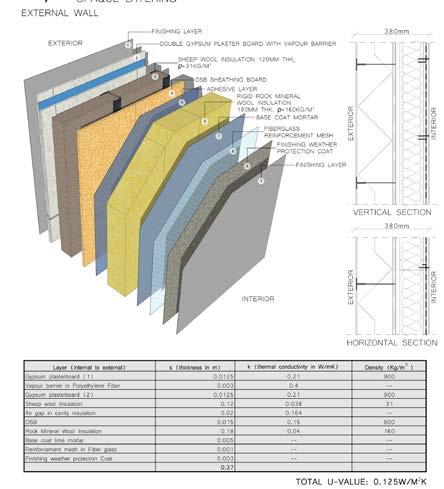
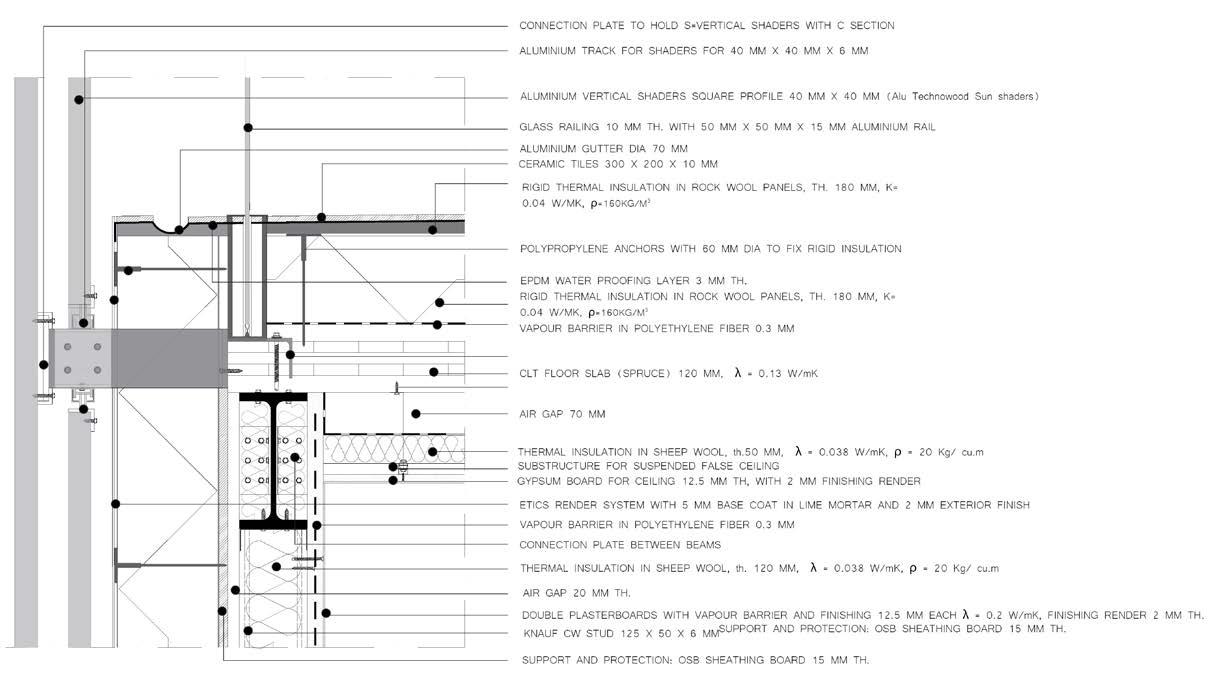
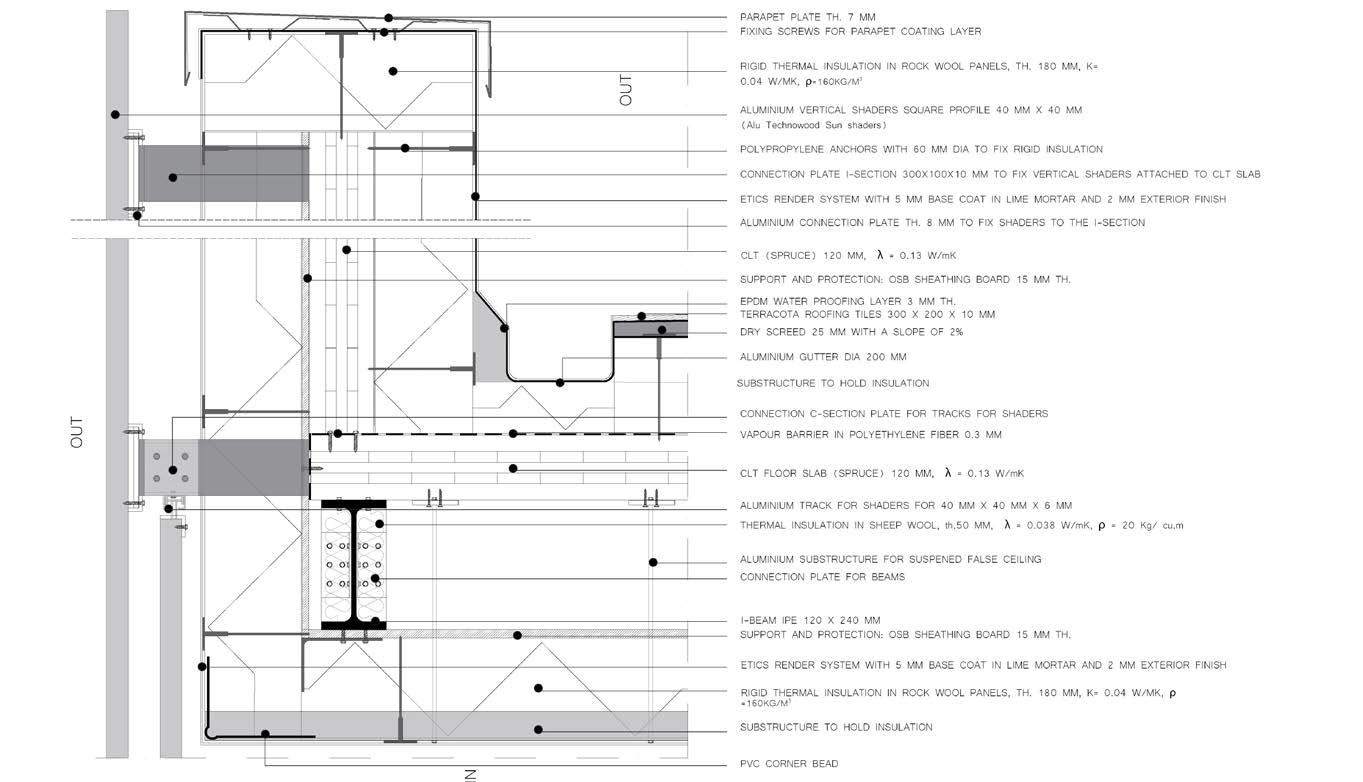
MATERIAL LAYERS
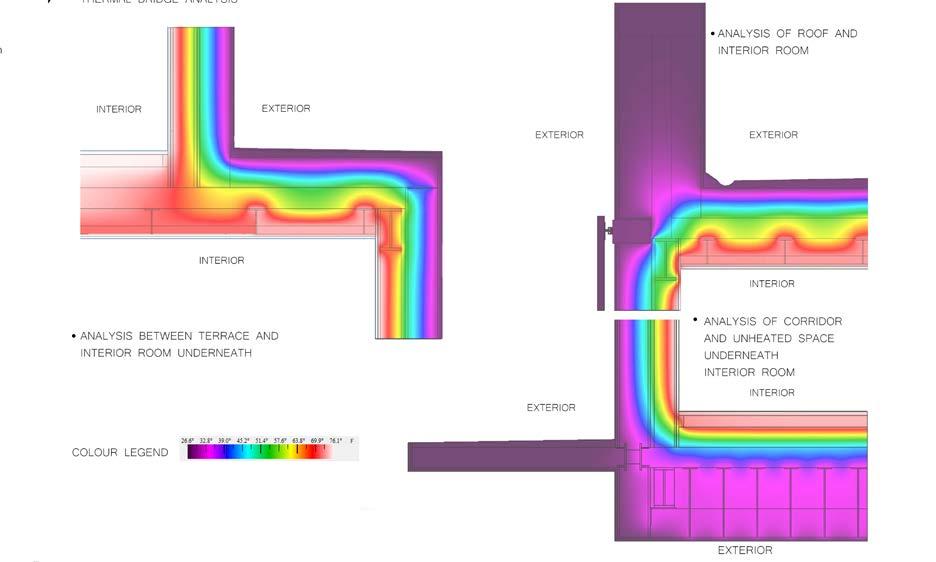
THERMAL BRIDGE ANALYSIS
32
33 OPAQUE DETAILS
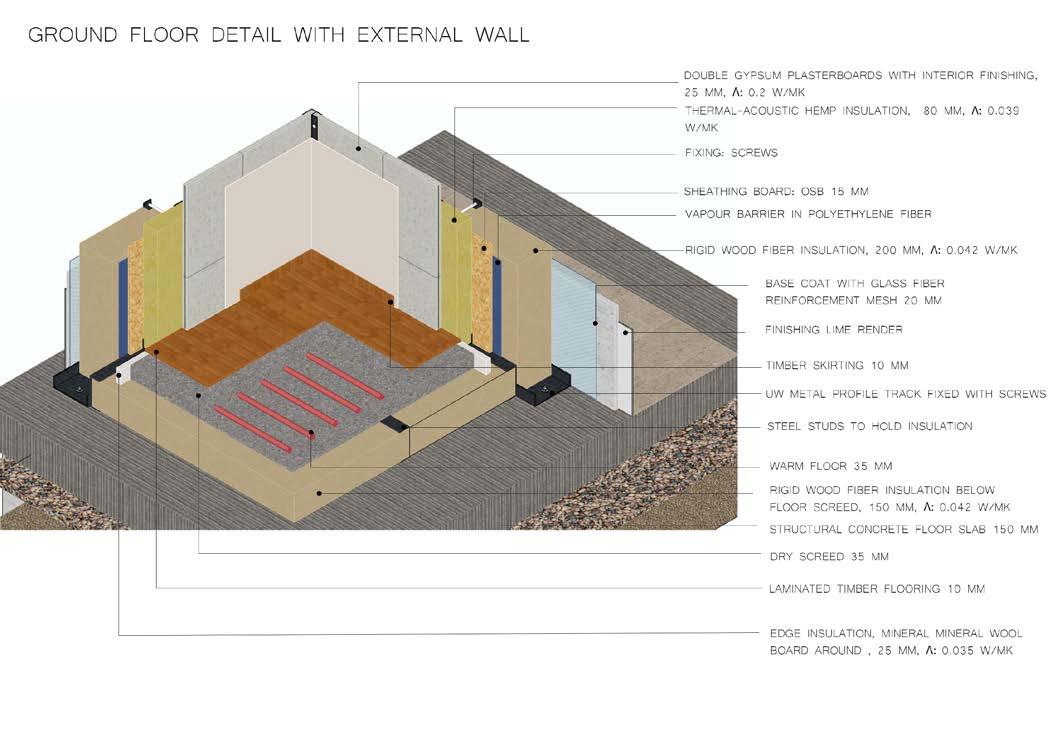
DETAIL A- INTERIOR WALL AND INTERIOR FLOOR DETAIL
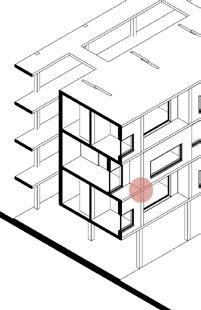
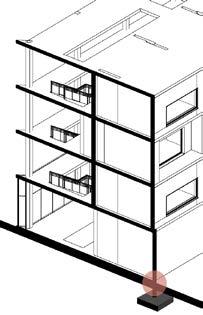
FACADE ELEMENTS
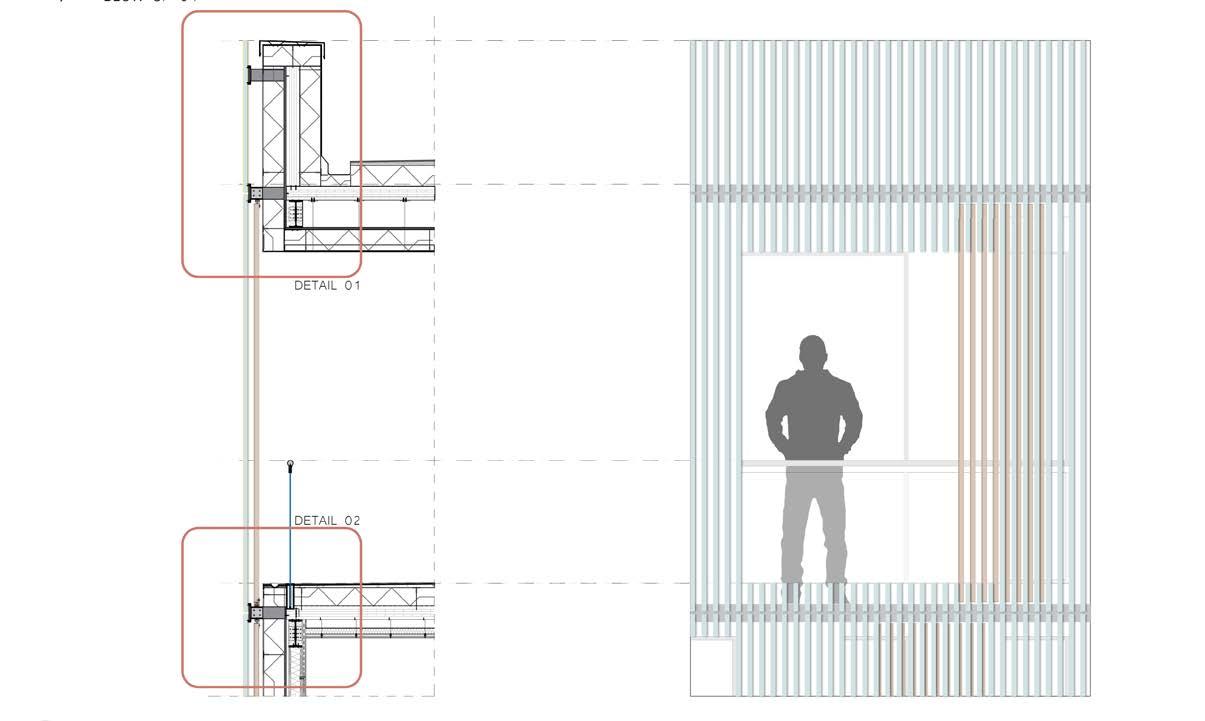
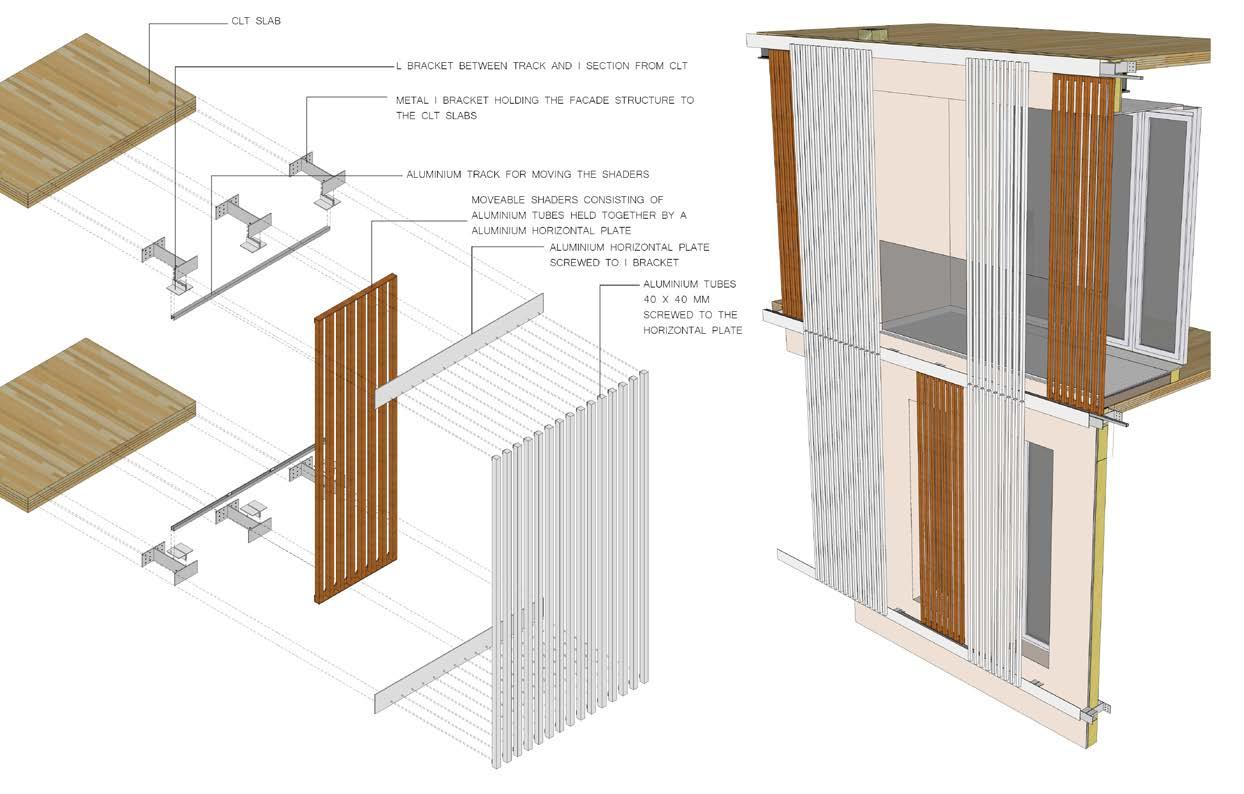
34
Roof FACADE
Balcony
35 DETAIL 01 DETAIL 02
DAYLIGHT ANALYSIS
Besides the construction details of the building the visual comfort of the spaces was optimized especially the ones oriented to East and SouthEast. The aim of this task was to analyze the behavior of the shared spaces of the building.
The false color images in the sheets refer to each optimized solution. Moreover, the parameters to be considered are:

1. Daylight Factor (DF): DF>2%
2. Spatial Daylight Autonomy (sDA): sDA>75% “preferable” for users

55%<sDA>74% “acceptable” for users
3. Annual Solar Exposure (ASE): ASE<10%
As a sample example, the daylight analysis of three spaces on the ground floor of the right building is shown below. After optimization we se considerable improvement in the DF, sDA and ASE of the spaces.

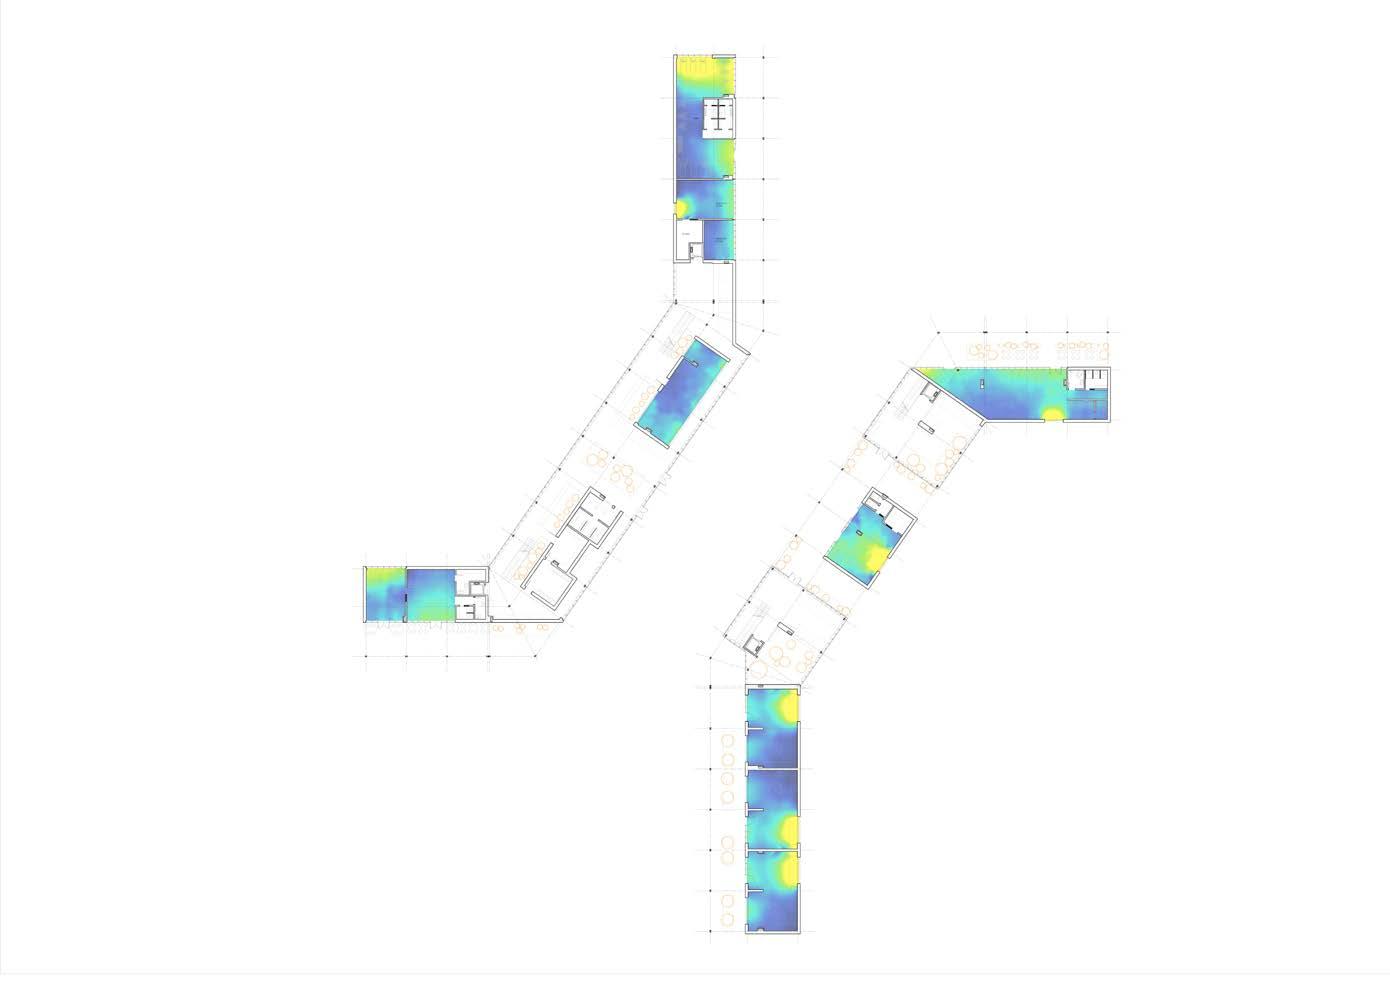
GROUND FLOOR 0.5 1.0 1.5 2.0 2.5 3.0 4.0 5.0 4.80 98 62 2.73 100 9 0 10 20 30 40 50 60 70 80 90 100 Book cafè [%] -43% +2% -85% ASE ASE DF DF OPTIMIZED INITIAL sDA sDA 3.99 99 37 3.64 100 18 0 10 20 30 40 50 60 70 80 90 100 Bakery [%] -9% +1% -51% ASE ASE DF DF OPTIMIZED INITIAL sDA sDA ASE ASE DF DF OPTIMIZED INITIAL sDA sDA 5.00 3.05 2.70 100 100 100 65 16 14 2.88 100 23 0 10 20 30 40 50 60 70 80 90 100 Retail shop 1 Retail shop 2 Retail shop 3 [%] -42% -65% Optimization is not needed.
RIGHT BUILDING
2
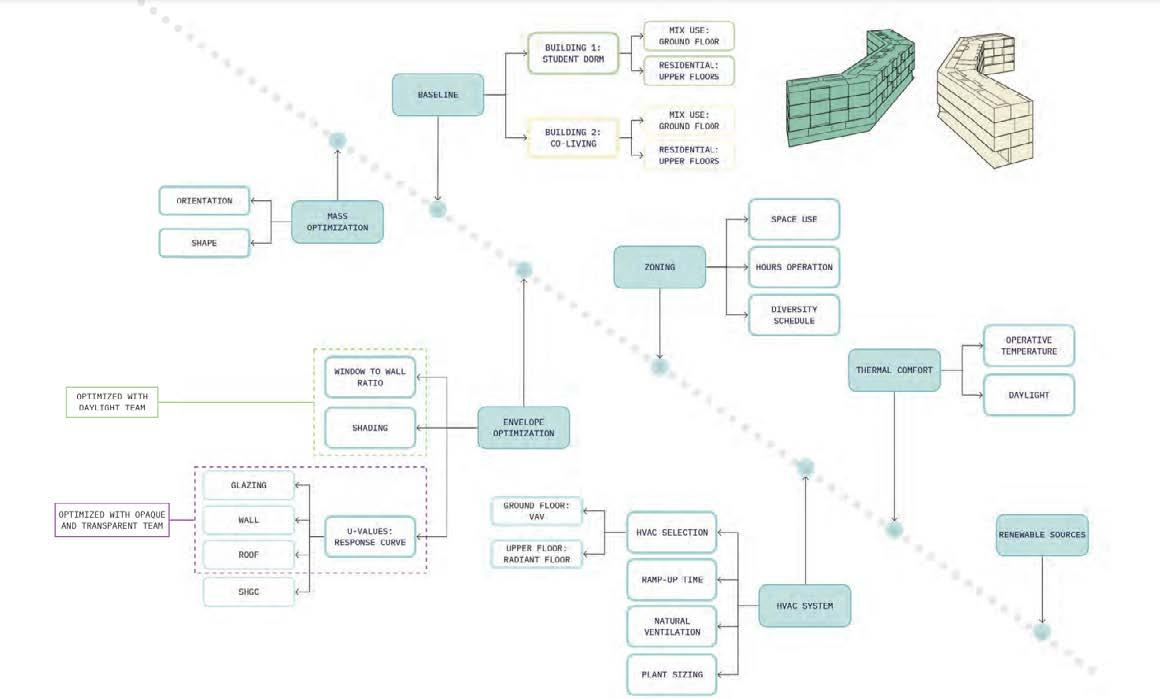
ENERGY ANAYSIS
With the improvement of visual comfort the optimization of energy was a important task for the building. Here we have the workflow of energy optimization from mass optimization to Pv optimization.
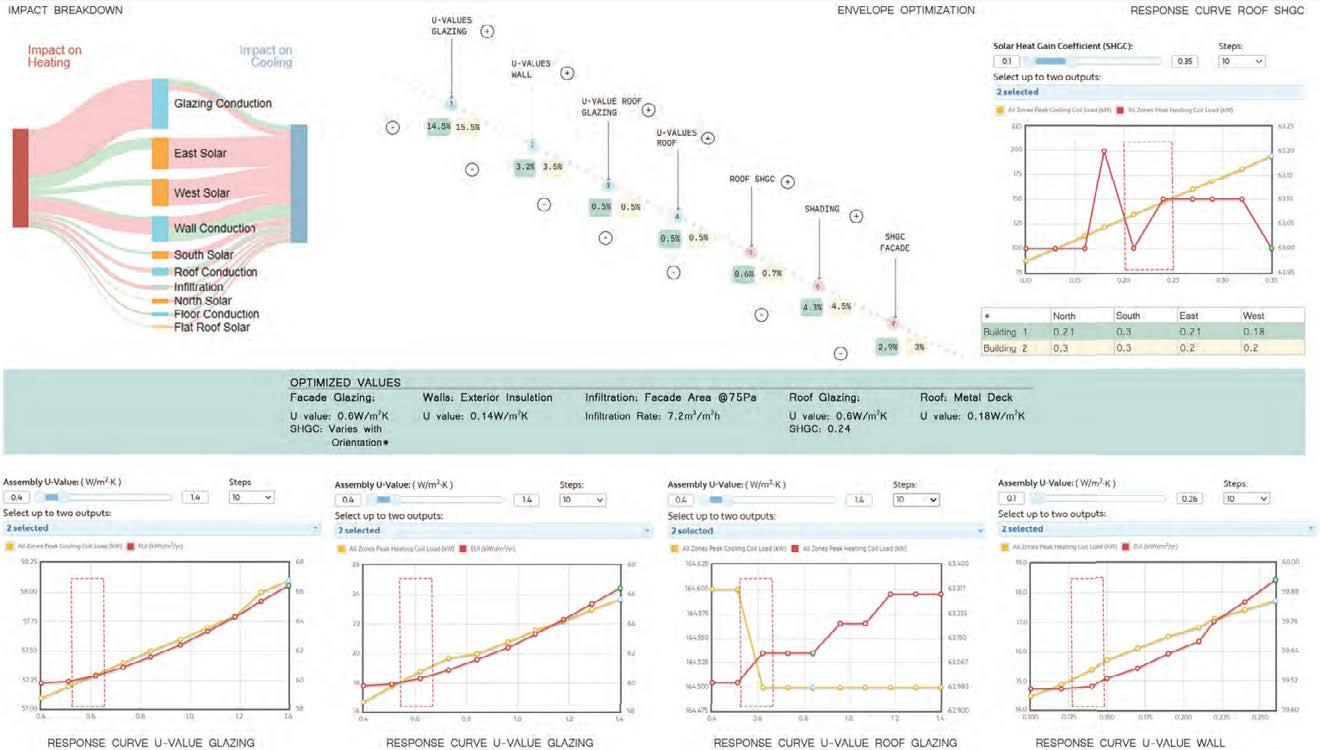
Below we see the steps for envelope optimization. For each envelope paramter, response curves were obtained to find the optimum range of values.
THANK YOU |
