2023 Economic Development

#1 U.S. Midsized Market for Economic Development


$50.2B GDP
$42B GDP

$35.3B GDP
Source: U.S. Bureau of Economic Analysis, 2022 (Lehigh Valley MSA)
Lehigh Valley:
United States:
Pennsylvania:
Source: Chmura Economics JobsEQ (American Community Survey, 2022, 5-year estimates)
$78,287 $75,149 $73,170
Source: Chmura Economics JobsEQ (American Community Survey, 2022, 5-year estimates)
Lehigh Valley: 10.7% United States: 12.5% Pennsylvania: 11.8%$8.1B Manufacturing
$7.5B Health Care & Education
$3.7B* Wholesale Trade
$3.5B Retail Trade
$8.3B* Finance, Insurance & Real Estate
$6.3B Professional & Business Services
$3.3B Transportation
$2.9B Information
Source: U.S. Bureau of Economic Analysis, 2022 (Lehigh Valley MSA)
*(Most recent data available)
16%
Source: U.S. Bureau of Economic Analysis 2022
Source: Chmura Economics JobsEQ, Q3 2023
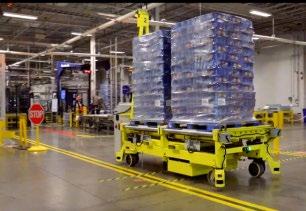
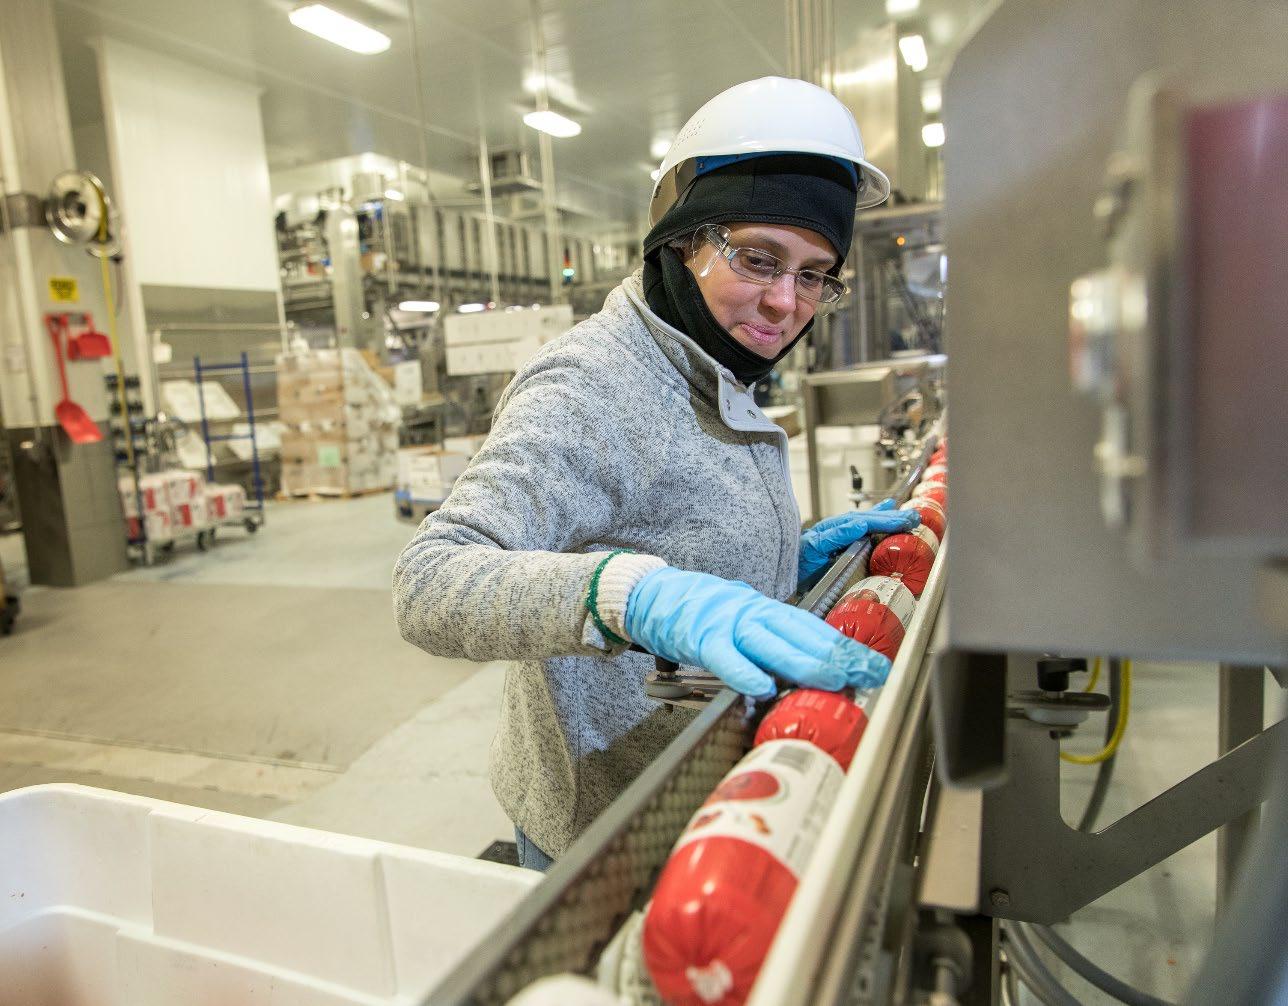
Manufacturing Wages Increasing
Average Annual Wages
$77,866 $55,000 $65,000 $75,000 $85,000 2013 2015 2017 2019 2021 2023


Access to population
Access to markets
Skilled workforce
Existing educational pipeline
Manufacturing heritage

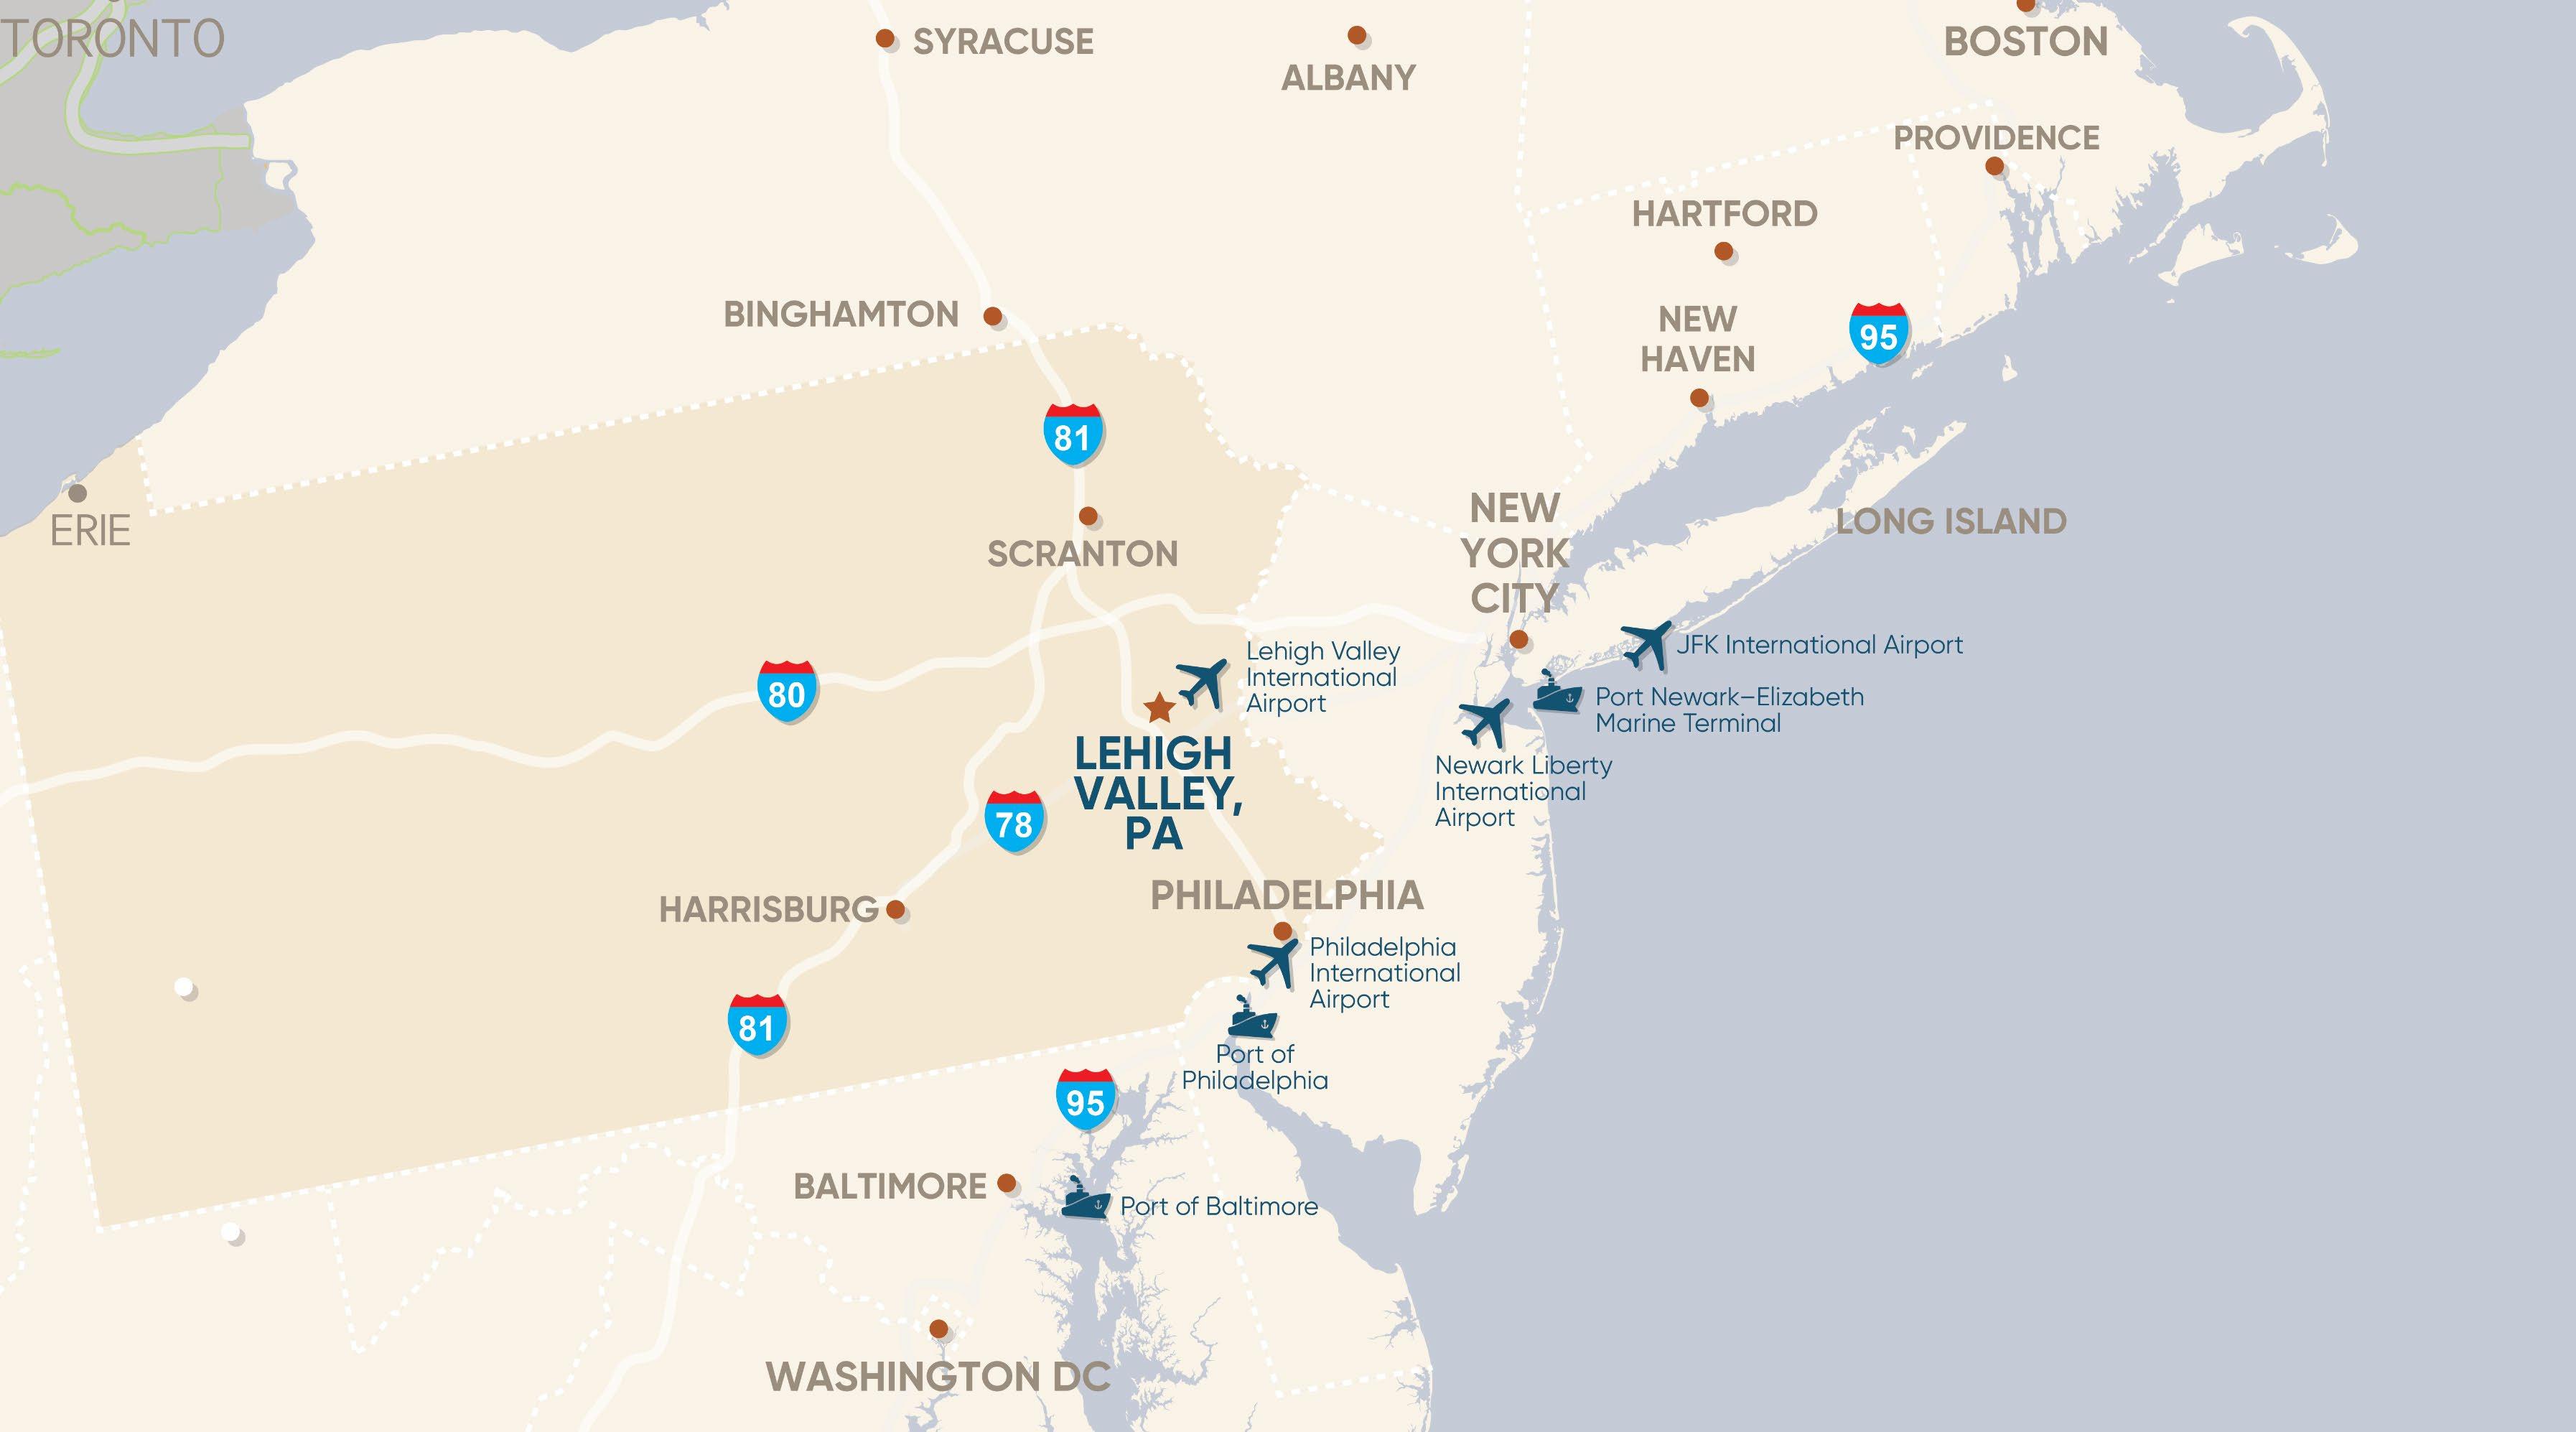
One-third of U.S. Population within a 1-day drive Source:
1.7 Million Labor Force Within an Hour’s Drive

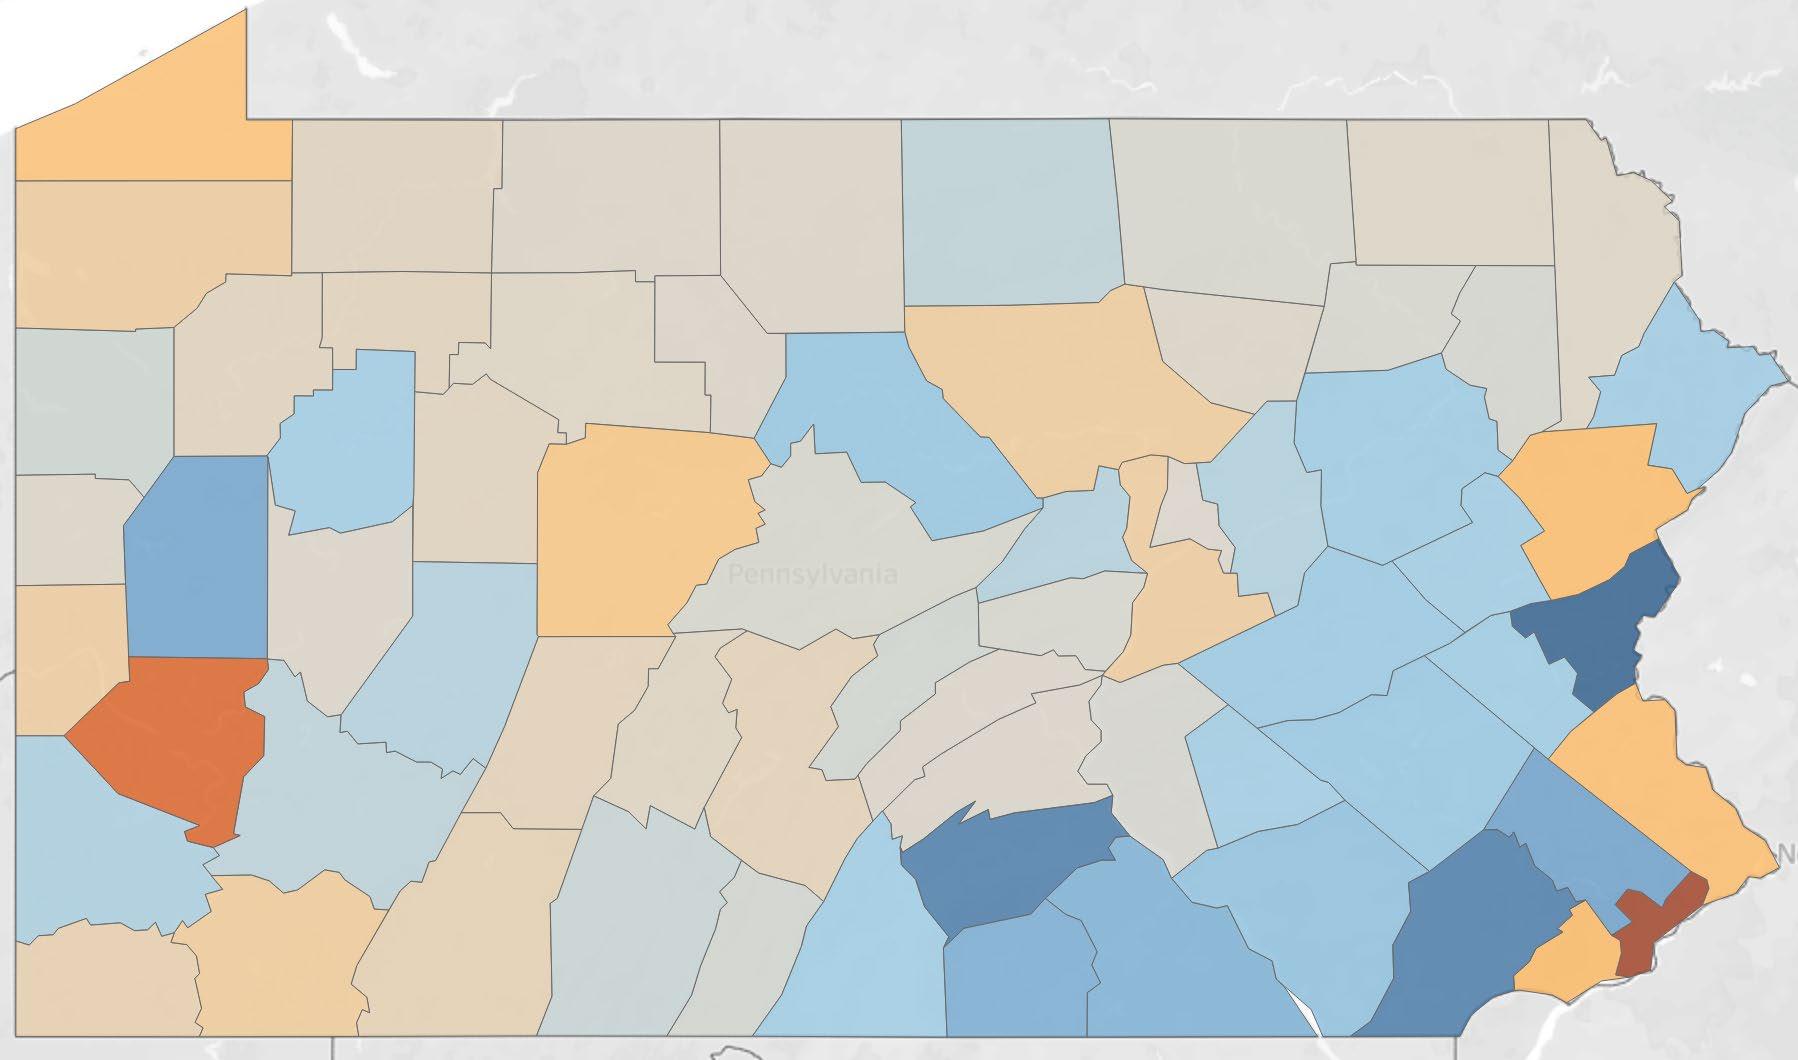
2 of 23 growing counties

Lehigh & Northampton among top 10
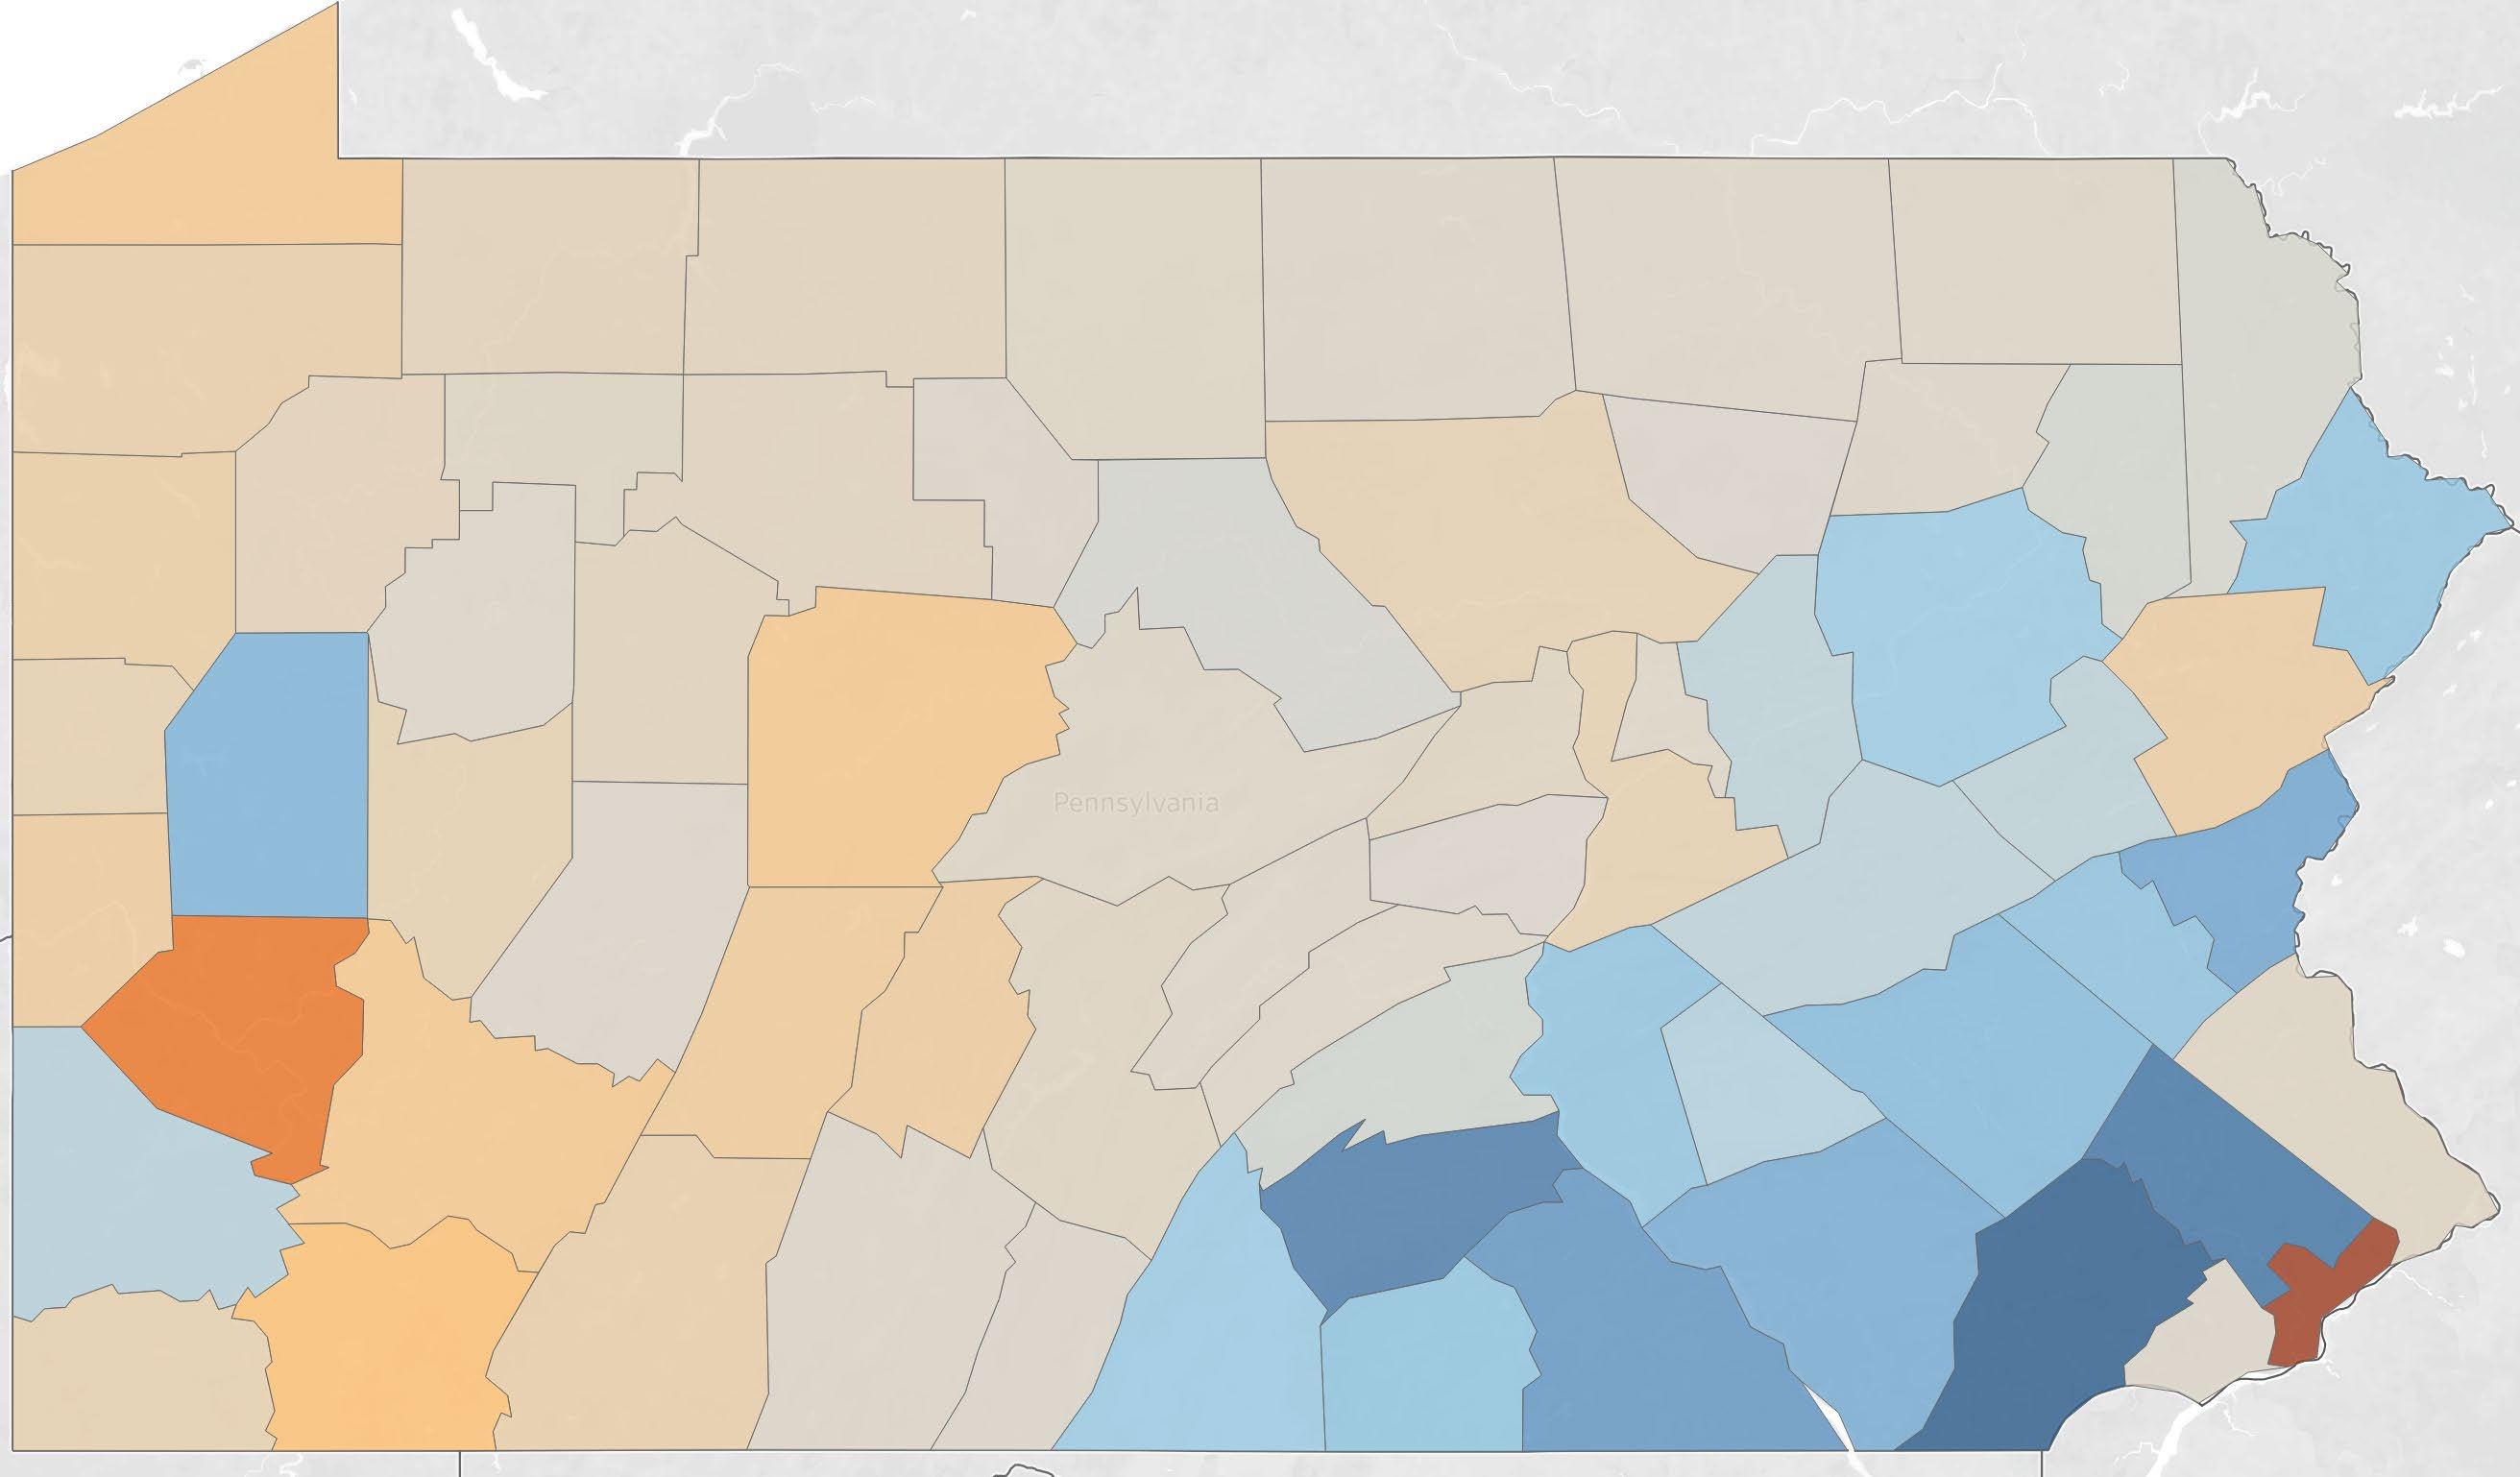
Source: U.S. Census Bureau Population Estimates Program, 2020-2023


Source: U.S. Census Bureau Population Estimates Program, 2020-2022
Higher growth rate than U.S. and Northeast U.S.
Source: U.S. Census Bureau Population Estimates Program, 2020-2022
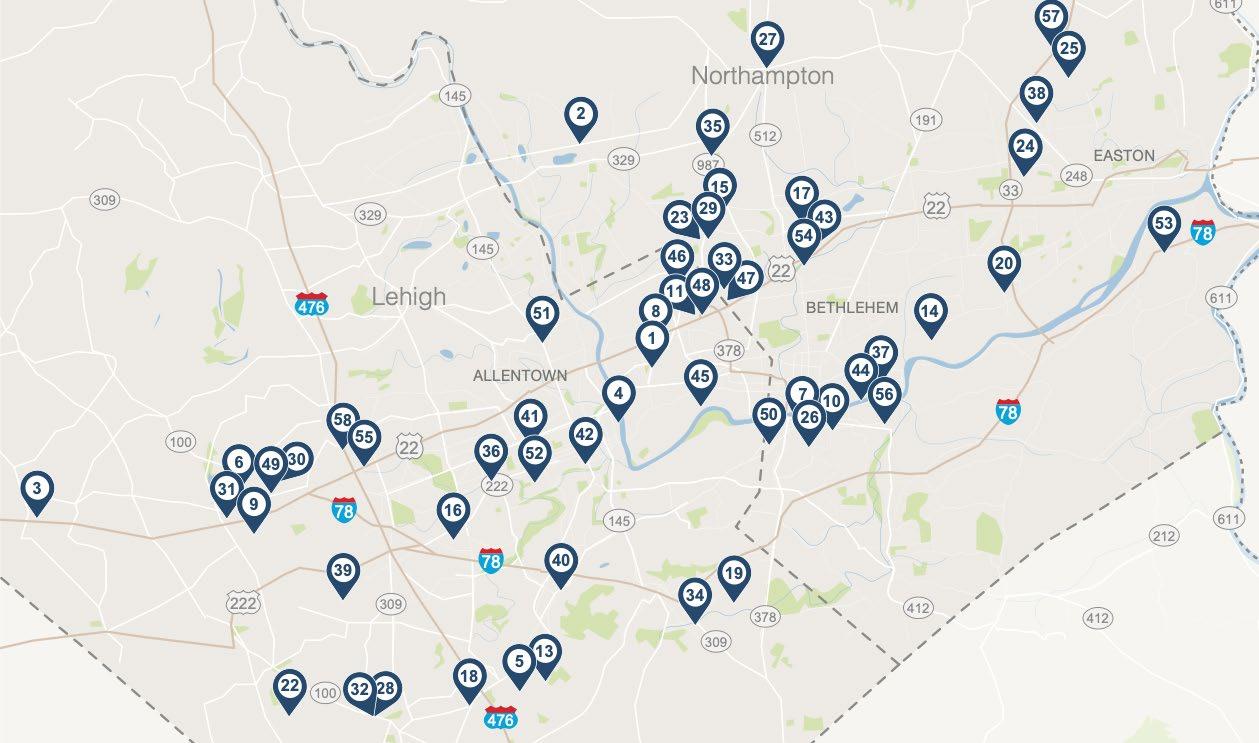


Plastic bottle manufacturer
• Relocated from NJ to Upper Macungie
• 73,000 SF
• 25 new jobs Source:

Plastic bottle manufacturer
• Relocated from NJ to City of Allentown

• 92,000 SF
• 98 new jobs
• $8 million investment


Plastic product manufacturer
• City of Allentown
• AEDC incubator graduate
• Plastic product manufacturing
• 42,000 SF


Refrigerated food & pharma
• City of Bethlehem
• 99,000 SF expansion
• 30 new jobs
• $80 million investment