
5 minute read
Oil Analysis Pitfall!


Factor:
A4P — Sampling Tools & Methods
Advertisement
Level: Platform (P)
Stage:
Sampling Tools & Methods
About:
Accurate sampling is critical when developing a lubrication analysis program. Inaccurate samples can lead to incorrect decisions regarding machine performance.
Learn More: noria.com/ascend/
For better or worse, our world is very connected. Some of these connections allow us to communicate freely, while other parts allow us to gather a whole lot of information. I know that I am not the first person to use the phrase “analysis paralysis,” but it really is relevant, especially when it comes to machine reliability. Don’t get me wrong; analysis is extremely important, but focusing on a single aspect of a report or one specific technology can quickly turn into an issue itself.
I recently had the opportunity to teach an Oil Analysis II class, which included case studies on failure investigations that we have seen or been a part of. Many of these were pretty unique situations and are meant to test how much information the students are able to use and if they could put the new knowledge into practice. Since this was a remote course, not all students were completely active in the exercise, but the ones that were did a very nice job, and it was obvious that they were honing their skills.
There was one case study exercise in particular (involving a CAT wheel loader) that I found interesting. There were some oil analysis values given, along with some pictures from the failure investigation.
Now, anyone that has been through the OA II course or has a good foundation in oil analysis might catch what is going on here, but the folks dealing with the machine had no formal oil analysis training.

The thing that folks noticed most frequently was the cavitation on the piston. And yes, that was part of what was wrong, but when we are looking for the root cause of failure, cavitation isn’t the answer. This exercise was meant to show people that you can’t just focus on one part of the puzzle and get to the solution. They were still in the detection phase of things and called the problem solved when they saw cavitation.

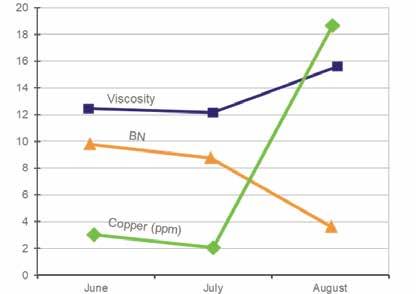
With no water in the samples, I was a bit curious as to what they thought was causing the cavitation or how it was caused inside the cylinder. Air could be the culprit, but this was not likely, in my opinion. I asked them to look a bit more at the oil analysis and determine what had changed. Base number was the first thing that they went to. It isn’t inaccurate to say that the base number changed, but still, what was the cause of all of this?
Diving more into the oil analysis part of the exercise, we see an increase in three key elements that showed up out of nowhere: boron, sodium and potassium — a few of the key building blocks for many coolants. We had gone over coolants and these building blocks about an hour before, and nobody caught this. They were too focused on the image of the piston and trying to figure out what the filtergram patch was telling them. ML
About the Author
Jeremie Edwards is an Associate Technical Consultant at Noria Corporation. He is one of an elite few certified by the International Council for Machinery Lubrication (ICML) as a Machinery Lubrication Engineer (MLE) and did so in order to become the best advisor for clients when it comes to their continuing education needs. Before joining Noria, Jeremie served six years in the U.S. Army as a parachute rigger and was deployed in Afghanistan, Uzbekistan, Turkey and Germany. Contact Jeremie at jedwards@noria.com
Contamination Control Objectives: Cleanliness and Dryness
With contamination being the leading cause of machine failure, one of the most important sections of a lubrication program is contamination control. Most plants I have visited have spent a lot of time and money creating a defensive machine design. While this is a proactive step to help machines ward off contaminants, this is really just a starting point. Contamination control objectives state how clean/healthy the lubricant inside a machine should be. This is a true measurement of how good or bad your contamination control program is.
Before defining contamination control objectives, it is best to have a good understanding of what contamination means in relation to lubricants. Simply put, contamination is anything that can damage or harm a lubricant or machine, such as solid particles, water and heat. When setting objectives, it is best not to use a broad-stroke, or a one size fits all approach. There are many factors that should be considered, such as machine type, risk of failure, cost of downtime and cost to repair. The objectives for each of these factors may be quite different due to the fact that contamination could affect them in different ways.

Target Cleanliness
ISO 4406:17 is the most widely used reporting standard for fluid cleanliness. This method assigns a code number to particles at three micron levels: 4, 6 and 14. Instead of a report showing the number of particles at each of these micron sizes (which could be in the thousands), the code is used for quick reference; instead of reporting actual particle counts such as 1752, 517 and 55, the code would report 18/16/13.
Cleanliness targets are generally assigned by machine because some machines have tighter tolerances than others. For example, a Target Cleanliness Level for a hydraulic system might be 15/12/10, which would be much lower than a gearbox of the same criticality, 17/14/12. Hydraulics systems with components such as servos are at a far greater risk of failure due to particle contamination than most gearboxes. Another important note to consider when initially setting targets is not to start too low. Targets need to be attainable and can be readjusted over time.
Target Dryness
If you have been in the lubrication world for any amount of time, you know just how harmful water can be for machines and lubricants alike. Water is not a good lubricant for machine components. Moisture targets are much the same as the cleanliness targets in that you want to stay under the proposed limit. By using a calculator available on the Machinery Lubrication website, the target dryness for a middleof-the-road criticality hydraulic system came to 100PPM. At the same time, the gearbox with the same criteria would have a target of 300 PPM. With this calculator, you can quickly get cleanliness and dryness targets by answering only six questions.

Temperature
While particle and moisture contamination are often monitored, one factor that doesn’t get much attention is temperature. When you have a hundred to a thousand assets running in a plant that is already hot due to the process, there is a good chance your machines are being exposed to high temperatures. But how hot is too hot? This one is a little trickier to set than cleanliness and dryness targets, as there is more data to consider. In general, temperature objectives list the maximum temperature at which a machine or component should run. Remember, viscosity is the single most important property of a lubricant; as temperatures go up, viscosity goes down. If your machines are running hotter than they should, you are most likely not protecting your lubricated components.
It may seem like a big undertaking to set up contamination control objectives on your site. Break it down into small pieces and start with the most critical machines.
The life extension of lubricated components can be drastically increased if you can keep the lubricant cool, clean and dry. These objectives can help keep score on how well you are fighting off contaminants at your plant.
About the Author
Travis Richardson is a Technical Consultant for Noria Corporation. He holds a Level II Machine Lubrication Technician (MLT) certification and a Level II Machine Lubricant Analyst (MLA) certification through the International Council for Machinery Lubrication (ICML). He is the Product Owner of LubePM, Noria’s digital lubrication program manager.


