Copyright © 2024 Coffee Directorate
All rights reserved. No part of this publication may be reproduced, distributed, or transmitted in any form or by any means, including photocopying and recording without prior written permission of the Directorate, except in the case of brief quotations. For permission requests, write to the author, addressed “Attention: Permissions Coordinator,” at the address below.
The Director,
Coffee Directorate Office, 10th Floor, Coffee Plaza Building Exchange Lane off Haile Selassie Avenue, P.O Box 30566-00100, Nairobi, KENYA Telephone: 0710670026, Email: directorcoffee@afa.go.ke / info@afa.go.ke Website: www.afa.go.ke
BBC Bacterial Blight of Coffee
CAN Calcium, Ammonium and Nitrate
CBD Coffee Berry Disease
CC Clean Coffee
CLR Coffee Leaf Rust
CMA Capital Markets Authority
EU European Union
FY Financial Year
GAPs Good Agricultural Practices
GBE Green Bean Equivalent
Ha Hectarage
ICO International Coffee Organization
KALRO Kenya Agricultural and Livestock Research Organization
KES Kenya Shillings
Kg(s) Kilogram(s)
KNBS Kenya National Bureau of Statistics
MoALD Ministry of Agriculture and Livestock Development
MT Metric Tonnes
NCE Nairobi Coffee Exchange
NCPB National Cereals and Produce Board
USA United States of America
USD United States Dollar
NPK Nitrogen, Phosphorus and Potassium
VAT Value added tax
Auction: The system under which clean coffee is offered for sale at a coffee exchange
Clean coffee: coffee bean or dried seed of the coffee plant separated from non-food tissues of the coffee fruit where the silver skin is reduced to the maximum possible extent
Coffee: means the plant botanically known as coffea species (L.) and includes the fruit, whether on the plant or detached therefrom, the seed in form of either buni, parchment coffee, clean coffee, roasted beans or ground coffe
Grower : means any person who cultivates coffee in Kenya and may for purposes of licensing, include; co-operative societies, unions, associations and estates
Estates: an area of land or group of parcels of land under coffee not being less than five acres in size in aggregate or land under coffee which has an average annual production of not less than twenty thousand kilograms of cherry over a period of three years
Direct sale: a contractual arrangement between a grower, a co-operative society, society, union, grower-miller, estate or an association of coffee growers and an overseas buyer or local roaster for the sale of own clean coffee based on mutually accepted terms and conditions enforceable in law
The Coffee Directorate’s mandate is to develop, promote and regulate the Kenyan coffee industry. The Crops (Coffee) (General) Regulations, 2019, Article 4 (2) (e) states that Coffee Directorate shall collect, collate and maintain a data base and disseminate information on the coffee industry. The directorate publishes the coffee year book annually to disseminate information on the entire value chain.
The Directorate is therefore pleased to publish and share with the public the Coffee Year Book for the year 2022/2023. This year book provides information and reference points to all stakeholders in the coffee industry. This publication is an outcome of the Directorate’s consulting and engaging stakeholders in collecting and collating information for enriching industry’s database.
The Directorate would like to thank the National Government, the County Governments, Kenya Agriculture and Livestock Research Organization - Coffee Research Institute, Kenyan universities, Nairobi Coffee Exchange, Kenya Trade Network Agency (KenTrade), Growers, Millers, Buyers and all other coffee value chain players for their invaluable support during the data collection, collation and validation which immensely improved the quality and the content of this annual publication.
On behalf of the Directorate, I take this opportunity to extend my appreciation to the Acting Director General, Agriculture and Food Authority (AFA), AFA staff and all stakeholders who contributed in making this publication a reality. My sincere hope is that readers will find this yearbook invaluable.
Dr. Benson O. Apuoyo, PhD. Acting Director, Coffee Directorate
Ithank all coffee value chain players for their support and cooperation during data collection for the publication of the Coffee Year Book2022/2023. I further take this opportunity to convey my sincere gratitude to the Acting Director Coffee Directorate for their insights towards publication of this year book. Further, I recognize and appreciate the critical role played by the Coffee Directorate staff during the entire process from data collection to validation. My special gratitude goes to the Coffee Directorate’s departments, CRI, AFA Research and Statistics
Section for key role played specifically the team of editors Dr. Javan Ngeywo, Calvin Baraka, Elisha Mtogo and Dr. Jane Cheserek for their immense input both technical and format.
Erick O. Onyuka
Acting Deputy Director, Technical and Advisory
Coffee exports during the year was 47,957 MT GBE, an increase from 42,858 MT GBE the year 2021/2022, while imports reduced to 1,392 MT GBE from 3,769 MT GBE the previous year. The value of exports was USD 252.12 Million. Domestic consumption level increased from 1722 MT of the year 2021/2022 to 2050 MT within the current this an increase of 19% Similarly the number of coffee houses increased from 506 to 791 houses.
During the Coffee Year 2022/2023 a total of 48,649 MT of clean coffee was produced compared to 51,853 MT recorded in the year 2021/2022, a decline of 6%. This was attributable to erratic weather pattern and biannual coffee production nature. The value of coffee produced was USD 204.5 Million. It is projected that during the year 2023/2024,
production will be 54,800 MT of clean coffee. This is attributable to the concerted effort by the government in ensuring availability of fertilizer and increased access to extension knowledge.
Despite the decline in production, the area under coffee increased to 111,902 Ha from 109,400 Ha in the previous year. The increase in area under coffee production was as a result of provision and access to good quality coffee seedlings by the growers. There were 605 cooperative societies with 1,122 factories. The highest pay-out rate was KES 102.05 per Kg of cherry. Average pay-out rate for the year was KES 71.97 per Kg of cherry.

Index
Area (ha)
Production (Kg)
Yield (Kg/ha)
National (109,385) National (111,902)
Estates (25,300) Estates (28,123) Co-ops (84,085) Societies (83,779)
National (51,852,633.67)
(14,160,448.58) Co-ops (36,290,398.21)
Bulk (8,800.66)
(431.60)
In the coffee year 2022/2023, global coffee production rose by 0.1% to 168.2 million bags. The world of coffee is divided between the growing Americas and the contracting rest of the world, a growth rate that belies the significant shifts occurring at the regional level. The 4.7% and 7.2% declines in production in Asia & Oceania and Africa, to 49.84 million bags and 17.9 million bags, respectively, can be ascribed to unfavorable weather that has a detrimental impact on important producers in the regions, especially Vietnam, Côte d’Ivoire, Uganda and Kenya. The Americas, particularly South America’s 4.8% gain, which was mostly driven by Brazil’s 8.4% increase in biannual production, completely offset the size of the decline in the two regions’ outputs (ICO, 2023).
Africa’s coffee production decreased by 7.2% in coffee year 2022/23 to 17.9 million bags, from 19.3 million bags in the previous coffee year, with the market share of the world’s output falling slightly to 10.6% from 11.5%. Kenya is the third largest Arabica producer in Africa, and its output decreased by 6% to 0.81 million bags in coffee year 2022/23 from 0.86 million bags. This occurred because of drought and Coffee Berry Disease in the Central Highlands which is a main coffee growing area. The total area under coffee during the year 2022/2023 was 111,902 Ha with a production of 48,649 MT of clean coffee valued at USD 204.5 million. The top five producing Counties were Kiambu (19.45 %), Kirinyaga (17,28%), Nyeri (12.98%), Murang’a (10.54%) and Kericho (9.71%). It is projected that there will be an increase of production in 2024/2025 to 54,800 MT.
Coffee producers in Kenya are categorized into cooperative societies and estates (medium and large scale). During the 2022/2023 coffee year there were 2,584 active estates. The smallholder
farmers are distributed across the 637 cooperatives. The coffee value chain involves various players both from the government and private sector. These players participate directly or indirectly in commercial activities involving coffee in their areas of operations, hence supporting rural economy. The socioeconomic benefit of coffee subsector is critical given its contribution to foreign exchange earnings, agro-processing, infrastructure and social investments, job creation and food security. Specifically, coffee contributes 0.3% to the Gross Domestic Product (GDP), hence a major source of livelihood to Kenya and rest of the world (KNBS, 2023).
Coffee was introduced by The Holy Ghost Fathers of the French Catholic Church who initially brought the Bourbon seeds to mainland Tanzania (notably Bagamoyo and Morogoro) in 1863 and were finally introduced to Kenya through Bura Taita Hills in Kenya during the 1890s. During the same period, the protestant Scottish missionaries were planting the Mocha plants to experiment on them in their respective stations including Kibwezi and Kikuyu (Mureithi, 2008). A special variety of coffee named “French Mission” coffee, was selected through many years of coffee cultivation under different environmental. Coffee was then planted in restricted to few estates and the natives were not allowed to cultivate it. Currently coffee is grown in 33 counties spread within Central, Eastern, Rift Valley, Western, Coast and Nyanza Regions. Coffee is grown in high altitude areas of 1400-2200 Meters above sea level (a.s.l) with temperatures ranging from 15 to 24 0C coupled with rainfall average range of (900-1400) mm per annum.
Coffee is grown in 33 counties categorized into regions namely, Central and Nairobi, North Rift, Central & South Rift, Lower Eastern, Western and Nyanza. This is illustrated in Figure 1.
Kenya predominantly produces Arabica coffee with less than 1% of the total production being Robusta coffee. The Arabica coffee varieties include two improved coffee varieties (Batian and Ruiru 11) which are disease-resistant, and three traditional coffee varieties (SL28, SL34, and K7) which are susceptible to major coffee diseases. Robusta is grown in the low-altitude regions, around the Lake Victoria Basin.
Arabica coffee (Coffea Arabica)
Batian: This variety was released in 2010. It has tall traits with characteristics resembling those of Cultivar SL28 in its vegetative aspects. The endosperm of the beans is green, big, bold, and the center cut is primarily single and straight. It is characterized by good beans with high cup quality. The variety is resistant to both CBD and CLR. Batian is planted at a density of 1905 trees/ Ha.
Ruiru 11: This variety was released in 1985 with the prefix “Ruiru” which indicates the breeding place, and code numbers “11” stand for the first release and one-way cross, respectively. It has a compact growth characteristic with resistance to Coffee Berry Disease (CBD) and Coffee Leaf Rust (CLR). The planting density is 2500–3300 trees/ha as opposed to 1300 trees/ha for traditional types.
SL 28 cultivar: This variety was selected from the Tanganyika drought-resistant genotypes at the Scott Laboratories, which is now the National
Agricultural Research Laboratories (NARL). The variety has bold beans with fine liquor suited for medium to high altitudes and its cup quality is excellent. Its shoot tips are green but sometimes bronze and the young primaries insertion angle is primarily semi-erect. SL28 produces a high yield and its planting density is 1300 trees/Ha. The variety is susceptible to CBD, CLR, and Bacterial Blight of Coffee (BBC).
The SL 34 variety: The variety was selected from French Mission Coffee at the former Scott Laboratories. It is primarily distinguished by dark bronze shoot tips with a small number of green-tipped strains. It is well-suited to highaltitude regions with heavy rainfall. It is a high yielder and of excellent coffee cup quality with a planting density of 1300trees/Ha however, it is susceptible to CBD and CLR.
K7 Variety: The variety was selected at Lengetet Estate in Muhoroni. It has good bean and liquor qualities and is suitable for low-altitude zones where Leaf Rust is prevalent. It is resistant to some races of Coffee Leaf Rust and partially resistant to Coffee Berry Disease. The variety is a high yielder with a planting density of 1300 trees/Ha. The tree’s young shoot tips have an intermediate bronze color.
Robusta coffee (Coffea canephora) is cultivated in low altitude zones and is characterized by its beans having a stronger, bolder flavor compared to Arabica coffee. It is a high yielding coffee species when compared to Arabica species.

There are a number of public institutions involved in the development, regulation and promotion of the coffee subsector in the country. These include National Government Ministries & Departments and Semi-Autonomous Government agencies. These include Office of the Deputy President, Ministry of Agriculture and Livestock Development, State Department for Agriculture, Ministry of Cooperatives and Micro Small & Medium Enterprises (MSME) Development, Investment, Trade & Industry, Foreign & Diaspora Affairs, National Treasury & Planning, State department of irrigation, State department of Youth Affairs, EAC and all the County Governments.
Agriculture and Food Authority (AFA)-Coffee Directorate (CD) is the regulator of the coffee subsector in Kenya. Key Government Agencies supporting the subsector include The Kenya Agricultural and Livestock Research Organization (KALRO)-Coffee Research Institute (CRI), Kenya Trade Network Agency (Ken Trade), Kenya Export Promotion and Branding Agency (KEPROBA), Kenya Plant Health Inspectorate Service (KEPHIS), Capital Markets Authority (CMA), Nairobi Coffee Exchange (NCE), New Kenya Planters Cooperative Union (NKPCU), among others. Private sector stakeholders involved include; smallholder coffee growers, estate growers, cooperative societies, coffee buyers, brokers,
coffee millers, warehousemen, roasters, traders, retail chains, coffee houses, certification agents, financial institutions and Non-Governmental Organizations play key role in the coffee value chain.
Smallholder coffee farmers are organized into cooperative societies for primary processing, and marketing. Co-operative societies are member-based private entities but have public interest. Medium and large scale producers are categorized as estates. During the year 2022/2023, the number of active estates were 2,749 while co-operative societies were 605 with a total of 1,122 factories. The role of Cooperatives is to produce, aggregate, undertake primary processing, transport, market, and facilitate access to finance and farm input for members. However, over the recent past, some coffee cooperatives societies have shown institutional and governance weakness leading to poor financial management and administration resulting to high levels of operational costs and indebtedness. During the crop year 2022/2023, there were 236 licensed coffee nurseries to raise coffee seedlings for planting.
In 2022/2023, twenty-one (21) commercial coffee millers were licensed by the respective county governments to mill coffee for growers as shown in Table 1. All growers entered into milling agreements with respective millers before milling activities and Millers were obligated to provide milling reports to the growers.

Eighteen (18) grower marketers were licensed to market their own coffee through the direct sale (second window) as shown in Table 2. This was a transitional year as the industry pursued full implementation of the Crops (Coffee)(General) Regulations, 2019, which abolished the Coffee Marketing Agents and replaced them with Brokers.
Table 3 lists commercial marketing agents and brokers that were licensed to offer coffee at the Nairobi Coffee Exchange (NCE) on behalf of growers.
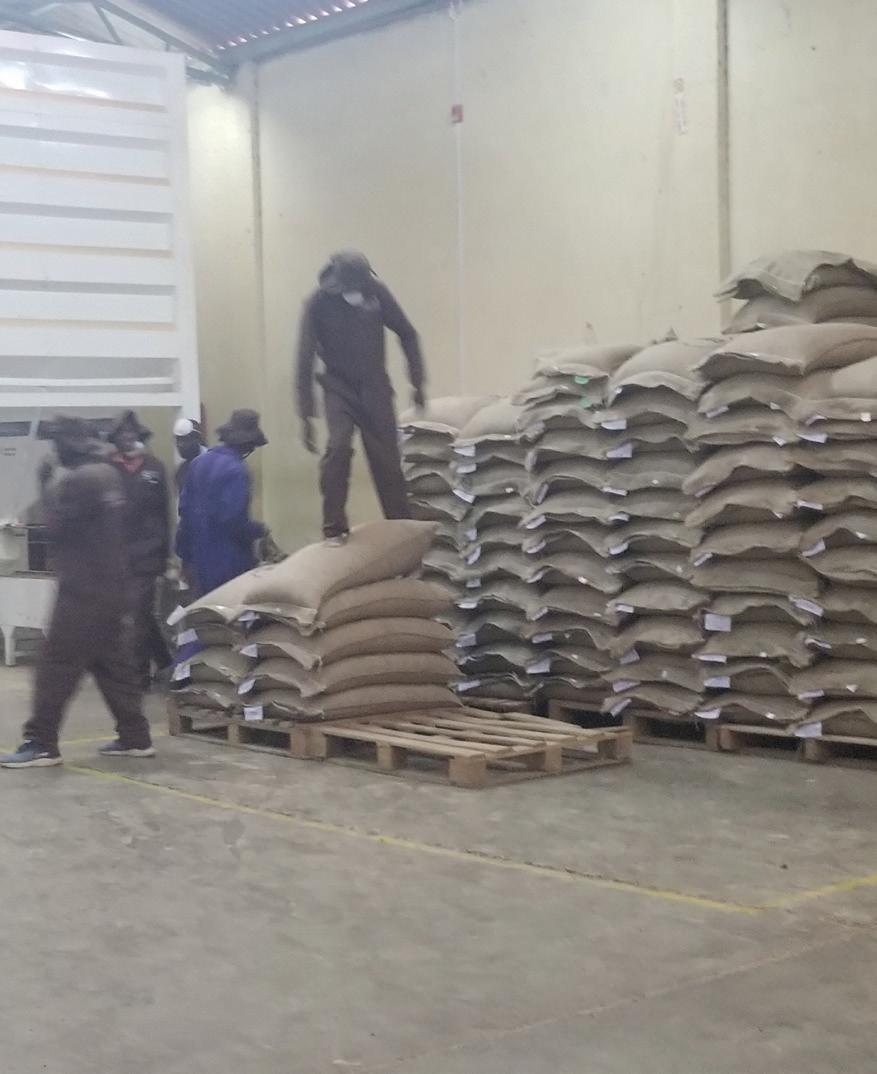
During the same period, the Coffee Directorate licensed 154 coffee buyers to buy coffee through the central auction at the Nairobi Coffee Exchange (NCE). Eighteen (18) Coffee warehousemen were licensed to provide safe and secure storage of clean coffee either privately or on a commercial basis as shown in appendix 10. The movement of clean coffee destined for export is facilitated by the Coffee Directorate through issuance of clean coffee movement permits.
Players in the coffee value chain undertake various roles and are interlinked in their roles from the farm to the cup. Figure 2 shows the interrelationships of the various players along the value chain.


During the coffee year under review, there were 605 societies, 1,122 factories affiliated cooperatives and 2,749 active estates (Table 4). The grower distribution is within the 33 coffee growing counties.
Table 4: Number of Estates, Cooperatives and Factories per County
During the coffee year, the total area under coffee for estates and smallholder farmers in cooperatives was 111,902 Ha, up from 109,400 Ha in the previous coffee year. This translates to an increase of 2,502 Ha (2.29%). The area under smallholder farmers reduced from 84,025.90 Ha in 2021/2022 to 83,779 Ha in 2022/2023. The total area under estates increased from 25,288.40
Ha in 2021/2022 to 28,123 Ha in 2022/2023.
Kiambu County had the largest area under coffee at 18.2% of the total national area under coffee. Other top Counties were Kirinyaga (9.1%), Nyeri (8.9%), Murang’a (8.5%), Meru (7.9%), Machakos (7.2%) and Bungoma (7.2%). Table 5 shows the area under coffee per county and grower category.
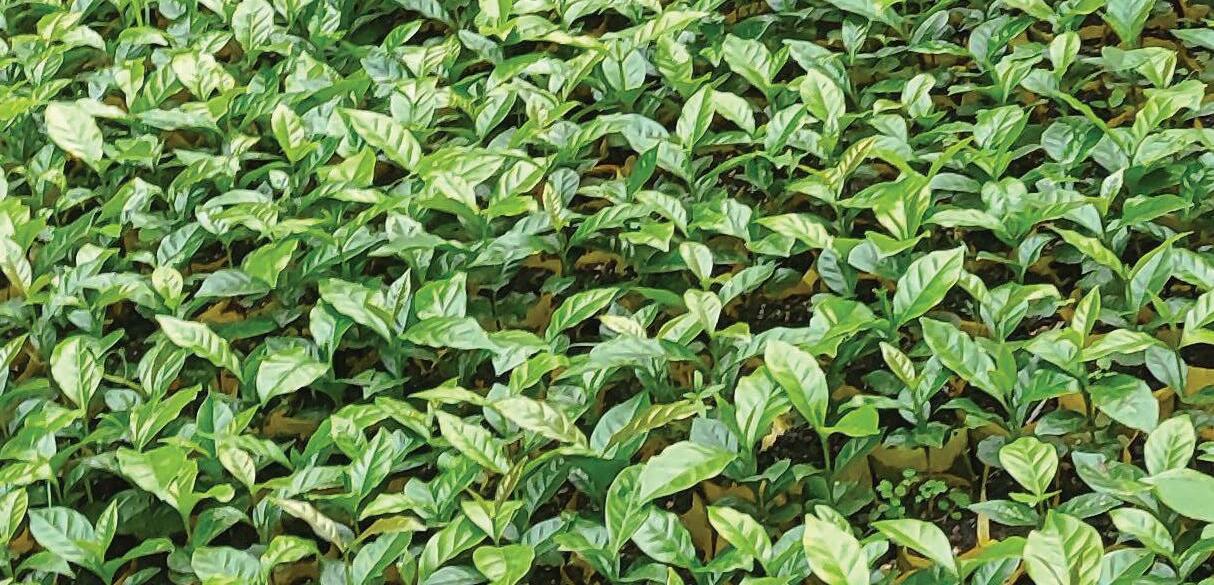
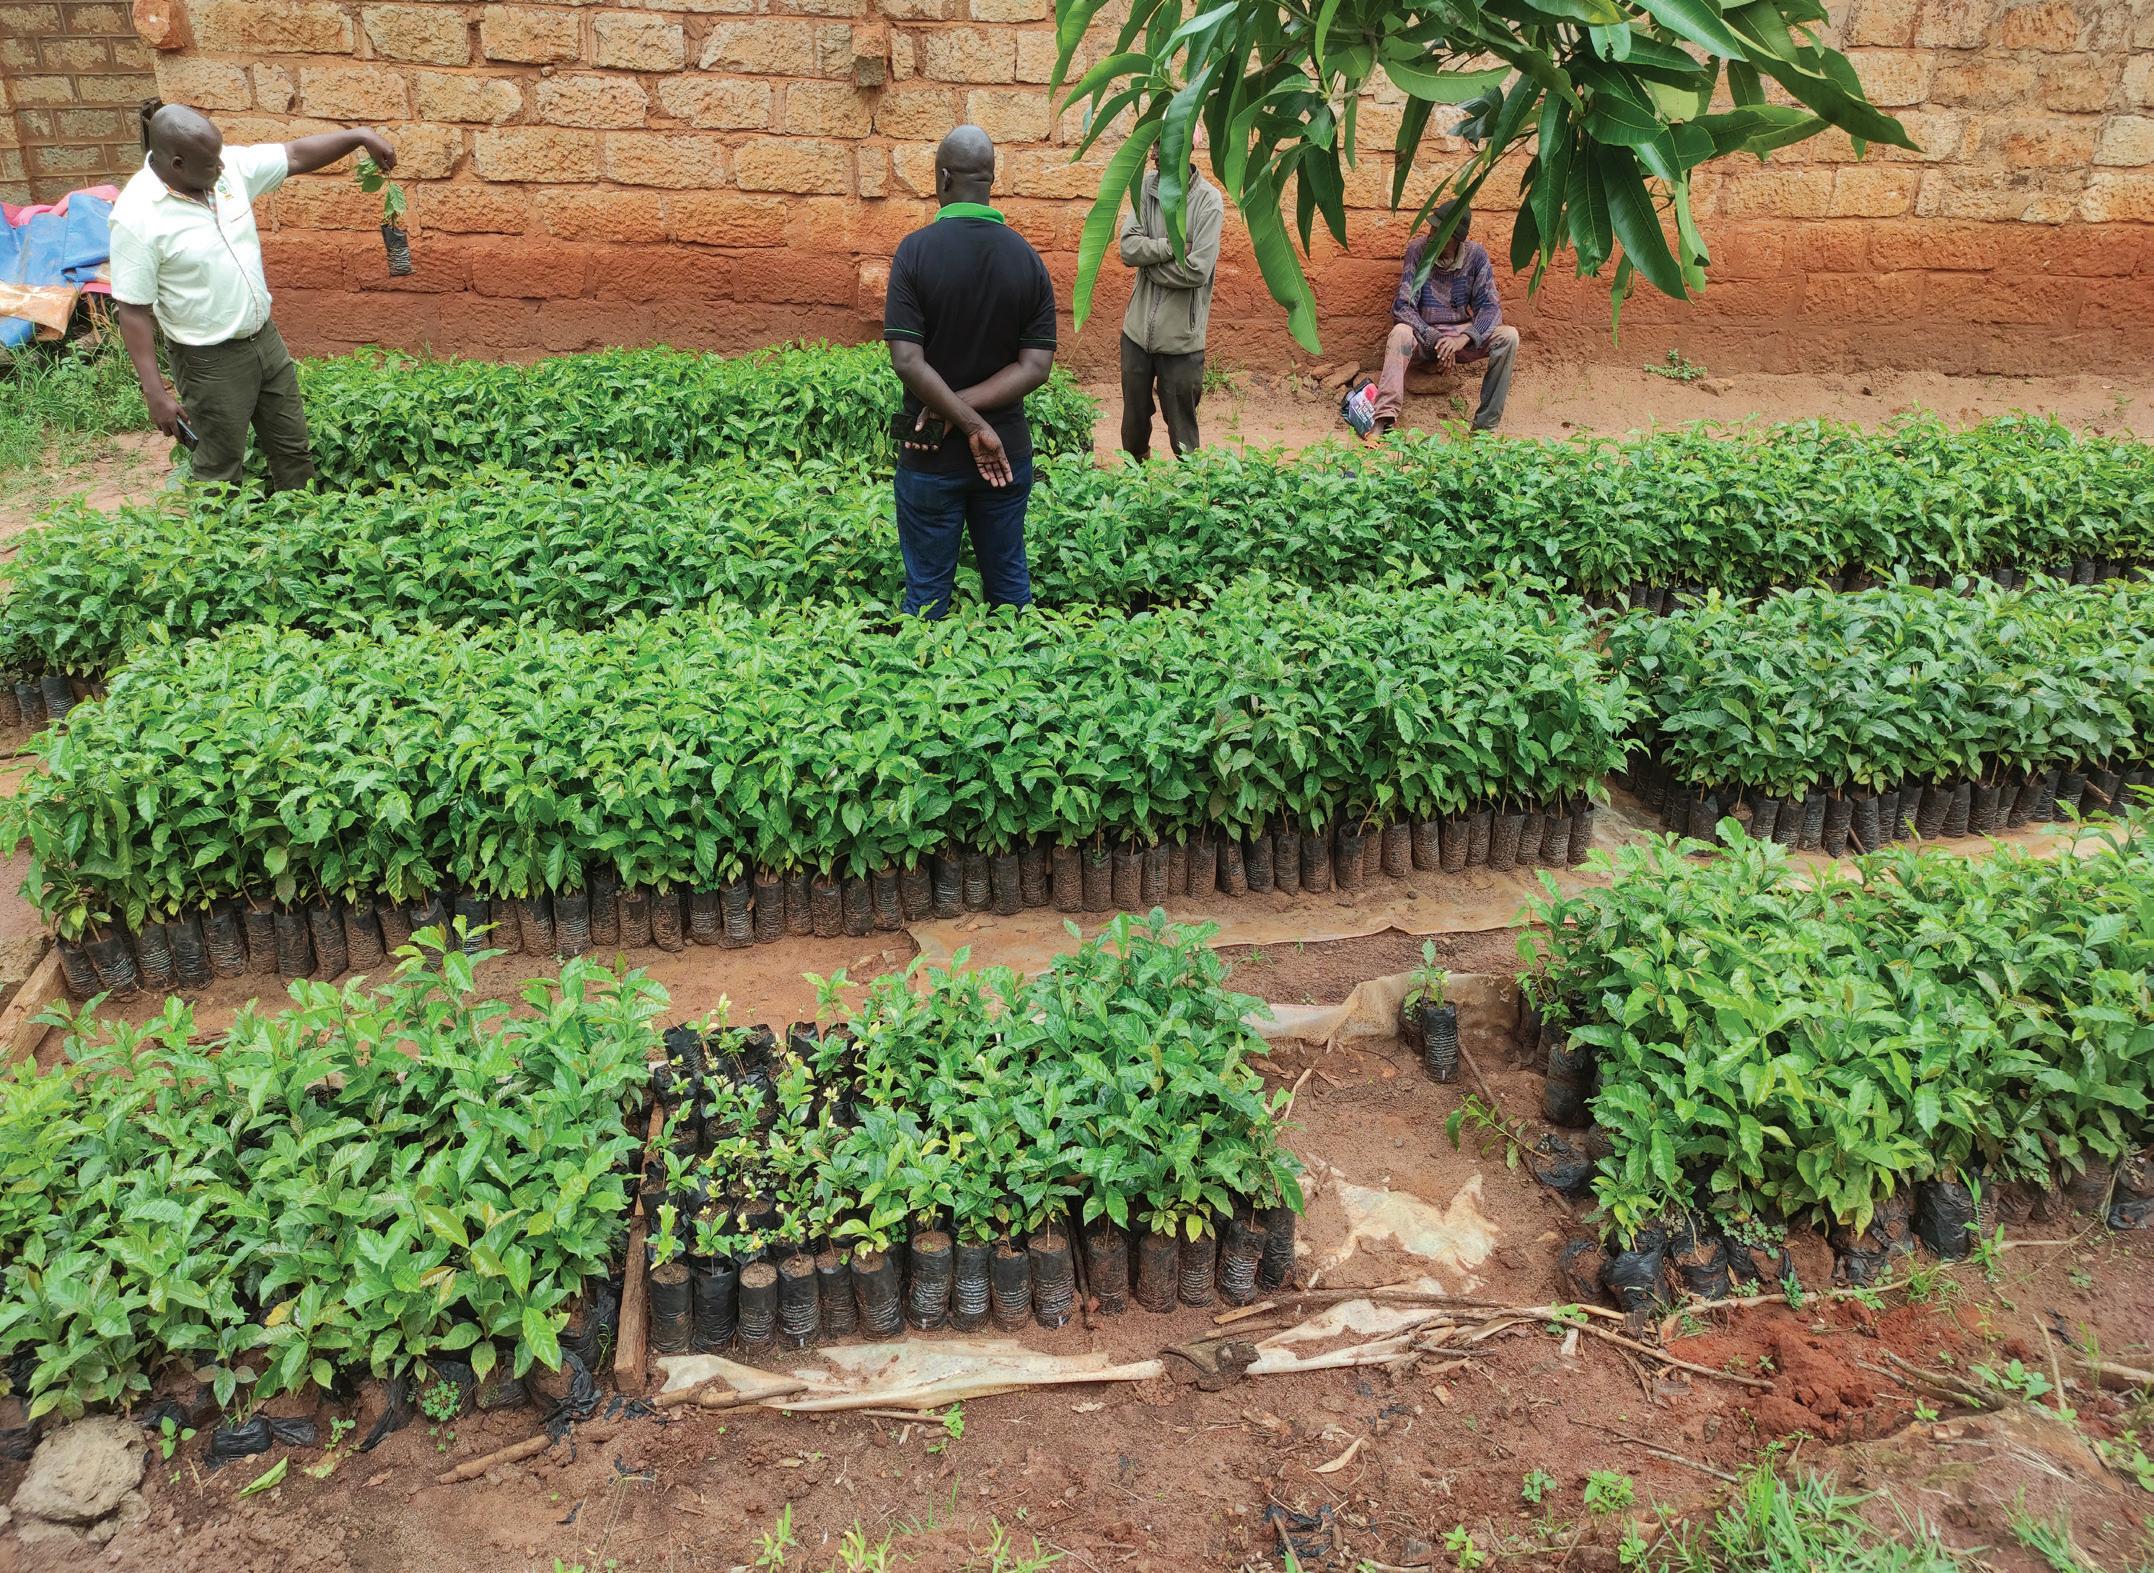
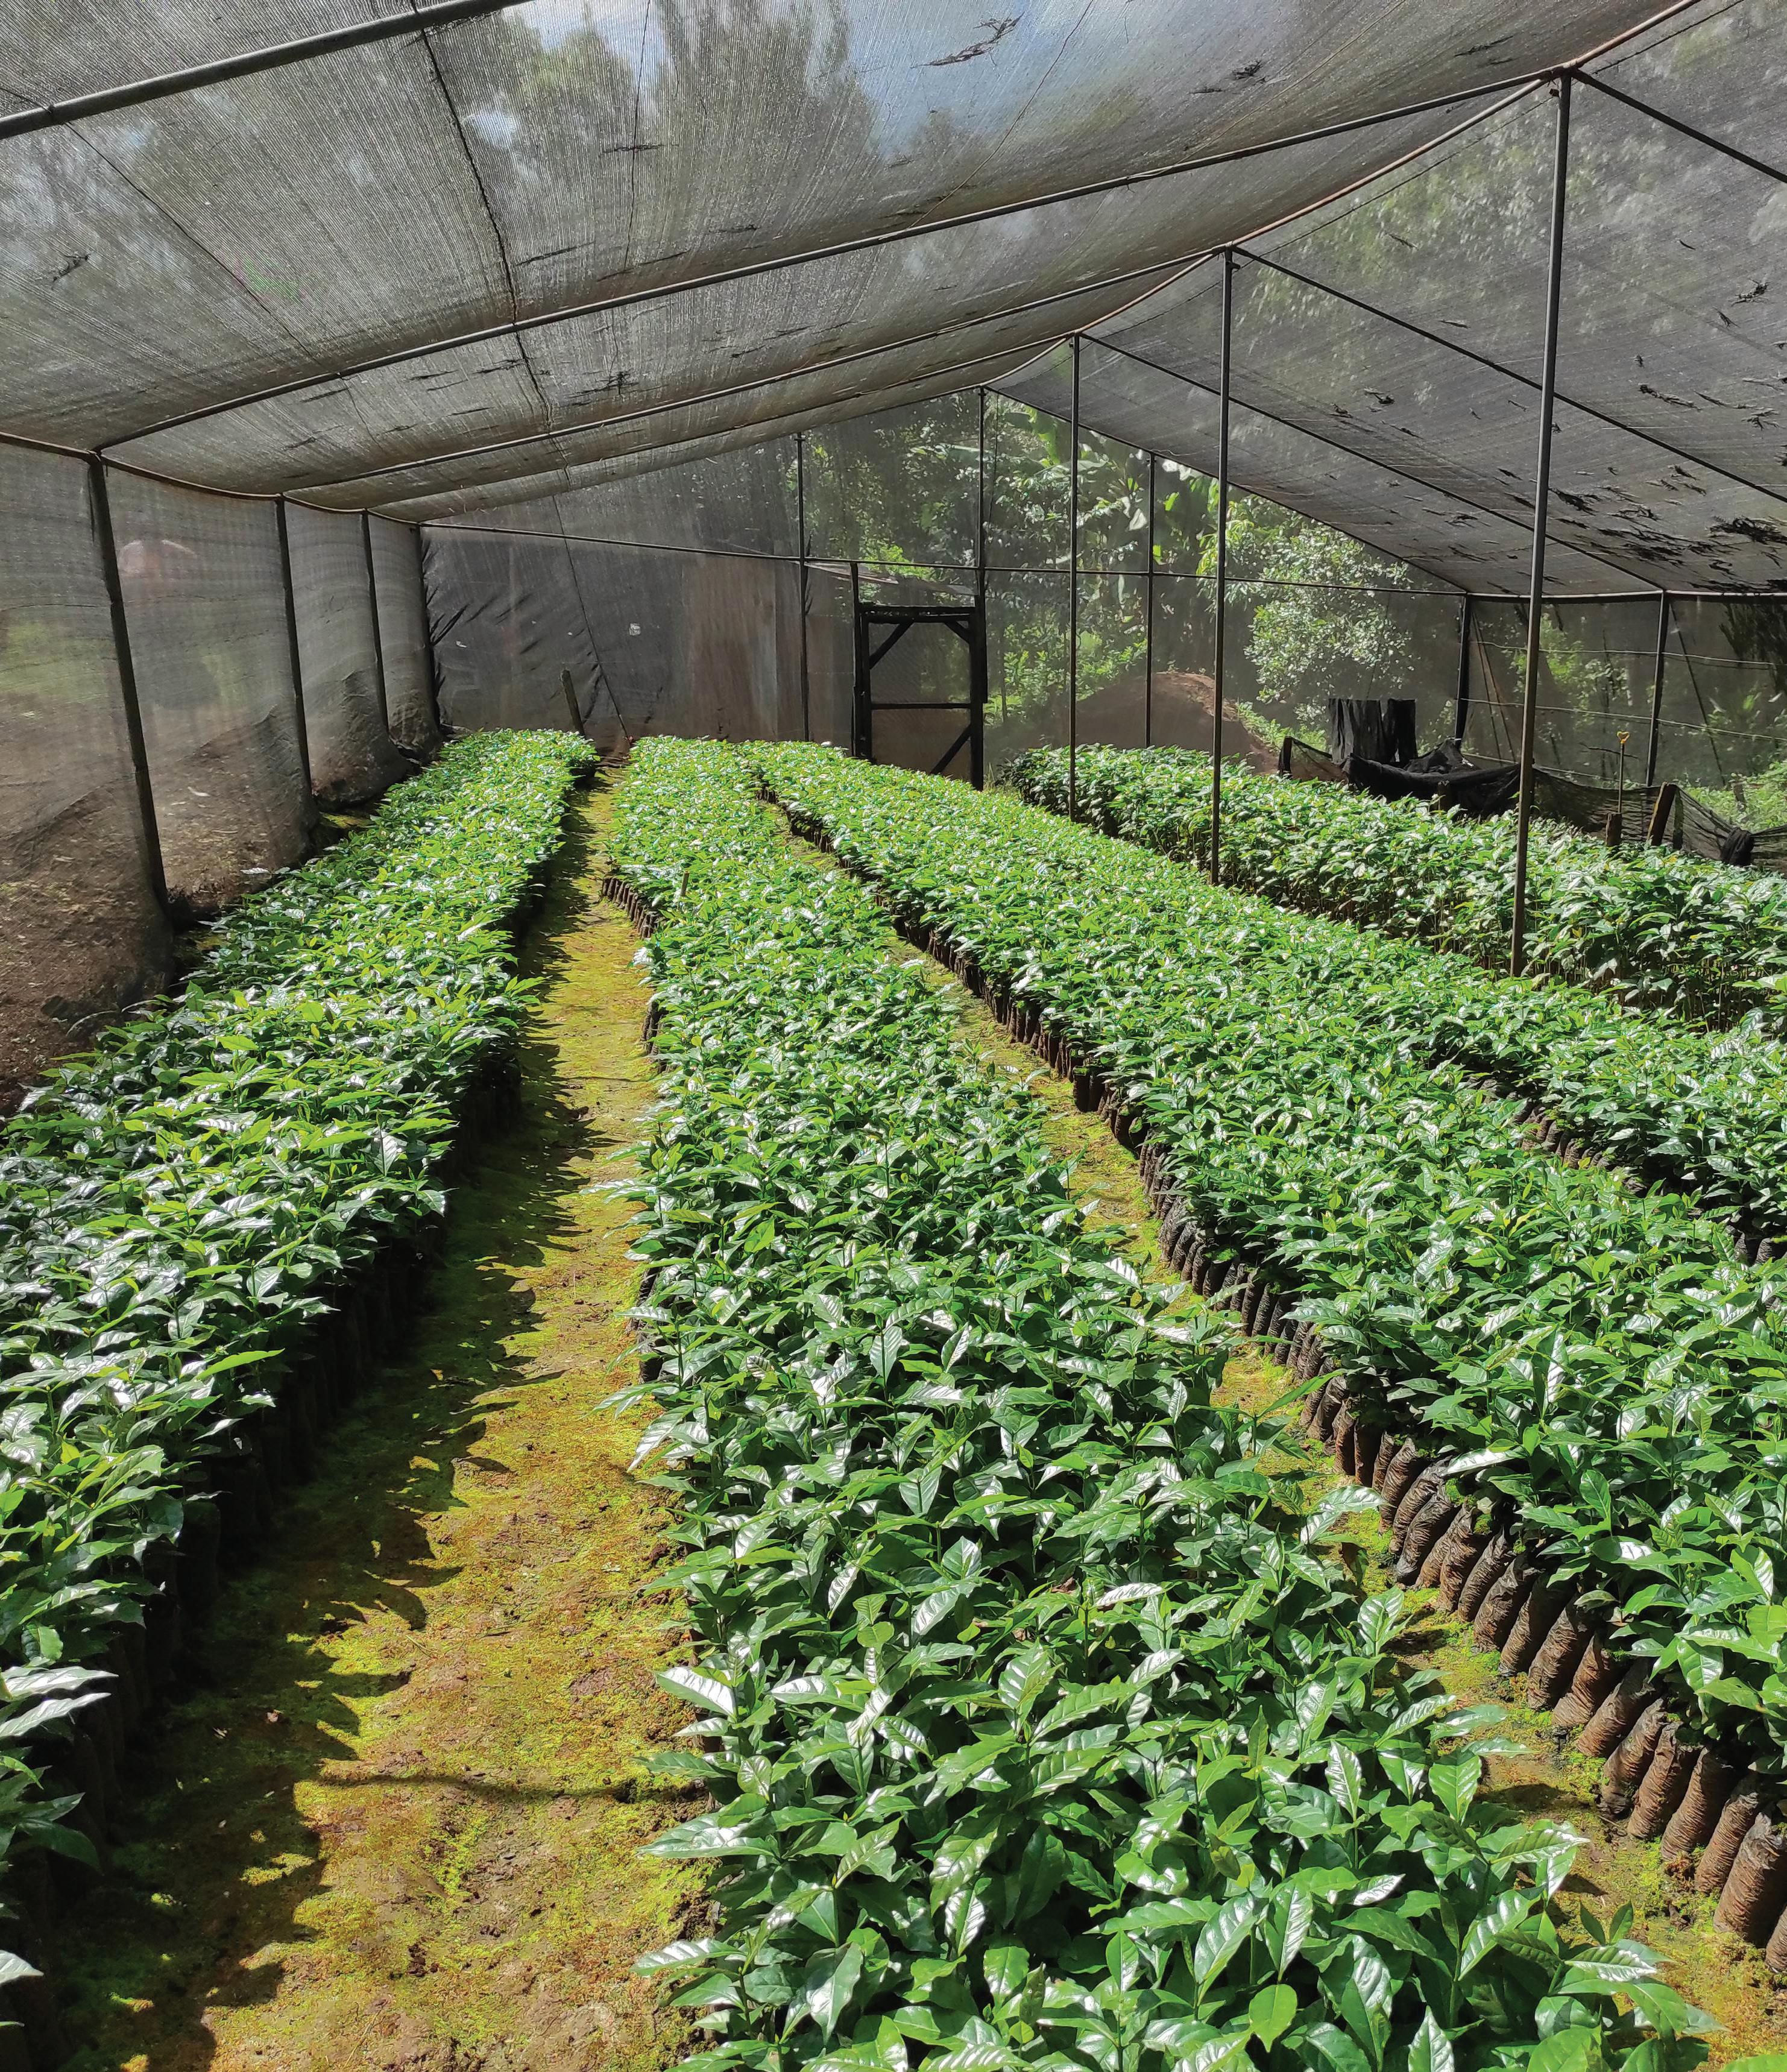
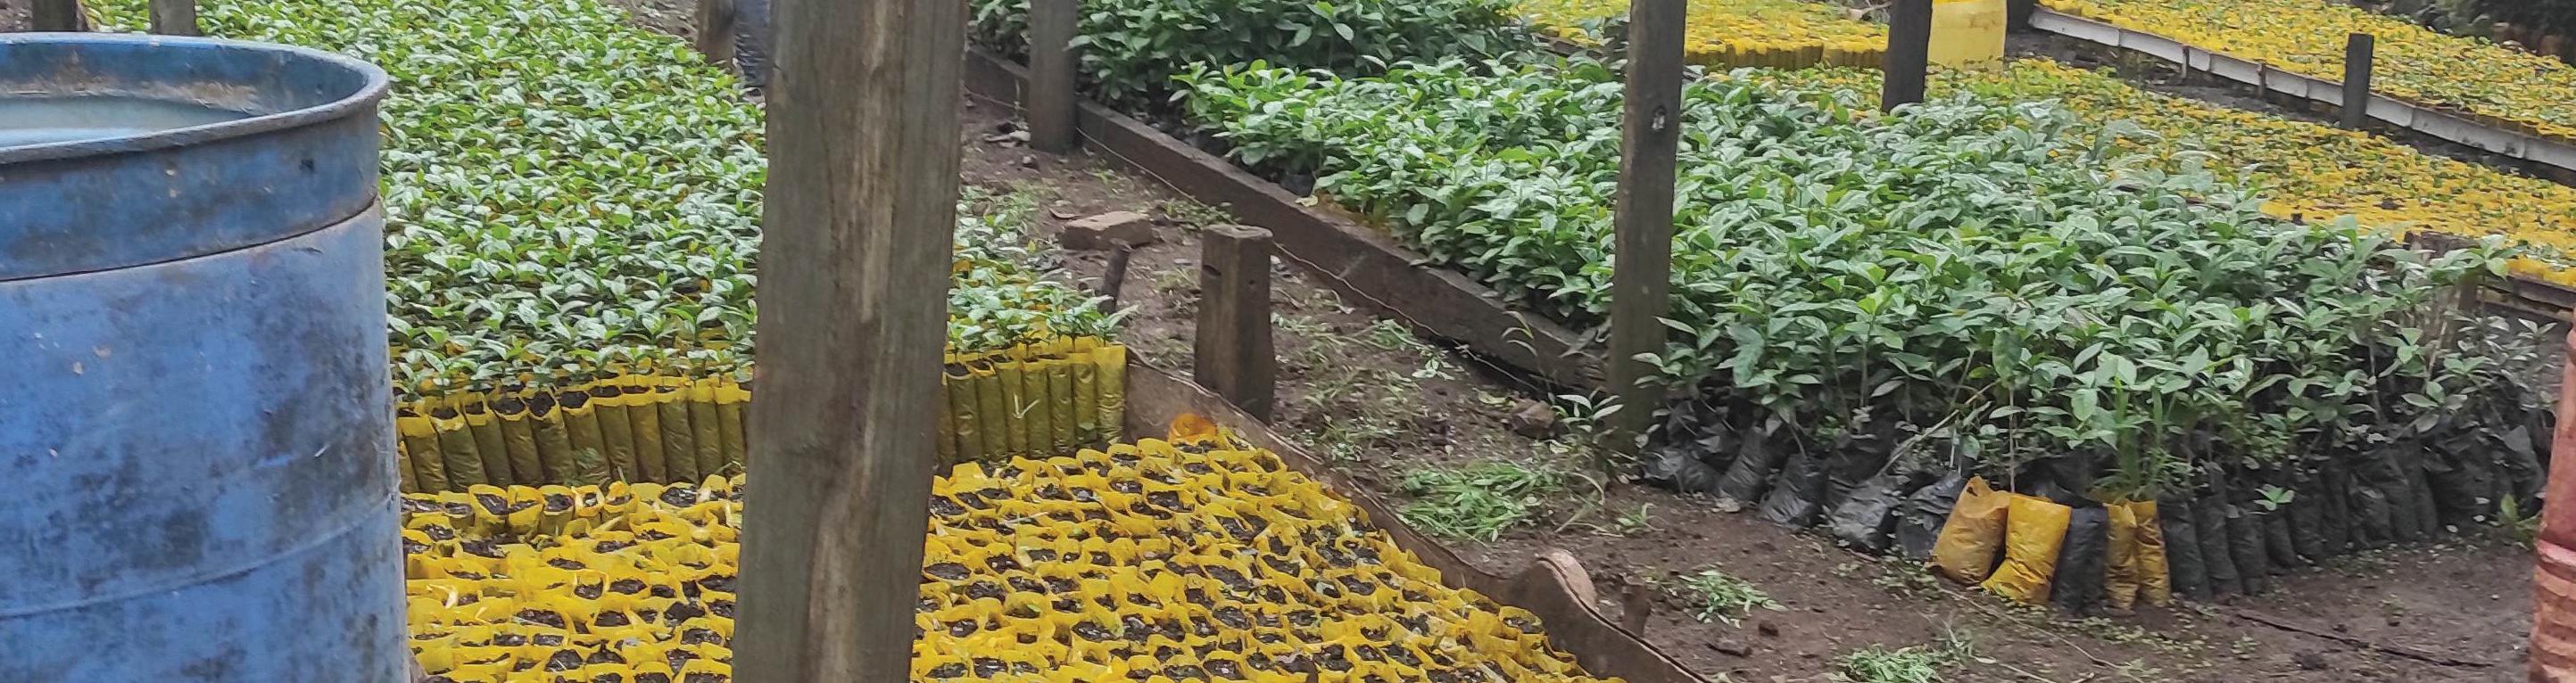
Coffee nurseries provide seedlings either from seeds or grafting. The nurseries are licensed by the County Governments pursuant to the Crops Act No. 16 of 2013 and The Crops (Coffee) (General) Regulations, 2019.
In 2022/2023, demand for planting materials continued to increase as more farmers expanded their coffee farms especially in the West of the Rift while others converted their farm plantations to improved coffee varieties. Significantly, grafted Ruiru 11 had the highest demand with most nurseries being owned by cooperative societies. Table 6 shows the distribution of licensed coffee nurseries by county. Uasin Gishu County was the leading with 28 nurseries owing to the new area for expansion both within the county and neighboring ones. Kirinyaga and Kericho counties were second and third with 25 and 23 nurseries respectively.
A total of 4,913,448 seedlings were raised in various nurseries during the coffee year 2022/2023 across the country. Batian Variety was high in spatial and numbers available totaling 2,715,317. Traditional varieties; SL 28, SL 34 and K7 were 1,805,679. Ruiru 11 and Robusta were available but lower numbers at 362,452 and 30,000 respectively. However, Robusta seedlings were only found in Busia County where majority of Robusta production is domiciled. Nandi County had the highest
number of seedlings in total while Laikipia County had the lowest. Nine coffee growing counties did not have nurseries hence depended on neighboring counties for expansion or gapping of their farms. This is illustrated in Table 7. It is worth noting that seedlings raised by nurseries within a county are not necessarily planted in that county but could be sold across the Country.
7: Coffee Seedlings per Variety per County
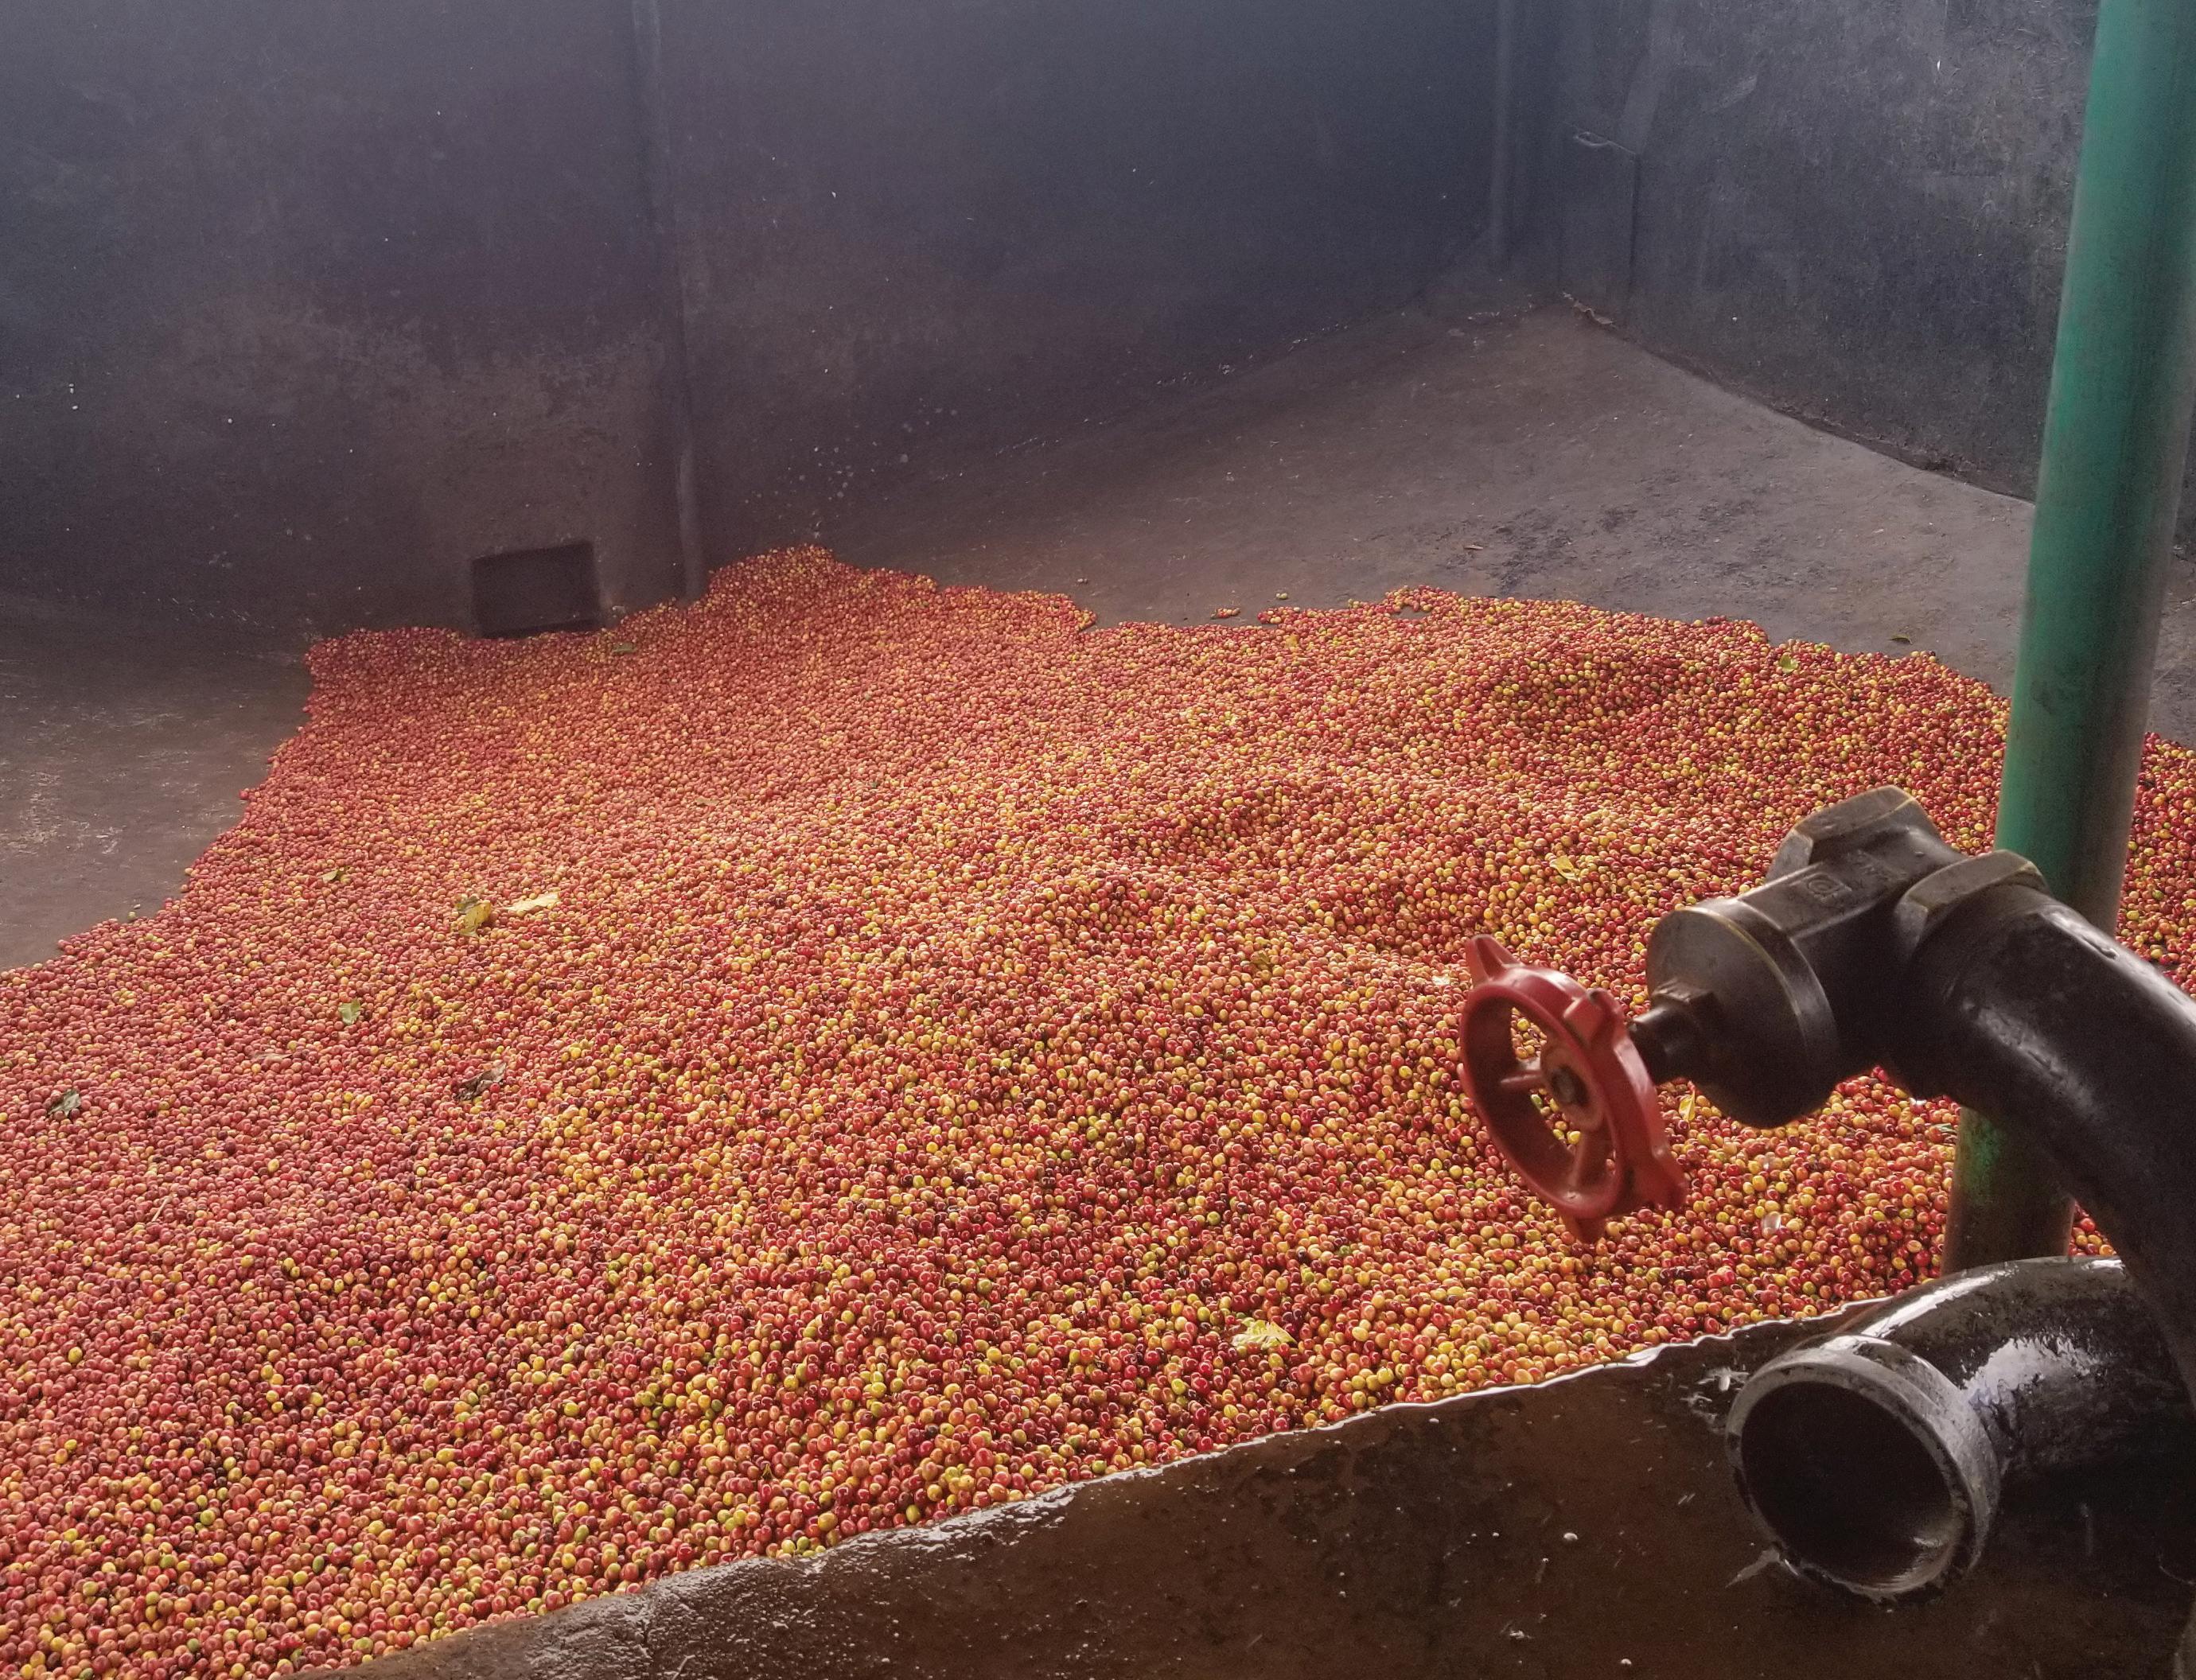
2.4 Cherry, Buni and Parchment Production
There are regions with two distinct seasons and regions with one season based on the rainfall pattern. Generally, the flowering periods are September/October for early crop and February/ March for late crop. The harvesting periods are May to July for early crop and September to December for late crop. The ratio of early to late crop is estimated in recent years as 45:55.
Coffee production is undertaken under two categories of growers namely cooperatives and
estates. Smallholder farmers deliver, process and market coffee through cooperative societies while estates undertake all processing and marketing of coffee on their own.
A total of 215 million Kgs of cherry were produced during the year by the small holder coffee farmers who deliver to the cooperative societies. In addition, over 7 million Kgs of Buni and 299,256 Kgs of parchment were produced by the cooperative societies (Table 8).
Table 8: Cherry, Buni and Parchment Production for Cooperatives Per County
The average national payout rates for cherry during the year 2022/2023 was KES 71.97 per Kg excluding counties that do not report cherry payment. The average payment for Buni and Parchment was KES 192.3 and KES 354.1 respectively. Parchment was reported in three Counties; Kakamega Nuru FCS KES 356, Laikipia Ngarua FCS, KES 324, Bomet, Emityot FCS KES
335. Vihiga reported on Buni only with payout rate of KES 70 for JEBROCK FCS.
Table 9 indicates highest cherry payout rates per county realized during the year 2022/2023. Gakuyu-ini factory of Thirikwa FCS in Kirinyaga county had the highest payout rate of KES 102.05 per Kg of cherry.
In the year 2021/2022, the Country experienced the highest production within the ten-year period as shown in Figure 4. The Country’s production reduced by 3,204 MT of clean coffee in the year 2022/2023 from 51,853 MT to 48,649 MT attributable to harsh weather conditions that accelerated the infestation of CBD especially
in the central region of the country. Coffee Directorate, County Governments and other sector players disseminated information on good agricultural practices (GAPs). The usage of subsidized fertilizer and pesticides contributed towards the reduction of heavy loss that was eminent.
A total of 48,648,541.03 Kgs of clean coffee was produced during the year 2022/2023 with cooperatives producing 34,488,092.45 Kgs while estates produced 14,160,448.58 Kgs. Kiambu was the leading county in production followed by Kirinyaga and Nyeri respectively both Nationally and in the East of Rift. Kericho and Bungoma were the leading counties in production in the West of rift as shown in Table 10.
Figure 5 further shows the trend of clean coffee production over the last 10 years. Kenya’s coffee production has been skewed towards the small-scale growers across the years by a 10-year average ratio of about 30:70 for estates and cooperatives respectively.
The practice of harvesting uniformly ripe cherries, which are then further sorted and processed within 24 hours is the first step in quality control for Kenyan coffee. Different grades of parchment, P1, P2, P3 and PL are generated by
based on size, shape and density. Screens with round perforations are used for size-grading of the flat coffee bean while slotted perforations are used for size-grading of the pea berries. Density difference is graded through gravity separator. These grades include E, AA, AB, PB, C, TT and T. The Buni is classified into two categories: Buni Heavy (MH) and Buni Light (ML). When a coffee grade is specified, a minimum 95 % of the beans falls in that grade category. Table 12 shows coffee grades, grading and standardized
Table 12: Coffee Grades, Grading Description and Screen Sizes
Serial No. Grade General description
Screen aperture as per KS 174 or ISO 415-19801
1 E Elephant – (Retained on 21)
Two beans joined together; it is a genetic defect and includes very large (bold) AA size.
2 AA Flat beans (through screen 21 retained on 18) Size diameter 7.2 mm
mm
3 AB Flat beans-(through screen 18 retained on 17)
4 PB Pea berries-(through screen 17. Retained on 12)
One ovule develops instead of the usual two.
5 C Smaller beans-(through screen 16 retained on 10)
diameter 3.96 mm
6 TT Light density beans, from AA, AB and E grades by air extraction Not Applicable
7 T Smallest, consists of broken and small C (through screen 7) Size diameter 2.9 mm
Table 13 shows Grades of Buni, Robusta, ungraded coffee, sorted beans, hulled and natural coffee.
Table 13: Buni, Robusta, Ungraded, Sorted and Natural Coffee Grades
Beans
Ears
Kenya Coffee is analyzed by two methods namely Devonshire or Specialty Coffee Association.
(i) Devonshire (Kenyan Method)
Grading by size and shape is only a fair estimate of coffee quality. The actual quality is assessed by experienced coffee cuppers after roasting brewing a sample of the coffee already graded by size. These is assessed on raw bean quality (colour and size to the grade specified), the roast quality (general appearance and centre cut)and Liqour (a combination of acidity, body ,flavor, aroma and aftertaste).
Average class is the mean of scores of each attribute while overall class is determined by the average scores of the attributes of Raw, Roast and Liquor.
(ii) Specialty Coffee Association (SCA) Cupping Method
This is carried out by Q Graders who are licensed by Coffee Quality Institute. This method selects specialty coffees with a score of 80 and above points for the specialty market. Coffee is analyzed based on several aspects on the cupping form below;


Profiles
Known for its consistently rich flavor along with a deep, wine-like acidity and pleasant aroma, Kenyan coffee beans have distinctly bright taste with complex tones of fruit and berry. However, Kenyan coffees have a huge range of flavors and
nuances depending on the region, varietal and processing methods used. The best Kenyan coffees can have a full spectrum of flavors to those with a well-developed palate. Various regions have varied attributes that determines the profiles.
For the creation of these profiles, only washed coffee is used to assess the flavors at their cleanest point. Several coffee estates and washing stations were chosen from each coffee growing counties. When cupping, only the main similar flavors from each cupped county were recorded. Table 14 shows cup profiles for selected counties.
Region County
Central and Nairobi; The Central region comprises Kiambu, Murang’a, Kirinyaga, Nyeri,
North Rift Region comprises of counties namely Trans Nzoia, West Pokot, Elgeyo Marakwet, Uasin Gishu and Nandi
Upper and Lower Eastern Regions comprises Meru, Tharaka Nithi, Embu, Makueni and Taita Taveta counties
Murang’a Light Blossom
Berrie Jelly / Plum Currant / Grapes / Lemon
Kirinyaga Strawberry Pie Cinnamon Infusion
Sugar Cane / Berries Hard Candy / Peach / Fresh Plum
Nyeri Blossom Orange Orange / Mixed Citrus Apricot Nectar / Blueberry Tea
Trans Nzoia Citrus Lime Grapefruit
Uasin Gishu Pineapple / Yellow Grapefruit Fresh Apricot
Nandi Lemon / Fresh Strawberry Light Strawberry
Meru Currant
Embu
Blackcurrant Syrup / Passion Fruit
Cardamom Infusion
Tree Tomato / Passion Fruit / Yellow Grapefruit
Mixed Stone Fruit / Juicy Plum / Apricot
Pink Pomelo / Freshly picked Strawberry and Gooseberry
Orange Juice / White Grape Juice / Lemon Tea
Sweet Spices Plum Juice / Blueberry Jelly
Tharaka Nithi Key Lime, Sweet Lemon Crunchy Plum Plum, Apricot, Pineapple, Mango, Orange, Pomelo
Machakos Blossom
Bungoma
Western and Nyanza Regions cover Bungoma, Kakamega, Busia, Vihiga, Siaya, Kisumu, Kisii, Nyamira, Homa Bay and Migori counties
Wild berries / Currant / Sweet Spices
Key Lime, Mixed Citrus
Strawberries
Kisii Citrus Lime Grapefruit
Busia
Red Berries / Black currant / Blueberries
Lilac / Persimmon / Marshmallow roots
Nyamira Pineapple, Mango Tree Tomato, Mango Purée
Key Lime pie, Lemon Tart, Orange Marmalade, Lilac
Marshmallow Roots /African Violet / Strawberries Blossom, Tea Like / Yellow Grapefruit / Purple Dragon Fruit
Tree Tomato / Passion Fruit / Yellow Grapefruit
Lilac / Blueberries / Black currant bud
Orange Blossom, Mix Citrus cocktail, Tree Tomato, Pineapple, Mango, Sweet Violet
Central and South Rift Regions cover Nakuru, Baringo, Laikipia, Kericho and Bomet counties
Nakuru
Baringo
Exotic Fruit / Fruit Bomb / Ripe Mango / Juicy Pineapple
Mango Purée
Chocolate (75%) / Vanilla Sweet Mixed Spice
Mango Sorbet / Stone fruits / Apricot// Lemon
Vanilla / Cinnamon / Purple Dragon Fruit
Kenya coffee processing has been mostly Washed and Natural (Buni). Following the current market shifts where the consumers are now keen on flavours, several growers are adopting to the new processing methods that enhance the coffee flavours. The processing methods include; Naturals, Carbonic Maceration, Anaerobic and Honey.
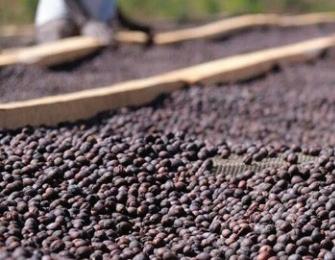
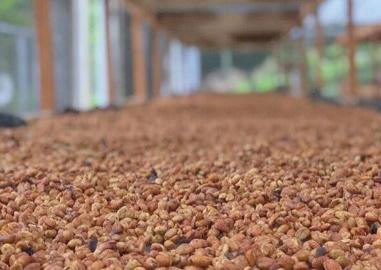
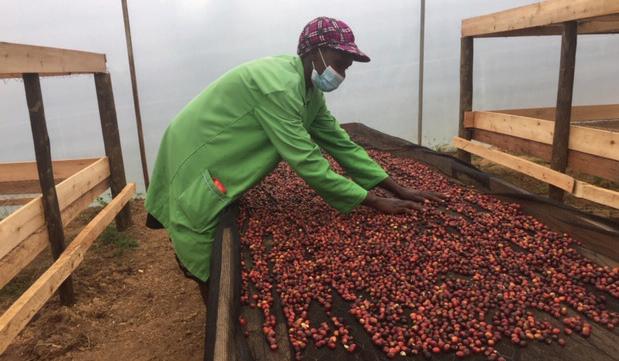
Naturals sundried, also called “natural process” or “dry process,” means drying coffee cherries whole without intervention of water or machines to remove any of the fruit. Prior to drying, the cherries are picked, floated in water, and sorted to remove any under-ripe or overripe fruit (Figure 6).
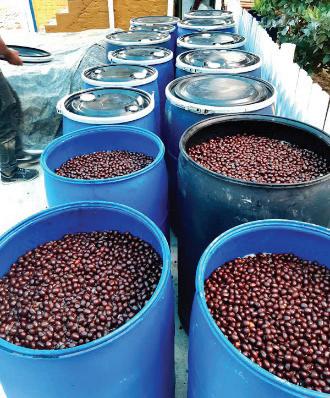
Anaerobic fermentation is coffee processing method where coffee is fermented in pressurized sealed tanks deprived of oxygen. This lack of oxygen produces lactic acids that create different and distinct flavor profile for the coffee (Figure 7).
Carbonic maceration is a process where coffee is fermented in a carbon-dioxide rich environment. After being picked, coffee cherries are placed in an airtight container (Figure 8).
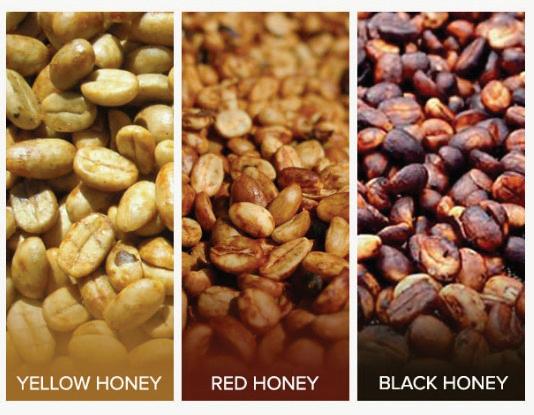
Honey process is where fresh coffee cherries are de-pulped and allowed to dry without washing (Figure 9). Most of the mucilage is gone, but the remaining golden, sticky mucilage is reminiscent of honey, which is where the process gets its name. Based on the percentage of mucus adherence honey coffee is categorized as: Red Honey: 50-90% of the mucus adheres to the rice husk, Black Honey: 90-100% of the mucilage adheres to the rice husk, White Honey: 10-15% of the mucus adheres to the rice husk and Yellow Honey has 15-50% of mucus clinging to the rice husk.
Crop forecast is carried out based on; analysis of production trends, weather patterns and its effect on coffee, scientific estimation from the bearing crop, visual observation on crop status and observations from coffee growers and millers. Coffee growing Counties are clustered into regions namely Central Kenya, Lower Eastern, Upper Eastern, Central and South Rift, North rift, Western and Nyanza. The regions have diverse environmental conditions hence production trend differ from one region to the other.
The production level for the year 2023/2024 is expected to increase to 54,800 MT of clean coffee. The projections indicate that there will be an increase of 13% compared to the year under review. During the coffee year 2022/2023, the weather was favorable for coffee production in most regions. There were adequate rains which
led to good flowering and heavy crop. This was coupled with expansion of area under coffee in western part of the country especially North Rift region. Cherry fund by the government through NKPCU enabled timely access of recommended farm inputs by growers
Selected counties such as Kiambu, Murang’a, Kirinyaga, Nyeri and Laikipia experienced prolonged cold and wet conditions from April to August 2023. The conditions led to increased cases of CBD infections, CLR and BBC which may affect optimal achievement of production. However, the industry players provided timely advisory information on disease management which averted major crop losses. Table 15 shows the forecast for the coffee year 2023/2024 by Counties and grower category.
The high management level production costs for Ruiru 11 and Batian were KES 31 while the farmer at the average level production, costs were KES 36 and KES 39 respectively. The cost of production for traditional varieties for high management level was KES 39 and the average farmer was KES 41 and KES 48 respectively. The average cost of processing and other cooperative operational costs in the 3 levels were KES 14.8 per Kg. A management cost of 5% of the total production cost was considered to act opportunity cost to the farmer if he was doing other on farm or off farm activities and receiving a payment for the same.
The gross margin per acre for Ruiru 11 at the high management level was KES 274,221 and KES 207,589, for Batian while at the average the gross margins were KES 108,561 for Ruiru 11 and KES 71,532 for Batian respectively. The gross margin per acre at the high management level for traditional varieties was KES 103,557 KES 45,743 average management and KES 41,198 for the low management level respectively.
The gross margin for the traditional varieties (SL 28, SL 34 and K7) was lower compared to the
improved varieties and cost of production was higher and this was attributed by the increasing cost of fungicides and since these varieties are susceptible to CBD and CLR, farmers have to incur costs of spraying against these two diseases.
The cost of inputs especially fertilizer in 2022 was high a 50 Kg bag of NPK was costing at KES 6,500 from KES 5,000 in 2020/21 and CAN KES 5,600 from KES 4,000 but in December 2022, the Government announced a subsidy program that offered farmers fertilizer at a discounted price of KES 3,500 per bag.
Though the farmers enjoyed the subsidized inputs in 2022/2023, coffee prices dropped from an average of KES 72 in June 2021/22 to KES 58 per kg of cherry in June 2022/2023, therefore reducing profitability of coffee by KES 14 per kg.
Table 16 shows cost of production at three management levels. The farmer producing at 10 Kgs per tree is at high management level, while the farmer producing at 5 kg is at an average management level and at 2 Kgs per tree is at low management level.

The evolving nature of the coffee market and demand for high quality coffee for specialty coffee segment is of great importance. Priority concerns for Kenya’s coffee industry stakeholders are quality, sustainability and stable supply. Producers and buyers often use certifications to promote their products. The growing demand for traceability and transparency in the value chain as well as the expanding digital marketplaces enhances direct coffee trade between local producers and foreign buyers. In Kenya and in the rest of the world, multinational companies are involved in coffee trading, and roasting further consolidates the market, putting pressure on prices along the entire chain.
The Kenyan coffee market is structured in to five key segments namely the traditional, specialty, regional, emerging and domestic markets.
3.2.1
This market segment covers the countries within the European Union (EU) namely Germany, Belgium and Sweden. The segment consumes both the specialty coffee and the commercial grade. The EU trading bloc forms the main component of the Traditional Market segment. During the year 2022/2023, the segment commanded 53% of Kenya’s total exports totaling to 25,229.2 MT.
The specialty coffee market segment includes USA and Japan. This market consumes high quality coffees (premium coffee grades Kenya AA, AB and PB) and usually pay high prices for the same. The USA and Japan combined, account for 25% of all coffee exported; USA imported 11,228 MT (23%) while Japan imported 569 MT (2%) of all coffee exported in the year 2022/2023.
The emerging market segment covers countries in the Gulf Region such as United Arab Emirates (UAE), Israel, Iran, Oman, and Jordan. The Gulf Region market mostly consumes MH, ML and T while Korea imports both specialty coffees and the commercial coffee grades. The Emerging markets in the year 2022/2023 had a market share of 25% which accounted for 11,499 MT. The potential markets for Kenya’s coffee include countries in Africa such as Djibouti, Eritrea, Rwanda, South Sudan, Sudan, Tanzania, Uganda, Egypt, DRC and Zambia. Countries such as Saudi Arabia, Israel, Jordan and Syria have shown immense interest in Kenya’s coffee over the last few years.
This is the local market for the Kenya coffee. The culture for coffee drinking has not been well developed. To promote domestic consumption of Kenyan coffee among the Kenyans, the
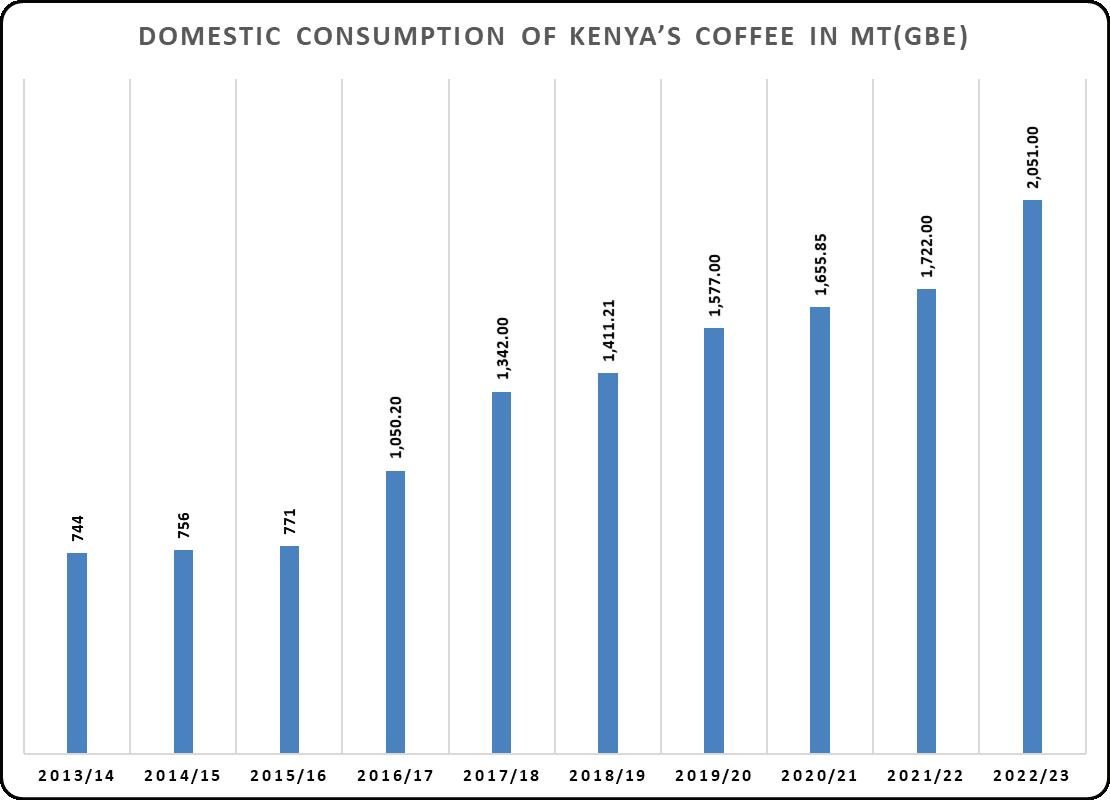
Directorate adopted a strategy of partnering with the institution of higher learning (Universities and colleges) to trigger the youth into coffee drinking culture. The domestic consumption level in the country increased to 4.3% of the national production in 2022/2023. The consumption grew from 1,722 MT to 2,050 MT which is translated to a growth of 19% as compared to the previous year.
The regional market comprises of countries within the African continent. Over the years, exports across Africa have been below 500 MT bar the year 2021/2022 where a total of 1,694 MT were exported. In the year 2022/2023, a total of 297.15 MT was exported to countries across the region which represented a drop of 82% as compared to the previous year mainly due to the cyclic nature of the Tunisian market. In the 2022/2023 coffee year, market comprised of South Africa, Somalia, Congo Democratic Republic, Nigeria, Rwanda and Gambia.
There are two systems of marketing coffee in Kenya which include auction and direct sales systems. Currently, about 60% of Kenyan Coffee is traded at the Nairobi Coffee Exchange under the auction system while 40% is traded through the direct sales. Table 17 shows marketed volumes and value for the past 10 years. The general trend indicate that the volumes of coffee offered through direct sales have been increasing over the years from 8,282 MT in 2013/2014 to 9,350 MT in the year 2022/2023.
The highlighted performance in comparison to the 2021/2022 season, volume, value and average price in both auction and direct sales recorded declines due to a brief period of restructuring where the coffee reforms were taking effect after withdrawal of direct sale licenses. This led to a 3-month period of no direct sale transactions and thus the drop-in volumes and consequent drops in value from last season’s as shown in table 17.
Source: NCE and CD (2023)
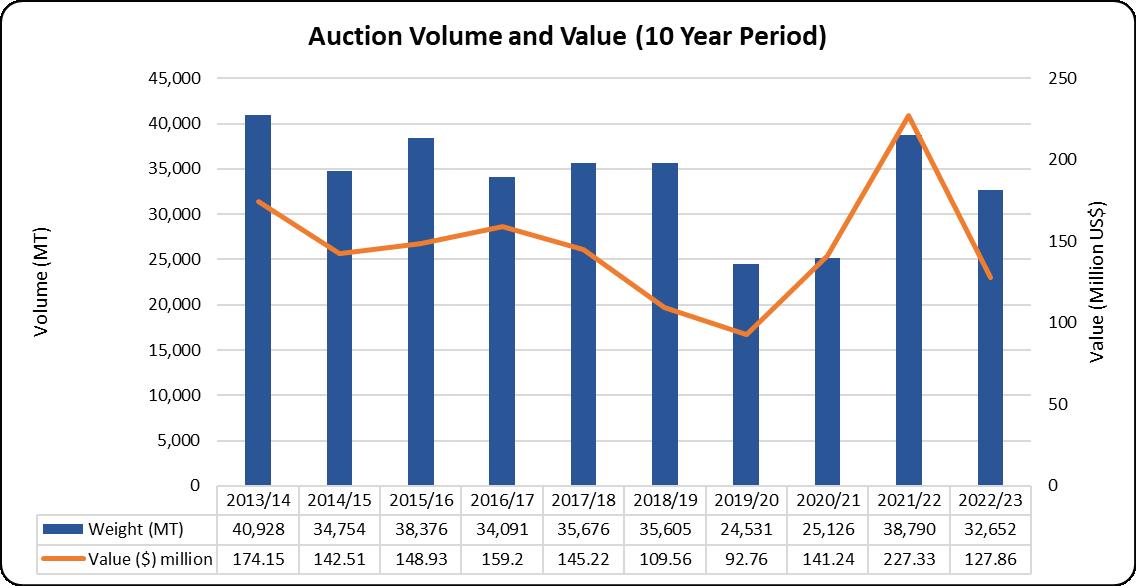
Overall, over the last few years, performance of the auction has been on a general uptrend from 2019/2020 through to 2021/2022 an overall upturn in volumes of 60% across the period. However, in the year 2022/2023 there was a recorded decline of 16% in auction volumes as compared to the year 2021/2022 that is from 38,970 MT to 32,652 MT. This could be attributed to the 3-month break during the actualization of the coffee reforms. The auction is expected to return to normalcy in the year 2023/2024. Figure 10 shows a ten-year trend of auction volume and value.
3.3.2 Auction Performance by Month
The best performance was observed in the month of February 2023 where an average of USD 221.19 per 50 Kg bag was observed against total value and volumes of USD 30.31 Million and 6.85 MT respectively. The highest price for the season was also recorded in February with at USD 686 Per 50 Kg bag (Table 18).
Source: NCE (2023)
N/B: The Months of June and July were transitional hence brokers and buyers had not commenced coffee trading while marketing agencies and dealers had their licences expired.
3.3.3 Performance by Grade
The highest average price per grade was realized for grade AA at USD 241.76 per 50 Kg bag while the lowest average price per grade was for miscellaneous grades at USD 65. Grade AB posted the highest volumes and value in the auction in the 2022/2023 season with 12,630,452 Kgs with a corresponding value of USD 53.96 million as shown in Table 19.
Table 19: Distribution of Grades in the Auction (Volumes & Value)
8,241,172.20
3.3.4 Performance by Marketing Agents and Brokers – Auction Sales In the 2022/2023 coffee auction, the top performing marketing Agents were Tropical Farm Management (24%), Coffee management Services (22%) and Sucastainability (14%) made up the top 3 with a combined market share of 60%. The top three performing brokers were Meru County Coffee Marketing Agency Limited (0.73%), New Kenya Planters Co-operative Union PLC (0.39%) and United Eastern Kenya Coffee Marketing Co. Ltd (0.33%). The Brokers replaced the marketing
agents and offered coffee to the auction on behalf of farmers.
Tropical Farm Management had the highest average price at USD 206.90 while among the brokers, the highest average was by Meru County Marketing at USD 200.75 per 50 Kg bag.
Table 20: Marketing Agents and Brokers Summary
Direct sales in the 2022/2023 season recorded an overall average price of USD 259.73 against a total volume of 9,350 MT and a corresponding total value of USD 48.57 Million. Tropical Farm Management Limited was the highest performer in direct sales with 4,111 MT traded corresponding to a value of USD 18.94 Million. The highest average direct sale price recorded was by United Eastern Coffee Marketing Company with a price of USD 635 per 50 Kg bag.
The highest direct sale average price was recorded for the AA, AB and PB premium coffees at US$ 450 while the lowest average was USD 79.65 for grade SB. Notably, there is a marked increase in the volumes of Naturals that were being exported through direct sales. Similarly, blends of various grades were being exported and pointed to consumer/buyer preferences for Kenyan blends as opposed to consignments of single bean categories as shown in Table 22.
A total of 42,001 MT was traded across both windows (Auction and Direct Sales) in the 2022/23 coffee year with a corresponding value of USD 176.43 million (Table 23). In comparison to the previous year (2021/2022), this represented a drop in both volumes and value which dropped by 17% and 43% respectively from 50,631 MT and USD 311.88 million respectively. The overall outlook on the Auction and Direct Sales grade
performance highlights the large volumes of the AB grade traded through both the Auction and Direct Sales window. A total of 15,343 MT was traded with a corresponding value of USD 69.54 Million. The highest average price recorded per grade was USD 262.96 per 50 Kg bag for the AA grade (Table 23).
Table 24 shows the performance by individual marketers in the 2022/23 coffee year in both the Auction and Direct Sales. Tropical farm management traded the most volumes at 11,806 MT. A total of 42,001 MT was traded through both the Auction and Direct sales.
Coffee exports play a pivotal role in Kenya’s economy, emerging as one of the country’s most significant agricultural commodities. Renowned for its rich flavor profiles and high quality, Kenyan coffee has garnered international acclaim, contributing substantially to foreign exchange earnings and employment opportunities within the country.
In the coffee year 2022/2023 a total of 63 traders including growers exported their coffee amounting to 799,275 bags (60 kg bags) with a corresponding volume of 47,956,516.68 Kgs Green Been Equivalent (GBE). The average price per 60 Kg bag was USD 315.55. The export value for the year 2022/2023 was USD 252.12 Million equivalent to 34.11 Billion in Kenyan
shillings. There were 52 export destinations in the year 2022/2023 coffee year with the top 3 destinations being United States of America, Germany and Belgium.
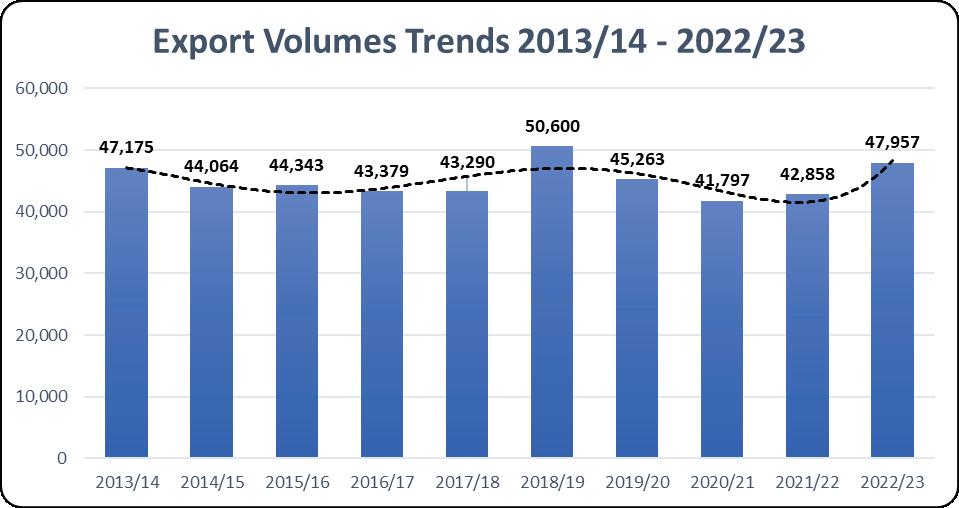
The Figure 11 shows the overall trend of export volumes over 10-year period from the coffee year 2013/2014 to 2022/2023. Over the past 5 years, the coffee exports have been declining from 2018/19 through to 2021/22 where a slight increase of 2.5% was observed and followed by an increase of 12% in volumes exported in the 2022/23 coffee year that is from 42,858 MT to 47,957 in the 2021/22 and 2022/23 coffee years respectively.
Current trend suggests a positive outlook in the years to follow especially with the growing preference for specialty coffee across the world and with Kenya being right in the middle of the specialty coffee movement.
Source: Kentrade (2023)
Export earnings in USD reduced from 298.56 million USD in 2021/22 to 252.12 million USD in 2022/2023 a decline of 16%. However, due to the weakening of the shilling against the USD, the effect of the lower value in USD did not translate into Kenyan shillings as the value in Kenyan shillings remained somewhat similar with a slight dip of 1% from 34.37 billion Kenyan shillings to 34.11 billion Kenyan shillings. Export earning for ten years is presented in table 25.
In the coffee year 2022/2023 coffee was exported to 52 destinations. Kenya gained ten export destinations in the year 2022/2023, however five export destinations that were there the previous coffee year were missed. Among the destinations lost were Tunisia, Bahrain, Burundi, Egypt and Guatemala. The loss of export destinations is attributed to cyclic and periodic export nature to the countries of concern.
The Table 26 shows the top ten destinations for Kenyan coffee in the 2022/2023 coffee year. The top ten destinations were USA (23%), Germany (17%), Belgium (11%), Sweden (9%), Korea, Republic Of (7%), Australia (4%), Netherlands (3%), Norway (2%), Denmark (2%0) and Finland (2%).
The rest, a total of 42 destinations accounted for 20% of the total coffee exported, that is 9,562 MT. The market share of the rest of the export destinations was 2% more as compared to last season’s 18% market share. The overall volumes exported to other nations other that the top 10 destinations increased by 26% signifying positive market diversification in terms of coffee exports by virtue of increased export destinations (10% increase) and an increase in the market share of nations that fall outside the top ten destinations for Kenyan coffee. Top ten destinations for a period of two years is shown in Table 26.
Kenya’s trade in coffee has always been heavy on the European market and the same is evident in Table 27 that highlights trade in a 5-year period. Exports to Europe have accounted for 57% of the total exports in the last 5 years followed by North America (20%) and Asia (17%) as shown in Table 27. This points to a need for Kenya to undertake active market diversification and market expansion especially within the African continent where regional trade for coffee has consistently been low.
In the period under review, a total of 52 traders exported coffee. Ibero similar to the previous season had the largest market share with 24%, completing the top five were; Taylor Winch (11%), C. Dorman SEZ (11%), Kenyacof Limited (9%), Tropical Farm (8%).
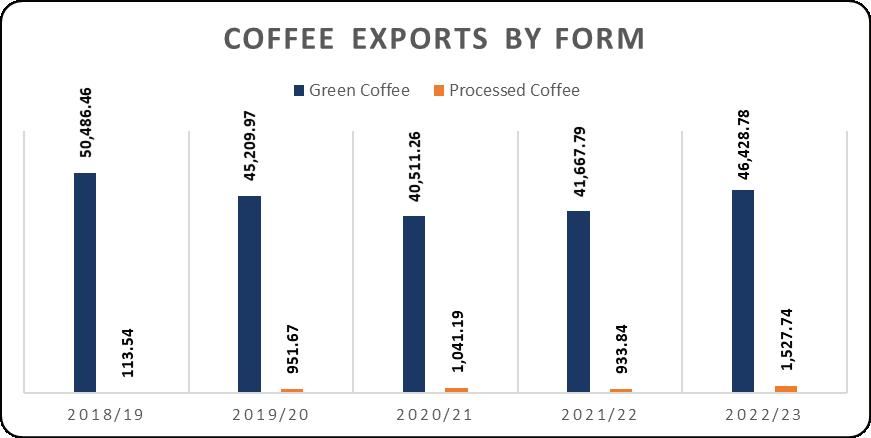
Kenya has over the years been a net exporter of green unprocessed coffee and as is evident in Table 28. During the period under review, 96.81% of her coffee exports were in green coffee form while 3.19% were in processed form (Roasted and Soluble).
Over the last 10-year period, Kenya’s green coffee exports have steadily been above 40,000 MT which has usually accounted for between 97% - 99% of the coffee exports while those of processed coffee have been fluctuating and low in the earlier years. However, over the last 5 years there has been a steady growth in the processed coffee exports due to more exporters working towards value addition before export. Most of the value-added coffee is still consumed locally as opposed to export. Figure 11 presents highlights on coffee export by form.
In the first seven years of the 10-year period under review as shown in Figure 13 below, processed coffee exports were peaked at an average of 57 MT. Processed coffee exports ranged from as low as two MT to a high of 169 MT in the first seven
years. This was the trend up until 2019/20 where the volumes of processed coffee exported increased 7-fold as compared to the previous year 2017/18 that is from 113.8 MT to 951.6 MT. During the 2022/23 coffee year the volumes of roasted coffee exported currently stand at 1,527.74 MT.
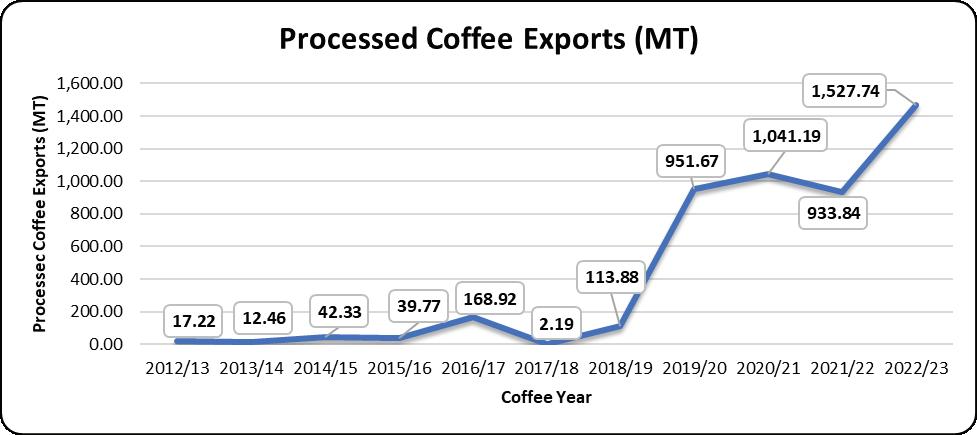
Since 2019/2020 exports of processed coffee have steadily trended above 900 MT. The trend in Figure 14 below has been positive with the trendline indicating expected continued growth in exports of processed coffee in years to come.
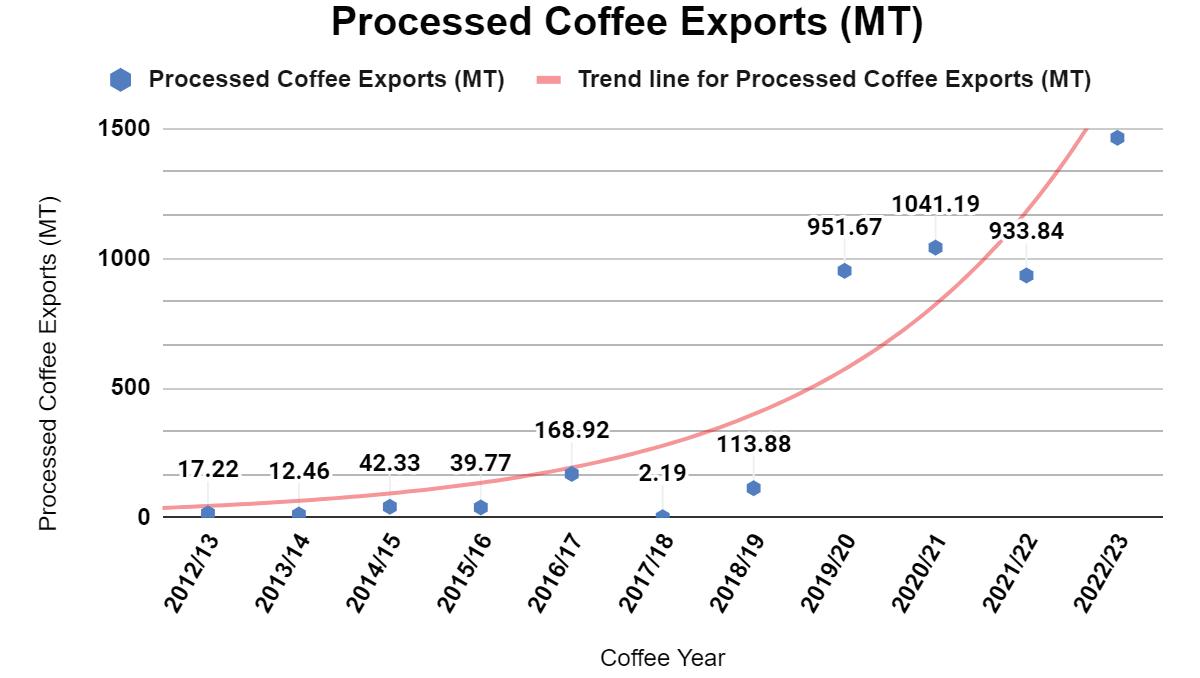
This aligns to well with the BETA Manifesto and the Vison 2030 which emphasize on value addition in agriculture. Value addition of coffee for export in Kenya is only in its infancy and if the trend continues, Kenya stands to earn higher foreign exchange as value added coffee earns more per kg as compared to green coffee.
With a growing emphasis on value addition through roasting, Kenya imports coffee for value addition and blending of coffees where the blending techniques seek to enhance flavor profiles. In the 2022/23 coffee year Kenya imported a total of 1,392 MT of coffee.
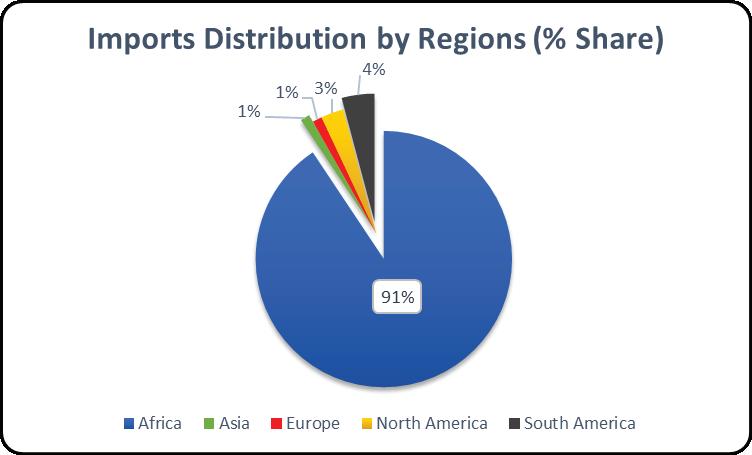
Majority (90%) of Kenya’s imports originate from its East African counterparts; Uganda (41%), Congo, Democratic Republic (38%), Tanzania (9%), Rwanda (1.9%) and Ethiopia (0.1%). This strong inter-trade between the East African Community region further strengthens Kenya’s bilateral trade relationships with its counterparts. Table 30 below further highlights the imports by form and country origin.
Table 29: Coffee Imports by Form and Country of Origin
Regionally, Kenya majorly imports from across Africa (91%) followed by South America (4%), North America (3%), Europe (1%) and Asia (1%) as shown in Figure 15.
Domestic coffee consumption goal as defined in the proposed National domestic coffee consumption strategy 2021 is to “Develop a coffee drinking culture among the middle-class’’ with the main output of increasing uptake to 2,500 MT by the year 2025 from 1,500 in the year 2019/2020.
The country has experienced growth in consumption from 1% of total production in 2010/2011 to 4.2% in 2022/23. Consumption grew from 1,722 MT in 2021/2022 to 2,051 MT in the 2022/2023 coffee year. This growth is attributable to the promotions conducted within universities and the engagement of Coffee Directorate in trade fairs and field days in various counties in Kenya targeting the youth. Figure 16 shows the trend in consumption over the last ten years.
The consumption of Kenyan coffee within the local market is shaped by a multitude of factors, which can be categorized into four main groups: Product Attributes, Consumer Behavior, Market Dynamics, and Distribution and Dispensing Options.
The quality of Kenyan coffee plays a pivotal role in driving local demand. Sustainable consumption hinges on the consistent delivery of high-quality Kenyan coffee that meets consumer expectations. Attributes such as sensory appeal, taste, appearance (influenced by packaging and branding), aroma, and texture influence the hedonic value of Kenyan coffee brands, thereby impacting repurchase interest among local consumers.

Consumer engagement with Kenyan coffee is heavily influenced by individual behavior, shaped by personality traits and lifestyle choices. Beyond demographic factors, personality traits define preferences, attitudes, habits, beliefs, and perceptions, guiding purchase decisions. Socioeconomic status, including income levels, further shapes consumer lifestyles and purchasing behavior, influencing what, why, when, and how often individuals choose to buy Kenyan coffee.
Marketplace dynamics exert a significant influence on Kenyan coffee consumption. Effective brand communication strategies, including messaging design, media selection, and frequency of exposure, impact consumer perceptions and attitudes toward Kenyan coffee. Information accessibility regarding the availability, location, and recognition of Kenyan coffee brands also shapes consumption decisions. Competition from other coffee brands serves as a benchmark against which consumers evaluate Kenyan coffee, considering factors such as presentation, messaging, and overall satisfaction.
The availability and accessibility of Kenyan coffee in various retail channels, the prevalence of coffee shops in key urban areas, baristas’ brewing skills, the affordability and availability of coffee-making equipment, and the design of takeaway coffee packaging collectively influence the place and form utility of Kenyan coffee. These factors determine the ease with which consumers can access and enjoy Kenyan coffee, thereby impacting consumption patterns.
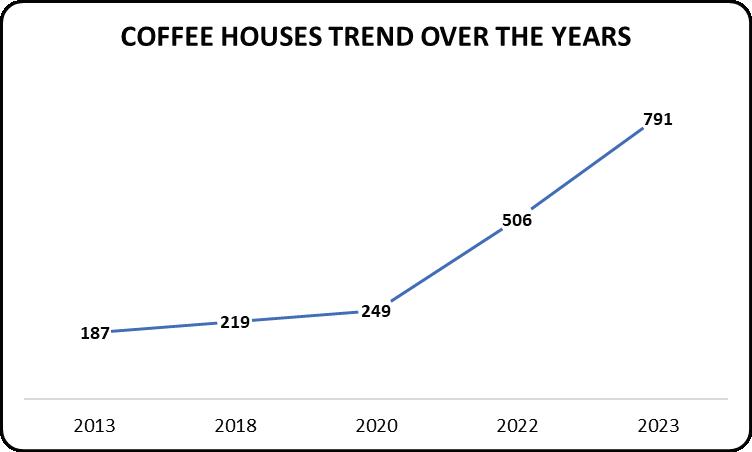
The increasing number of stakeholders engaging in value addition has occasioned an increased number of coffee consumption outlets, this is due to steady supply of processed coffee that are of high quality and a rise in the consumer preference for coffee. Kenya’s coffee industry has seen significant growth in both the number of coffee outlets and stakeholders involved in roasting and packaging. The increase in coffee outlets from 231 in 2019 to 791 in 2023 suggests a growing demand for coffee among consumers.
Moreover, the rise in the number of stakeholders engaged in roasting and packaging, from 25 in 2019/2020 to 35 in 2022/2023, indicates increased
activity and competition within the coffee supply chain. Coffee shops and major hotels appear to be driving domestic consumption in key urban centers like Nairobi, Mombasa, Kisumu, Nakuru, and Eldoret. This highlights the importance of these establishments in catering to the coffee preferences of Kenyan consumers.
Kenya’s per capita coffee consumption is currently at 0.043 kg per person, an increase by 0.007 Kg per person as compared to 2021/2022 where the consumption per capita was 0.036 kg per person. According to the 2019 Kenya Population and Housing Census (KPHC) Volume II Report, Kenya’s population stood at 47.6 million people. Overall, these statistics indicate a growing interest in coffee within Kenya, both in terms of consumer demand and industry expansion. Figure 17 highlights the trend in the establishment of coffee houses across the country over the years since 2013 to 2023.
Coffee consumers prefer different preparation techniques hence there are many types of methodologies of coffee preparation. The coffees made could be concentrated or mild in nature depending on the client taste. Table 30 shows different types of coffee are commonly prepared and drunk coffee in Kenya.
Coffee type Description
Espresso Espresso is a type of coffee that is served in little “shots” and is highly flavorful and concentrated. Espresso features a froth called crema, which sets it apart from other varieties of coffee. It is reddish-brown in color and takes on structure when minuscule air bubbles combine with the soluble oils of the most widely used, finely ground coffee beans. Espressos’ rich flavor and enticing aroma are enhanced by the crema. When an espresso has crema, it has been expertly crafted with finely ground coffee.
Cappuccino A coffee beverage called a cappuccino is produced with espresso and steaming milk. There is no set ratio for the espresso, frothed milk, and steamed milk in the recipe for this espresso-based beverage. To put it another way, each of the coffee’s ingredients should make up a third (1/3). Usually, flavored syrup or sweetener are not added to a cappuccino. However, you are welcome to include them based on your preferences.
Latte
Caffe macchiato
A latte is a kind of coffee beverage made with espresso (one shot of coffee) and steaming or scolding milk. The majority of people mistake a cappuccino for a latte. Well, lattes and cappuccinos are comparable. Lattes differ in that they contain less foamed milk and more steamed milk. One shot of espresso and at least six ounces of heated milk are required to make the ideal latte.
A double or single espresso with a dollop of warm, frothy milk on top is called a cafe macchiato. There is taste to the Caffe macchiato, unlike many other varieties. It’s a robust coffee beverage with a hint of sweetness. While most people like their morning coffee as an espresso or cappuccino, a Caffe macchiato makes a great afternoon treat. The flavor of coffee macchiato is neither very light nor creamy.
Long Black
Flat White
Mochaccino
A double or single shot of espresso is served over hot water in a glass as the long black. The crema is preserved when the espresso is poured over boiling water. You can achieve a well-balanced drink that highlights the subtleties and characteristics of the coffee mix you used, depending on how it is prepared. To do this, you need a good-quality espresso.
A flat white is a type of coffee drink that has delicate bubbles and steamed milk with either a single or double espresso. The glossy smoothness is aided by the macrofoam milk. Making flat white coffee requires expertise. If it doesn’t have the proper flavor, the drink will taste bland.
Ristretto
Piccolo Latte
A mochaccino, also known as a caffe mocha, is a variation of cappuccino coffee that has been flavored or sweetened with chocolate. It is made with a shot of espresso and heated milk, along with flavoring and chocolate sweetener. The drink comes in a variety of flavors, some of which include milk chocolate and others with dark chocolate syrup.
A ristretto is an espresso made with half water and equal parts coffee, either in a double or single shot. In essence, it is an espresso extraction that is darker, thicker, and more concentrated. To construct a ristretto that gives you control over the extraction’s pour pace, you need to grind the coffee finer.
A piccolo latte is a kind of coffee beverage made by combining one or two espresso shots with an equivalent volume of milk. In this instance, warm milk is utilized to lessen acidity. The milk in a piccolo late is steamed, not foamy or texturized, unlike many other coffee drinks.
Café au Lait
A French coffee called café au lait has hot milk added to it. White coffee is not the same as this coffee. Cold milk or a whitener is added to white coffee. This beverage can be made using brewed coffee and steaming milk. There is no foam on top of Café au Lait, in contrast to other coffee varieties like espressos. However, you can enhance its flavor by adding some foam.
Decaffeinated Decaffeinated Coffee is the type of Coffee with reduced level of caffeine.
The Directorate employs a number of strategies to boost coffee consumption in Kenya which include consumption campaigns at universities and among the public. A number of events have been carried out consistently to achieve the goal.
In season 2010/2011, local consumption proportion was only 1% of the national production. However, the country has experienced growth in local consumption mainly due to the promotions conducted within Universities in Kenya targeting the youths. The growth potential is based on the hypothesis that university students become high income earners compared to students in other middle level colleges.
The Directorate carries out regular consumption campaigns in universities upon invitation to build a good understanding among the youth on coffee and it’s benefits with the aim of building a strong drinking culture among the young adults. This is mainly conducted through sampling of brewed Kenyan coffee, information sharing through candid discussions and issuance of the catalogues to give a better understanding to the youth on the coffee value chain.
Collaboration with universities in the establishment of Coffee Houses has been effective and impactful in the advocacy of domestic coffee consumption noting that youth leverage is a factor in the coffee shops attribute. The coffee houses offer quick and convenient access to coffee for the students. This often gives the students an affordable access to authentic Kenyan coffee and thus building their interest in the same post university.
Coffee quality is assessed through cupping at the coffee mills, coffee traders and Agriculture and Food Authority cupping centers. Coffee industry needs trained liquorers and laboratory technicians who are certified through the examinations program and play a key role in the sustainable growth of the coffee industry in Kenya and beyond and realization of better returns to all players in the coffee value chain. The Directorate has certified a total of 137 Coffee Liquorers. In the Financial Year 2022/2023, Ten candidates sat for the Coffee Experts Examination among which four candidates qualified as Coffee Experts and were issued with Certificates.
The Kenya Coffee Events (KCE) was founded in 2019. The National Committee is the Kenya coffee industry team coordinated by Agriculture and Food Authority - Coffee Directorate to facilitate capacity building training workshops, coaching, coffee competitions and networking events. This initiative aims to empower the youth to gain knowledge and skills as well as support their innovative ideas to progress in the coffee value chain.
The 1st Edition of the African Youth Barista Championship (AYBC) was conducted during the 62nd Edition of the Inter-African Coffee Organization summit in Lome’ Togo.10 competitors registered for the competition and Kenya emerged as the African Champion.
The Barista profession has gained popularity with more youth participating in the Kenya national Barista championships. In the FY 2022/2023, 21 Baristas competed, and winner represented Kenya during the World Barista Championship in Athens, Greece.
10,534,102.40 19,898,023.50 7,432,971.98 111,695.06 475,442.16 2,388,748.88 100,896.49 1,545,189.17 1,061,712.99
18,727.32 1,049,392.86 665,580.54 8,208.10 24,991.47 3,059.15 2,523,063.57 796,371.87 6,737.12 3,626.41
Mt. Elgon Coffee Marketing Agency
924,229.62
Coffee Marketing
Name of Miller Tariffs
Baringo CHA Coffee Mill
Central Kenya Coffee Mills- Karatina
CMS Mills Ltd-Eldoret
Embu County Coffee Mill Cooperative Society
Great Rift Coffee Mill
Gusii Coffee Farmers’ Cooperative mills
Hema Coffee Mills
Kahawa Bora Coffee Mills
Kipkelion District Cooperative union Coffee mills
Kofinaf Company Ltd
Lower Eastern Coffee Mill
Milling Tariffs
Meru County Coffee Millers Cooperative Union Ltd
Milling – USD 45 Per MT of parchment
Handling – USD 25 Per MT of CC
Export bag – KES 350 + VAT
Marketing – 2% of gross value
Milling – USD 45 Per MT
Handling – USD 1.5 Per bag of CC
Warehousing – no extra cost
Milling – USD 45 Per ton
Handling – USD 1.5 Per bag of of CC
Warehousing – no extra cost
Milling – USD 55 Per ton
Handling – USD 1 Per bag of CC
Export bag – USD 3.0 + VAT
Transport - USD 1.40 per bag
Milling – USD 65 Per ton
Handling – USD 1.25 Per bag of CC
Export bag – USD 3.0 + VAT
Milling – USD 55 Per ton
Handling – USD 1 Per bag of CC
Export bag – USD 2.71 + VAT
Drying charges - USD 20 Per Ton
Milling – USD 55 Per ton
Export bag - KES 300 + VAT
Milling – USD 55 Per ton
Handling – USD 1.5 Per bag of P
Regrading estate cured coffee - USD 35 Per ton of CC
Export bag – USD 3.50 + VAT
Transport - USD 0.99 per bag
Milling – USD 66 Per MT
Handling – N/A
Export bag – KES 250 + VAT
Warehousing - USD 1.5 Per bag for 42 days
Transport – KES 5 per kg
Milling – USD 45 Per ton
Handling – USD 1.5 Per bag of P
Re-processing of estate cured coffee - USD 35 Per ton of CC
Export bag – Charged at Cost
Transport(Mill to warehouse) - USD 0.75 Per bag
Milling – USD 50 Per ton
Handling – USD 2.0 Per bag
Transport – KES 150 Per bag
Export bag – KES 350
Milling – USD 40 Per ton
Handling – USD 1.5 Per bag of P
Export bag – USD 3.0 + VAT
Transport - USD 1.2 per bag of CC
Name of Miller Tariffs
Mt. Elgon Coffee Mill
Murang’a cooperative union Coffee Mill
Milling – USD 50 Per ton
Handling – USD 1.5 Per bag of P and USD 1.5 Per bag of CC
Export bag – USD 4 + VAT
Transport - USD 3.5 per bag
Warehousing - USD 1.5 per bag
Milling – USD 40 Per ton
Handling – USD 1.70 Per bag
Transport – USD 0.75 per bag
Export bag – USD 3 + VAT
Warehousing - USD 0.05 Per bag
New KPCU Ltd
NKG coffee mills Ltd
Othaya FCS Coffee mill
Sasini Coffee Mill
Tharaka Nithi County Coffee Mill
Milling – USD 40 Per ton
Handling – USD 1.75 Per bag of of CC
Export bag – USD 3.0 + VAT
Transport - KSHS 0.85 Per KM per bag
Milling – USD 65 Per ton
Handling – USD 1.25 Per bag
Export bag – USD 3.0 + VAT
Warehousing - USD 0.050 Per bag
Milling – USD 60 Per ton
Thika Coffee Mills Ltd
Umoja Specialty Coffee Millers
Export bag – USD 3 + VAT
Transport – KES 150 per bag
Milling – USD 55 Per ton
Handling – USD 1.5 Per bag
Export bag – KES 445 per bag
Transport – KES 90 per bag
Warehousing - USD 1.6 Per bag
Milling – USD 40 Per ton
Handling & Sorting– KES 150 Per bag
Export bag – KES 350 + VAT
Transport - KES 200 Per bag
Milling – USD 45 Per ton
Handling – USD 1.5 Per bag
Export bag – KES 320
Transport – KES 100 per bag
Milling – USD 40 Per ton
Handling – USD 0.025 Per kg of P
Export bag – USD 3.0 + VAT
Regrading estate cured coffee - USD 30 Per ton
Marketing Charges
Name
Aristocrats Coffee and Tea Exporters Ltd
Classic Coffee Ltd
Coffee Management Services Ltd
Kenya Cooperative coffee exporters ltd
Meru County Coffee Marketing ltd
New KPCU ltd
Oakland Coffee Ltd
Sucastainability Kenya Ltd
Sustainable management services
Thika coffee marketing ltd
Tropical Farm Management Kenya PLC.
Marketing Commission – US $ 60 Per MT
Direct sales Commission – 1.2 % of the gross value
Marketing Commission – 1.8 % of the gross value
Direct sales Commission – 1.8 % of the gross value
Marketing Commission – 2.2 % of the gross value
Direct sales Commission – 2.2 % of the gross value
Marketing Commission – 2 % of the gross value
Direct sales Commission – 2 % of the gross value
Marketing Commission – 1.8 % of the gross value
Direct sales Commission – 1.8 % of the gross value
Marketing Commission – 2.5 % of the gross value
Direct sales Commission – 2.5 % of the gross value
Marketing Commission – 2.3 % of the gross value
Direct sales Commission – 2% of the gross value
Marketing Commission – 2.0 % of the gross value
Direct sales Commission – 2.0 % of the gross value
Marketing Commission – 2.2 % of the gross value
Direct sales Commission – 2.2 % of the gross value
Marketing Commission – 2.2 % of the gross value
Direct sales Commission – 0.5 % of the gross value
Marketing Commission – 2 % of the gross value
Direct sales Commission – 2 % of the gross value
Name of Coffee Dealer
Coffee Buyers
1. A2x
4. Africa Tea And Coffee Co.Ltd
7. African Coffee Roasters
10. Africoff Trading Co Ltd
13. Afrimex Global Ltd
16. Alanwood Limited
19. Almasi Coffee Limited
22. Alvima Global Investment Ltd
Goldrock International Ent Co. (K) Ltd
Grandezza Coffee
Grazia Di Dio Traders Limited
Hela Coffee Limited
Ibero Kenya Ltd
Ikawa Coffee Limited
Jabali The Coffee Company
Jasons Cup Limited
25. Am&K Capital Limited 26. Javans Coffee Limited
28. Aquila Farm Ltd
31. Ausken Coffee Exporters Limited
34. Baobab Coffee Ltd
37. Barke Enterprises Limited
Jemman Coffee & Mining Co. Limited
Josra Coffee Company Ltd
35. Jotim Coffee
Jowam Coffee Traders Company Limited
40. Bean Planet Africa Enterprises Company Limited 41. Juu Coffee Processing Company
43. Bekas Systems Limited 44. Kahawa Buni Enterprise
46. Betco Coffee Company Ltd
49. Blue Scope Shipping And Logistics(K) Ltd.
52. Bosphorus Company Limited
55. Bridge Expo & Trans Ltd
58. Bursho Company Limited
Kahawa Chai Classic Beans Ltd
Kahve Coffee Limited
Kairos Coffee Export
Kenira Produce Limited
Kenya Co-Operative Coffee Dealers Limited
61. Buteco Limited 62. Kenya Nut Company Ltd
Nzuri Kenyan Coffee Limited
Paulbath Investments Limited
Pazoori Limited
Peclex Enterprises Limited
Pn Power System Limited
Primacafe Agency Limited
Rahma Premium Ltd
Rambi Investments Limited
Red Berry Coffee Co. Ltd.
Rockbern Coffee Group Ltd
Rosie Vam Dyke Co Ltd
Rumani Agencies Limited
Sanaark Investment Ltd
Sasini (K) Limited
Sats Commodity Traders Limited
Scalable System Limited
Servicoff Limited
Sondhi Trading Limited
Songonyet Global Coffee Estste
Star Coffee (K) Ltd.
Starteam International Limited
64. Buymore Wholesalers & Distributors
67. C Dorman Sez Ltd
70. Caffe Del Duca Limited
73. Coffee Exporters Kenya Ltd
76. Coffee Family Ventures Limited
79. Connect Coffee Company Ltd
82. Crowd Farm Africa Ltd
85. Delafarm Trading Company Ltd
88. Delanex Ventures Kenya Limited
Kenyacof Limited
Kevmary Limited
Kimani Coffee Experts Limited
Kirenge Farm Ltd
Kissaprica Limited
Kyandu Trading Company Ltd
Lamadeal Company Limited
Le Alvin Enterprises Ltd
Libamba Coffee Limited
Limbua Group Limited
Step Solutions Limited
Sumseron Coffee And Tea Limited
Sunrays Distributors Ltd
Super Gibs Ltd
Talisman Coffee Ltd
Tamayu Africa Limited
Taste Of Kenya Coffee Limited
Taylor Winch Coffee Limited
Tea & Coffee Connection Limited 91. Delectable Cakes & Coffee Limited
Ten Bean Coffee Company Ltd
94. Diamond Coffee Co. Ltd
Liwani Coffee Estate Ltd
Terrani Mokka Ltd. 97. Di-Versatile International Ltd
Louis Dreyfus Company Kenya Limited
Doska Coffee Trading Limited
Double Space Trading Limted
Dripping Springs Coffee Company Limited
Eagle Crown Coffee
M. A. Pandit & Co. Ltd
Magical Occassions Limited
Magikal Kenya Limited
Manutratech Industries Limited
Tesmoh International Ltd
Tetragrammaton Limited
The Fresh Products Limited
Tigoy International Connect Limited
Timaget Commodities Ltd 112. East African Gourmet Coffees Ltd
Eastmount Native Coffee Limited
Elite Exim Limited
Faina Enterprises Ltd
Margymwan Fruits&Veggies Ltd
Mokal Coffee Ltd.
Mombasa Coffee Ltd
Mt Kenya Specialty Tea & Coffee Co Ltd
Tomoca Coffee Kenya Ltd
Trans-Atlantic Trading Company Limited
Trb Enterprises Limited
Tripple M Coffee Enterprises Limited
124. Fair To Good Limited
127. Fair Trade Enterprises Limited
130. Fairchain Kenya Epz Ltd
133. Fasheta Kenya Limited
136. Fenkil Empire Ltd
139. Feralli Freighters Limited
142. First Cup Coffee Ltd
145. Five Thirty East Sprouts Limited
Name of Coffee Dealer
Mumbi Coffee Merchants Ltd
Mweki Global Sourcing & Supplies Ltd
Myrtle Essies Limited
Nairobi Java House Limited
Namellok
Nilsen Ltd
Ninth Avenue Limited
Njeofvin International Enterprises Limited
148. Galieni Ltd 149. Nova Gardens Ltd
151. Global Mark Foods Limited
154. Globalafrea
Nyeri International Coffee Expo Ltd
Name of Warehouseman
1. African Coffee Roasters 2. Kenya Cooperative Coffee Exporters Limited
3. Africoff Trading Co Ltd 4. Kyandu Trading Company Ltd
5. Agl Kenya Limited 6. Louis Dreyfus Company Kenya Limited
7. Alanwood Limited
Tulon Coffee Ltd
Two Rocks Coffee Ltd
Utake Coffee
Value First Limited
Wanjala & Moylan Limited
Wanyutu Trading Company
Wellyard Ltd
Zillion Agribusiness Limited
Zwei Enterprises Limited
Zzattura International Limited
8. Mitchellcotts Freight Kenya Limited
9. C Dorman Sez Ltd 10. Mombasa Coffee Ltd
11. Coffee Management Services Ltd 12. New Kenya Planters Cooperative Union
13. Diamond Coffee Co. Ltd 14. Nkg Coffee Mills Kenya Ltd
15. Jabali The Coffee Company 16. Sondhi Trading Limited
17. Jemman Coffee & Mining Co. Limited
18. Taylor Winch Coffee Limited
BUNGOMA KAPTOLA FCS KAPTOLA FCS XDA024
BUNGOMA KHACHONGE FCS KHACHONGE FCS XDA010
BUNGOMA KHALABA FCS KHALABA FCS XDA011 250,035.00 11,251,575.00
BUNGOMA KHAMULATI FCS KHAMULATI FCS XDA007
BUNGOMA KIBINGEI FCS KIBINGEI FCS XDA006 223,932.00 11,431,728.60
EMBU KANGAARI NORTH FCS MBUI NJERU FACTORY XBD 012
EMBU KANGAARI SOUTH FCS GAKUURI FACTORY XBD 014
EMBU KANGAARI SOUTH FCS GATAMBARA FACTORY XBD 014
EMBU KANGAARI SOUTH FCS KANGUNU FACTORY XBD 014
EMBU KANGAARI SOUTH FCS KIANGUCHU FACTORY XBD 014 EMBU KANGAARI SOUTH FCS KINGAA FACTORY XBD 014
FACTORY XBD 024
EMBU KITHUNGURURU FCS NDUNDA FACTORY XBD 024
EMBU KIVIUVI FCS KIVIUIVI FACTORY XBD 027
EMBU MIKIKI FCS KITHEGI FACTORY XBD 016
EMBU MIKIKI FCS KITHIMU FACTORY XBD 016
EMBU MIKIKI FCS MINAI FACTORY XBD 016
EMBU MURAMUKI FCS KATHANGARI FACTORY XBD 025
EMBU MURUE FCS GITUARA FACTORY XBD 006
EMBU MURUE FCS KAVUTIRI FACTORY XBD 006
EMBU MURUE FCS KIANYANGI FACTORY XBD 006
EMBU MURUE FCS NGURUERI FACTORY XBD 006
EMBU NEW KIRIMIRI FCS KIRIMIRI FACTORY XBD 026
EMBU NEW KYENI FCS GACHAGORI FACTORY XBD 011
GACHUNGU FACTORY XBD 011
EMBU NEW KYENI FCS
THAMBANI FCS MIKIMBI FACTORY XBD 005
BAY AYORO FCS AYORO XEB 11 F01
BAY KABONDO KABONDO XEB 01 F01
HOMA BAY MBEKA FCS MBEKA XEB 14 F01
HOMA BAY OGERA FCS OGERA XEB 08 F01
HOMA BAY ORINDE FCS ORINDE XEB 16 F01
HOMA BAY PALA KABONDO PALA KABONDO XEB 15 F01
HOMA BAY RANGWE FCS RANGWE XEB 019 F01
HOMA BAY SORI FCS SORI XEB 10 F02
KAKAMEGA BUNYALA FCS BUNYALA FCS XDB014
KAKAMEGA IDAKHO FCS IDAKHO FCS XDB06
KAKAMEGA ISUKHA FCS ISUKHA FCS XDB05
KAKAMEGA ISUKHA-IVUGWI ISUKHA-IVUGWI XDB017
KAKAMEGA KAMBIRI FCS KAMBIRI FCS XDB06
KAKAMEGA KIBUMA FCS KIBUMA FCS XDB012
KAKAMEGA KOSESOSA FCS KOSESOSA FCS XDB015
KAKAMEGA MACHINE FCS MACHINE FCS XDB020
KAKAMEGA MATETE FCS MATETE FCS XDB018
KAKAMEGA MLIMBA FCS MLIMBA FCS XDB016
KAKAMEGA MUMIAS CGCS MUMIAS CGCS XDB008
KAKAMEGA MUMONYONZO FCS MUMONYONZO FCS XDB013 4,058.00 365,220.00 44,108.00 3,043,452.00
KAKAMEGA NAMASOLI FCS NAMASOLI FCS XDB010
CHEPNORIO MAIN XCE07F01
CHEPNORIO YALLA XCE07F02
CHERARA CHERARA XCE41
KICHAWIR
KOMOTHAI GITHONGO F07
KOMOTHAI KAGWANJA F04
KOMOTHAI KAIMBU F09
KOMOTHAI KAMUCHEGE F13
KOMOTHAI
KIAMBU NYAKIRI GIAGITHU F04
KIRINYAGA INOI FCS THAITA FACTORY XAD 001
KIRINYAGA KABARE FCS KARANI FACTORY XAD 002
KIRINYAGA KABARE FCS KATHATA FACTROY XAD 002
KIRINYAGA KABARE FCS KIAMICIRI FACTORY XAD 002
KIRINYAGA KABARE FCS KIANG’OMBE FACTROY XAD 002 615,676.00
KIRINYAGA KABARE FCS KIANGOTHE FACTORY XAD 002
MUTIRA FCS KAGUMO FACTORY XAD 005
KIRINYAGA MUTIRA FCS KARII FACTORY XAD 005
KIRINYAGA MUTIRA FCS KIAGUNDU FACTORY XAD 005
KIRINYAGA MUTIRA FCS KIAMUTUIRA FACTORY XAD 005
KIRINYAGA MUTIRA FCS MUGAYA FACTORY XAD 005
KIRINYAGA MUTIRA FCS MUTITU FACTORY XAD 005
KIRINYAGA MUTIRA FCS NGORANO FACTORY XAD 005
KIRINYAGA MWIRUA FCS GATHAMBI FACTORY XAD 006 13,578.50
MWIRUA FCS GETUYA FACTORY XAD 006
MWIRUA FCS IHARA FACTORY XAD 006
GAKERO GAKERO XEA 25 F01
KISII GAKERO ITABAGO XEA 25 F02 13,403.00
KISII GAKERO KEBEGE XEA 25 F03
KISII GESARARA FCS BOCHURA XEA 07 F03
KISII GESARARA FCS GESARARA XEA 07 F01
KISII GESARARA FCS GETWANYANSI XEA 07 F02
ITHAENI FCS ITHAENI XBE29F01
MACHAKOS KAKUYUNI FCS KAKUYUNI XBE08F01 9,989.00 1,608.00
MACHAKOS KAKUYUNI FCS KWA KITHAMA XBE08F03 16,850.50 1,714.50
MACHAKOS KAKUYUNI FCS KWAKITOTHIA XBE08 F05 22,516.60 1,238.50
MACHAKOS KAKUYUNI FCS MUUSINI XBE08 F04 5,598.50
MACHAKOS KAKUYUNI FCS NGUMUTI XBE08F02 14,419.00 1,494.00 MACHAKOS KALILUNI FCS KALILUNI XBE25F01
KALILUNI
KAMBUSU FCS KAUKISWA XBE19F02 511,347.60
MACHAKOS MUISUNI FCS MAVINDU XBE09F03
MACHAKOS MUKUYUNI FCS MUKUYUNI XBE28F01
MACHAKOS MUNGALA MUNGALLA XBE32F01
MACHAKOS MUPUTI FCS MAPUTI XBE07F01 3,891.00
MACHAKOS MUSILILI FCS MUSILILI XBE30F01
MACHAKOS MUTHUNZUUNI MUTHUNZUUNI
MACHAKOS SENGANI FCS KITHAAYONI XBE17F02
KITHANGATHINI KITHANGATHINI XBE02
MAKUENI KITHANGATHINI KIVANI XBE02
MAKUENI KITHANGATHINI KWALONGO XBE02
MAKUENI KITHANGATHINI NDIANI XBE02
MAKUENI KITHANGATHINI UPETE XBE02
MAKUENI KITHUMANI KITHUMANI F01 XBE 12
MAKUENI KITHUMANI MUKUI F02 XBE 12 MAKUENI MASOKANI FCS MASOKANI F01 XBE
GIKONGORO GIKONGORO XBB051
XBB065
XBB065
XBB065
KIGARI THAGU XBB044
MERU KIMACHIA
GATUNYU KIGIO MUCHAI XAB40
MURANGA GIKIUGA GIKIUGA XAB58
GUTHERA KIANJOGU
KAMAHUHA KAMAHUHA XAB70 MURANGA KAMUGA GATITU / GAKIMA XAB81
KAMUGA KAGUMOINI
KAMUGA MUTOHO XAB81
MURANGA KAMUNGA RWARO+MITARAKWA XAB89 MURANGA KANGIRI GATUMBI A XAB89
MURANGA KANGIRI GATUMBI B XAB89
MURANGA KANGIRI KANGARUMAI A XAB89
KANGIRI KANGURUMAI B XAB89
MURANGA KANGIRI KANGUYA A
KANGIRI KANJATHIB
KANGIRI NEW IRATI A XAB89
MURANGA KANGIRI NEW IRATI B
KANGORIAKI KAHITI XAB42
KANGORIAKI KIUNYU XAB42 MURANGA KANGORIAKI NGOE-INI XAB42 MURANGA KANGORIAKI RIAMBARA XAB42
MURANGA KANGUNU KANGUNU XAB73 1,420,109.00
KIANGEGE YAMUGWE XAB89 MURANGA KIANJOGU KIANJOGU XAB89
KIAWANDUMA KIAWANDUMA XAB71
MURANGA KIGETUINI KIGETUINI XAB23
MURANGA KIMURI KIMURI XAB61 MURANGA KINOGERAMA CHOMO XAB44
KINOGERAMA KIMAKIA XAB44
MURANGA KINOGERAMA MABAE XAB44
MURANGA KINOGERAMA NDIARA XAB44
KINOGERAMA RWEGETHA XAB44
KIORU KIORU XAB75
KIRU
KAMELI FCS KAMELI FCS XCF 005
KAMNO KAPKANGANI KAMNO KAPKANGANI XCF 012
KAMUNG’EI FCS KAMUNG’EI FCS
KAPCHEPSIR KAPCHEPSIR XCF 015
KAPKIYAI KAPKIYAI FCS XCF 024
KAPKOLEI FCS KAPKOLEI FCS XCF 026
KAPSAOS FCS KAPSAOS FCS XCF 004
NANDI KAPSIMOTWO FCS KAPSIMOTWO FCS XCF 006 NANDI KAPTICH MULT-P FCS KAPTICH MULT-P FCS
KEMELOI FCS
NYERI MUGAGA KAGUMOINI XAC064F01
NYERI MUGAGA KIAMABARA XAC064F02
NYERI MUGAGA KIENI XAC064F03
NYERI MUTHEKA CHORONG’I
THARAKA NITHI MUIRU IRIGU XBC024 THARAKA NITHI MUIRU NTHIMA XBC024
NITHI MUTINDWA MUTINDWA XBC006
NITHI MUTUGUTA MUTUGUTA XBC037
THARAKA NITHI MWANGA MIIGI XBC033
THARAKA NITHI MWANGA RUGUTI XBC033
NITHI MWIMBI CENTRAL RIAKANUGU
TRANS NZOIA KAIBEI FCS KAIBEI FCS XCI TRANS NZOIA KAMISSA KAMISSA XCI 031
TRANS NZOIA KAPSARA KAPSARA XCI 026 TRANS NZOIA
1. Ms. Grace Kyalo – Director General AFA
2. Dr. Benson Apuoyo - Ag. Director - Chair
3. Mr. Bernad Gichovi - Ag. DD – RC
4. Mr. Erick Onyuka - Ag. DD – TAS
5. Ms. Josephine Simiyu – DD- MRPD
6. Dr. Jane Cheserek - Coffee Research Institute
7. Dr. Javan Ngeywo
8. Mr. Calvin Baraka
9. Mr. Samuel Mwau
10. Ms. Fellistus Lotee
11. Mr. Charles Nyamweya
12. Ms. Elizabeth Njuguna
13. Mr. Timothy Otachi
14. Mr. Stephen Kamau
15. Mr. Paul Mutua
16. Ms. Sheila Agida
17. Mr. James Nzomo
18. Mr. Abdub Godana
19. Mr. Lawrence Oluoch
20. Mr. Wycliffe Choge
21. Mr. Elisha Mtogo
22. Mr. Bethwell Rop
23. Mr. Daniel Koitalek
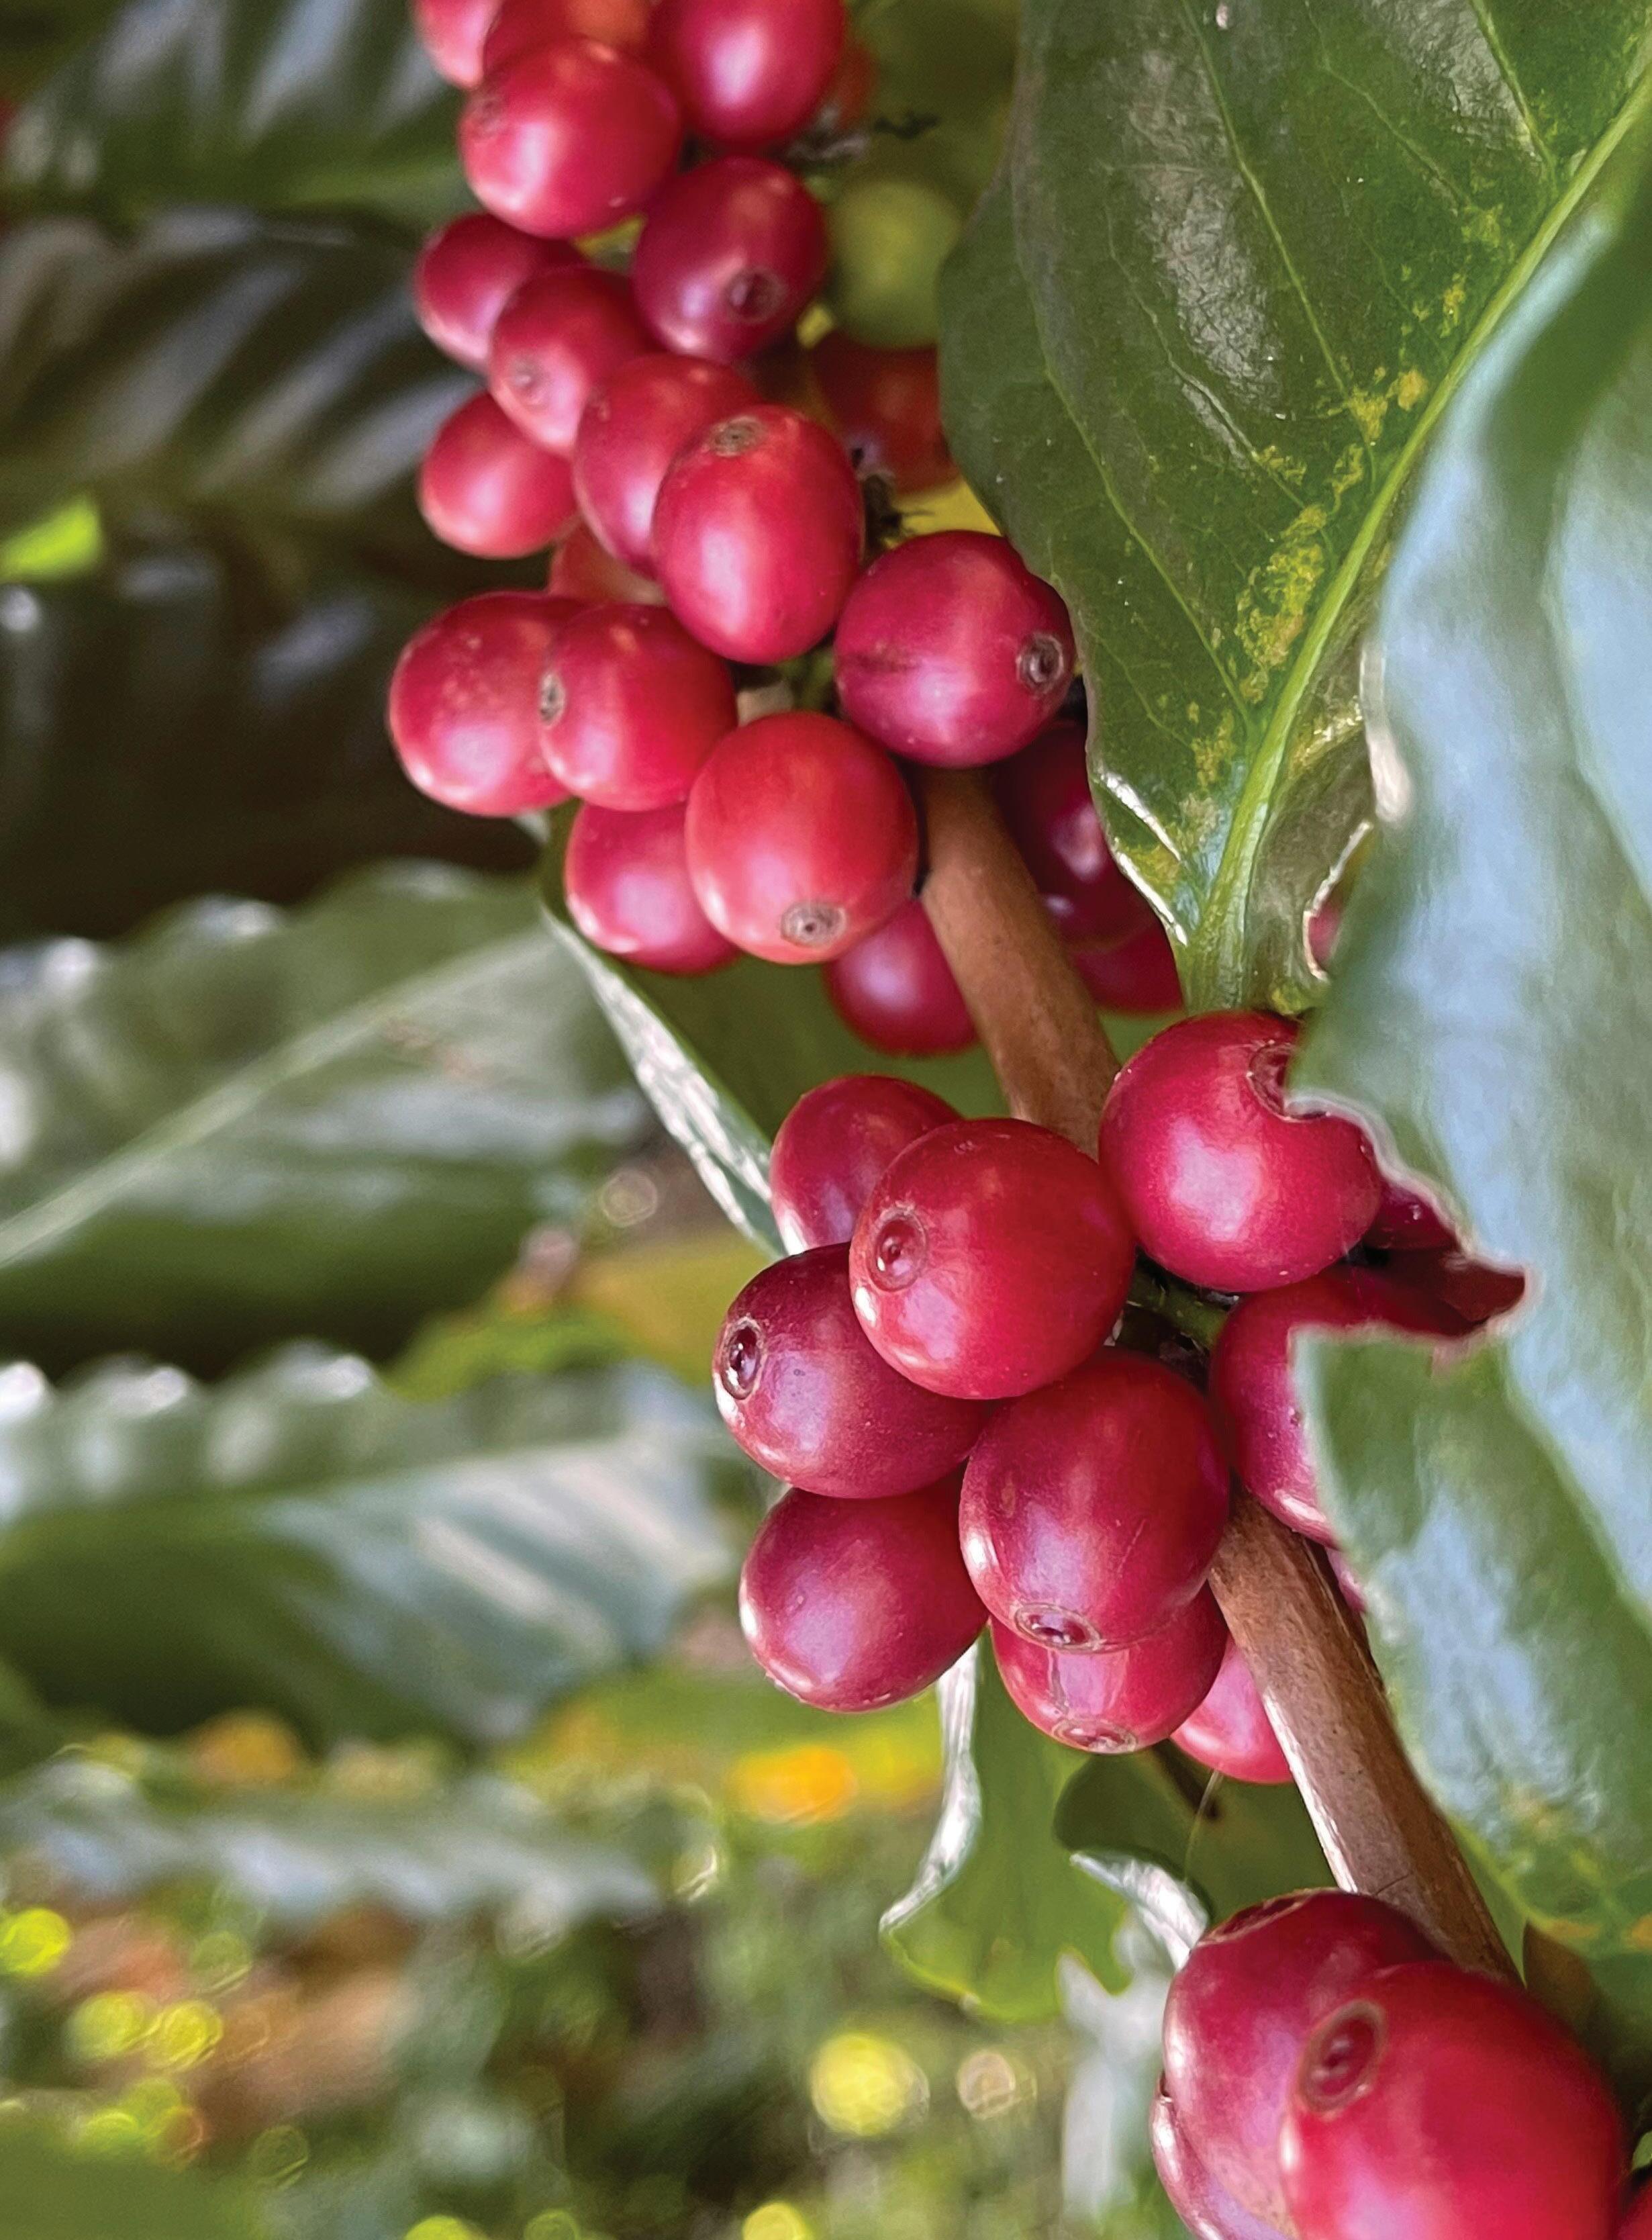
Coffee Directorate Office, 10th Floor, Coffee Plaza Building Exchange Lane off Haile Selassie Avenue, P.O Box 30566-00100, Nairobi, KENYA
Telephone: 0710670026,
Email: directorcoffee@afa.go.ke / info@afa.go.ke Website: www.afa.go.ke