
ROOSEVELT INSTITUTE REIMAGINE THE RULES
The Causes of and Responses to Today’s Inflation
Joseph E. Stiglitz and Ira Regmi December 2022
About the Authors
Joseph E. Stiglitz is chief economist of the Roosevelt Institute. He is a Nobel laureate in economics and University Professor at Columbia University. He also serves as co-chair of the Independent Commission for the Reform of International Corporate Taxation and co-chair of the High-Level Expert Group on the Measurement of Economic Performance and Social Progress at the OECD.
Ira Regmi is the program manager for the macroeconomic analysis team at the Roosevelt Institute. They hold a bachelor’s degree in economics from Delhi University and a master’s in international affairs from Columbia University, where they specialized in gender and public policy. Prior to working at Roosevelt, Ira worked on corporate finance issues and international development.

EXECUTIVE SUMMARY
Over the last couple years, the world has experienced the highest levels of inflation in more than four decades. There are multiple sources of economic disruption that have likely contributed to this inflation, most notably pandemic shutdowns and reopenings and Russia’s invasion of Ukraine. The inflation, in turn, has sparked a debate about its causes, with some claiming it is demand-induced, largely the result of high spending in response to the pandemic. Others focus on pandemic-induced supply shortages and demand shifts, possibly exacerbated by market power and market manipulation. While there may be elements of all of these, the policy response needs to address the dominant cause. If it’s a result of excessive aggregate demand, then monetary policy reducing aggregate demand through monetary tightening is appropriate. If it’s largely supply-driven, a more tailored response is required, including fiscal policy that alleviates the supply constraints.
Our analysis concludes that today’s inflation is largely driven by supply shocks and sectoral demand shifts, not by excess aggregate demand. Monetary policy, then, is too blunt an instrument because it will greatly reduce inflation only at the cost of unnecessarily high unemployment, with severe adverse distributive consequences. This paper presents a variety of fiscal and other policy measures that hold out the prospect of having a more significant effect on inflation. In particular, these measures would reduce inflation’s impact on the most vulnerable and provide long-term benefits to the economy without the likely high costs of excessively rapid and large increases in interest rates.
We look at both the aggregate and sectoral-level data, and show, notably, that real personal consumption has largely been below trend, particularly in the periods when inflation heated up, and total real aggregate demand has been consistently below trend, which reinforces the conclusion that the “problem” arises from the supply side. With three fiscal quarters of anemic growth, from the fourth quarter of 2021 to the second quarter of 2022, it is hard to see how excess demand by itself could be at the root of the problem. Moreover, inflation in the United States is no worse than in other countries even as Americans saw a more robust recovery, largely because we had more fiscal support. A sectoral breakdown of inflation, as well as a closer look at the patterns in the timing of inflation, further support the conclusion that excessive spending during the pandemic is not the principal cause of today’s inflation.
Breaking down inflation by sector reveals that it is tied to the obvious shocks and supply chain interruptions the economy has experienced, from high food and energy prices to the shortage of microchips for automobiles.
We also explain how the large pandemic-induced shifts in demand, such as those associated with housing, have contributed to today’s inflation.
Another important factor is the increase in market concentration, which has generated greater market power; the current circumstances have provided a prime opportunity for a greater exercise of that market power.
A Wage-Price Spiral?
The paper also addresses the concern that inflation will seep through the economy, regardless of its original source, as a wage-price spiral is set in motion. We conclude that with nominal wages already tempered, this does not seem likely. Moreover, declining real wages are typically not a sign of a tight labor market. Weak unions, globalization, and changes in the structure of the economy provide part of the explanation for why wage-price dynamics today may be markedly different from 50 years ago.
Conventional economics worries that inflationary expectations might perpetuate inflation; but so far, inflationary expectations appear mild, perhaps because many market participants agree with our analysis that the underlying sources of today’s inflation are supply side interruptions, less temporary than people had hoped for at the onset of the inflation, but temporary nonetheless. Recent data are consistent with this perspective: While inflation does vary considerably month to month, it is heartening that it has slowed over the last four months to 2.8 percent (BLS CPI; authors’ calculations) a slowing consistent with the supply side interpretation, but inconsistent with the standard macroeconomic demand-side analysis. (Because there was higher month-over-month inflation at the end of 2021 and the beginning of 2022, the year-over-year rate remains high at 7.7 percent.) The New York Federal Reserve’s “Underlying Inflation Gauge” peaked in July 2022 at 4.9 percent, and by October 2022 was at 4.2 percent.
The Right Policy Response
This analysis provides a different perspective from conventional economics on the appropriate policy responses to current inflation. Conventional wisdom, partly based on a wealth of experience in which demand shocks have given rise to inflation, holds that interest rates should be increased when there is inflation, whatever the cause. Interest rates worldwide have been abnormally low, partly because of the excessive reliance on monetary policy in response to the 2008 financial crisis. But the cost of capital should not be zero (or worse, negative). Restoring interest rates to more normal levels has distinct advantages. Going beyond that raising them too far and too quickly is problematic, especially given the buildup of debt in the era of near-zero interest rates.
Most importantly, such increases in interest rates will not substantially lower inflation unless they induce a major contraction in the economy, which is a cure worse than the disease. An economic downturn like that is likely to have long-lasting adverse effects, and the most marginalized in society will bear the brunt. Volatile energy and food prices are largely internationally driven and not under the control of the Federal Reserve. The recent aggressive hikes have not remedied these price increases and are unlikely to do so in the future. Inflation induced by these price fluctuations may come down (as it has recently in some months in the United States), but not because of Fed action. To the contrary, the paper explains several reasons why large and rapid increases in interest rates, beyond normalizing them, may be counterproductive. For instance, they could impede investments that might alleviate some of the supply shortages.
By contrast, well-designed fiscal and other policies can help to ameliorate the supply shortages, tame inflation, and protect the vulnerable, providing long-term benefits even if it should turn out that inflationary pressures are transient.
KEY TAKEAWAYS
1. Today’s inflation comes mostly from sectoral supply side disruptions, largely the result of the COVID-19 pandemic and its consequent disturbances to supply chains; and disruptions to energy and food markets originating from Russia’s invasion of Ukraine. Demand patterns too have undergone significant changes, again largely induced by the pandemic. In some sectors, these effects have been amplified as a result of the exercise of market power. But today’s inflation, for the most part, is not the result of significant excesses of aggregate demand such as might have arisen from excessive US pandemic spending.
2. While we welcome the return of interest rates to more normal levels, which reduces a number of distortions associated with persistent, abnormally low interest rates, increasing interest rates too far and too quickly risks a painful slowdown to the economy with minimal benefits to inflation short of a significant downturn. This would have particular adverse distributional consequences, especially for marginalized groups in the country.
3. There are fiscal and other measures that can and should be taken to alleviate particular sectoral inflationary pressures, and that are likely to be more effective than broad-based interest rate increases.
4. Recent data shows significant moderation of inflationary pressures, with nominal wage increases in particular being only a little over pre-pandemic levels. This, together with other indicators such as tempered inflationary expectations, goes a long way in alleviating worries about an incipient wage-price spiral.
THE CAUSES OF AND RESPONSES TO TODAY’S INFLATION1
US (monthly) inflation rates started to increase dramatically in early 2021, peaking in June 2022 at an annual rate of slightly above 9 percent before starting to decline (see Figure 1). Core inflation rates (excluding the volatile energy and food sectors) followed a similar pattern (see Figure 1). While inflation rates were still below rates in the late 1980s when they hit 14 percent and above anxieties quickly arose that we might be entering a new inflationary period.
Figure 1

People accused the Federal Reserve of getting behind the curve. They believed the Fed should have raised interest rates earlier. Now, some alleged, it would take higher interest rates,
1 Acknowledgments: We would like to thank Mike Konczal for his invaluable inputs as well as his comments and support throughout the writing of this paper. We would like to thank Dean Baker, James Galbraith, Martin Guzmán, Anton Korinek, Justin Bloesch, J.W. Mason, Andreas Schaab, and Allen Sinai for their extremely helpful comments. We also would like to thank Claudia Sahm and Matthew Klein for sharing their thoughts on their areas of expertise. In addition, we are extremely thankful to Andrea Gurwitt for her incredible edits that have vastly aided the way the paper reads. We would like to thank Victoria Mooers, Parijat Lal, Ricardo Pommer Muñoz, and Haaris Mateen for their invaluable contributions to this paper. We also would like to thank Felicia Wong, Marissa Guananja, Suzanne Kahn, Matt Hughes, Sonya Gurwitt, and Sunny Malhotra of the Roosevelt Institute, and Ali Ryan-Mosley, for their support.
maintained for longer and with a deeper downturn, to tame inflation. Others argued that the inflation was transitory, driven by pandemic supply interruptions.
Interpreting the cause of current inflation and therefore how best to manage it is not simple. We’ve never had an event like the pandemic shutdowns, with a war in Ukraine interrupting food and energy supplies even before the global economy had recovered from COVID-19. Some suggested that the underlying cause of the inflation was excess pandemic spending well intended, to prevent a pandemic depression and protect the vulnerable, but still excessive and not well targeted. Even without such fiscal support, there might have been demand-side inflationary pressures once local pandemic restrictions were relaxed, with individuals spending money not spent while supply remained constrained.
If demand were the cause, the argument went, curbing demand was the answer; and that’s what conventional monetary policy is good at, though with long and variable lags. But if, as we believe, inflation was more microeconomic in its origins a combination of specific supply shortages, demand shifts, and firms with market power taking advantage of the market turbulence to raise prices even further then raising interest rates might not only not solve the problem of inflation, it might exacerbate it even while inducing an economic downturn. The answer to the rhetorical question, “Will raising interest rates increase the supply of food or oil?” is obvious.
In an almost tautological sense, inflation reflects an imbalance in supply and demand, so both demand and supply are involved (at least in competitive markets but because many markets in the United States are far from competitive, one needs to go beyond such a simple analysis to understand inflation in markets with market power, as we do below); one could reduce inflation either by reducing demand or increasing supply. But as the previous paragraph suggests, there is something deeper about the current debate: Is today’s inflation the result of an excess of aggregate demand, or is it the result of a myriad of sectoral supply side shocks? The optimal response to today’s inflation depends on the answer to that question.
Of course, both may be true, at least to some extent. But this paper addresses the question of what the predominant source of today’s inflation is, and provides a clear answer. It is not
aggregate demand but a host of microeconomic problems on the supply side (including increased exercise of market power) combined with shifts in the patterns of demand.
A Wage-Price Spiral?
In the absence of adequate supply side responses, there is naturally a worry that a wage-price spiral is beginning. Some macroeconomists, looking at the past or at other countries, argue that whatever the cause and whatever the cost, a spiral must be nipped in the bud, and the most effective way to do that is to raise interest rates early and aggressively.
Today, however, there is strong evidence that we are not facing a nascent wage-price spiral. A variety of recent data support the hypothesis that inflation is likely to be tamed without any significant further increases in interest rates or unemployment. While inflation does vary considerably month to month, it is heartening that headline inflation has slowed down over the last four months to below an annual rate of 3 percent, a slowing consistent with the supply side interpretation developed in Section 2, but inconsistent with the standard macroeconomic demand-side analysis. (Of course, taming inflation does not mean that inflation rates will immediately fall to the old target of 2 percent, a target that was essentially pulled out of thin air. And, of course, it does not mean that prices will return to their prepandemic levels.)
There are other indications: Nominal wage growth has already come down markedly, with wages lagging well behind prices. The New York Federal Reserve’s Underlying Inflation Gauge (UIG) “captures sustained movements in inflation from information contained in a broad set of price, real activity, and financial data,” peaked in June 2022 at 4.8 percent and by October was down to 4.2 percent (Federal Reserve Bank of New York 2022).2
Inflationary expectations have also remained tame, which is consistent with our interpretation of the data.3
2 It is interesting that the UIG’s perspective of moderating inflation is consistent with data concerning inflationary expectations cited in Section 3 of this paper.
3 See the discussion in Section 3.
Much of this should not come as a surprise. Pandemic-induced supply bottlenecks seem to be in the process of being resolved (see Section 2) as inventories are restored to more normal levels4 and delivery lags are markedly reduced.5 There are reasons to believe that prices of energy, food, and autos, for instance, will not continue to rise but will actually decrease, setting off disinflationary processes. But we cannot tell when partly because no one can predict when the war in Ukraine will end or how the pandemic in China, with its citywide lockdowns, will evolve.
Designing a Policy Response
We argue that supply side and demand-shift inflation is markedly different from inflation arising from an excess of aggregate demand. Given the evidence that today’s inflation is overwhelmingly related to sectoral disturbances, we are not optimistic that a blunt instrument such as raising interest rates will do much to tame inflation unless it causes a marked slowdown in the economy. The reduction in aggregate demand required to alleviate critical supply shortages is large, assuming that the shortages won’t be addressed by the market itself. Indeed, monetary tightening may well be counterproductive and, in any case, is unlikely to be timely, even as it imposes large, long-lasting, and inequitable costs. It is far better to address sectoral supply bottlenecks directly rather than an across-the-board dampening of the economy with the concomitant increase in unemployment. Section 6 below shows some things we could do to temper inflation, including implementing fiscal and other policies that would benefit society regardless of the pace of inflation. Monetary policy, on the other hand, has the potential to inflict long-lasting scars.
4 Increasing by nearly 17 percent by September 2022 from the trough in September 2021. The increase in car inventories by almost 70 percent since its lowest point in February is indicative that the car shortage, which played such a large role in inflation earlier in the pandemic recovery, is now being alleviated. It is reflected in a fall in the average transactions price for cars (BEA 2022a).
5 The supplier deliveries index, measuring whether deliveries are taking a longer or shorter time (put together by the Institute for Supply Management) reports an almost 40 percent decline between October 2022 and a year earlier, with delivery times now getting shorter rather than longer (Institute for Supply Management 2022)
The Organization of the Paper
This paper is organized into seven sections beyond this introduction, and a set of concluding remarks. We first look at aggregate data to see whether there has in fact been excessive aggregate demand. Section 2 looks at the underlying microeconomics of the economy, supply interruptions, demand shifts, and the increased exercise of market power. Section 3 takes a closer look at the labor market, showing that nominal wage growth has already been tempered and that there is little evidence of a wage-price spiral. Section 4 shows that US inflation, compared to other countries, is not particularly high, which one would have expected had excessive pandemic spending caused current inflation. Section 5 provides a few remarks about parsing the relative importance of alternative sources of inflation. Section 6 examines some of the risks posed by excessive increases in interest rates. Section 7 discusses some of the fiscal and other measures that might be more effective in addressing inflation than monetary policy. The concluding section argues that an appropriate assessment of today’s macroeconomic situation, with all the risks and uncertainties including those associated with aggressive monetary tightening, suggests a more measured response from now on. While restoring interest rates to more normal levels has distinct advantages, going beyond that raising them too far and too quickly is problematic, especially given the buildup of debt in the era of near-zero interest rates.
SECTION 1: EXCESS AGGREGATE DEMAND IS NOT THE PRIMARY SOURCE OF INFLATION
People who believe federal spending during the pandemic (particularly through the American Rescue Plan, as well the CARES Act) is the source of the post-reopening inflation typically focus on the resulting excessive consumption by the recipients. However, real personal consumption, even after recovering from the depths of the pandemic, was only slightly above trend and not commensurate with the level of inflation seen during the same time.
Demand-driven inflation, of course, is the result of an excess of total demand over potential supply. Aggregate demand consists of consumption, government expenditures, investment, and net exports. Below, we look at what has happened to each. As we shall see, neither the timing nor the pattern of inflation across sectors is well explained simply by an excess of aggregate demand; and indeed, for most of the time since the onset of the pandemic, aggregate demand has remained below potential. When it has exceeded estimated potential, the excess is insufficient to explain the observed increase in inflation.
Real Personal Consumption Is Only Slightly above Trend
Several major spending bills were designed to stabilize demand throughout the economy during the COVID-19 pandemic. The International Monetary Fund (IMF) estimated that the fiscal stimulus related to the pandemic was 25.5 percent of the total US GDP (IMF Fiscal Affairs Department 2021). The goal was to stabilize economic spending, and it was successful. As Figure 1.1 shows, we have seen a rapid recovery in real personal consumption in the aftermath of the pandemic.6
6 Because we are looking at a relatively short period, it makes little difference whether we use a log or real scale. For convenience, we use the latter. Figure 1.1 (and most of the figures below) is based on the National Income and Product Accounts (NIPA) that use chain-weighted indexes for adjusting for inflation.
Figure 1.1

Comparing the core Consumer Price Index (CPI) (that is, excluding the volatile energy and food components) to personal consumption expenditure, we see that inflation started to increase in early 2021 and rose until early 2022, after which it began to stabilize with relatively moderate fluctuations. The period of increase in inflation corresponded to a period in which consumption was markedly below trend (though increasing rapidly).7
What matters for aggregate price pressure is total aggregate demand, and other components of aggregate demand remain weak, as we shall see.8 But this simple comparison refutes the claim that excessive consumption was the central cause of excessive inflation that followed the post-pandemic recovery.
The speedy return to trend lines as the economy reopened in 2021 was an indication of a successful recovery quite unlike the aftermath of the 2008 Great Recession, where demand never really returned to trend, as seen in Figure 1.2.9
7 Consumption was recorded above trend in June 2021 and has remained marginally above trend since then, while the inflation rate had started to see sharp increases beginning in February/March 2021. The monthly inflation rate went down slightly in July and August of 2021, as consumption reached above-trend levels.
8 When inflation picked up, aggregate demand was still substantially below potential. See the fuller discussion below.
9 These results parallel those of Aladangady et al. (2022), obtained using the PCE deflator.

Nominal consumption is indeed higher than the previous trend line, and while some hold this out as evidence of excessive demand, all this represents is that prices are higher. (Moreover, those higher prices also mean that nominal potential output is also proportionally higher.) The source of those price increases needs to be investigated. Our analysis, detailed below, shows clearly that the primary source of those price increases is not excess aggregate demand but a complex set of supply and sectoral demand shocks.
Government Expenditures
The American Rescue Plan and other COVID-19 measures provided help for state and local governments and increased federal expenditures in certain areas. But again, government expenditures are not contributing to excessive growth in aggregate demand that might underlie current inflation. Real government expenditures including federal, state, and local funds inclusive of national defense and nondefense spending (excluding transfers) have, with the exception of one quarter near the peak of the pandemic, been below trend, most recently during the period of increased inflation and significantly so (see Figure 1.3).
Figure 1.3

Investment
Gross private domestic investment, while markedly below trend in the period during which inflation took off, rose above trend from Q3 of 2021 until around Q2 of 2022, as seen in Figure 1.4. It is important to note, however, that this period also coincides with a dramatic increase in inventory accumulation as seen in Figure 1.5, some of which was “unintended,” simply the result of consumption and other components of aggregate demand being less than firms had anticipated.

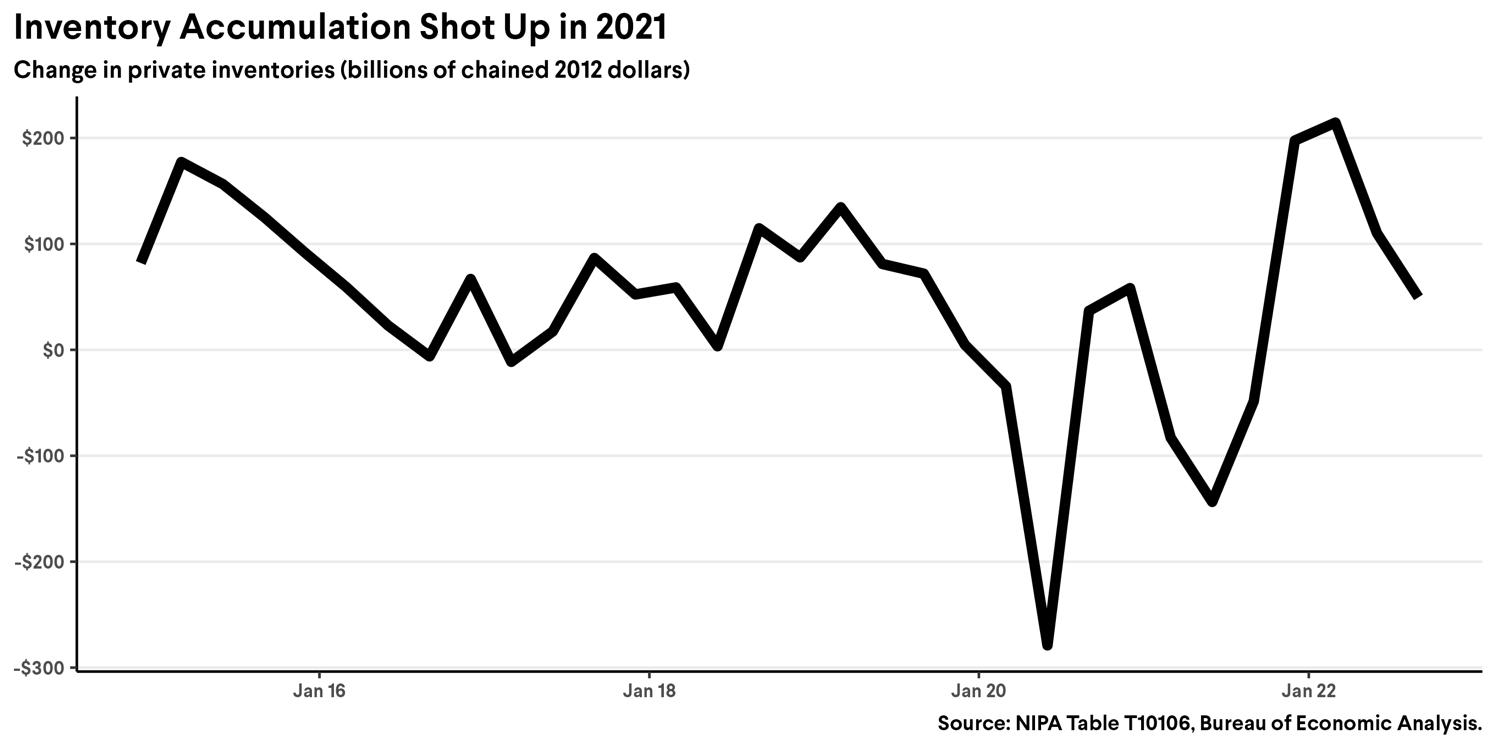
Figure 1.4
Figure 1.5
Focusing on investment in plants and equipment in Figure 1.6, we see that it remained below trend.
Figure 1.6

On the other hand, as we can see in Figure 1.7, residential investment accelerated sharply to extraordinarily high levels within a short period in the early pandemic. However, there have been steady declines since April 2021, in the aftermath of the interest rate hikes.
Figure 1.7

Net Exports
The final component of aggregate demand is net exports. Net exports have actually headed the wrong way: down. Their rapid decline since the pandemic, as shown in Figure 1.8 (with a slight rebound in 2022), reinforces our conclusion that aggregate demand is not the source of inflation.
Figure 1.8

Aggregate Demand
Figure 1.9 puts the pieces together, adding up C + I + G + NE (consumption plus investment plus government expenditures plus net exports) and comparing them all with trend, to show that in total, the economy has largely remained below trend. Actual output equals aggregate demand, provided that supply is not the binding constraint.10 The accumulation of inventories as shown earlier in Figure 1.5 suggests that aggregate supply was not a binding constraint. (As we discuss more fully in the next section, there were, of course, important sectoral supply constraints.)
10 If there were aggregate supply constraints that were binding, observed output might be below trend; even if in the absence of such supply constraints, demand would have exceeded trend.

Comparing actual output with the Congressional Budget Office’s calculation of potential GDP its estimate of what the economy could produce substantiates that excess aggregate demand is not the source of today’s “excess” inflation. That is, we are only trying to explain the increase in the post-pandemic inflation rate relative to the pre-pandemic inflation rate.11
11 Pre-pandemic, we still had inflation, and we are not trying to explain the reasons underlying “normal” inflation. Throughout the discussion below, we seek to understand just this excess inflation, even though, for simplicity, we will often discuss alternative explanations of today’s inflation.
As Figure 1.10 shows, GDP remained below potential except for a brief period between Q4 of 2021 and Q1 of 2022.12 13
Indeed, if the relationship between the “aggregate output gap” and price inflation were stable, then the period following the onset of the pandemic until at least mid-2021 should have been marked by deflation or disinflation. In addition, if this relationship were near linear, the cumulative effect would have resulted in prices lower now than even before the pandemic, which is clearly not the case. We emphasize this point not to make any claims about what this relationship is like, but rather to reinforce the central theme of this paper: that one has to go beyond aggregates and macroeconomics to understand what has occurred.14
12 The data in Figure 1.10 from the CBO’s most recent report show little adjustment for the pandemic. Potential output is typically defined as the level of output and the associated level of unemployment above which inflation starts increasing (increases to above the target level, currently 2 percent). It is largely determined by the economy’s capacity to produce, its labor force, capital stock, the terms of trade on imported intermediate goods, and productivity. The pandemic induced variations in all of these, beyond the large sectoral shocks (to be discussed at greater length in the next section). In the appendix, we show the decrease in labor force and capital stock (relative to trend) induced by the pandemic. In the years before the pandemic, the working-age population had largely stagnated; today, it is slightly larger than it was before the pandemic. The capital stock is a mere 1.4 percent below trend (see Figure A1). While these and other adjustments would lower potential GDP, they would not lower it enough to make aggregate demand lower than potential output, or at least lower it enough for excess aggregate demand to be the source of inflation. During the pandemic, the observed decrease in the labor force participation rate was at least in part the result of the increased risk of working; nonetheless, the number of individuals seeking employment who could not find jobs increased enormously. In addition, because of COVID-19, there was a slight but significant increase in the number of days individuals were absent from work because of illness. Even if these decreases were permanent (e.g., a result of attitudinal shift away from work and a higher incidence of disease), the resulting impact on output would be insufficient to result in the level of inflation we have witnessed. (The most recent evidence suggests that these changes are not permanent: Current participation rates are negligibly above levels seen in 2015. See also the discussion in Section 3.) While labor supply and capital stock decreased from trend as a result of the pandemic, productivity increased dramatically by some 4 percent between the first and second quarters of 2020 alone (while the annual productivity increase has been well under 2 percent (BLS 2022i). Moreover, overall terms of trade were moving favorably toward the US, at a rate significantly above trend (BEA 2022b). All of this suggests that no matter how one looks at it from an aggregate perspective, excess aggregate demand could not account for the magnitude of the “excess” inflation observed.
13 The CBO’s estimate for potential GDP changed considerably since the pandemic. We compare the actual GDP to the CBO’s latest estimate of what potential output was in each of the earlier quarters.
14 See also the discussion on wage dynamics in Section 3.
Figure 1.10


Our argument can be seen another way, by comparing GDP projections before and after the pandemic. Before the pandemic, the expectation was that prices would remain relatively stable that is, aggregate demand would increase in tandem with aggregate supply so GDP projections are, in effect, projections of aggregate demand. As seen in Figure 1.11, actual GDP with May 2022 as a baseline was more than 2 percent below the baseline projections of January 2020.
Figure 1.11
Still a third way to see that aggregate demand was not the driver of inflation is to look at the unemployment rate. The unemployed are those people able and willing to work. When there is significant unemployment, it means that there is unused worker potential (i.e., the economy is working below potential). This is typically refined to say that there is a “natural” rate of unemployment, below which inflation exceeds some target level, or above which inflation starts to increase. 15 Pre-pandemic, inflation was below the 2 percent target (only 1.8 percent in February 2020 according to the PCE index that the Federal Reserve monitors) even though the unemployment rate was 3.5 percent. It was not until July 2022, well after the inflation rate increased, that unemployment returned to that level. Even if one had said the Phillips curve had shifted so much that post-pandemic the natural rate of unemployment (or the NAIRU, the unemployment rate below which inflation increases) was 5 percent, inflation would not have started increasing until July 2022. Nonetheless, inflation started to increase in November 2020 when the unemployment rate was 6.7 percent, higher than almost anyone thinks the natural rate or NAIRU is. (Similar perspectives arise from looking at wage inflation data, presented in Section 3.)16 Something else was going on something that cannot be understood just by looking at aggregative statistics and invoking stable and standard macroeconomic relations the cross- and inter-sector shocks and constraints that are the subject of Section 2. (See Box A on Understanding Inflation and Box B below on the stability of the Phillips curve.)
15 The original Phillips curve argued that there was a stable relationship between the unemployment rate and the rate of inflation. The expectations-augmented Phillips curve gained prominence after Milton Friedman’s presidential address to the American Economic Association in December 1967 (Friedman 1968), in which he argued that there is a stable relationship between the unemployment rate and the rate of increase in the inflation rate. The natural rate of unemployment refers to the rate of unemployment at which inflation is at, say, 2 or 3 percent; the NAIRU refers to the critical rate below which the inflation rate is ever increasing. Those who argue that the NAIRU has increased have to explain why the inflation rate has not increased since the beginning of 2022. The case for a shift in the NAIRU is perhaps even weaker than the case for a shift in the natural rate.
16 These results are generally unchanged if instead of focusing on the NAIRU we look at the overall relationship between unemployment and inflation, or the Phillips curve, as discussed in footnote 15 and more extensively in Section 3 (and especially the appendix to Section 3). Unemployment increased precipitously during the pandemic and has now returned to pre-pandemic levels. If the Phillips curve were indeed stable, inflation would have fallen dramatically, and the average inflation rate over the interval between the onset of the pandemic and now would have been markedly lower than pre-pandemic. (If one were using an expectationsaugmented Phillips curve, the rate of inflation would have been markedly lower at the end of the period.) Of course, one can explain the seeming anomaly by saying that the Phillips curve shifted evidently by a large amount. But that argument carries with it a heavy burden to explain why it shifted so much, and why it wouldn’t shift back again as the economy gradually returns to normal. An ever-shifting Phillips curve is of limited help for policy analyses, as we discuss further in the appendix to Section 3.
BOX A: UNDERSTANDING INFLATION
The simplest macroeconomic models relate price inflation simply to the disparity between aggregate demand and the economy’s “potential” output (economies can actually produce beyond potential output for a period of time, by forgoing needed maintenance, for example). At the same time, wage inflation is driven by the level of unemployment, with low levels of unemployment giving rise to increasing wage inflation. The intuition behind these dynamics is simple: In competitive markets, prices (wages) go up if and only if there is an excess of demand for goods (labor) over supply.
But obviously, the goods and labor market are interrelated, and competition is far from perfect, so more general formulations have price inflation affected by wage inflation and vice versa. Hence, it is conceivable that high demand has its effects indirectly first through tightness in the labor market, which then gets passed onto prices. In the same way, price inflation gets passed on into wages, and this then sets off the much-feared wage-price spiral. In Section 3, we present reasons why we may not need to be too concerned about this at the current time.
Section 3 and the discussion just presented argue that excess aggregate demand has, however, not manifested itself in the current period of inflation indirectly through the labor market, in spite of all the concerns about labor shortages. During the period in which inflation originally increased in the pandemic (February 2021 to May 2021), wage increases remained muted. At least for this inflationary episode, it appears that wages lagged behind prices. It was price inflation that gave rise to wage inflation. So we must explain the origins of this price inflation, and this section has shown that it cannot be attributed to an excess of aggregate demand.
There are many reasons why there may not be a stable relationship between the output gap and goods inflation or unemployment and wage inflation. The latter might be affected by changes in demography, search costs, or turnover costs variables that normally change slowly. A shock to the economic system, such as that associated with the pandemic, has a multitude of effects on individual sectors and on the aggregate. When the sectoral disturbances are large enough, one cannot rely on previously estimated macroeconomic relationships, at least for the periods until normalcy is restored. The central contention of
this paper is that to understand today’s inflation, one has to look at sectoral problems, not at the aggregate. The rise in inflation originates in these shortages, and inflation will be tamed when these shortages are resolved.
There is one more important set of inflation theories that has received attention in recent years, focusing on how expectations of inflation in the future may drive inflation today. These forward-looking inflation models have been important for people who worry about inflation momentum: Once inflation starts, the belief that it will continue sustains it.
Without addressing the persuasiveness of the underlying theoretical models and the assumptions that go into them, inflationary expectations have been very muted and are clearly not driving today’s inflation (see fn. 67 below).
Understanding Why Pandemic Spending Didn’t Have the Inflationary Effect Expected by Some
During the pandemic, there were large buildups of cash balances and wealth (savings above normal level, called excess savings17), which some blamed on excessive government fiscal support. But a careful analysis of the data by Aladangady et al. (2022) shows that fiscal support provided little of the explanation; less consumer spending was the dominant explanation (see Figures 1.12a and b).
17 Aladangady et al. (2022) define excess savings as savings above and beyond what people would have saved if income and spending components had grown at recent, pre-pandemic trends.

1.12b

In turn, the buildup of cash balances and excess savings gave rise to worries that it might set off inflationary pressure as these were spent down. But the evidence presented earlier, particularly real consumer expenditure, suggests that aggregate demand recovered but never became excessive. Why?
Figure 1.12a
Figure
There are three parts to the explanation, all supported by the data. First, as the pandemic wound down and individuals found themselves with excess cash balances and greater savings than they would otherwise have had, they did not spend the money quickly (Stiglitz and Baker 2022a). And a considerable amount of the observed drop in household “excess savings” went to pay “non-withheld” taxes (Arnon 2022), such as capital gains (Baker 2022c), which went up by some 40 percent, or more than $160 billion (see Figure 1.13.)
Figure 1.13

Interestingly, data from the Bureau of Labor Statistics (BLS)18 report the largest increase in expenditures at the top a group that received the least pandemic aid and, according to JP Morgan Chase (Greig and Deadman 2022), showed a slight increase in cash balances over the period.
None of this should come as a surprise. Economic theory suggested that people would treat excess savings as wealth and spend it gradually over their lives. It suggested, for instance, that individuals would not go to restaurants that much more after the pandemic to compensate for the lack of eating in restaurants during the pandemic. It also suggested that if high levels of uncertainty persisted, individuals would want to keep higher levels of 18 BLS 2022a
precautionary balances.19 (Personal savings rates by 2022 were above pre-pandemic trend levels until late 2021, well after inflation started to increase. See Figure 1.14 from Aladangady et al.)20
Figure 1.14

Secondly, when individuals spent the money, they spent it heavily on globally produced goods, reflected in the surge of imports in Figure 1.15.21 This didn’t have the multiplier effects
19 Stiglitz (2020) noted the possibility that the pandemic might generate inflationary pressures as a result of an imbalance of aggregate demand and supply, but emphasized the likelihood that there would be a need for enhanced precautionary balances for an extended period of time.
20 Some pointed to the fall in the national savings rate as corroborating the “excessive” consumption perspective. The best way to assess whether there was excessive consumption is to look at the levels of consumption, as we have done. There are some statistical quirks in the measurement of the savings rate, which explain why it gives a misleading picture. When these are corrected, the picture that emerges is that already presented. Because capital gains are excluded from income in the national income accounts, this mechanically reduces the savings rate. The increased tax payments reduce disposable income, while the capital gains income, not accounted for as income in the national accounts, does not show up as increased income. When adjusted for capital gains tax, the drop in savings is not as large as the official measure. The adjusted savings rate was higher than pre-pandemic levels until Q4 of 2021 and fell only by 1 percent in Q3 of 2022.
21 The large movements cannot be explained just by the movements in exchange rates, which themselves exhibited some complexity. They declined in the initial months of the pandemic but then recovered, reaching levels well in excess of those pre-pandemic. There are too many forces at play to precisely determine the contribution of each; whatever the cause, the fall in the exchange rate from early in the pandemic to early 2021 contributed to the inflation in that period, while the increase in the exchange rate since mid-2021 until now has contributed to the inflation over that interval.
or the inflationary effects on the US economy that it would have had it been spent on domestically produced goods.22
Figure 1.15

As seen in Figure 1.16, consumption expenditure on largely non-traded categories like recreational and transportation services is comparable to or lower than pre-pandemic levels. Food services and accommodations are only moderately higher. While there were increases in these categories in late 2020, the changes were merely a readjustment to pre-pandemic levels rather than indicative of a sustained rise in demand.
22 Obviously, US expenditures on traded goods is just a fraction of global expenditures, while by definition, US expenditures on non-traded services represent the totality of those expenditures. Figure 1.15 shows imports increasing from pre-pandemic levels by some 10 percent. If US purchases of global goods is roughly proportional to its share in global income, this would have induced only a small percentage increase in global demand, well within the range that global markets could have accommodated.

And thirdly, additional spending on domestically produced goods went disproportionately into increased prices and profits rather than increased production, as we will see in later sections. This also limited the multiplier effects of the spending, with the increased profits, share buybacks, dividends, and stock market values having a much more modest effect in stimulating consumption or investment than if the spending had gone into increased employment and wages.
Concluding Comment
The evidence is overwhelming: Were there no supply problems, aggregate demand would not be excessive. While the economy was able to recover from a devastating pandemic with the help of an effective fiscal response, the inflation we’ve experienced is not best understood as an excess of aggregate demand over aggregate potential supply. Rather, today’s inflation is the result of a series of microeconomic, industry-specific problems, which we look at in detail in the next section.
SECTION 2: THE SUPPLY SIDE IS THE DRIVER OF INFLATION
To understand today’s global inflation, one must look at where the price increases are coming from. Over the past two years, the sources of inflation changed, especially after Russia’s invasion of Ukraine when energy and food prices moved to the center of the economic debate. The changing sources and nature of inflation make the analysis complicated and the narrative complex. We can identify five (often intermixed) major factors: energy and food; supply interruptions, most notably for cars; demand shifts in the presence of supply inelasticities; increased rents (largely a result of demand shifts in the location and type of housing desired); and manifestations of market power (see Figure 2.1).
Figure 2.1

COVID-19 was a major disturbance to both the demand and supply sides of the economy. Policy focused largely on protecting individuals to ensure their standards of living didn’t plummet; that approach meant there was always the risk that demand and supply would be out of sync.23 But inflationary pressures did not become evident until well into the pandemic, indeed, until in some respects we were in the process of recovery. And it started well before consumption or aggregate demand had normalized. The global economy seemed unable to produce, or at least produce the goods and services that individuals wanted at that time.
23 Stiglitz 2020.
Many thought the supply side problems and consequent inflation would be transitory. The persistence of inflation was partly a result of two unanticipated shocks the Russian invasion of Ukraine, contributing significantly to food and energy inflation, and the omicron variant of COVID-19, leading to further supply side interruptions in global supply chains, especially with China’s zero-COVID policy.
But there was another problem: an unexpected lack of resilience in the US and global economies. Many market analysts were excessively optimistic as the US economy emerged from the pandemic. They looked to the quick responses in some sectors, such as lumber (typically with relatively short supply chains), not expecting the very slow responses elsewhere. Few anticipated, for instance, the microchip shortage that led to soaring car prices certainly not those who had anticipated inflation coming from pandemic spending. In the appendix to this section, we discuss some of the reasons for this lack of resilience.
The lack of resilience meant that as the US economy responded and recovered from the pandemic, a host of slow-to-correct supply shortages appeared, giving rise to the inflation we experienced.24 While sufficient reduction in aggregate demand would alleviate the shortages, the economic price of doing so would be enormous. A better strategy entails directly addressing the microeconomic problems themselves, as we discuss below.
Even as this paper is being completed, the picture is changing. There are reports of reduced supply chain bottlenecks, with chip shortages ameliorating and shipping prices falling. Auto prices are stabilizing as car inventories build up.25
In the subsections below, we discuss some of the main factors on the supply side giving rise to inflation.
24 Many of the shortages occurred outside the US, either because of COVID-19 lockdowns or limited resilience abroad, or arose because of shipping limitations discussed more fully below.
25 See fn. 4 above.
Energy and Food Price Increases outside the Domestic Market Are Driving Much of Current Inflation
In the United States, 1.3 percentage points of the headline 7.7 percent 2022 CPI inflation as of October 2022, annualized, came from energy prices, and an additional 1.6 percentage points came from food prices (BLS 2022b).26 By contrast, in the period from 2014 to the pandemic, energy had an overall deflationary effect of about 0.15 percentage points.
As the global economy recovered from the depths of the pandemic, energy and food prices rose. Energy prices were returning to more normal levels from very depressed levels following the onset of the pandemic and didn’t reach pre-pandemic levels until early 2021. Then, in late February 2022, in response to the Russian invasion of Ukraine, nations including the United States responded with international sanctions on Russia. As a result, oil and food prices shot up to heights that were almost twice pre-pandemic levels. But as the war has continued, matters have normalized, and by the fall of 2022, oil prices were down by a third, returning to levels around (or if adjusted for inflation, below) those seen in 2015 or at other pre-pandemic peaks.27 But in economics, perceptions matter: Consumers often seem more aware of and sensitive to price increases than they are to decreases of the same magnitude.28
It is not likely that these particular sources of inflation will continue. Even if prices don’t come down, they won’t go up, at least not at the rate they have since the war began. Of course, were the war in Ukraine to end, energy and food prices would fall, which would be deflationary or disinflationary. On the other hand, OPEC might take actions to try to keep oil
26 For an average US household, energy costs fuel and service costs, heat, electricity, and gasoline are the fourth largest expense category, and energy prices are highly volatile. For an average US household, over 11 percent of an average US household’s expenditures is spent on energy, and 13 percent on food (BLS 2022j; Melodia and Karlsson 2022). Because of the importance of fertilizer, food and energy prices are related (International Food Policy Research Institute 2022). Market power almost surely plays a role here too. Food prices may also have been affected by large climate events.
27 Some have suggested that food and energy prices have increased by more than can simply be accounted for by the economic recovery, the war in Ukraine, and changes in the flows of oil and gas into the global market, indicating that market power has been at play. With OPEC deliberately taking actions to restrict production, that is obviously the case. (Market power is discussed further below.) This may also have to do with speculative and precautionary behavior, with market participants building up stockpiles, against the contingency that prices might rise even further.
28 Thus, if oil prices go from $60 to $100 and then back to $60, people will remember inflation, not a temporary price spike.
prices high (as it has already done), illustrating the role that politics and market power play in the setting of global energy prices.29
Even if the war turns out to be protracted, there are reasons to believe that prices may go down. As governments, households, and producers react and respond to this crisis, supplies will increase and demand will be reduced. Already, energy prices have seen month-overmonth declines of 4.6 percent in July, 5 percent in August, and 2.1 percent in September 2022.30 Given the volatility of energy prices, there is no assurance, of course, that this will continue. Indeed, there was a slight reversal in October, with a 1.8 percent increase, and prices are still 17.6 percent higher than a year earlier.31 Food prices are also expected to moderate to 3 percent to 4 percent in 2023.32
Looking a little further into the future, there is more cause for optimism. For half a century, the United States and European governments have paid their farmers not to produce. If the war continues, presumably that policy could or should end and again, as that happens, food prices would fall.33 The price of fossil fuels should also decline markedly, with the decreased consumption during the pandemic and war leading to prices below the pre-pandemic trend.34 Moreover, as the world moves toward renewable energy, energy prices will largely be determined by the long-run marginal (or average) cost of renewables, which is substantially below current prices (Sims et al. 2021).
29 OPEC had a production cut right before the US midterms, which as this paper goes to press, OPEC is poised to undo (Meredith and Turak 2022). OPEC of course denies that politics had anything to do with it.
30 These are seasonally adjusted changes from the preceding month in CPI (energy) for All Urban Consumers.
31 12-month (unadjusted) increases peaked at 41.6 percent in June before falling to 32.9 percent in July, 23.8 percent in August, and 19.8 percent in September.
32 Unlike energy, food prices did not plummet after the onset of the pandemic in 2020 they increased 3.4 percent in 2020, 3.9 percent in 2021, and are on track to increase 9.5 to 10.5 percent in 2022 (USDA 2022).
33 Again, politics might interfere: Farm lobby groups might lobby for the continuation of the restrictions. If that were to happen, it would be a self-inflicted wound.
34 The reason for this is that the stock of oil will be greater than it otherwise would have been. The price of oil (or any depletable) natural resource is a declining function of the stock and total demand. The stock of oil (and other fossil fuels) post-war will be higher because the high prices deterred consumption from what it otherwise would have been. The war itself has provided further impetus for countries to move toward renewables beyond that provided by the increasing evidence of the costs of climate change.
It would take a better crystal ball than we have to predict how fast all of this will happen. But the recognition that there are fundamental disinflationary forces at play should temper inflationary expectations.
Goods Inflation Is Significant, Historically Unique, Driven by Supply Side Factors, and Is Already Beginning to Ease
Core goods, which exclude energy and food, are responsible for a significant share of recent inflation. These goods contributed 2.3 percentage points to inflation in 2021 (almost all of which 1.94 percentage points was due to automobiles and car parts).35 By contrast, this category had not contributed at all to inflation in the years leading up to the pandemic. Indeed, its contribution was slightly negative.
In 2022, supply side pressures began to ease. Core goods’ contribution to inflation remained higher than pre-pandemic levels, but by October 2022 had dropped to 1.8 percentage points.
A major explanation for these price increases is the idiosyncratic supply chain factors associated with the disruptions prompted by the pandemic shutdowns and subsequent reopenings. The Federal Reserve Bank of New York’s Global Supply Chain Pressure Index (GSCPI), which integrates various indices that analyze delivery times, backlogs, and inventories to assess supply chain pressures, shows that the sustained and frequent problems are much larger in magnitude compared to historic trends (Federal Reserve Bank of New York 2022). Supply chain pressures have been easing consistently since April 2022, though they remain at historic highs (Stiglitz and Baker 2022b).
As supply chain pressures eased, the prices of nonfuel imports stopped advancing in April 2022 and have declined consistently since May 2022 (BLS 2022c)36 (see Figure 2.2).
35 From the beginning of 2022 until October, it contributed 0.3 percentage points to inflation. Source: BLS CPI, authors’ calculations.
36 Nonfuel import prices are still markedly higher than they were a year earlier, but these steady monthly declines temper inflation and should eventually become important sources of disinflation.
Core Inflation and the Perpetuation of Inflation
Some have cited price increases in core goods and services to argue against the supply side hypothesis: The inflation we are seeing is more than just energy and food. But this itself says nothing about whether there is aggregate demand-driven inflation since increases in the price of noncore goods seep into the price of core goods and services.
Inflation in intermediate goods used by the services sector will, for instance, increase the prices of services. The same will happen for other goods. The key questions are: Is an excess of demand pushing inflation still higher? Is there a significant risk of triggering a wage-price spiral? And, if so, is tightening monetary policy the best way to head off such a spiral? The first question we have already answered in the negative. Later sections of this paper answer the second and third questions. In an appendix to this section, we take a closer look at three critical shortages and what lies behind them: chips, energy, and shipping. We’ve also discussed the moderation of energy prices, down significantly from their peak with prospects of further decreases. Automobile companies report that the chip shortages they faced earlier are being addressed, and chip makers more broadly are discussing the possibility of a chip surplus.37 Cargo shipping rates have fallen by some 60 percent since the peak in the summer of 2021 another indication that critical supply bottlenecks are, at last, being addressed.
38 Further, as we have noted, nonfuel import prices are falling sharply, another major source of disinflation (in 2021 and earlier in 2022, they were adding to inflation. See Figure 2.2).
39
37 Fitch 2022.
38 See Global Container Freight Index (Freightos Data 2022).
39 BLS 2022c.

Large Sectoral Shifts in Demand—Partially Induced by Supply Shortages—Can Give Rise to Inflation
The simplistic debate about demand- and supply side sources for today’s inflation misses one crucial point: There is a fundamental difference between sectoral demand effects and effects associated with excesses of aggregate demand. A supply side shortage (or an increase in prices in one sector) induces a shift in demand to other goods and services or a reduced supply of labor.
40 A sudden increase in demand for a particular good can be inflationary in the presence of sectoral supply constraints in that sector. Likewise, the pandemic itself induced large sectoral shifts in demand with similar effects. Were there perfect symmetry in price responses an increase in demand in one sector giving rise to a price increase of the same magnitude as a price decrease that resulted from a decrease in demand in another sector such demand shifts would not be inflationary. But that is not the case. For various reasons, shortages typically give rise to much larger price increases than the decreases associated with surpluses. Well-recognized downward nominal rigidities mean that firms don’t lower prices when there is a surplus as much as they raise prices when there is a shortage. Moreover, with capacity constraints, a small shift in demand can give rise to a large
40 The ways in which a shortage of supply of particular goods interacts with labor supply and the demand for other goods was a major subject of earlier disequilibrium macroeconomics (see, e.g., Solow and Stiglitz 1968), with insights applied to the recent pandemic in Guzman and Stiglitz (2021).
shortage; the marginal cost of increasing output is large, so prices even in a competitive market would rise considerably. But if the marginal cost curve below current levels of production is relatively flat (the way it is traditionally depicted), the decrease in price when demand decreases is limited.41 Thus, large demand shifts are typically associated with increased inflation.
The appropriate policy response to sectoral demand shifts is markedly different from inflation arising from excess aggregate demand (Bloesch 2022a). It does not entail reducing aggregate demand, but rather directly addressing supply constraints. As firms sort out which shifts are permanent, there will be supply side responses. Whether the demand shifts are temporary or permanent, disinflationary processes will be set in motion.42
There Were Large Shifts in Patterns of Demand for Housing
An increase in the housing rent component of the CPI has been an important source of inflation, contributing 0.6 percentage points to the annualized 8 percent for 2022 inflation as of October 2022.43 Rents are important because housing costs make up around a third of CPI.44 The good news is that, for reasons explained below, these increases are likely to moderate significantly.
How do we explain the significant rent rises that have occurred? Knowing the answer says a lot about where rents are likely to go and what might be done about rent inflation. It is not as if the number of Americans needing or wanting housing suddenly increased. Indeed, in the pandemic, with the loss of over 1 million lives and restrictions on immigration, population was well below trend and that should also reduce the demand for housing.45 At the same time, the demand for office space was reduced, which should have led to lower real
41 These responses are amplified in imperfectly competitive markets, where price is set as a markup over marginal costs. See the discussion below.
42 One unanswered (and essentially, for now, unanswerable) question is to what extent some of the observed shifts in demand are permanent. For instance, it is likely that there will permanently be more working from home than before the pandemic in the parts of the economy where that is feasible.
43 BLS CPI; authors’ calculations.
44 Taken from BLS CPI Weights (BLS 2022d).
45 To be sure, we have been underinvesting in housing since the financial crisis, which has provided a fertile ground for a housing shortage (Baker 2022b).
estate prices. Instead, gross rent for retail properties46 began increasing as early as May 2020, exceeding pre-pandemic levels by July 2020 (BLS 2022e).
What seems to have happened in the pandemic is that many people wanted to move, since they could live anywhere if they could work from home. If people couldn’t interact (due to COVID-19 and necessary restrictions in place), cities became less attractive. Remote work likely had an impact on the kinds of housing people wanted, with many looking for more space at home (correspondingly, this reduced the demand for commercial real estate).47
Increases in residential rents, of course, get reflected directly in CPI, while the reductions in commercial real estate get reflected only indirectly, as prices slowly decline in response to lower overall costs of doing business. (So, a program of conversion of real estate from commercial to residential is an example of a policy that might be more successful in reducing inflation than simply raising interest rates.)
If adjustment processes were smooth and symmetric, the increased demand for some types of residential real estate would be offset by decreased demands for others, and there would then be little net effect. But adjustment processes are neither smooth nor symmetric. Homeowners are reluctant to take losses or to accept a price lower than they think the house is worth. So too for landlords.48 This means price reductions are sluggish, price increases can occur very quickly, and overall, there is an increase in the average price.49 50
There are further technical problems in the measurement of housing costs in the CPI. Some two-thirds of Americans own their homes. They don’t pay rent. But the CPI pretends they do. The CPI imputes (i.e., guesses) what homeowners would pay if they had to rent their homes. Because in many areas rental markets are thin and unrepresentative of housing more
46 Includes any incidental charges paid by the tenant (from the Producer Price Index).
47 Recent studies have shown that remote work accounted for more than 60 percent of the surge in house prices between November 2019 and November 2021 (Kmetz, Mondragon, and Wieland 2022).
48 Moreover, if they believe that overall prices are rising, misunderstanding overall trends from those in their particular locale, they will believe it pays to leave their apartment vacant rather than accept a rent that is too low. The expected gain in total (discounted) rental payments from potential increases in the monthly rental rate would exceed the cost of leaving the unit vacant for another month.
49 Moreover, converting commercial real estate to residential takes time.
50 These asymmetries are likely also to play out as the Fed raises interest rates. Raising interest rates over the long run tends to reduce house prices from what they otherwise would have been. The downward adjustment is slow, but the increase in mortgage rates is fast. So new homeowners and those increasing the size of their houses are likely to face higher living costs and experience high inflation (as opposed to measured inflation).
generally, what happens in the rental market is not a good indicator of rental values. Moreover, in the approach taken, homeowners in areas where prices and rents are booming are treated as if they are worse off because their “imputed” rent goes up even though they may in fact be better off because they have become much wealthier. The CPI measure can be badly misguided for the two-thirds of Americans living in their own home.
Moreover, the numbers used by the US Bureau of Labor Statistics (which calculates the consumer price index), while perhaps providing the most comprehensive and accurate metrics, lag by 6 to 12 months behind the private indices (like Zillow) that focus on new rentals.51 This bodes well for the future: The rent component of CPI is likely to decrease within the next year.
There is a further detail illustrating the complexity of housing dynamics:52 Many people went home to live with their parents when the pandemic began. This, together with other aspects of housing dynamics already discussed (people leaving urban areas), led to lower rental prices, which resulted in a significantly smaller number of individuals living in the average rental unit. Since most of these people have leases, this effectively creates a short-term scarcity in rental properties and drives up rents. There is a temporary “overconsumption” of housing by those who signed longer-term leases at favorable terms. As leases expire and as Zoom meetings become less central to life, this trend will be corrected and rents (adjusted for inflation) can be expected to normalize.
Corporate Profit Markups Increased during the Pandemic and Are Driving Up Inflation
Increased costs and shortages explain some of the increased inflation. In some sectors, the shifts in demand discussed earlier are creating shortages that would result in higher prices even in competitive markets. But something else is happening. Companies are doing more than just passing on cost increases.
The US economy has been characterized more and more by increasing market power (Stiglitz 2019; Gutiérrez and Philippon 2019), and when there is market power, firms increase prices
51 See Adams et al. 2022.
52 We are indebted to Justin Bloesch for drawing our attention to this.
more than increases in costs. Prices are a markup over (marginal) costs. Thus, if only energy prices were the original source of inflation, firms with market power would not just pass on their increased costs in the form of higher prices but would raise prices by even more, generating higher profits for themselves.
But matters are even worse. Firms have increased the amounts by which they mark up costs. Between 1960 and 1980, markups averaged 26 percent above marginal costs and have been on a slow and consistent rise ever since. The average markup charged in 2021 was 72 percent above the marginal cost. Moreover, 81 percent of the average increase in markups from 1980 to 2019 came from increases within industries, pointing to a generalized increase in market power.
The pandemic has given rise to an even starker increase in markups (Konczal and Lusiani 2022), as firms with the most market power drove the sharp increase in aggregate markups in 2021 (see Figure 2.3).
Figure 2.3

This is consistent with the widespread belief that companies with market power are taking advantage of the current situation to increase their profits (Konczal 2022; Groundwork 2022).53 Profit margins are the highest they have been in more than 70 years.
As seen in Figure 2.4, while profits were increasing steadily since 2010 and market concentration was also rising steadily, corporate profits increased sharply in 2021, exceeding pre-pandemic levels. In addition, corporate profits continued to rise through the third quarter of 2022 even as inflation increased. This rise in profits aligns with an analysis of earnings calls done by Groundwork Collaborative, which concludes that an overwhelming number of corporations claimed that inflation (that is, higher prices for them) was good for business and that they didn’t intend to reduce prices even as input costs came down sharply (Colgate-Palmolive 2022; Motley Fool Transcribing 2022).54
53 Standard economics raises a question: Why should corporations with market power choose to exercise that market power more now, amid this crisis? Korinek and Stiglitz (2022) provide a variety of answers to this apparent puzzle. See also below.
54 Profits and markups can increase even in competitive sectors. The high price of energy would lead to increased profits and prices above costs (markups) whether the fossil fuel sector was competitive or not. Parsing the relative importance of the supply constraints discussed in the preceding subsections and that of market power is beyond the scope of this paper.
Figure 2.4

Market power is particularly evidenced in certain sectors that are key for consumer inflation. Some economists (Ghosh 2022; Sahay 2022; Russell 2022) have suggested that the high concentration of market power in, for instance, wheat, provides ample scope and incentive for market manipulation. Four firms control 70 percent to 90 percent of the global wheat trade (IPES 2022).55
There is a more benign interpretation, still related to market power, of what has happened to markups. Even with the limited market power conferred by search costs even in sectors with many firms, each faces a downward-sloping demand curve one would expect prices to be increased by more than costs. In today’s world, one would expect the heightened sense of uncertainty associated with the pandemic, the war in Ukraine, and central banks rapidly raising interest rates, to further exacerbate markups. In the well-established Phelps-Winter (1970) theory of customer markets, firms face a trade-off: If they raise prices, current profits are increased, but this comes at the expense of future profits as customers search more, with some finding another seller with cheaper prices or goods more to their liking. With increased uncertainty, firms put more weight on the present, and thus are more likely to increase their
55 Even with competitive markets, a belief that prices are going to rise in the future would induce farmers to withhold supply today, in the hopes of making more money by selling in later periods.
prices. (As we note in Section 6, however, this model suggests that raising interest rates may be counterproductive.)
Increased concentration has had another (unintended) effect: It has made the economy less resilient and has worsened the impact of underlying supply side interruptions, which was glaringly evident in the disastrous baby formula shortages. These shortages, in turn, contribute to inflation.
For our purposes, the reason for the greater exercise of market power and the nature of the adverse consequences of market concentration are of secondary importance. What is key is that (a) increased markups associated with increased market power provide an explanation that is different from that provided by the “excess aggregate demand theory” and is more in accord with the evidence; (b) increased interest rates will do nothing to reverse these price increases, and may make matters worse; and (c) there are alternative policies that directly affect the exercise of market power and would have benefits in their own right, independent of any impact they have on inflation.
The flip side of firms passing on more than their cost increases to consumers is that workers have seen declining real wages, which we discuss in the next section.
SECTION 3: THE LABOR MARKET IS NOT A MAJOR DRIVER OF INFLATION56
The labor market has received the most attention of all the potential supply side problems. The pandemic created disruptions in the labor market unparalleled in nature and scale. Vacancies and quits both rose dramatically as the economy emerged from the depths of the pandemic. Those arguing early on for strong monetary tightening claimed (i) a wage-price spiral had been set in motion; and (ii) there had been such fundamental changes to the structure of the labor market that to bring down inflation to 2 percent would require persistently high unemployment for an extended period of time, as long as five years.57
The preceding section’s analysis suggests that as the world recovers from the pandemic and war shocks, disinflationary forces may be unleashed without the need to increase unemployment at all. But even if these disinflationary forces are not as strong as they now seem (or if the war lasts longer than we currently expect), we argue here that (i) the evidence for whether the labor market is very tight is at best ambiguous; (ii) the evidence for whether there has been a shift in the Phillips curve and other labor market relations is also at best ambiguous; (iii) there is little compelling evidence that the economy is likely to experience a wage-price spiral; and (iv) if there are significant labor market shortages, there are better policies to alleviate these shortages than raising interest rates. While there are still aspects of the labor market that are abnormal the employment-topopulation ratio remains at 1 percentage point below the pre-pandemic level the decline is half that which occurred during the 2008 financial crisis and conditions are recovering quickly. The huge difference between the employment-to-population ratio in the US and New Zealand (another country with a large COVID-19 relief package) 8 percentage points higher suggests that pandemic effects are small relative to other determinants, some of which might be altered over time, especially if the right policies were put in place.
56 This section has especially benefited from discussions with Justin Bloesch and incorporates many key insights from his October 21, 2022, Roosevelt Institute blog post, “Why Unemployment Can Stay Low While We Fight Inflation” (Bloesch 2022b).
57 Lawrence Summers, former treasury secretary and a strong advocate of the “excess aggregate demand” theory of inflation, has said that the US would need 5 percent unemployment for five years to combat inflation (Tully 2022; Aldrick 2022; Domash and Summers 2022a; Domash and Summers 2022b; Summers 2021).
This section is divided into three parts. First, we present the “big picture” the broad indicators that the labor market is not as tight as some claim. Next, we explain the overwhelming evidence that suggests wages have moderated sufficiently and there should be little concern of an uncontrolled wage-price spiral. The final section argues that if there were tightness in the labor market, the appropriate remedy is not to throw the economy into a recession through excessive monetary tightening, but pursue supply side fiscal and regulatory policies to expand the labor force.
The appendices to this part address two questions that have loomed large in the policy debates. First, why were US labor market dynamics so different from those in other countries? We review the drama of the pandemic, explaining how poorly designed policies led to unnecessary and excessive labor market turmoil. Second, does the Great Resignation high quit and vacancy rates portend high wages and a long road ahead to getting inflation down? We suggest not. We conclude the appendix with a cautionary note against basing policy on a model that has become central to macroeconomic analysis: the Phillips curve, which is the theoretical relationship between unemployment and inflation. The curve has proven unreliable, especially in periods of marked changes in sectoral relative prices, like the one we are currently in.
The Big Picture
The COVID-19 pandemic shifted both the demand for, and supply of, workers in frontline and close-contact occupations, resulting in a one-off repricing of wages.58 But rather than the sustained acceleration of wage and price increases that characterizes the feared wage-price cycle, current trends are more consistent with a shift in the level and structure of wages. As seen in Figure 3.1, the rate of nominal wage growth has moderated as of October 2022. Recently, the three-month percent change in the Employment Cost Index (ECI) is only (at an annualized rate of) around 1.6 percentage points higher than it was pre-pandemic, hardly a source of concern of “runaway” inflation. All of this has occurred with little change in the
58 This reduced wage inequality, with the highest rate of wage growth occurring in the lowest quartile of the income distribution. This was because most occupations in the frontline, close-contact, and essential job sectors were low wage and a high proportion of these “essential workers” were Black, other people of color, and women (Holder, Jones, and Masterson 2021).
unemployment rate refuting the claim that wage inflation can only be tempered through large and persistent increases in the Phillips curve.59
Figure 3.160

More broadly, in forthcoming research, David Autor, Arindrajit Dube, and Anne McGrew (Autor et al. forthcoming) demonstrate that wage increases have been mostly concentrated in the bottom quartile of the income distribution. This serves to counteract the claim that the reduction in labor force participation (which has largely reversed)61 is the result of individuals who were enriched by pandemic payments withdrawing their labor supply. Lowincome individuals, living on the edge, largely spent what they were given. While on average they had some extra savings and liquidity62 substantial increases compared to what they had before these are not enough to rely on. Particularly for those in the bottom quartile, those who can work will have no choice but to work, if they can find a job.
59 There are some complexities in interpreting the data caused by compositional changes in the labor force. The recent marked slowing of hiring of workers in low-paid sectors suggests that these compositional effects may even imply that the “composition-adjusted” decline in wage inflation is even greater.
60 Data for average hourly earnings show a similar pattern and levels, with the rate of increase falling from around 1.8 percent in the summer of 2021 to somewhat around 0.8 percent in the fall of 2022.
61 At the time of this writing, it stands at little over 62 percent. While this is more than a percentage point below the pre-pandemic level, it is at the same level as it was in 2015, when weak aggregate demand was widely seen as contributing to weak labor force participation.
62 As Aladangady et al. (2022) point out, “. . . most excess savings have been held by households at the top half of the income distribution.”
The good news is that there has been some wage compression quite desirable given concerns about the growth of wage inequality in recent decades. But now that this (limited) “leveling” has occurred, there is little reason to believe that wages for these workers will continue to rise at a rapid pace; Figure 3.2 shows the rapid decrease in the growth of retail workers’ and leisure and hospitality workers’ average hourly earnings. Indeed, the former has fallen below the average growth in the period of 2018 to 2019.
Figure 3.2

The strong wage moderation implies that wage growth has lagged behind inflation, as shown in Figure 3.3. Real wages have been decreasing, by 2.9 percent in Q1 of 2022 and 3.5 percent in Q2 of 2022. Most recently, real wages (average hourly earnings) in October 2022 were 2.3 percent lower than a year earlier. The best indicator of a tight labor market is increasing real wages, so the fact that they are falling strongly suggests otherwise. But labor markets are complex, and no single number, not even real wages, gives a full picture of what is going on.63
63 Later, we provide alternative explanations, focusing on wage-price dynamics, for the decline in real wages. Again, we note the necessity of adjusting for compositional effects, but that doing so doesn’t change the basic picture.
Figure 3.3

There are other indicators that the labor market is not as tight as people in favor of large interest rate increases claim. The number of self-employed people, part-time workers, and employees with short average working hours represent disguised forms of unemployment that underestimate the labor market's slack.64 As seen in Figure 3.4, the U6 unemployment indicator, which includes total unemployed plus part-time workers and those marginally attached to the labor force, remains much higher than the headline unemployment rate.
Overall, then, the picture that emerges is of a labor market less tight than some have claimed, with considerable scope for increasing the workforce especially if wages and working conditions were improved. Further evidence will be presented in the appendix, where we look at recent movements in quits and vacancies, and in the discussion below where we show that US labor force participation is much lower than in other advanced countries. Earlier observed wage increases are more consistent with a picture of shifts in the level and structure of wages partly temporary, partly permanent than of a picture of an economy with out-of-control wage inflation. Indeed, the wage moderation already observed provides
64 Early in the pandemic, those numbers indicated a less tight labor market than one might have been led to believe on the basis of the headline unemployment rate, but since then they have recovered to more normal levels. Still, even as of the writing of this paper, the number of self-employed persons has, for instance, remained above pre-pandemic levels. As of October 2022, the number of self-employed persons across industries is over 9.9 million (BLS 2022f), slightly more than pre-pandemic levels of 9.6 million (in October 2019) (BLS 2019).
strong counterevidence to an incipient wage-price spiral. We now turn to these wage-price dynamics.
Figure 3.4

Wage-Price Dynamics
At the center of the worry about the Fed and other central banks getting “behind the curve” is that the banks may have unleashed a wage-price spiral because they didn’t act quickly enough. If workers come to expect higher inflation, they will demand higher wages, and the increase in wages will then lead firms to increase prices.
These really are empirical questions: To what extent do price increases (or expectations of price increases) get reflected in wage increases? To what extent do current price increases get reflected in expectations of price increases? The answers to these questions clearly depend on market structure, the openness of the economy, the market power of firms, and the market power of workers.
For instance, workers might like to recuperate the losses they have been experiencing due to inflation, but the evidence (cited above) is that they have little power to do so, even if in the past they were able to. In a globalized, competitive economy, if workers in traded-goods
sectors were to demand higher wages, their jobs would be in jeopardy.65 But such constraints also have an impact on non-traded sectors. In particular, in a world of competitive labor markets, the only way that a change in the price of goods consumed by individuals (such as rent or food) would affect wages in restaurants, for example, is through labor supply effects (typically small, especially in the short run) or general equilibrium demand effects.66 If wages do not increase with prices then there can’t be a wage-price spiral, no matter the extent to which wages get reflected in prices. Of course, for globally traded goods in competitive markets, US wages shouldn’t matter.
Some economists emphasize expectations in driving inflation. More recent theories and evidence have questioned this hypothesis (Rudd 2021). But in any case, to date, inflationary expectations as reflected either in market prices or in consensus forecasts have been mean-
65 The extent of globalization has been affected both by the pandemic and global geopolitics. Moves away from globalization may reduce the degree of competition in the market, affecting both labor and product markets. In the short run, increased power to raise prices may result in more inflation, as we suggested in Section 1. The evidence presented in this section strongly suggests that, overall, workers’ bargaining power has not increased. Recent research in labor markets has emphasized the importance of monopsony power, with an increase in monopsony power also driving down real wages (Bassier, Dube, and Naidu 2022; Ashenfelter et al 2022). Parsing the role that these various factors play in increasing markups, described in Section 5, remains unsettled.
66 This is another arena in which simplistic aggregative macroeconomic models may be misleading. In such models, there is no difference between real consumption wages and real product wages. But, as in the Great Depression, there can be large changes in relative prices (and even more, in the presence of shortages, in “shadow” relative prices). This distinction plays an important role in the analysis of the Great Depression (see Greenwald et al. 1988). It may help explain why movements in real wages (using the CPI, for example) may not be indicative of labor scarcity. (During the Great Depression, agricultural prices fell by some 50 to 75 percent, leading to increases in real consumption wages. But it would be a mistake to read from this that the labor market was tight!) There is one more reason that movements in real wages might not be fully reflective of the tightness of the labor market. Nominal wages and prices respond separately to labor shortages (surpluses) and goods shortages (surpluses) in an uncoordinated way. Lags in adjustments mean that real wages nominal wages divided by nominal prices may decrease even when the unemployment rate is below the natural rate. For an early exposition of these wage-price dynamics, see Solow and Stiglitz (1968).
reverting and firmly anchored,67 precisely what one would have expected if market participants shared even part of the diagnosis of inflation that we have presented here.68
The bottom line of this analysis is simple: Fears of a wage-price spiral seem greatly exaggerated. The evidence presented earlier in this section shows that nominal wage inflation is already being tempered.
Policy Responses
We’ve seen that wage increases are not at the heart of today’s inflation. In any economy going through the magnitude of structural changes that we’ve experienced, particular firms or sectors may find it difficult to hire the workers they need, and especially so if they are reluctant to raise wages or improve working conditions.69 If aggregate labor shortages do exist, the best way to address them is not by a wholesale reduction in aggregate demand, the effects of which would be pernicious, but to increase labor supply. The US employmentpopulation ratio and labor force participation rate, particularly among women, are low compared to many other advanced countries, and much could be done to increase them. Unfortunately, up-to-date comparable data are not available, but as of 2021, according to the World Bank, the employment-population ratio of 57 percent was significantly below the
67 Inflation expectations, especially over the long run, have not increased in tandem with inflation. The Federal Reserve’s 10-year Survey of Consumer Inflation Expectations has increased from the low of 1.15 percent in the depths of the pandemic to 2.37 in October 2022 still very moderate (Federal Reserve Bank of Cleveland 2022) Other series, such as that of the University of Michigan and the “Implied Expectations from Treasury Inflation Protected Securities (TIPS),” give a similar picture. For instance, the one-year inflation expectation from the University of Michigan is, naturally, higher, but still below current inflation: It increased from 2.1 percent in the depths of the pandemic to 5.4 percent in April 2022, but by September had come down to 4.7 percent (Federal Reserve Bank of St. Louis 2022a). And the 10-year expectation based on TIPS increased from 0.63 percent in the depths of the pandemic to 2.25 percent on November 18, 2022, having come down from a peak in April of 3.02 percent (Federal Reserve Bank of St. Louis 2022b)
68 At the same time, the limited increase in inflationary expectations could in part be due to a widespread belief that were inflation to increase significantly, central banks would increase interest rates, even though rational market participants should recognize that unless such increases generated a marked global slowdown, they would be unlikely on their own to do much about the underlying drivers of today’s inflation.
69 As is the case when firms have monopsony power. Note that in competitive labor markets, employers would never complain about a labor shortage, though they might complain about higher wages cutting into profits. Still, in competitive product markets, prices would adjust to restore returns to a competitive level.
nearly 63 percent level attained earlier this century.70 This was lower than the UK’s (60 percent) or New Zealand’s (67 percent). Results are similar if we look at the ratio of the working-age population who are employed.71 This suggests there is much scope for increasing the labor supply. (There are many reasons why working-age people may not be in the labor force: For example, they may be early retirees or not in the labor force because of illness, disability, or family responsibility.)
Increasing pay, improving working conditions,72 making employment more flexible (more working from home, more flexibility in hours), and providing better childcare73 are among the ways to increase labor force participation. And maintaining a tight labor market is a way to induce employers to offer workers good wages and working conditions. Slowing the economy down will have the opposite effect, reinforcing wage and income inequalities including across races, ethnicities, and genders and likely further reducing labor force participation.74
70 Based on the most recent data (World Bank [modeled ILO estimate], International Labour Organization, ILOSTAT database) available as of June 2022 (World Bank 2022) The International Labour Organization adjusts national data to a common conceptual basis to create a harmonized or standardized rate of employment that is suitable for an international comparison. These numbers vary from US BLS estimates. The BLS notes that harmonized data for comparison may not be able to adjust for all demographic and other differences.
71 Because of differences in demographic structure, the ratio of employment to working-age population, rather than employment to population, may be a better indicator. The US looks no better using these numbers. For instance, based on recent data, the US number of 71.3 percent is markedly below that of Canada, at 75.4 percent, and even more so than Australia at 77.4 percent or Japan at 78.5 percent (OECD 2022c)
72 Paid family leave has, for instance, been linked to systematically higher labor force participation and higher worker retention (Rossin-Slater 2017).
73 The inadequacy of supportive policies proved to be particularly relevant in the pandemic with school closures. Lack of adequate childcare and family support suppresses labor force participation, particularly for mothers (Duran-Franch and Regmi 2022).
74 By 2031, sustained demand and closing gender and racial gaps in education and wages could draw into the labor market 28 million workers more than the CBO’s estimate (Mason, Konczal, and Melodia 2021).
SECTION 4: THE RISE OF INFLATION HAS BEEN GLOBAL; THE UNITED STATES IS NOT AN OUTLIER
Those who blame US inflation on excess demand focus on the high level of US government fiscal spending during the pandemic. But if high spending led to inflation, then US inflation should be greater than elsewhere. However, regardless of their policies and stances over the past three years, most OECD countries experienced higher inflation than before the pandemic. The reason is straightforward: The key sources of inflation, the supply side effects such as supply chain disruptions, are international. All countries, regardless of how they addressed the pandemic and deployed fiscal stimulus, are struggling with the challenges of reopening their economies. Of course, these challenges play out in different ways. With Europe more dependent on Russian gas and with an electricity pricing system in many European countries excessively linked to the price of gas, the war in Ukraine has taken a greater toll there. A country like the US, with more dependence on cars, will show more inflation when car prices soar.
To better understand the sources of inflation, we first look at the change in inflation against a pre-pandemic baseline. According to OECD inflation data, the annualized rate of change in US inflation between pre-pandemic (between December 2017 and December 2019) and postpandemic levels (between December 2020 and June 2022) was 6.9 percentage points, only slightly higher than the average of the rest of the advanced economies (excluding Turkey), at 5.6 percentage points (OECD 2022d, authors’ calculations) (see Figure 4.1).75
75 A full comparison of different countries is obviously far more complicated. Results can vary moderately across different indices. The ways countries form their price indices vary across the board (Baker 2022b). Baker (2022b) points out that inflation was even higher for used vehicles than for new vehicles. This could play an important role in the difference in the US’s and Europe’s inflation rates, because the US includes used and new car prices in price indices while Europe includes only new car prices. Differences in consumption or output baskets also play a role. Moreover, as observed below, there are many differences in the policies pursued across countries, with other countries pursuing policies that were more effective in maintaining links between workers and their employees. Parsing the role of each policy (in particular, the higher levels of fiscal support) is virtually impossible. Finally, there are important structural differences between countries that lead to dissimilar impacts of shocks. Higher market power in the US than in many other advanced countries and therefore higher markups can give rise to a larger increase in prices in response to an increase in costs (say, from an increase in the price of oil).

Second, we want to look at core inflation (see Figure 4.2). Recall that core inflation excludes the volatile energy and food sector. Analyzing core inflation is important for comparison, especially because Europe’s level of dependency on Russian energy sources meant that the direct impact of the Russian invasion of Ukraine was higher on European energy prices (though as we noted in Section 2, energy prices do seep into core inflation). Figure 4.2 shows that the change in the US inflation rate is more pronounced, but still limited. More granular
data show that the gap between levels of core inflation in the US and other countries decreases over time as core inflation catches up rapidly in other countries.76
Figure 4.2

Given the markedly stronger growth in the US than in other advanced countries, it is not surprising that the US might experience some higher core inflation (though, as we have argued, it is not the excess of aggregate demand relative to potential output that is giving rise to the inflation), but what is remarkable is how small the difference is.77 Moreover, the most recent monthly and quarterly core inflation data from the OECD put the US Q3 rate at 6.3 percent behind the average for core inflation (7.2 percent, including Turkey).78 OECD inflation
76 Since April 2022 US core inflation has been below OECD average core inflation, with a gap of 0.9 percentage points as of August 2022 (US 6.3, OECD 7.2). US core inflation exceeded OECD core inflation from April 2020 to April 2022, with a peak gap of 1.4 percentage points in June 2021 (US 4.5, OECD 3.1). The OECD average includes Turkey, which has long had a very high inflation rate (OECD 2022a).
77 In October 2019, the IMF projected that the US’s output would grow 2.1 percent, Germany 1.2 percent, France 1.3 percent, and the UK 1.4 percent in 2020; in 2024 the projected growth rates were 1.6 percent for the US, 1.2 percent for Germany, 1,4 percent for France, and 1.5 percent for UK (IMF 2019). In the IMF’s October 2022 report, growth of output in 2020 was given as -3.4 percent in the US, 13.7 percent in Germany, -7.9 percent in France, and -9.3 percent in the UK. Growth in 2021 was 5.7 percent in the US, 2.6 percent in Germany, 6.8 percent in France, and 7.4 percent in the UK. In 2022, growth is forecasted to be 1.6 percent in the US, 1.5 percent in Germany, 2.5 percent in France, and 3.6 percent in the UK (IMF 2022). Some claim that there have been large spillovers to other countries from US-induced global goods inflation, without which the differences of inflation would be higher. But were overall excess demand the real source of inflation, we would expect higher (increased) inflation in non-traded goods, such as services. For a comparison, see Figure 4.2.
78 OECD 2022a.
forecasts expect inflation rates in several OECD countries to far exceed US inflation in Q4 of 2022.
79
There are reasons other than the difference in pandemic spending and the technical issues referred to in footnote 75 that would lead one to expect a greater increase in inflation in the US than in other advanced countries. We note four in particular.
First, the higher weight put on automobiles in US CPI (over 9 percent compared to about 3.6 percent in France for vehicle purchases,80 while normally not particularly noteworthy, becomes important when higher car prices are a major cause of inflation.
Second, in the previous section, we noted the increased labor market turmoil attributed to US pandemic policy that led to less job retention.81 This weakening of worker-employer connections would be expected to increase labor mobility, lower labor force participation, and induce sectoral shortages including in non-traded goods leading to inflation as the economy struggled to return to normal.
Third, housing costs are, as we have noted, an important component of the CPI and the magnitude of increases in housing (rents) also sets the US apart from many countries. We noted in Section 2 that large shifts in demand can give rise to higher prices, because of asymmetries of adjustments with prices going up in areas with increased demand more than offsetting decreases in areas of decreased demand. The pandemic’s impact on the structure of demand for housing, for example, such as where people want to live and how much space they would like, seems to be more pronounced in the US than in other countries. A geographically large country like the US with a mobile population makes relocating much easier and more lucrative for workers. Organizational restructuring toward online and
79 As of November 22, 2022, forecasted inflation for Q4 2022 is 5.7 percent for the US, which is below many OECD countries, including Italy (5.9 percent), Germany (7.2 percent), the United Kingdom (10.2 percent), and the average for the Euro area (6.8 percent) (OECD 2022b).
80 For the weights assigned to cars in the US CPI, see BLS 2022g. For the weights assigned to cars in the French CPI, see European Central Bank 2020
81 Interestingly, US reliance on its unemployment schemes didn’t save the government any money. Higher unemployment rates, as well as the overall weakness in preexisting social safety nets in the US, necessitated higher spending on unemployment benefits, which was closer to the average amount spent in EU countries on job retention schemes (Kammer and Arnold 2021).
remote work may accordingly induce more relocation, generating more disruption in the housing market.82
Finally, higher market concentration in the US relative to Europe (Gutiérrez and Philippon 2019) is also likely to have resulted in a greater increase in prices. We saw in Section 2 that firms and sectors with more concentration (market power) increased markups more.
The overwhelming picture that emerges from this data is consistent with this paper's central message: Globally shared supply shocks are driving inflation. It is not excessive aggregate demand in the US, as claimed by those who wish to blame the US’s inflation on “excessive spending,” including spending associated with the American Rescue Plan.83
82 There are other differences in housing markets across countries. For instance, we noted in Section 2 the unreliability of the CPI rent component as an indicator of housing costs. The rental market on which the imputations are based is thinner in the US than in a country like Germany, where it is more dominant, and accordingly may be more unreliable. By the same token, the adverse welfare effects may be greater in Germany than (on average) in the US.
83 Unfortunately, it is hard to construct really clean tests of the hypothesis that, had it not been for the ARP, inflation would have been significantly lower. The pandemic shifted demand in the US to goods, much of which were imported (observable in the data presented in Section 1), translating into goods price inflation, which affected inflation (including core inflation) in countries around the world. Still, with non-traded goods making up two-thirds or more of households’ consumption basket, one would have thought that if the driver of inflation were excessive aggregate demand it would manifest itself in an especially large increase in non-traded goods’ prices, and therefore in core inflation. This does not seem to be the case. See the discussion below.
SECTION 5: PARSING THE ROLES OF DEMAND AND SUPPLY
Because of the interdependence of all sectors and all factors on each other, it is nearly impossible to precisely pinpoint the role of any one element or set of elements in contributing to today’s inflation. This makes it difficult to have much confidence in predictions of the course of inflation within any given policy framework. For instance, an increase in the prices of goods like food, energy, utilities, capital goods, and subsequently transportation, affects the prices of a wide range of services. Moreover, a lack of supply in one sector gets reflected in an increase in demand in other sectors.84 There is a shift in demand, which that sector sees as an increase in demand. But, as we have noted, it would be wrong to read this as evidence of an excess of aggregate demand. 85
The critical question is whether aggregate demand is the problem or whether it is sectoral shifts and supply side problems. The previous section analyzed what might be viewed as a natural experiment: The US injected more money into the economy. Did it result in more inflation? Not to the extent one would expect, at the time one would expect, or in the places one would expect if that injection were the source of inflation.
If the American Rescue Plan were the source of the problem, one would expect inflationary pressures to show up most in non-traded goods the sectors special to the US, as we noted in Section 3. This is not the case, except for rents, and we have discussed the unique features of that market. Core goods, which are mostly traded, contributed more to inflation in 2021 than did core services, excluding rents, which are mostly non-traded.86 Figure 5.1 illustrates this.
84 As we noted in the case of rents, with fully downward flexible nominal wages and prices, demand shifts would have only limited inflationary effects because upward pressure in sectors gaining demand would be offset by downward pressures in sectors losing demand. But with nominal rigidities and capacity constraints, price increases predominate, which is part of the reason that periods of high disturbance such as now are inflationary.
85 Therefore studies such as the one done by the Federal Reserve Bank of San Francisco (FRBSF 2022) attributing about a third of inflation to demand-side effects must be taken with caution. What these studies see as a price increase from an increase in demand may have its origin in a supply perturbation.
86 The tradability indexes of CPI goods and services by the BLS confirm that the number of items classified as services including rents are overwhelmingly non-traded, while core goods are overwhelmingly traded (Johnson 2017).

Since the money from the pandemic programs went overwhelmingly to low- and lowermiddle-income individuals, one would expect to see inflation especially high in goods consumed by these households and in the rents they pay. To the contrary, we see that housing costs (which make up a large part of CPI, and the increase in which has been a major source of inflation) are being driven just as much by the shifts resulting from working from home, a phenomenon more relevant to workers with higher levels of education and those with higher median earnings87 (Kmetz, Mondragon, and Wieland 2022). Food costs, which tend to make up a larger portion of the budget for low-income households, point to a similar pattern. US food inflation is high (13 percent in Q3 2022), but has been closely tracking the OECD average since the beginning of the pandemic, which suggests it is not driven by US policies.88
More generally, it’s hard to see how the ARP could have been the critical source of inflation when, as we saw in Section 1, real consumption stayed below trend in the initial stages of inflation and has largely remained so.
87 A BLS study of OES survey data, as well as a survey under the US Department of Labor’s Employment and Training Administration, shows that 79.3 percent of participants with less than a high-school diploma were unable to work remotely, whereas only 26.2 percent of respondents with bachelor’s degrees and higher were unable to work remotely (Dey et al. 2020). The median weekly earnings increases with education. 88 OECD 2022a.
Would the US have had almost the same level of inflation without the ARP? Global energy and food prices would still be elevated. There is no reason to believe that firms with market power would not have taken advantage of the situation, raising prices by more than their costs increased;89 nor is there reason to believe that the supply chain and other supply side problems associated with the pandemic, like the baby formula shortage, would not have occurred.
The flip side of this argument is that a demand reduction will have a limited effect on inflation. To be sure, with a sufficiently weak US economy, price increases will be muted, and might even come down; but the magnitude of the decline in US GDP and the resulting increase in unemployment required to bring down the prices of globally traded goods, or even to make a large enough difference in the rate of inflation, is likely to be substantial.
89 As we showed in Section 2.
SECTION 6: IMPLICATIONS OF AGGRESSIVE INTEREST RATE HIKES
Economists focus on trade-offs: the benefits of tighter monetary policy in terms of reduced inflation, and the costs in terms of lower real output and higher unemployment. The costs of lower output and higher unemployment are real and tangible. In Federal Reserve Chair Jerome Powell’s own words, the “unfortunate costs of reducing inflation” bring “some pain to households and businesses” (Board of Governors of the Federal Reserve 2022d). And, though Powell didn’t mention it, those costs are not spread evenly. They are borne heavily by lowincome individuals and marginalized groups, as we show in Figure 6.1.
If our analysis is correct, however, the benefits will prove elusive. Inflation will be reduced only a little from what it otherwise would have been unless we squeeze the economy so much that unemployment becomes much higher than it is today. The Federal Reserve will not be able to do much to contain the increases in prices coming from international markets,90 lack of investment in supply chains, COVID-19 disruptions, climate change, the war in Ukraine, or the exercise of market power.
Moreover, some (and perhaps many) of the factors causing today’s inflation will be resolved over time not because of the Fed’s action, but despite it. And if that is the case, we will have paid a high and unnecessary price.
Why Interest Rate Increases May Be Counterproductive
Raising interest rates will do little to contain inflation but could make matters worse. We argued in Section 2 that supply side shortages are the source of much of the inflation. Tighter monetary policy makes it more difficult for firms to make the investments that might alleviate these shortages.
There is another reason interest rate increases may be inflationary that is related to the longstanding theory of Phelps and Winter (1970) about imperfect competition discussed in Section 2. Even with the limited market power conferred by search costs, an increase in
90 Apart from limited effects that might arise from currency appreciation, which are likely to be at most temporary as other countries match our rates, the reversal of the appreciation will itself be inflationary.
interest rates induces firms to raise prices as they prioritize current profits over the loss of future profits that happen when customers seek and find a different provider (Greenwald and Stiglitz 2003).
Moreover, there is evidence (Dias and Duarte 2019) that increased interest rates do get passed on to consumers in the form of higher rents directly contributing to higher inflation. There are good reasons for this. In the short run, higher interest rates cause dwellers to move between rented and owner-occupied housing, which leads to higher rents the basis of CPI calculations. Moreover, landlords may try to pass along their increased “capital costs” to renters.91 In the long run, too, higher costs of capital will reduce supply, again leading to higher rents.92
Aggressive
Interest Rate Hikes Will Perpetuate Existing Inequalities and Reverse the Gains from a Strong Recovery
Suppressing aggregate demand translated into reduced economic activity and higher unemployment is the primary mechanism that interest rate hikes rely on to reduce inflation. To the extent that investment and consumption are interest-sensitive, increased interest rates reduce investment (and thereby growth) and consumption.93 Tighter monetary policy also may get reflected in less availability of credit, thereby also reducing consumption and investment.
91 As in the standard markup models. Because of search costs and product differentiation, rental markets are far from perfectly competitive; as we’ve noted, in standard imperfectly competitive markets, firms (here, landlords) set prices as a markup over costs. Even in highly competitive markets, behavioral economics suggests that landlords may in the short run pass on costs; in the intermediate term, if the resulting prices are above marketclearing levels, there is a process of gradual price adjustment.
92 An increase in the interest rate may increase the cost of capital more than and faster than it brings down the price of housing (again, partly because of the dynamics of price adjustment, which also may exhibit downward price sluggishness, if not rigidity, as noted above). There are other more complex channels through which higher interest rates lead to higher rents. Higher interest rates lead to less construction, and the reduced supply of housing in the future implies rents in the future will increase. But if landlords expect rents to be increasing, landlords who sign long-term leases will insist on higher rents now; it may even benefit them to leave their property temporarily vacant, in anticipation of getting a higher rent in the future.
93 The effect on consumption is unsettled. Target savers reduce savings when interest rates increase. Apart from housing and the purchase of cars, aggregate demand may not be very interest-elastic. Financial innovation has had complex effects on the relationships that firm and consumer activities have with interest rate (Dynan, Elmendorf, and Sichel 2006).
The effects of interest rate hikes will travel much faster through some parts of the economy, while others will witness a considerable lag. For example, new home construction starts fell quickly as interest rates increased. Contrary to some claims, tightening monetary policy does distort the economy.94
Cutting the recovery short right now through excessive tightening of monetary policy will have a particularly large effect on workers who are marginalized95 and have lower levels of education96 (disproportionately Black and brown).97 These workers are the last to be hired in an economic recovery, are in less stable and more interest-sensitive occupations, and work under precarious conditions with less than adequate compensation.
The unemployment rate for Black Americans is nearly double that of white Americans (see Figure 6.1), so if we were to target a 5 percent average unemployment rate, implicitly the “targeted” rate of Black unemployment would be twice as high, about 10 percent. Similarly, the “targeted” rate of Black male unemployment would be almost four times as high, well in excess of 15 percent. Not surprisingly, this will have long-lasting effects (Williams 2020).98
94 New home constructions fell while employment in construction continued to grow. Eventually, of course, employment in the sector will decrease. This illustrates the long and variable lags of monetary policy.
95 BLS 2022f.
96 Historically, periods of growth have resulted in reductions in unemployment levels especially for those with low levels of educational attainment (BLS 2022f).
97 Black and Latinx workers are disproportionately represented in occupations that are more vulnerable to economic downturns and thus experience disproportionate job losses during downturns (Hoynes, Miller, and Schaller 2012).
98 This paper shows that following the Great Recession, “[i]t took more than 10 years for Black workers’ incomes to return to their pre-recession levels.”

Global Consequences and Economic Fragilities
The Fed’s interest rate increases are a different form of “beggar-thy-neighbor” policy (a policy enacted by one country that results in a loss for another) than the one that played out in the Great Depression, because this time it involves inflation. Higher interest rates lead to currency appreciation, which lowers import prices and reduces inflation in the US, but simultaneously increases prices and inflation abroad.
Even worse, since other countries will likely match US rate hikes to mitigate these exchange rate effects,99 there will be a global slowdown, dampening domestic exports and further weakening aggregate demand.
And with so many firms (including in the US) and countries around the world overindebted not a surprise given the long period of very low interest rates the consequences may be devastating. The dramatic changes in food and energy prices and foreign exchange rates (because of the asynchronous setting of interest rates) will only worsen matters. This could lead to deep and possibly prolonged downturns in some countries. Risks are particularly
99 More than half a dozen central banks, including in the UK, Norway, and Indonesia, have already, as of September 2022, followed the US Federal Reserve’s suit and increased their interest rates (Canepa and Schneider 2022).
heightened because of the growth of nontransparent derivatives and other hidden maturity and foreign-exchange mismatches evidenced dramatically by the near meltdown of the UK’s pension system, which was saved only by strong intervention by the Bank of England.
In the 1997 East Asia crisis, when the IMF responded with the conventional wisdom of raising interest rates, Stiglitz warned that it could lead to massive bankruptcies and a deep downturn, with capital fleeing the region. This would undermine one of the primary purposes of raising interest rates, which is to support the exchange rate. The IMF took the view that if that happened, the situation could be easily remedied with a simple reversal. However, one doesn’t “unbankrupt” firms simply by lowering interest rates. What was predicted happened, with the region experiencing a deep downturn made worse by the unnecessarily high interest rates that the IMF had demanded. There were significant hysteresis effects, with long-lasting consequences of mistaken policies. The same applies to the current situation.
The main reason that things might not turn out so badly is that inflation in the US will be tamed on its own for which, as we have suggested, there is already increasing evidence simply as the supply side effects giving rise to inflation are tamed and reversed.
SECTION 7: THE NEED FOR A MORE SIGNIFICANT ROLE FOR FISCAL AND OTHER POLICIES
A series of supply side problems (including those arising from broken supply chains and sectoral demand shifts) are the underlying driver of inflation today, and the best policies to address today's inflation are those that directly address these supply side problems, with actions that work quickly. Fiscal policies100 and other government interventions, tailored more directly to reduce the drivers of today’s inflation, are likely to be more effective and less costly than raising interest rates. and other government interventions, tailored more directly to reduce the drivers of today’s inflation.101 Advances in macroeconomics over the past two decades have provided a strong rationale for such government interventions beyond the obvious one that monetary policy may be ineffective, distortionary, or not timely.102
A comprehensive list of what measures might or should be undertaken is beyond the scope of this paper; a few examples include expanding the supply of energy (such as the measures included in the Inflation Reduction Act [IRA]), curtailing market power (again, as the IRA did with pharmaceuticals, and with other efforts being pursued by the Federal Trade Commission), and increasing the production of goods currently in short supply (as the recently passed CHIPS and Science Act does).103 To the extent that there is a real labor shortage, the provision of childcare and other measures discussed earlier in this paper would increase labor force participation and the supply of labor.104
There are many other ways in which fiscal and other policies might help combat today’s inflation. It is conceivable that significant increases in the supply of renewable energy or
100 It should be clear that the concern is not aggregate fiscal spending but specific expenditures (and other regulatory measures). If one were worried that the economy was already nearing or exceeding its potential output, increased expenditures addressing supply constraints might (at least in the short run) lead to demandpull inflation; if so, these increased expenditures would have to be accompanied either by increased taxes or reduced expenditures elsewhere.
101 Inflation in Europe has been particularly affected by electricity prices. A better regulatory regime would have dampened these price increases.
102 Earlier, we discussed the fact that firms do not adequately consider the large, pervasive macroeconomic externalities associated with their decisions. These may be particularly strong in a period of large supply interruptions, such as this one.
103 There are a variety of policies that might increase housing supply in markets in which rents are rising rapidly.
104 Other measures, such as more immigration, would also help.
fertilizer, for example, could be achieved in a relatively short time span were the Defense Production Act (DPA) invoked.105 (The argument for doing so parallels that for government intervention to increase the production of vaccines and other COVID-19 products in the early days of the pandemic, when the market exhibited shortages of critical products and the DPA was invoked.) And even more so if such measures were accompanied by other ingredients of successful industrial policies, such as low-interest loans and price guarantees.
When price increases are related to the exercise of market power, tax policy may be an important tool in curbing inflation because it is more targeted than the blunt instruments of monetary policy. As the Independent Commission for the Reform of International Corporate Taxation (ICRICT) has urged, well-designed corporate tax structures that penalize the exercise of market power can provide market-based incentives to limit price increases (ICRICT 2022).106 Right now, a temporary windfall profits tax on the super profits reaped by energy companies, at the expense of ordinary citizens, would raise substantial funds to address the inequities and distortions arising from today’s inflation and enable investments that would alleviate some of the supply shortages. It could be designed even to encourage investments that rapidly expand the supply of energy, particularly in green energy, by not subjecting increments in such expenditures to the windfall profits tax.
Some of these steps have immediate effects, but others will take longer. Releasing oil from the oil reserves or food from stockpiles (when they exist) has an immediate effect; changing agricultural policies from restricting production as Europe and the US have been doing for more than half a century to expanding production would have some effect within one growing season and a more significant impact in several growing seasons.
105 For example, we noted earlier the shortage of microchips for cars. A strong argument could be made that an intervention to reallocate chips that were going elsewhere (hypothetically, to smartphones) would be socially beneficial the inconvenience of an older smartphone pales in comparison to the benefits of restoring car production to normal levels more quickly. Because of strong macroeconomic externalities, market responses may be far from socially optimal.
106 Writing down simple models in which, with full observability of relevant variables, one can design taxes with the desired effects is easier than actually implementing such policies. Still, there are simple, implementable tax policies that discourage excessive increases in prices. Firms have to report costs and revenues; one can therefore calculate markups over average costs, and tax authorities have such data for past years. Increasing the windfall profits tax rate on firms with large windfall profits (for the period of the war in Europe, for instance) disincentivizes price increases and encourages investment.
CONCLUDING REMARKS: THE NEED FOR A MEASURED MONETARY RESPONSE
The current political environment, unfortunately, circumscribes the fiscal and other measures we are likely to take though the previous discussion notes that some significant measures have already been adopted.
We are in a predicament similar to the one we faced in 2008, in which the optimal policy response would have been to implement far stronger fiscal measures. Given the limitations on fiscal policy, monetary policy had to step in. The increase in inequality was an unintended and unpleasant side effect, but leaving unemployment high would have been worse. Here, though, there needs to be a measured monetary response.107
Of the large downside risks discussed in Section 6 associated with raising interest rates too quickly and too far, which are incommensurate with the limited gains in reducing inflation, the particular concern is the uncertainty about the length of the lags in monetary policy heightened by the unprecedented situation of today’s global economy. Indeed, a longstanding criticism of monetary policy is that it operates with long and variable lags up to a year and a half giving rise to the concern that a monetary tightening has its full effect just when it is not needed; monetary policy is then counterproductive, even with the more normal demand-driven inflation, causing a recession or a slowdown just when the economy requires stimulation.
Both because of the ineffectiveness of monetary policy when inflation’s origins are largely sectoral (as now), and the long and variable lags, the danger is that since inflation will not come down quickly even as central banks raise interest rates, central bankers wedded to the wrong economic model will push too much. This is like medieval bloodletters who kept doing more of the same when their therapy failed until the patient either had a miraculous recovery (for which the bloodletters took credit) or died (which was more likely). Here, the risk is that, given the uncertainties about the magnitude of the effects of interest rates on
107 In the aftermath of the 2008 crisis, monetary authorities, confronting the limits of conventional monetary policy as short-term interests hit the zero lower bound, were creative in innovating new policies, such as quantitative easing. Here, too, monetary policy could be creative, for example in directing credit to sectors in which supply shortages are evident. But while such “directed credit” played an important role in the East Asia miracle, it has been shunned in recent decades by most monetary authorities.
inflation and given the long and variable lags with which the effects of monetary policy are felt, the ramifications of tightening will be realized just as the economy needs additional stimulus.
The Challenges of Policy
Given the unexpected shocks of a more persistent COVID-19 with various mutations and the war in Ukraine, and given the startling (at least to strong-market advocates), deep lack of resiliency of the economy, it should not be a surprise that inflation has been less transitory than had originally been hoped.
We should be careful about interpreting successes and failures, both in prediction and in policy. Being correct in one’s forecast for the wrong reason should earn no kudos.108
Understanding where one’s forecast went wrong is essential for designing appropriate policies.
Those who thought the bout of inflation was transitory were obviously wrong. But the reason, as this paper has shown, has little to do with the explanations given by most of the inflation hawks: The underlying problem is not the persistence of excessive aggregate demand, as we’ve seen.
Nor does the fact that inflation proved to be so persistent mean that the focus on supply side effects was wrong. This paper has shown that a closer look at the data reveals overwhelmingly that today’s inflation is related to sectoral perturbations and not to an excess of aggregate demand. Weber et al. (2022) approach the problem from the other side, focusing on the extent to which today’s inflation can be explained by movements in particular sectoral prices. Their conclusions are much in accord with ours: They find that, “[I]n times of overlapping emergencies, economic stabilization needs to go beyond monetary policy and requires institutions and policies that can target these systemically significant sectors” (Weber et al. 2022).
108 In particular, contrary to the prognostications of some, the US exchange rate has not collapsed (which would have given rise to higher prices of traded goods) the US exchange rate has strengthened.
Those who thought that inflation would be more transitory than proved to be the case were simply excessively optimistic they had more faith in the resilience of the market economy than they should have had. Forty years of ideology grounded in a belief in the strength of the market economy cannot be shaken overnight.
Moreover, we’ve seen that the persistence of inflation has much to do with factors that no one could have reasonably predicted. No one can be blamed for not guessing how long COVID-19 would linger, with its new, more contagious variants; or the persistence of the flawed Chinese response, with all of its implications for global supply; or the long-lasting consequences of Russia’s invasion of Ukraine (the invasion itself, the effectiveness of Ukraine’s response, the persistence of Russia); or OPEC’s decisions to restrict the supply of oil. What is clear, though, is that these unpredictable events have had large and persistent sectoral effects, contributing to inflation.
If inflation does fall, it is essential not to give credit where credit is not due. We noted earlier that forces are at play to alleviate many of the sectoral inflationary pressures caused by the war and pandemic. As the increase in energy and food prices tempers and as bottlenecks get resolved, inflation should come down on its own.
109 Indeed, we have described forces actually lowering some of the prices that gave rise to inflation, setting off a disinflationary process. If inflation is tamed as a result, we cannot attribute success in fighting inflation to the resolve of the Fed.
It is equally important to assess blame where blame is deserved: Excessive tightening of monetary policy can and likely will induce a recession. A recession is not the inevitable aftermath of the pandemic or the war. If it occurs, it is mainly of the Fed’s making.
Toward a Judicious Monetary Policy in a World of
Uncertainty
All policy is conducted in the presence of high levels of uncertainty. This is true even in regular times, but the current period is far from ordinary. All policy is, or should be, based on a balanced assessment of the risks of different actions and the multiplicity of costs and
109 Or at least, that would be the case in the absence of a wage-price spiral which does not seem in evidence, as we noted in Section 3 or in the absence of another supply shock.
benefits borne by various segments of society. And policies should not be driven by conventional wisdom or models fitted to past data with markedly different circumstances.
Raising interest rates from their low levels of the past 14 years is likely good. Zero is not the scarcity value of capital. Moreover, such low interest rates distort capital markets,110 induce innovation to save labor,111 and enhance wealth inequality.112 Indeed, tight labor markets not only lead to higher wages alleviating inequality, one of the pressing problems of our times and the inclusion of marginalized groups, but also induce productivity-enhancing innovations.113 But beyond that point, as we have noted, further increases may be counterproductive and impose a high cost on our economy and our society.
This is not the occasion to assess more broadly the appropriate framework of monetary policy or any quantitative targets. Suffice it to say it may be desirable, even necessary, that the 2 percent target for inflation be at least temporarily revised. We need to remember that that number was pulled out of thin air with little or no theoretical or empirical justification.114
Elsewhere, it has been shown that under plausible assumptions, uncertainty about the value of the natural rate of unemployment or the NAIRU (and there is obviously uncertainty about it) should lead to targeting an unemployment rate that is below the expected value of the
110 With, for instance, risk premium becoming unreasonably small, in the process of investors “searching for yield.”
111 In the theory of induced (or directed) innovation, the extent of labor-saving (vs. capital- or resource-saving) innovation depends on relative factor prices; low interest rates (costs of capital) induce more labor-saving innovation. See Stiglitz and Greenwald (2014). On the other hand, the “shadow price” of labor may, in tight labor markets, considerably exceed market wages, inducing more productivity enhancing innovations.
112 For a survey of these wealth effects, see Colciago, Samarina, and de Haan (2019). For a theoretical discussion, see Stiglitz (2015) and (2016).
113 And so higher wages need not simply lead to a wage-price spiral.
114 See, for instance, Stiglitz et al. (2020). Indeed, especially with downward nominal rigidities, there is a high cost to having too low an inflation target, especially in periods in which there is large structural adjustment, since it inhibits the ability to adjust relative wages and prices (see Akerlof and Dickens 2007). Guerrieri et al. (2021) go further, explaining that, “In fact, there is no simple, possibly re-weighted, inflation index that can be used as the optimal target. When labor is mobile between sectors, monetary easing can have the additional benefit of inducing faster reallocation, by producing wage increases in the expanding sector.” As the discussion of Section 3 made clear, the nature of the trade-offs, say between unemployment and inflation, are at best contentious, with more recent research suggesting that the costs of tighter labor markets in terms of inflation are lower than had previously been thought to be the case, and that the benefits in terms of inclusion and induced labor productivity may be greater; if so, policy should be directed at creating tighter labor markets.
NAIRU that is, uncertainty should induce a more expansive monetary policy than would otherwise be the case.115
This paper has argued that the overwhelming sources of today’s inflation are on the supply side, and appropriate responses need to consider this reality. In these circumstances, short of causing a major downturn, monetary policy is unlikely, on its own, to moderate inflation significantly. It is simply too blunt an instrument. At best, raising interest rates dampens inflationary pressures by killing the economy it is evident that if we increase unemployment enough, inflationary pressures in the non-traded sector will be brought in tow. But even then, the economy may confront inflationary pressures from abroad. Once one takes the kind of sectoral approach in analyzing the US economy, were the current sources of inflationary pressures to continue, bringing aggregate inflation down would require massive deflation in the non-traded sector.116 This translates into very high unemployment, particularly costly for low-income and marginalized communities.
Whatever we do, inflation may or may not last longer than we hope. There are scenarios all around. The war in Ukraine could end quickly, bringing down the energy and food prices that have surged with it. The chip shortage is already on the way to being resolved. More favorable politics might lead to policies that strengthen the labor force. But things may not turn out so well. Policy should be directed at handling all contingencies, addressing supply shortages as they appear and protecting the most vulnerable from the effects of inflation that may be beyond our control.117
115 Stiglitz (forthcoming) shows that, “If the expectations augmented Phillips curve is sufficiently close to linear, for sufficiently small δ (high discount rates) and [ratio of the marginal social cost of inflation to that of unemployment] it is desirable to target an unemployment rate below the NAIRU if we are much more concerned with shortfalls in unemployment than we are with overemployment, the argument for having an even higher target (i.e., with a lower level of unemployment) is strengthened.” The relatively flat Phillips curve implies that the risk of significant increases in inflation from too low an unemployment rate are limited, while we have explained how higher unemployment may have a high marginal social cost, especially because of its adverse effects on marginalized groups.
116 Especially difficult given how traded-goods prices seep into those in the non-traded sector, as we’ve seen.
117 This paper focuses on the issue of inflation. There are also important policy issues when it comes to protecting low- and middle-income individuals and small businesses. For instance, Europe has attempted to limit gas and electricity price increases; more fundamental reforms in its regulatory regime would almost surely be desirable. Inflation compensation payments, financed partly by a windfall profits tax, can be an essential part of a package of protective measures
Not only do the policy solutions we describe in this paper do much to address the inflation we are confronting, they deliver significant benefits to society should inflation be tamed on its own. If inflation comes down, more likely than not, it is because of the resolution over time of some of the supply side problems. Inducing a potentially unnecessary, large economic downturn and accompanying increase in unemployment is not what the country needs. It only adds to the suffering of people who are already struggling. Together, these concerns strengthen the argument for a measured monetary response to inflation combined with fiscal policy and other more targeted measures.
The good news is that all the recent indicators point to inflation moderating on its own. There is now increasing evidence that supply side problems are at last being resolved. Key prices like energy and food show strong mean reversion they’re returning to more normal levels and that will be disinflationary. 118 Hopefully, this will induce the Fed to exercise even more caution in its policy of monetary tightening.
118 Of course, even if we can have some confidence that relative energy and food prices will be lower than they are today in the long run, we can’t be sure about prices in the short run. As we have repeatedly noted, no one knows how long the war in Ukraine will last; how devastating it will be; how quick, strong, and effective supply side policies in the US and Europe will be; or how effective OPEC will be in reducing the supply of oil and gas.
Appendix to Section 1: Analyzing Potential Output
There are two key ingredients in analyzing potential output: capital stock and labor supply. Both were affected by the pandemic but not sufficiently to generate a significant disparity between aggregate demand and potential aggregate supply with the trajectory of some of the inputs that go into the construction of potential GDP. Capital input measured by the net stock of fixed assets (nonresidential private) is slightly below pre-pandemic trends in 2021 and into 2022 (Figure A1).
Another indicator that the economy was well below potential is that capacity utilization did not reach the pre-pandemic level until June 2021, after the initial increases in inflation, and by October 2022 was just reaching levels attained in 2015, when inflation was very muted.119
Figure A1

Potential labor supply is more complex. Estimates of the number of people of working age had largely stagnated in the years before the pandemic (Figure A2), and in spite of the pandemic and the restrictions on immigration, are now slightly higher than before the pandemic.
119 Board of Governors of the Federal Reserve System 2022.
Figure A2

On the other hand, labor force participation is down, and there has been considerable discussion about whether this is temporary or longer-lasting (as we observed in Sections 1 and 3), and whether increased hiring with better wages and working conditions would result in higher labor force participation. The answers to these questions, discussed in Section 3, affect estimates of potential output, though as we have noted, not enough to alter our analysis.120
Unemployment statistics reflect those people who are able and willing to work searching for jobs and not finding them. The fact that the economy had large excess capacity and large numbers of unemployed workers provides a compelling case that aggregate demand was lower than potential output. What constrained output was aggregate demand and/or sectoral supply constraints.
120 The CBO revised its estimates repeatedly over the course of the pandemic. The numbers we use post-pandemic are based on its latest calculations. The central issue was the effect of the pandemic on labor supply. In the peak of the pandemic, the CBO thought there would be a sufficient reduction in labor force participation to significantly shift down potential output. It subsequently adjusted its potential output estimates, saying that the “…CBO projects that the effects of social distancing on economic activity in 2021 will be smaller than the effects it projected in February, reflecting a more rapid return to normalcy” (CBO 2022). Even using the CBO’s more pessimistic estimates of potential output, one can’t explain observed inflation by looking only at the aggregates: The actual GDP was still under the potential GDP estimated in July 2021.
Appendix A to Section 2: Explaining the Lack of Resilience
In our concluding remarks, we explained why many analysts were excessively optimistic that inflation would be temporary: They thought that the supply shortages would be more temporary than proved to be the case. The economy exhibited a remarkable lack of resilience. We should have been more attentive to the failures that became evident during the pandemic itself, for example the inability to produce even simple products like masks and protective gear let alone more complicated products like tests and ventilators.
There were many factors contributing to the lack of resilience. The just-in-time inventory system (keeping inventories at a minimum) has distinct advantages in normal times. But with supply chain interruptions, stock-outs became frequent, which led to production interruptions. Moreover, restarting production when there are multiple stock-outs can be problematic in a world in which the production of each good requires multiple inputs: Good A requires more input of good B to restart production; but good B requires C; but C requires more A. Interdependencies can result in production traps, which may take a long time to work themselves out.
121
There was also underinvestment in many parts of the economy, including underinvestment in resilience. Part of resilience is having the capacity to meet shifts and surges in demand. In striving to cut costs, firms did everything they could to ensure that they did not have any excess capacity.
Lack of supply chain diversification, as firms pursued the cheapest sources of supply, meant the economy was more vulnerable to supply side interruptions, such as might occur with a lockdown in that source of supply.
Moreover, the increasing market concentration we had been warned about (Gutiérrez and Philippon 2019; Stiglitz 2019), the consequences of which we describe more fully below, not only gave firms the power to take advantage of these disruptions by raising prices and markups; it also made the economy less resilient simply because of a lack of adequate diversification. This became evident in the baby formula shortage.
121 Again, something that Stiglitz (2020) had warned about, but was totally missed by those focusing (incorrectly, as we have seen) on only the macroeconomics.
We could push the analysis back further. Why had the economy developed such a lack of resilience? The answer is simple: The shortsightedness and poor risk management that became so clear in the run-up to the 2008 financial crisis marked not only the financial sector but vast swaths of the economy.122 A simple example illustrates what had happened. We built cars without spare tires all well and good as long as a driver didn’t need one. It saved pennies in the short run, but these savings were overwhelmed by costs when a driver had a flat tire miles away from the nearest gas station.123
There is one more reason for the observed market dysfunctions. Companies in the automobile and smartphone sectors, for instance, failed to take into account the full societal consequences of their decisions. Shortages of goods in one sector have consequences for others. These are referred to as macroeconomic externalities; they are pervasive, and can have large consequences (Jeanne and Korinek 2018) 124
Appendix B to Section 2: Case Studies
There are many examples of critical supply shortages. In this appendix, we describe in greater detail what happened in three critical cases.
Case Study: Microchips
We have already described the large role that new and used automobiles plus motor parts played in overall CPI inflation in 2021. It wasn’t that we had forgotten how to make cars during the pandemic, or that production facilities had suddenly disappeared. Key to the car shortage was the lack of microchips, and the lack of microchips was because of a simple market failure: By and large, car manufacturers (except Tesla) had canceled chip orders at the onset of the pandemic, so production shifted elsewhere (e.g., to making smartphone chips).
122 Economists would put it that firms had not adequately priced risk.
123 Similarly, Stiglitz (2022) noted the lack of spare capacity extra beds in hospitals, which played out disastrously in the pandemic.
124 Korinek and Stiglitz (2022) have discussed the implications of these macroeconomic externalities for inflation more broadly, and Stiglitz and Guzman (2021) have discussed their implications for responding to the pandemic. These externalities are the macroeconomic manifestation of a broad class of externalities uncovered by Greenwald et al. (1988).
There is no definitive explanation for why it took so long to alleviate the chip shortage. Either repurposing chip production for cars or readapting cars’ software for the kind of chips that might be available would in any case take time. But longer-term contracts with the new users may also have impeded the redirection of production. In our market economy, even if the social return to reducing the supply constraint in automobiles is enormous, especially when compared to asking households to keep old smartphones for a little longer, such diversions of production may be limited.125
There was another reason for the chip shortage. Rather than investing in their own fabrication plants that would have enhanced resiliency, semiconductor firms preferred to outsource manufacturing to Asia (Williams 2022). There were short-term benefits, of course: higher short-term returns and profits. The top five firms in the semiconductor industry also chose to spend $247 billion in share buybacks between 2011 and 2021 rather than invest in capacity and innovation.126
Case Study: Fossil Fuels
The disregard of relevant risks is evident too in the excessive reliance on fossil fuels, and the slow pace of the shift to renewables. A well-diversified renewable energy system, supplemented with using existing energy generator plants as buffers, would provide a reliable and low-cost source of energy for the short to intermediate term, and would have reduced the impact of the increase in oil and gas prices as a result of the war in Ukraine.
The risks of renewables are far lower than those of relying on the whims of the authoritarian countries central to the fossil fuel system. This has been evident for a long time.127 Yet market
125 These problems are closely related to the macroeconomic externalities discussed earlier.
126 These companies included Intel, IBM, Qualcomm, Texas Instruments, and Broadcom (Lazonick 2021). It is ironic that now the government will inject some $50 billion into the industry because it claims it lacks the financial wherewithal to make the necessary investments (Swanson 2022).
127 In Making Globalization Work (2006), Stiglitz warned of the risks of Germany becoming excessively dependent on Russian gas.
producers have been slow to move, and governments have been slow to encourage a faster pace of transition toward renewables. 128
One might have expected a more rapid supply response from those involved in fracking in the US and perhaps elsewhere. The lack of response may be a result of large losses from overexpansion in the previous boom; a price guarantee for a relatively short period (four years) might have brought down prices rapidly, with at most limited effects on atmospheric greenhouse gas concentrations (because such fields can be designed to have a short life).
Case Study: Shipping
We have seen a similar lack of attention to relevant risks in other industries (Palladino and Estevez 2022). Ports worldwide, including in the United States, struggled to match the massive increase in the pace of the development and use of mega-ships by container shipping companies. While deploying mega-ships helped container companies to defray labor and fuel costs through economies of scale, handling costs for the rest of the transport chain, including port authorities and railroads, increased along with the size of the ships (International Transport Forum 2015). Because the container companies were making these decisions at a fast pace and without adequately consulting port authorities, efficiency decreased as port authorities, most of which were public and quasi-public, struggled to upgrade infrastructure to accommodate these larger vessels (Chua et al. 2018). In addition, the rise of mega-ships also led to increased market concentration, limited choices, and poor supply chain resiliency; three alliances of ocean shippers carry 80 percent of the world’s cargo (Dayen and Mabud 2022; International Transport Forum 2018).
Appendix to Part 3
The Drama of the Pandemic in the US Labor Market
In the United States, some 23 million people joined the ranks of the unemployed at the worst of the pandemic economic downturn, and the labor market was thrown into turmoil. The
128 It has not been for lack of finance: The electric utility sector has distributed over 86 percent of its net earnings (i.e., over $250 billion) to shareholders over the past decade (Lusiani 2022)
contrasts in this context between the US and other countries is marked, as shown by OECD data. The US unemployment rate peaked at 14.7 percent, the highest in BLS recorded data since January 1948. The UK peaked at 5.1 percent, Germany at 3.9 percent, and South Korea at 5.2 percent.129 All of these countries had pre-pandemic unemployment rates between 3.3 percent and 4 percent. This set the stage for an unprecedented level of labor movement in the US, and makes the challenge of interpreting what is happening in the US all the more difficult. The US was distinctive both in the size of its recovery packages and in their design, doing a poorer job of retaining the bonds between workers and their employers.
The pandemic affected both the demand and supply sides of the labor market. In the aftermath of the pandemic, the labor supply was lower than had been expected before the pandemic, most obviously because 457,000 workers died from COVID-19. Increased risk of death, COVID complications, long COVID, shutdowns, and business closures and downsizing led to the early retirements of around 3 million workers (Storm 2022). Immigration to the US also remained below 2019 pre-pandemic levels in 2021 (Migration Policy Institute 2022),130 both because the government increased barriers to immigration (from their already high levels) and because poor COVID-19 management, especially in the early stretch of the pandemic, made the US less appealing as a destination.
131
The key issue, referred to earlier, is: Did COVID-19 unleash long-term changes in attitudes toward work, or were the changes temporary and likely to be reversed as the economy slowly normalized?
132 The recent increase in labor force participation (including retirees returning to work) suggests that much of what has happened is temporary.133
129 The difference is probably mostly accounted for by poor policy design; other countries made a big effort to keep workers attached to their firms.
130 Migration Policy Institute tabulations of US Department of Homeland Security, Office of Immigration Statistics, Yearbook of Immigration Statistics (various years). Available at www.dhs.gov/files/statistics/publications/yearbook.shtm.
131 While labor shortages contribute to supply constraints, this relationship also works the other way around, where supply constraints lead to unwillingness to participate in the labor market. See Solow and Stiglitz (1968). The alleviation of supply shortages may itself have a positive impact on labor supply.
132 Some have suggested too that the income/wealth effects associated with increased wealth and cash balances (described in Section 1) may have led some to reduce their labor supply. Most of these effects, if significant, will be temporary too.
133 The number of persons not in the labor force was down in October 2022 from one year ago in the latest BLS data (BLS 2022f). For retirees, data on labor force participation for age 65 and above from FRED (BLS 2022h). The pattern is also confirmed by Hiring Lab (Bunker 2022).
Monthly data from BLS show that, by October 2022, the employment-population ratio had recovered from an all-time low of 51.3 percent in the initial days of the pandemic to 60 percent, a number just 1 percentage point below pre-pandemic levels.134
Vacancies and Quits
The greatest puzzle of the current labor market has been the increase in quits and vacancy rates (see Figures A3 and A4.)135 Did this point to a permanent change in the labor market, with attitudes to work reflected in the “Great Resignation”? Were there structural changes, such as increased costs of matching workers with firms, that would indicate a shift in key labor market functions like the Phillips curve or the Beveridge curve (which relies on job openings for a given level of unemployment as an indication of tight labor markets)? If so, this would suggest that it might take high levels of unemployment for long periods of time to tame the labor market and bring down the rate of wage inflation.
Of course, with so many workers detached from their firms, loyalty to firms was decreased and there was an unprecedented task of rematching workers with firms, so one would expect temporarily high labor turnover, high quits, and correspondingly high vacancies. But these effects might be relatively short-lived they did not necessarily represent a permanent upward shift in quits and vacancy rates, as a result of, say, greater difficulties in matching.
Figures A3 and A4 show that both quits and vacancies have come down significantly (for instance, vacancies have come down from a peak of 6.6 percent in March 2022 to 5.9 percent in September) without any significant increase in the unemployment rate. While the data is only for a limited time span, it is consistent with the perspective advanced here that the changes in labor market dynamics may be largely temporary.
134 We earlier use World Bank calculations based on ILO data for an international comparison. This data, only available up to 2021, shows that the US employment-population ratio had started increasing in 2021 after dropping sharply in 2020. The BLS data show that that trend had continued, but even then, the employmentpopulation and labor force participation numbers for the US were markedly lower than that of other advanced countries.
135 Many of the quits in 2020 and 2021 were associated with the rapid rise in risks associated with existing labor market arrangements (see, for example, Parker and Horowitz 2022). Perhaps relatedly, lower income brackets and other marginalized groups, including Black and Hispanic workers (Raifman and Sojourner 2022), disproportionately exposed to pandemic risks, showed higher quit rates

Interpreting Shifting Vacancy and Quit Rates
Quits and vacancies are, of course, interdependent, and observed quit and vacancy rates are both endogenous variables, related to a host of variables besides matching costs including and especially the special pandemic circumstances with turnover costs, wage distributions, and unemployment insurance all altered from “normal.” Some economists have suggested
Figure A4
that wage inflation is related to vacancies (Blanchard, Domash, and Summers 2022), but Bloesch (2022b) provides a far more convincing case that it is related to actual quits136 it is the threat of a worker leaving, more than the difficulty in filling a job, at least as measured by standard vacancy data. (Most quits represent workers moving from one firm to another, and shifts in hiring practices/norms affect job listings and therefore “vacancies.”137)
The implication of this analysis is that the (partly temporary) increase in vacancy and quit rates should not necessarily be seen, as some monetary authorities seem to have done,138 as indicators of an acute labor shortage. As Bloesch (2022b) concludes:
[N]ot much has changed to make one conclude that the unemployment rate consistent with low inflation, the so-called “natural rate,” is higher than before. Instead, it looks increasingly possible that the labor market can return to a strong but not overheating equilibrium, giving time for supply-side issues to be resolved and bring inflation back down.
BOX B: OVER-RELIANCE ON ORTHODOX ECONOMIC MODELS UNDERMINES OUR ABILITY TO EXAMINE DRIVERS OF INFLATION EFFECTIVELY
Some public policy discussions of the inflationary prospects of the economy rely on a wellstudied relationship between inflation and unemployment, called the Phillips curve. In recent years, the curve has been flat (Hazell et al. 2022), implying that a lower-than-normal (or what is called the natural) rate of inflation generates little extra inflation; the converse is
136 See also Cheremukhin and Restrepo-Echavarria 2022.
137 This is particularly true because norms of recruitment practices have changed over time, with a greater emphasis on equality of opportunity, inclusion, and transparency. HR practices may require specificity in hiring, so a firm wanting one employee may have several job postings; these practices too can change over time. Moreover, with reports of tight labor markets (whether accurate or not) so prevalent in the press and with evidence of high turnover, some firms would move to not only advertise more jobs (reinforcing the picture of high vacancies) but hire more workers essentially a 21st century version of labor hoarding.
138 In September 2022, Federal Reserve Chair Powell asserted “...that (vacancies) and quits are really very good ways to look at how tight the labor market is” (Board of Governors of the Federal Reserve 2022a; Board of Governors of the Federal Reserve 2022b).
139
that it would take higher unemployment, maintained for a long time, to wring inflation out of the economy.
The disinflationary effect of a resolution of the supply side problems, which we have emphasized, would suggest otherwise: that even with a decrease in unemployment, inflation may come down markedly. Recent changes in labor market dynamics noted above are consistent with this interpretation of the data.
Current inflation, marked by large changes in relative prices, has highlighted the limitations of modern macroeconomics, which has focused excessively on aggregates rather than the sectoral constituents of those aggregates. When there are large changes in relative prices, we need to look at the determinants of sector-specific price changes rather than generalized movements in price indices such as the PCE and CPI (Borio et al. 2021).
This helps us understand why the Phillips curve has proved to be so unstable. Over the years, multiple studies have attempted to explain this seemingly ever-shifting Phillips curve for instance, changes in demography and in labor markets. The fact remains that, even with such “adjustments,” it has not proved to be a reliable tool for predicting the course of inflation and is likely to be even less reliable in the current situation, one unlike any the economy has ever experienced.140 141
We suspect that the elusiveness of the Phillips curve can best be understood through the disappearance of cyclical properties of specific important components of the inflation index. It should be evident that prices set in the international market are not indicative of domestic business cycles (Stock and Watson 2019) in a world in which cyclical movements are not
139 There is an obvious dissonance as those who argue that today’s inflation is caused by an excess of aggregate demand also argue that the flat Phillips curve means it will be hard to wring out today’s inflation. If it were flat, the slight lowering of the unemployment rate from what it otherwise would have been would not have induced much inflation (though the high levels of unemployment during the pandemic should themselves have induced measurable disinflation). The two views are, of course, reconcilable if one believes the Phillips curve relationship is unstable. As we explained, we do, but in ways that make bringing down today’s inflation easier.
140 While the higher level of unemployment during the period after the Great Recession did not have the adverse effects on inflation that one would have expected had one used Phillips curves estimated on earlier data neither did the lower level of unemployment in the late 1990s have the positive effects on inflation that one would have expected.
141 Adams et al. (2022) show that the estimated Phillips curve relationship even changes when one changes how one measures rent.
perfectly synchronous. Moreover, cyclical properties of sectoral prices, even in non-traded sectors, vary considerably across markets depending on the market structure, wage-setting practices, and other regulations. There is no presumption that the aggregate of these would exhibit sufficient stability to be relied on especially in a time of unprecedented change like this, including in the economy's sectoral composition.
Past experiences provide an uncertain guide to how things will play out today. Indeed, the last time the United States had a supply shock, albeit one quite different from today’s, was almost 50 years before the era of globalization, when unions and labor legislation were far stronger than they are today and before we had begun the transition to the service, digital, and knowledge-based economy.
142
In short, it’s misguided to base high-stakes economic policy on a relationship that is weak and unstable, does not match data since the 1970s (Sahm 2021; Storm and Naastepad 2012), and is unlikely to describe the current world well (Storm 2022).
143
142 As Orszag, Rubin, and Stiglitz (2021) point out, economists have been notoriously poor in predicting economic variables, like interest rates, even in more normal times.
143 And as we note elsewhere, if one does use the curve, one has to explicitly take into account the uncertainty about its level and shape. One should not base policy just on the expected value of key parameters.
REFERENCES
Adams, Brian, Lara Loewenstein, Hugh Montag, and Randal Verbrugge. 2022. “Disentangling Rent Index Differences: Data, Methods, and Scope.” Working Paper no. 555. BLS Working Paper. Washington, DC: US Department of Labor, US Bureau of Labor Statistics, and Office of Prices and Living Conditions. https://www.bls.gov/osmr/research-papers/2022/pdf/ec220100.pdf
Akerlof, George A., and William T. Dickens. 2007. “Unfinished Business in the Macroeconomics of Low Inflation: A Tribute to George and Bill by Bill and George.” Brookings Papers on Economic Activity 2007, no. 2 (2007): 31–46. http://www.jstor.org/stable/27561591
Aladangady, Adita, David Cho, Laura Feiveson, and Eugenio Pinto. 2022. “Excess Savings during the COVID-19 Pandemic.” FEDS Notes. https://www.federalreserve.gov/econres/notes/feds-notes/excess-savings-during-thecovid-19-pandemic-20221021.html.
Aldrick, Philip. 2022. “Larry Summers Says US Needs 5% Jobless Rate for 5 Years to Ease Inflation.” Bloomberg, June 20, 2022, sec. Economics. https://www.bloomberg.com/news/articles/2022-06-20/summers-says-us-needs-5jobless-rate-for-five-years-to-ease-cpi
Arnon, Alexander, Richard Prisinzano, and Mariko Paulson. 2022. “Why Taxpayers Owed $500 Billion in Taxes When They Filed This Year.” University of Pennsylvania. May 23, 2022. Budget Model. https://budgetmodel.wharton.upenn.edu/issues/2022/5/23/why-taxpayers-owed-500-billion-taxes.
Ashenfelter, Orley, David Card, Henry Farber, and Michael R. Ransom. 2022. "Monopsony in the Labor Market: New Empirical Results and New Public Policies." Journal of Human Resources 57, special issue (September). http://jhr.uwpress.org/content/57/S/S1.full.pdf.
Autor, David, Arindrajit Dube, and Anne McGrew. 2022 (forthcoming). “The Unexpected Compression Competition at Work in the Low Wage Economy.” Presented at HKS Inequality Social Policy Seminar, September 12, 2022.
Baker, Dean. 2022a. “If Wage Growth Is Driving Inflation, Why Is Workers’ Share of Income Falling?” DC Report. April 21, 2022. https://www.dcreport.org/2022/04/21/if-wage-growth-is-driving-inflation-why-is-workers-share-ofincome-falling/.
Baker, Dean. 2022b. “Two Routes to Lower Inflation.” Center for Economic and Policy Research (blog). April 26, 2022. https://cepr.net/two-routes-to-lower-inflation/.
Baker, Dean. 2022c. “Contrary to What You Read in the Paper, People Are Not Spending Down Their Savings.” Center for Economic and Policy Research (blog). July, 01, 2022. https://www.cepr.net/contrary-to-what-you-read-in-thepaper-people-are-not-spending-down-their-savings/
Bassier, Ihsaan, Arindrajit Dube, and Suresh Naidu. 2022. “Monopsony in Movers: The Elasticity of Labor Supply to Firm Wage Policies.” Journal of Human Resources 57, no. S (April): S50–S86. https://doi.org/10.3368/jhr.monopsony.0319-10111R1
Blanchard, Olivier, Alex Domash, and Lawrence H. Summers. 2022. “Bad News for the Fed from the Beveridge Space.” Peterson Institute for International Economics Policy Brief 22-7. https://doi.org/10.2139/ssrn.4174601
Bloesch, Justin. 2022a. “A New Framework for Targeting Inflation: Aiming for a Range of 2 to 3.5 Percent.” Roosevelt Institute, November 17, 2022. https://rooseveltinstitute.org/publications/a-new-framework-for-targetinginflation-aiming-for-a-range-of-2-to-3-5-percent/.
Bloesch, Justin. 2022b. “Why Unemployment Can Stay Low While We Fight Inflation.” Roosevelt Institute (blog). October 21, 2022. https://rooseveltinstitute.org/2022/10/21/why-unemployment-can-stay-low-while-we-fightinflation/.
Board of Governors of the Federal Reserve System (US). 2022. “Capacity Utilization: Total Index.” FRED, Federal Reserve Bank of St. Louis. Accessed December 1, 2022. https://fred.stlouisfed.org/series/TCU.
Borio, Claudio, Piti Disyatat, Dora Xia, and Egon Zakrajšek. 2021. “Monetary Policy, Relative Prices and Inflation Control: Flexibility Born out of Success.” BIS Quarterly Review. https://www.bis.org/publ/qtrpdf/r_qt2109b.pdf.
Bunker, Nick. n.d. “‘Unretirements’ Continue to Rise as More Workers Return to Work.” Hiring Lab: Economic Research by Indeed, April 14, 2022. https://www.hiringlab.org/2022/04/14/unretirements-rise/
Bureau of Economic Analysis. 2022a. “Auto Inventory/Sales Ratio.” FRED, Federal Reserve Bank of St. Louis. Accessed November 30, 2022. https://fred.stlouisfed.org/series/AISRSA
Bureau of Economic Analysis. 2022b. “Gross Domestic Product: Terms of Trade Index [W369RG3Q066SBEA].” Retrieved from FRED, Federal Reserve Bank of St. Louis. Accessed November 30, 2022. https://fred.stlouisfed.org/series/W369RG3Q066SBEA.
Bureau of Economic Analysis. n.d. “National Income and Product Accounts.” From National Data of Bureau of Economic Analysis (BEA). Accessed November 27, 2022. https://apps.bea.gov/iTable/?reqid=19&step=2&isuri=1&categories=survey/.
Bureau of Labor Statistics (BLS). 2022a. “Consumer Expenditure–2021.” US Bureau of Labor Statistics. Accessed November 30, 2022. https://www.bls.gov/news.release/cesan.nr0.htm.
Bureau of Labor Statistics (BLS). 2022b. “Archived Consumer Price Index Supplemental Files.” US Bureau of Labor Statistics. Accessed November 18, 2022. https://www.bls.gov/cpi/tables/supplemental-files/home.htm
Bureau of Labor Statistics (BLS). 2022c. “Import/Export Price Indexes.” US Bureau of Labor Statistics. Accessed November 22, 2022. https://www.bls.gov/mxp/
Bureau of Labor Statistics (BLS). 2022d. “Measuring Price Change in the CPI: Used Cars and Trucks.” US Bureau of Labor Statistics. Accessed November 30, 2022. https://www.bls.gov/cpi/factsheets/used-cars-and-trucks.htm.
Bureau of Labor Statistics (BLS). 2022e. “PPI Tables.” US Bureau of Labor Statistics. Accessed November 22, 2022. https://www.bls.gov/ppi/tables/.
Bureau of Labor Statistics (BLS). 2022f. “Employment Situation News Release.” US Bureau of Labor Statistics. Accessed November 30, 2022. https://www.bls.gov/news.release/archives/empsit_11042022.htm
Bureau of Labor Statistics (BLS). 2022g. “Relative Importance and Weight Information for the Consumer Price Indexes.” US Bureau of Labor Statistics. Accessed November 30, 2022. https://www.bls.gov/cpi/tables/relativeimportance/home.htm.
Bureau of Labor Statistics (BLS). 2022h. “Labor Force Participation Rate–With No Disability, 65 Years and Over.” Retrieved from FRED, Federal Reserve Bank of St. Louis. Accessed November 30, 2022. https://fred.stlouisfed.org/series/LNU01375379
Bureau of Labor Statistics (BLS). 2022i. “Nonfarm Business Sector: Labor Productivity (Output per Hour) for All Employed Persons.” Retrieved from FRED, Federal Reserve Bank of St. Louis. Accessed November 19, 2022. https://fred.stlouisfed.org/series/OPHNFB
Bureau of Labor Statistics (BLS). 2022j. “Calendar Year Aggregate Expenditure Shares Across Selected Groups Tables by Demographic Characteristics.” US Bureau of Labor Statistics. Accessed November 18, 2022. https://www.bls.gov/cex/tables/calendar-year/aggregate-group-share.htm.
Bureau of Labor Statistics (BLS). 2022. “Current Employment Statistics–CES (National).” US Bureau of Labor Statistics. Accessed November 22, 2022. https://www.bls.gov/ces/
Bureau of Labor Statistics (BLS). 2022. “Labor Force Statistics from the Current Population Survey.” US Bureau of Labor Statistics. Accessed November 22, 2022. https://www.bls.gov/cps/tables.htm
Bureau of Labor Statistics (BLS). 2022. “Earnings.” US Bureau of Labor Statistics. Accessed November 22, 2022. https://www.bls.gov/cps/earnings.htm.
Colciago, Andrea, Anna Samarina, Jakob de Haan. 2019. “Central Bank Policies and Income and Wealth Inequality: A Survey.” Journal of Economic Surveys 33, no. 4 (September): 1199–1231. https://doi.org/10.1111/joes.12314.
Canepa, Francesco, and Howard Schneider. 2022. “Central Banks Raise Rates Again as Fed Drives Global Inflation Fight.” Reuters, September 22, 2022, sec. European Markets. https://www.reuters.com/markets/europe/centralbanks-raise-rates-again-fed-drives-global-inflation-fight-2022-09-22/.
Cheremukhin, Anton, and Paulina Restrepo-Echavarria. 2022. “The Dual Beveridge Curve.” Working Paper no. 2022021A, Working Paper Series. St. Louis, MO: Federal Reserve Bank of St. Louis. https://doi.org/10.20955/wp.2022.021
Chua, Charmaine, Martin Danyluk, Deborah Cowen, and Laleh Khalili. 2018. “Introduction: Turbulent Circulation: Building a Critical Engagement with Logistics.” Environment and Planning D: Society and Space 36, no. 4 (August): 617–29. https://doi.org/10.1177/0263775818783101.
Congressional Budget Office. 2020. The Budget and Economic Outlook: 2020 to 2030. Washington, DC: Congressional Budget Office Nonpartisan Analysis for the US Congress. https://www.cbo.gov/publication/56020
Congressional Budget Office. 2022. The Budget and Economic Outlook: 2022 to 2032. Washington, DC: Congressional Budget Office Nonpartisan Analysis for the US Congress. https://www.cbo.gov/publication/57950
Congressional Budget Office. 2022. An Update to the Budget and Economic Outlook: 2021 to 2031. Washington, DC: Congressional Budget Office Nonpartisan Analysis for the US Congress. July 1, 2021. https://www.cbo.gov/publication/57339
Dayen, David, and Rakeen Mabud. 2022. “How We Broke the Supply Chain.” The American Prospect, January 31, 2022, sec. Economic Policy. https://prospect.org/api/content/c278c3a0-8065-11ec-aadd-12f1225286c6/
Dias, Daniel A., and João B. Duarte. 2019. “Monetary Policy, Housing Rents and Inflation Dynamics.” International Finance Discussion Papers. https://www.federalreserve.gov/econres/ifdp/files/ifdp1248.pdf
Domash, Alex, and Lawrence H. Summers. 2022a. “A Labor Market View on the Risks of a U.S. Hard Landing.” Working Paper no. 29910. NBER Working Paper Series. Cambridge MA: National Bureau of Economic Research. https://doi.org/10.3386/w29910
Domash, Alex, and Lawrence H. Summers. 2022b. “How Tight Are U.S. Labor Markets?” Working Paper no. 29739. NBER Working Paper Series. Cambridge MA: National Bureau of Economic Research. https://doi.org/10.3386/w29739.
Duran-Franch, Joana, and Ira Regmi. 2022. “Family-Friendly Policies and the Motherhood Employment Gap during the COVID-19 Recovery.” Roosevelt Institute, August 16, 2022. https://rooseveltinstitute.org/publications/familyfriendly-policies-and-the-motherhood-employment-gap-during-the-covid-19-recovery/
Dynan, Karen E., Douglas W. Elmendorf, and Daniel E. Sichel. 2005. “Can Financial Innovation Help to Explain the Reduced Volatility of Economic Activity?” Journal of Monetary Economics 53, no. 1 (January):123–150. https://doi.org/10.1016/j.jmoneco.2005.10.012
European Central Bank. 2020. “Selected Euro Area Statistics and National Breakdowns.” European Central Bank. October 26, 2020. https://www.ecb.europa.eu/stats/ecb_statistics/escb/html/index.en.html
Federal Reserve Bank of Cleveland. 2022. “10-Year Expected Inflation” FRED, Federal Reserve Bank of St. Louis. Accessed November 19, 2022. https://fred.stlouisfed.org/series/EXPINF10YR
Federal Reserve Bank of New York. 2022. “Global Supply Chain Pressure Index (GSCPI).” Federal Reserve Bank of New York. Accessed November 27, 2022. https://www.newyorkfed.org/research/policy/gscpi#/overview.
Federal Reserve Bank of St. Louis. 2022a. “University of Michigan: Inflation Expectation.” FRED Database, Federal Reserve Bank of St. Louis. Accessed November 27, 2022. https://fred.stlouisfed.org/series/MICH.
Federal Reserve Bank of St. Louis. 2022b. “10-Year Breakeven Inflation Rate.” FRED Database, Federal Reserve Bank of St. Louis. Accessed November 26, 2022. https://fred.stlouisfed.org/series/T10YIE
Fitch, Asa. 2022. “For Chip Makers, the Flip From Shortage to Glut Intensifies.” The Wall Street Journal, November 4, 2022. https://www.wsj.com/articles/chip-makers-cut-costs-as-demand-slump-supplants-pandemics-chipshortage-11667560050.
Friedman, Milton. 1968. “The Role of Monetary Policy.” American Economic Review 58, no. 1 (March): 1–17. https://www.aeaweb.org/aer/top20/58.1.1-17.pdf
Ghosh, Jayati. 2022. “Curbing Commodity-Market Speculation.” Project Syndicate, August 10, 2022, sec. Economics. https://www.project-syndicate.org/commentary/financial-traders-commodity-market-speculation-by-jayatighosh-2022-08.
Greenwald, Bruce C., Joseph E. Stiglitz, Robert E. Hall, and Stanley Fischer. 1988. “Examining Alternative Macroeconomic Theories.” Brookings Papers on Economic Activity 19, no. 1: 207–270. https://www.jstor.org/stable/2534427#metadata_info_tab_contents
Greenwald, Bruce C., and Joseph E. Stiglitz. 2003. “6 Macroeconomic Fluctuations in an Economy of Phelps-Winter Markets” in Knowledge, Information, and Expectations in Modern Macroeconomics: In Honor of Edmund S. Phelps, edited by Philippe Aghion, Roman Frydman, Joseph Stiglitz, and Michael Woodford, 123–136. Princeton, NJ: Princeton University Press.
Greig, Fiona, and Erica Deadman. 2022. “Household Pulse: The State of Cash Balances through March 2022.” JPMorgan Chase & Co, June 2022. https://www.jpmorganchase.com/institute/research/household-incomespending/household-pulse-cash-balances-through-march-2022
Groundwork Collaborative. 2022. Q2 2022 Corporate Profiteering Findings. Washington, DC: Groundwork Collaborative. https://groundworkcollaborative.org/resource/q2-2022-oil-gas-corporate-profiteering-findings/
Guerrieri, Veronica, Guido Lorenzoni, Ludwig Straub, and Iván Werning. 2021. “Monetary Policy in Times of Structural Reallocation.” Working Paper no. 2021-111. Becker Friedman Institute (BFI) Working Papers. Chicago, IL: BFR Economics at University of Chicago. https://bfi.uchicago.edu/wp-content/uploads/2021/09/BFI_WP_2021111.pdf
Gutiérrez, Germán, and Thomas Philippon. 2019. “How EU Markets Became More Competitive Than US Markets: A Study of Institutional Drift.” University of Pennsylvania, Wharton Finance Department. http://germangutierrezg.com/GutierrezPhilippon_Europe_2019.pdf
Hazell, Jonathon, Juan Herreño, Emi Nakamura, and Jón Steinsson. 2022. “The Slope of the Phillips Curve: Evidence from U.S. States.” The Quarterly Journal of Economics 137, no. 3 (August): 1299–1344. https://academic.oup.com/qje/article/137/3/1299/6529257.
Hebebrand, Charlotte, and David Laborde. 2022. “High Fertilizer Prices Contribute to Rising Global Food Security Concerns.” International Food Policy Research Institute (blog). April 25, 2022. https://www.ifpri.org/blog/highfertilizer-prices-contribute-rising-global-food-security-concerns.
Holder, Michelle, Janelle Jones, and Thomas Masterson. 2021. “The Early Impact of COVID-19 on Job Losses among Black Women in the United States.” Feminist Economics 27, no. 1-2 (March): 103–116. https://doi.org/10.1080/13545701.2020.1849766
Hoynes, Hilary, Douglas L. Miller, and Jessamyn Schaller. 2012. “Who Suffers during Recessions?” Journal of Economic Perspectives 26, no. 3 (Summer): 27–48. https://doi.org/10.1257/jep.26.3.27
IMF Fiscal Affairs Department. 2021. “Fiscal Monitor Database of Country Fiscal Measures in Response to the COVID-19 Pandemic.” From Database of Country Fiscal Measures in Response to the COVID-19 Pandemic and IMF staff estimates. Last updated September 27, 2021. https://www.imf.org/en/Topics/imf-and-covid19/FiscalPolicies-Database-in-Response-to-COVID-19.
Independent Commission for the Reform of International Corporate Taxation (ICRICT). 2022. An Emergency Tax Plan to Confront the Inflation Crisis. ICRICT. https://www.icrict.com/press-release/2022/9/16/icrict-declaration-anemergency-tax-plan-to-confront-the-inflation-crisis-m87sa
International Monetary Fund (IMF). 2019. World Economic Outlook, October 2019: Global Manufacturing Downturn, Rising Trade Barriers. Washington, DC: International Monetary Fund. https://www.imf.org/en/Publications/WEO/Issues/2019/10/01/world-economic-outlook-october-2019.
International Monetary Fund (IMF). 2022. Countering the Cost-of-Living Crisis. Washington, DC: International Monetary Fund. https://www.imf.org/en/Publications/WEO/Issues/2022/10/11/world-economic-outlook-october-2022
International Transport Forum. 2015. The Impact of Mega-Ships. Paris: International Transport Forum, OECD. https://www.itf-oecd.org/impact-mega-ships
International Transport Forum. 2018. The Impact of Alliances in Container Shipping. Paris: International Transport Forum, OECD. https://www.itf-oecd.org/impact-alliances-container-shipping.
IPES-Food. 2022. Another Perfect Storm? Brussels: IPES-Food. https://ipesfood.org/pages/foodpricecrisis
Jeanne, Olivier, and Anton Korinek. 2019. “Managing Credit Booms and Busts: A Pigouvian Taxation Approach.” Journal of Monetary Economics 107 (November): 2–17. https://doi.org/10.1016/j.jmoneco.2018.12.005.
Johnson, Noah N. 2017. “Tradable and Nontradable Inflation Indexes: Replicating New Zealand’s Tradable Indexes with BLS CPI Cata.” US Bureau of Labor Statistics Monthly Labor Review, May 2017. https://www.bls.gov/opub/mlr/2017/article/tradable-and-nontradable-inflation-indexes.htm
Kammer, Alfred, and Nathaniel Arnold. 2021. “Europe’s COVID-19 Crisis Response: A Race Well Run, But Not Yet Won.” Intereconomics 56, no. 4: 194–196. https://www.intereconomics.eu/contents/year/2021/number/4/article/europe-s-covid-19-crisis-response-arace-well-run-but-not-yet-won.html
Klein, Matthew C. 2022. “Is America’s Job Market ‘Too Good’?” The Overshoot, August 2022. https://theovershoot.co/p/is-americas-job-market-too-good.
Kmetz, Augustus, John Mondragon, and Johannes Wieland. 2022. Remote Work and Housing Demand. San Francisco: Federal Reserve Bank of San Francisco. https://www.frbsf.org/wp-content/uploads/sites/4/el2022-26.pdf
Konczal, Mike, and Niko Lusiani. 2022. Prices, Profits, and Power: An Analysis of 2021 Firm-Level Markups. New York: Roosevelt Institute. https://rooseveltinstitute.org/wpcontent/uploads/2022/06/RI_PricesProfitsPower_202206.pdf.
Korinek, Anton, and Joseph E. Stiglitz. 2022. “Macroeconomic Stabilization for a Post-Pandemic World: Revising the Fiscal-Monetary Policy Mix and Correcting Macroeconomic Externalities.” Working Paper no. 78. Hutchins Center Working Paper Series. Washington, DC: Brookings Institution. https://www.brookings.edu/research/macroeconomic-stabilization-for-a-post-pandemic-world/
Lazonick, William, and Matt Hopkins. 2021. “Why the CHIPS Are Down: Stock Buybacks and Subsidies in the U.S. Semiconductor Industry.” Institute for New Economic Thinking Working Paper Series No. 165, available at https://papers.ssrn.com/sol3/papers.cfm?abstract_id=3952144
Lusiani, Niko. 2022. “Power Struggle: How Shareholder Primacy in the Electrical Utility Sector Is Holding Back an Affordable and Just Energy Transition.” Roosevelt Institute, May 24, 2022. https://rooseveltinstitute.org/publications/electric-utilities-shareholder-primacy/.
Mason, J.W., Mike Konczal, and Lauren Melodia. 2021. “Reimagining Full Employment: 28 Million More Jobs and a More Equal Economy.” Roosevelt Institute, July 21, 2021. https://rooseveltinstitute.org/publications/reimaginingfull-employment-28-million-more-jobs-and-a-more-equal-economy/
Melodia, Lauren, and Kristina Karlsson. 2022. “Energy Price Stability: The Peril of Fossil Fuels and the Promise of Renewables.” Roosevelt Institute, May 11, 2022. https://rooseveltinstitute.org/publications/energy-pricestability/
Meredith, Sam, and Natasha Turak. 2022. “U.S. Delivers Angry Rebuke of Massive OPEC+ Production Cut and It Could Backfire for Saudi Arabia.” CNBC, October 6, 2022. https://www.cnbc.com/2022/10/06/oil-us-delivers-angryrebuke-of-massive-opec-production-cut.html.
Motley Fool Transcribing. 2022. “Kimberly Clark (KMB) Q2 2022 Earnings Call Transcript.” Last updated July 26, 2022. https://www.fool.com/earnings/call-transcripts/2022/07/26/kimberly-clark-kmb-q2-2022-earnings-calltranscrip/
Migration Policy Institute. n.d. “Migration Data Hub.” Migration Policy Institute. Accessed December 1, 2022. https://www.migrationpolicy.org/programs/migration-data-hub.
Organisation for Economic Co-operation and Development (OECD). 2022a. “Inflation (CPI).” OECD. Accessed November 22, 2022. http://data.oecd.org/price/inflation-cpi.htm.
Organisation for Economic Co-operation and Development (OECD). 2022b. “Inflation Forecast.” OECD. Accessed November 30, 2022. http://data.oecd.org/price/inflation-forecast.htm
Organisation for Economic Co-operation and Development (OECD). 2022c. “Labour Market Situation, OECD - Updated: October 2022” OECD, October 10, 2022. https://www.oecd.org/newsroom/labour-market-situation-oecdupdated-october-2022.htm.
Organisation for Economic Co-operation and Development (OECD). 2022d. "Main Economic Indicators - complete database." Main Economic Indicators (database). Accessed November 30, 2022. https://www.oecdilibrary.org/economics/data/main-economic-indicators/main-economic-indicators-complete-database_data00052-en.
Palladino, Lenore, and Isabel Estevez. 2022. “The Need for Corporate Guardrails in US Industrial Policy.” Roosevelt Institute, August 18, 2022. https://rooseveltinstitute.org/publications/the-need-for-corporate-guardrails-in-usindustrial-policy/
Parker, Kim, and Juliana Menasce Horowitz. 2022. “Majority of Workers Who Quit a Job in 2021 Cite Low Pay, No Opportunities for Advancement, Feeling Disrespected.” Pew Research Center (blog). March 9, 2022. https://www.pewresearch.org/fact-tank/2022/03/09/majority-of-workers-who-quit-a-job-in-2021-cite-lowpay-no-opportunities-for-advancement-feeling-disrespected/.
Phelps, Edmund S., and Sidney G. Winter Jr. 1970. “Optimal Price Policy under Atomistic Competition,” in Microfoundations of Employment and Inflation Theory. New York: W. W. Norton and Co.
Powell, Jerome. 2022a. “Transcript of Chair Powell’s Press Conference: November 2, 2022.” Federal Reserve Board. https://www.federalreserve.gov/mediacenter/files/FOMCpresconf20221102.pdf.
Powell, Jerome. 2022b. “Transcript of Chair Powell’s Press Conference: September 21, 2022.” Federal Reserve Board. https://www.federalreserve.gov/mediacenter/files/FOMCpresconf20220921.pdf
Powell, Jerome. 2022c. “Monetary Policy and Price Stability.” Speech delivered at Reassessing Constraints on the Economy and Policy economic policy symposium. Jackson Hole, Wyoming. August 26, 2022. https://www.federalreserve.gov/newsevents/speech/powell20220826a.htm.
Rossin-Slater, Maya. 2017. “Maternity and Family Leave Policy.” NBER Working Paper no. 23069. NBER Working Paper Series. Cambridge MA: National Bureau of Economic Research. https://www.nber.org/system/files/working_papers/w23069/w23069.pdf
Rudd, Jeremy B. 2021. “Why Do We Think That Inflation Expectations Matter for Inflation? (And Should We?)” Finance and Economics Discussion Series 2021-062. Board of Governors of the Federal Reserve System. https://doi.org/10.17016/FEDS.2021.062
Russell, Rupert. 2022. Price Wars: How the Commodities Markets Made Our Chaotic World. New York City: Knopf Doubleday Publishing Group.
Sahay, Tim. 2022. “How High Energy Prices Emboldened Putin.” The American Prospect, March 22, 2022, sec. Books. https://prospect.org/api/content/9a2e58f4-a957-11ec-9c46-12274efc5439/.
Sahm, Claudia. 2021. “COVID-19 Is Transforming Economic Policy in the United States.” Intereconomics 56, no. 5 (July/August): 185–90. https://www.intereconomics.eu/contents/year/2021/number/4/article/covid-19-istransforming-economic-policy-in-the-united-states.html
Seeking Alpha. 2022. “Colgate-Palmolive Company’s (CL) CEO Noel Wallace on Q2 2022 Results - Earnings Call Transcript.” SA Transcripts. Accessed July 26, 2022. https://seekingalpha.com/article/4527474-colgatepalmolive-companys-cl-ceo-noel-wallace-on-q2-2022-results-earnings-call-transcript.
Sims, Jonathan, Catharina Hillenbrand von der Neyen, Durand D‘souza, Lily Chau, Nicolás González-Jiménez, and Lorenzo Sani. 2021. Put Gas on Standby. London: Carbon Tracker Initiative. https://carbontracker.org/reports/put-gas-on-standby/
Solow, Robert M., and Joseph E. Stiglitz. 1968. “Output, Employment and Wages in the Short Run.” Quarterly Journal of Economics 82, no. 4 (November): 537–60. https://doi.org/10.2307/1879599.
Freightos Data. 2022. “Freightos Baltic Index (FBX): Global Container Freight Index.” Freightos. Accessed December 1, 2022. https://fbx.freightos.com/
Stiglitz, Joseph E. 2006. Making Globalization Work. New York: W. W. Norton & Company.
Stiglitz, Joseph E. 2016. “Fed Policy, Inequality, and Equality of Opportunity.” In Economic Mobility: Research & Ideas on Strengthening Families, Communities & the Economy, edited by Alexandra Brown, David Buchholz, Daniel Davis, Arturo Gonzalez, 77–94. St. Louis, MO: Federal Reserve Bank of St. Louis and the Board of Governors of the Federal Reserve System. https://www.stlouisfed.org//media/project/frbstl/stlouisfed/Files/PDFs/Community%20Development/EconMobilityPapers/EconMobility_B ook_508.pdf/.
Stiglitz, Joseph E. 2015. “New Theoretical Perspectives on the Distribution of Income and Wealth Among Individuals: Part IV Land and Credit.” Working Paper no. 21192. NBER Working Paper Series. No 21192. NBER Working Paper Series. Cambridge, MA: National Bureau of Economic Research. https://www.nber.org/papers/w21192.
Stiglitz, Joseph E. 2019. “Reflections On The Global Financial Crisis Ten Years On.” In After the Crash: Financial Crises and Regulatory Responses, edited by Sharyn O’Halloran and Thomas Groll, 167–82. New York: Columbia University Press. http://www.jstor.org/stable/10.7312/ohal19284.14
Stiglitz, Joseph E. 2020. "Four Priorities for Pandemic Relief Efforts." Roosevelt Institute Working Papers. New York: Roosevelt Institute. https://rooseveltinstitute.org/wp-content/uploads/2020/07/RI_Four-Priorities-forPandemic-Relief-Effort-WP-202004-1.pdf.
Stiglitz, Joseph E. (forthcoming). Rethinking Macroeconomics: Volume IV of Selected Papers. Oxford, UK: Oxford University Press.
Stiglitz, Joseph E., and Bruce Greenwald. 2014. Creating a Learning Society: A New Approach to Growth, Development, and Social Progress. New York: Columbia University Press.
Stiglitz, Joseph E., Carter Daugherty, and the Foundation for European Progressive Studies. 2020. Rewriting the Rules of the European Economy: An Agenda for Growth and Shared Prosperity. New York: W.W. Norton.
Stiglitz, Joseph E., and Dean Baker. 2022a. “Inflation Dos and Don’ts.” Project Syndicate, July 8, 2022. https://www.project-syndicate.org/onpoint/us-inflation-supply-side-causes-and-solutions-by-joseph-e-stiglitzand-dean-baker-2022-07
Stiglitz, Joseph E., and Dean Baker. 2022b. “The Fed Should Wait and See.” Project Syndicate, September 12, 2022, sec. Economics. https://www.project-syndicate.org/commentary/fed-should-pause-rate-hikes-inflation-dampeningby-joseph-e-stiglitz-and-dean-baker-2022-09.
Stiglitz, Joseph E., and Martin M. Guzman. 2021. “The Pandemic Economic Crisis, Precautionary Behavior, and Mobility Constraints: An Application of the Dynamic Disequilibrium Model with Randomness.” Industrial and Corporate Change 30, no. 2 (March): 467–97. https://doi.org/10.1093/icc/dtab012.
Stock, James H., and Mark W. Watson. 2019. “Slack and Cyclically Sensitive Inflation.” Working Paper no. 25987. NBER Working Paper Series. Cambridge, MA: National Bureau of Economic Research. https://www.nber.org/papers/w25987
Storm, Servaas, and C. W. M. Naastepad. 2012. Macroeconomics Beyond the NAIRU. Cambridge, MA: Harvard University Press.
Storm, Servaas. 2022. “Inflation in the Time of Corona and War.” Institute for New Economic Thinking Working Paper Series no. 185. Rochester, NY: Institute for New Economic Thinking. https://papers.ssrn.com/sol3/papers.cfm?abstract_id=4138714
Summers, Lawrence H. 2021. “The Biden Stimulus Is Admirably Ambitious. But It Brings Some Big Risks, Too.” Washington Post, February 4, 2021, sec. Opinion. https://www.washingtonpost.com/opinions/2021/02/04/larry-summers-biden-covid-stimulus/.
Swanson, Ana. 2022. “Biden Administration Releases Plan for $50 Billion Investment in Chips.” New York Times, September 6, 2022, sec. Business. https://www.nytimes.com/2022/09/06/business/economy/biden-techchips.html
Tully, Shawn. 2022. “Contrarian Economist Larry Summers Was Right All Along about Inflation. His Ominous New Prediction for What’s Next.” Fortune, September 23, 2022, sec. Economy. https://fortune.com/2022/09/23/economist-larry-summers-inflation-economy-prediction/
US Department of Agriculture (USDA). 2022. “Food Price Outlook.” USDA Economic Research Service. Last updated November 22, 2022. https://www.ers.usda.gov/data-products/food-price-outlook/
Weber, Isabella M., Jesus Lara Jauregui, Lucas Teixeira, and Luiza Nassif Pires. 2022. “Inflation in Times of Overlapping Emergencies: Systemically Significant Prices from an Input-Output Perspective.” UMass Amherst Economics Department Working Paper Series. https://scholarworks.umass.edu/econ_workingpaper/340/.
Williams, Alex. 2022. The Physical Capacity Shortage View of Inflation. Washington, DC: Employ America. https://www.employamerica.org/content/files/2022/06/The-Physical-Capacity-Shortage-View-of-Inflation.pdf
Williams, Jhacova. 2020. “Laid Off More, Hired Less: Black Workers in the COVID-19 Recession.” The Rand Blog (blog). September 29, 2020. https://www.rand.org/blog/2020/09/laid-off-more-hired-less-black-workers-in-thecovid.html.
Why Market Power Matters for Inflation, before House Committee on Oversight and Reform Subcommittee on Economic and Consumer Policy, 117th Cong. (2022) Statement of Mike Konczal, Roosevelt Institute. https://oversight.house.gov/sites/democrats.oversight.house.gov/files/Konczal%20Testimony.pdf
World Bank. 2022. “Employment to Population Ratio, 15+, Total (%) (Modeled ILO Estimate).” From ILOSTAT database, International Labour Organization. Updated June 2022. https://data.worldbank.org/indicator/SL.EMP.TOTL.SP.ZS
YCharts. 2022. “US ISM Manufacturing Supplier Deliveries Index.” Institute for Supply Management. Accessed December 3, 2022. https://ycharts.com/indicators/us_ism_manufacturing_supplier_deliveries_index
Zillow Research. 2022. “Housing Data.” Zillow. Last updated October 2022. https://www.zillow.com/research/data/