Students
Wanrongmiao Zhang
Chuyi Yin
Ifeoluwa Titilope Owolabi
Jiayao Chen
Yaqiao Liao
Madeeha Ayub
Yinan Fang
Shihua Chen
Yu-Cheng Lin
Chia-Wei Chan
Amelia Rose Linde
Yunsong Liu
Yuli Wang
Territory
Iceland
Ruhr Valley
Southern Nigeria
Bohai Economic Rim
Sichuan
Kashmir
Ganges Basin
Singapore
Indonesian Archipelago
Metropolis Los Angeles
Lake St Clair Watershed
Medellin Metropolitan Area
South American
Infrastructural Integration
Urbanism
Anthropocene / Hinterland / Planetary
Crisis / Emergency
Critical
Ecological / Landscape
Everyday / Emperical
Ephemeral
Informal / Insurgent
Infrastructure / Network
Lean / New / Tactical
Post-Colonial
Post-Industrial
Smart City / Digital
Social
Utopian / Visionary
Global
Conflict Resilient
University of Michigan
Maria Arquero de Alarcon TAMUD
Post-extraction
......
2020
034 Ruhr Valley
Zollverein Park Lake Phoenix Averdung Plaza
120 Sichuan
Serta Larung Gar Buddhist Academy Ying Xiu Town Reconstruction Heming Tea House
210 Singapore
Rail Corridor Bukit Brown Hawker Center
322 Lake St Clair Watershed
Waterfronts Suburbia Food Justice and Water Right
002 Collective Map
066 Southern Nigeria
Okrika Water-front Community Eko Atlantic City Makoko Slums
150 Kashmir Kashmir as a Passage Kashmir as a Host Kashmir as a Territory
242 Indonesian Archipelago
Mangroves & Palm Plantation The Great Garuda & Land Reclamation Street Vendor & Formalization
348
Medellin Metropolitan Area
The Metrocable Jardin Circunvalar de Medellín The River that is Not
004 Iceland
Runways to Greenways Vik Campsite Reykjavik Municipal Plan 2010-2030
090 Bohai Economic Rim
Jiaozhou Bay Bridge and Tunnel Qinhuangdao Beach Restoration 798 Art District
178 Ganges Basin
Kumbh Mela Maidan Kashi Vishwanath Corridor
288
Metropolis Los Angeles
Fab Civic Center Park One Santa Fe Elysian Park Heights
378 South American Infrastructural Integration
Pan-American Highway Maria Elena Vila Piloto
Contents A-1
CONTENTS
Theories and Methods of Urban Design Winter 2020 A-2 Iceland Iceland Medellin Metropolitan Area Colombia
Economic Rim
St Clair Watershed United States & Canada South American Infrastructural Integration South America
Los Angeles United States
Bohai
China Lake
Metropolis
Kashmir
Enclaves within India, Pakistan and China
Sichuan China
Ganges Basin India
Singapore Singapore
Indonesian Archipelago Republic of Indonesia
Papua New Guinea
Est Timor
Ruhr Valley Germany
Southern Nigeria Nigeria
Collective Map A-3
01 IDENTIFICATION OF THE TERRITORY AND LOCATION
Iceland is a Nordic island country in the North Atlantic, with a density of 0.3 km2 per citizen, making it the most sparsely populated country in Europe1. Although Iceland was isolated for centuries from the rest of the world, today it is a trade-transit station between the American and European continents. Iceland joined the European Economic Area and became a Schengen country, but is not part of the European Union.
Iceland is a bowl-shaped highland, surrounded by coastal mountains and a plateau in the middle. More than 100 volcanoes punctuate the island and the Öræfajökull is the tallest peak in the country, with an altitude of 2110 meters2. This country is built on volcanic rocks, and most of the land cannot be reclaimed, which has not been conducive to agricultural development in the past. Thus, most of the population is concentrated along the southwest coast, supported by fishing. The volcanoes provide abundant geothermal energy and the natural scenery attracts tourists3. The river flows outward from the central plateau in a radial pattern, and there still exist modern glaciers, covering 11.5% of the island. Iceland has Vatnajokull, the third largest glacier in the world. However, the country is facing the grave issue of melting ice due to global warming4
1. “Population, Total - Iceland.” Data. Accessed March 26, 2020. https:// data.worldbank.org/indicator/SP.POP. TOTL?locations=IS&view=chart.
2. Reynarsson, Bjarni. “The planning of Reykjavik, Iceland: three ideological waves-a historical overview.” Planning Perspectives 14, no. 1 (1999): 49-67.
3. Edda. “The Biggest Volcanoes in Iceland.” Perlan, July 19, 2019. https://perlan.is/thebiggest-volcanoes-in-iceland/.
02 RELEVANCE FROM THE POINT OF VIEW OF URBAN DESIGN THEORY AND PRAXIS
Iceland has a short history of urban development as the island only industrialized in the late nineteenth century due to its isolation, colonial status, and self-supporting economy. Influenced by Ebenezer Howard’s Garden Cities of Tomorrow, Guðmundur Hannesson, the Professor of Medicine, at the University of Iceland, published ‘On Town Planning’, in 1916. It remains a relevant book in Iceland’s urban planning history5 .
Iceland is near the Arctic Circle, with many hot springs, fumaroles, and
4. Halldórsdóttir, Katrín. “Densification as an Objective Towards Sustainable Planning in Reykjavik. Case Study: A Redevelopment Plan for the Ellidaarvogur Area.” PhD diss.
5. Reynarsson, Bjarni. “The planning of Reykjavik, Iceland: three ideological waves-a historical overview.” Planning Perspectives 14, no. 1 (1999): 49-67.
Theories and Methods of Urban Design Winter 2020 A-4
ICELAND
[Critical DATA]
Geographical Delimitation
Iceland is at the juncture of the North Atlantic and Arctic Oceans. The country lies between latitudes 63 and 68°N, and longitudes 25 and 13°W.

Area 103,000 km²
Population
353,574 [as of 2018]6
Social Indicators
Iceland is almost entirely urban with half of the population located in and around the capital Reykjavik. The educational system is very developed, with about 100,000 students nationwide, 1 /3 of the population. Iceland is the most gender-equality practiced country in the world7.
Economic Indicators
The second half of the 20th century saw substantial economic growth driven primarily by the fishing industry. The economy diversified greatly after the country joined the European Economic Area in 1994, but Iceland was especially hard hit by the global financial crisis in the years following 2008. The economy is now on an upward trajectory, fueled primarily by a tourism and construction boom. Literacy, longevity, and social cohesion are first rate by world standards7.
Environmental Indicators
Iceland is situated on top of a hotspot, which provides geothermal energy for sustainable development. And hydropower produces electric power with efforts in developing public transportation. And Iceland has been using its resources for green power generation and has built many geothermal power stations and dams for hydropower stations to mitigate the risk of climate change7
6. “Population, Total - Iceland.” Data. Accessed March 26, 2020. https:// data.worldbank.org/indicator/SP.POP. TOTL?locations=IS&view=chart.
7. “The World Factbook: Iceland.” Central Intelligence Agency. Central Intelligence Agency, February 1, 2018. https://www.cia. gov/library/publications/resources/the-worldfactbook/geos/ic.html.
Iceland A-5
ICELAND
Figure 01. World Map
8. “Climate Change.” Go to frontpage. Accessed April 21, 2020. https://www.government. is/topics/environment-climate-and-natureprotection/climate-change/.
9. Welling, Johannes, Rannveig Ólafsdóttir, Þorvarður Árnason, and Snævarr Guðmundsson. “Participatory Planning Under Scenarios of Glacier Retreat and Tourism Growth in Southeast Iceland.” Mountain Research and Development 39, no. 2 (2019).

10. Green, Jared. “Iceland Blends Renewable Energy into the Landscape.” THE DIRT, August 8, 2019. https://dirt.asla. org/2018/10/23/icelands-landscape-policyminimizes-the-visual-impact-of-renewablepower/.
11. Lenhart, Maria, Skift, Andrew Sheivachman, Raini Hamdi, and Skift. “The Rise and Fall of Iceland’s Tourism Miracle.” Skift, September 11, 2019. https://skift.com/2019/09/11/the-riseand-fall-of-icelands-tourism-miracle/.
12. “The Country That Tourism Has Taken by Surprise.” BBC Future. BBC, February 22, 2017. https://www.bbc.com/future/ article/20170222-the-country-that-tourism-hastaken-by-surprise.
13. Liang-Pholsena, Xinyi, Rosie Spinks, and Skift. “Why Iceland’s Tourism Boom May Finally Be Over.” Skift, January 17, 2019. https://skift.com/2019/01/16/why-icelandstourism-boom-may-finally-be-over/.
volcanoes. At the same time, Iceland is facing grave threats of increased carbon emissions. Almost all of Iceland’s glaciers are receding, and scientists predict that they may largely vanish in the next 100-200 years8. For example, since the start of this millennium, the southeast outlet glaciers of Vatnajökull have retreated rapidly; according to Hannesdóttir and Baldursson (2017), their mass loss per unit area is among the highest in the world9. Working toward preparedness for climate change, Icelanders relay on the geothermal heating systems in many cities, which can be considered as a massive infrastructure project in the state protecting the environment through diminished carbon dependency. The capital city Reykjavik, for example, has 370 miles of hot water pipes. Hot water from ten districts of the capital comes from four geothermal zones, and ten automated hot water stations provide hot water and heating for urban dwellers. These energy sources save billions of dollars each year, and play an essential role in mitigating the risk of climate change.
However, Iceland’s geothermal systems are expanding with intense public protests that claim the systems are destroying the stunning landscape. In 2016, landscape architect and urban planner Björk Guðmundsdóttir proposed a new landscape policy designed to create a more harmonious relationship between land and energy10. Eventually, she settled on a series of design guidelines, simple but with a positive impact on new projects, and created new roles for landscape architects and urban designers to focus on land issues brought by the energy.
Tourism is a significant pillar of the Icelandic economy. Tourism revenue now accounts for 42 percent of Iceland’s economy in 2019, an increase from around 27 percent in 2013, according to Statistics Iceland11. Iceland has lacked major construction since the end of World War II. The sudden influx of tourists has also increased the demand for public transport and infrastructure construction. In recent years, new hotels, restaurants, roads, and supporting infrastructure are rapidly developing12. But for Iceland, which has a total population of 3.5 million, faced 2.3 million tourists in 201813. That’s why so many campsites for tourism appeared in rural areas along the coastline with perfect natural scenery recently.

Theories and Methods of Urban Design Winter 2020 A-6
Figure 02. Hot Springs and Cultural Spots in Iceland
2020 2010
Reducing 12% CO2 emissions under global warming.
Iceland is the first country to sign a free trade agreement with China.
Grímsvötn eruption interrupted airlines in whole Europe for one week.
Icelandic financial crisis boomed due to influence from all over the world. Iceland’s systemic banking collapse was the most extensive experienced by any country in economic history.
Iceland joins the European Economic Area.
Third Cod War with British for 200 nautical miles.
Second Cod War with British for 50 nautical miles.
Iceland joins Nordic Council.
First Cod War with British for 12 nautical miles.
The immediate post-war period(World War II) was followed by substantial economic growth, driven by industrialization of the fishing industry and the US Marshall Plan program.
Iceland formally became a republic country. And the first president is Sveinn Björnsson.
The Althing replaced the King with a regent and declared that the Icelandic government would take control of its own defense and foreign affairs during World War II.
Iceland became a fully sovereign and independent state in a personal union with Denmark.

Denmark granted Iceland a constitution and limited home rule. Moreover, Hannes Hafstein served as the first Minister for Iceland in the Danish cabinet.
Icelandic Commonwealth belonged to Denmark after the Napoleonic Wars.
Icelandic Commonwealth belonged to Denmark–Norway.
People built their homesteads in present-day Reykjavík and established Icelandic Commonwealth, Norwegian-Norse chieftain Ingólfr Arnarson.
Iceland was be found by Swedish Viking explorer Garðar Svavarsson.
Iceland A-7

1900 1940 1950 870 1970 2000
HISTORY, ACTORS
1990 1940 1918 1971 1975 1994 2008 2011 2014 2030 874 1262 1814
TIMELINE :
AND EVENTS
1874
1944 1945
1958
1200 1800
Figure 03. Nautical Area of Three Cod Wars
Figure 04. Norsemen landing in Iceland in 872
Right now, the disappearance of glaciers is developing large-scale glacier tourism. In the town of Húsafell, about 90 minutes from Reykjavik, a sustainable and hospitable campsite attracts both international tourists and Icelandic families to glacier and lava cave tours. Environment and tourism experts from University of Iceland are using participatory scenario planning (PSP) to explore adaptation planning for recreational sites near melting glacier areas. Their study demonstrated that PSP can be a valuable tool to support recreational land-use planning in glacial landscapes, and to improve anticipatory adaptation to potentially undesirable future changes14
03 METHODS TO CONDUCT YOUR INVESTIGATION
The database from The World Bank, The Central Intelligence Agency and other articles provide insights on the environment, economy, policy, and history of Iceland with objective and rational recolonization. Specifically, the data of CO2 emissions presented that Iceland’s carbon emissions have been decreasing year by year, indicating that sustainable construction has been practical. I will research ecological projects to explore how Iceland adapts to climate change.
Google Earth and photographs will provide a lens to three-dimensional Iceland. For technique, I will use OpenStreetMap and GIS for mapping and continue my study on Iceland’s topography.
Online news and social media illustrates that tourism development has played a decisive role in recreational land-use planning. Researching critiques will help me analyse Iceland’s campsites.
Theories and Methods of Urban Design Winter 2020 A-8
14. Welling, Johannes, Rannveig Ólafsdóttir, Þorvarður Árnason, and Snævarr Guðmundsson. “Participatory Planning Under Scenarios of Glacier Retreat and Tourism Growth in Southeast Iceland.” Mountain Research and Development 39, no. 2 (2019).
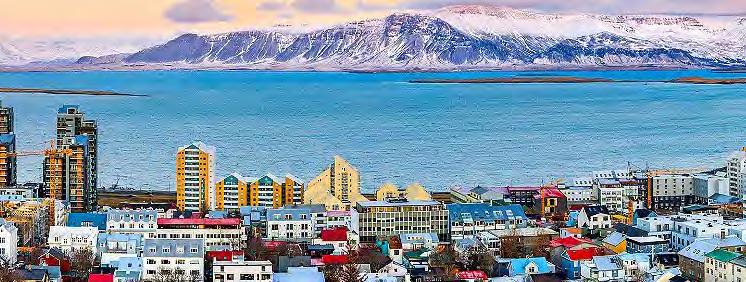
Figure 05. Community in Reykjavik
05 ANTICIPATED FINDINGS
Three case studies will illustrate the importance of sustainable development in Iceland under the crises of the climate change--runways to greenways, Vik campsite, and ReykjavIk Municipal Plan 2010-2030.
Three cases illustrate different ways under the crises of global warming. The first case, which is related to ecological urbanism, introduces environmental strategies in renovating abandoned areas and supporting services for the nearby community. The second case illustrates ephemeral urbanism, an approach of protecting the environment against tourism development. And for the third one, I will attempt to discuss climate change mitigation.

Iceland A-9
Figure 06. Landscape in Iceland
0 1 mile
SITE
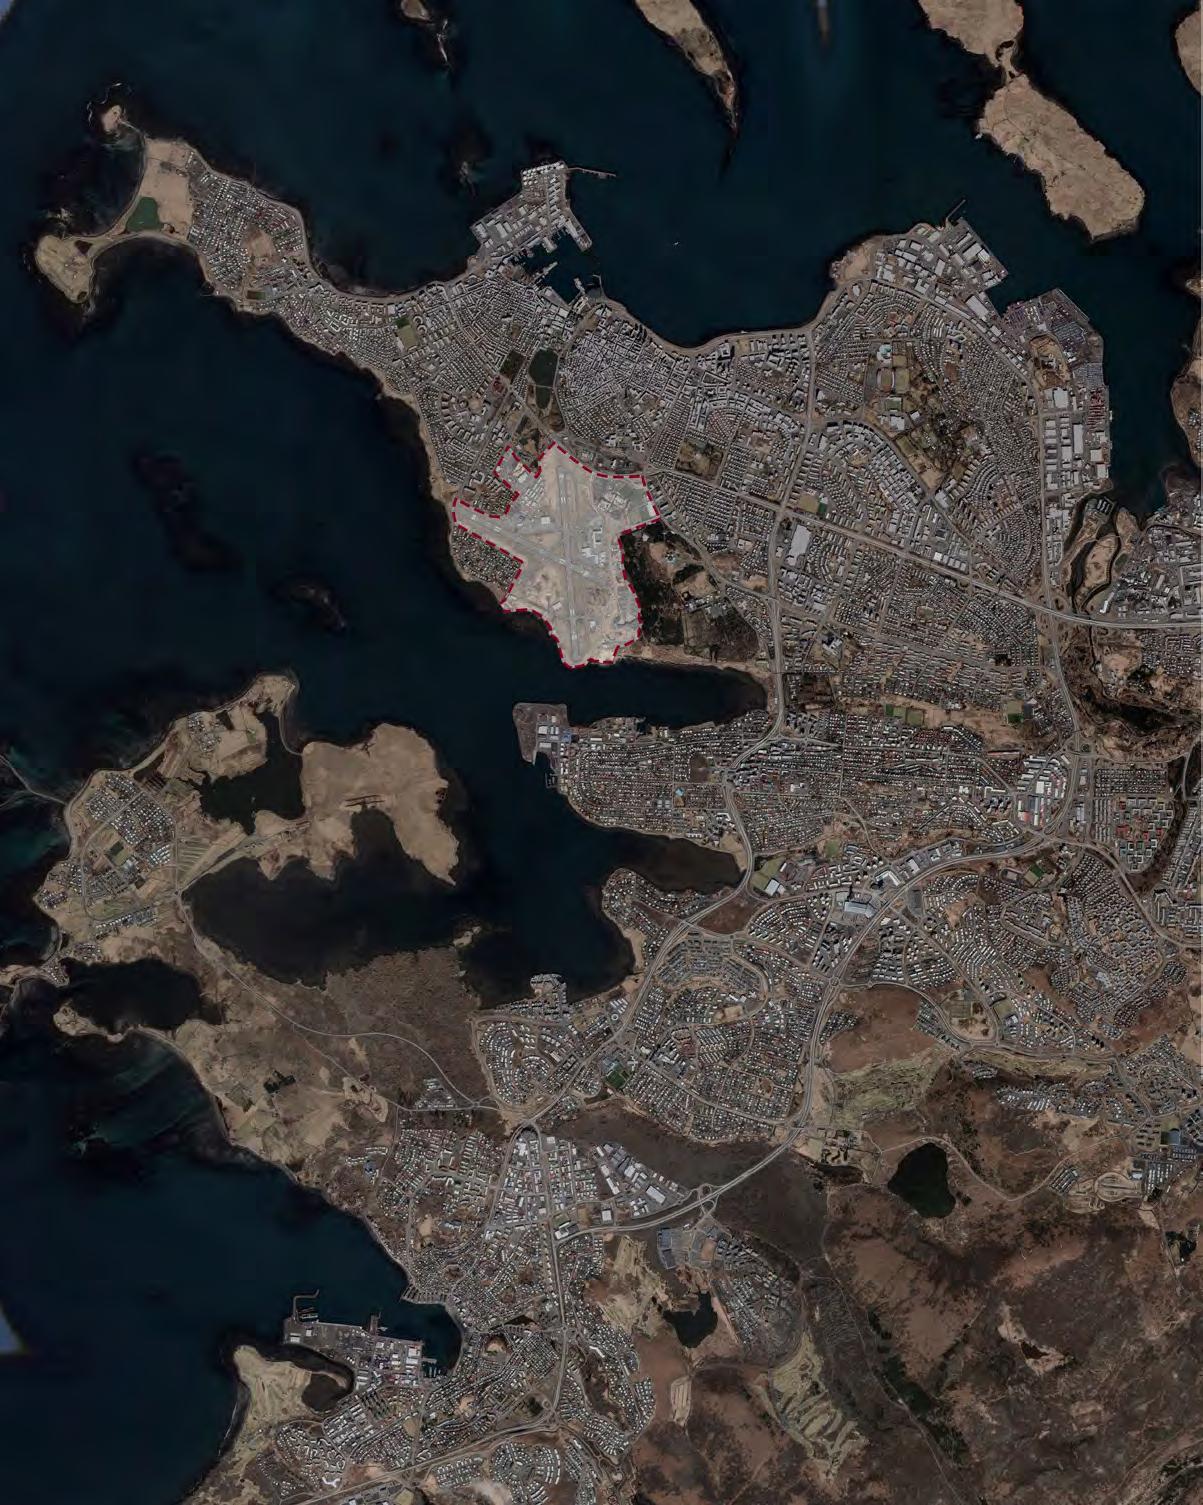
Figure 07. Aerial view of the Runways to Greenways
Theories and Methods of Urban Design Winter 2020 A-10
Location Year(s) Status Footprint Designer
Additional Agents
Key Project Components Program(s)
Key Project Components Program(s)
Funding Streams
RUNWAYS TO GREENWAYS [ECOLOGICAL URBANISM]
A 2007 international competition organized by capital Reykjavik invited architects, urban designers, and planners to discuss the future of an abandoned World War II airfield and its surrounding 150 hectares, located Vatnsmyri15. The Runways won the first prize and proposed a city, self-sufficient with respect to energy, agriculture, water, while addressing the development potentials of technological enterprises for the region.
[Reykjavik, ICELAND]
[2007]
[Unbuilt]
[N/A]
[Lateral Office]
[The site is a defunct World War II runway established by the Americans.]
[The three large greenways are programmed as: ecology, recreation, and production.]
[This area is mainly divided into four quadrants, which correspond to 4 primary urban block typologies: permeable perimeter block, porous folded block, stacked campus and pixelated residences. ]
[Public]

0 1 mile Administration Area Road River Iceland A-11
15. WHITE, MASON, and LOLA SHEPPARD. “Productive Urbanisms.”
Figure 08. Cartography of the Runways to Greenways
THE RUNWAYS TO GREENWAYS AND THE ECOLOGICAL URBANISM
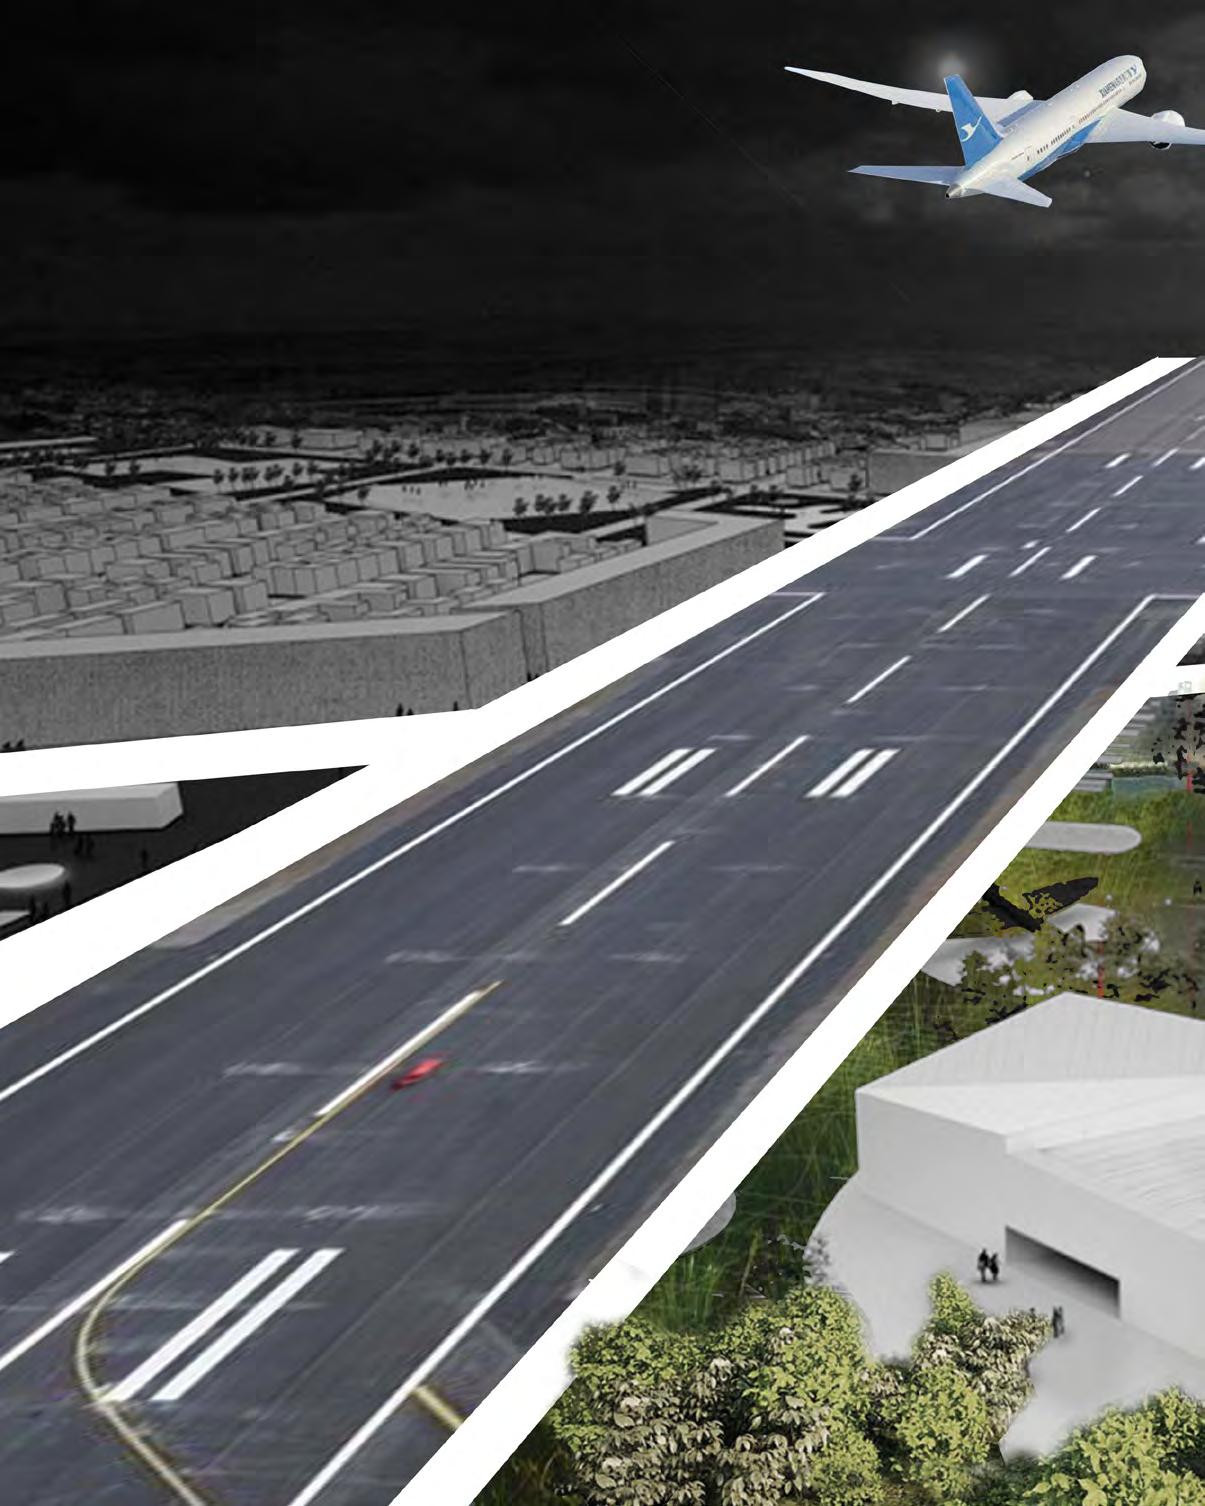
Runways to Greenways, an urban design proposal for the Vatnsmýri area of Reykjavik, aims at reusing three defunct World War II runways and looks forward to new public space and ecological regeneration strategies. The project establishes “no-build” zones and public landscapes. The figure of the runway is used to identify three primary axes. Three former runways are converted into a “greenway” programmed as: ecology, recreation, and production16.
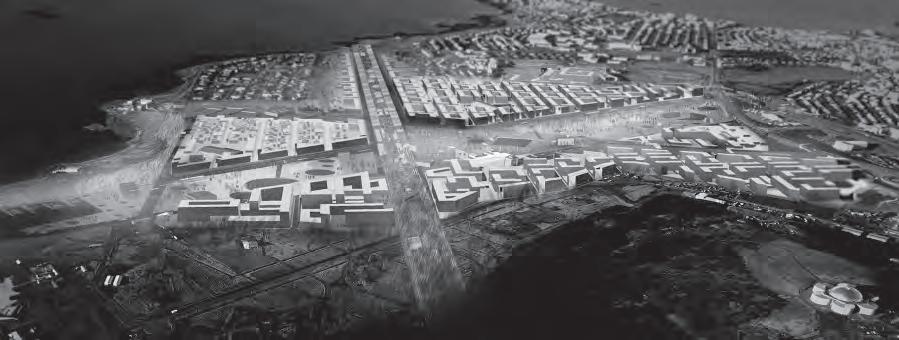
Matthew Gandy mentions, “ecological urbanism deals with urban design in terms of methodology”17and this project depends on a strategy that considers energy use, ecology and land use when integrating public amenities. The premise of the project is to use ecology as a catalyst for urban development. This proposal identifies exterior space as equally charged with activity, use, and event as built or interior spaces. The objective of this project is to propose a city that is selfsufficient in terms of energy, agriculture and water for ecological urbanism in Vatnsmyri area18. The integrated infrastructure calls for a symbiotic relationship between ecological urbanism and nature, and between energy consumption and production in an effort to pair infrastructure, landscape, public amenities and architecture in a culturally, economically and environmentally productive urban realm. For example, production greenway is a program centered on economies of food and energy production. It capitalizes on the benefits of abundant energy and a tradition of high-tech agriculture, to propose a productive landscape within the center of the city, both eliminating local transport and putting people in direct contact with food and energy production19
While form and program are carefully considered, unfortunately, this project lacks a more in-depth exploration of ecological urbanism in terms of economy and social strategies for connecting with the city.
16. ATERAL OFFICE. Accessed March 27, 2020. http://lateraloffice.com/filter/Energy/ RUNWAYS-GREENWAYS-2007-08.
17. Gandy, Matthew. “From urban ecology to ecological urbanism: an ambiguous trajectory.” Area 47, no. 2 (2015): 150-154.
18. Waldheim, Charles. Landscape as urbanism: A general theory. Princeton University Press, 2016.
19. WHITE, MASON, and LOLA SHEPPARD. “Productive Urbanisms.”
Theories and Methods of Urban Design Winter 2020 A-12
Figure 09. Rendering of Runways to Greenways

0
Ecology
Figure 10. Figure Ground Plan of the Runways to Greenways
1/4 mile
Production Recreation Corridor Iceland A-13


Theories
and Methods of Urban Design Winter 2020 A-14
Figure 12. Taxonomy of the Runways to Greenways
Runways figure
Greenways figure
Figures superimposed
Figure 11. Transect of the Runways to Greenways

Runway New Block Iceland A-15
Source Intended User Winner Policy Propose Phase Vatnsmyri Masterplan Design
City Vatnsmyri Area Government Phase I (selected); Phase II Lateral Office Citizen
Figure 13. Actors of the Runways to Greenways
Initiator Fund
Competition
Theories
and Methods of Urban Design Winter 2020 A-16
Figure 14. Collage of the Runways to Greenways

Iceland A-17

0 1/2 mile SITE
Theories and Methods of Urban Design Winter 2020
A-18
Figure 15. Aerial view of the Vik Campsite
20. “Www.vikcamping.is.” www.vikcamping. is. Accessed March 27, 2020. http://www. vikcamping.is/.
VIK CAMPSITE [EPHEMERAL URBANISM]
Camping is cheap, but is also a good way to experience nature and has a lower impact on the environment. The high tourist season in Iceland is from late May to August and campsites will be extremely crowded during this time with both vans and tent campers. However, some campsites are only open from spring to early fall20.
Location Year(s) Status
Footprint Designer

Additional Agents
Key Project Components Program(s)
Funding Streams
[Vík í Mýrdal, ICELAND]
[2018]
[Ephemeral]
[N/A]
[Vik Camping]
[The campsite has a capacity of 250 people and there is always a space for one more tent or car.]
[Vik campsite offers accomodation in 4 cottages at the camping ground.]
[N/A]
[Private]
0 50 mile Administration Area Road River Compsite Iceland A-19
Figure 16. Cartography of the Vik Campsite
THE VIK CAMPSITE AND THE EPHEMERAL URBANISM
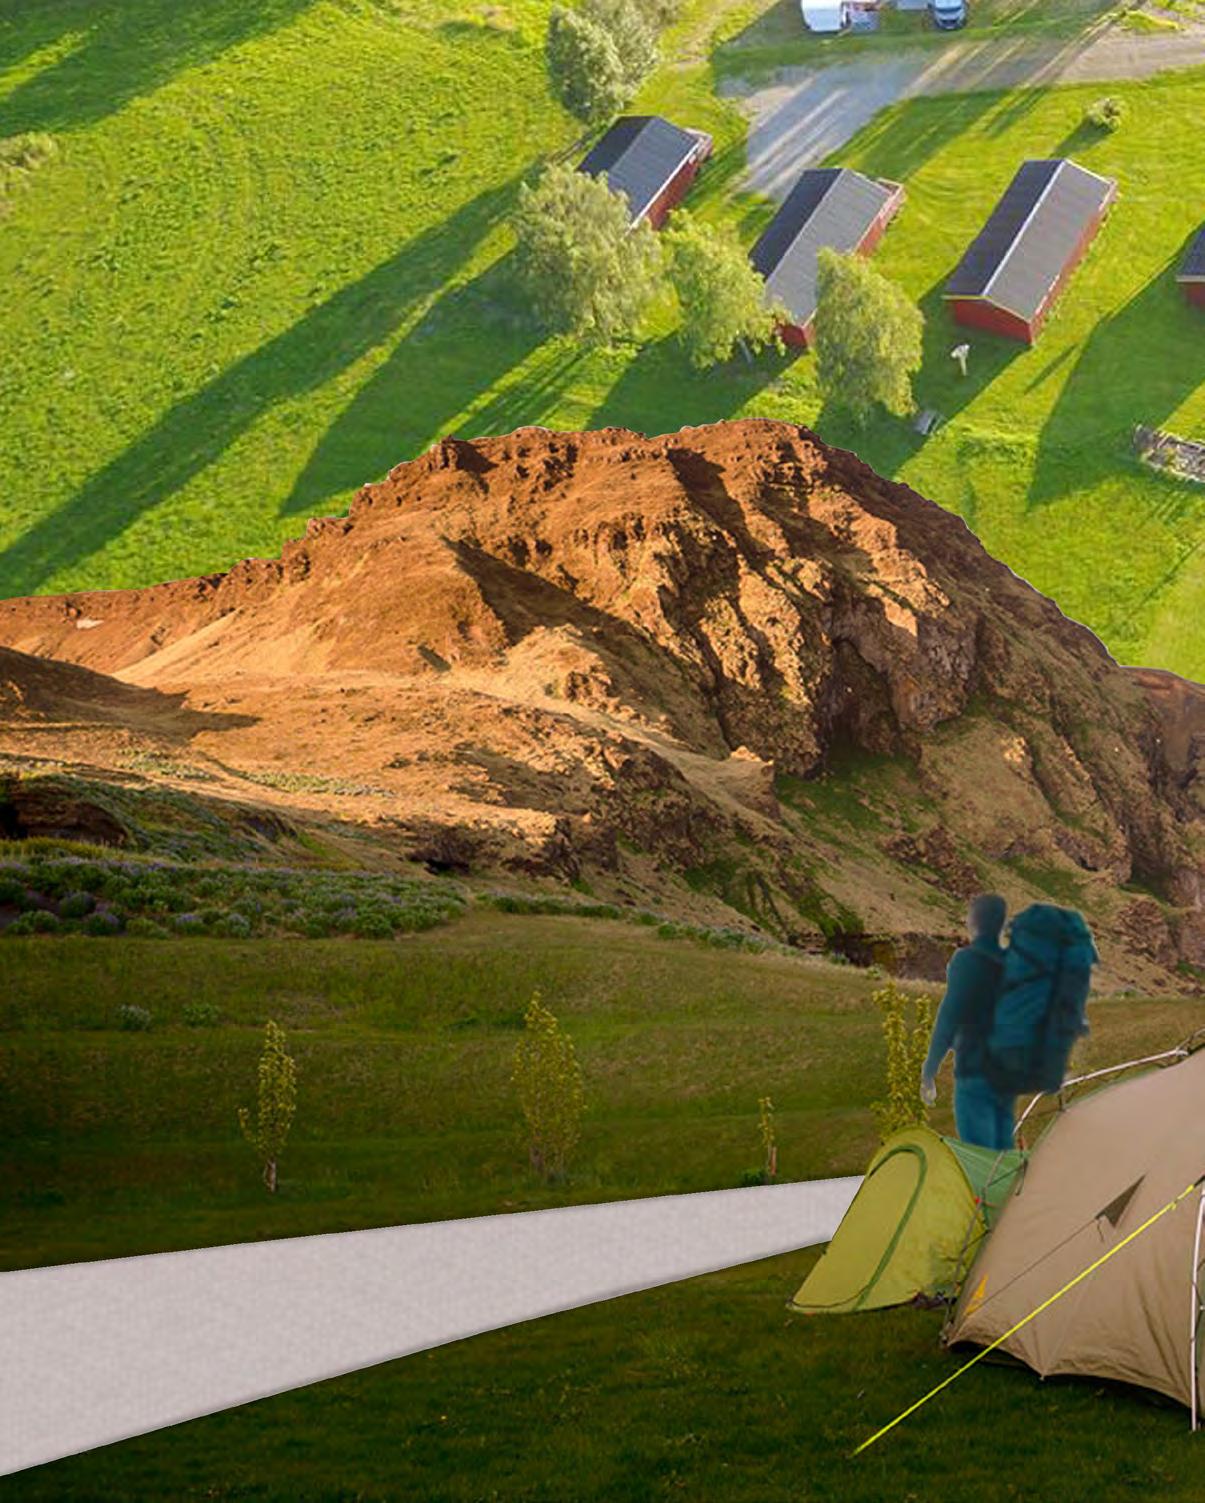
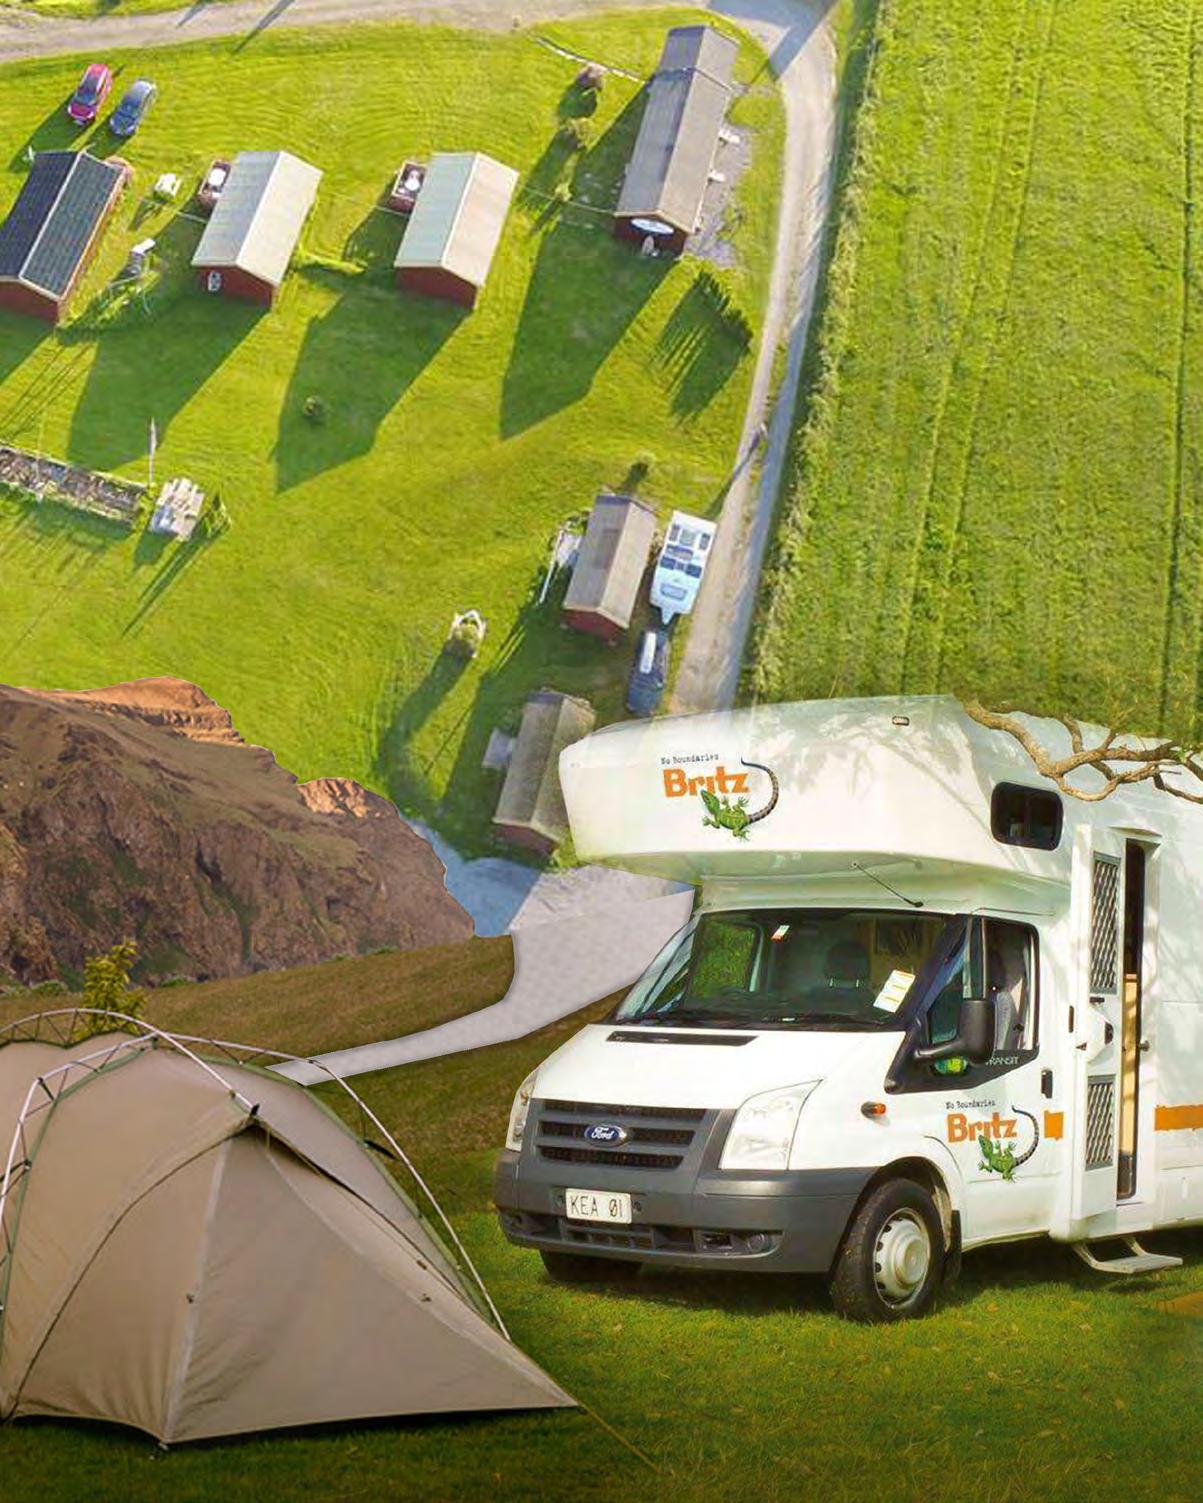
Campsites can be considered as ephemeral urbanism since this kind of construction is more like a quick response to tourism’s requisition and climatic conditions in specific seasons. Ephemeral urbanism for this project is not only about deployment and disassembly different from the characteristic of stability of the permanent hotels or Airbnbs. it is more related to the negotiation between tourists, designers, and institutions or companies for managing users’ requisitions21.It means that enough flexibility and affordability satisfying every party will make the maximum profits.
There are over 170 campgrounds in Iceland for citizens and tourists. Every village has its campground and people can camp at a specific time. Increasing numbers of tourists who damaged the environment, prompted the government to enact new laws responding to negative influence of tourism. In November 2015, new conservation legislation came into effect making changes to where it is permissible to camp22. Moreover, for protecting the environment, some campsites are only open during the hot season. For example, the Vik Campsite is an ephemeral housing region, opening from spring to early fall. Vik Campsite is located 1 km from Vik, the southernmost village in Iceland. The cottages in the site can accommodate up to 250 people in tents, cabins, cars and caravans. On the campsite, the service buildings offer most of the services required by campers, electricity, toilets, warm and cold running water, shower, WiFi and dining facilities23.

The issue is that these campgrounds are vacant without any activities or urban development during slow periods and the shoulder season. What’s worse, single land-use structure is lack of economic resilience. For example, a little decline in tourism shows how the slowdown affected the ephemeral campsites. Hotel stays were flat year-over-year, while Airbnb stays dropped 11 percent. However, campsites declined a massive 30 percent24. Under these issues, urban designers and planners should activate the vitality of campgrounds during slow periods for more flexibility and affordability.
21. Mehrotra, Rahul, and Felipe Vera. “Ephemeral urbanism: Looking at extreme temporalities.” In In The Post-Urban World, pp. 44-55. Routledge, 2017.
22. “May I Camp Anywhere?” Umhverfisstofnun. Accessed April 21, 2020. https://www.ust.is/2016/06/30/May-I-campanywhere-/umhverfisstofnun/frettir/stokfrett/.
23. “Www.vikcamping.is.” www.vikcamping. is. Accessed March 27, 2020. http://www. vikcamping.is/.
24. Lenhart, Maria, Skift, Andrew Sheivachman, Raini Hamdi, and Skift. “The Rise and Fall of Iceland’s Tourism Miracle.” Skift, September 11, 2019. https://skift.com/2019/09/11/the-riseand-fall-of-icelands-tourism-miracle/.
Theories and Methods of Urban Design Winter 2020 A-20
Figure 17. Vik Campsite

0 1/4 mile 0 1/4 mile Iceland
Park Sea Forest Water Building Non-tourist Season High Tourist Season Tent RV
A-21
Figure 18. Figure Ground Plan of the Vik Campsite


Theories and Methods of Urban Design Winter
A-22
2020
Figure 19. Transect of Vik Campsite
Cottage Service RV Tent
Figure 20. Taxonomy of Vik Campsite
Cottage

Owner Fund Source Tool Intended User Policy Private Private Property Vik Government Tourist and Citizen Private tent and RV Iceland A-23 Tent Service
Figure 21. Actors of Vik Campsite
 Theories and Methods of Urban Design Winter 2020 A-24
Figure 22. Collage of Vik Campsite
Iceland A-25

0 1 mile SITE
Figure 23. Aerial view of Reykjavik
Theories and Methods of Urban Design Winter 2020 A-26
25. Daniels, Andrew. “Iceland’s Radical Plan to Slow Climate Change.” Popular Mechanics. Popular Mechanics, May 9, 2019. https://www. popularmechanics.com/science/green-tech/ a27410266/iceland-fighting-climate-changecarbon-storage/.
26. Halldórsdóttir, Katrín. “Densification as an Objective Towards Sustainable Planning in Reykjavik. Case Study: A Redevelopment Plan for the Ellidaarvogur Area.” PhD diss.
REYKJAVIK MUNICIPAL PLAN 2010-2030 [CRISIS URBANISM]

Iceland is experiencing climate change caused by carbon emissions, with great transformations in melting glaciers and dramatic changes in weather patterns. Iceland decided to cut its greenhouse gas emissions by 40 percent by 2030. However, its carbon emissions actually rose by 2.2 percent from 2016 to 201725. To decline carbon emissions in Reykjavik, urban planners proposed the Municipal Plan for Reykjavik between 2010 and 203026.
Location Year(s) Status Footprint Designer
Key Project Components Program(s)
Funding Streams
[Reykjavik, ICELAND]
[2010-2030]
[In Progress]
[whole Reykjavík]
[Gísli Marteinn Baldursson and his colleages]
[Traffic plan for public transportation] [Spot On] [Public ]
0 2 mile Administration
Road
Iceland A-27
Area
River
Figure 24. Cartography of Reykjavik
THE REYKJAVIK MUNICIPAL PLAN 2010-2030 AND THE CRISIS URBANISM

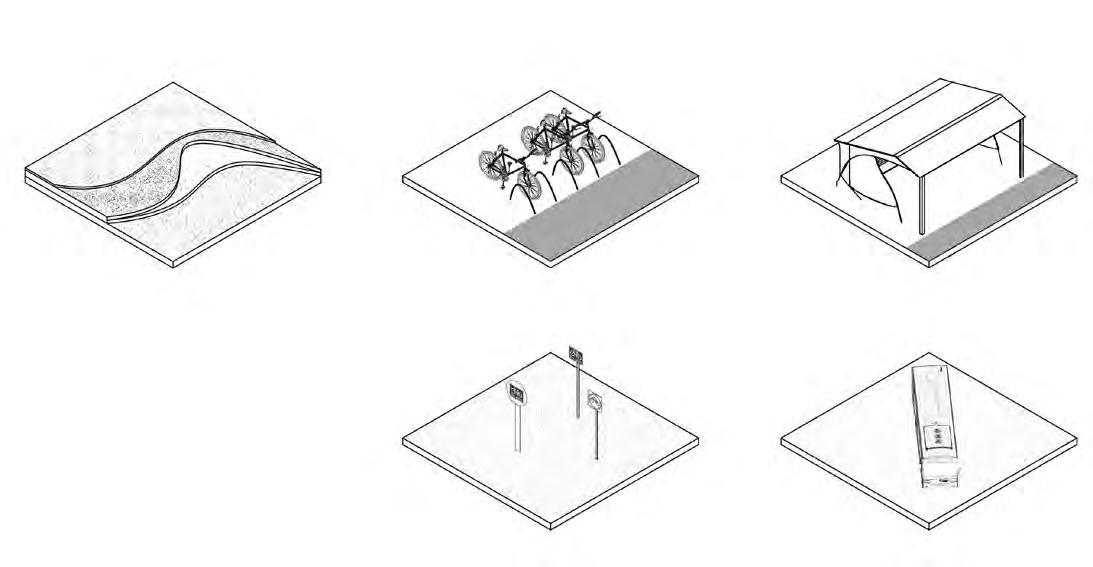
There are two proposals for reducing carbon emissions in Reykjavík. The first one proposes radical changes in earlier policy on the development and evolution of transport in order to deal with the issue of climate change27. Only 17.8 percent of Icelanders used public transport regularly in 2014, according to figures from Statistics Iceland. This plan for public transportation development will reduce 12% CO2 emissions (metric tons per capita). Compared to the traditional approach of increasing the road capacity, the proposal minimised traffic delays during peak periods. The main emphasis is placed on encouraging other means of transportation than the private car and thus minimise motor traffic and the pressure it puts on the street system28. For the transportation caused by tourism, the main criterion is to hold back the increase of traffic by encouraging change in tourists’ travel habits. This proposal should result in only an insignificant increase in car traffic during the planning period despite the increase in population and jobs.
Moreover, the Municipal Plan also proposes sustainable neighbourhoods, creating more green space and ecological community for absorbing carbon emissions29. Moreover, It seems that the crisis of climate change can then provide dramatic urban recoveries. This proposal will strengthen the nature, landscape and recreational areas of the city as part of a better quality of life and improved public health for residents. For example, foresting the island with native birch trees in Geldingane simultaneously preserved the area as a green space and provided a carbon sink for the city.
Theories and Methods of Urban Design Winter 2020 A-28
Figure 25. Diagrams of Reykjavik Municipal Plan 2010-2030
27. Hokoda, Emma. “Three Land Use Proposals for Geldinganes Framed by the City of Reykjavik’s Municipal Plan and Climate Neutrality Goals.” (2018).
28. Eboli, Carolina Cardoso Pera. “Urbanisation control lab: Icelandic perspective on urban planning for rapid urbanisation.” Proceedings of the Institution of Civil Engineers–Urban Design and Planning 171, no. 2 (2018): 77-86.
29. Eboli, Carolina Cardoso Pera. “Urbanisation control lab: Icelandic perspective on urban planning for rapid urbanisation.” Proceedings of the Institution of Civil Engineers–Urban Design and Planning 171, no. 2 (2018): 77-86.


sustainable neighbourhoods 0 1mile 0 1mile Iceland A-29 Water Water Walking Zone Riding Zone Road Road Administration Area Administration Area Public Transportation New Green Space
26.
Ground
Figure
Figure
Plan of Reykjavik

Theories and Methods of Urban
A-30
Design Winter 2020
Figure 27. Transect of Reykjavik
Figure 28. Taxonomy of ReykjavIk Municipal Plan 2010-2030
Green Space
Sharebike
Bike Sign
Public Bus
Bike Route
Bus Station
New Green Space

Initiator Publication Comment Fund Source Cooperation Intended User Policy Designer Environment and Planning Committee Guðjón Ó Printing Office National Planning Agency City City of Reykjavík Department of Planning and Environment 9 reports from public Citizen transportation system and landscape system Iceland A-31 Route New Green Space
Figure 29. Actors of ReykjavIk Municipal Plan 2010-2030

Theories
and Methods of Urban Design Winter 2020 A-32
Figure 30. Collage of Reykjavik
 Iceland A-33
RUHR VALLEY GERMANY
01 IDENTIFICATION OF THE TERRITORY AND LOCATION
The Ruhr Valley, also known as the Ruhr Region, consists of over 53 towns and municipalities organised into a polycentric structure. With a population of over five million, the region is one of the largest metropolitan areas in Europe.1 The region lies along the course of the Ruhr River, Lippe River, and Emscher River that are the main tributaries of the Lower Rhine. The Ruhr Valley stretches 116 kilometers across from east to west and over 67 kilometers from north to south. 2
Transformed into one of the greenest areas in Germany nowadays, the Ruhr Valley has more than half of the land cover being either agriculture or green space. However, back in the mid-twentieth century, it was mining and the steel industry that dominated the Ruhr region because the natural landscape of the valley gave birth to the smaller scale mining in the first place. The industrial facilities in the area covered 200 hectares between the coal mines, the production facilities, and factories of steel and the assembly and transportation network of rails.3 The decline of the industry in the second half of the 20th century left behind a large number of areas underutilized and with high levels of pollution in both soil and water. As a result, the area was once characterized by environmental damage and low life quality.4 With the ongoing regional revitalizations, the green industry meets traditional industry heritage in the Ruhr Valley.5
1. Metropole “METROPOLIS RUHR CITY OF CITIES.” Accessed Jan. 2020. https://www. metropole.ruhr/en/
2. Hospers, Gert-Jan & Wetterau, Burkhard. Small Atlas Metropole Ruhr: The Ruhr region in transformation. 2018.
3. JOSÉ JUAN BARBA, ANDREA PORTILLO, METALOCUS, “THE EMSCHER LANDSCAPE PARK”. Accessed Jan. 2020. https://www.metalocus.es/en/news/ emscher-landscape-park
4. Gruehn, Dietwald. “Regional planning and projects in the Ruhr region (Germany).” In Sustainable landscape planning in selected urban regions, p. 216. Springer, Tokyo, 2017.
5. Hospers, Gert-Jan & Wetterau, Burkhard. Small Atlas Metropole Ruhr: The Ruhr region in transformation. 2018.
02 RELEVANCE FROM THE POINT OF VIEW OF URBAN DESIGN THEORY AND PRAXIS
During the last few decades, the Ruhr Region has managed structural change towards a climate-friendly future. The actions are recognized while the coal and steel industries have been shrinking to “death” since the short peak after world war two. The changes have impacted the political structure, culture, and environment. Since the 1960s, higher education, such as universities and colleges, are invested and so do business innovation initiatives. In order to reverse the poor environmental condition and unhealthy image associated with the area, the Ruhr Valley planned the International Building Exhibition (IBA) Emscher Landscape Park, a regional greenway, to mitigate the pollution and provide recreational opportunities. The industrial remains have been reprogrammed into cultural and art incubators to accommodate the diverse cultures.6 In addition, there has been a shift from the fuel industry to renewable energy as the new focus on solar and wind power installations in populated areas. 367,400 green jobs have been created by 2010. 7
This regional case serves as a prototype from where other cities and regions that are facing similar problems can learn. The research highlights the regional scale and municipal cooperation, the role of design in providing a new imaginary for the region, and particularly, the role of the landscape and ecology in addressing transformation.
6. Keil, Andreas, and Burkhard Wetterau. Metropolis Ruhr: A regional study of the new Ruhr. Regionalverband Ruhr, 2014.
7. Gruehn, Dietwald. “Germany Goes GreenInnovations towards a Sustainable Regional Development.” World Technopolis Review 1, no. 4 (2013): 236.
Theories and Methods of Urban Design Winter 2020 A-34
[Critical DATA]
Geographical Delimitation
In North Rhine-Westphalia province, Western Germany. The triangle of Duisburg-Recklinghausen-Dortmund is the heart of the region.
Area
4,439 km²
200 hectares of industrial land
39% Agricultural land, 18.3% Woodland8
Population
5 million [as of 2020] estimate to shrink to 4.8 million by 2030
Social Indicators
Major cities such as Dortmund, Essen and Duisburg have more than 500,000 inhabitants. The rest of the region remian suburb feeling density.
13 % foreigners in the region comes from nearby countries as guest workers. Refugees from Near East increase the diversity in large cities to 19% lately.9
Economic Indicators
Transform from steel-coal industry to a diverse share of education, health system, public services, retail tourism, green tech and renewable energy. Redevelopment of urban openspaces increases land values in cities. 10 Seek oppotunity as shrinking with focus on senior service.
Environmental Indicators
Ruhr River, Lippe River and Emscher River as main waterways.
18.3 % of the land is woodland which is previous to ecosystem. Retoration of Emscher River that use to be a polluted water drain.
8. Keil, Andreas, and Burkhard Wetterau. “Metropolis Ruhr.” A Regional Study of the New Ruhr. Regionalverband Ruhr, Essen 2013.
9. Hospers, Gert-Jan & Wetterau, Burkhard. Small Atlas Metropole Ruhr: The Ruhr region in transformation. 2018.
10. Gruehn, Dietwald. “Germany Goes GreenInnovations towards a Sustainable Regional Development.” World Technopolis Review 1, no. 4 (2013): 236.
Ruhr Valley A-35
Ruhr
GERMANY
Valley
Figure 01. The map of Ruhr Valley location.
Urbanisms often emerge as a response to the drastic change in society. The cases in the Ruhr Valley reflect those urbanisms such as post-industrial urbanism, landscape urbanism and ecological urbanism. The revitalization started at a postindustrial era tackling shrinkage issues. Many of the solutions use landscape as the medium to naturalize, soften, and activate the space for a more open and relaxing atmosphere. In response to pollution and degradation, restorations in all scales offer an opportunity for a culturally, economically, and environmentally sustainable future.

Back to the origin of urbanisms, it denotes a comprehensive study towards the cities, including social, environmental, and political aspects. Predecessors study the cities through observations, synthesis, and even criticisms. German sociologist Georg Simmel’s study in The metropolis and mental life 11 differentiates the meaning of city and urbanism by pointing out the social aspects related to urban life in the cities. According to the book Urbanism as a Way of Life 12, Louis Wirth tries to define characteristics of urban life and identify a framework like a sociologist. Historian Françoise Choay concludes the history of urban studies that started from industrial time and introduces urbanism as the modern stage of the studies evolved from “Regularization”, “Pre-urbanism”.13 The research not only informs urbanists on facts, relations of the phenomenons, but also the methodology of the study of the cities.
03 METHODS TO CONDUCT YOUR INVESTIGATION
The author views the Emscher River, the natural symbol of the area, to be a thread that connects all the cases on multiple levels. Land-based strategies are the main focus of the study. To have a broad understanding of the region as a whole, the author started the research on the background information. The investigation includes the master plans about the transformation of the area and its consequences. Regional planning reports introduce the natural system and social characteristics and history of the area. Based on the understanding of the region as a whole with natural, social, and development history, the author conducted a timeline with the critical events that reveal catalysts and milestones.
Theories and Methods of Urban Design Winter 2020 A-36
Figure 02. Aerial view of Emscher river, Rhine-Herne Canal, Emscherkunst.
11. Simmel, Georg. “(1903)‘The Metropolis and Mental Life’.” The Sociology of Georg Simmel (1950): 409-424.
12. Wirth, Louis. “Urbanism as a Way of Life.” American journal of sociology 44, no. 1 (1938): 1-24.
13. Choay, Françoise. “The modern city: planning in the 19th century.” 1969.
TIMELINE : HISTORY, ACTORS AND EVENTS
Figure 04. Ruhr Industry.
2000
“Handlungsprogramm zur räumlichen Entwicklung der Metropole Ruhr(Action programme for the spatial development of the Ruhr metropolis)” released by RVR in German
Regionalverband Ruhr (RVR) took over the Kommunalverband Ruhrgebiet (KVR) with expanded rights.
1800 1990
After 10 years’ programme, the The International Building Exhibition (IBA) Emscher Park began into work.
1959 1956 1952 1929 1913 1899
1850 1900 1851 1849 1847 1837 1893 2018 2004 2001
1995 1985 1982 1965 1999 2020 2010 1598
North Rhine-Westphalia at this time had the highest levels of smog in Germany.
Area wide protests by steelworkers against closures and lay-offs in the Ruhr. The last blast-furnace between Duisburg and Dortmund is closed down in Gelsenkirchen.
The Ruhr university which is the first university in the Ruhr area opened in Bochum.
The Zechensterben (death of the mines) began with the protest against the import of cheap American coal in Bonn.
The International Ruhr Authority ceased their work and was taken over by the European Coal and Steel Community which is the seed of the later European Union.

The world economic crisis caused the export-oriented production of the coal and steel industry to collapse.
The Ruhrreinhaltungsgesetz (law concerned with cleaning up the Ruhr) introduced laws that contributed in regulating the dam and ensuring the water supply of the growing conurbation.

The Emscher Cooperative is founded, primarily to deal with drainage and flooding measures in the Ruhr generally.

Formation of the Rhenish-Westphalian Coal Syndicate with its head office in Essen, as an association of a large number of Ruhr mines.
Zollverein Coal Mine begins operating.
Ruhr made smelting iron ore with coke for the first time.
The first steam locomotive to travel along the Ruhr valley, on the SteeleVohwinkler Railway.
The Kronprinz Mine reached the important deep-lying coking-coal seams of the Emscher Basin
In Holzwickede the development of mining is mentioned in document
Ruhr Valley A-37
Zollverein Coal Mine Industrial Complex becomes a UNESCO World Heritage Site. 1600 1950
Ruhr iron industry reached the peak on demand for coal and the number of workers in the area at 124,6 million tonnes per year and 494,000 people.
The Ruhr becomes a part of the newly defined European metropolitan area Rhine-Ruhr.
Figure 03. Emscher River before and after its renaturation in the city of Dortmund.
Figure 05. Aerial view of shaft xii in Zollverein.
Design reports, including the description for different projects from regional to local scales, state the details of the process of the transformation. The examination on spatial characteristics of a series of real cases includes visualizations of the projects’ cartographic inventory, critical design elements, and collage that reflects the dynamics. The author focused on the landscape aspect with an assembled representation of aerial photos, geoinformation data such as land use, and 3d models. Diagrams depict the relationship among all actors and reveal the social dynamics of the process. Moreover, literature done by scholars asserts critical perspectives and investigation towards the planning and design of the region. Similar to the study of urbanism, this research integrates the data, analysis and author’s reflection of related urbanisms based on practices in the Ruhr Valley.
04 ANTICIPATED FINDINGS
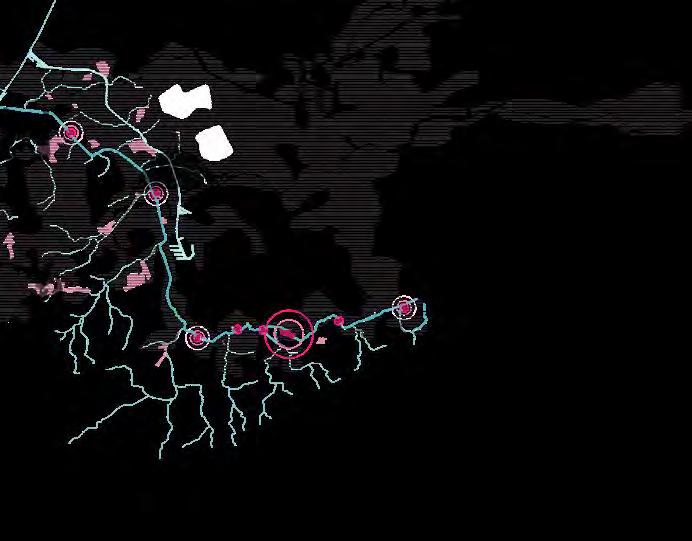
The research provides a unique perspective that builds on the understanding of environmental features and the landscape of the Ruhr Valley. On the regional scale, the IBA Emscher Landscape Park, the Emscher Conversion and the Duisberg master plan set the top-level structures and backbones that take measures regarding the urban, social, cultural, and ecological development of the area. Those plans and initiatives are realized with local projects, among which the author chose three of them that are representative of the area.
Those three cases represent the region on diverse scales under similar situations, which is the shrinkage of the industry and the urban area as well. Even though three projects have diverse focuses and outcomes, the thread of the research can be found as the landscape as the toolkit and waterways as the main topics.
Acknowledging the role of this area back in the industrial epoch, the Zollverein Park is hard to be ignored since this site is created as the park. It serves as the natural connection between two post-industrial developments in the Zollverein Coal Mine Industrial Complex. 14 Lake Phoenix project is part of the large-scale Emscher river restoration project with surrounding development. Since the Emscher renaturation and water management are considered the main approaches of the regional plan,

Theories and Methods of Urban Design Winter 2020 A-38
IBA Emscher Park
Figure 06. IBA Emscher Park and project location.
14. Planergruppe Oberhausen , Zollverein Park- A park evolves, Avda.vademarin,68;28023 Madrid, 2018. Accessed Mar. 2020. https:// www.planergruppe-oberhausen.de/zollvereinpark/
15. Peet, R. “A greener tomorrow: Water management in urban redevelopment.” Dortmund, Germany, ICLEI Case Study (2016).
16. Agence Ter, Averdung Platz, 2011, Accessed Jan. 2020. http://landezine.com/index. php/2011/11/duisburg-agence-ter-landscapearchitecture/
10 mile

Averdung Plaza
Zollverein Park
Lake Phoenix
Ecological Development Center
Ecological Corridor
Emscher River
Other Waterway
Emscher Landscape Park
Preserved Area
Lake Phoenix project showcases the potential of comprehensive urban sustainable development to facilitate the ecological and economic wellness of the area with a collaborative process.15 Averdung Plaza, a smaller scale project which is a civic plaza would call out the unique perspective from landscape architects featuring the urban social space by greenness. 16
Together, those real cases with landscape components and ecological focus may reveal the truth. It is that landscapes that serve as the base and usually forgotten in the urban analysis can play an essential role in the environment-based transformation and regional urban developments. The way it works in the Ruhr Valley is through the consistency of a well-engaged top-down planning system, the interdisciplinary collaborations, and, most importantly, the human nature of love for “green”.
As an urbanist and a future landscape architect who focuses on urban ecology, the author would like to expand the understanding of urban development and green redevelopment through a broad investigation of urban dynamics in the area and cases with related urbanisms. This research tends to explore the Ruhr Valley with its history, development and especially design projects to learn the process as reference for transformation plans all over the world. Similar regions include the Detroit metropolitan area that is part of the Rust Belt in the USA, Kansai in Japan and Northeast Industrial Region in China.
Ruhr Valley A-39
Natural System of The Ruhr Valley

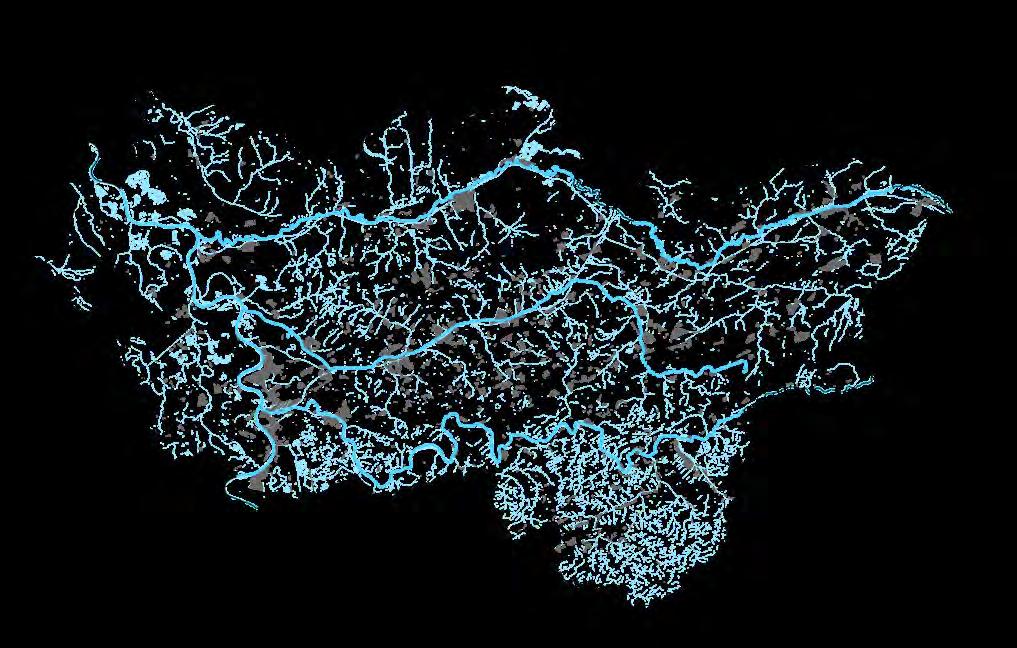
Industries are usually developed along the waterways due to the geological nature and transportation need.
Water
Industrial Development
20 mile
Broad “greenland” can be “the future of Ruhr”
Theories and Methods of Urban Design Winter 2020
Water
Green Open Space
Preserved Area
20 mile
A-40
Figure 07 : Natural system of the Ruhr Valley.
Urban Development Change of The Ruhr Valley


20 mile
Development
Area
Valley A-41
1840
Sprawl” significantly change the land.
1930
Water Urban
Paved
Ruhr
In
“Urban
In
1970 Nowadays
In
08
development
Figure
:Urban
change of the Ruhr Valley.


Theories and Methods of Urban Design Winter 2020 A-42 0 2 mile Essen Zollverein Park Emscher River Legend Stream River Green Space Site Industrial Commercial Landmark
Figure 09. Context of Zollverein Park
17.Ruhr, Regionalverband, ed. Unter freiem Himmel/Under the Open Sky: Emscher Landschaftspark/Emscher Landscape Park. Walter de Gruyter, 2013.
18. OMA, Zollverein Masterplan, Accessed Mar. 2020. https://oma.eu/projects/zollvereinmasterplan
ZOLLVEREIN PARK [POST INDUSTRIAL URBANISM]
Being part of the IBA Emscher Landscape Park “multifunctional blue-green network.” 17, Zollverein Park is the green open space in the industrial complex that sits outside of the city center of Essen. Done by OMA, the masterplan of the complex transforms the factory remains successfully through the idea of “walled city” and the “conservation by conversation” that reuse the structure remains as the introduction of Art and Culture as the new core of life.18
Implemented in 2018, the Zollverein Park serves as the natural connection between two post-industrial developments in the Zollverein Coal Mine Industrial Complex. The designs also help build the natural and cultural connections with the industrial history that is meaningful to the area. This case shows the possibility of a former industrial campus to be turned into a landmark that respects the land and artfully recalls the history.
Location Year(s) Status
Footprint Designer

Additional Agents
Key Project Components Program(s)
Funding Streams
[Essen, GERMANY]
[2005-2018]
[Built]
[Consider both landscape and built...] [Planergruppe Oberhausen]
[Obervatorium, Rotterdam– arts; F1stdesign, Cologne – orientation system; Licht Kunst Licht, Bonn – light design [Green space, Industry plants, Industrial complex ]
[Preserved structure, Open space, Enclosures, Trails, Mixed-use development ]
[Public]
Ruhr
A-43
Valley
Zollverein Park
Lippe River
Emscher River Ruhr River
Essen
Rhein River
Figure 10. Location of Zollverein Park.
ZOLLVEREIN PARK AND POST INDUSTRIAL URBANISM
As a case illustrating the tenets of Post-industrial Urbanism, this project deploys a series of landscape practices regenerating formerly industrial sites. The death of mines and the drastic decline of the coal and steel industry made Ruhr’s 1980s. In response to the need for post-industrial solutions, the International Building Exhibition Emscher Park (IBA) became a workshop to propose the future of the industrial region with a conceptual structural change. This regional project involved 17 cities and 117 projects, and included landscape planning and urban development projects for ecological, economic, and cultural renewal.19 The 10-year long Emscher Landschaftspark (Emscher Landscape Park) was created as an experimental approach to land management strategies and included numerous collaborations, mainly in the public sector.
Planergruppe Oberhausen, the landscape team, proposed the “track boulevard and the ring promenade” as a key feature and a linkage to all the urban development. The landscape is reintroduced into the site accompanied by park scrapes making available necessary new, multifaceted, and robust infrastructure for new activities at Zollverein. 20
Zollverein becomes a park with urban forests, lush shrubs, and open spaces, revealing the view of the post-industrial Art and Cultural center from the treeshaded paths.21 Beyond the typical cleaning-up and repairment, these projects provide the opportunity to preserve the industrial memory and post-industrial identity of the area.22 Despite the achievements of the projects so far, Egberts has criticisms on whether the focus on Industrial culture will remain when facing the shortage of funding.23 This addresses the fact that the establishment of the projects required fundings from major public resource.
19. Internationale Bauausstellung Emscher Park (Hrsg.): Katalog der Projekte 1999, Gelsenkirchen 1999. Accessed Mar. 2020. https://www.internationale-bauausstellungen. de/en/history/1989-1999-iba-emscher-park-afuture-for-an-industrial-region/
20. Planergruppe Oberhausen , Zollverein Park- A park evolves, Avda.vademarin,68;28023 Madrid, 2018, Accessed Mar. 2020. https:// www.planergruppe-oberhausen.de/zollvereinpark/

21. JOSÉ JUAN BARBA, ANDREA PORTILLO, METALOCUS, “THE EMSCHER LANDSCAPE PARK” Accessed Jan. 2020. https://www.metalocus.es/en/news/ emscher-landscape-park
22.Regionalverband, ed. Unter freiem Himmel/Under the Open Sky: Emscher Landschaftspark/Emscher Landscape Park. Walter de Gruyter, 2013.
23. Egberts, Linde. Chosen legacies: heritage in regional identity. Taylor & Francis, 2017.
24. Internationale Bauausstellung Emscher Park (Hrsg.): Katalog der Projekte 1999, Gelsenkirchen 1999. Accessed Mar. 2020. https://www.internationale-bauausstellungen. de/en/history/1989-1999-iba-emscher-park-afuture-for-an-industrial-region/
25. Planergruppe Oberhausen , Zollverein Park- A park evolves, Avda.vademarin,68;28023 Madrid, 2018, Accessed Mar. 2020. https:// www.planergruppe-oberhausen.de/zollvereinpark/
Theories and Methods of Urban Design Winter 2020 A-44
Figure 11. Simple and robust furnishing in Zollverein Park.

Ruhr
Ring Promenade Green
Industrial Area Boundary 0.5
Valley A-45
Space Forest Water
mile
Figure 12. Plan of Zollverein Park.
Regional Corporation
Regional Association of Ruhr
EU, Federal, State
State of North Rhine-Westphalia, 17 cities
Policy
Moderater Regional Plan Local Project
Emscher Landscape Park
Emscher Conversion
Duisburg Master Plan

Funding Expertise
Zollverein Park
Lake Phoenix
Averdung Plaza
Urban Designer, Architect, Landscape Architect, Engineer
Local Government
City of Essen
ZOLLVEREIN PARK DESIGN Transect

The IBA plan has three stages start with an overall strategy, the framework with six topics that focus on regional interventions, and realization by numerous local projects.24 It is the large scale, comprehensive engagement, and cooperation among stakeholders that make the plan a success model.
Featured former trails transform into paths for walkers, joggers, and cyclists. Industrial wastelands were declared nature reserves, leftover industrial land was taken as an opportunity to create a new landscape, and heaps became landmarks. 25
Theories and Methods of Urban Design Winter 2020 A-46
IBA Emscher Park
Figure 13. Diagram of actors of Zollverein Park.
Figure 15. Transect of Zollverein Park during the industrial era and now.


Ruhr
A-47
Valley
Industrial time heaps Taxonomy
Urban Forest
Industrial Wetland
The Ring Promenade
The Track Boulevard
Figure 14. Taxonomy of Zollverein Park.

Theories
and Methods of Urban Design Winter 2020 A-48
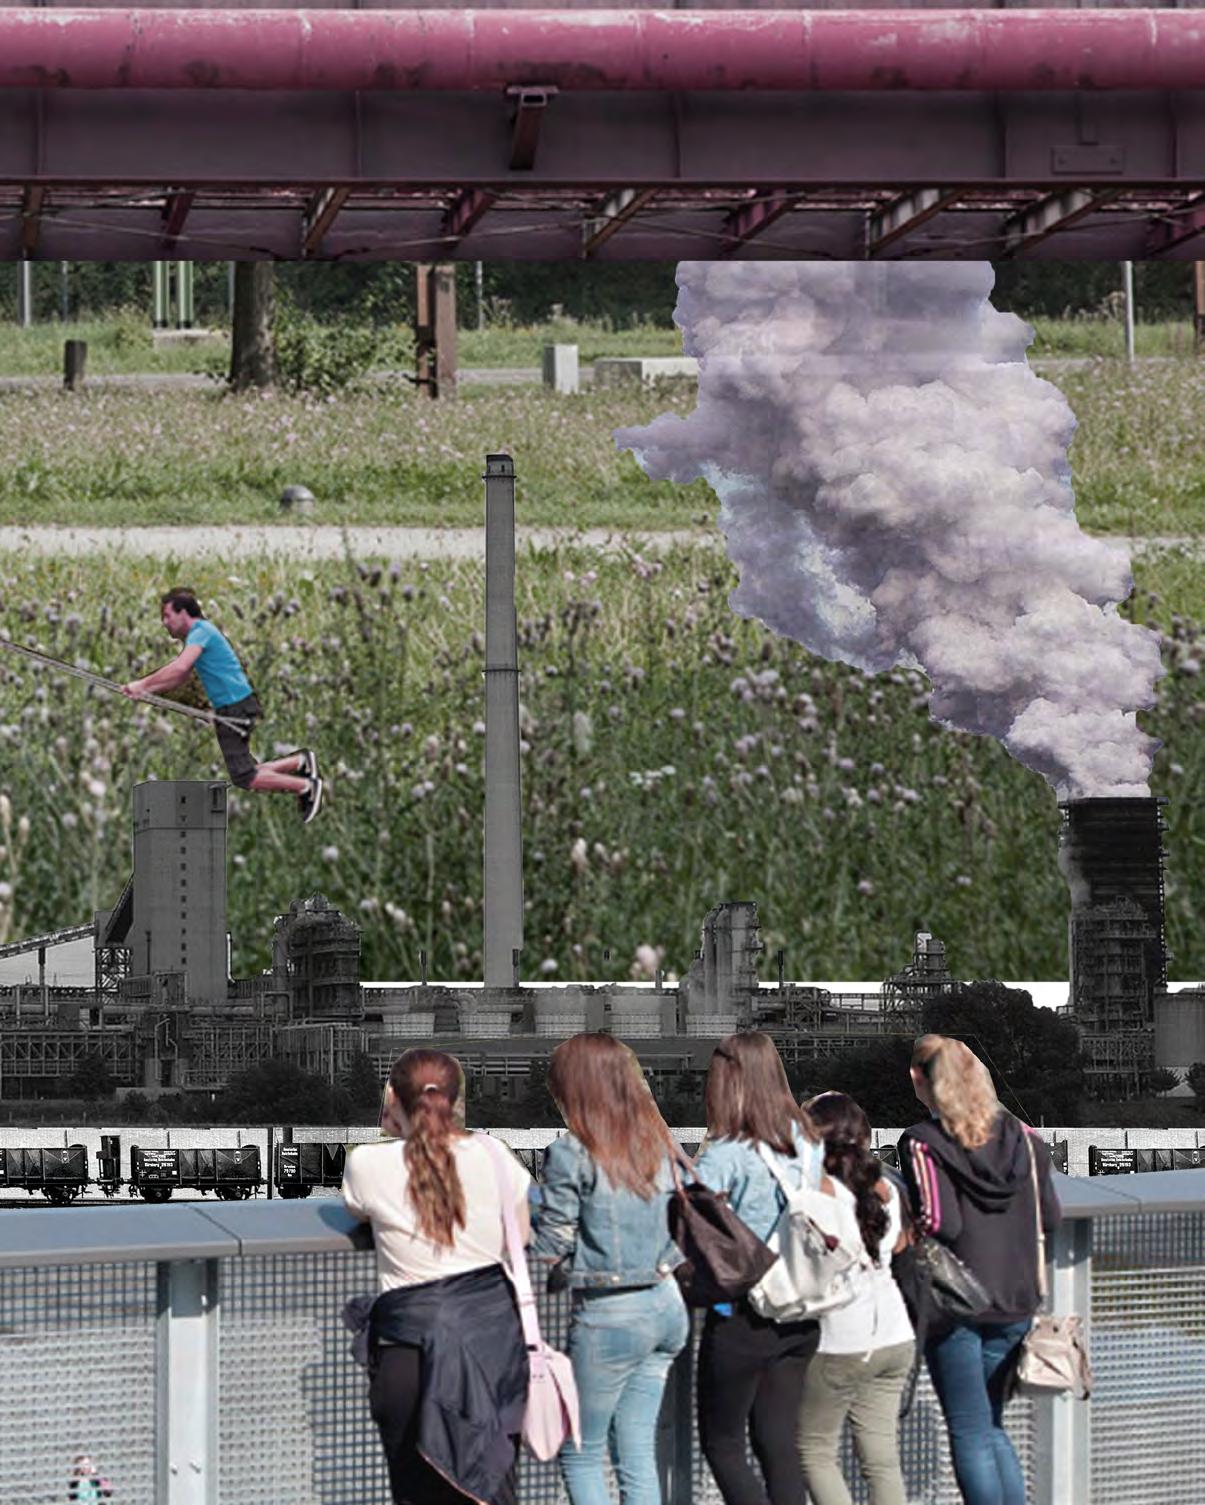
Figure 16. Collage of Zollverein Park.
 Ruhr Valley A-49


Theories and Methods of Urban Design Winter 2020 A-50 0 2 mile Legend Stream River Green Space Boundary Site Industrial Open Space Commercial Mixed-use Landmarks Residential Dortmund Lake Phoenix
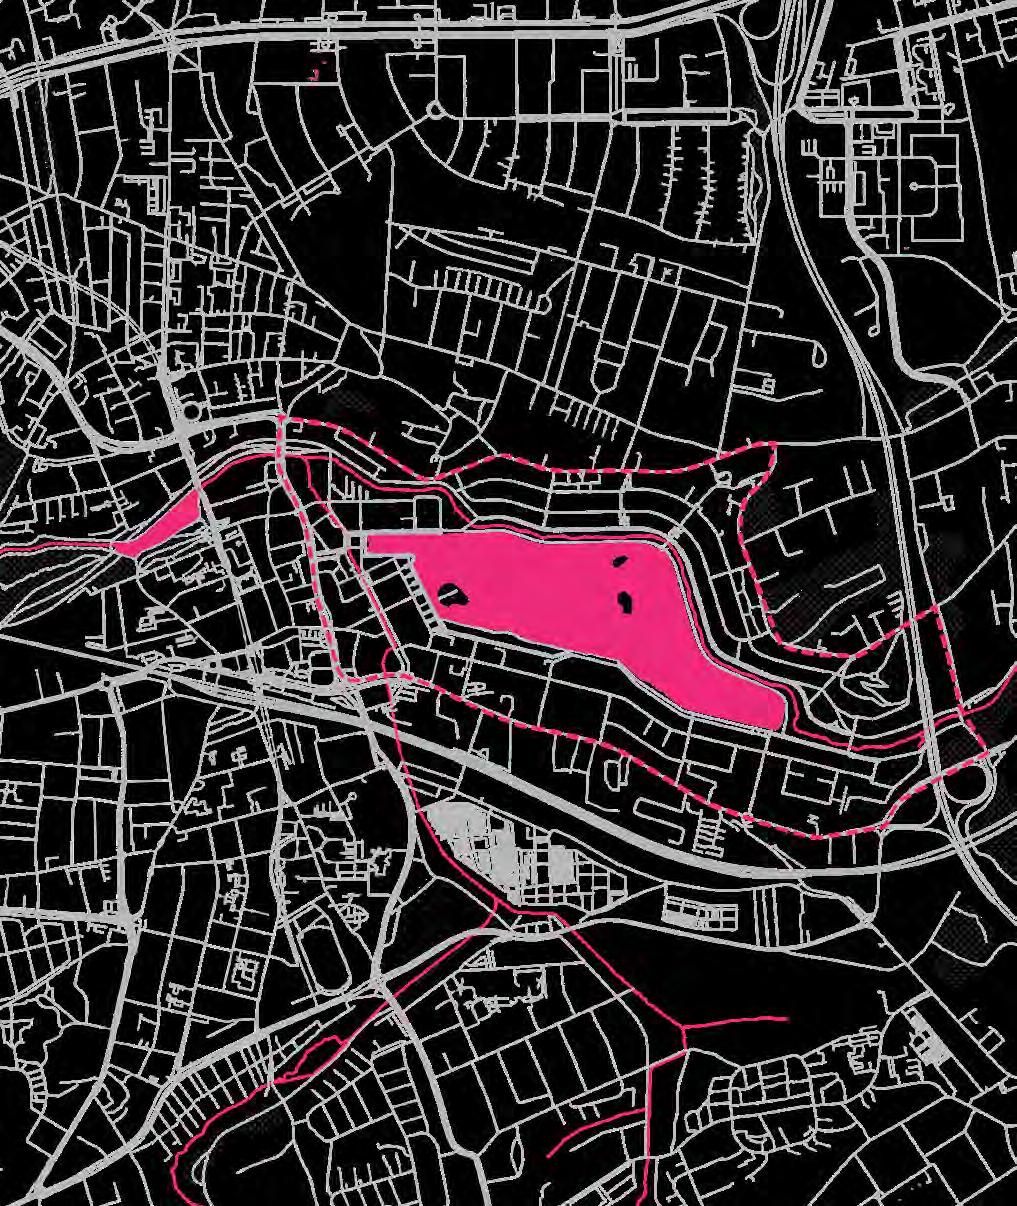
Figure 17. Context of Lake Phoenix.
26. WIKUE. “Emscher 3.0: from grey to blue or, how the blue sky over the Ruhr region fell into the Emscher, by Wuppertal Institut für Klima, Umwelt, Energie GmbH.” (2013) : 15-35.
27. Gruehn, Dietwald. “Germany Goes GreenInnovationstowards a Sustainable Regional Development.” World Technopolis Review 1, no. 4 (2013): 235.
28. Emscher conversion, Accessed Mar. 2020. https://www.eglv.de/en/ emschergenossenschaft/emscher-conversion/
LAKE PHOENIX (PHOENIX SEE)
[ECOLOGICAL URBANISM]
Situated in the city of Dortmund, Lake Phoenix project is part of the Emscher River restoration and includes surrounding new real estate development. According to the regional guidebook Emscher 3.0, the Emscher master plan of the riverside emerges from its specific industrial and settlement history, proposes waterways engineering and renaturalization into a new, innovative meaning that aims at bringing back a blue Emscher river with technology, ecology, and quality.26 The Emscher renaturation leads to the establishment of Emscher Landscape Park.27 The Wastewater Emschergenossenschaft and Lippeverband are two public sector management companies and operators.
The conversion includes engineering and renaturalization that channels wastewater into underground canals and neutralizes the surface waterway with natural habitats and stormwater management. The Emscher Conversion project aims to decisively enhance the value of the Emscher region through projects that extend far beyond the waterways, sustainably changing the living and working environment of the population. 28
Location Year(s) Status Footprint Agents

Key Project Components Program(s)
Funding Streams
[Dortmund, GERMANY] [2010]
[ Built ] [200 hectares]
[Thyssen-Krupp AG , local government and the management consultancy McKinsey & Co] [Lake, Sustainable development]
[Recreation, Residential housing and Office-services, Commerce facilities,Public infrastructure]
[Public and Private]
Ruhr
A-51 Phoenix Lake (Phoenix-See)
Valley
Lippe River
Emscher River
Ruhr River
Dortmund
Rhein River
Figure 18. Location of Lake Phoenix.
LAKE PHOENIX AND ECOLOGICAL URBANISM
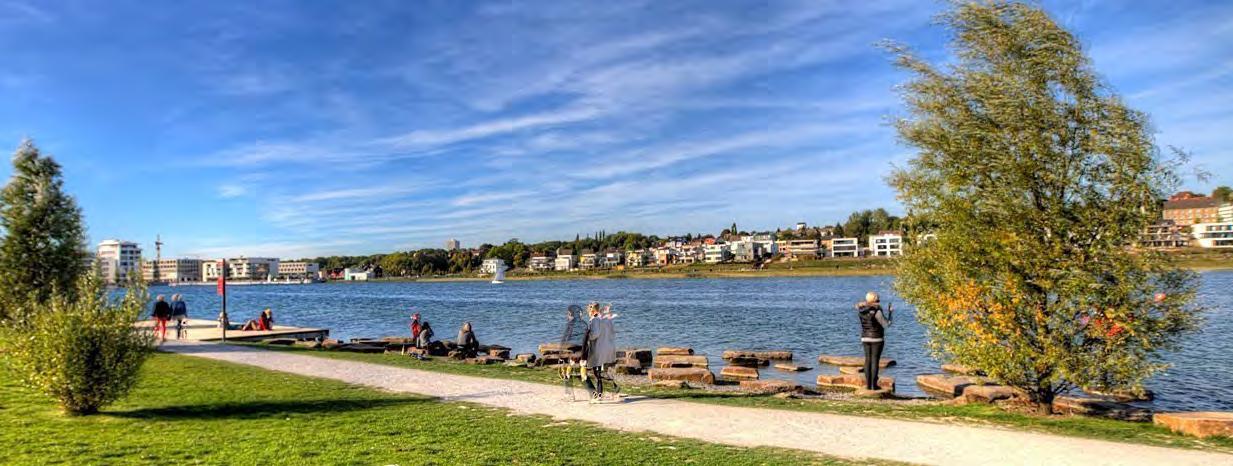
Learning from the scientific fields of Ecology and Urban Ecology, Ecological Urbanism focuses on a systematic approach toward environmental urgency, the dynamics of the elements, and movement in the cities.29 Broad interdisciplinary collaborations at all levels, such as political, planning, design and implementation, can bring the theory into practice. While there is still debate going on whether the urban social fabrics are well intervened in this topic 30, the practices of the theory tend to bring not only environmental benefits but also social benefits to humans and cities. The Lake Phoenix project would be a pilot project showcasing those benefits.
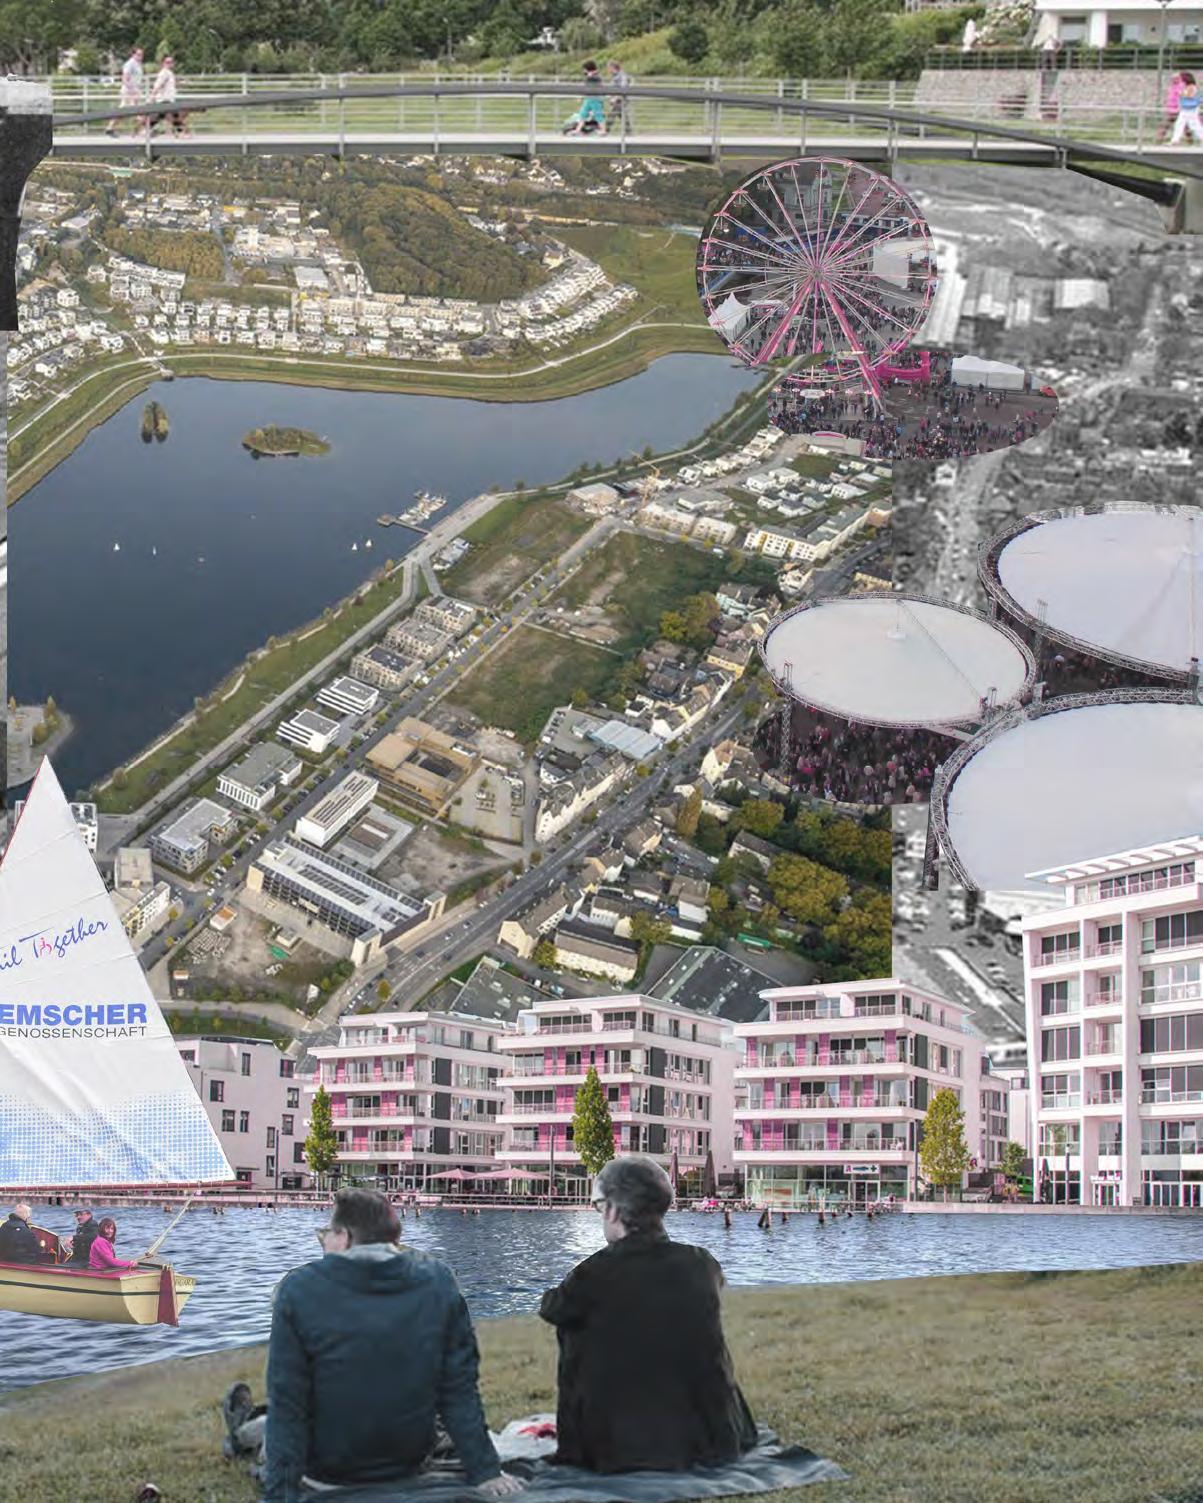
The Phoenix Lake project meets all criteria in terms of design intents. The lake itself becomes the local recreation area and improves the environment by daylighting the original stream creating the human-made lake that prevents the flood and enhances wildlife habitats.31 The surrounding area is developed with modern residential buildings, commercials, and retails that economically and socially bring back life.
Besides, since the project has been put to the ground so that it can be evaluated on environmental performance and the ecosystem services it provides. Researchers examine the ecosystem services the plan provides and conclude that there is a significant improvement in the reduction of pollutants, biodiversity, and flood prevention, which all lead to environmental benefits. There is a growing amount of economic value driven by the development of the project and the improvement of environmental quality. 32
The project starts with the major lake, recreation plans, and mixeduse development, which work collectively to serve as a center of residential, technological, and touristic life contributing to ecological, social, and economic sustainability and therefore enhancing life quality. On the other hand, there have been criticisms about the gentrification issue emerging from the development due to not diverse housing developments targeting mix-income affordability.33
29. Mostafavi, Mohsen, and Gareth Doherty, eds. Ecological urbanism. Lars Müller Publishers, 2010.
30. Hagan, Susannah. “Ecological Urbanism”, 2015. Accessed Mar. 2020. https://www. architectural-review.com/essays/ecologicalurbanism/8679977.article
31. Peet, R. “A greener tomorrow: Water management in urban redevelopment.” Dortmund, Germany, ICLEI Case Study (2016).
32. Gerner, Nadine V., Issa Nafo, Caroline Winking, Kristina Wencki, Clemens Strehl, Timo Wortberg, André Niemann, Gerardo Anzaldua, Manuel Lago, and Sebastian Birk. “Large-scale river restoration pays off: A case study of ecosystem service valuation for the Emscher restoration generation project.” Ecosystem Services 30 (2018): 327-338.
33. Davy, Benjamin. Land policy: Planning and the spatial consequences of property. Ashgate Publishing, Ltd., 2012.
Theories and Methods of Urban Design Winter 2020 A-52
Figure19. Phoenix Lake view, by Dumitru Brinzan, 2013
Boundary 0.5
Ruhr Valley A-53 River Green Space Forest Road Lake
mile
Figure 20. Plan of Lake Phoenix.
Regional Corporation
Regional Association of Ruhr, Emscher Cooperative, Development Corporation of the State of NRW ltd.
Funding
EU, Federal, State

Policy
State of North Rhine-Westphalia
Moderater
IBA Emscher Park
The Project Ruhr GmbH Department of Planning of the City of Dortmund
Regional Plan

Local Project
Emscher Landscape Park Zollverein Park
Emscher Conversion
Lake Phoenix
Duisburg Master Plan Averdung Plaza
Expertise
Urban Designer, Architect, Landscape Architect, Engineer
Local Corporation
the Wirtschafts- und Beschäftigungsförderung ( Business and Employment Promotion ) of the City of Dortmund the Phoenix See Entwicklungsgesellschaft mbH ( Phoenix Lake Development Corporation ltd.
LAKE PHOENIX DESIGN
The restoration intervention includes upgrading sewer systems that deal with stormwater management, renaturalization of the river bank and the creation of the lake to bring back wildlife.
The design also creates open spaces such as plazas, overlooks, playgrounds and fields by the lake to provide recreation use for surrounding residents.
Transect
Theories and Methods of Urban Design Winter 2020 A-54
Figure 21. Diagram of actors of Lake Phoenix.
Figure 23. Transect of Lake Phoenix during the industrial era and now.
Taxonomy


 Ruhr Valley A-55
Industrial Site
Lake Phoenix
Playground
Re-naturalization of River Bank Lake
Figure 22. Taxonomy of Lake Phoenix.
 Theories and Methods of Urban Design Winter 2020 A-56
Figure 24. Collage of Lake Phoenix.
 Ruhr Valley A-57


Theories and Methods of Urban Design Winter 2020 A-58 0 300 ft 0 2 mile Legend Stream River Green Space Site Industrial Commercial Landmarks Ruhr River Rhine River Averdung Plaza
Figure 25. Context of Averdung Plaza.
PLAZA
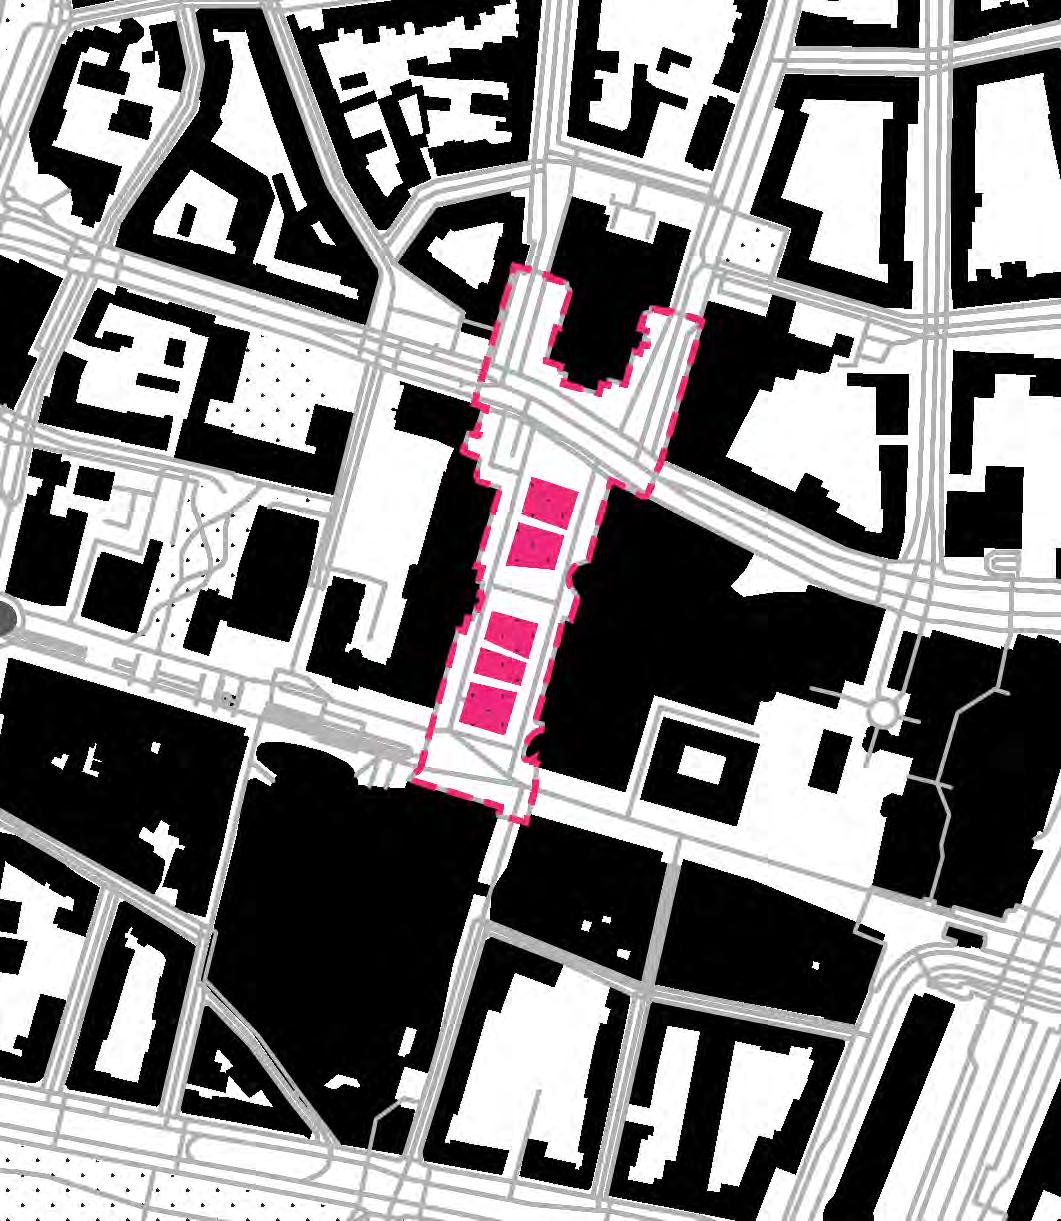
Averdung Plaza is located in the center of Duisburg. It is designed based on people’s social life and gathering needs by utilizing a variety of urban amenities with details at human scale. The tool that designers use is the landscape, which is the center green plaza.
This project may set a tone for the master plan of the larger area of the city for regeneration. Planned by Foster and Partners, the master plan developed the strategy for the city of Duisburg towards “a vibrant, green and sustainable city”. The vision focuses on strengthening existing links between public transport infrastructures and the reintroduction of the inner city as a central focus within this urban fabric. Complex culturally sustainable developments, including the open spaces, are proposed to make the city attractive and welcoming again.34

Ruhr Valley A-59
Averdung Plaza (Platz Averdung)
(KÖNIG-HEINRICH
[LANDSCAPE
[Duisburg, GERMANY] [2004] [Built] [1.6 hectare] [Agence Ter] [City of Duisberg]
Space, City Center Redevelopment] [Plaza, Green Space] [Public]
Year(s) Status Footprint Designer Additional Agents
Project Components Program(s)
Streams
AVERDUNG
PLATZ AVERDUNG)
URBANISM]
[Open
Location
Key
Funding
34. Foster and Partners, Duisburg Masterplan, 2007, Accessed Jan. 2020. https://www. fosterandpartners.com/projects/duisburgmasterplan/
Lippe River
Emscher River
Ruhr River
Duisburg
Rhein River
Figure 26. Location of Averdung Plaza.
AVERDUNG PLAZA AND LANDSCAPE URBANISM

The idea of Landscape Urbanism treats “landscape as the medium” 35 to tackle problems in urban areas such as cities. The theory is raised by landscape architects addressing that the tool, knowledge, and creativity of this discipline can have positive impacts on the urban environment and offer solutions through intervention on the timely horizontal surfaces, which is the landscape.36 In design practices, the surface can be in urban infrastructure, public open spaces, and urban natural areas. Inspired by the existing landscape on the site, landscape architects brought the lawn into the center of the popular area. Natural open space was not common in such a dense post-industrial city that is transforming into the green future city. This simple, elegant design with fine-textured urban furniture builds a wide expanse of grass on which people can relax. The project consists of a game between the mineral, vegetation and water play that animate the central space.37
This design also provides an elegant example of creating civic space with experience and observations on landscapes. As stated in the intent, “the city envisioned re-arranging this precinct to make it more urban and representative,” designers create this public space to invite people to the social life in the center of the city.38 This project implies the importance of the observation and perception of the trait about human life. Inspired by the “Social Life of Small Urban Space” 39 that focuses on the behavior of people in public areas and the relationship between human and physical space, the study finds the practice reflecting that importance.
35. Samuel Medina, Charles Waldheim: Landscape Urbanism All Grown Up, July, 2016, Accessed Mar. 2020. https://www. metropolismag.com/ideas/charles-waldheimlandscape-urbanism-all-grown-up/
36. Corner, James. The landscape imagination [electronic resource]: collected essays of James Corner, 1990-2010. Princeton Architectural Press, New York, 2014.
37. Land 8, König-Heinrich Platz Averdung Shows us All That Keeping it Simple is the Best Policy, Accessed Mar. 2020. https://land8.com/ konig-heinrich-platz-averdung-shows-us-allthat-keeping-it-simple-is-the-best-policy/
38. Agence Ter, Averdung Platz, 2011, Accessed Jan. 2020. http://landezine.com/index. php/2011/11/duisburg-agence-ter-landscapearchitecture/
39. Whyte, William H. The Social Life of Small Urban Spaces. Washington, D.C.: Conservation Foundation, 1980.
Theories and Methods of Urban Design Winter 2020 A-60
Figure 27. View of the plaza during event, by Agence Ter
Ruhr Valley A-61 0.1 mile
Building
Road Boundary
Figure28: Plan of Averdung Plaza
Green Space Water
Regional Association of Ruhr
Funding
EU, Federal, State
Policy
State of North Rhine-Westphalia
Moderater Regional Plan Local Project
IBA Emscher Park
AVERDUNG PLAZA DESIGN

Cooperation Local Corporation
Emscher Landscape Park Zollverein Park
Emscher Conversion
Lake Phoenix
Duisburg Master Plan Averdung Plaza
Expertise
Urbanists, Urban Designers, Landscape Architects
City of Duisburg
Sitting in the busy center of the city surrounded by urban landmarks, the plaza design utilizes fine scale designs such as planting, urban furnitures, fountain, sculptures and the events programming to activate the space.
Transect
Theories and Methods of Urban Design Winter 2020 A-62
Figure 29. Diagram of actors of Averdung Plaza.
Figure 31. Transect of Averdung Plaza during events.
Taxonomy


 Ruhr Valley A-63
Events Amenity
Sculpture
Fountain
Figure 30. Taxonomy of Averdung Plaza.
 Theories and Methods of Urban Design Winter 2020 A-64
Figure 32. Collage of Averdung Plaza.
 Ruhr Valley A-65
SOUTHERN NIGERIA NIGERIA
01 IDENTIFICATION OF THE TERRITORY AND LOCATION
Nigeria is a country in the Western part of the African continent. It is bordered by the Republic of Benin and Niger to the West and North respectively. It shares its Eastern border down to the shores of the Atlantic Ocean with the Republic of Cameroon. Modern Nigeria was established in 1914 when the British protectorate of Northern and Southern Nigeria were joined. The country gained independence in 1960.
Nigeria has six-geopolitical zones carved out from Northern and Southern Nigeria a way to effectively distribute resources by grouping the country based on similar categories among the hyper-diverse 400 ethnic groups and 250 languages. Today, notable differences exist between the North and the South not only in physical landscape, climate and vegetation but also in social organization, religion, literacy and agricultural practices. This study focuses on the Southern part of Nigeria which has three geopolitical zones- South-South (Bayelsa, Cross-River, Rivers, Delta, Akwa-Ibom), South-West (Ogun, Oyo, Lagos, Ondo, Ekiti, Osun) and the South-East, (Abia, Anambra, Enugu, Ebonyi, Imo). The total population of this territory is about 76,000,000 people.6
02 RELEVANCE FROM THE POINT OF VIEW OF URBAN DESIGN THEORY AND PRAXIS
This research examines the recent urban transformation in Southern Nigeria, with a focus on the interrelationships between socio-economic inequality and environmental vulnerabilities under the lenses of social, informal/insurgent and new urbanisms. To understand the evolution of urban planning and design in the region, it is critical to acknowledge the legacy of colonial British rule and the different eras of leadership and their impact.
Pre-colonial settlements in the south were simply built for convenience and pragmatic programs for community, livelihood and thermal comfort. However, under the administration of the Colonial era, the issues of trade and transportation started to change the socio-spatial geography of the territory
1. Statistics. In Worldometers. Accessed May 21, 2020. https://www.worldometers.info/worldpopulation/nigeria-population/.
2. Statistics. In the World Data Atlas. Accessed May 21, 2020. https://knoema.com/atlas/ Nigeria/topics/Education/Literacy/Adultliteracy-rate.
3. Ade Ajayi, J.F, Anthony Hamilton, and Reuben Kenrick. Essay. In Encyclopaedia Britannica, edited by Toyin O Falola. Accessed May 21, 2020. https://www.britannica.com/ place/Nigeria.
Theories and Methods of Urban Design Winter 2020 A-66
[Critical DATA]
Geographical Delimitation
Nigeria is bordered to the north by Niger, to the east by Chad and Cameroon, to the south by the Gulf of Guinea of the Atlantic Ocean, and to the west by Benin.
Population
National: 205,532,461;1about 2.64 percent of the total world population and Africa’s most populous country.
Focus: Southern Region- 76 million
Social Indicators
The major ethnic groups are; Yoruba and Igbo while some of the minor ethnic groups are Urhobo. The major religions practices are Roman Catholicism, Christianity, and Islam. Nigeria adult literacy rate was at level of 62 % in 2018, up from 51.1 % in 2008.2 Infant mortality rate is 77.8 out of every 1000 births. Only 28% of Nigerians have access to improved sanitation facilities while 64% have access to potable drinking water.
Economic Indicators
The major occupations are in the agrarian, manufacturing, and extraction/mining of natural resources especially crude oil. Over the past years, the construction sector, education, and tourism have also experienced growth. It is the country with the highest number of extremely poor people in the world. By May 2020, 1 US dollar is worth 390 Nigerian Naira. 100 million Nigerians are said to live below 2 dollars per day. GDP per capita is $2,222 (nominal, 2019 est.) Debt-to-GDP ratio is 16.075 percent as of 2019, inflation rate is The unemployment rate is 6.11% Average life expectancy is 54 years 50% of Nigerian live in slums, while 2 out of every 3 urban dwellers live in informal areas.
Environmental Indicators
Nigeria has a tropical climate with variable rainy and dry seasons, depending on location. It is hot and wet most of the year in the southeast but dry in the southwest and farther inland. A savanna climate, with marked wet and dry seasons, prevails in the north and west.3
Nigeria has the highest burden of fatalities from air pollution in Africa and 4th globally, producing more than 3 million tons of waste annually. According to the HEI chart, there were 150 deaths per age-standardized deaths per 100,000 people attributable to air pollution in Nigeria in 2016.4 In Lagos, an estimated seven million people died from diseases related to indoor and outdoor air pollution in 2012 according to the WHO.
Nigeria’s climate has been changing, evident in: increases in temperature; variable rainfall; rise in sea level and flooding; drought and desertification; land degradation; more frequent extreme weather events; affected fresh water resources and loss of biodiversity.5
4. Ogundipe, Shola. “Essay.” In Nigeria: Air Pollution - Nigeria Ranks 4th Deadliest Globally. Accessed May 21, 2020. https:// allafrica.com/stories/201809010001.html.
5. Haider, Huma. “Essay.” Climate Change in Nigeria: Impacts and Responses, 2. Accessed May 21, 2020. https://assets.publishing.service.gov.uk/ media/5dcd7a1aed915d0719bf4542/675_ Climate_Change_in_Nigeria.pdf.
6. Essay. In The Violent Road: Nigeria’s South West. Accessed May 21, 2020. https://aoav.org. uk/2013/the-violent-road-nigeria-south-west/.
Southern Nigeria A-67 Nigeria Africa
in ways that the British colonial masters did not anticipate. This situation was exacerbated by the laissez-faire attitude that the colonial masters had towards urban planning; their interests were solely in rural administration and rural export and the segregation of their colonies from the rest of the cities. During the colonial period, the Southern part of Nigeria was a British protectorate and in 1915. After the amalgamation of Northern and Southern Nigeria for economic reasons; the surplus from the South was redistributed for the development of the North.


Employment opportunities available in the cities brought rapid urbanization between 1914 and 1970 accompanied by housing shortage, unsanitary conditions, air and water pollution, waste management problems and inadequate transportation.7 The Nigerian Town and Country Planning Ordinance Act of 1946 regulated urban growth and it was modelled after the British Town and Country planning Acts of 1932.8 Three agencies were in charge to advance government plans: the Planning Authority, the Urban Council, and the Health Authority. These agencies did not work in harmony; and in fact, inhibited each other’s work.9
Nigeria was granted independence on October 1, 1960 and it became a republic in 1963. After a brief period of political and economic bliss, Nigeria’s long-standing regional differences based on ethnic competitiveness, educational inequality, and economic imbalance, again came to the foreground in one of the bloodiest conflicts in the continent, the Biafran War. The discovery of oil reserves and the control on production and profit also did their part in the conflict. This situation birthed environmental justice movements and insurgent responses from residents and environmental activists.
Over the past decades (1960 to 2010’s), urban transformation in Southern Nigeria has been plagued with challenges stemming from pitfalls in policies, an unstable economy, and lack of public infrastructure for transportation, electricity, and sanitation.10 To showcase the implications of these socio-economic and political conditions in city making and public life, this investigation takes a deeper look
Theories and Methods of Urban Design Winter 2020 A-68
Figure 1-Map showing the Southern region of Nigeria
Figure 2-Population density map
7. Obinna, V. & Owei, Opuenebo & Mark, E. (2010). Informal Settlements of Port Harcourt and Potentials for Planned City Expansion. Environmental Research Journal. 4. 222-228. 10.3923/erj.2010.222.228.
8. Taylor, Robert W. “Urban Development Policies in Nigeria: Planning, Housing, and Land Policy.” Essay. In Urban Development Policies in Nigeria: Planning, Housing, and Land Policy, 3–9, 2000. https://msuweb.montclair. edu/~lebelp/CERAFRM002Taylor1988.pdf.
9. Uyanga Joseph, Urban planning in Nigeria: Historical and administrative perspectives and a discussion of the city of Calabar (Habitat International Volume 13, Issue 1, 1989, Pages 127-142)
TIMELINE : HISTORY, ACTORS AND EVENTS
500 In Nigeria evidence of urbanization at the Yoruba city of Ife dated back to about this time
1884 The British took an interest in Nigeria because of its resources and they colonized Nigeria in 1884. The three largest ethnic groups upon the arrival of the British were the Igbo, the majority in the southeast; the Hausa-Fulani of the Sokoto Caliphate, the majority in the north; and the majority in the southwest.
1900 The British Government established the Southern protectorate assumed control of the Southern and Northern Protectorates.
1914 British colonial amalgamation of Northern protectorate, Lagos Colony and Southern Nigeria protectorate Lagos becomes the capital of Nigeria
1946 The Nigerian Town and Country Planning Ordinance Act of 1946 regulated urban growth following the model of the British Town and Country planning Acts of 1932
1956- Shell-BP expedition makes first discoveries of major petroleum deposits in the Eastern Region, at Olobiri and Afam, in Port Harcourt, transforming the city’s economy to petroleum.
1960 Nigeria gained independence from the United Kingdom, but remained in the Commonwealth of Nations.
1965 Refineries completed in Port Harcourt, owned 60% by Federal Government, 40% by Shell BP
1967 The Biafran War started, resulting from political, economic, ethnic, cultural and religious tensions; and control over the oil production in the Niger Delta. War ended in 1970.
1971 Nigeria joins the Organization of Petroleum Exporting Countries (OPEC)
1975 Relocation of the capital from Lagos to Abuja for reasons of congestion and ethnic neutrality.
1975 The Third National Development Plan creates the Federal Ministry of Planning for more effective urban policy.
1979 Nigeria outlawed gas flaring, to be phased out over 5 years. The law was not enforced and in 2008 some 20 billion cubic meters of gas was flared, out of a global total of 150 billion.
1993 Shell Oil stopped pumping oil in the Ogoni Province, but continued to use pipelines that pass through it. The Ogonis are a 500,000-strong community in southwestern Nigeria. They maintain that oil production has polluted their land, destroying their livelihoods of fishing and farming. Shell canceled several community development projects budgeted at $29 million.
1995 Execution of activist Ken Saro-Wiwa, and eight other members of the Movement for the Survival of the Ogoni for leading protests against oil activities and pollution in the Ogoniland region.
1996 Nigeria Shell’s former head of environmental studies reported in a taped interview that the company broke its own rules and international standards in Nigeria and caused widespread pollution. He resigned from his post in protest in late 1994.
1998 Attacks by Niger Delta protesters shut down the Shell and ENI pipelines. Anger over pollution of cropland and fishing grounds growing.
1998 An underwater pipeline from a Mobil Oil production platfor m broke and released 40,000 barrels of oil into the Niger delta
2000 President Obasanjo’s administration established the Niger Delta Development Commission NDDC to tackle human & ecological issues in the Niger Delta Region.
2004 Militants in the oil-producing Niger-Delta region vandalize oil pipelines and kidnap foreign workers to contest the environmental pollution and neglect of their communities, reclaiming a fair share of the wealth.
2009 Government strikes amnesty deal with the Niger-Delta militants.
2011 A UN report said it could take 30 years and at least $1 billion to recover the poisoned mangroves of a black carpet of crude oil.
2012 Architect Jeff Forbes designs and builds the Okrika Waterfront Townhall in Port Harcourt as a part of the People Live Here campaign, protesting against massive evictions in the area.
2012 Massive slum demolitions in Lagos by the Lagos government because they were “desirous of restoring the amenity and value of the waterfront”. The demolitions rendered 200 households homeless.
2012 Architect Kunle Adeyemi built a floating school on the water to serve the urgent needs of education in this community.
2016 The Niger Delta Avengers attacked more oil infrastructure in Southern Nigeria, ignoring a call for unity from Pres. Muhammadu Buhari.
2017 Britain’s High Court ruled that Royal Dutch Shell cannot be sued in London over oil spills in Nigeria, in a setback to attempts to hold British multinationals liable at home for their subsidiaries’ actions abroad. The court also said the claimants should be able to use Nigerian courts.
2017 Police broke up a sit-in protest in Lagos, dispersing hundreds of former slum-dwellers demanding compensation after being evicted from their waterfront homes. Amnesty International published a report calling the evictions “unlawful” and demanded an investigation into the violence.
2019 More than 50 people were left missing after a leaking oil pipeline exploded and caused a stampede in Bayelsa state. The Nembe Creek Trunk pipeline exploded, with no fatalities reported. It runs from an oil terminal in Bonny to the state of Bayelsa with a capacity of 150,000 barrels per day.
2019 Fishnet Alliance Members met at Okrika waterfront Port Harcourt, to demand action to save the marine ecosystem and protest the impact of the extractive industries in the area.
Southern Nigeria A-69
at the different forms that urbanism takes in the region. Through the lens of informal urbanism, I examine the conditions of informality in which a large proportion of the population lives; social and insurgent urbanism guides the projects developed with government support as a response to citizens’ action; and new urbanism showcases examples of highly exclusive and exclusionary urban enclaves. For the purpose of this research, I investigate three projects: Okrika Waterfront community in the South-South zone, Eko Atlantic City and Makoko Community in the South West zone.
Through the lens of insurgent urbanism, we can observe how the impact of the extractive industries, government inaction and neglect have inspired urban projects and campaigns to protect the Okrika Waterfront community from further demolition and environmental degradation. Using the lens of new urbanism, we can observe the socio-economic and political implications of creating EkoAtlantic City, an enclave within Lagos. Poised to solve the housing shortage in Lagos, it is out of the reach of an average Nigerian. Last, under social urbanism I observe the use of participatory planning and building processes to create socially beneficial projects within the Makoko community.
By bringing together these disparate urban projects, I interrogate the role that the government and capitalism play in environmental degradation? How have urban designers, activists and the civil society intervened to create better living conditions? What are the underlying socio-political meanings embedded within these interventions? How successful have the projects been, in terms of programs, end-user responses and interpretations?

10. Taylor, Robert W. “Urban Development Policies in Nigeria: Planning, Housing, and Land Policy.” Essay. In Urban Development Policies in Nigeria: Planning, Housing, and Land Policy, 3–9, 2000. https://msuweb.montclair. edu/~lebelp/CERAFRM002Taylor1988.pdf.

11. Hillier, Amy. “Making Sense of Cities: The Role of Maps in the Past, Present, and Future of Urban Planning.” Mapping Across Academia, 2017, 45–61. https://doi. org/10.1007/978-94-024-1011-2_3.

Theories and Methods of Urban Design Winter 2020 A-70
Figure 3-7- A cross-section of enivronmental challenges in the South zone of Nigeria; rapid urbanisation, heavy traffic, flooding, air pollution and waste managment problems.
03 METHODS TO CONDUCT YOUR INVESTIGATION
My investigation relies on mapping techniques to situate the geographical context and the spatial form,11 social and environmental structures of the selected projects. Through these maps, I aim to unfold the relationships between the citizenship, governance and socio-political factors that shape urban space.
Secondly, I use the technique of diagramming to represent self-authored abstraction of existing conditions in the social and political realm of the projects. This will enable me to highlight critical issues to provoke necessary conversations and interventions.
In addition to this I will be collecting relevant demographic data and written information from existing data sources and literature in books, journals, the internet and social media to help me understand the background of the urban conditions existing in my selected case studies.
04 ANTICIPATED FINDINGS

This research aims to instill a sense of urgency for critical conversations on the urban conditions in Southern Nigeria, through the lens of three case study projects. To frame them, I recount the legacy of colonization, the Biafran War, the militant insurgencies, and current conditions (rapid urbanization due to rural migration, political and ethno-religious riots, environmental pollution, falling oil prices, chronic high rates of unemployment, housing shortage, lack of infrastructure for transportation, sanitation and waste management).


By juxtaposing these environmental, geographic, political and socioeconomic factors on the physical and social fabric of these territories, I look for specificities within the non-western context of urban design that can help synthesize unique local responses in the future.

Southern Nigeria A-71
Figure 8-10 A cross-section of Nigeria’s diverse cultures.


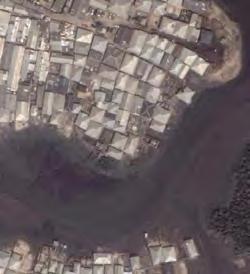


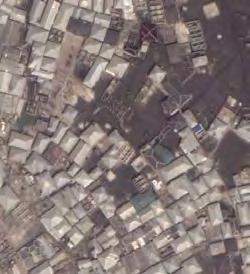


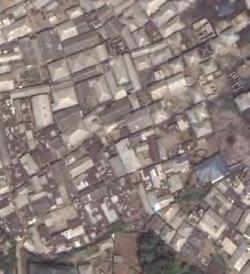


Theories
and Methods of Urban Design Winter 2020 A-72
Figure 12- Aerial map of Okrika Waterfront Community
12. Holston, James. “Insurgent Citizenship in an Era of Global Urban Peripheries.” City & Society 21, no. 2 (2009): 245–67. https://doi. org/10.1111/j.1548-744x.2009.01024.x.
13. Documents & Reports - All Documents. Accessed May 21, 2020. http:// documents.worldbank.org/curated/ en/731661522102870635/text/Deliverable-1-1. txt.
OKRIKA WATER-FRONT COMMUNITY [ INSURGENT URBANISM]
James Holston describes insurgent citizenship as new movements generated by residents living in impoverished and marginalized urban peripheries while struggling for basic resources of daily life and shelter; based on their claims to have a right to the city.12 This form of insurgent urbanism is evident in the everyday life of the residents of the Okrika waterfront community, is an informal settlement located in the shoreline area in Port Harcourt, a major oil-producing city in Nigeria. Okrika Waterfront is a self-built settlement constructed on land reclaimed from the surrounding waterways causing a rise in the water tables. A slight majority of the residents (59%) utilize indoor flush toilets that are either connected to underground cesspits or open drains. Most of the remaining residents rely on public or private hanging latrines, and a small fraction practice open defecation.13 There are about 480,000 residents living in Portharcourt’s waterfront communities which face the threats of demolitions from the state government with no plans to compensate or resettle the displaced people.
Location Year(s) Status
Footprint Designer
Additional Agents
Key Project Components Program(s)
Funding Streams
[Port Harcourt, South-South region, NIGERIA

[Estimated 1970’s
[ Built]
[311 dwelling units, 1866 population]
[Self-Built houses]
[Urban designers, Philantropists, Political activists]
[Marshland colonisation, informal clusters, fringe settlement]
[Fishing, local businesses, housing units, Jetty, Okrika town hall, Advocacy]
[Self-owned housing units, private initiatives by environmental advocates]
Southern Nigeria A-73
THE PROJECT AND THE URBANISM
Insurgent practices of the urban poor and vulnerable are usually evident in their struggle for shelter and other basic services, and aim to create spaces of inclusive and active citizenship. As these underserved groups defy policies imposed on them from above, they shape their environment through resistance and insurgency. In this study, I ask who participates in and creates these interventions and what are the internal compositions of these movements, particularly in respect to race and gender. What are their practices of citizenship and collective action? How do they perceive their rights and how are they perceived by others, namely by the state and the media? And what are the implications of these spaces of insurgency for planning thought?14
In the 1980’s, the state government redeveloped three squatter settlements along the waterfront area of Port Harcourt which in reality exacerbated the housing problems, rendering many homeless.15 Similarly, Okrika faces the threat of displacement today. Once again, the government supports a renewal scheme which ostentatiously promises a better neighborhood for the city. Apart from the massive evictions and displacement of current inhabitants, these communities are exposed to the consequences of unhealthy environment practices by the extractive industries, which expel waste into the air and water bodies. Crude oil spillage has become common currency, making the water unsafe for drinking and fishing, negatively impacting their livelihoods.
Although the waterfront settlements are heterogeneous in ethnicity, the dwellers have a strong sense of community, raising their voices against the threat to their place of abode and the neglect of the government on the issues of environmental decay, pollution and poor sanitation in their settlement. Over the recent years, there have been passive and active insurgence by the residents of this community. One of such movements is the “Fish Not Oil” campaign, pioneered by the Fishnet Alliance Agency which protests against the neglect of the oil corporations in the environmental degradation caused by their extraction activities. For the past four years, there has been a cloud of black soot hanging over the city believed to be a result of illegal crude oil activities or the destruction of existing oil refineries.15
14. 2005 Miraftab F. and S. Wills. “Insurgency and Spaces of Active Citizenship: The Story of Western Cape Anti-Eviction Campaign in South Africa.” Journal of Planning Education and Research 25(2): 200-217.
15. Obinna, V. & Owei, Opuenebo & Mark, E. (2010). Informal Settlements of Port Harcourt and Potentials for Planned City Expansion. Environmental Research Journal. 4. 222-228. 10.3923/erj.2010.222.228.
16. Giles, Chris. “Why Is This Nigerian City Covered in a Strange Black Soot?” CNN. Cable News Network, April 26, 2018. https:// www.cnn.com/2018/04/26/africa/nigeriaportharcourt-soot/index.html.

Theories and Methods of Urban Design Winter 2020 A-74
Figure 13- Photographs from Okrika waterfront showing the FishNotOil campaign by Fishnet Alliance and the physical condition of the community

 Southern Nigeria A-75
Figure 14- Illustration by Author
Architect Jeff Forbes also built a town hall in this Okrika Waterfront community as a part of the “People Live Here” campaign to protest against the forced eviction of over 400,000 water-front residents. The building provides basic facilities and serves as a place to engage the neighborhood in active citizenship conversations to fight and retain their homes.17
The Chicolo radio station is another insurgent intervention, a communitybuilt waterfront radio station and media facility to facilitate the socio-political empowerment of the residents.. The center is a catalyst, a community-led initiative to articulate their needs to the government and strengthen their political will to transform policies, allowing people to directly improve their neighborhoods.18 This project is owned, operated and maintained by the waterfront communities.19
com/jeffforbes/Okrika-Waterfront-Town-HallNigeria.
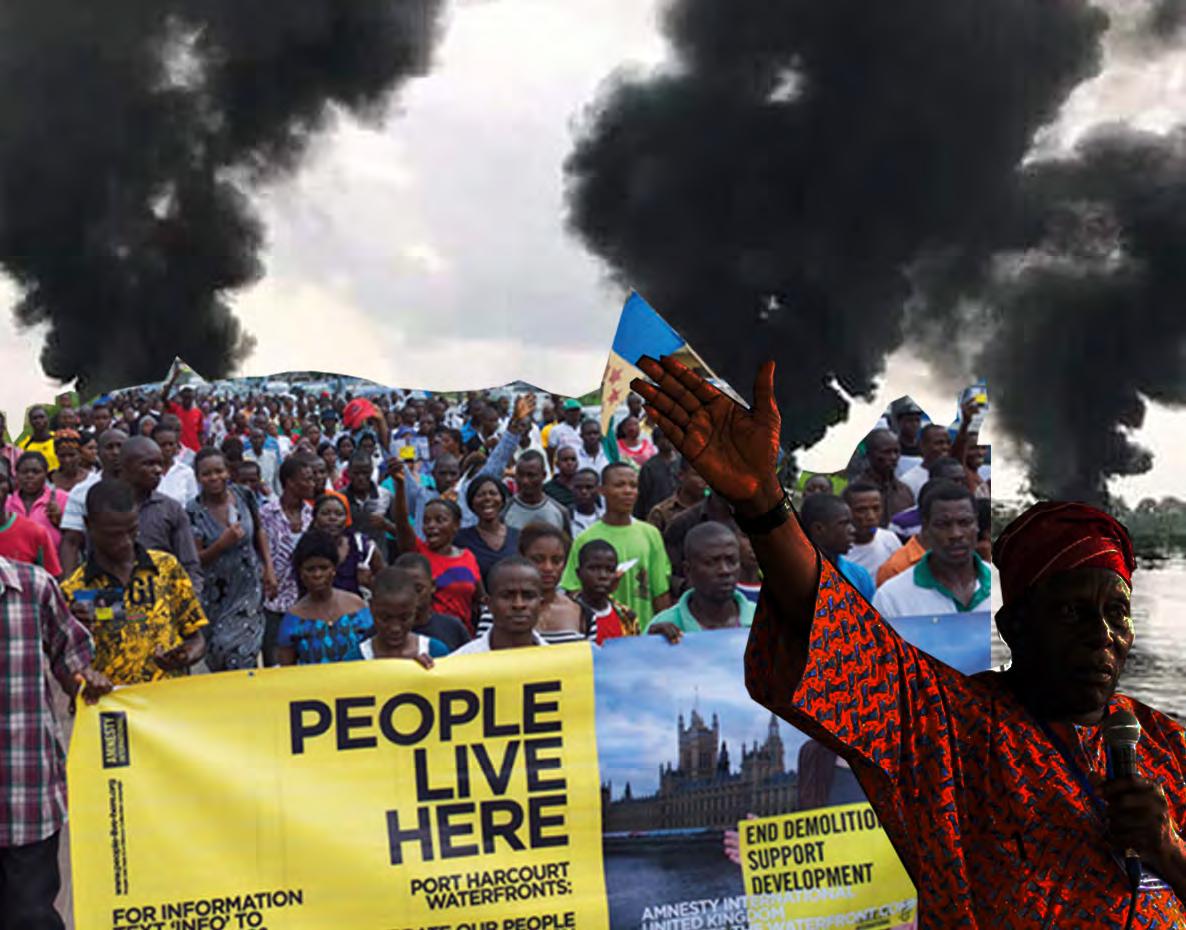
18. “The Human City Project, Nigeria - Jeff Forbes,” 2012. https://cargocollective.com/ jeffforbes/The-Human-City-Project-Nigeria.
19. “Chicoco Radio | Port Harcourt, Nigeria | 2014.” NLE, 2020. https://www.nleworks.com/ case/chicoco-media-centre/.
17. “Okrika Waterfront Town Hall, Nigeria.”Jeff Forbes, 2012. https://cargocollective.
Theories and Methods of Urban Design Winter 2020 A-76
Figure 15 Synthetic collage by author
Recreation
Information


 Community gathering space for citizenship action
Southern Nigeria A-77
Figure 20-21 Taxonomy components of the Chicoco radio station by author
dissemination
Participatory planning and building to instill a sense of community
Figure 16-19- Taxonomy component of the Okrika Waterfront Town Hall showing programs and uses (by author)

0 1 mile Theories and Methods of Urban Design Winter 2020 A-78
Figure 22- Actors and agents (drawing by author)
 Figure 23- Figure ground drawing of Okrika waterfront (drawing by author)
Southern Nigeria A-79
Figure 24- Transect drawing by author









Theories
and Methods of Urban Design Winter 2020 A-80
Figure 26- Aerial view of Eko Atlantic city
Location Year(s) Status
Footprint
Designer
Additional Agents
Key Project Components Program(s)
Funding Streams
EKO ATLANTIC CITY [NEW URBANISM]
Geographically, Lagos is classified into mainland area and island. The island area contains the central business district, Lagos Island. The island houses most of the highbrow residential and commercial neighborhoods in Lagos, which include Ikoyi, Lekki and Victoria Island. Victoria Island is originally bordered by the Atlantic Ocean on the south and the mouth of the Lagos lagoon on the West. Rapid commercialization and ambitious plans to extend development led to rapid expansions by land reclamation through sand filling, and further displacements of residents. Despite its thriving commercial growth and real estate promise, Victoria Island’s shorelines were eroded annually beginning in the 1980’s and by 2005, a coastal road had completely collapsed into the ocean. This was a threat to the key financial center in Lagos and this problem birthed the vision of the Eko Atlantic city. The Eko Atlantic is one of a two-part projects proposed to the government by South Energyx20 as a solution to the gradual erosion from ocean surges which threatened Victoria Island. The first part reclaims a 4-square mile land area from the Atlantic Ocean on the portion which used to be a beach while the second part of the proposal includes an 8.5-km long sea revetment called the great wall of Lagos.

[Lagos, South-west NIGERIA]
[started 2009]
[Partially Built ]
[3.9 square miles]
[South Energyx construction]
[Lagos state government, Chagoury group, private investors]
[3.9 Square mile sandfilled area, 8.5km long seat revetment, Infrastructure ]
[Live, work and play development, prime real estate, tourism, commercial hub ]
Chargoury group, private investors from Nigeria and the Middle east.
Southern Nigeria A-81
20. “About Eko Atlantic.” Eko Atlantic. Accessed May 21, 2020. https://www. ekoatlantic.com/about-us/.
21. “New Urbanism.” New Urbanism. Accessed May 21, 2020. http://www.newurbanism.org/.
THE PROJECT AND THE URBANISM
New Urbanism promotes the creation and restoration of diverse, walkable, compact, vibrant, mixed-use communities composed of the same components as conventional development, but assembled in a more integrated fashion, in the form of complete communities.21 These contain housing, work places, shops, entertainment, schools, parks, and civic facilities essential to the daily lives of the residents, all within easy walking distance of each other. The infrastructure plan for Eko Atlantic city sharply contrasts with the existing situation in the rest of Nigeria. In a country where 24 hours of electricity supply is absent, a selfsustaining new city makes a luxury claim for the promise of uninterrupted power supply and other luxurious social amenities.
Eko Atlantic is tagged as “a city to live, work and play”, promising to solve the housing shortage in Lagos, and even to ease the traffic gridlocks, by providing houses for 250,000 and access to another 150,000 who commute to the new city every day for work. An important criticism of the new urbanism movement is that it is described as a social engineering scheme which fails to address social equity while enriching the coffers of the private sector developers. Eko Atlantic City validates this argument by becoming an enclave seated contextually within the city of Lagos. While promoted as relaxed, open, and free from inefficient state bureaucracy, the politics written into the city’s concept diverges from the declared intent.22 The Eko Atlantic city was initially proposed as a public partnership project; an environmental solution to prevent the ocean surges from eroding the victoria Island completely away, while at the same time providing accommodation and reducing traffic problems in the city. Observing the economic situation in the country and comparing with the cost of living in Eko Atlantic, the project is out of reach of the average Lagosian and Nigerian. It doesn’t solve the housing shortage of low-income earners but provides prime real estate for the over-served high net worth individuals who are expatriates, foreign investors and diasporans. Although the project is presented as a PPP project, the private investors provided all the funding. In 2017, the managing director of South informed the public that this project is directed towards the top 2%.
22. “Extrastatecraft: the Power of Infrastructure Space. By Keller Easterling.” International Affairs 91, no. 3 (2015): 642–44. https://doi. org/10.1111/1468-2346.12301.
https://www.theguardian.com/environment/ true-north/2014/jan/21/new-privatizedafrican-city-heralds-climate-apartheid.
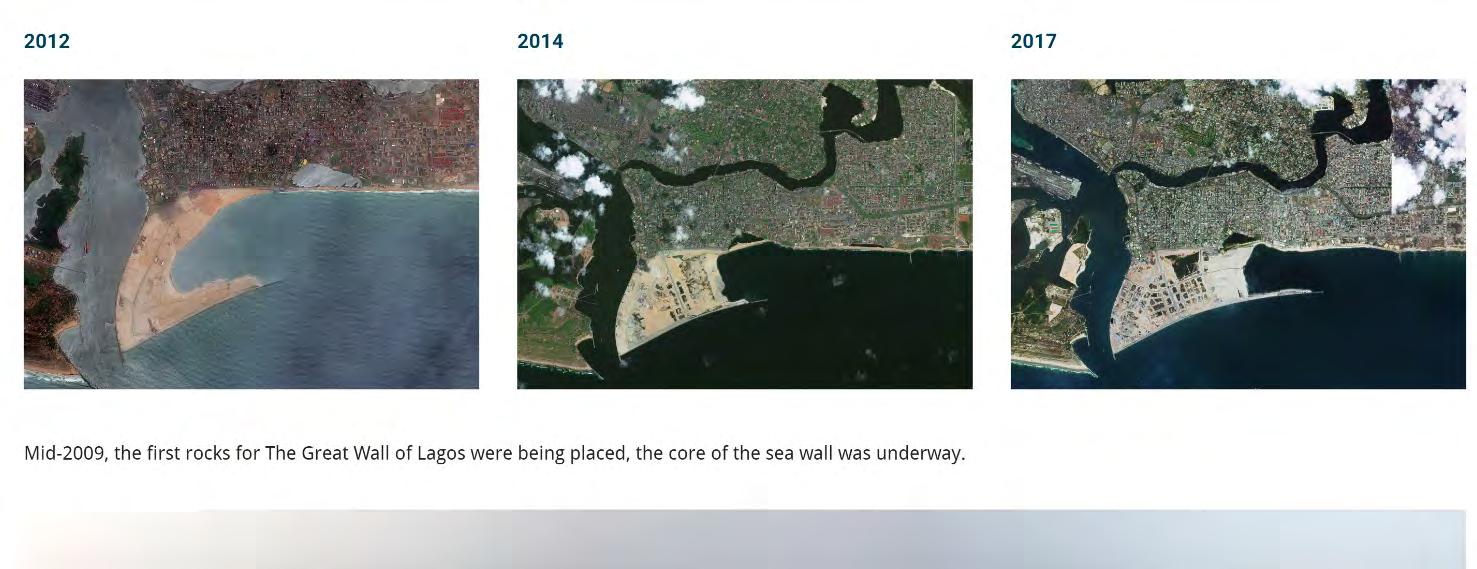
Theories and Methods of Urban Design Winter 2020 A-82
23. Lukacs, Martin. “New, Privatized African City Heralds Climate Apartheid.” The Guardian. Guardian News and Media, January 21, 2014.
Figure 27- The development process of the Eko Atlantic city

 Southern Nigeria A-83
Figure 29- Illustration by Author
Figure 28- A 3D-rendering of the Eko Atlantic city
A few kilometers away from Eko Atlantic city is the popular Makoko slum, a waterfront slum where residents live in unsanitary conditions inside buildings built on water. For a new city project which was initially touted as a geographical solution, Lukacs says “the disaster capitalists behind Eko Atlantic have seized on climate change to push through pro-corporate plans to build a city of their dreams, an architectural insult to the daily circumstances of ordinary Nigerians”.23 He describes climate apartheid as “a world in which the rich and powerful exploit the global ecological crisis to widen and entrench already extreme inequalities and seal themselves off from its impacts’’
For a new city built in the 20th century, I think that the Eko Atlantic city is a missed opportunity for a new African city to define a new system of transparency, governance, social equity and public infrastructure which addresses local environmental and socio-economic conditions. If the Lagos state government had maintained a higher level of control in this large scale development project, as it was in cities like Sweden, Berlin and HongKong,24 perhaps the Eko Atlantic project would have included realistic plans for low-income housing.

Theories and Methods of Urban Design Winter 2020 A-84
Figure 30- Synthetic collage by Author
24. Moskowitz, Peter. “Growth Machine.” Essay. In How to Kill a City, 142–43. New York: Bold type books, 2017.
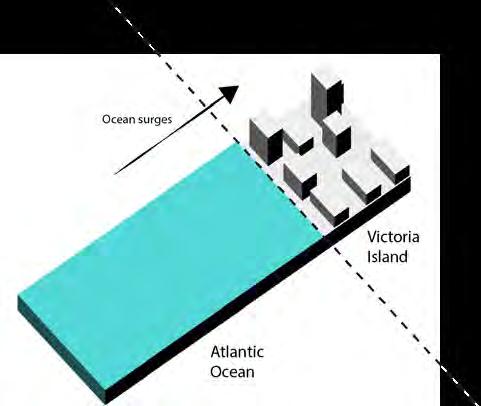
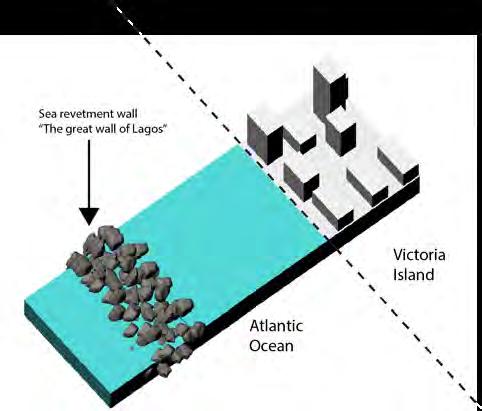

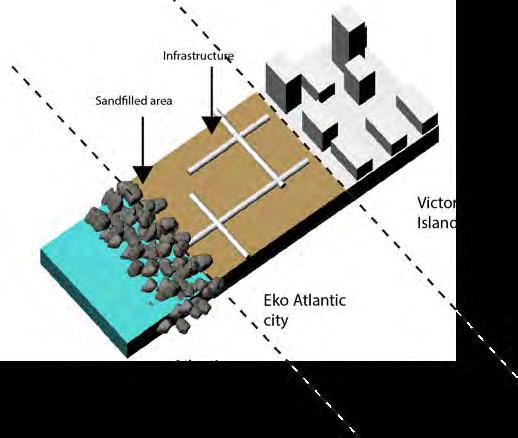

Southern Nigeria A-85
Figures 31-35 Taxonomy component of the Eko Atlantic city by author

Theories and Methods of Urban Design Winter 2020 A-86
Figure 36- Actors and agents (drawing by author)
 Southern Nigeria A-87
Figure 38- Transect drawing by Author
Figure 37- Figure ground drawing by author












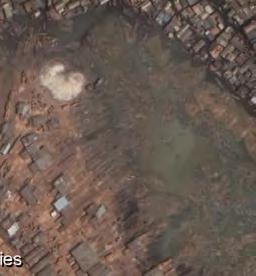


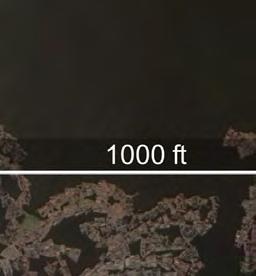

Theories
and Methods of Urban Design Winter 2020 A-88
Figure 40- Aerial view of Makoko
25. Simpson, Sarah. “Lagos, the Mega-City of Slums.” The New Humanitarian, April 22, 2016. https://www.thenewhumanitarian.org/ news/2006/09/05/lagos-mega-city-slums.
MAKOKO SLUMS
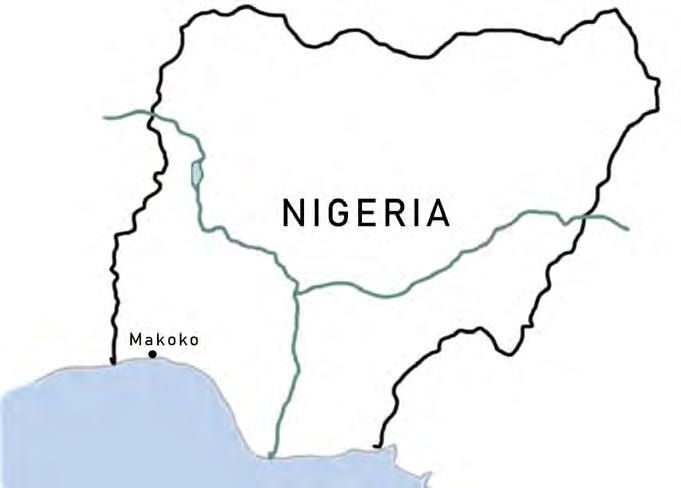
SOCIAL URBANISM
26. Udoma, Olumide. “Makoko: ‘Venice of Lagos’.” Smart cities drive. Accessed May 21, 2020. https://www.smartcitiesdive.com/ex/ sustainablecitiescollective/makoko-venicelagos/241671/.
Lagos is a megacity of a population of 20 million and presents a house deficit problem of about 2.5 million people in a constantly growing city. In Lagos, about two of every three people live in a slum.25 Makoko is an informal settlement with about half of its population living on the Lagos lagoon in structures built on stilts.26The sprawling community currently estimated at 150,000, began in the 19th century as a fishing village for immigrants, who settled on the water’s edge.27 In 2012, some 200 households were rendered homeless by demolitions exercised by the Lagos state government. By 2018, the government announced further plans to evacuate all water-front shanty towns in the city they were “desirous of restoring the amenity and value of the waterfront”
Location Year(s) Status
Population Designer
Additional Agents
Key Project Components & programs
[Marine swamps, homes on stlit, social interventions by designers and philantropists]
Southern Nigeria A-89
[1800’s] [ Built ] [300,000] [Self-built]
[Lagos, Southwest Nigeria]
THE PROJECT AND THE URBANISM
Neighborhood improvement emerges as a response to the failure of all those coercive actions and measures of control which saw the eradication of urban informality as the only possible solution.28 Makoko community receives little to no support for public goods and amenities for proper sanitation, education and healthcare from the state government while constantly faced with threats of eviction. The policies of neighborhood improvement imply the implementation of actions that channel resources to perfect the physical conditions of a settlement for its progressive incorporation into the formal urban fabric.29 However, a few organizations, urban designers and philanthropists have installed some socially responsible projects within the community.
In 2012, Architect Kunle Adeyemi built a floating school on the water to serve the urgent needs of education in this community. It was a prototype developed to demonstrate a water urbanism which promotes living with water rather than aiming to suppress or dominate it. The physical envelope presented a modular, scalable architecture with an innovative foundation system, while the social context of the intervention proposed a new but familiar architecture to support education, healthcare, and community gatherings.30 Between 2013 and 2017, the Makoko Neighborhood Hotspot offered a technical and social infrastructure31 providing bio-gas linked to community toilets and also creating a business incubator for converting waste to biogas. Both interventions involved a bottom up approach; because the projects were embedded into the physical and social fabrics of the Makoko community; using locally-sourced materials and adapted construction systems together with a self-build approach where community members were involved in the consultation and the building process.
27. French Press Agency. “Makoko, ‘Venice of Africa,’ Faces Demolition Prospects in Nigeria.” Daily Sabah. Daily Sabah, May 17, 2018. https://www.dailysabah.com/ africa/2018/05/17/makoko-venice-of-africafaces-demolition-prospects-in-nigeria.


28. Rojas, E. (2009). Construir ciudades. Mejoramiento de barrios y calidad de vida urbana. Estados Unidos: Banco Interamericano de Desarrollo (BID).
29. Restrepo , Alejandro, and Francesco . Orsini. “INFORMALITY AND SOCIAL URBANISM IN MEDELLÍN,” n.d. https://www.umass.edu/larp/sites/default/ files/AE%20FM%20Informality%20 and%20Social%20Urbanism%20in%20 Medelli%C2%A6%C3%BCn.pdf.
Theories and Methods of Urban Design Winter 2020 A-90
Fig 41-43 A cross-section of images showing the physical and socio-economic conditions in Makoko


 Southern Nigeria A-91
Fig 44
Illustration by Author
Apart from providing for immediate needs for social amenities, I think these projects present an opportunity for the Lagos state government to take a critical look at informal settlements within the city. The root cause of slums is poverty itself and if 50% of the igerian population currently live in poverty; then slums will continue to remain a part of our urban lives. It is therefore more efficient for the government to budget its scarce resources towards neighbourhood improvement schemes, rather than recurring demolition activities.

30. “Makoko Research – Heinrich Böll Stiftung – 2012.” NLE, April 2012. http://www. nleworks.com/publication/makoko-researchheinrich-boll-stiftung/.
31. Makoko Neighborhood Hotspot .” World Architects. Accessed May 21, 2020. https:// www.world-architects.com/en/fabulous-urbanzurich/project/makoko-neighborhood-hotspot.
Theories and Methods of Urban Design Winter 2020 A-92
Fig 45- Synthetic collage by Author
Water tanks for cleaning purposes


Waste-to-energy business incubator
Space for social interaction
Southern Nigeria A-93
Fig 46-50-Taxonomy component of the Makoko Neghbourhood Hotspot project (graphics by Author)
Pit Latrine Bio-gas storage tanks

Theories and Methods of Urban Design Winter 2020 A-94
Figure 51- Actors and agents (drawing by author)
Southern Nigeria A-95
Figure 53- Transect drawing by Author
Figure 52- Figure ground drawing of Makoko by author
BOHAI ECONOMIC RIM CHINA
01 IDENTIFICATION OF THE TERRITORY AND LOCATION
The Bohai Economic Rim, located in the north of China, is one of the three major economic zones in the country and includes the Beijing-Tianjin-Hebei Region, Shandong Peninsula, and Liaoning Peninsula.1 This territory has seven development regions (Zhongguancun in Beijing, Binhai New Area in Tianjin, Caofeidian in Hebei, Shenyang Economy Zone and Liaoning Coastal Economic Zone in Liaoning, Yellow River Delta Eco-Economic Zone, and Shandong Peninsula Marine Economic Zone in Shandong).2 Its rapid development and its geo-strategic location had made it the area with the most potential for growth in the north of China.
02 RELEVANCE FROM THE POINT OF VIEW OF URBAN DESIGN THEORY AND PRAXIS
As one of the fastest-growing urbanized areas in China, the Bohai Economic Rim is a significant case study exploring the mechanisms for sustainable coastline development, the construction of the regional transportation system, and functional transformation of its coastal cities. In terms of development, there are two main goals: improving the environmental problems of seawater pollution, sedimentation, and erosion and the regional economic development through improved transportation links.
The severe environmental pollution in the Bohai Bay relates to different factors. Geographically, the inner ring of the Bohai Bay limits its seawater exchange capacity. The Yellow River estuary in the Bohai Rim brings large amounts of sediment and upstream pollutants. Coupled with heavy industry in Liaoning, aquaculture in Shandong, and the pressures of coastal cities in the Beijing-Tianjin-Hebei region, the Bohai Bay environmental condition is under stress. Since 1940, the area of Bohai has shrunk 5700 km2; the natural coastline length has decreased from 1397km to 561km.3 Figure 02 shows the changes in the coastline of Tianjin Port where human intervention has significantly accelerated since 2000.
2.
August-2011.pdf.
Theories and Methods of Urban Design Winter 2020 A-96
1. Yuan Gong, Yu Xiao, Li Lu. “Study on Emphases and Trend of Tianjin Urban Public Safety Planning from the View of Bohai Rim Megalopolis,” Journal of Civil Engineering and Architecture71, Volume 7, No. 10 (Oct 2013):1204, DOI: 10.17265/19347359/2013.10.003.
Research on space developing mode of Bohai rim megalopolis, Tianjin planning bureau, https://www.glc.org/wp-content/ uploads/2016/10/Bohai-Rim-visit-china-
[Critical DATA]
Geographical Delimitation
Municipalities: Beijing, Tianjin
Provinces: Liaoning, Hebei, Shandong
Area
Coastline Length: 2668 km
Land Area: 522000 km2
Bohai Sea Area: 95000 km2
Population
240 million [as of 2011]
Social Indicators
Qing Dynasty: Low population in northeast of China, no economic zone
1860-1900: Business Ports
1900-1930: Transportation Network
1930-1949: War Period, Industrial Base
Economic Indicators
GDP(2010): 10.1 trillion RMB(1.5trillion U.S. dollar), 25.3% of China
GDP per capita: 41000RMB(6300 U.S. dollar)
Hub Ports: Qingdao Port, Tianjin Port, Dalian Port
High-Speeds Railway: 2 in operation, 4 under construction
Express Way: 12190 km
Environmental Indicators
Nature Coastline Length: 561km
Annual Sewage Discharge: 2.8 billion tons
Annual Pollutant: 700,000 tons
3. Hou X Y, Zhang H, Li D, Hou W, Song Y. Development trend, environmental and ecological impacts, and policy recommendations for Bohai Sea reclamation. Acta Ecological Sinica, Vol. 38, Issue 9 (2018):3311-3319.
4. “Tianjin Eco-City”, Archdaily, last modified January 11, 2011, https://www.archdaily. com/102887/tianjin-eco-city-surbana-urbanplanning-group?ad_source=search&ad_ medium=search_result_all
5. Shougang Group. “Caofeidian Park.” Accessed April 13, 2020. https://www. shougang.com.cn/en/ehtml/CaofeidianPark/.
Bohai Economic Rim China Bohai Economic Rim A-97
6. Theguardian, “Caofeidian, the Chinese ecocity that became a ghost town - in pictures.”, Last modified July 23, 2014. https://www. theguardian.com/cities/gallery/2014/jul/23/ caofeidian-chinese-eco-city-ghost-town-inpictures
7. Kong, Lin. “Research on the Industrial Upgrading of China’s Bohai Economic Rim,” DEStech Transactions on Economics, Business and Management, (2018):642, DOI: 10.12783/ dtem/icssed2018/20323.
8. Wenhai, Lu & Cusack, Caroline & Baker, Maria & Tao, Wang & Mingbao, Chen & Paige, Kelli & Xiaofan, Zhang & Levin, Lisa & Escobar, Elva & Amon, Diva & Yue, Yin & Reitz, Anja & Neves, Antonio & O’Rourke, Eleanor & Mannarini, Gianandrea & Pearlman, Jay & Tinker, Jonathan & Horsburgh, Kevin & Lehodey, Patrick & Yufeng, Yang. “Successful Blue Economy Examples With an Emphasis on International Perspective,” Frontiers in Marine Science, Volume 7(June 2019):261, Http://doi. org/10.3389/fmars.2019.00261.
9. Ibid

10. Jianing Song. “Thoughts on Bohai Sea Ecological Environment Governance,” China Development, Volume 17, No 5(2017): 7-12
11. Xu, Ning & Gao, Zhiqiang & Ning, Jicai. “Analysis of the characteristics and causes of coastline variation in the Bohai Rim (1980–2010),” Environmental Earth Sciences75, Volume 8 (April 2016): 719, http://doi. org/10.1007/s12665-016-5452-5.
The opportunity to minimize the environmental impacts of this rapid urbanization of the territory is central to the role of urban design. As the new development projects like the Sino-Singapore Tianjin Eco-city, the HuludaoXingcheng Coastal Trail, and the Qinhuangdao Beach Restoration propose strategies to balance sustainability and the economy, this research scrutinizes the ecological and environmental protection measures they incorporate.4 Regional economic cooperation is accompanied by coordination on industrial development and measures to upgrade the existing production flows. In this sense, as Beijing and Tianjin mainly focus on developing high-tech industries, traditional heavy manufacturing plants are gradually converging towards the coastline. This is the case of the relocation of the Shougang Iron and Steel Plant to the coastline of Caofeidian in Hebei.5 The steel plant jointly constructed by Beijing and Hebei aimed to promote regional cooperation and promote the development of new coastline areas. However, the status quo proves that this development model is a failure. Over-development and unreasonable planning have turned Caofeidian New District into a ghost town.6 Liaoning and Hebei have been traditional gathering places for heavy industry since the founding of New China.7 With the agglomeration of coastline industries and the erosion and sedimentation of the Bohai Rim, China has intensified efforts toward coastline management in the past five years.8 Figure 03 records the riverbed after ebb near the Xinchang Bridge in Huludao City, Liaoning Province. The water in the river channel was abnormally coloured red due to the industrial pollution, and it eventually flowed to the Bohai Sea. Some cities along the Bohai Rim have rehabilitated and restored the polluted coastline.9 Since 1998, the State Environmental Protection Administration and the Ocean Administration have issued a number of policies, such as the “Blue Sea Action Plan”, but this top-down policy has had little effect. The lack of clear division of management and regional responsibilities has caused the Bohai Sea to fall into the tragedy of the commons.10 The introduction of new regional governance policies like the Bohai Sea Comprehensive Management Action Plan in 2018 may bring some positive change, but it is yet too early to know.
The main factor affecting coastline change is anthropogenic development activity.11 The Bohai Rim is the center of the production of energy and raw
Theories and Methods of Urban Design Winter 2020 A-98
Figure 01. Coastline Changes of the Bohai Bay
TIMELINE : HISTORY, ACTORS AND EVENTS
2020 2010
Regional Level:Construction of the Bohai Rim high-end headquarters base began.
National Level: The State Council approved the outline of cooperation and development in the Bohai Rim Region.
Beijing Olympics
Regional Level:Tianjin become the economic center of the Bohai Economic Rim.
National Level: China identified seven development zones, one of which is the Bohai Rim.
Regional Level: Bohai Strait Tunnel was proposed.
National Level: The concept of the Bohai Economic Rim was first proposed.
National Level: China began reform and opening-up.
Regional Level: Tangshan Earthquake

National Level: 10 years Cultural Revolution. Slow economic development.
National Level: Three years of famine. National food and non-staple food shortage crisis caused by the Great Leap Forward Movement and the policy of sacrificing agricultural development industry.
National Level: The foundation of The People’s Republic of China.
International Level: The Bohai Rim region was controlled by Japan and was called the Greater East Asia Co-prosperity Sphere. The construction of ports and industrial bases has accelerated the process of urbanization and has had an impact on the economy and environment of the Bohai Rim.
National Level: Emperor Guangxu decided to make Qinhuangdao a commercial port.
International Level: According to the Convention of Beijing, Tianjin Treaty Port opened. Since then, the construction of ports has begun in the Bohai Rim region
Bohai Economic Rim A-99
Figure 02. Bohai Economic Rim
1940 1860
1990 2000
1980
1970 1978 1976 1996 2006 2008 2015 2018 1898 1937 1949 1985
1992
1900
1950 1959
1960
1966
materials in China, a large proportion of which is the heavy chemical and steel industry. The accumulated port investment in the Bohai Rim Region from 1999 to 2010 is 732 million RMB (105 million USD) with an annual growth of 23.7%, the highest in the three coastal metropolises in China including the Yangtze River and Pearl River Deltas.12 Figure 05 shows the highly competitive liner services and cargo in Dalian Port.


From a socio-political perspective, urban policy in China is responsible for directing internal migration to cities in China. This is one of the most extensive migrations in the world according to the International Labour Organization,13 with the rural population flowing from the central and western regions into the eastern coastal cities. The Bohai Rim Region alone has received more than 5 million migrants. With the arrival of migrant populations, the demand for urban infrastructure,education, mental health, housing, public transportation, and recreation changes dramatically. In this situation, the agency of the urban designer can help shape the systems and places that will accommodate these growing populations. The opportunity to deploy high-density urban development while minimizing environmental impacts is the center of many of these efforts in China.
03 METHODS TO CONDUCT YOUR INVESTIGATION
This investigation uses a mixed methods approach to illustrate the changes in the Bohai coastline. By combining cartographic analysis with research papers and recent urban policy driving development in the region, I trace the artificial and natural Bohai Sea coastline changes in the past 40 years. To illustrate the environmental crisis, the plans for economic growth and the social dynamics resulting from the massive migration, I use research studies published by the Tianjin Planning Bureau and the Ministry of Transport of the People’s Republic of China. Last, I focus on the environmental, infrastructural and economic growth aspects through the analysis of specific projects along the coastline. The Development & Planning of the Bohai Rim Megalopolis shows that seven development regions are under construction along the coastline. Approved by the
12. Lili Song, MarinavanGeenhuizen. “Port infrastructure investment and regional economic growth in China:Panel evidence in port regions and provinces” Transport Policy 36 (2014):173–183.
13. International Labour Organization, Accessed March 21, 2020. http://www.ilo.org/ beijing/areas-of-work/labour-migration/lang-en/index.htm.
Theories and Methods of Urban Design Winter 2020 A-100
Figure 03 Environment Pollution
Figure 04 Coastline Changes of the Bohai Sea
central government, each region contains multiple projects and urbanisms worthy of study. By mapping industrial distribution, transportation facilities, and natural resource distribution in this territory, I chose three projects, Jiaozhou Bay Bridge and Tunnel, Qinhuangdao Beach Restoration and 798 Art District. These three projects represent the character of the region’s development and completed more exploration to relate them with different urbanisms.
05 ANTICIPATED FINDINGS
This research paper focuses on the rapid coastline changes in Bohai Economic Rim from the perspective of development and regional integration. Through the study of specific projects, I expect to reveal the complex entanglement of economic growth interests and environmental protection needs in a new generation of urban design projects.
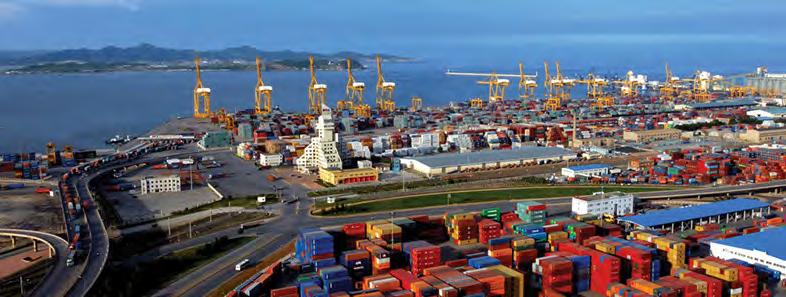
Focusing on the needs of increased connectivity, the Bay Bridge and Tunnel is part of regional traffic that illustrates the ambitions of infrastructural urbanism well. A Huge investment in infrastructure is always accompanied by controversy. Whether high-risk and high-investment projects are glorious symbols of government merit or truly convenient projects for citizens is worthy of further discussion.
The Bohai Sea environmental governance has been a big problem since the 1980s. With top-down policies failing, local governments are looking for new ways to improve the coastline conditions. Qinhuangdao beach restoration is an ecological project designed by landscape architect Yu Kongjian who was invited to participate in the design by the local government. Can eco-urbanism approaches in coastal cities be suitable to respond to regional environmental governance needs?
The 798 Art District, located in Beijing, is the largest culture-driven postindustrial intervention in China. Can the lessons learned by de-industrialization inform the Bohai Economic Rim industrialization efforts?The unique transformation of this site serves as an empirical case for a new type of industrial coastline area in the Bohai Economic Rim.
Bohai Economic Rim A-101
Figure 05 Port Construction

Theories
0
and Methods of Urban Design Winter 2020 A-102
1 mile
Figure 06 Jiaozhou Bay Aerial View
THE JIAOZHOU BAY BRIDGE AND TUNNEL [INFRASTRUCTURE URBANISM]
14.
agencies. “The
Engineering & Technology. Volume: 6, No. 7(Aug 2011):10, http://doi.org/10.1049/et.2011.0722.
Transportation is essential for the development of the Bohai Economic Rim. With more than 60 ports, the connection between them and the cities plays a vital role in economic development and urban life. The Jiaozhou Bay Bridge and Tunnel connect the port city of Qingdao with its Huangdao suburb and Hongdao Island.14 As the first subsea tunnel project in China, it offers the opportunity for the construction of the Bohai Strait Tunnel project.15
2011): 2971–76. https:// doi.org/10.4028/www.scientific.net/amr.368373.2971
The Jiaozhou Bay Bridge reduces the distance between Qingdao and Huangdao by 30 km and the travel time by 20 to 30 minutes. Although the bridge shortens commuting time, many people question why it was built in the widest part of the bay instead of the narrowest. The bridge is ten times the length of the nearest bay, which resulted in unusually expensive construction.
Location Year(s) Status

Footprint Designer
Additional Agents
Key Project Components Program(s)
Funding Streams
[Qingdao, CHINA]
[2011]
[Built]
[36.48km/7.80km]
[China Hignway Planning and Design Institute]
[Relevant to the conceptualization of the project]
... You may need another line...
[Transport Facilities, Connection of Cities]
[Cross-sea Bridge, Subsea Tunnel]
[Public and Private]
Bohai Economic Rim A-103
Wire
Graphic,”
15. Song, Chao Ye, and Shu Ming Zhou. “The Overall Design of Qingdao Jiaozhou Bay Subsea Tunnel.” Advanced Materials Research 368–373 (October
0 100 km
Figure 07 National Highway System Plan in Bohai Economic Rim.
The nearest sides of the Bay are the old city of Qingdao and the newly planned economic development zone. There is not enough space in the old city to build a giant pier, and the expensive land price in the development zone also makes the plan difficult to implement. The designer chose to connect the bridge with the national highway, which made the bridge not only a channel for commuting and cargo transportation, but also connected with larger regional traffic flows. For the connection to the nearest point of the bay, the Jiaozhou bay tunnel serves as the citizens’ way to commute.
Cross-bay bridges bring into question the environmental impacts caused by their construction. As an inner ring bay, the water exchange capacity is not strong. Studies show that the construction of the Jiaozhou Bay Bridge further reduces the water exchange capacity, resulting in the inability to discharge pollutants in the water.16 Coupled with the impact of coastal aquaculture on water bodies, pollutants may accumulate in Jiaozhou Bay and affect life and production. For such infrastructure construction, environmental impact assessment and protection measures are essential. Digital urbanism and smart city urbanism have great application in this area. Therefore, designers should encourage the use of remote sensing, GIS and other technologies to provide supervision and adjustment measures during project design, construction and operation.

Theories and Methods of Urban Design Winter 2020 A-104
16. Pin Li, Guangxue Li, LuluQiao, Xueen Chen, Jinghao Shi, Fei Gao, Nan Wang, Shuhong Yue. “Modeling the tida ldynamic changes induced by the bridge in Jiaozhou Bay,Qingdao,China,” Continental Shelf Research 84(2014): 43–53. https:www.elsevier. com/locate/csr
Figure 08 Jiaozhou Bay Bridge
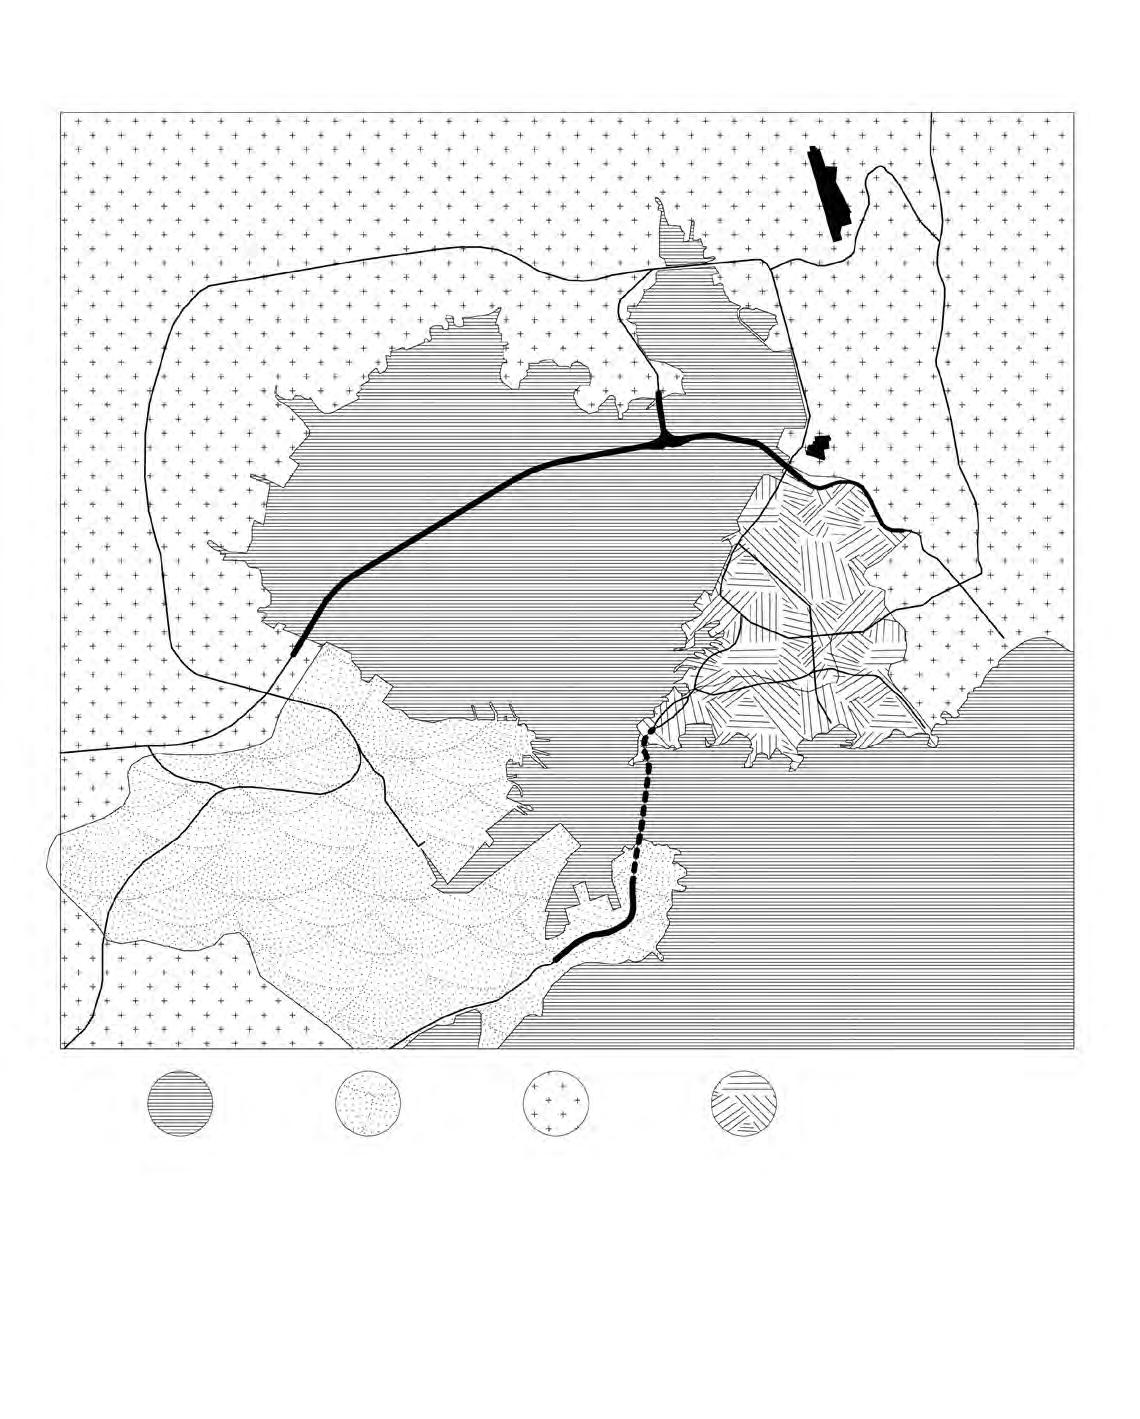
Bohai Economic Rim A-105 0 1 mile
Figure 09 Jiaozhou Bay Bridge Figure Plan
Water Development Land City Zone
THE PROJECT AND THE URBANISM
Stan Allen proposed the social and spatial impact of infrastructure intervention on cities.17 In addition to the impact on the economy and ecology, the impact of the cross-sea bridge on society and space is also very interesting. Qingdao has held the Qingdao Bay Bridge Marathon since 2018.18 Jiaozhou Bay Bridge has become an attractive marathon track, enhancing the city’s reputation and influence, and promoting the development of local tourism. Infrastructure also provides opportunities for urban cultural communication. A similar case is the Chesapeake Bay Bridge.19
The construction of the Jiaozhou Bay Bridge also affected the spatial form of the bridge ’s starting and ending points. The starting point of the bridge in the old city became a new transportation hub. Both Qingdao South Railway Station and Qingdao International Airport started planning and construction after the bridge was completed and put into operation one after another. The formation of a transportation hub has accelerated the planning of local infrastructure and business services and improved the quality of life of residents. The end of the bridge forms a new development zone, and planners are even considering adding another bridge route to drive the new zone development.
17. Stan Allen, Points Lines: Diagrams and Projects for the City (New York: Princeton Architectural Press,1999)

18. “Qingdao Bay Bridge Marathon”, Sdchina, accessed April 14, 2020.http://english.sdchina. com/show/4364950.html.
19. Chesapeake Bay Bridge-Tunnel. http:// www.cbbt.com/
Theories
A-106
and Methods of Urban Design Winter 2020
Figure 10 Jiaozhou Bay Bridge and Tunnel Taxonomy


A-107
Bohai Economic Rim
Figure 12 Jiaozhou Bay Bridge and Tunnel Section
Figure 11 Jiaozhou Bay Bridge and Tunnel Actors
 Figure 13 Jiaozhou Bay Bridge Collage
Theories and Methods of Urban Design Winter 2020 A-108
 Bohai Economic Rim A-109
 Theories and Methods of Urban Design Winter 2020 A-110
0 200m
Figure 14 Qinhuangdao Beach Restoration Aerial View
25, No 3(May 2009):732, http://doi.org/10.2112/07-0959.1.
QINHUANGDAO BEACH RESTORATION [ECOLOGICAL URBANISM]
The heavy industrial pollution along the coastline in the Bohai Sea has caused the progressive decrease in water quality. The coastline has suffered from intense erosion caused by anthropogenic development activities. Dam and reservoir construction have lead to serious erosion while coastal engineering, tourism, and storm surges have further intensified this problem.19 The Qinhuangdao Beach Restoration aims to rehabilitate these damaged coastline environments, restore the beauty of the site and encourage public participation. This project demonstrates how to transform a damaged landscape into a pleasant beach with a sustainable and harmonious man-nature relationship by incorporating ecology.20 The project balances the delicate relationship between land and sea, and restores areas contaminated with sewage, garbage and other wastes, while enriching life in coastal areas.
Location Year(s) Status
Footprint Designer
Additional Agents
Key Project Components Program(s)
Funding Streams
[Qinhuangdao, CHINA]
[2006]
[Built]
[74 Acres]

[Kongjian Yu/Turenscape]
[Relevant to the conceptualization of the project]
[Park, Ecological Restoration]
[Boardwalk, Museum, Embankment]
[Public]
Bohai Economic Rim A-111
20. Xue, Zuo (George) & Feng, Aiping & Ping, Yin & Xia, Dongxing. “Coastal Erosion Induced by Human Activities: A Northwest Bohai Sea Case Study,” Journal of Coastal Research. Volume
21. William S. Saunders, Kongjian Yu. Designed Ecologies: The Landscape Architecture of Kongjian Yu(Basel: Birkhäuser,2012): 94-99
0 100 km
Figure 15 Location of oil field in the Bohai Sea..
However, ecological protection is not the only goal of beach management in Qinhuangdao. The city is looking for opportunities to become an international tourist destination as part of the regional development plan. Qinhuangdao offers an interesting example of ecotourism. Through the design and management of the beach as a bird habitat and watching place,21 the city promotes the development of other tourism projects. Commercial accommodation and recreation projects were built near the beach at the same time as the construction of “sponge” greenbelt along the coast to prevent polluted surface rainwater from entering the ocean.22
THE PROJECT AND THE URBANISM
Landscape designer Kongjian Yu argues that an ecological approach is urgently needed both as a remedial device for the contemporary city and as an organizing principle for new cities.23 From an urban perspective, this design is a good remedy for contemporary coastal cities when dealing with the need to improve water quality. The concept of the sponge park is an ecological buffer zone that can absorb water, store water, seep water, and purify water. In this long and narrow plot, a way has been found for humans, nature and other species to live in harmony. The environment of this bird habitat has been greatly improved, and it has also brought economic benefits. This is a reasonable direction for sustainable development for the coastal city of Qinhuangdao.
However, from the perspective of regional development, one or two projects are not enough. Just as the ecosystem is a whole, eco-urbanism also hopes to build a system-based and multi-scalar ecological approach to addressing urgent environmental concerns.24 Due to the failure of the top-down ecological governance strategy, the smaller design projects offer another opportunity for restoring the ecological system around the Bohai Sea. The biggest challenge is to form regional governmental collaboration and bring together local residents, public officials, and local, national and international experts to develop innovative solutions to the issues in the Bay Area. In addition to the restoration of existing cities, the control of the new city’s ecological organization principle is now more urgent. Whether the esteem of the sponge city policies (sponge city is a

Theories and Methods of Urban Design Winter 2020 A-112
22. Yu Kongjian, “COASTAL LANDSCAPES,” Landscape Architecture Frontiers. Vol. 5, Issue 4(2017), doi:10.15302/J-LAF-20170401.
23. Chinadaily. “Healthcare industry takes off in the serene Beidaihe district.” Last modified September 15, 2017. https://www.chinadaily. com.cn/kindle/2017-09/15/content_32036401. htm.
24. Mohsen Mostafavi, Gareth Doherty. Ecological Urbanism , Lars Müller Publishers, 2010.
25. Maria Arquero de Alarcon and Mclain Clutter, “Informal Urbanism,” Theories and Methods of Urban Design, University of Michigan,2018.
Figure 16 Qinhuangdao Beach Restoration
 Bohai Economic Rim A-113
0 200m
Figure 17 Qinhuangdao Beach Restoration Figure Plan.
Water Land Green Beach Plaze
city structured and designed with a floor control system which can absorb and capture rainwater and utilize it in urban life.25) in recent years will affect the design and future development of the new city is an area of opportunity for the urban designer. At the same time, the development of sponge cities also provides new areas for flood control and urban water system management. I believe that more than one method can promote “the development of multidimensional sustainable human communities within harmonious and balanced built environments”.26


Theories and Methods of Urban Design Winter 2020 A-114
Figure 18 Qinhuangdao Beach Restoration Figure Plan.
Figure 20 Qinhuangdao Beach Restoration Figure Plan.
26. Kees van Leeuwen, Jan Hofman, Peter Driessen, Jos Frijns, The Challenges of Water Management and Governance in Cities(Basel: MDPI AG,2019), 159.
27. Miguel Ruano. EcoUrbanism, Published by Watson-Guptill Pubns 1998.


Bohai Economic Rim A-115
Figure 19 Qinhuangdao Beach Restoration Figure Plan.
 Figure 21 Qinhuangdao Beach Restoration Collage
Theories and Methods of Urban Design Winter 2020 A-116

Bohai Economic Rim A-117

0 200 m
Figure 22 798 Art District District Aerial View
Theories and Methods of Urban Design Winter 2020 A-118
46(2015):147-155, https://doi.org/10.1016/j. habitatint.2014.11.007.
THE 789 ART DISTRICT [POST-INDUSTRIAL URBANISM]
The Bohai Rim Industrial Belt has emerged rapidly in the recent years, attracting industries with cheaper land and better connections. Companies gradually moved out of cities and closer to coastal areas leaving behind old industrial areas. The 798 Art District in Beijing is one exemplary case that has preserved the building stock and introduced new functions. A new cultural symbol of factory transformation in Beijing, it was reformed in the 1980s. Beijing, as the political, cultural and economic center of China, has moved industry out of the city. Creative and cultural industries develop in old bauhaus style factories, reflecting the shift in the city’s positioning in the region.27 In this transformation, new industries need to find the balance of their economic function and cultural function.28
Location Year(s) Status
Footprint Designer
Additional Agents
Key Project Components Program(s)
Funding Streams
[Beijing, CHINA]
[1957]
[Built]
[173 Acres]
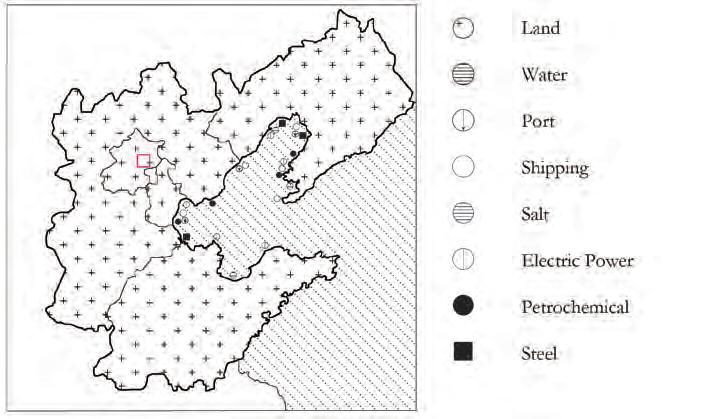
[Sasaki]
[Dessau Industrial Design Institute]
[Factory Renovation and Reuse, Spatial Intergration, Functional Transformation, SOHO Lifestyle, Cultural Innovation]
[Art Zone: Museum, Gallery, Art Center, Artist Studio, Design Company, Bar, Restaurant, Housing]
[Private]
Bohai Economic Rim A-119
28. Yimei Yin, Zhigao Liu, Michael Dunford, Weidong Liu. “The 798 Art District: Multi-scalar drivers of land use succession and industrial restructuring in Beijing,” Habitat International, Volume
29. John McCarthy, Yan Wang. “Culture, creativity and commerce: trajectories and tensions in the case of Beijing’s 798 Art Zone,” International Planning Studies, 21:1,(2016):1-15, DOI: 10.1080/13563475.2015.1114446
100 km
0
Figure 23 Industry distribution in the coastline of Bohai Economic Rim.
While attracting investors and artists, the art district should also consider the sustainable development of the industrial landscape. In recent years, the belief that the 798 Art District has been over-commercialized has been increasing.29 With too many top-down interventions, the sustainability of the industrial landscape has been undermined. The artists were forced to leave due to the increase in rent. Artists and residents who initially found the value of the post-industrial zone are ignored. The landscape was created by the different actors and the voices of the artists need to be heard.
THE PROJECT AND THE URBANISM
The recent history of the 798 Art District has demonstrated how urban designers can shape the cycles of industrialization and deindustrialization in our cities. The first group of people to discover its value were artists, as they needed a large space to be their studio, and the low price was attractive to them. After 10 years of free reuse, the site was partly revitalized. Then, architects and urban designers played an important role when the government planned to demolish the factories as part of the 2008 Beijing Olympics plans. Designers argued all these architectures and industrial infrastructure should be preserved as the heritage of Bauhaus Style in the city.
The vision plan designed by Sasaki in 2006 for the 798 Art District freed the site from the original demolition fate.30 The factory buildings have been transformed into a museum, gallery space and cafe, and the former humble courtyards and open spaces have also been transformed into outdoor sculptures and fashion exhibitions, and venues for various events. The design emphasizes that art is the premise of the district, improves the transportation and encourages the development of art-related projects.31 The plan enhances land value and promotes regional economic transformation and development through long-term strategies, thus was accepted by the government. This case proves that designers are helping to preserve industrial heritage and developing cultural industries is valuable in post-industrial urbanism.
30. Juncheng Dai, Xue Huang and Huasheng Zhu. “Interpretation of 798: Changes in Power of Representation and Sustainability of Industrial Landscape,” sustainability,Volume 7 (Apr 2015):5282-5303, DOI: 10.3390/ su7055282.
31. Archdaily. Accessed March 21, 2020. https://www.archdaily.cn/cn/892357/sasakiwei-bei-jing-798yi-zhu-qu-zhi-ding-yuan-jinggui-hua-duo-nian-cheng-guo-huo-apaguo-jizhuo-yue-jiang
32. Ibid

Theories and Methods of Urban Design Winter 2020 A-120
Figure 24 798 Art District District
 Figure 25 798 Art District Figure Plan
0 200m
Building Land
Bohai Economic Rim A-121
Today, in the face of the current over-commercialization of the 798 Art District, designers need to think about whether design has really helped the community and artists. In the post-industrial revival, it is important to balance the interests of the stakeholders. Designers need to find a platform where all kinds of voices are heard to ensure that the project serves different participants. Designers should more actively incorporate policy regulations controlling rentals and preventing gentrification of the spaces. This method is dedicated to controlling the proportion of art and commercial institutions and bringing artists back. Another method is to improve the management rights of artists. For example, the government establishes a democratic consultation organization composed of a multi-stakeholder community, or seeks an experienced management company to plan the development of the park.


Theories and Methods of Urban Design Winter 2020 A-122
Figure 25 798 Art District Taxonomy
Figure 27 798 Art District Section


Bohai Economic Rim A-123
Figure 26 798 Art District Actors
 Figure 28 798 Art District District Collage
Theories and Methods of Urban Design Winter 2020 A-124
 Bohai Economic Rim A-125
SICHUAN CHINA
01 IDENTIFICATION OF THE TERRITORY AND LOCATION
Sichuan, or “Chuan” or “Shu ‘’ for short, is one of China’s 23 provinces with Chengdu as the capital city. As a landlocked province, it is located in the southwestern part of China, with Chongqing in the east, Yunnan and Guizhou in the south, Tibet in the west, and Shaanxi, Gansu, and Qinghai Province in the north.
The geomorphology of Sichuan Province varies greatly from east to west, and the terrain is complex and diverse. It occupies most of the Sichuan Basin and the easternmost part of the Tibetan Plateau between the Jinsha River on the west, the Daba Mountains in the north, and the Yungui Plateau to the south. Sichuan is located in the transitional zone between the first-level Qinghai-Tibet Plateau and the middle second-level and lower reaches of the Yangtze River Plain. The terrain is characterized by high elevation in the west and low elevation in the east. The west part consists of a plateau and mountainous area, and the altitude is more than 3000 meters; the east consists of a large basin and hills, and the altitude is mostly between 500 to 2000 meters.
Eastern Sichuan, the Sichuan Basin, and surrounding mountains, belong to a humid climate zone in the mid-subtropics. Due to the characteristics of a maritime climate, this area is warm and humid throughout the year. Southwestern Sichuan, the mountainous region, belongs to a subtropical sub-humid climate zone. With huge temperature differences, it is cooler in the morning and warmer in the afternoon, and the four seasons are not obvious. 1
1.
2. tjj.sc.gov.cn
Theories and Methods of Urban Design Winter 2020 A-126
The total area of Sichuan Province is 486,000 square kilometers. At the end of 2018, Sichuan’s resident population was 83.41 million, with a GDP of 40678.13 billion yuan. 2 www.sc.gov.cn, n.d.
[Critical DATA]
Geographical Delimitation
Sichuan Basin, Tibetan Plateau, Jinsha River, Daba Mountains, Yungui Plateau, Han Valley, Jialing River, Yangtze River, Hengduan Mountains, Qin Mountains, Yungui Plateau

Area
485,000 km²
Population
83.41 million [as of 2018]
Social Indicators
Inhabitation history: 15 century B.C.
56 ethnic groups
China’s second Tibetan area
China’s only Dai ethnic group area
China’s Yi ethnic group area
Economies Indicators
4067.813 billion yuan [as of 2018]

44651 yuan per capita [as of 2017]
Environmental Indicators
Complex geological structure and rich geomorphological landscape
Eight National historical and cultural city
One World Cultural Heritage Site
Two World Irrigation Engineering Heritage

One World Cultural and Natural Heritage Site
Three World Natural Heritage Sites


Four Protected areas of the World’s Man and the Biosphere Protection

Sichuan A-127 Sichuan CHINA
World Natural Heritage Sites Sichuan Giant Panda Sanctuaries
Figure 01: Location of Sichuan
Figure 02~07: Heritages of Sichuan
World Cultural and Natural Heritage Sites Mount Emei Leshan Buddha
World Irrigation Engineering Heritage Dujiang Dam
World Cultural Heritage Sites Mount Qingcheng
World Natural Heritage Sites Huanglong
World Natural Heritage Sites Jiuzhai Valley
3. Lee, Rose Hum. The City: Urbanism and Urbanization in Major World Regions. Chicago: J. B. Lippincott Company, 1955.
4. Wang, Fang. “Research on the Evaluation of Urban Economic Vitality Based on MultiSource Data-Taking Chongqing and Chengdu as Examples.” Vibrant Urban and Rural HabitatProceedings of the 2019 China Urban Planning Annual Conference, n.d., 1696–1706.
5. Smith, Nicholas Russell. Urban Furnace: The Making of a Chinese City, 2015.
6. Centre, UNESCO World Heritage. “World Heritage List.” UNESCO World Heritage Centre. Accessed February 17, 2020. https:// whc.unesco.org/en/list/.
02 RELEVANCE FROM THE POINT OF VIEW OF URBAN DESIGN THEORY AND PRAXIS
Sichuan is an inland province; however, its remoteness and inaccessibility have never prevented its modernization. Because it sustains itself with the blessing of agriculture and amicable climate, it reveals how a region may survive without favorable policies or administrative attention. In 251BC, after the construction of the Dujiangyan Irrigation System, Sichuan became a place known as the “heavenly kingdom”, for its highly advanced agriculture. In 1203AD, as a result of a prosperous commodity economy, Sichuan firstly adopted the banknote into circulation and became one of the richest states in China. Though not favored by central government policies for a long time, it remained self-sustained by its advanced agriculture and yielded some well-developed cities through history. 3
Also, because of Sichuan’s diverse ethnic groups and typologies, it has always been inclusive in welcoming nearly all kinds of user-groups and their urbanisms. Buddhism settlements in the highlands, Taoist Temples in the mountainous areas, and historic cities in the basin all get along with each other, sharing a similar dialect, diet habits and attitudes. This inclusiveness invites different public involvement and different appropriation of typologies within the province. 4
The uneven distribution of cities in Sichuan stems from the unequal distribution of topography , which produces urbanisms that can not be unified in a simple framework. Residents in this area are mainly nomads, and the cities developed relatively late: most of them were formed in the 19th century. The southeast is a basin with a large population. Affected by natural conditions, cities and towns are mostly distributed along rivers, which is conducive to living and the production of water. At the same time, affected by traffic conditions, urban agglomerations are mainly distributed near railway or transportation channels. 5
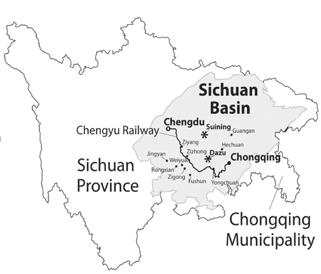
The “carnivalism”, celebrating consumption, in the regions produces

Theories and Methods of Urban Design Winter 2020 A-128
Figure 08: Location of Sichuan
1980
1960 1970
1950
1940
2008
Sichuan Tianfu New District becomes a national new district
Wenchuan Earthquake
Chongqing and the prefecture-level cities of Fuling, Wanxian, and Qianjiang all form a municipality directly under the Central Government from Sichuan Province. At this point, Sichuan and Chongqing were divided and formed into the administrative region of Sichuan Province today
Forth April, student upheaval
Sichuan has been China’s most populous province
Vigorous development of rural tourism represented by “agritainment”
The first test communication satellite developed by China was successfully launched in Xichang Satellite Launch Center
Sichuan province holds the first outbound Exhibition
When Deng Xiaoping came to power, Sichuan was one of the first provinces to try market economy companies

Affected by the Great Chinese Famine, about 9.4 million people died in Sichuan during this period
1954 Chongqing is once again incorporated into the Sichuan Province

1939
1935
Order of the National Government moving capital to Chongqing to separate Chongqing from Sichuan Province
About 3.5 million Sichuanese joined the army during the Anti-Japanese War
Chiang Kai-shek vigorously rectified Sichuan’s military, financial and transportation facilities, effectively strengthening the influence of the National Government in Sichuan
The Republic of China established the Kawabe Special Administrative Region, which recognizes the unique cultural and economic conditions of the region
The massacre and years of turmoil during the transition period of the Ming and Qing Dynasties, the population of Sichuan dropped sharply.
Buddhism remains influential in the region
Due to the stubborn resistance of the Sichuan military and civilian population, the population has plummeted and the economy has withered
The first real paper money in human history is called JiaoZi
Social stability in Sichuan region, economy enters its heyday


Li Bing family built Dujiangyan
Sichuan is a gathering place for amphibious military forces and a haven for political refugees
A highly developed ancient Shu civilization began to appeard.
Sichuan
in 1980s
A-129 Sichuan
900 1200 1600 1900
1990
2000
: HISTORY, ACTORS AND EVENTS 1930 1937 2014 1997 1989 1023
2010 25000 BC 256 BC 500
TIMELINE
2020
1978 1979 1984 1986
Figure 09~13: Photos of Sichuan in 1980s
appropriation of public spaces, offering a new lens in understanding its diverse public spaces. The highly developed agriculture enables citizens to have money to do extra recreational activities. Also, the amicable climate in the Sichuan Basin lengthens the available time for citizens to conduct outdoor activities compared to other cities. So carnivalism was born and prospered in the Sichuan Basin, offering new and temporary public spaces such as sidewalk Mahjong or outdoor teahouses, mahjong shop and outdoor restaurant. 6
The differences in economic levels make disaster management in eastern and western Sichuan uneven, which calls for more attention to designing for the prevention of natural disasters. Villages and towns in the West, located in areas with high earthquake frequency lack infrastructure, financial resources, training for professionals, and equipment to monitor earthquakes. Therefore, their emergency response capacity is poor, and they are greatly affected by natural disasters. After the 2008 earthquake, non-profit organizations and social organizations actively participated in the recovery plan, making up for the impact of low urbanization on disaster management. 7
However, domestic or global research on urbanism favors coastal cities and regions, and barely pays attention to this inland province. Its development happened in its own way, a unique and vernacular way, without much influence under globalization, industrialization or gentrification. So, Sichuan Province is worth of deep study about its regional characteristics and diverse urbanism. 8
8.
and
“Interpreting Gentrification in Chengdu in the Post-Socialist Transition of China: A Sociocultural Perspective.” Geoforum 93 (2018): 120–32. https://doi.org/10.1016/j. geoforum.2018.05.014.
03 METHODS TO CONDUCT YOUR INVESTIGATION
1. Through literature reviews, identify Sichuan’s cultural and ethnic background, identify the minority’s living condition and how this shaped the built urban or suburban environment.
2. Through mixed media such as documentaries and reports, address the

Theories and Methods of Urban Design Winter 2020 A-130
7. Lim, William Siew Wai. Public Space in Urban Asia. New Jersey: World Scientific, 2014.
Yang, Qinran,
Min Zhou.
Figure 14: Photos of Chengdu, Sichuan
https://doi.org/10.1017/ s1479591414000163.
impact brought by the Wenchuan Earthquake in 2008, and the reconstruction plan of those regions.
3. Through in-depth interviews, explore how Sichuanese feel about their preference for public spaces, and develop multi-generational approaches.


4. By mapping the inequality within Sichuan: regulations, topography, economy, ethnic groups and public spaces.
05 ANTICIPATED FINDINGS
From rural areas to urban areas, from minority ethnic groups to inclusive groups, from where residents are rightless to where residents are innovative, several conclusions could be drawn as follow:
1. Brutal redevelopment could lead to residents’ insurgency, even under the name of reconstruction of informalities. Changing the original urban context should be a careful decision not to sacrifice minority’s rights. Instead, it should provide adequate infrastructure and minimize the unevenness.
2. Not only how to survive natural disasters but also how cities recover from them should be equally important. Absolute and fast-forward developments may lead to undesired designs. Memorial design could happen in different ways, more than rebuilding it as a tourist site, more sustainable. 9
3. Privately-owned public space is playing an important role in shaping citizen’s lives . Its low cost and hybridity may contribute to its inclusiveness. Embracing the everyday habits of citizens could be productive to providing a place for people to interact and overcome political distance. 10
Sichuan A-131
9. Miller, Michelle Ann, Douglass, Mike. “Disaster Governance in Urbanizing Asia.” Book. Singapore: Springer, 2016.
10. Wang, Di. “Mahjong and Urban Life: Individual Rights, Collective Interests, And City Image in Post-Mao China.” International Journal of Asian Studies 11, no. 2 (2014): 187–210.

Theories
and Methods of Urban Design Winter 2020 A-132
Figure 15: Collage of people in Serta
 Sichuan A-133

0 0.1
mile Theories and Methods of Urban Design Winter 2020
A-134
Figure 16: Satellite Map of Serta Buddhist Academy
Location
Year(s)
Status
Footprint Designer
Key Project Components Program(s)
Funding Streams
SERTA LARUNG GAR BUDDHIST ACADEMY [INSURGENT URBANISM]
Serta Larung Gar Buddhist Academy is located approximately 20 kilometers southeast of Seda County, Ganzi Tibetan Autonomous Prefecture, Sichuan Province, at an altitude of 3600 meters. Surrounded by mountains, the monasteries at the bottom of the valley, centered on the large sutra hall of the Buddhist Academy, are densely packed on all sides of the hillside. On the highest mountain of the Buddhist College, there is a splendid building called “Altar City”. The name of the mandala in Sanskrit is “mandala”, which means a dojo that performs certain sacrifices in accordance with Buddhist tantra rituals.11 In 2010, there were more than 5,000 students, more than 100 teachers, and monks who came because of the fame of the Buddhist College, living in those crimson red cabins. The cabins are all built in a wood style that is traditionally found in this region and built closely together so that they appear almost on top of each other.
[Seda County, Ganzi Tibetan Autonomous Prefecture, Sichuan Province, CHINA] [1980]
[Built / Demolishing]

[Total footage: 4 square kilometers; Temple complex footage: 2.35 square kilometers; Overall floorage: 1.7 square kilometers]
[Khenpo Jigme Phuntsok]
[Dense wood shacks; Monastery; Buddhist Academy Hall]
[Academy, residence, monastery]
[Public and private]
Sichuan A-135
+
11. Zeng, Jie, and Tiange Liang. “Exploration of Town Planning of Wuming Buddhist College.” Urban and Rural Planning, 36–38.
Figure 17: Photos of pilgrimage in Serta Buddhist Academy
Figure 18: Location of Serta
Buddhist monks, along with their informal activities, created other uses and forms of urban space. They include spontaneous events, large Buddhist events, and daily meditation that defies or leads to escape from existing rules. Their reclaiming of natural space turning it into a high-density sprawl of residence around the academy introduced a heterogeneous while uniform style in architecture. 12

Using the insurgent urbanism lens is critical to examining what is happening after a lack of support from public administration. The Buddhists were shaping the environment on their own in the first place. While Buddhists transform the landscape around the academy, their co-habitation asks for more re-purposing of the existing fabric, making the overall landscape more religious and unique. There are different kinds of adaptation and reuse of neglected or residual spaces: the construction of hospitals for different genders, restaurants, Lama supermarket, Chinese supermarket, parking lots, and female and male public restrooms.
However, recently there has been control and exclusion . Public space has been both an expression of power and a subject of political control. 13 In the case of geological disasters such as landslides caused by severe weather, large-scale collapse is likely to occur, and due to lack of planning, garbage in the monk house area has been stacked randomly and dirty toilets will be difficult to control in the case of an epidemic. Therefore, the Seda County Government began to demolish and transform the Buddhist College in 2016 to improve the infrastructure such as fire passages, tourism main passages, sewage pipes, drinking water supply and garbage disposal, as well as new functional buildings such as vegetable markets, bathrooms, and restaurants.
Today there are attempts by individuals and religious communities for greater freedom.14 This fits in with the definition of insurgent urbanism: the practices of self-help and defiance to recognize the ability of individuals and opportunities in the right for affordable housing, for accessibility to everyday infrastructure and for quiet Buddhist practice environment against the dominant forces in the society. Urban design or planning shouldn’t drive people out of their habitat due to poor living conditions. Instead, respecting everyone’s right to qualified housing and infrastructure is important.15 It’s everyone’s right to claim municipal resources and legal settlements.
12. Li, Jin. “Reassembling Religion: SinoTibetan Encounters in Serta,” 2019.
13. Gayley, Holly. “Reimagining Buddhist Ethics on the Tibetan Plateau.” Journal of Buddhist Ethics, 2013.
14. Hou, Jeffrey. Insurgent Public Space: Guerrilla Urbanism and the Remaking of Contemporary Cities. New York, NY: Routledge, 2010.
15. “Spaces of Insurgent Citizenship.” Cities and Citizenship, 1998, 155–73. https://doi. org/10.1215/9780822396321-008.
Theories and Methods of Urban Design Winter 2020 A-136
Figure 19: Ariel view of Serta Buddhist Academy

Residence Road Track Footway Parking Healthcare Allotment Buddhist Academy
Sichuan A-137
Figure 20: Programs of Serta Buddhist Academy


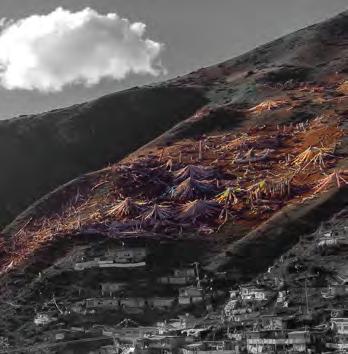


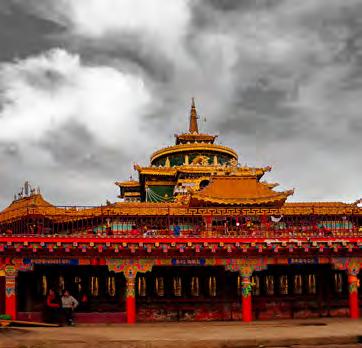
Monks Nuns Government Tour Guide Residents Shepherd Merchant Teachers Visitors Theories and Methods of Urban Design Winter 2020 A-138
Larong Hotel
Buddhist Academy
Meditation Hall
Sky Burial Stand
Destruction Ruins
Typical Housing
Figure 21~26: Programs of Serta Buddhist Academy


 Sichuan A-139
Tower Crane
Stupa
Construction Fence
Prayer Flag Solar Streetlight
Prayer Wheel
Figure 27~32: Taxonomy of Serta Buddhist Academy
Figure 33: Section of Serta Buddhist Academy
 Theories and Methods of Urban Design Winter 2020
A-140
Figure 34: Collage of Yingxiu Town
 Sichuan A-141

0 0.5
mile
Theories and Methods of Urban Design Winter 2020
A-142
Figure 35: Satellite Map of Yingxiu Town
16. He, Chang-Rong, Ru Zhang, Qun Chen, and Sheng-Li Han. “Earthquake Characteristics and Building Damage in High-Intensity Areas of Wenchuan Earthquake I: Yingxiu Town.” Natural Hazards 57, no. 2 (June 2010): 435–51. https://doi.org/10.1007/s11069-010-9624-4.

YING XIU TOWN RECONSTRUCTION [EMERGENCY URBANISM]
Yingxiu is a town in southern Wenchuan County, northwestern Sichuan province. It is located at the southern end of the Ngawa Tibetan Autonomous Prefecture, and lies on the road to Jiuzhaigou Valley, Wolong and the Siguniang Mountains. On 12th May 2008, the town suffered huge losses from the Magnitude 8.0 earthquake. It is at the epicenter and was one of the worst hit areas of the Sichuan earthquake. Most houses in the town collapsed with landslides everywhere causing water and power outages, and communication and traffic interruptions. Eighty percent of the town was destroyed and 5,462 people died among its ten thousand residents. 16 Yingxiu Town completely lost contact for more than ten hours after the earthquake. External rescue forces also found it extremely difficult to enter Yingxiu due to mountainous terrain and weather.
Location Year(s) Status Footprint Designer
Key Project Components Program(s)
Funding Streams
[Wenchuan County, Aba Tibetan and Qiang Autonomous Prefecture, Sichuan Province, CHINA]
[2008]
[Built]
[Total footage: 0.82 square kilometers]
[Tongji University; China Academy of Building Research; Paul Andrew; I.M.Pei; Jingtang He]
[Memorial Museums and Earthquake Relics]
[Residence, Commercial, Memorial, Education, Healthcare, Cemetery, Park, Hotel, Transportation]
[Public]
Sichuan A-143
+
Sichuan Basin
Wen chuan-Mao wen Fault Zone
Bei chuan-Ying xiu Fault Zone
An Town-Guan Town Fault Zone
Figure 18: Location of Yingxiu
Figure 36: 2008 Earthquake cause: fault zone
The town’s restoration attracted global attention and started quickly. The state government and the counterpart construction team were determined to rebuild it. They invited Shanghai Tongji University, the China Academy of Building Research and other architectural design and research units to the postdisaster reconstruction. Many international-level architectural design masters gathered in the town to design the memorial architecture. Paul Andreu was invited to design the International Academic Center for earthquake resistance and disaster reduction; Jingtang He was invited to design the epicenter and the Yingxiu Center Health Center and I.M.Pei was invited to design the Youth Activity Center. 17
Using the lens of emergency urbanism could be helpful to explore how this region recovered from the earthquake. Rebuilding the city is inevitable throughout the city’s construction history because the disaster was ubiquitous. What natural disasters bring are truly catastrophic for a city which is unprepared or trapped by technology or economic limitations to handle emergencies. 18
All types of disasters call for designing the city for resilience. They also call for memorialization of the disaster, and they aim to help all traumatized to recover mentally and physically.19 This nationwide endeavor asked for the allocation and cooperation in the process of reconstruction. It’s undeniable that the city-help-city policy accelerated the recovery process and architectural qualities. 20
However, in this “fast-forward “emergency recovery, there were some questions that needed to be answered. For example, how to better memorialize this earthquake? Is it only achievable through proliferation of large-scale public projects? And how could this tourism-oriented planning really echo residents’ spiritual needs. When they mourn their beloved, can they bond to the large, new architecture. Is there any formalism in designing the new residences? Last but not least, when local residents are poor, less educated and in deep grief, how do designers represent them and design for their real needs and requirements?
17. Liu, Jinfeng, Yong You, Xiaoqing Chen, Jiankang Liu, and Xingzhang Chen. “Characteristics and Hazard Prediction of Large-Scale Debris Flow of Xiaojia Gully in Yingxiu Town, Sichuan Province, China.” Engineering Geology 180 (2014): 55–67. https://doi.org/10.1016/j.enggeo.2014.03.017.
18. Vale, Lawrence J., and Thomas J. Campanella. The Resilient City How Modern Cities Recover from Disaster. Oxford: Oxford University Press, 2005.
19. Yong, Chen, and David C. Booth. “Reconstruction of Wenchuan.” The Wenchuan Earthquake of 2008, 2011, 222–47. https://doi. org/10.1007/978-3-642-21159-1_6.
20. Sorace, Christian P. “The Mirage of Development.” Shaken Authority, January 2017. https://doi.org/10.7591/ cornell/9781501707537.003.0006.

Theories and Methods of Urban Design Winter 2020 A-144
Figure 37: Photo of Yingxiu Town after reconstruction

River Residence Road Bridge Cable Car Terminal Expressway Main Road Tunnel New Memorial Landmark Earthquakes Relic
Sichuan A-145
Figure 38: Yingxiu Town Reconstruction Plan
Resident Tourist Receptionist Farmer Scientist Health Care Provider Nonlocal Scientist Hotel Owener Logistics Worker Restaurant Owner Museum Volunteer Cemetery Volunteer Government Resident’ relative Nonlocal NGO Worker Visitor Theories and Methods of Urban Design Winter 2020 A-146 Rebuilt Office Building Facade 1 Rebuilt Office Building Facade 3 Rebuilt Office Building Facade 2 Portable Earthquake Shelter Facade 1 Portable Earthquake Shelter Facade 2 Original Housing Facade 1 Original Housing Facade 1 Rebuilt Housing Facade 1 Rebuilt Housing Facade 2
Figure 39~47: Yingxiu Town reconstruction taxonomy


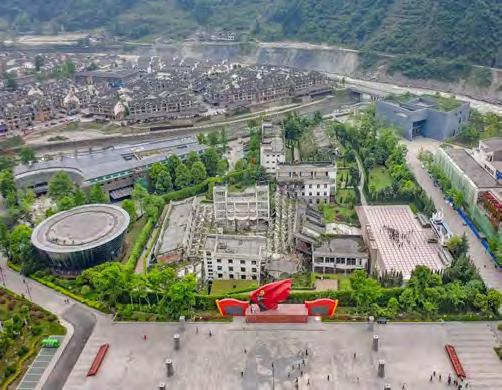

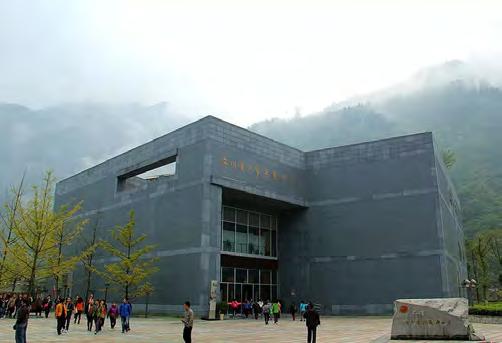
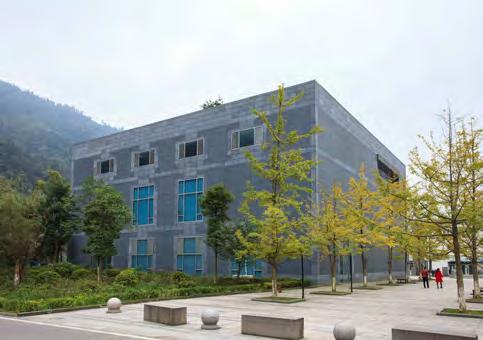
Worker
taxonomy
Sichuan A-147
Figure 52~53: Yingxiu Town Youth Activity Center, designed by I.M.Pei
Figure 50~51: Epicenter Memorial of Wenchuan earthquake, designed by Jingtang He
Figure 48~49: International Academic Center for earthquake resistance and disaster reduction, designed by Paul Andreu
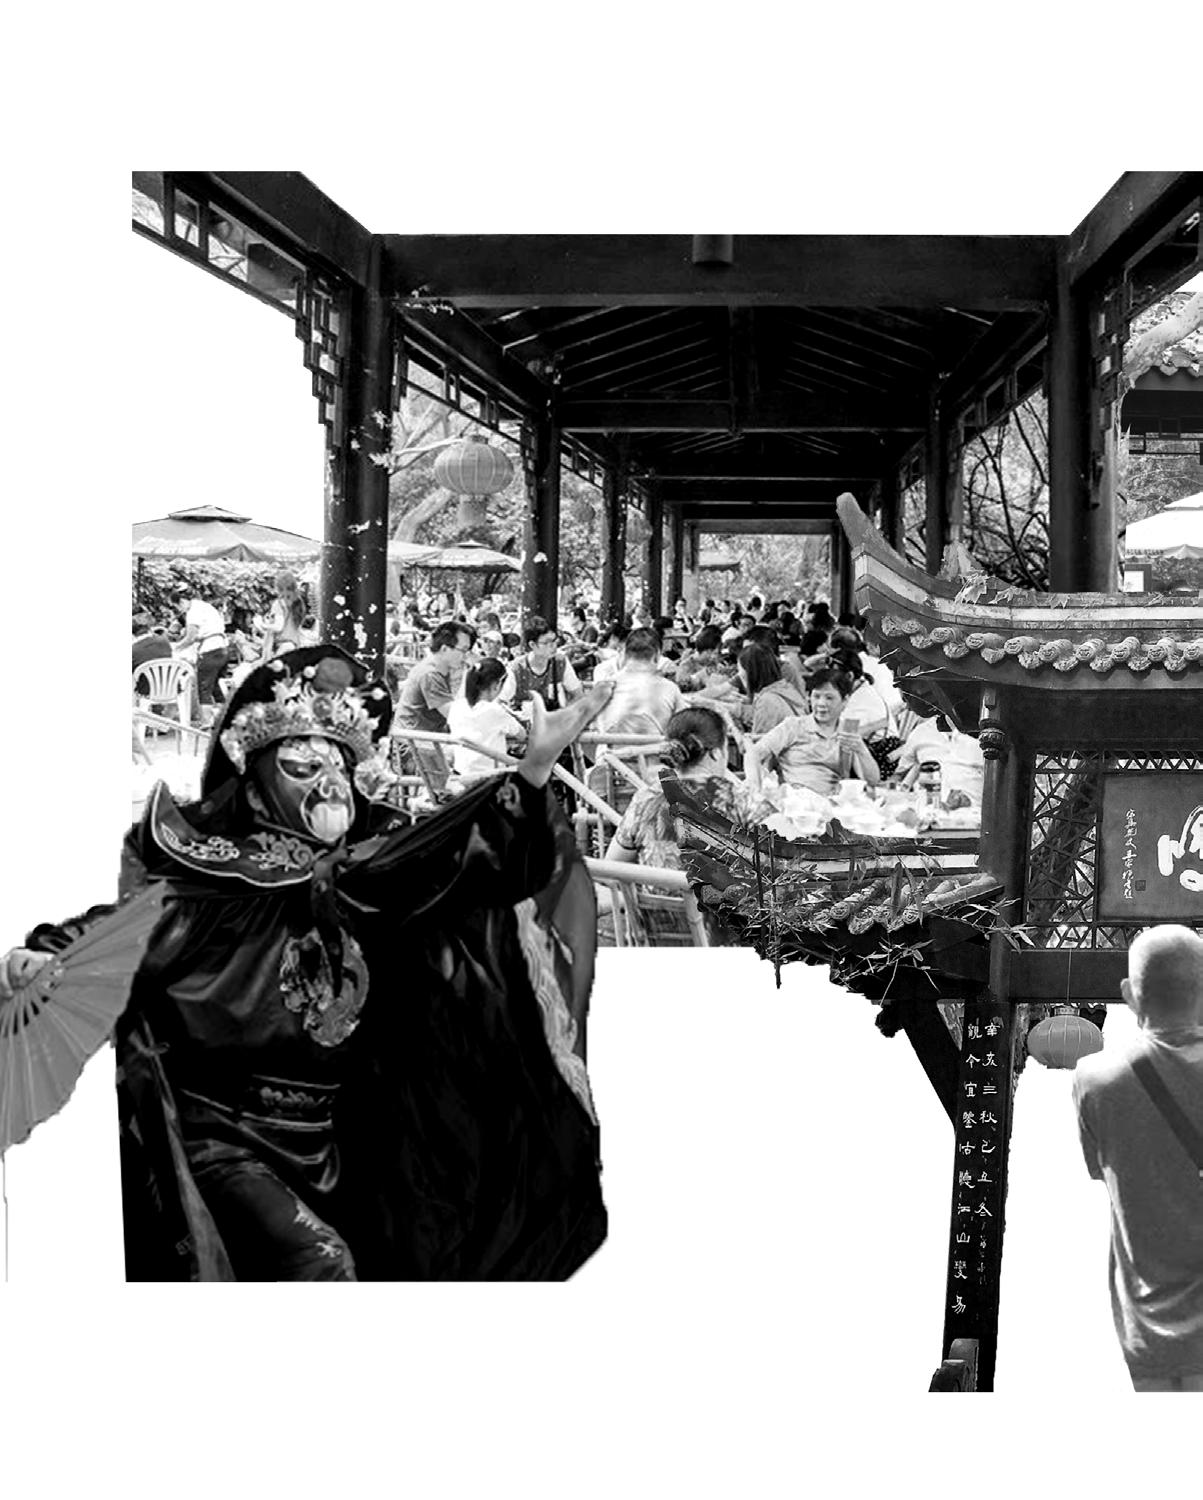
Theories and Methods of Urban Design Winter 2020 A-148
 Sichuan A-149
Figure 54: Collage of Heming teahouse


Theories and Methods of Urban Design Winter 2020 A-150 + TEA HOUSES IN CHENGDU + HEMING TEA HOUSE
Figure 55: Teahouses in Chengdu City
Figure
Location
Year(s)
Status
Footprint Designer

Key Project Components Program(s)
Funding Streams
HEMING TEA HOUSE [EVERYDAY URBANISM]
The Heming Teahouse, located in the People’s Park, Renming Park. Renming Park, built in 1911, located in the center area of Chengdu. It is a comprehensive garden integrating cultural relics with leisure and entertainment. Heming Teahouse, built in the Ming Dynasty, it’s the oldest and most influential teahouse of all the teahouses in Chengdu’s main city. It’s decorated with grey walls and black tiles. The old promenade is covered with moss with several old sycamore trees growing next to it. It is directly opposite the artificial lake, and the willows on the shore are in accordance with it. Open at six o’ clock in the morning, Heming Tea house attracted many citizens everyday. It can accommodate more than 3,000 people to drink tea within its two stories and large courtyard. The teahouse requires the least investment: a rented room, a stove water, some tables, chairs and tea bowls. In the smaller tea house, one person can act as a manager, waiter and stove manager for everything. Even though it’s small, it has everything it needs.21
[People’s Park, Chengdu, Sichuan Province, CHINA]
[1923]
[Built]
[Total footage: 3800 square meters]
[Mr Gong]
[Tea House]
[Mahjong, Tea House, Ear Pick, Sichuan Opera, Massage, Chess, Smoking]
[Public]
Sichuan A-151
+
21. Taylor, Peter. Global Research of Cities: A Case of Chengdu: Springer, 2018.
Renmin Park
Square Vegetation Water Architecture
Heming Teahouse
Figure 56: Renming Park plan
Figure 18: Location of Chengdu
As an important public domain, teahouses are very inclusive. Drinking tea is only one activity there. Also, modern tea houses are infused with political activity: people are free to meet, read, listen to public lectures and discuss politics.12 Unlike the private dialogue space on the internet, the vitality of the teahouse lies in its ability to become a hub for public opinion. Driven by the increasing vitality of the overall public life and its persistence and importance to civil society, no force will prevent the expansion of the public sphere.The teahouse is the epitome of the city. 13
Using the lens of Everyday Urbanism, we understand the concept of the teahouses further. The teahouse celebrates the liveliness of everyday life, passes memories from generation to generation, appropriates and creates ephemeral public space with the habit of public life. It is a productive mechanism in the city to let citizens overcome the distance and deal with their everyday desire. It is simple, but not trivial.

Teahouses provide livelihoods for different types of workers providing opportunities for merchants and newcomers to appropriate and create new public life. Customers are the ones who enjoy this vivid space, but they are not the creators. Additional services providers within the teahouse such as fortune tellers, earwax pickers, shoe polishers and hawkers, are the creator. At the same time, the significance of public space has continued in the collision between foreign cultures and local cultures.14 When migrants or new immigrants first moved into the city, they did not enjoy the same rights as regular residents, but they could get a sense of social belonging in public spaces such as teahouses. At the same time, the tea house is spacious, cheap and convenient, which is one of the best ways for the patrons to communicate with the outside world. Overall, the teahouse revitalized the city’s social spaces and created a more open environment for people to enjoy public life. 15
22. Yang, Qinran, and Min Zhou. “Interpreting Gentrification in Chengdu in the Post-Socialist Transition of China: A Sociocultural Perspective.” Geoforum 93 (2018): 120–32. https://doi.org/10.1016/j. geoforum.2018.05.014.
23. Wood, Frances. “Chengdu.” Oxford Art Online, 2003. https://doi.org/10.1093/ gao/9781884446054.article.t016279.
24. “The Key to Urban Reform:” Civilizing Chengdu, 77–110. https://doi.org/10.2307/j. ctt1tg5jrh.7.
25. Wang, Di. The Teahouse under Socialism: The Decline and Renewal of Public Life in Chengdu, 1950-2000. Ithaca: Cornell University Press, 2018.

Theories and Methods of Urban Design Winter 2020 A-152
Figure 57~58: Photo of Heming Teahouse
 Sichuan A-153
Figure 59: Interior of Heming Teahouse
Walkers-by: dog walkers, bird walkers, exercising people, tourists

Theories and Methods of Urban Design Winter 2020 A-154
Vendors
Ear Picker
Customers Waiters
Chefs Shoe Polishers
Opera Performers Park Keeper
Teahouse Owner
Sichuan opera stage
Figure 60: Elevation of Sichuan Opera Stage
Figure 61: Section of Heming Teahouse
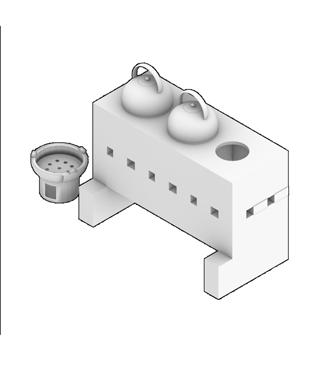





Stage Teahouse
Sichuan A-155
Bamboo chair
Tiger stove
Alcohol holder
Mahjong
Alcohol truck
Small square table
Copper pot
Water tank
Three pieces of tea set
Figure 62~70: Section of Heming Teahouse
KASHMIR TERRITORIES ENCLAVES WITHIN INDIA, PAKISTAN AND CHINA
01 IDENTIFICATION OF THE TERRITORY AND LOCATION
The territory of Jammu and Kashmir is an ‘ensemble of enclaves’1, divided between the countries of India, Pakistan and China. Other neighboring countries include Afghanistan and Tajikistan. Within its disputed borders marked by dashed lines in printed world maps, this territory comprises the three geographically distributed zones of Jammu, Kashmir and Ladakh. Situated in the Southern Himalayas and crisscrossed by five tributaries of the Indus River Basin, the unique geomorphological features of the area ‘implicitly emphasize the values’2 of the Kashmir society. The access to continental routes of transportation between neighboring countries, and the abundance of natural resources mark the strategic importance of the Kashmir Territories in global geopolitics. From an independent country two centuries ago, the territory of Jammu and Kashmir has been reduced to a dually claimed region, enmeshed in conflict. A series of wars, treaties and concessions, mark its disputed map.
The functional analysis of a territory is marked by its living conditions, political ecology, socio-economic parameters and infrastructure, all of which are a direct result of its location on the world map. In a globalized world, territories hold more significance as ensembles than cities or countries as interdependency continues to increase. The plurality of ‘territories’3 signifies the multiplicity and fragmentation of claim within Kashmir. Indian administered Kashmir, Pakistan Occupied Kashmir, Azad Kashmir, etc are the different nomenclatures assigned to the land bound in imaginary borders by the stakeholders. Evidently, the sociospatial practices in each of these regions differ due to the presence of an LOC (line of control) that emerged after subsequent ceasefires.
Occupation through accessibility of mountain passes has been the norm. ‘Mountains are as a rule world apart from civilizations, which are urban and lowland achievements.’4 Armies crawl up in high altitude passes; build secret tunnels, watchtowers and fortifications to alter the Line of Control (LOC). The infrastructure of securing the territory is displaced with fleeting movements to gain more and more area for respective countries. This ephemeral nature of
1. Falah, Ghazi-Walid. “The Geopolitics of ’Enclavisation’and the Demise of a TwoStateSolution to the Israeli - Palestinian Conflict.” Original Articles. Third World Quarterly 26, no. 8 (1/11/2005): 1341–72. doi:10.1080/01436590500255007.
2. Marshall, Tim,. “Prisoners of Geography : Ten Maps That Explain Everything about the World.” Book. New York, New York: Scribner, an imprint of Simon & Schuster, Inc., 2015.
3. Franke, Anselm. “Territories : Islands, Camps and Other States of Utopia.” Book. Berlin : Köln : KW, Institute for Contemporary Art ; Verlag der Buchhandlung Walther König, 2003.
4. Braudel, Fernand. “The Mediterranean and the Mediterranean World in the Age of Philip II.” Book. New York,: Harper & Row, 1972.
Theories and Methods of Urban Design Winter 2020 A-156
Social Indicators
There are wide disparities between different districts of Jammu and Kashmir, Islam is practiced by about 68.3%, while 28.4% follow Hinduism. Small minorities include Sikhism 1.9%, Buddhism 0.9% and Christianity 0.3%. Literacy rate is about 67.16%. Life Expectancy is 73.5.5 Poverty rate is 10.35%. Sex Ratio is 889/1000. 6
Economic Indicators
Agrarian and Tourism based economy, dependent on natural resources. Handicrafts and Tourism related businesses are the major sources of employment.7 Per capita net State GDP in 2016-2017 was 62,145 Indian Rupee. Rural unemployment is 25 per 1000 people. Medium spatial index of housing and household amenities is between 0.45-0.65.8
Environmental Indicators
Rich Himalayan biodiversity (flora and fauna), wetlands, high altitude lakes, mountain ecosystems, riparian landscapes. Ground water in abundance. The main sources od power production are hydropower. Air quality index is 47.37 (moderate). Waste management is poor and unsanitary.9
5. Narain, Prem, S. D. Sharma, S. C. Rai, and V. K. Bhatia. “Dimensions of socioeconomic development in Jammu & Kashmir.” development 1981 (1991): 82.
6. Radhakrishnan, Vignesh. Sen, Sumatra. 2019. “Is Jammu and Kashmir underdeveloped as stated by Amit Shah?” The Hindu
7. Jammu and KashmirStat. “Socio-Economic Statistical Information about Jammu and Kashmir”. jammuandkashmirstat.com
http://www.jammuandkashmirstat.com/
8. CEIC. “India Consumer Price Index: Jammu and Kashmir: Housing”. ceicdata.com
https://www.ceicdata.com/en/india/consumerprice-index-2010100-by-state-jammu-andkashmir/consumer-price-index-jammu-andkashmir-housing.html
9. Department of Ecology Environment & Remote Sensing J&K
http://www.jkdears.com/eers/eers/orders/ Draft%20Environment%20Policy_2018_ Online.pdf
Kashmir A-157
[Critical
Geographical Delimitation
Area (85,806+5,134+28,174+270.3+14,380) sqmi Population (12.55+4.04+1.9)million
Kashmir
DATA]
Jammu and Kashmir, between India, Pakistan and China, within Southern Himalayas and Indus River Basin
11.
the transition of power through built structures is what de-territorializes and re-territorializes the enclaves in Kashmir. It produces an urbanism in conflict, constantly struggling for an identity against a high level of fragmentation.


02 RELEVANCE FROM THE POINT OF VIEW OF URBAN DESIGN THEORY AND PRAXIS
Framed under the domain of urban design theory and praxis, the study of Spatial Adaptations in Disputed Territories is a research area of critical importance. The immense number of determinants that play mutually exclusive yet overlapping roles render a complex and biased field of practice. Today, the world contains more spaces of exception than ever before, ‘blurring the boundaries between exception and norm’10. Disputed territories fall under a special category of spaces of exception. The output of any urban intervention can be uncertain. Normal rules of theorization become inapplicable and require a deeper understanding of participating entities. These multiple narratives that can be theorized, practiced and challenged.
12. Sen, Satadru. “Ethnocracy, Israel and India.” History and Sociology of South Asia 9, no. 2 (July 2015): 107–25. doi:10.1177/2230807515572211.

Establishing the narrative
The study of the Kashmir Territories, as an overlap of conflicting regions, builds up on scholarship addressing urban geopolitics, bio-politics and sociospatial urban design practices across international borders. Urbanization here is enslaved by ‘forces attached to technologies of control, patterns of migration and the flow of capital’11 by ‘ethnocratic regimes’12. Despite the isolation and fragmentation of the region into claimed regions of Indian Administered Kashmir, Pakistan occupied Kashmir, Azad Kashmir, Aksai Chin and Siachen Glacier, I aim to situate the lens of my paper considering this territory as a well defined singular entity being stretched by external forces. I step into the ever debated Kashmir issue by considering it more than a geographical passage between countries. Theorising the impact of conflict in the socio-spatial transformation of the territory is a sequential process carried forward since the
Theories and Methods of Urban Design Winter 2020 A-158
10. Agamben, Giorgio,. “State of Exception.” Book. Chicago : University of Chicago Press, 2005.
Yacobi, Haim. “Towards Urban Geopolitics.” Book Review Essays. Geopolitics. ABINGDON: Taylor & Francis Group, 21/8/2009. doi:10.1080/14650040802694091.
Figure 02-07 Everyday images of Kashmir establishing imageability
03 TIMELINE : HISTORY, ACTORS AND EVENTS
2019 Article 370 was unilaterally abolished by a Presidential Order and Jammu and Kashmir was divided into two Union Territories of Jammu Kashmir and Ladakh.
2016
2012
Following the killing of Burhan Muzaffar Wani on 8 July, violent protests broke out in Kashmir Valley. An imposed curfew continued for more than 50 days, and more than 90 people were killed by Indian armed forces.
The Chief Minister of Indian-administered Jammu and Kashmir, Omar Abdullah, said that the security situation was not yet conducive to the revoking of the Armed Forces Special Powers Act (AFSPA) in the state.
2008 Following 2008 Kashmir unrest, hundreds of thousands of Muslims marched in Srinagar for independence, the largest protest against Indian rule in over a decade.
1999
1990
An officially estimated 10,000 Kashmiri youths crossed into Pakistan for training and procurement of arms. Indigenous and foreign militant groups besides proIndia renegade militants proliferated through the 1990s with an estimated half a million Indian security forces deployed in the Kashmir Valley.
Protests and anti-India demonstrations began in the Valley, followed by police firing and curfew. Mass Exodus of Kashmiri Hindus started in Kashmir Valley.
The Indian Army took the Siachen Glacier region of Kashmir.
India and Pakistan signed the Shimla Agreement which stated that the final settlement of Kashmir would be decided bilaterally in the future and that both sides would respect the LOC.

Pakistan took advantage of the discontent in the Kashmir Valley and sent a few thousand armed Pakistani infiltrators across the cease-fire line in Operation Gibraltar. Incidents of violence increased in Kashmir Valley, and a full IndoPakistani war broke out until a ceasefire was made.
China annexed Tibet. Tensions rose between China and India on the issue of the boundary between Tibet and India, especially in Aksai Chin.
The UN Security Council passed Resolution 122 which stated that the state constitution was not a final legal disposition of the State. India’s Home Minister, Pandit Govind Ballabh Pant, during his visit to Srinagar, declared that the State of Jammu and Kashmir was an integral part of India and there can be no question of a plebiscite to determine its status afresh. India continued to resist plebiscite efforts.
A ceasefire between Indian and Pakistani forces left India in control of the Kashmir Valley, most of the Jammu province and Ladakh, while Pakistan gained control of the western districts comprising the present day Azad Kashmir, the Gilgit Agency and Baltistan.

The Pakistan Resolution was passed at Iqbal Park, Lahore. The resolution demanded the establishment of an independent state comprising all regions with Muslim majorities. The letter “K” in the name “Pakistan” represented Kashmir.
The All Jammu and Kashmir Muslim Conference was founded by Sheikh Abdullah in collaboration with Chaudhry Ghulam Abbas to fight for the rights of the State’s Muslims.

The movement against the repressive Maharaja Hari Singh began and was brutally suppressed by the State forces. Hari Singh was part of a Hindu Dogra dynasty which ruled over a majority Muslim State. The predominantly Muslim population was kept poor, illiterate and inadequately represented in the State’s services.
Jammu and Kashmir (princely state) was created with the signing of the Second Treaty of Amritsar between the British East India Company and Raja Gulab Singh of Jammu. Gulab Singh accepted overall British sovereignty. Kashmir Valley was a Muslim-majority region speaking the Kashmiri language and had a distinct culture called Kashmiriyat.
Kashmir A-159
1950 1846 1980 2000
1988 1984 1972 1965 1959 1931 1932 1940 Kargil
1949 1957
War
2020 2010 1900
Figure 08 Cartoon by Mir Suhail
Figure 10 Sheikh Abdullah preaching
Figure 09 LOC between India and Pakistan
Figure 11 Nehru inspecting militia
1850s. I accept the definition of solid boundaries to analyse border controls and sieged urban centers as a phenomenon that places Kashmir in Kashmir. With this argument in mind, the relationship of urban centers in major cities can be established with its hinterlands/quasi-border zones.
Cross border networks and urbanization
‘The post-cold war era has been heralded as the age of triumphant neoliberalism which has been tied to the emergence of new forms of inequality, dis-enfranchisement, and violence, with national security states increasingly using interlinked strategies of militarization and penalization to exercise coercive control over marked segments of their populations’13. Kashmir is a territory subjected to contestation for the production of strategic links of economy and political superiority in the Indian Subcontinent. Urbanization is modulated and inherently manipulated to produce an output of a market economy based on territorial dominance and international relations. Borders and Quasi-border zones can be read as ephemeral urbanisms guided by the Himalayan passages and the ‘Line of Control’14 which was established after successive ‘Indo-Pak wars’15 in the second half of the last century.
Incessant territorial concessions continue to redefine the authoritative powers in the Kashmir territories. This was best demonstrated when Pakistan ceded a portion of its Kashmiri territory to China under the ‘China-Pakistan Economic Corridor trade agreement’16 to establish a land route to Gwadar Port. The concession was deemed illegal by India as it could render its seaports and logistical links less worthy of trade. Similarly, China acquired Aksai Chin along the north-east Kashmir and continues a hold on it due to the mountain barriers. India still claims the region and provides political support to Tibet which is claimed by China.

Therefore, the desire to keep the Kashmir territories under their umbrella arises purely out of maintaining primacy in economic interests and geopolitical significance in the subcontinent. In this dialogue, the ‘provincial knowledge’17 of

13. Haley Duschinski. “Destiny Effects: Militarization, State Power, and Punitive Containment in Kashmir Valley.” Article. Anthropological Quarterly 82, no. 3 (1/7/2009): 691–717. doi:10.1353/anq.0.0072.
14. Singh, Priyanka. “Prospects of Travel and Trade across the India–Pakistan Line of Control (LoC).” International Studies 50, no. 1–2 (1/2013): 71–91. doi:10.1177/0020881715605237.
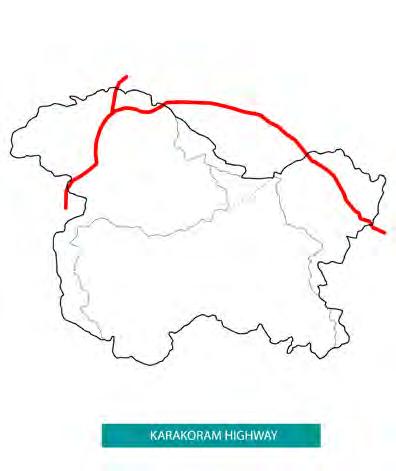
15. Gill, John H. “Provocation, War and Restraint under the Nuclear Shadow: The Kargil Conflict 1999.” Original Articles. Journal of Strategic Studies 42, no. 5 (29/7/2019): 701–26. doi:10.1080/01402390.2019.1570144.
16. Umar Farooq. “China-Pakistan Economic Corridor: Geo-Political Implications, Regional Constraints and Benefits of CPEC.” South Asian Studies 34, no. 2 (31/12/2019): 599.
17. Roy, Ananya. “Who’s Afraid of Postcolonial Theory?” International Journal of Urban and Regional Research 40, no. 1 (1/2016): 200–209. doi:10.1111/1468-2427.12274.
Theories and Methods of Urban Design Winter 2020 A-160
Figure 12-17. Sequential Maps of territorial turmoil in Kashmir
a sizable urban population is vastly ignored and rendered immaterial. The issues of urbanization in Kashmir are always measured with respect to its surrounding countries but the cross border exterior elements always belittle its internal struggles.
Territory as a quasi urban camp
‘Space is a fundamental category for any form of power. It is a medium of social relations, articulated as physical and symbolic distance, proximity, position, opposition, and simultaneity. The production and control of space is thus crucial to any execution of power, representing its potency, reproducing its social order, and neutralizing and naturalizing its objectives through planning processes that lead to a specific physical layout. Any claim to power and property institutionalized itself in the act of territorialization.’18
In the midst of conflict, how does the urban environment shape in Kashmir territories? Its identity, title and governance has transformed tremendously over time. From being an autonomous princely state, the status of Kashmir has been reduced to that of a Union Territory, directly under the control of the Central Government under the Jammu and Kashmir Reorganization Act of 2019. An important part of the infamous Article 370, that guaranteed autonomy to the people of Kashmir, included land ownership policies which prohibited any nonKashmiri from buying property. After its abolishment by exclusive presidential order, Kashmir became an open land market. This poses serious threats to urban growth in a number of ways. Foreign private firms can now invest in properties that can lead to rapid urbanization of the hinterlands. Early this year, ‘6000 acres of land’19 were identified by the government for potential investors. Local businesses, most importantly tourism, will lose their dominance and be reduced to a second class in their own territory.
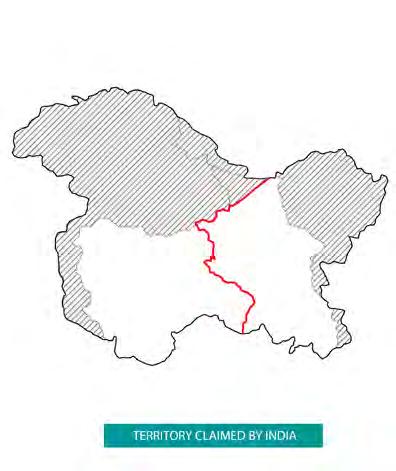

Although the Indian government projects a strong facade of infrastructure development behind scrapping Article 370, it is also a way of converting a military occupation to a civilian one. Before this, ‘neo-modern militarism’20 influenced

A-161
Kashmir
18. Franke, Anselm. “Territories : Islands, Camps and Other States of Utopia.” Book. Berlin : Köln : KW, Institute for Contemporary Art ; Verlag der Buchhandlung Walther König, 2003.
19. https://kashmirobserver. net/2020/01/30/6000-acres-of-land-identifiedin-jk-for-investors/
20. Gusterson, Hugh, and Besteman, Catherine. “Cultures of Militarism: An Introduction to Supplement 19.” Current Anthropology 60, no. S19 (1/2/2019): S3–14. doi:10.1086/700648.
and shaped the urban fabric. It converted the entire territory in a modern day concentration camp where the ‘state of exception is permanently realized’21. A crucial question I wish to raise through these polemics is if Kashmir is an urban camp. Are people contained in an armed urban setting? In a valley of abundant nature, zones of social abandonment are created in the name of securitization. ‘They make it a desolation and call it peace’22. To highlight the spatial stigma that military impunity has created, this research maps the local struggle against an alien population trying to suppress its momentum and movement.
Settler Colonialism in the urban fabric
Kashmir is a settler colonial project for the Indian Government that has time and again used military power as an agency. Just like the ‘mountain top settlements of the West Bank’23, the physical structure of army camps and their strategic location redefine placemaking in Kashmir by employing urban design and planning practices. The Indian Administered enclave uses a militarized formula that is deep rooted within the urban fabric. The mechanism of neomodern militarism is either set up in full bloom on smaller hilltops or in strategic walled-off zones of the territory. In 2019, with the scrapping of Article 370, the total population of defense personnel was ‘700,000’24, making Kashmir the most militarized zone in the world. It also meant that there was one defense personnel for every 8 civilians.
Such a dynamic in demography produces an eerie urban atmosphere, in constant tension and uncertainty. People are expected to carry out day-to-day activities under the shadow of fear. We witness deterioration of socio-spatial linkages, people are unable to maintain quality outdoor habits which then reduces the interaction with public spaces. Urbanization or urban theories are challenged here as regular rules of placemaking do not apply, there is a constant battle for the negotiation of space in the urbanity of Kashmir. Apart from huge army camps and detention centers, smaller bunkers are diffused abundantly in neighborhoods, forming a seamless system of surveillance and security. The imageability of the territory has been reduced to barbed wires and silent empty roads. The urban realm here, is a medium and ‘instrument that forms a social space against the backdrop of military coordinates and the means of conquering and controlling space’25
The defense use accounts for 26% of the land use in the capital city of Srinagar, way higher than public zone or commercial. Although not the main theme of the paper, this ‘other’ citizenry adds to the urbanization pressures on the ecologically sensitive regions of the territory, which have always gone unaddressed amidst the uncertain political climate. Kashmir has a rich landscape and diverse flora and fauna but a lack of structure in the governing systems has led to numerous issues. The focus on urban values and design for the environment is significantly low, given the absence of a strong and cohesive community.
The alien population also affects the everyday functional zones of the territory. In times of uncertainty, public infrastructure is devoted to the army
21. Agamben, Giorgio,. “Means without End Notes on Politics.” Book. Minneapolis : University of Minnesota Press, 2000.
22. Agha, Shahid Ali,. “The Country without a Post Office.” Book. [Alexandria, Va.] : Chadwyck-Healey, 1998.
23. Franke, Anselm. “Territories : Islands, Camps and Other States of Utopia.” Book. Berlin : Köln : KW, Institute for Contemporary Art ; Verlag der Buchhandlung Walther König, 2003.
24. Waheed, Mirza. 2016. “India’s crackdown in Kashmir: is this the world’s first mass blinding?” The Guardian
25. Stojanovic, Djordje. “Space, Territory and Sovereignty: Critical Analysis of Concepts.” (2018) 10.18999/nujlp.275.3.
Theories and Methods of Urban Design Winter 2020 A-162
for private uses. Their housing inside the city is either provided in educational and cultural institutions or prototypical units that then mark a no-entry zone. The National Institute of Technology and other Public Educational institutes witnessed an overnight surge of non-Kashmiri students leaving their dorms and hostel rooms after the Indian Government issued travel advisories for tourists in 2019. For the next 6 months, these residences were the ‘humble abode of the extra troops’26
Theorizing design or planning practices in a region where land/building use is fickle, produces psychological barriers too. This dynamic of vulnerability generates a unique and conflicted ‘bio-political’27 consensus in the society. People have become skeptical of using urban amenities and claiming their ‘right to the city’28. It has decreased civic participation in public places, thereby losing the essence of urbanity and weakening the social construct of the region’s natural/ built fabric.
26. https://www.firstpost.com/india/kashmirsschools-colleges-double-up-as-bunkers-formilitary-students-forced-to-depend-on-tuitionsnotes-in-absence-of-classes-7720351.html
27. Senellart, Michel. “The Birth of Biopolitics : Lectures at the Collège de France, 1978-79.” Book. Basingstoke [England] ; New York : Palgrave Macmillan, 2008.
28. Harvey, David. “The Right to the City.” Article. New Left Review, no. 53 (9/2008): 23–40.
29. Segal, Rafi., Weizman, Eyal., and Tartakover, David. “A Civilian Occupation : The Politics of Israeli Architecture.” Book. Tel Aviv : London ; New York : Babel ; VERSO, 2003.
30. sdasrinagar.com
04 METHODS TO CONDUCT INVESTIGATION
The territory of Kashmir can be observed through various lenses and mediums. The development of thematic cartographies provide a borderless overview of the territory with respect to its international neighbors. Understanding the ‘vertical perspective’29 of these sets of maps can help to establish the context of the study. The territory of Jammu and Kashmir has multiple claims and therefore the available data is always biased, depending on the sources. Through the initial data, I aim to establish its regional position from the lenses of all the stakeholders and explore the morphology that urbanism displays in such fragmentation.
The second set of methods is purely based on identifying the deep rooted settler colonialism and militarism in the territory through spatial mapping and the ways in which strategic planning practices have been instrumentalized to advance this agenda. The data of military distribution will be compiled through master plan/zoning documents30, aerial imagery, surveys, questionnaires and personal memory. This objective information has to be projected to determine the way in which a diffused alien population influences everyday living in the city of Srinagar, Kashmir. Many urban practices within the districts of Kashmir revolve around the presence of military personnel. Their built typologies are spread over the territory on scales that differ as we move from urban centers to the hinterlands.
For this paper, I will zoom into the capital city of Srinagar. Amidst the surrounding hills of Zabarwan ranges, the River Jhelum and low lying neighborhoods, the civilian population is at all times shadowed by a military occupation. The mapping will highlight defense units that are conveniently and permanently set up in the city center and other strategic locations. Therefore, using their settlements as focal points, one can better theorize the polemics around urban conditions of society, culture and its people.
Kashmir A-163
Lefebvre argues, ‘there is politics of space because space is political’31 and this brings me to the case study undertaken in this paper. From the larger cartography to the spatial analysis of the city, the third part zooms into the ever fluctuating and dynamic processes of the neighborhoods in downtown Srinagar. There are very specific and strategic practices that authorities use to curb the practice of everyday life and their tactics are employed through spatial characteristics of the urban fabric. Through the study of people’s movements in the narrow streets of downtown, the army blocks off main streets to curb protests. The suppression of mobility is done through barriers, blockades, checkpoints and rerouting of traffic. A crucial part of the methodology here is cognitive mapping and a verbal recital of the social resistance that suppresses these exterior efforts of fragmentation. It is based on the stories of residents and the invisible socio-spatial urban values that can potentially aim at resilience and inclusion.
05 ANTICIPATED FINDINGS
This research is an attempt to open a discussion on the multiple and overlapping urbanisms of Kashmir. The aim is to establish preliminary dialogue of theories and methods which can critically unfold the deep rooted conflict in society. I begin with the aim of establishing why Kashmir is a strategic geographical location, claimed by a number of countries in the Indian Subcontinent. These claims have resulted in the enclavisation of this territory and I hope to establish their relationships with each other irrespective of quasi border controls.
Further, the paper will unfold and quantify the hotbeds of defense activities in the locus of public realm, identifying the resultant fabric that evolves from having walled-off security zones. Another potential outcome is the study of typologies converted from public places or institutions to housing for the military personnel. Finally the conclusion of the paper with the case study project anticipates to add a very grounded approach of residents to situate conflict, criticality, colonialism and resistance in the urbanism of their surroundings.
Theories and Methods of Urban Design Winter 2020 A-164
31. Lefebvre, Henri,. “The Production of Space.” Book. Oxford, OX, UK ; Cambridge, Mass., USA : Blackwell, 1991.

Kashmir A-165
Figure 18 Image by the author
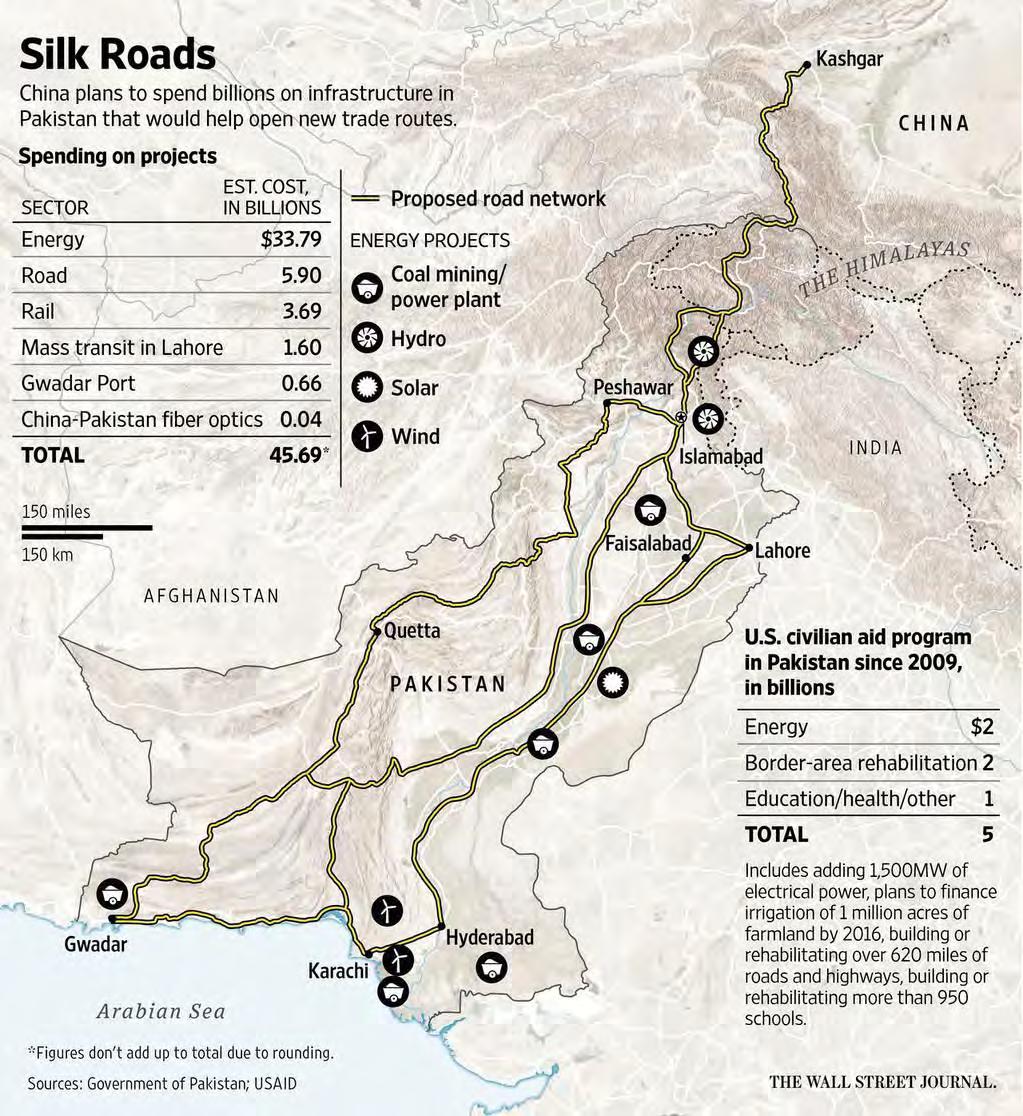
Theories and Methods of Urban Design Winter 2020 A-166
Figure 19 Cartography of the China Pakistan Economic Corridor
32. Sassen, Saskia. “The Global City: Enabling Economic Intermediation and Bearing Its Costs.” City & Community 15, no. 2 (6/2016): 97–108. doi:10.1111/cico.12175.
33. Baghel, Ravi, and Nüsser, Marcus. “Securing the Heights: The Vertical Dimension of the Siachen Conflict between India and Pakistan in the Eastern Karakoram.” Article. Political Geography 48 (9/2015): 24–36. doi:10.1016/j. polgeo.2015.05.001.
34. Umar Farooq. “China-Pakistan Economic Corridor: Geo-Political Implications, Regional Constraints and Benefits of CPEC.” South Asian Studies 34, no. 2 (31/12/2019): 599.
KASHMIR AS A PASSAGE [GLOBAL URBANISM]
Global City is ‘an extreme space for the production and/or implementation of very diverse and very complex intermediate capabilities’32 In the case of the territory of Kashmir, three or more parties exploit its resources as a passage to ‘economic superiority’33 and territorial dominance. With such incentives arise multiple claims to the potentially urbanized areas leading to instability and uncertainty. Kashmir is used as a pawn in the games of increasing urbanization, trans-national economies and international relations.
‘Geo-political implications’34, regional constraints and benefits are factors that play a dominant role in the way the cartography of Kashmir is being urbanized and contested. Pieces of land are given away in concessions from one conflicting party to another based on debated treaties.

Location Year(s)
Status
Footprint Designer
Additional Agents
Key Project Components Program(s)
Funding Streams
[Kashmir- Pakistan and China]
[1959-1979]
[Built]
[1300km (810mi)]
[Military Engineers]
[Government Trade Routes]
[A trade route between two countries passing through a region of Kashmir, claimed by another country]
[Infrastructure]
[Government]
A-167
Kashmir
Figure 20 Image by the author
Kashmir as a geographical entity between India, Pakistan and China reveals the international implications its location has over its urbanism. It is a passage for many strategic infrastructures and resources that makes it desirable to be claimed. This is the reason that the issue of Kashmir always catches international media attention and countries hold strong opinions as they portray their political bias. It can never be an ‘internal matter’35 for the Indian State, that has time and again tried to downplay the Kashmiri freedom struggle.
The rich hydrology and riparian landscapes of Kashmir are used for hydroelectric power plants that at the moment supply energy to the entire Northern India. These Himalayan rivers and their tributaries flow into Pakistan Occupied Kashmir and ultimately in the Arabian Sea. An increase in the number of dams in the Indian Occupied Kashmir will lead to low water supply on the other end of the LOC. Therefore a power plant project, instead of generating local economy, urban growth and jobs is institutionalized as a point of conflict.
Similarly the China Pakistan Economic Trade Agreement aims to establish a land route for China through Gilgit Baltistan to the ‘Gwadar Port’36 for better and faster access to the Mediterranean. India’s objection to this huge ‘$62 billion mega economic venture’37 was supported by its claim to Pakistan Occupied Kashmir. Kashmir Territories establish themselves uniquely in the global urbanism of the Indian Subcontinent. These are just agencies or instruments of gaining political and economic primacy. Their intricate values of urbanity are neglected in the broader schemes of power grabs and reduced to chunks of land.
I argue that the relational dependence of urban growth in Kashmir on its surrounding countries hinders its independent analysis. Viewing Kashmir as
35. https://www.theguardian.com/world/2019/ oct/31/india-strips-kashmir-of-special-statusand-divides-it-in-two


36. Malik, Hasan Yaser. “Strategic Importance of Gwadar Port.(Gwadar Port, Pakistan).” Journal of Political Studies, no. XXII (31/12/2012).
37. Umar Farooq. “China-Pakistan Economic Corridor: Geo-Political Implications, Regional Constraints and Benefits of CPEC.” South Asian Studies 34, no. 2 (31/12/2019): 599.
Theories and Methods of Urban Design Winter 2020 A-168
Figure 21-22 Cartoons by Mir Suhail
more than just a passage through mountains is paramount in theorizing its urban practices and the way they shape the socio-spatial structure.

The occupation of the territory and its fragmentation generates a unique relationship between urban centers and its hinterlands. The borders have extensively militarized urbanisms that stretch linearly over a ‘740km long Line of Control (LOC)’38. The ‘forgotten border villages’39 remain in heavy military presence as India fears armed infiltrations. Border urbanisms are therefore gorgeous valleys placed against military bunkers. This generates inaccessibility in the hinterlands of Kashmir as distance from city centers increases. Just recently, in the COVID 19 crises, India and Pakistan ‘exchanged fire across the LOC’40. It targeted civilians from border villages who were then used as human shields.
In circumstances of uncertainty, a major tool that has prevented global attention towards Kashmir has been the disruption of digital infrastructure. Today, where ‘data driven urbanism’41 is the talk of the town, there still exist urban areas where this basic necessity is restrained. It helps shape the narrative of the situation and creates a wide difference in the way Kashmir is being viewed and inhabited. Urbanism without the internet also influences everyday activities. People resort to the old ways of paying bills by standing in long queues, education takes a very hard hit, local businesses are affected and people remain confined to a bubble of information. The wireless luxury creates a spatial devoid that cuts this territory from the rest of the world. Where data assemblages place cities as information economies bustling with technological revolutions, Kashmir gets drastically reduced to a stone age era, marking its importance through absence.
Kashmir A-169
38. https://daily.jstor.org/how-did-kashmirs-72year-old-conflict-begin/
39. Waheed, Mirza. “The Collaborator.” Book. London : Viking, 2011.
40. https://www.change.org/p/governmentsof-india-and-pakistan-stop-exchange-of-firealong-the-loc-jammu-kashmir-resume-dialogue
41. Alberto Vanolo. “Smartmentality.” Urban Studies 51, no. 5 (1/4/2014): 883–98. doi:10.1177/0042098013494427.
Figure 23 Silk route to Gwadar Port

Theories
A-170
and Methods of Urban Design Winter 2020
Figure 24 Image by the author

 Kashmir A-171
Figure 25 Image by the author

Theories
and Methods of Urban Design Winter 2020 A-172
Figure 26 Image by the author
42. Haley Duschinski. “Destiny Effects: Militarization, State Power, and Punitive Containment in Kashmir Valley.” Article. Anthropological Quarterly 82, no. 3 (1/7/2009): 691–717. doi:10.1353/anq.0.0072.
43. Yiftachel, Oren. “Eyal Weizman, Hollow Land: Israel’s Architecture of Occupation , Verso, London (2007) ISBN 978-1844671250 288 Pp.” Political Geography 28, no. 2 (2/2009): 145–46. doi:10.1016/j.polgeo.2008.12.005.
KASHMIR AS A HOST [CONFLICT URBANISM]
This sub-theme puts under view the dynamics of the capital city of Srinagar as a host to ‘militarization’42. This alien population that is deeply diffused within the fabric of the city as a mode of settler colonialism will be analyzed through the lens of land ownership policies, land use, zoning laws, neighborhood planning practices.
The sites that can be studied under this sub theme are, Hari Parbat Fort (A Mughal Fort built upon a hilltop used as a walled off military camp, with the wall and tower typology), Tattoo Ground (123 acre of land in the city center under defense use) and Downtown (Old Town) city to determine how the heritage district handles the army intrusions. In addition to this, a general mapping exercise will determine the placement of the smallest form of ‘military occupation’43, the temporary bunkers that survey streets and squares.

Kashmir A-173
Figure 27 Image by the author
Settler Colonialism achieved through studying urban patterns of a territory follows a very strategic set of policies that uses spatiality to its advantage. The place itself acts as a host to conflict that replicates and finds its ways in corners and crevices. Based on the case study of the city of Srinagar, I argue that society within these municipal boundaries functions like an open air urban camp. Various forms of ‘securitization and control in political life’44 are enforced onto the civilian population. The primary mode is incorporated through settlements scattered throughout the city, varying in scale and type. These institutions produce a ‘state of mind’45 within the urban dynamic, that of detachment and fear within their own fabric. Obvious and normal conditions are replaced by uncertainty and indeterminacy.
One of the largest camps within the municipal boundary of the city include the Badamwari Cantonment zone extending the security region up the hill of Hari Parbat Fort. This is a classic example of taking the higher ground to assert dominance over a piece of heritage. Just like the ‘hilltop settlements of Palestine’46 instrumentalized for land ownership of low lying villages, the old fort umbrellas downtown Srinagar, river Jhelum and the Dal lake in its securitized control. Tattoo ground, a 123 acre walled off army complex, right in the city center produces another ‘zone of abandonment’47, with wire topped high walls housing distinctly ugly, single storeyed barrack structure. The ground is surrounded by all the major government offices like the civil secretariat, high court, radio and police stations. Furthermore, the road intersections around it are major traffic arteries leading to the airport and major commercial center in the city, Lal Chowk. In such a central zone which is highlighted as a civic center in the ‘Master Plan 2035’48, the area is being used for defense purposes.
In addition to these, there are smaller CRPF (Central Reserve Police Force) camps distributed between neighborhoods for housing of army personnel. A few of these localities include Sanathnagar, Barzulla, Hyderpora, Gupkar Road, Indira Nagar, etc. The omnipresence of the army, so close to residential zones,


44. Pastoreková, Laura, and Vodrážka, Peter. “(In)Visible Elements of the City Military Architecture in the Context of Urban Structure Development.” Procedia Engineering 161 (2016): 2161–67. doi:10.1016/j. proeng.2016.08.809.
45. Park, Robert Ezra,. “The City.” Book. Chicago, Ill.,: The University of Chicago press, 1927.
46. Segal, Rafi., Weizman, Eyal., and Tartakover, David. “A Civilian Occupation : The Politics of Israeli Architecture.” Book. Tel Aviv : London ; New York : Babel ; VERSO, 2003.
47. Virilio, Paul. “Bunker Archéologie.” Book. Paris : Galilée, 2008.
48. http://www.sdasrinagar.com/wp-content/ uploads/2019/03/Master-Plan-2035ReportFinal.pdf
Theories and Methods of Urban Design Winter 2020 A-174
Figure 28-29 Cartoons by Mir Suhail
creates a ‘spatial stigma’49 that reinforces an imposed control narrative on the citizens on a daily basis. In certain instances, military just takes up abandoned/ dilapidated houses in the neighborhood and roam around during the day to assert their presence over the territory,in downtown which is the epicenter of protests, these make shift bunkers, along with local police study everyday movements and grassroots organizations to gather information, they use familiar settlements to blend in the neighborhoods and be an integral part of the spatial mechanism to influence it from within. The infrastructure of Srinagar is at the mercy of political violence. Such passive and sometimes active aggression ‘targets civilians by reaching into the crevices of everyday life and re-engineering information’50 to redefine the urban atmosphere for better dominance in the name of national security.
The smallest type of settlement are military bunkers, just tents with some protective rainproof covering at intersections, crossings, outside camps for protection to study the general movements of people in commercial places/ residential areas. These outposts are easy and quick to set up and connect between bigger settlement camps to form a seamless connection.


Through these differently scaled practices, settler colonialism has been rooted in the city of Srinagar. Control over institutions, public and commercial spaces, neighborhoods and circulation spaces is the way to lay defense over the movement map of the city to identify hotbeds of so-called ‘illegal’ activity. The soul spaces of the city are morphed with their presence to carry out military operations. ‘Military impunity’51 is further guaranteed by PSA (Public Safety Act) and AFSPA (Armed Forces Special Powers Act). The basic fundamentals of the ‘right to the city’52 are challenged here. The army has the authority to detain or shoot on sight any suspect without reason. Such acts in place alter the urban realm completely, it causes desertification of social spaces and makes people skeptical of inclusion or embracing their own city. The city of Srinagar, with the urbanity it has to offer lies on the ‘threshold of indeterminacy between democracy and absolutism’53

Kashmir A-175
49. Wacquant, Loïc. “Territorial Stigmatization in the Age of Advanced Marginality.” Thesis Eleven 91, no. 1 (11/2007): 66–77. doi:10.1177/0725513607082003.
50. Graham, Stephen,. “Cities under Siege : The New Military Urbanism.” Book. London ; New York : Verso, 2011.
51. Pasquetti, Silvia. “Experiences of Urban Militarism: Spatial Stigma, Ruins and Everyday Life.” Article. International Journal of Urban and Regional Research 43, no. 5 (9/2019): 848–69. doi:10.1111/1468-2427.12797.
52. Harvey, David,. “Rebel Cities from the Right to the City to the Urban Revolution.” Book. London : Verso, 2013.
53. Agamben, Giorgio,. “State of Exception.” Book. Chicago : University of Chicago Press, 2005.
Figure 30 Military settlements inside Tattoo Ground, Batamaloo, Srinagar
Figure 31 Army bunkers, makeshift holes in the city fabric for smaller outposts and stations
Figure 32 Hazratbal mosque against the securitized hari Parbat fort
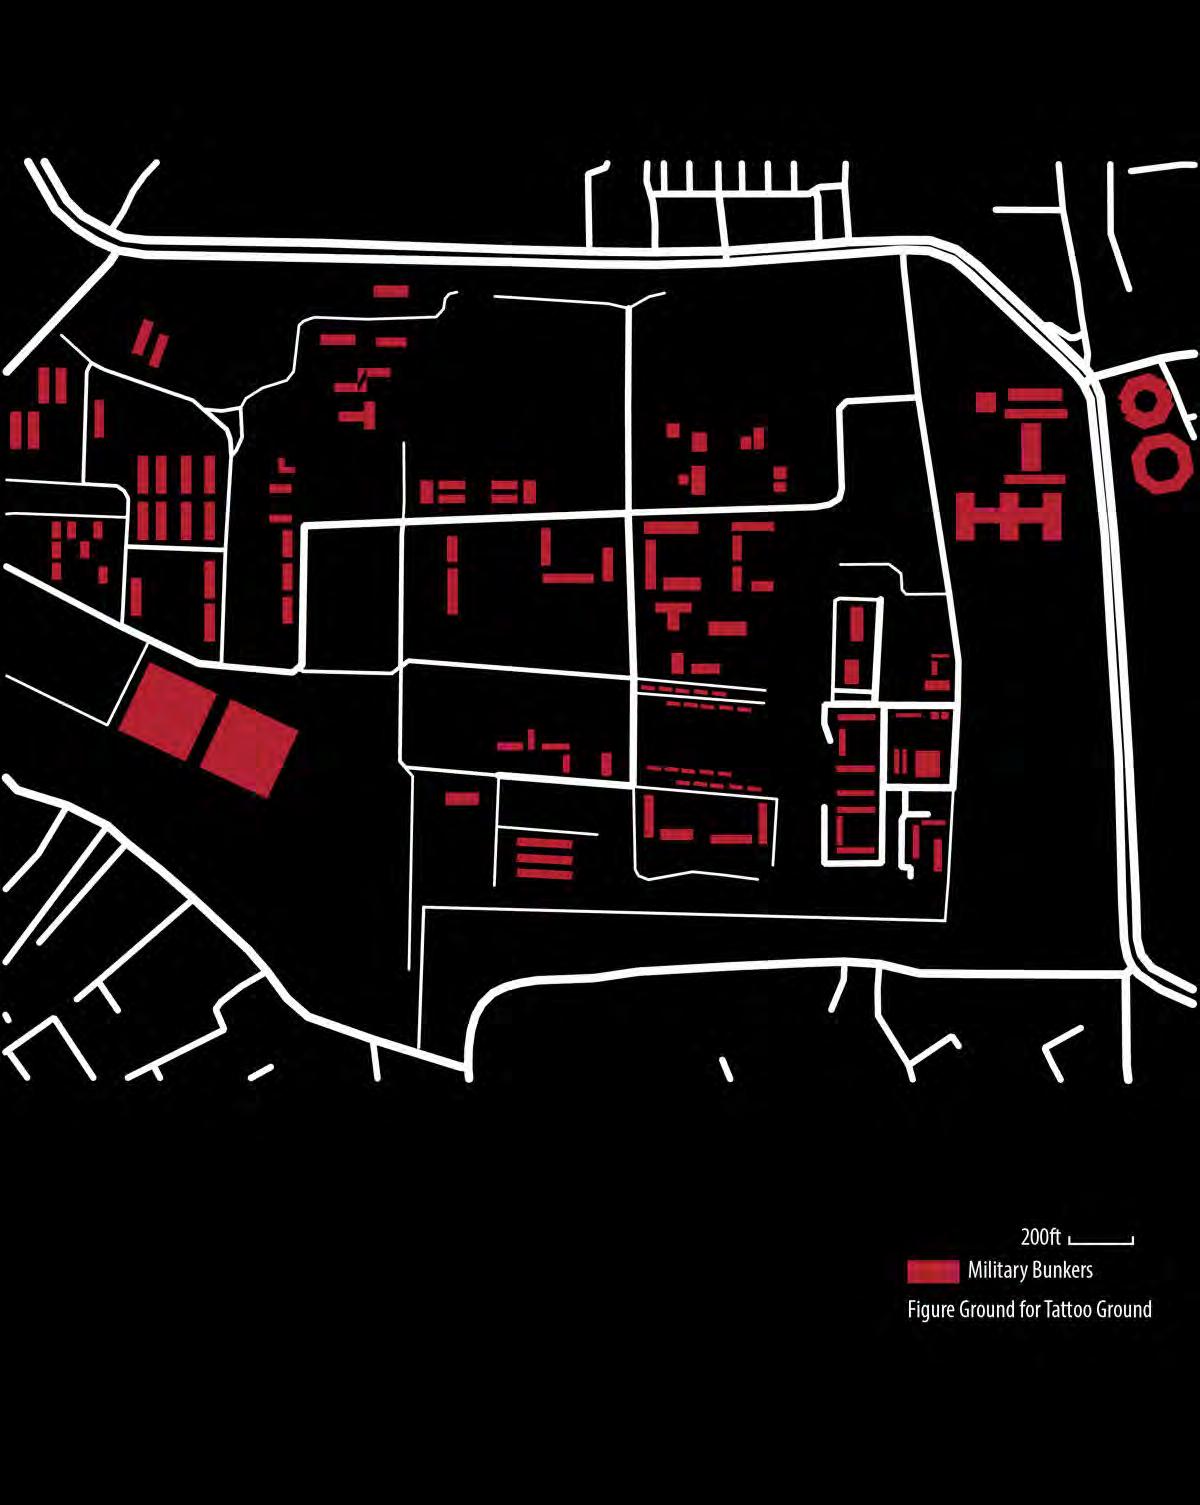
Theories
and Methods of Urban Design Winter 2020 A-176
Figure 33 Image by the author

 Kashmir A-177
Figure 34 Image by the author

Theories and
Winter
A-178
Methods of Urban Design
2020
Figure 35 Image by the author
KASHMIR AS A TERRITORY [RESILIENT URBANISM]

The settler colonial regime uses its agenda to capitalize on a territory’s resources but not on humans. The policies strictly restrict human interaction with their urban fabric to gain control and keep the power established. It is the inherent nature of society to contribute to their urbanism, and that is how ‘imageability’54 is defined, but through restrictive practices, the power structures aim to create a divide between the two elements of urbanism, living and their environment.
The urbanism used as a site of infiltration for colonialism is also used as a retaliatory mechanism, as a resistance for survival, by the people of Kashmir. People have tactics that they use in their ‘spatial practices’55 to oppose and counteract the implementation of authorities, in this case the military. I argue that the protest of people, active or passive, is supported by the resilient properties of urbanism.
A-179
Kashmir
54. Lynch, Kevin. “The Image of the City.” Book. Publication of the Joint Center for Urban Studies. Cambridge [Mass.]: Technology Press, 1960.
55. Ahearne, Jeremy. “Michel de Certeau, The Practice of Everyday Life.” Review essays. International Journal of Cultural Policy 16, no. 1 (1/2/2010): 2–3. doi:10.1080/10286630902971595.
Figure 36 Image by the author
The term ‘Urbicide’56, in my opinion, is very contextual and can encompass varying methodologies. In the case of Kashmir, the killing of urban fabric has been a slow process of infiltration resulting in its ‘physical segregation’57 and fragmentation. The extent of lockdown depends on the political climate at a particular instance. In times of heightened insecurity, even the luxury hotels can be converted to ‘jails’58 for detaining local leaders. This is similar to the conversion of movie theatres to detention centers in the insurgent urban atmosphere of the 1990s. Therefore, the inherent use of space is altered overnight. I argue that this ‘war on the infrastructure’59 of the urban realm in Kashmir is the most quick and efficient way of establishing military impunity and territorial stigmatization.
‘It is the very nature of urban areas and their tendencies to density, congestion, diversities, heterogeneity, and formal diversity that makes them hard to invade and conquer. Both planner and conqueror look for ways to control an area by manipulating its infrastructure, reshaping and replacing the built environment, or attempting to manage the local population’s various cultural sensitivities’60. In the case of the city of Srinagar, urban centers are limited from further development, outposts and security measures have webbed the built fabric. However, the urbanism used as a site of infiltration for colonialism is also used as a retaliatory mechanism, as a resistance for survival, by the people of Kashmir. This case study project zooms into the downtown Srinagar city to spatially narrate the resistance movement.
When we talk about legibility in a city, there are specific movement routes or cognitive maps in the minds of people that make them traverse the city in a particular way. The nodes, landmarks, intersections are important considerations, but in cases of lockdowns, strikes and indefinite curfews, people have to find alternate routes of mobility. The direct road to the hospitals is blocked, the bridges are sealed off so people go around the lake to find alternate means of traffic. ‘They have changed the road map of the city, trying to make us feel like strangers in our own neighborhoods’61, says a resident.
56. Campbell, David, Graham, Stephen, and Monk, Daniel Bertrand. “Introduction to Urbicide: The Killing of Cities?” Commentary. Theory & Event 10, no. 2 (2007): N_A. doi:10.1353/tae.2007.0055.
57. Charlesworth, Esther Ruth. “Divided Cities : Belfast, Beirut, Jerusalem, Mostar, and Nicosia.” Book. Philadelphia : University of Pennsylvania Press, 2009.
58. https://www.theguardian.com/world/2020/ feb/20/how-india-turned-kashmir-centaurhotel-into-a-jail-for-politicians

59. Graham, Stephen,. “Cities under Siege : The New Military Urbanism.” Book. London ; New York : Verso, 2011.
60. https://www.metamute.org/editorial/ articles/military-operations-urban-planning
61. https://apnews.com/ aa7048cf325646298fb773d7cb12d3b6

Theories and Methods of Urban Design Winter 2020 A-180
Figure 37-38 Cartoons by Mir Suhail Figure men
62. https://www.standwithkashmir.org/
Downtown Srinagar is a labyrinth of narrow streets and pathways. During unrest, main roads are always blocked. Social interactions and communications happen in the inner streets. They always open to the River Jehlum where the stagnation is all the more evident. But what makes the urbanism of downtown Srinagar a resilient fabric is the ability to carry on the struggle for ‘self determination’62 through its streets, walls and most important, its people. The community survives prolonged periods of conflict through their urbanism, it helps them cope within the urban camp by reshaping its functions.
Social interactions and take place through mosque visits that help generate and spread news when telecom services are down. Every neighborhood has at least three to four mosques in the vicinity that remain open at all times. While the major roads are sealed off, local business on the inner streets remains open. People gather around street corners and maintain quasi outdoor vibrancy alive. The liveliness comes from the fact that the street has a mixed land use, where shops take up the ground floor of residential spaces. These aren’t just retail, but involve a whole range of craft stores from pottery and copperware to woodwork and Pashmina shawls. The ballet of the downtown city streets is very intricate and close grained. The streets stay safe with constant eyes on them, but social capaciousness isn’t the only reason that provides resilience to its urbanity.
The mazed streets of downtown Srinagar become lively even in times of extreme political tension as people gather in its enclosure and organize protests from within. It is a street dialogue where the sound of conversations loom over the greater silence of the city. The walls are covered in graffiti, slogans are shouted and everyone takes to the streets, as if bricks and asphalt is empowering them.
Through the identification and analysis of military infiltration into the territory of Kashmir, the original landscape has morphed and been redefined. Every element of urban fabric has been subjected to forces of settler colonialism and it fights back through community insurgency and resistance. This constant battle of securing territory and negotiating power marks serious gaps in the way space is ‘conceived, perceived and lived’63 . It was conceived as a paradise on Earth, perceived as a disputed territory and lived as an urban camp.


Kashmir A-181
63. Lefebvre, Henri,. “The Production of Space.” Book. Oxford, OX, UK ; Cambridge, Mass., USA : Blackwell, 1991.
Figure 39 Security lockdown near Jamia Masjid with amy men and tanks patrolling the streets
Figure 40 Settlements of downtown Srinagar with Jamia Masjid and Hari Parbat in the background
Figure 41 Scene in downtown Srinagar during shutdown, barbed wires and army men surround roads
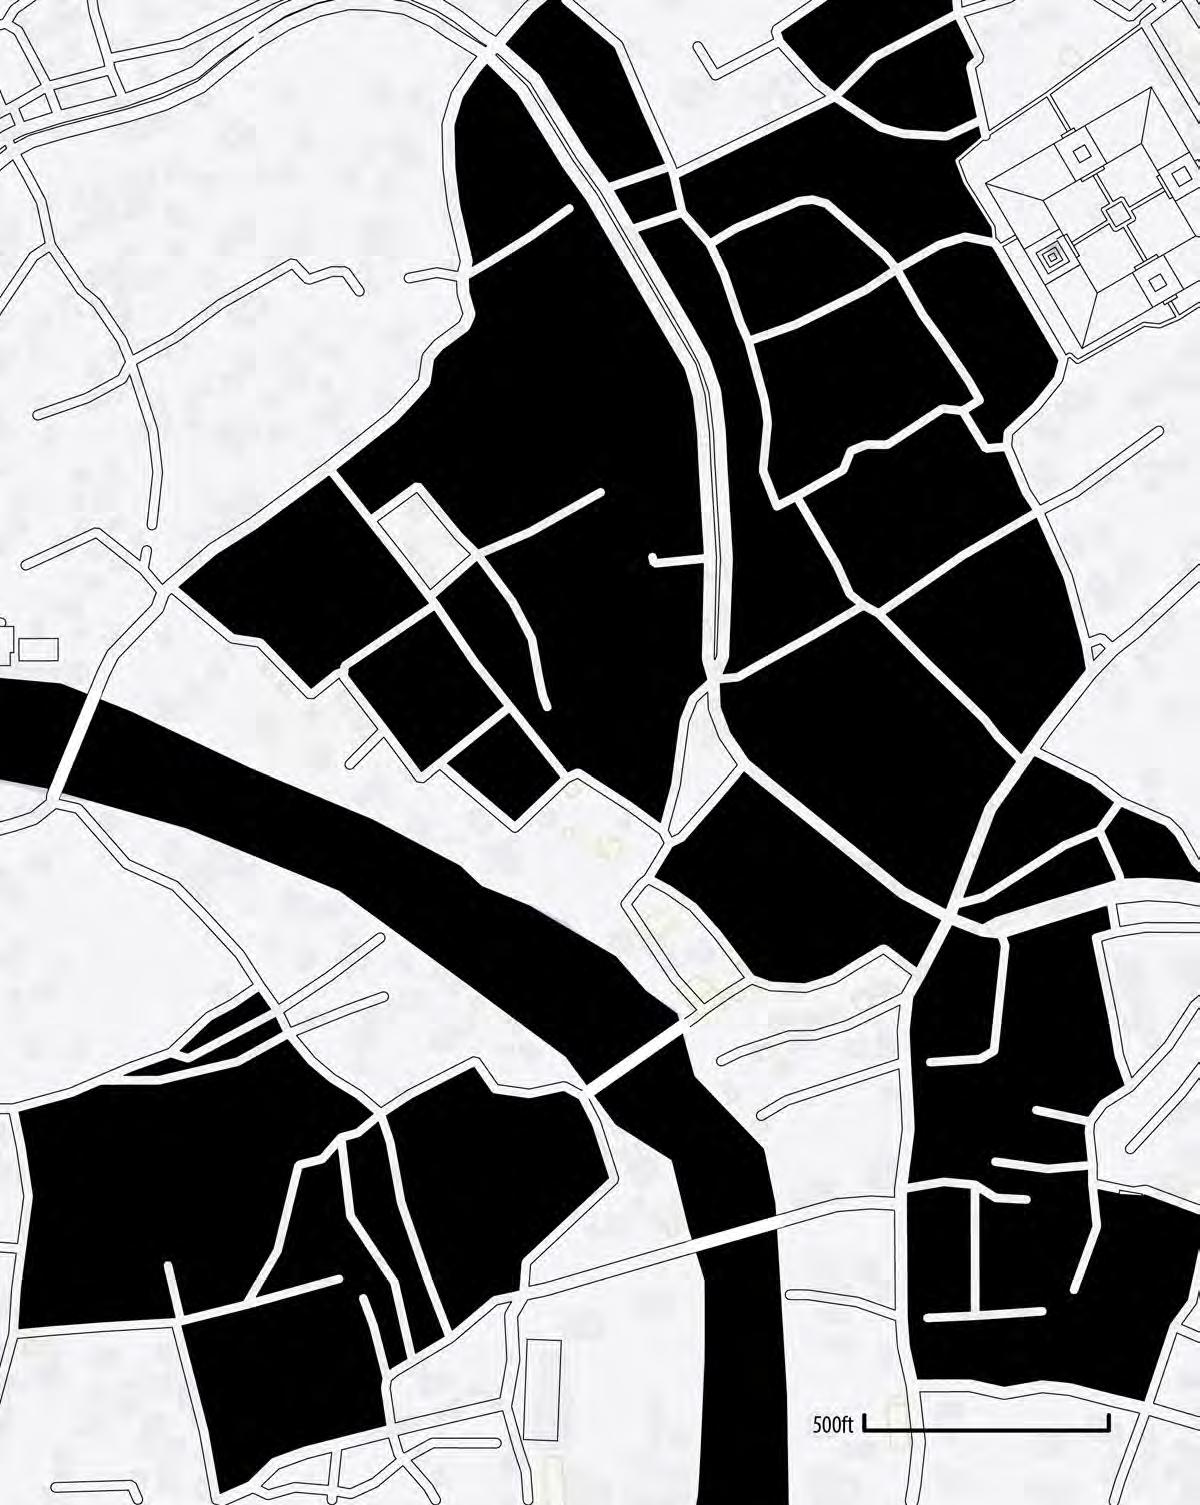
Theories
and Methods of Urban Design Winter 2020
A-182
Figure 42 Image by the author

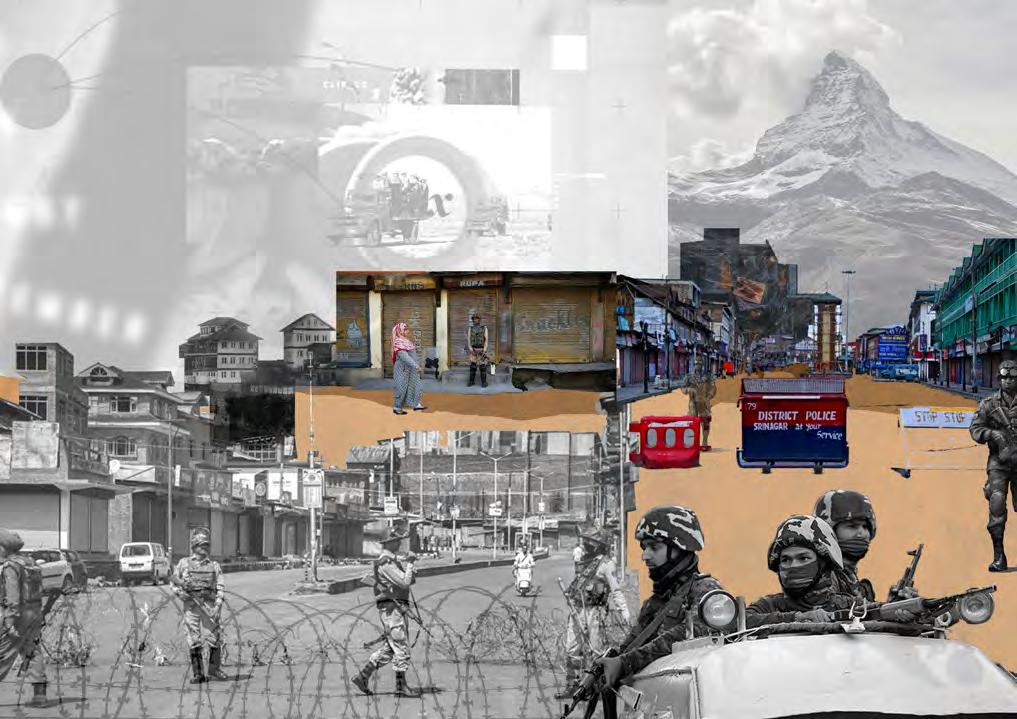
Kashmir A-183
Figure 43 Image by the author
GANGES BASIN INDIA
01 IDENTIFICATION OF THE TERRITORY AND LOCATION
The Ganges, India’s river of life, is a trans-boundary river in Asia which flows through India and Bangladesh. The 2,525 km river rises in the western Himalayas in the Indian state of Uttarakhand, and flows south and east through the Gangetic Plain of India and Bangladesh, eventually emptying into the Bay of Bengal.1
The river Ganges is one of the most powerful natural deities that provides sustenance for both body and soul to the countless settlements along the banks, defines the culture of India and nourishes an entire cultural landscape with settlements along the river’s edge. Nowhere else on earth are the natural and the spiritual worlds so intertwined as in India. This is a place where fire and air, animals and trees, mountains and rivers are revered as gods.2
1. Sawant, Reshma, and Shete, Gurudas. “A Review of Early Historic Urbanization in India.” In A Companion to South Asia in the Past, 319-331. Chichester: Wiley Blackwell, 2016.
02 RELEVANCE FROM THE POINT OF VIEW OF URBAN DESIGN THEORY AND PRAXIS
Great rivers give birth to great civilizations. Since the late Harappan period, after the decline of the Indus civilization, a second period of urbanization, known as the Ganges civilization, began between 1900–1300 BC.3 The Ganges River Basin has witnessed the construction of ancient settlements and villages for generations, becoming a symbolic river with religious, cultural, and socioeconomic significance in India.4
For millennia, the Ganges is one of the most sacred waters to Hindus. Religions and culture bring the aggregation of people; the aggregation of people forms the city. Many cities along the Ganges could be seen as an epitome of a great and profound history of religion in India. On the one hand, numerous ancient cities form along the Ganges, such as Varanasi, which present a scenario of great Indian cultures. Magnificent ancient temples, huge stairs down to the river, sophisticated sculpture and traditional customs represent the history of
2. Ganges. Directed by Ian Gray. London: BBC Natural History Unit, 2007
3. Erdosy, George. “The Origin of Cities in the Ganges Valley.” Journal of the Economic and Social History of the Orient 28, no. 1 (1985): 81-109.
4. Kumar, Dilip. “River Ganges – Historical, Cultural and Socioeconomic Attributes.” Aquatic Ecosystem Health & Management 20, no. 1-2 (2017): 8–20.
5. Jayaswal, Vidula,. The Buddhist Landscape of Varanasi. Aryan Books International, 2015.
Theories and Methods of Urban Design Winter 2020 A-184
[Critical DATA]
Geographical Delimitation
The Ganges basin is a part of the Ganges-Brahmaputra basin in Tibet, Nepal, India and Bangladesh.
Area
1,086,000 km²
Population
400 million [as of 2015]
Social Indicators
The Ganges is a sacred river to Hindus along every fragment of its length. Because of its highest mystic power of sanctity, people from all parts of India came and settled along the river - resulting in the development of a social space encompassing all of India.6
Economic Indicators
The Ganges Basin with its fertile soil is instrumental to the agricultural economies of India. The Ganges and its tributaries provide a perennial source of irrigation to a large area.7 Another main economic activity in the Ganges basin is tourism. Three towns holy to Hinduism—Haridwar, Prayag, and Varanasi— attract millions of pilgrims to its waters to take a dip in the Ganges, which is believed to cleanse oneself of sins and help attain salvation.
Environmental Indicators
More than 95% of the upper Gangetic Plain has been degraded or converted to agriculture or urban areas.8 Meanwhile, the Ganges suffers from extreme pollution levels, caused by the 400 million people who live close to the river.
Ganges Basin INDIA
6. Ghosa Amalānanda. An Encyclopaedia of Indian Archaeology. Leiden: Brill, 1990.
7. Stone, Ian. Canal Irrigation in British India: Perspectives on Technological Change in a Peasant Economy. Cambridge: Cambridge University Press, 1984.
8. Acciavatti, Anthony, Aleksandr Bierig, Duncan Corrigall, and Rahul Mehrotra. Ganges Water Machine: Designing New Indias Ancient River San Francisco, CA: Applied Research Design Publishing (ar d), 2015.
Ganges Basin A-185
India and the development of Indian religions.5 On the other hand, some cities, which does not exist permanently, also show a temporary flux of traditional celebrations and events in India. Kumbh Mela, a Hindu festival held every 12 years, is an extreme example of a religious congregation that generates a megacity, an ephemeral megacity.9
Another factor that makes the Ganges become historically important is its convenience of waterway transportation, which make the Ganges one of the centers of social and political tradition in India. Many former provincial or imperial capitals, including Patliputra, Kannauj, Kara, Kashi, Allahabad, Murshidabad, Munger, Baharampur, Kampilya and Kolkata, have been located on its banks.10 During the colonial period, with the invasion of western architecture culture, Indian and western architecture culture gradually began to mix, which is particularly evident in Kolkata, the capital of British India from 1772 to 1911. Since the twentieth century, classic European architecture during the colonial period and modern Indian architecture before and after India’s independence both represent the architectural feature of “fusion”.
Based on these traditional meaning of the Ganges, today, the future development of cities along the Ganges has become a quite common but difficult issue. It is a always problem between the traditional and the modern, between the informal and the formal, also between the citizens and the government. Kashi Vishwanath Corridor is selected as an example to show this controversy and conflict in the development of Varanasi, one of the most important religious hubs in India. On the one hand, It is Prime Minister Modi’s “dream project” to connect the Kashi Vishwanath Temple (one of the most temples in Indian religion) to the steps leading to the banks of the Ganges. Numerous ancient temples also come to light because of the project. On the other hand, more than 270 homes and 15 neighborhoods were demolished due to the project. Many residents see the project as a blow to Hindu spirituality. What would be a proper way in the transformation of cities like Varanasi in India? It would be an inevitable problem architects and urban designers would face all the time.
INDIA CHINA BANGLADESH BHUTAN NEPAL Theories and Methods of Urban Design Winter 2020 A-186
9. Mehrotra, Rahul, Felipe Vera, and Dinesh Mehta. Kumbh Mela: Mapping the Ephemeral Megacity. New Delphi: Niyogi Books, 2015.
10. Wang, Yongping. Indian Colonial Cities and Architecture. Nanjing: Southeast University Press, 2017.
0 300 mile
Figure 01. Map of Ganges Basin
TIMELINE : HISTORY, ACTORS AND EVENTS
2020 1700
2019
Kashi Vishwanath Corridor Project started. More than 30 temples have come to light but many citizens’ houses were cleared.
India’s Prime minister Narendra Modi affirmed to work in cleaning the river and controlling pollution.
1850
2013
2007
Ganges was ranked as one of the five most polluted river in the world. The pollutants range from toxic industrial waste to sewage to plastics and innumerable religious offerings made to the river.
1986-
2000 Rs. 10 billion, around US$226 million, or less than 4 cents per person per year, were spent on the Ganga Action Plan.
1986
1960s-
Over the 1960s and 1970s, severe power shortages, strife in labour relations and a militant Marxist-Maoist movement who sometimes used violence and property destruction as tactics of protest damaged much infrastructure in some cities such as Kolkata, leading to economic stagnation. 1970s
India became a sovereign and democratic nation in July 1947, marking the end of British India.
1911
1910
1900s
In December 1929, the Indian National Congress Party started a movement for complete independence from British rule. It became the civil disobedience movement.
On 12 December 1911, George V Mary made the announcement that the capital of the Raj was to be shifted from Kolkata to Delhi
British made Varanasi a new Indian state, with Ramnagar as its capital.
Countless palaces, forts, garden houses, and squres were built by British.
1868
The first British reference to the Kumbh Mela in Prayag occurs only in an 1868 report, which mentions the need for increased pilgrimage and sanitation controls at the “Coomb fair” to be held in January 1870.
The first British canal in India—with no Indian antecedents—was built.
British East India Company ruled parts of the Indian subcontinent, which is taken to have commenced after the Battle of Plassey.
The East India Company, was formed to trade in the Indian Ocean region. Britain began trading in India frequently.
The spread of Harappan settlement eastward from the Indus River basin to the Ganges-Yamuna doab, cities began to come into being along the Ganges River.
Ganges Basin A-187
1800 1900 1920 1500 BC 1960 1980 2000
1940 1947 2014 1612 1757 1854
Raghubir Singh, an Indian photographer, has noted that no one in India spoke of the Ganges as polluted until the late 1970s. The Ganges Action Plan (GAP) was launched by Rajiv Gandhi, the then Prime Minister of India, on June 1986 with covering 25 towns. 2010 1600
The most recent full Kumbh Mela was held, which became the largest religious gathering in the world with almost 120 million visitors.
1929
03 METHODS TO CONDUCT YOUR INVESTIGATION
The data of this research will be collected in the following four ways:
(1) Conduct the research on the history and basic information of Ganges basin utilizing historic maps and old report on the Ganges River.
(2) Study related literature of the Ganges, which helps relate the history and culture of the Ganges to the theory and practice of urban design.
(3) Watch several related documentaries to understand better about the religions and festivals of the settlements along the Ganges.

(4) Conducted research on social media including Instagram to find events or projects of the highest social concern in Indian cities.
05 ANTICIPATED FINDINGS
Based on the preliminary research, several conclusions would be drawn:
(1) Several factors including religion or celebration would result in the continuous flux and the temporalities in the urban contexts, so we need to also accommodate more of these phenomena rather than lock ourselves into an absolute solution.11
(2) Post-colonial cultures represent an interpenetration process and a novel form of urbanization. With the globalization, it is also an intriguing and important lesson for urban designers to learn about the process of hybridity of traditions in post-colonial cities.
(3)Access to the water could be an essential part in traditional Indian urban
Theories and Methods of Urban Design Winter 2020 A-188
Figure 02-06. Photographs along the Ganges River
11. Haas, Tigran, and Hans Westlund. In the PostUrban World Emergent Transformation of Cities and Regions in the Innovative Global Economy. London: Routledge, Taylor & Francis Group, 2018.
space, especially old cities along the Ganges. Nonetheless, it should not be the only rule that urban designers obey in reorganizing the waterfront space in Indian cities. Religions and gods bless believers to live a better life, but not destroy their own houses.
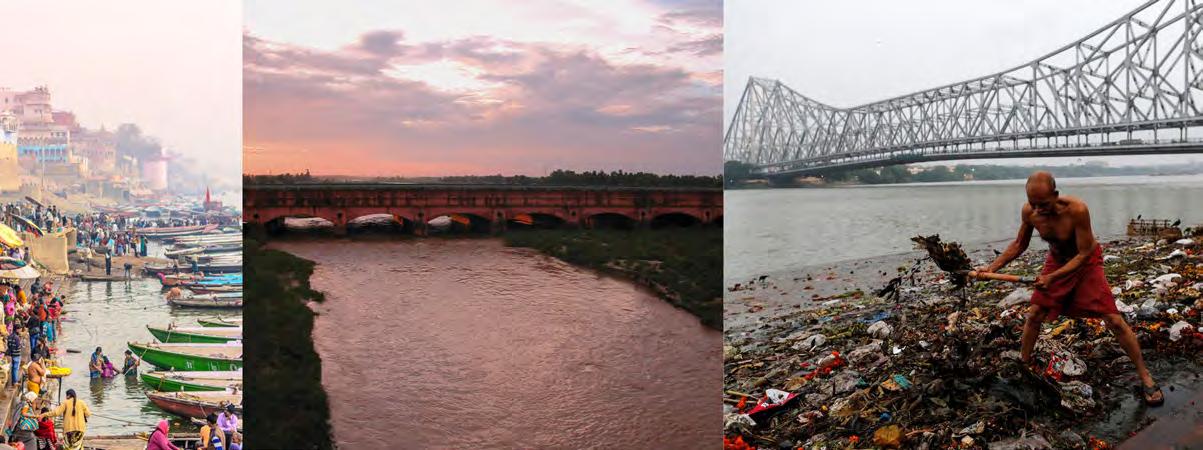 Ganges Basin A-189
The River of the History
THE RIVER GANGES

The Water Goddess
Cultural and Religious Significance
Holy Cites
Waterway Transportation
Historical and Political Significance
Capital Cites
 Project 1: Kumbh Mela
Project 2: Maidan
Theories and Methods of Urban Design Winter 2020 A-190
Figure 07. Diagram of Research Method
Future Development Tradition and Modernity
The River of the Future
Informality and Formality
Project 3: Kashi Vishwanath Corridor


Controversy and Conflict Ganges Basin A-191

Theories and Methods of Urban Design Winter 2020 A-192 Y A M U N A G A N G E S 0 0.3 mile
Figure 08. Satellite Map of Kumbh Mela
Oxford University Press, 2015.
KUMBH MELA [EPHEMERAL URBANISM]
Among the many complex interactions between humans and water in the Ganges river basin, perhaps none is more awe-inspiring than the religious festival of Kumbh Mela. Held every 12 years, Kumbh Mela is a major pilgrimage and festival in Hinduism at the confluence of Ganga-Yamuna River.12
The Kumbh Mela is said to be the biggest gathering of people in the world. When the festival approaches, approximately 7 million people gather for 55 days, with an additional flux of 10 to 20 million people coming24-hour cycles on the 6 main bathing dates.13 Attendees at the Kumbh Mela come from all sections of Hindu religious life, ranging from sadhus (holy men) to hermits, and even to silkclad teachers using the latest technology.
Location Year(s) Status
Footprint Designer
Key Project Components Programs
Funding Streams
[Confluence of Ganges and Yamuna River, INDIA]
[Every 12 years]
[Ephemeral]
[11.5 mi2]
[Prayagraj Mela Authority]
[A gridded city plan is cyclically laid out as the bathing festival Kumbh Mela takes place every 12 years.]
[Religious pilgrimage, rituals, social practices and festive events marked by a ritual dip in the waters as well as a celebration of community commerce with numerous fairs, education, religious discourses, and mass feedings of monks or the poor]
[Public]
Ganges Basin A-193
INDIA CHINA BANGLADESH BHUTAN NEPAL Kumbh
100 mile 100 mile
Mela
12. Dharampal, Gita, Monika KirloskarSteinbach, Rachel Dwyer, and Jahnavi Phalkey. Key Concepts in Modern Indian Studies. New Delhi, India:
13. Mehrotra, Rahul, Felipe Vera, and Dinesh Mehta. Kumbh Mela: Mapping the Ephemeral Megacity. New Delphi: Niyogi Books, 2015.
Figure 09. Location of Kumbh Mela
MELA AND EPHEMERAL URBANISM
The idea “ephemeral urbanism” considers the constant flux in the current urban environment and the flexibility and uncertainty of the programming of urban surface. The Kumbh Mela is a typical example of ephemeral urbanism, which is framed by both a strong cultural ecology and a highly dynamic physical geography.

The cycle of the festival results in the cycle of the city. According to Hindu mythology, a fight between the gods and demons continued for 12 divine days, which is considered to be as long as 12 years for humans.14 So Hinduism believers celebrate the festival once in 12 years. Also, affected by the monsoon, the water level at the confluence of Ganges and Yamuna River will rise and fall, and the venue for the festival will be submerged seasonally.
In response to these two cycles, the city will be established every 12 years and last for only around two months. From a fertile agricultural land, roads in a grid system, electrical poles, pontoon bridges, water infrastructures and tents are all constructed in around six months before the festival, and quickly occupy the land of over 30 km2.
Theories and Methods of Urban Design Winter 2020 A-194
14. Maclean, Kama. “Making the Colonial State Work for You: The Modern Beginnings of the Ancient Kumbh Mela in Allahabad.” The Journal of Asian Studies 62, no. 3 (2003): 873–905.
Figure 10. Tents during Kumbh Mela Festival
KUMBH
Y
Ganges Basin A-195
pontoon bridges temporary blocks
the Ganges
0 0.3 mile
Y A M U N A G A N G E S
Figure 11. Figure Ground Plan
KUMBH MELA AND EPHEMERAL URBANISM

How can people start to manage this rapid, unprecedented process of urbanization that aims to assemble such a megacity in a matter of weeks?
Unlike a more permanent city, the Kumbh Mela takes form like a choreographic process of temporal urbanization, happening in coordination with environmental dynamics. It comprises 5 stages: planning, construction, assembly, operation, and deconstruction.15 These stages are directly linked to the makeshift context and timings determined by the presence of the monsoon in the region. The aggregation of units converges in an endless texture of cotton, plastic, plywood, and other materials all of which is organized by a smart infrastructural grid for roads, electricity, and waste, making the construction in an incredible speed and at the lowest cost. When the events ends in March, all these items are deconstructed, leaving no trace on the site.
Theories and Methods of Urban Design Winter 2020 A-196
15. Mehrotra, Rahul, Felipe Vera, and Dinesh Mehta. Kumbh Mela: Mapping the Ephemeral Megacity. New Delphi: Niyogi Books, 2015.
Figure 12. Pontoon Bridge during Kumbh Mela Festival
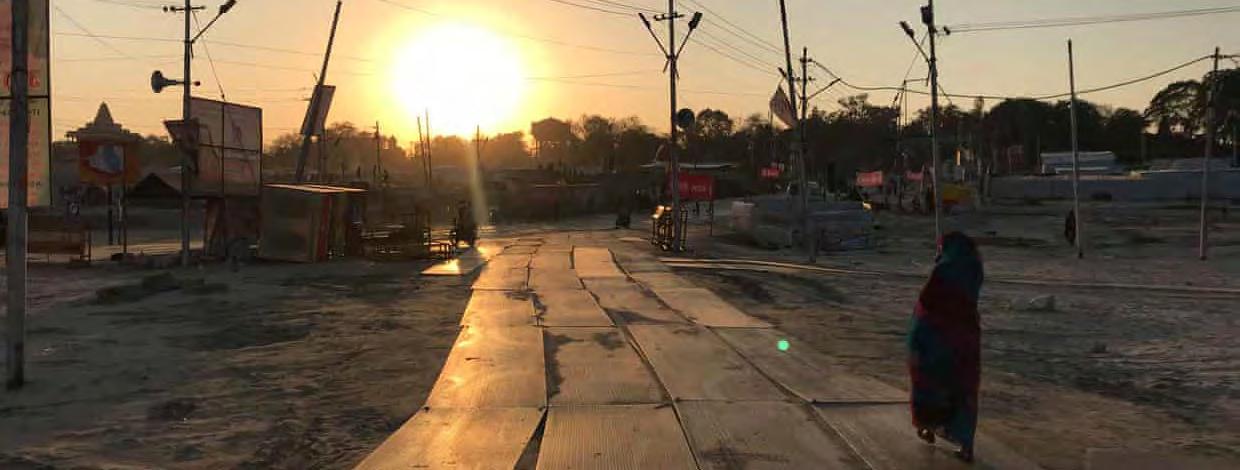 Ganges Basin A-197
Electric Poles Pontoon Bridges
River Edge
Tents A
Tents B
Tents C
Figure 13. Temporary Metal Road during Kumbh Mela Festival
Figure 14. Taxonomy


Theories
A-198
and Methods of Urban Design Winter 2020
Figure 15. Transect
Figure 17. Collage
Cycle of Festival Cycle of Monsoon
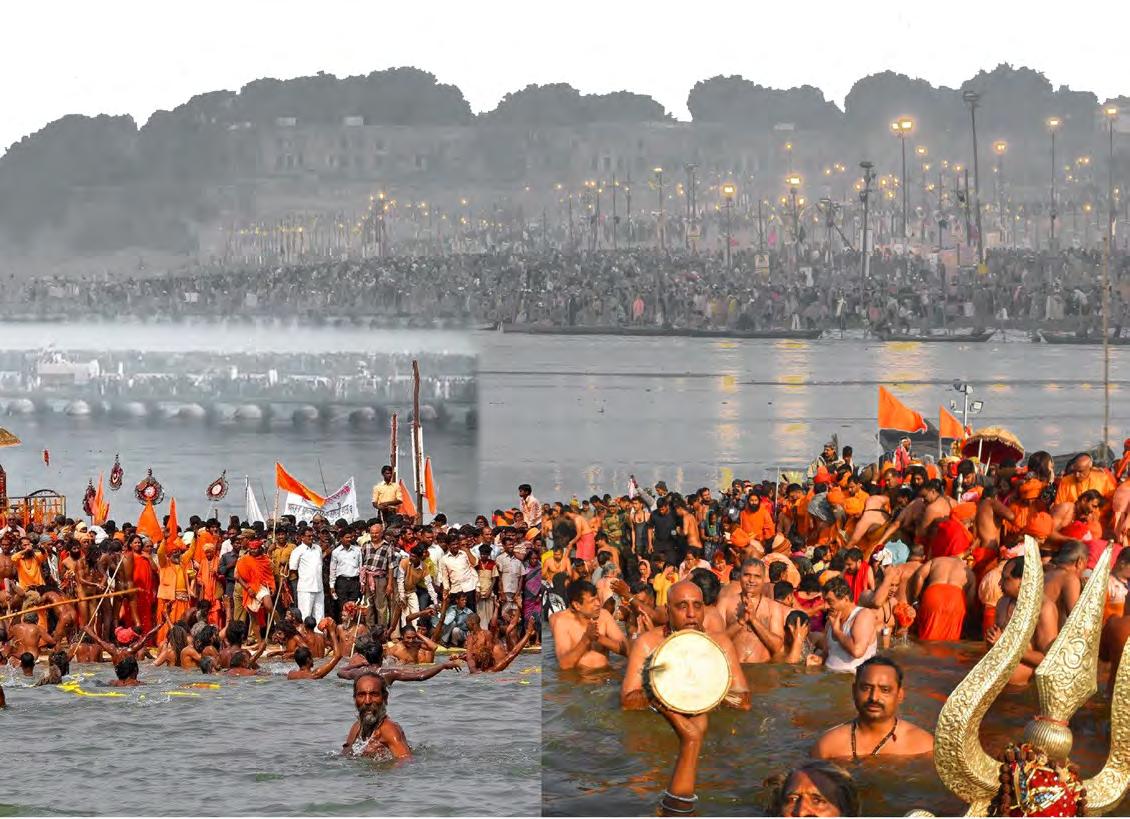
Temporary Flux
Temporary Events
Temporary Infrastructure
Temporary Buildings
Kumbh Mela Prayagraj Mela Authority
Ganges Basin A-199
Figure 16. Actors
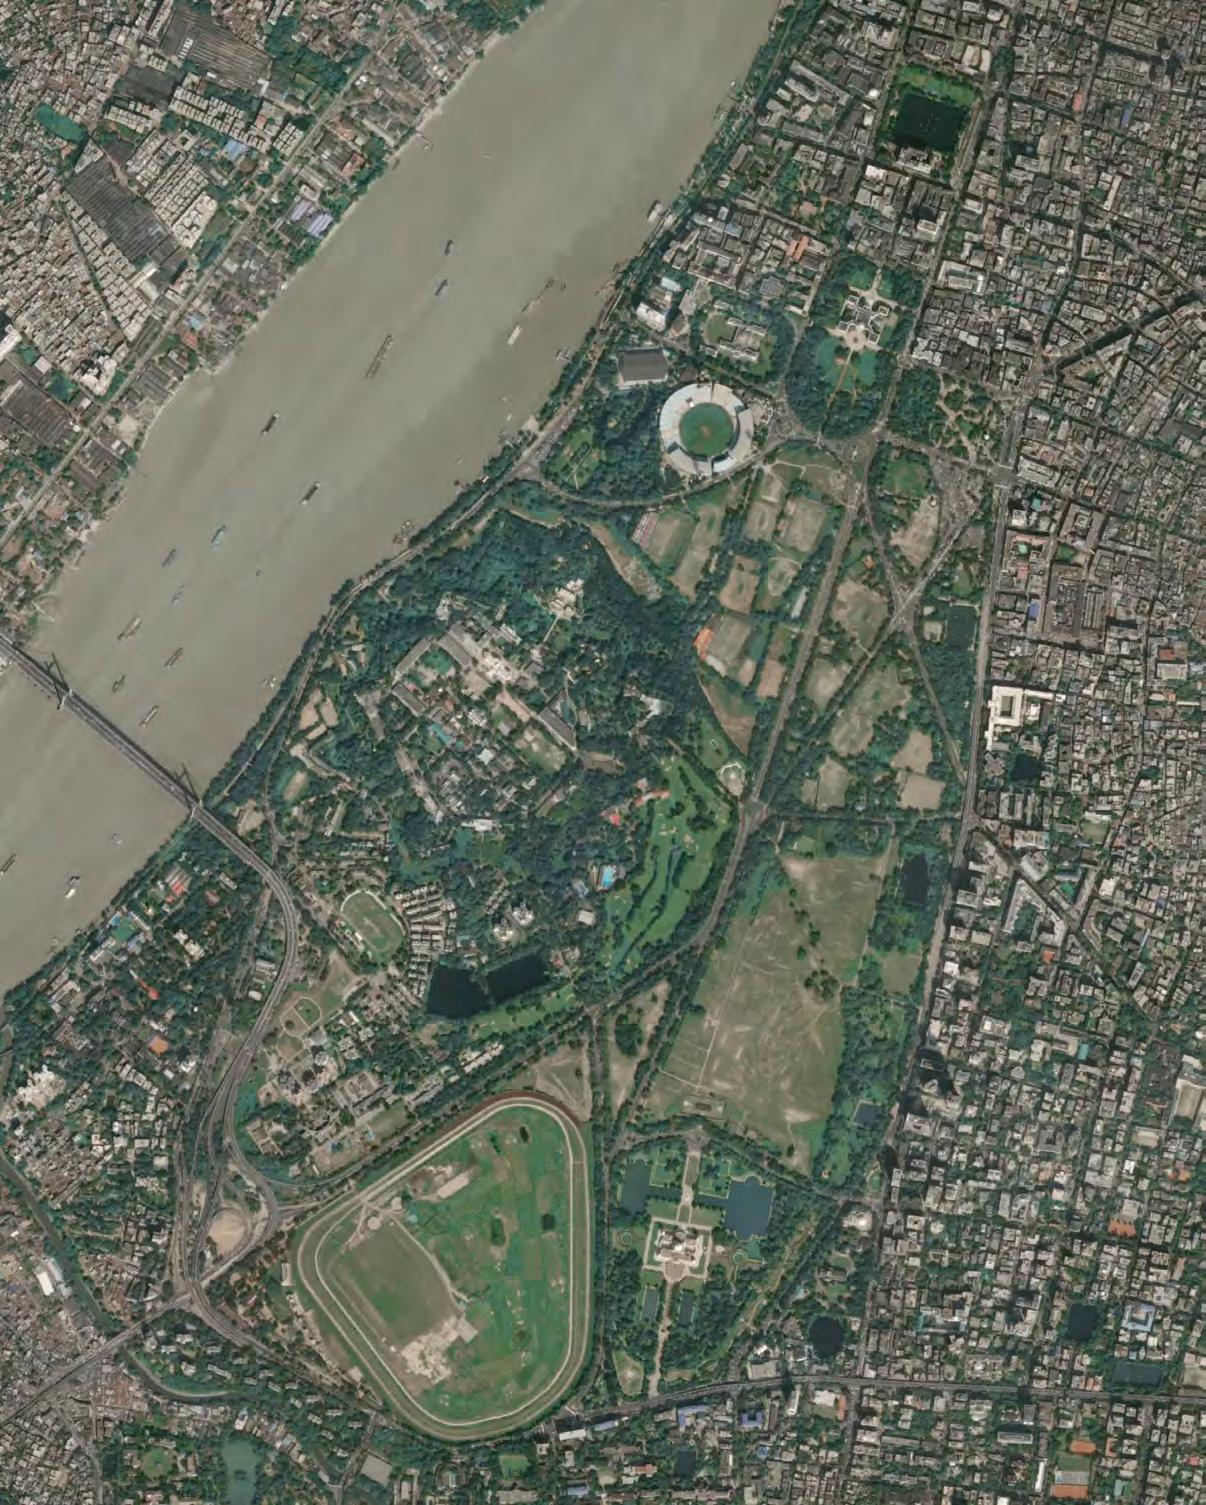
Theories and Methods of Urban Design Winter 2020 A-200 0 0.2 mile G A N G E S
Figure 18. Satellite Map of Maidan
Location Year(s)
Status
Footprint Designer
Key Project Components Programs
Funding Streams
MAIDAN [POST-COLONIAL URBANISM]
The Maidan (literally, open field), also referred to as the Brigade Parade Ground, is the largest urban park in Kolkata in the Indian state of West Bengal.16
The Maidan was initially developed as a parade ground for the forces. It is a vast stretch of field that includes numerous play grounds, including the famous cricketing venue Eden Gardens, Fort William, several football stadiums, and the Kolkata Race Course.17 The Maidan is dotted with statues and architectural works, the most notable being the Victoria Memorial. Due to the freshness and greenery it provides to the metropolis, it has been referred to as the “lungs of Kolkata”.
[Kolkata, INDIA]
[1758]
[Built]
[2 mi2]
[British East India Company]
[It is a vast stretch of field that includes numerous play grounds, including the famous cricketing venue Eden Gardens, several football stadiums, and the Kolkata Race Course.]
[Initially developed as a 1.9-sqaure-mile parade ground for the forces. Now as a place of political rallies, fairs and exhibitions or for citizens to play cricket and football.]
[Public]
Ganges Basin A-201
INDIA CHINA BANGLADESH BHUTAN NEPAL
Maidan
16. Wang, Yongping. Indian colonial cities and architecture. Nanjing: Southeast University Press, 2017.
100 mile 100 mile
17. Halder, Sibabrata, and Manju Halder. Colonial Architecture of Kolkata: Reflections of the European Building-Art in Eastern Enterprise Kolkata: Urbee Prakashan, 2013.
Figure 19. Location of Maidan
MAIDAN AND POST-COLONIAL URBANISM
“Post-colonial urbanism” refers to the novel forms of urbanization that emerged with the recession of western colonial powers within formerly colonized cities. Kolkata used to be the capital of British India, which witnessed a spate of frenzied construction activity of buildings largely influenced by the conscious intermingling of Gothic, Baroque, Roman, Oriental and Islamic schools of design.18 Maidan in Kolkata was built to be military use at first, and become the largest urban park in Kolkata at present.
In the era of British India, Maidan, grown from a small parade ground for the forces into a mega park, had cricket grounds, marble mausoleums, cathedral, fort, and acres of lush lawns dotted with pools and ponds carefully manicured for the morning and evening strolls taken by the departing Raj.

Theories and Methods of Urban Design Winter 2020 A-202
19. Banerji, Anu, and Ghosh, Tapan. “From Space to Place: The Recent Transformation of Calcutta’s Maidan.” Environments 22, no. 2 (1/1/1994): 82.
Figure 21. Figure Ground Plan
Figure 20. Victoria Memorial in Maidan
G A N G E S
Ganges Basin A-203
colonial buildings other buildings the Ganges 0 0.2 mile
MAIDAN AND POST-COLONIAL URBANISM

Today, Maidan’s fascination still holds but in a different way. Over the past years Maidan has undergone transformations.
It is now more responsive to its citizens in providing an urban refuge where they can be near its landmarks, trees, fresh air, open sky, sounds of water and so on. Forts and palaces have transformed into libraries and museums; private venues have become open to everyone; new housing has been built along the periphery of the park. People come to Maidan to jog, walk, stroll, play and fly kites. Le Corbusier once dubbed this sort of urban space as “lungs” of a city.19
Theories and Methods of Urban Design Winter 2020 A-204
19. Banerji, Anu, and Ghosh, Tapan. “From Space to Place: The Recent Transformation of Calcutta’s Maidan.” Environments 22, no. 2 (1/1/1994): 82.
Figure 22. Plan of Fort William in Maidan
 Ganges Basin A-205
European Palace Eden Gardens
Residential Buildings
European Gardens Race Course
Fort William
Figure 24. Taxonomy
Figure 23. Aerial View of Maidan in the 1800s


A-206
Theories and Methods of Urban Design Winter 2020
Figure 25. Transect
Figure 27. Collage
British India
Maidan, Kolkata

Kolkata Government
European Palace
European Gardens
Fort William
Hybridity and Fusion
Housing Development
Museums
Stadiums
Ganges Basin A-207
Figure 26. Actors

Theories and Methods of Urban Design Winter 2020 A-208 0 0.05 mile
A N G
G
E S G A N G E S
Figure 28. Satellite Map of Kashi Vishwanath Corridor
Location
Year(s)
Status
Footprint Designer
Additional Agents
Key Project Components Programs
Funding Streams
KASHI VISHWANATH CORRIDOR [CONFLICT URBANISM]
Varanasi is a city on the banks of the river Ganges in Uttar Pradesh. It is a major religious hub in India, the holiest of the seven sacred cities in Hinduism and Jainism.20
This ancient city, however, is going through a major transformation. Kashi Vishwanath Corridor, Prime Minister Narendra Modi’s “dream project”, started in 2019, which connects the Kashi Vishwanath Temple (a shrine dedicated to Lord Shiva) to the steps leading to the banks of the Ganges.21 Numerous ancient temples hidden under residential and commercial structures have been freed from crowded and narrow streets and come to light again. But the plans have brought major changes and controversy to Varanasi—more than 270 homes and 15 neighborhoods were demolished to clear 45,000 square meters of space for the corridor.
[Varanasi, INDIA]
[2019]
[In Progress]
[0.02 mi2]
[Dr. Bimal Patel]
[Government of Prime Minister Narendra Modi]
[A unique project in Varanasi is pushing for modern development in the heartland of Indian antiquity.]
[Ancient temples, pilgrim center, public utilities such as auditorium, museum, wellness centers, boutiques]
[Public]
Ganges Basin A-209
INDIA CHINA BANGLADESH BHUTAN NEPAL
Kashi Vishwanath Corridor
20. Jayaswal, Vidula,. The Buddhist Landscape of Varanasi. Aryan Books International, 2015.
100 mile 100 mile
21. Singh, Ranah P. B. “Water Symbolism and Sacred Landscape in Hinduism: A Study of Benares (Varanasi).” Erdkunde 48, no. 3 (1994).
Figure 29. Location of Kashi Vishwanath Corridor
KASHI VISHWANATH CORRIDOR AND CONFLICT URBANISM

“Conflict urbanism” is a term that designates not simply the conflicts that take place in cities, but also conflict as a structuring principle of cities, as a way of inhabiting and creating multiple components of urban space.22 There is a battle to belong behind Kashi Vishwanath Corridor Project, between modernity and tradition, government and citizens, power and democracy, beautification of the city and livelihood of people.
On the one hand, the project is a beautification plan and movement to decongest Varanasi and have state-of-the-art facilities. Varanasi has always been defined by its maze of narrow alleyways, palaces, heritage homes and centuriesold temples. The Prime Minister Narendra Modi, who supervises the project, said it was his long-standing dream to renovate the temple complex. When Modi came to Varanasi to lay the cornerstone for the corridor in early March, he declared it “the beginning of the liberation of the Kashi Vishwanath Dham”. Some devotees are rejoicing with the project, regarding it as a model for historic precincts in the country.23
On the other hand, although the government claimed that the corridor, aims to beautify the area and establish a direct link from the temple to the Ganges river, the project was met with vehement protest when it was announced since the project seriously affected the local’s livelihoods. Many old neighborhoods predating the temple have effectively been wiped out, and with them, timehonored traditions. Thousands of residents evicted from these neighborhoods now face a bleak future. Many city residents see the project as a blow to Hindu spirituality.
Theories and Methods of Urban Design Winter 2020 A-210
22. “Events.” Lecture | Conflict Urbanism | Center for Middle East Studies. Accessed April 30, 2020. https://watson.brown.edu/cmes/ events/2017/lecture-conflict-urbanism.
23. Desai, Madhuri. Banaras Reconstructed Architecture and Sacred Space in a Hindu Holy City Seattle : University of Washington Press, 2017.
Figure 31. Figure Ground Plan
Figure 30. The Ancient City of Varanasi and the Path of the Corridor.
Plan G A N G E S G
N G E S temples other buildings the
0 0.02 mile before the project project proposal
Ganges Basin A-211
A
Ganges
KASHI VISHWANATH CORRIDOR AND CONFLICT URBANISM
The project represent a common but difficult problem. In what way should traditional cities like Varanasi develop and transform?

I agree that many magnificent cityscapes emerge on the basis of sacrificing the interests of residents (eg. Haussmann’s plan for Paris). With a long history of Indian cultures, Indian cities at the Ganges banks have extremely complex city context. But in the transformation of these cities maybe we urban designers need to think about what exactly these religions and cultures mean to the city and people. Should the god they believe become a devil to demolish their own houses?
“We believed Lord Shiva roamed these alleyways and visited our homes to bless us,” said a respondent in a report. “It was our living city.”24
24. Sen, Priyadarshini, Priyadarshini Sen, Priyadarshini Sen, Priyadarshini Sen, Adelle M. Banks, Ryan Burge, and Claire Giangravé. “Refurbishing Holy Site, India’s Modi Levels Ancient Spiritual Landscape.” Religion News Service, September 22, 2019. https:// religionnews.com/2019/04/22/plans-torefurbish-a-hindu-temple-ruffle-communitiesalong-the-ganges/.
Theories and Methods of Urban Design Winter 2020 A-212
Figure 32&33. Several Old Temples in Varanasi Rediscovered Within the Demolished Houses
 Ganges Basin A-213
Stairs Stairs + Temple Stairs + Platform
Temple Housing + Temple Housing
Figure 34. Taxonomy
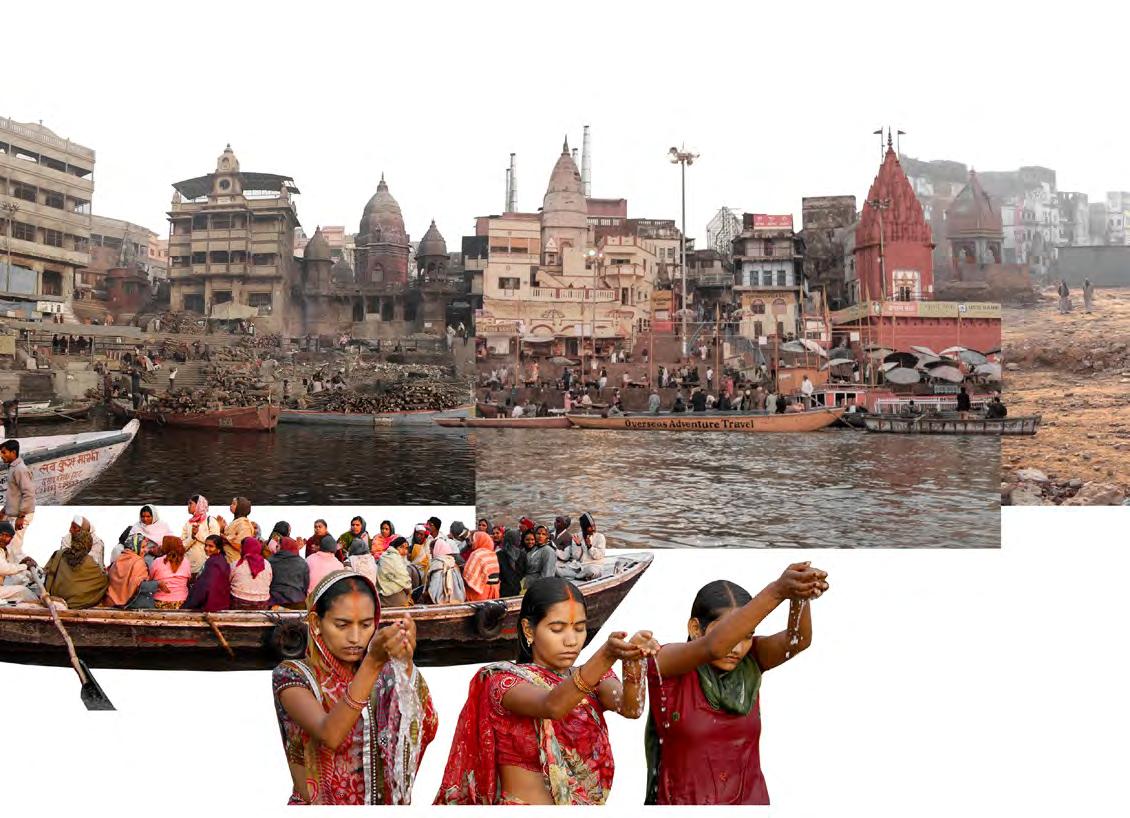

Theories
A-214
and Methods of Urban Design Winter 2020
Figure 35. Transect
Figure 37. Collage
Kashi Vishwanath Corridor Varanasi Government
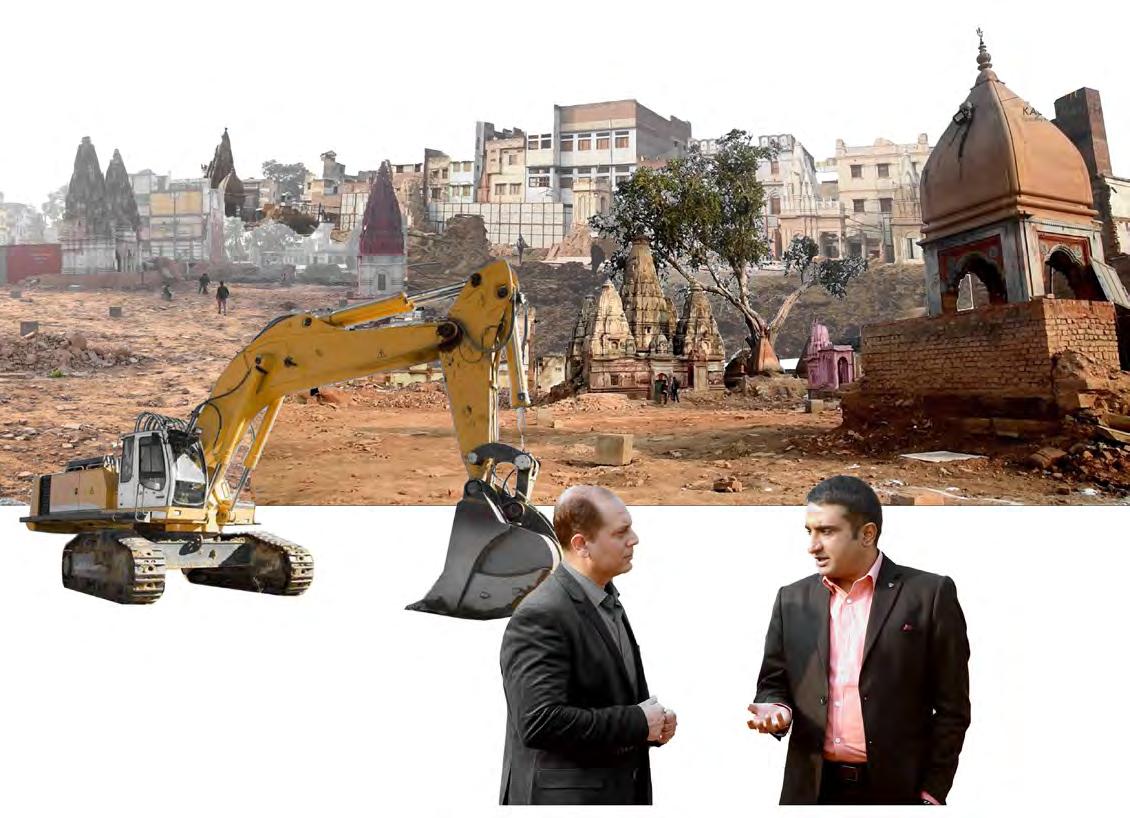
Kashi Vishwanath Temple
Other Ancient Temples
Waterfront Stairs
Varanasi Citizens support against Save and Create
Sacrifice and Demolish
Original Citizens’ Houses
Ganges Basin A-215
Figure 36. Actors
SINGAPORE SINGAPORE
01 IDENTIFICATION OF THE TERRITORY AND LOCATION
Singapore, located at the southernmost tip of the Malay Peninsula in the Southeast Asian region, is a tropical island nation consisting of one main island along with 58 other islets. Blocking the southern exit of the Strait of Malacca, Singapore is considered an important maritime channel. With the expansion of colonialism and the globalization of trade, Singapore Port has become one of the world’s busiest ports since the late 19th century. The Port of Singapore and the Straits of Malacca are important hubs of the Maritime Silk Road. East Asian countries’ bulk cargo shipping to Europe and Africa must pass through the Straits of Malacca, which is managed by Singapore. Leading to the Middle East and Europe, the Malacca Straits are still the shortest sea route, and the cost of shipping via the Malacca Straits is much lower than the land transportation cost of the Eurasian Continental Bridge. Every year, nearly 100,000 ships pass through the 105-kilometer-long Singapore Strait, bringing oil from the Middle East, iron ore into China, and coal from Southeast Asia to India, accounting for about a quarter of the world’s traded goods.
Thanks to the historical exported trade, Singapore earned a highly-developed market economy. Along with Hong Kong, South Korea, and Taiwan, Singapore was one of the original Four Asian Tigers during the second half of the 1990s, but has already surpassed others in terms of GDP per capita. In the past 40 years, with the exception of a few years of recession, almost full employment has been achieved; Inflation is usually less than 2%. Wages have risen steadily after inflation, reflecting improvements in productivity. Life expectancy and the quality of health care are among the highest in the world.
Although colonial history is not a pleasant memory for the people of Singapore, the immense impact of colonization on population migration brought a mixed conflicted and blended human life to this southeast Asian country. At the same time, precisely because of the special demography and development history, Singapore is recognized as one of the most liberal, innovative, competitive, dynamic and business-friendly economies, Singapore attracts investors from all
Theories and Methods of Urban Design Winter 2020 A-216
1. Wong, Tai-Chee. Spatial Planning for a Sustainable Singapore. Dordrecht: Springer, 2008. Accessed January 22, 2020. ProQuest Ebook Central.
2.“How Does Travel & Tourism Compare to Other Sectors?” the authority on world travel & tourism - benchmarking report 2017, 2017.
Singapore
[Critical DATA]
Geographical Delimitation
The Republic of Singapore is situated off the southern tip of the Malay Peninsula and lies in 1°17′N 103°50′E.
Area
581.5 square kilometers (1960s), 719.1 square kilometers (2018)
Population
5.64 million (0.52 million permanent residents
1.64 million foreign students/foreign workers/Dependants)
Social Indicators
Ethnic groups: Chinese descent(74.1%), Malay descent(13.4%), Indian descent(9.2%) Religion: Buddhism(33.2%), Christianity(18.8%), no religion(18.5%), Is- lam(14..0%),Taoism and folk religion(10.0%), Hinduism(5.0%)
Language: 4 official languages
Economic Indicators
The total GDP: $349.7 billion(2018)
GDP per capita: $61766(2018)
Unemployment rates: 2.2%(2019)
Environmental Indicators
Waters: 1.44%
Water demand: 380(2010) to 760(2060) million per day
Water sources: 4-Malaysia, rainwater catchments, reclaimed water, seawater desalination
Singapore A-217
3. “Singapore profile”, https://www.bbc.com/ news/world-asia-15971013
parts of the world. In response to Singapore’s diverse and complex cultural and historical conditions, the government has introduced corresponding adjustment strategies to adapt to the changing social conditions. Thanks to its strict laws and regulations, it is safe for anyone, anytime, to walk the streets. Due to these efforts, there is political stability and social harmony. Singapore has become a brand name that means reliability, excellence and integrity. Formerly a colony that was poor, powerless, and neglected, it was labeled as Third World; however, it has now undoubtedly become a first-class prosperous country. At the same time, tourism became a major industry and contributor to Singapore’s economy, which, to some extent, has once again stimulated discussion on solving the problems of post-colonial society in Singapore.
02 RELEVANCE FROM THE POINT OF VIEW OF URBAN DESIGN THEORY AND PRAXIS
Today, Singapore is considered a prosperous and developed country, but when we look back at the beginning of its independence in the 1960s, there were many undeniable shortcomings: severe housing shortages, most of which were accompanied by poor sanitation and dirty waterways. The unemployment rate was high and strike movements against the British colonial forces were frequent. Criminal gangs controlled parts of the city, the police had very limited say, and corruption was widespread. The ethnic conflict was also isolated from Singapore by neighboring countries including Malaysia. The outgoing British colonial government and navy caused serious setbacks to the local economy. At the same time, there was a shortage of natural resources. But there were also many positive aspects: going out to sea, natural deep-water ports, the strategic location of major sea trade routes at crossroads, English traditions, experience of the rule of law, some infrastructure, and ancillary services trade with long-established companies. The country, however, made good use of the strengths it was dealt with, and

Theories and Methods of Urban Design Winter 2020 A-218
3.Han, Heejin. “Singapore, a Garden City: Authoritarian Environmentalism in a Developmental State.” The Journal of Environment & Development 26, no. 1 (March 2017): 3–24. doi:10.1177/1070496516677365.
4. Ho, Elaine Lynn-Ee, Wong Chih Yuan and Ramdas, Kamalini. Changing Landscapes of Singapore: Old Tensions, New Discoveries. New ed., Singapore: NUS Press Pte Ltd, 2013. muse.jhu.edu/book/27560.
5.Yeoh, Brenda S. A. “Contesting Space in Colonial Singapore : Power Relations and the Urban Built Environment.” Book. Singapore : Studies in Society & History. Singapore : Singapore University Press, 2003.
Figure 01 The shipping map of the Strait if Maalacca
1990
1980
Singapore appears to emerge from its worst recession on record after the economy expands at an annualised rate of 20.4% between April and June.
Government approves a controversial plan to legalise casino gambling, paving way for construction of two multi-billion-dollar casino resorts.
Singapore slips into recession for the first time in 13 years during Asian financial crisis
Singapore announced the Singapore Green Plan.
Prime Minister Lee Kuan Yew stands down after 31 years.
1959
The government launched the Garden City Action Committee for interagency coordination in executing the garden city vision.
Singapore became one of the founding members of Asean.
Singapore became an independent republic and joined the United Nations.
Singapore joined the Federation of Malaya, Sabah (North Borneo), and Sarawak in the Federation of Malaysia.
Lee Kuan Yew became prime minister and Singapore became a self-government territory.
Singapore becomes separate crown colony.
1826
Japan surrendered, British applied military administration again.
Singapore falls to Japan in WW II, and was renamed as Syonan.
Suez Canal opens, trade booms.
Singapore established under East India Co. rule and became British colony.
Singapore A-219
HISTORY,
1990 1965 1973 1967 2009 1869 1942 1945 1946
TIMELINE :
ACTORS AND EVENTS
1992 1998 2005 2020 2000 1910 1900 1920 1970
1960
1963 1950 1940 1930
leveraged its location and other positives to overcome the difficulties. The lack of natural resources has prompted Singapore to prioritize national education and technology, turning negative impacts into key competitive advantages. Victory in this country is achieved through a variety of successful ideas, enlightened and enduring strategies.

One of the main interests from the point of view of urban design is to better emulate the role of urban design in integration of urban growth and environmental stewardship. From the point of view of environmental production and initiatives, Singapore has a very top-down non-participation approach to policy making, some authors describe it as an authoritarian environmentalism. Today’s Singapore is an intentionally tree-lined and verdant city, a result of three decades of thoughtful policy, which will require political will and sustained effort to implement. The technical bureaucracy of development-oriented government agencies reduces land to resources. Throughout the economic rise of Singapore, the environment was divided into categories based on utilitarian values, and the environment with material value was prioritized. As early as the 1960s, the Singapore government incorporated environmental protection goals into its development plan. In 1973, the government established the Garden City Action Committee to coordinate inter-agency efforts to implement the garden city vision. Till now, the city-country enjoys the reputation of “Garden City”, where it is displaying a state-led transition to a green country. The garden city project is being carried out in conjunction with other environmental reforms in the country, both institutional and legal, the environmental initiatives here include tree planting, clean-up campaigns, environmental resource management and pollution control.. The successful experience of attracting high-tech and financial industries to settle down in Singapore through the construction of garden city and the improvement of urban ecological environment has become a model for cities in other countries .
Singapore’s landscape and ecological infrastructure have been impacted by globalization and transnationalism. The built environment is more than a habitat for cultures. In certain situations, an authoritarian country like Singapore,
These could be additional images

6.Lim, William Siew Wai,. “Public Space in Urban Asia.” Book. New Jersey : World Scientific, 2014.
7.Gannon, Martin and Rajnandini Pillai. “The Singapore Hawker Centers.” In Understanding Global Cultures: Metaphorical Journeys Through 29 Nations, Clusters of Nations, Continents, and Diversity, 4th ed., 457-466. Thousand Oaks, CA: SAGE Publications, Inc., 2010. doi: 10.4135/9781452224886.n27.
8.Yuen, Belinda. “Greening the City-State of Singapore.” Forestry Studies in China, n.d.
9.Rong, Dongmei. “Brief Analysis and Enlightenment of Urban Underground Space Development and Management in Singapore.” China Land and Resources Economy, October 21, 2019. http://kns.cnki.net/kcms/ detail/11.5172.F.20191018.1738.003.html.
Theories and Methods of Urban Design Winter 2020 A-220
Figure 02 A busy Victoria Dock, Tanjong Pagar, in the 1890s..
Figure 03 Chinese community in Singapore carrying the flag
to celebrate the victory
landscape helps dominant groups in society attain power through spatial design. For example, the developed projects in the Marina Bay area not only reflect Singapore’s rising status in the global economy, but also emerge its desire in tourist trade. To realize the nation’s aspirations, natural and historical landscapes are modified by urban development projects in Singapore.
Due to the wars in Asia and the demand for cheap labor during colonial rule, a large number of immigrants flowed into Singapore, the most representative of which was the colony. With the growth of a huge Chinese community, Singapore has become the only country outside China with a majority of Chinese population.

Singapore’s colonial history dates back to the 1820s, when the maritime fortress island nation was ruled by British and Japanese colonists. To some extent, colonization provided Singapore with a prerequisite for developing into an early trading and commercial center. As a country with a history of immigration and also occupation, Singapore poses an interesting question for urban designers which is how can different cultures be made to coexist. As it used to be a colony of Britain and Japan (for a short time), Singapore is famous for its multi-layered cityscape and diversity of races, which on the other hand, put pressure on dealing with the local and colonial culture. Different regions and occupations manifest themselves through shaping urban space, and this has rendered an interesting condition in Singapore, for urban design research. Redevelopment plans made by planners, in many cases, are contested by segments of the population. The conflict between old and new results in debates within social groups and arouses greater public consciousness towards place attachment and heritage identity.
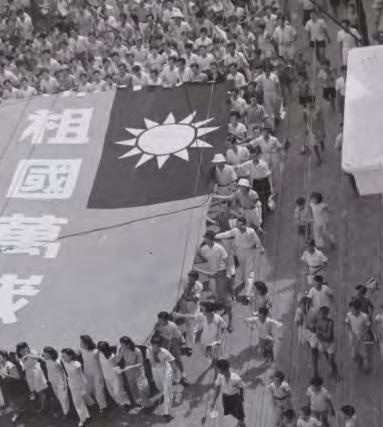
of interest that illustrate your text Singapore A-221
Figure 04 Japanese POWs cleared up the city during the British reoccupation in September 1945
METHODS TO CONDUCT YOUR INVESTIGATION
To conduct the investigation into Singapore’s urbanization, the significance of studying deeply into public policy is self-evident. Other methods include referring several examples to explain how advanced policies, theoretical methods, master plans and site designs shape the country and further, transform the society.
Mapping the changing infrastructure and public space in the past 30 years helps to understand the developments in both economic and public policy. In a rapidly developing urbanization world, the agendas to promote the replacement of old infrastructure can reflect how Singapore treats historical space and civic life under the guideline of the Garden City Project, and analyzes the impact of landscape on humanities and urban space. Through the exposition and comparison of different periods of pre-colonial, colonial and post-colonial cityscape in Singapore, extensive reading and consulting materials show the changes and urban practices of these periods, as well as Singapore’s citizens’ postcolonial life and attitudes to heritage.
To showcase the intense development during the last 30 years, consulted demographic data will help understand the percentage of immigrant population in urban growth, and infer the transfer of urban discourse power. Last but not the least, this paper is also interested in analyzing how different environmental and urban policies are enabling urban transformation on the fringe and the management of historical monuments on the island.
6.Lim, William Siew Wai,. “Public Space in Urban Asia.” Book. New Jersey : World Scientific, 2014.
7.Gannon, Martin and Rajnandini Pillai. “The Singapore Hawker Centers.” In Understanding Global Cultures: Metaphorical Journeys Through 29 Nations, Clusters of Nations, Continents, and Diversity, 4th ed., 457-466. Thousand Oaks, CA: SAGE Publications, Inc., 2010. doi: 10.4135/9781452224886.n27.
04 ANTICIPATED FINDINGS
As Singapore is a developed, modern, post-industrial city with great attention on making a green city, there can be several discussions about the “Garden City” fabric and ecological strategies in the urban space. Due to the shortage of land, a landscape-oriented development emerged to work as an approach to mediate the tension that both built environment and human life might bring about, and to fix unhealthy urban conditions. This approach also applies to other aspects of urban design, such as preserving and reusing historical heritage in high-density spaces through creating productive landscapes. There is no doubt that studying Singapore is a good way to understand the notion of landscape and ecological urbanism, where landscape spreads and controls the urban space.
Also, by learning different moments of green infrastructure construction, there could be an answer to the management of a public landscape, for there are plenty of discussions on the time and budget control in not only landscape practice but also in other realms. By understanding how landscape infrastructures identify the land and influence human activities under a national ecological policy of economic and urban growth, there could be more critical thoughts on the topdown landscape development strategies and the spatial implications they will bring about.
Of course, when exploring landscape or ecological urbanisms, an
8.Yuen, Belinda. “Greening the City-State of Singapore.” Forestry Studies in China, n.d.
9.Rong, Dongmei. “Brief Analysis and Enlightenment of Urban Underground Space Development and Management in Singapore.” China Land and Resources Economy, October 21, 2019. http://kns.cnki.net/kcms/ detail/11.5172.F.20191018.1738.003.html.
Theories and Methods of Urban Design Winter 2020 A-222
03
unavoidable question is to explore the role of mitigating global climate change. Singapore with top-notch ecological technologies, although this may not be the main purpose of the government, provides many examples for countries that are still struggling to explore how to deal with the disasters caused by climate warming. Not only is it a guide at the technical level, Singapore has also successfully explored a model of profiting from the landscape—tourist attractions, spatial connection, and productive landscape while building an ecological landscape.
On the other hand, overpopulation and immigrants bring trouble with jobs and racial integration world-widely. Food culture, which can directly represent the diversity of nations and behaviors in Singapore, from my point of view, is one of the important mirrors to reflect the integrative development in the social restructure period. Discussing the commitment made by the government under the guideline to empower the informality in cityscape, like the establish of hawker centers in Singapore, is a way to challenge and develop the exist arrangement of existing urban conditions and human activities in a multi-racial society, also we could have a proposal that the ignominy stuff in modern cities is possible to be transferred as supporting sectors when it is recognized.
Singapore A-223
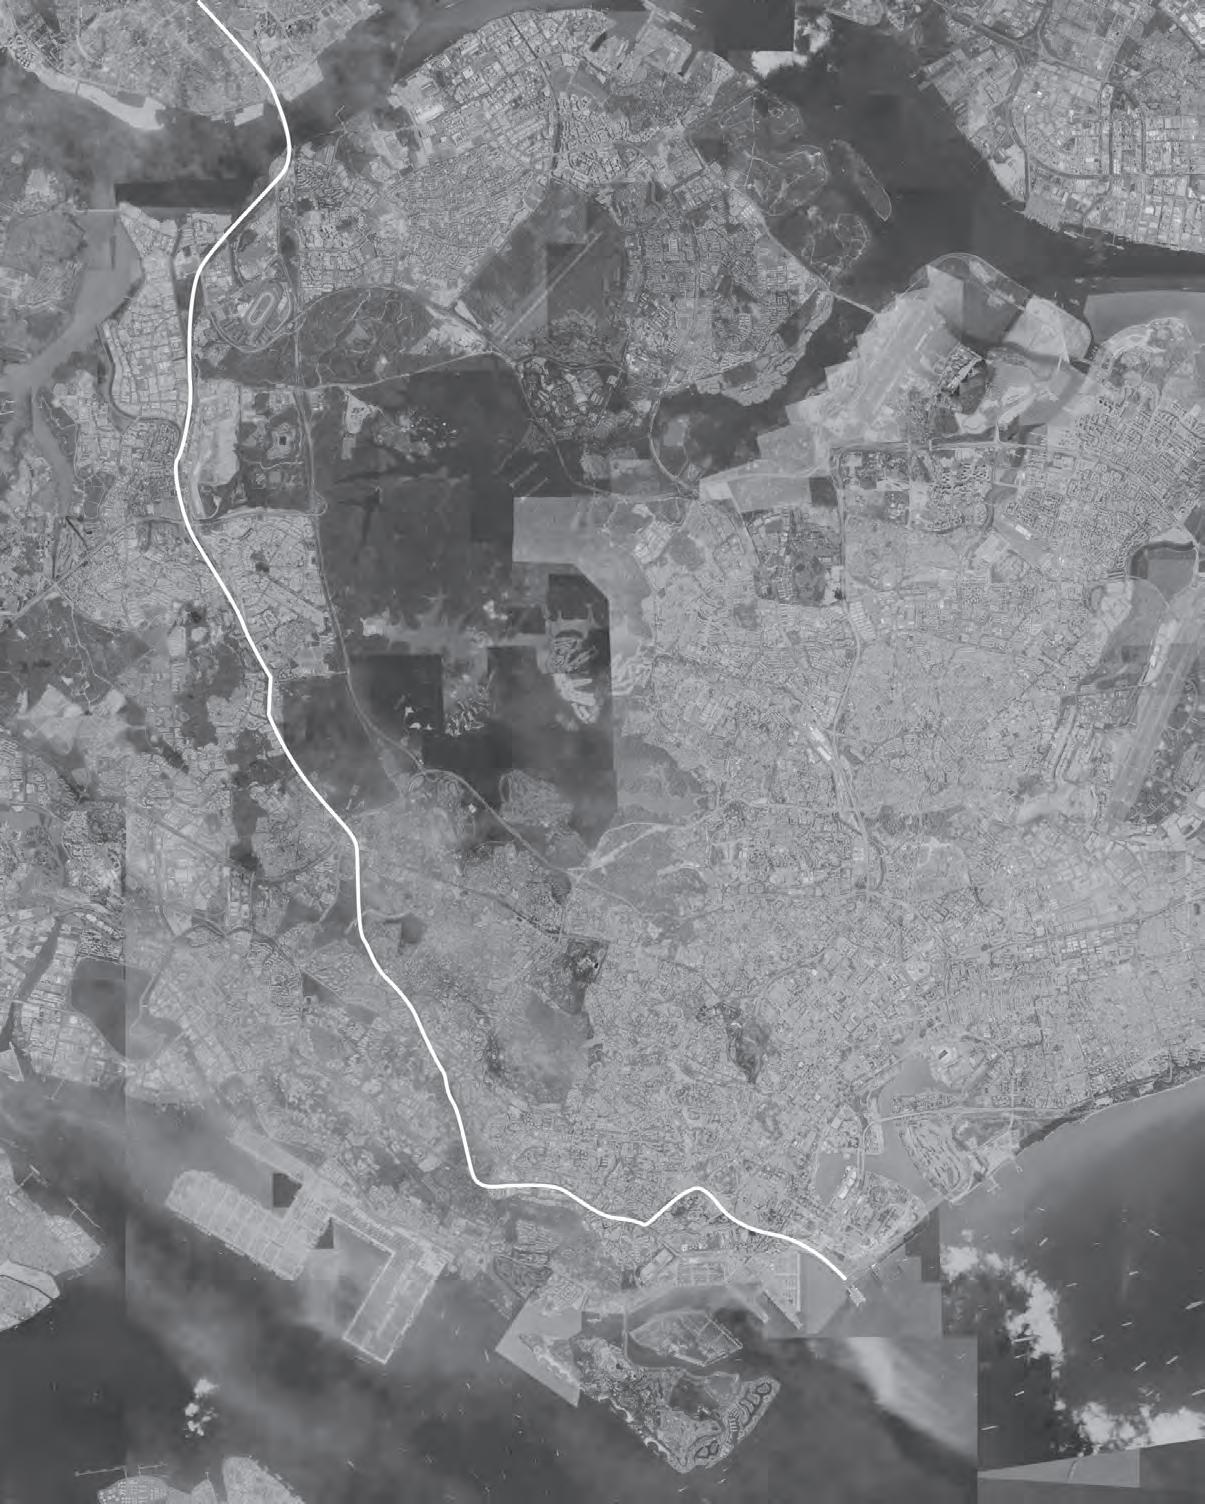
A-224 0 1
Figure 05 Aerial view of the greenway
Theories and Methods of Urban Design Winter 2020
mile
10. “The Rail Corridor: Lines of Life: Urban Design / Master Plan: Projects.” NIKKEN SEKKEI LTD. Accessed February 17, 2020. https://www.nikken.co.jp/en/projects/ landscape/the_rail_corridor_lines_of_life. html?region=Overseas.
RAIL CORRIDOR [LANDSCAPE URBANISM]
“Stitching the Nation with Lines of Life”
The railway that ran north to south across Singapore was initially used for commuting and transporting goods between Singapore and the rest of the Malay Peninsula at the beginning of the 20th century. The closure of this 24km railway released a linear, continuous land, spanning the entire nation. Singapore Urban Redevelopment Authority (URA) held a competition to collect ideas transforming the 100ha site into a public space to benefit both its people and environment. The winner’s masterplan proposed a vivid vision for the railway corridor as a peoplecentric greenway. As the slogan “Lines of life” goes, they aimed at weaving this linear landscape infrastructure into the lives of those around it.
Location Year(s) Status
Additional Agents
Key Project Components Program(s)
Funding Streams
[Singapore]
[2019]
[Built]
[Length: 24km, Site Area: approx. 100ha]
[NIKKEN SEKKEI Ltd]
[Singapore National Parks, Urban Redevelopment Authority]
[Rail corridor,Heritage&Culture, Biodiversity&Greenways, Recreational and Community Space]
[Parks within The Natural Park Network ]
[Public]

Singapore A-225
Footprint Designer
Figure 06 Cartography of the greenway
THE PROJECT AND THE URBANISM
Landscape urbanism is an approach to understanding urban space, and its components, which aims to make good places through a creative integration of natural, human, and cultural process layers.
The construction of greenway is a paragon of progressive implementations that ensured an effective working balance between ongoing landfill closure and processes of site management. The trail enhancement project was designed as a series of flexible and incremental stages that will be completed in three parts by 2021. North, central, and south, three parts of works include improvements to accessibility, sensitive refurbishment of industrial heritage and restoration of the native forest to contribute to the biodiversity and greenery in urban space.
According to the plan, the railway site will not work as a simple axis running across the country, but rather as a space of laterally connected green space for each neighboring community along the railway. On the other hand, the inner spirit of related diverse community’s natural habitats and historical legacies could be instilled back into the greenway. This creative public space would serve as a link to the surrounding communities.
The display of this greenway project is a vision for the nurturing of an abundant heritage together with the country’s urbanization, also the developers and residents. Not only providing people with a corridor to walk along but also empowering them as concerned parties owning the space. Furthermore, the infrastructure will respond and react to the daily lives and sentiments of individuals and will be accessible to everyone.
11. Niemelä, Jari. “Urban Ecology Patterns, Processes, and Applications.” Book. Oxford ; New York : Oxford University Press, 2011.
12.McGrath, Brian. “Urban Design Ecologies.” Book. Chichester, West Sussex : Wiley, 2013.
13.“The Rail Corridor: Lines of Life: Urban Design / Master Plan: Projects.” NIKKEN SEKKEI LTD. Accessed April 30, 2020. https://www.nikken.co.jp/en/projects/ landscape/the_rail_corridor_lines_of_life. html?region=Overseas.
14.Ho, Elaine Lynn-Ee, Wong Chih Yuan and Ramdas, Kamalini. Changing Landscapes of Singapore: Old Tensions, New Discoveries. New ed., Singapore: NUS Press Pte Ltd, 2013. muse.jhu.edu/book/27560.

Theories and Methods of Urban Design Winter 2020 A-226
Figure 07 Winning concept plan

08
0 1 mile
Figure
Figure ground plan of the greenway
Singapore A-227

Theories and Methods of Urban Design Winter 2020 A-228
Figure 09 Taxonomy
Figure 10 Actors

Singapore A-229
Figure 10 Section

Theories and Methods of
Winter
A-230
Urban Design
2020
Figure 11 Collage of the elements along the greenways

Singapore A-231

0 0.1mile
Figure 12 Aerial view
Theories and Methods of Urban Design Winter 2020 A-232
15. “Discover Bukit Brown.” Bukit Brown Wayfinder | Singapore Heritage Society. Accessed February 17, 2020. https://www. singaporeheritage.org/bukitbrownwayfinder/.

16. Yeoh, Brenda S.A. Contesting Space in Colonial Singapore: Power Relations and the Urban Built Environment. Reprint ed., Singapore: NUS Press Pte Ltd, 2013. muse.jhu. edu/book/23179.
BUKIT BROWN [POST-COLONIAL URBANISM]
Bukit Brown cemetery is located in the central area of Singapore, bordering Lornie Road and parts of the Pan Island Expressway. Originally owned by private clans for burials, it was established as a public burial ground for the Chinese in 1922. With millions of Chinese immigrants passing or settling in Singapore, Bukit Brown Cemetery became an important feature of migrant and colonial cultural history.
The government announced the Lornie Road in 2011 and decided to demolish the cemetery for renovating housing which sparked a public protest. Although they eventually failed to divert the highway, they at least forced the government to agree on keeping detailed records. In addition to filial piety to the survivors, they also made the cemetery a “living museum.”
Location Year(s) Status
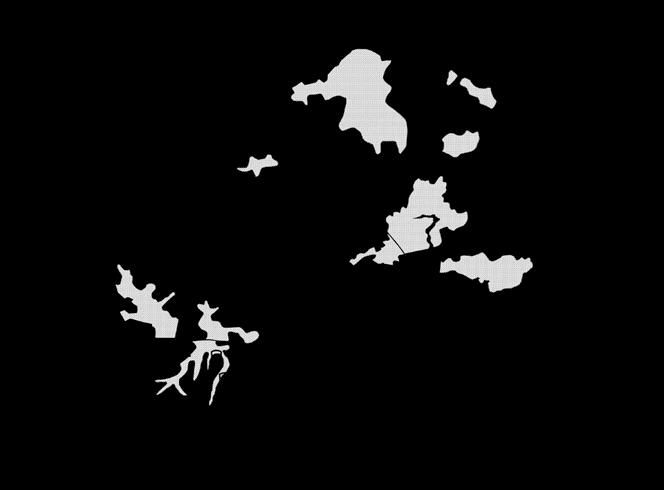
Footprint Designer
Additional Agents
Key Project Components Program(s)

Funding Streams
[Singapore]
[1922 - 1973]
[ Partly Demolished]
[0.86km²]
[None]
[Municipal Council(before 1965)]
[Tombs]
[Cemetery]
[Public and Private]
0 1 mile
Singapore A-233
Figure 13 Cartography of Chinese burial grounds
THE PROJECT AND THE URBANISM

Discussion on post-colonial development often responds to the hybridization of the social, cultural, and formal qualities between the former occupying powers and native cultural traditions, in addition, it also challenges the strategies towards the colonial cultural heritages under the rubric of urbanization.
Cemeteries like Bukit Brown are projections of inner connections within migrants, that was one of the results of the dark colonial history, however, final resting places are not so final in this crowded city-state, due to the scarcity of land in Singapore. Traditional burial cemeteries are considered a waste of resources. As the thoughts that the urbanization in Singapore and the demand of land for public housing are becoming more and more urgent, the former tombs and cemeteries are gradually being cleaned up to provide space for reconstruction.
The protest from Chinese communities is the concretization of the conflicts between migrant civic culture and national development goals. Singapore addressed this issue by applying a digital documentary on tombs which allowed relatives to save their memory and history. Besides, the authorities developed the noted cemeteries as a tour place to enjoy nature and urban legacy, which invited the site to become part of civic recreation space in an institutional manner.
Bukit Brown Cemetery was partly appropriated by the colonial authority, replacing its ethnic exclusivity with municipal inclusivity in a post-colonial configuration. Through the process of transformation in land use and the existing form of cemeteries, the site could be identified as a place with struggles over the definition of “national interests”, that happened between the civic and the state.
17. Lim, William Siew Wai,. “Public Space in Urban Asia.” Book. New Jersey : World Scientific, 2014.
18.Ugc. “Bukit Brown Cemetery.” Atlas Obscura. Atlas Obscura, October 30, 2017. https://www.atlasobscura.com/places/bukitbrown-cemetery.
19.“Bukit Brown Cemetery.” Remember Singapore, November 27, 2019. https:// remembersingapore.org/bukit-browncemetery/.
Theories and Methods of Urban Design Winter 2020 A-234
Figure 14 Tech map of Bukit Brown

0 0.1 mile
Figure 15 Figure ground plan of Bukit Brown
Singapore A-235
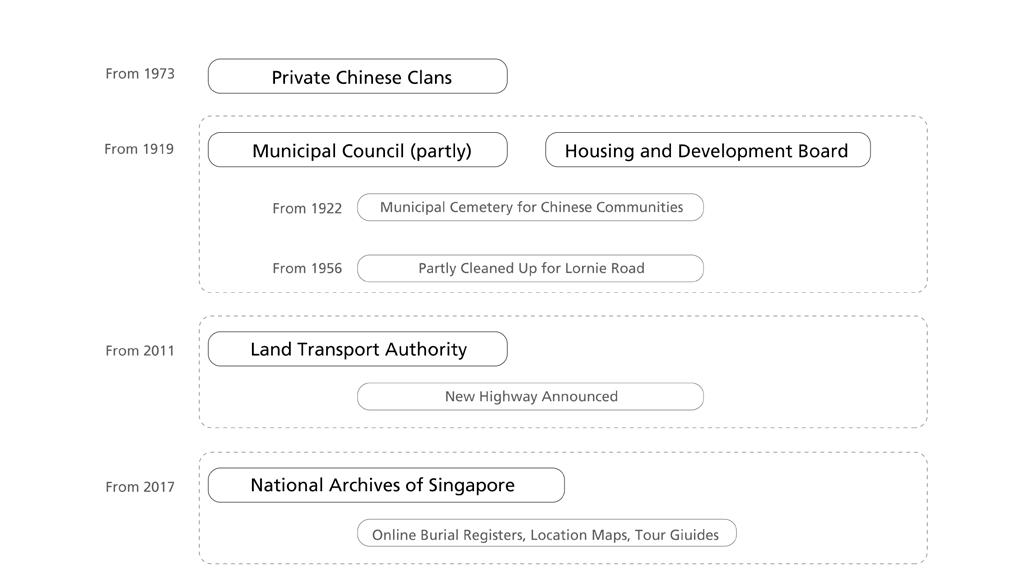
Theories and Methods of Urban Design Winter 2020 A-236
Figure 16 Taxonomy
Figure 17 Actors
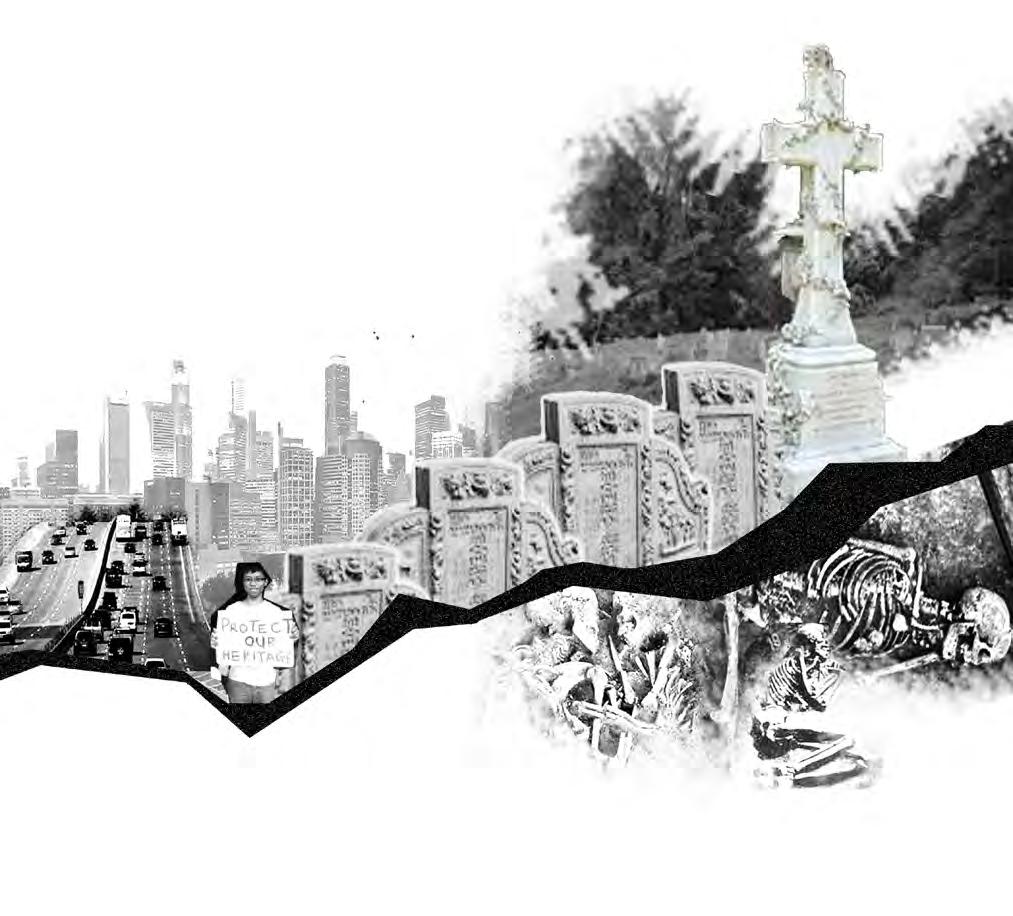 Singapore A-237
Figure 18 Section
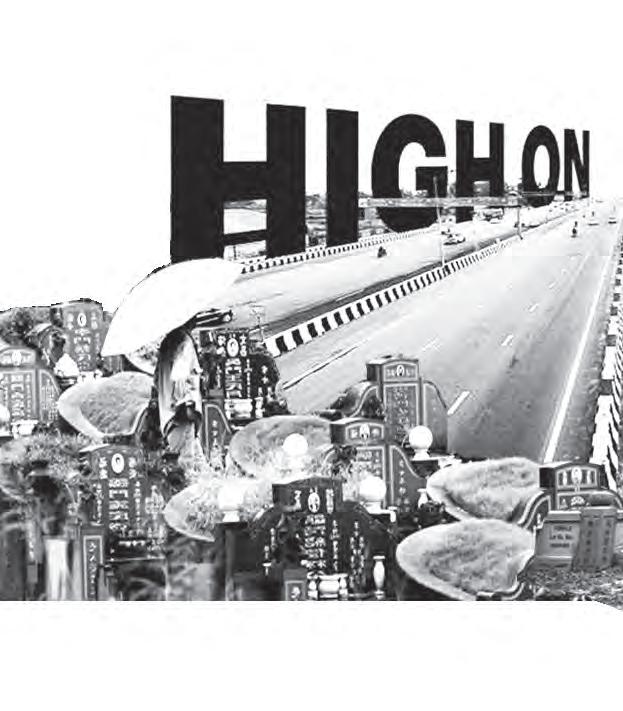
Theories
A-238
and Methods of Urban Design Winter 2020
Figure 19 Collage of the elements in Bukit Brown

Singapore A-239

0 0.5mile
Figure 20 Aerial view
Theories and Methods of Urban Design Winter 2020 A-240
20. Finance Daily. “Unique Singapore Hawker Centre.” Sina Finance, July 13, 2019. https:// finance.sina.com.cn/roll/2019-07-14/docihytcerm3482367.shtml.
21. “Hawker Food Centres in Singapore.” Visit Singapore Official Site. Accessed January 23, 2020. https://www.visitsingapore.com/ editorials/the-street-food-of-singapore/.

HAWKER CENTER [SOCIAL URBANISM]
Street vendors or hawkers of cooked foods were once found everywhere in Singapore carrying goods on their persons or using carts or stalls with mobility. Street food is handy and affordable, but it brought problems of sanitation management such as poor sanitary conditions, dirty urban appearance, the disorderly spread of stalls, sloped roads, and covered sidewalks. Although street vending had already been a part of Singapore ’s civic culture, hawkers had no recognized legal status in the city, which was almost a blind spot and a hidden danger for city management. Since independence, with the development of urbanization in Singapore, demand for eating out among Singaporeans is getting higher ,which requires taking the management of hawkers into consideration.
Location Year(s)
Status
Designer
Additional Agents
Key Project Components Program(s)
Funding Streams
[Singapore]
[1990s]
[Built ]
[ National Environment Agency]
[ National Environment Agency (NEA), Housing and Development Board (HDB) and JTC Corporation]
[An open-air complex in Singapore housing many stalls that sell a variety of inexpensive food]
[Plan of the development of hawker centers]
[Singapore government]
0 1 mile
Singapore A-241
Figure 21 Cartography
THE PROJECT AND THE URBANISM
Informal settlements like stalls and hawkers are challenging the public policy in the metropolis and, more, raising discussions on city rights. To address these spontaneous components in Singapore, the solution is to recognize hawkers’ rights to the city and elevating the spirit of belonging.
The Singapore Hawker Center is a tiered open catering operation and consumption place built by the government since 1960s. The purpose is to provide services to residents and jobs for hawkers while solving the increasing population and hawkers in the city. After the Hawker Center was completed, the government reissued a formal business license to the hawkers and successively moved them to the stall rented by the center to ban illegal hawkers on the street. Absolutely, while the hawker center in Singapore continues to improve its software and hardware, its dietary varieties are gradually becoming more international due to the booming tourism.
The gathering and institutional actions on street venders here in Singapore proposed an appropriate social strategy that has reinvented the concept of hawkers and responded to the possible urbanization crisis. The government has collaborated with private actors to make another historic transformation of iconic street vendors. The key element of this new emergence is the concept of new street entrepreneurs or hawkers, which not only empowered the informality in the city but also envisioned these hawkers into the masterplan of a future Singapore.
22. Ohtsuka, Kazuya, Hikaru Kinoshita, and Hiroyuki Marumo. “A Study On The Historical Change Of Hawker Centres In Singapore.” Journal of Architecture and Planning (Transactions of AIJ) 73, no. 627 (2008): 1029–36. https://doi.org/10.3130/aija.73.1029.
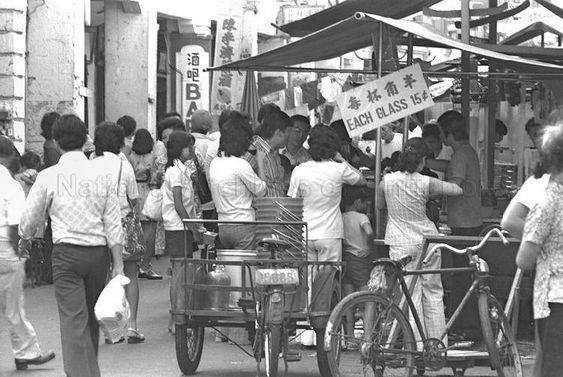
23.Henderson, Joan C, Yun, Ong Si, Poon, Priscilla, and Biwei, Xu. “Hawker Centres as Tourist Attractions: The Case of Singapore.” International Journal of Hospitality Management 31, no. 3 (9/2012): 849–55. doi:10.1016/j.ijhm.2011.10.002.
24.TARULEVICZ, NICOLE. “HAWKERPRENEURS: HAWKERS, ENTREPRENEURSHIP, AND REINVENTING STREET FOOD IN SINGAPORE.” Revista de Administração de Empresas 58, no. 3 (6/2018): 291–302. doi:10.1590/s0034-759020180309.
24.Yeoh, Brenda S.A. Contesting Space in Colonial Singapore: Power Relations and the Urban Built Environment. Reprint ed., Singapore: NUS Press Pte Ltd, 2013. muse.jhu. edu/book/23179.
Theories and Methods of Urban Design Winter 2020 A-242
Figure 22 Hawkers selling cooked food

0 0.1 mile
Figure 23 Figure ground plan of the hawker center in China Town
Singapore A-243

Theories and Methods of Urban Design Winter 2020 A-244
Figure 24 Taxonomy
Figure 25 Actors
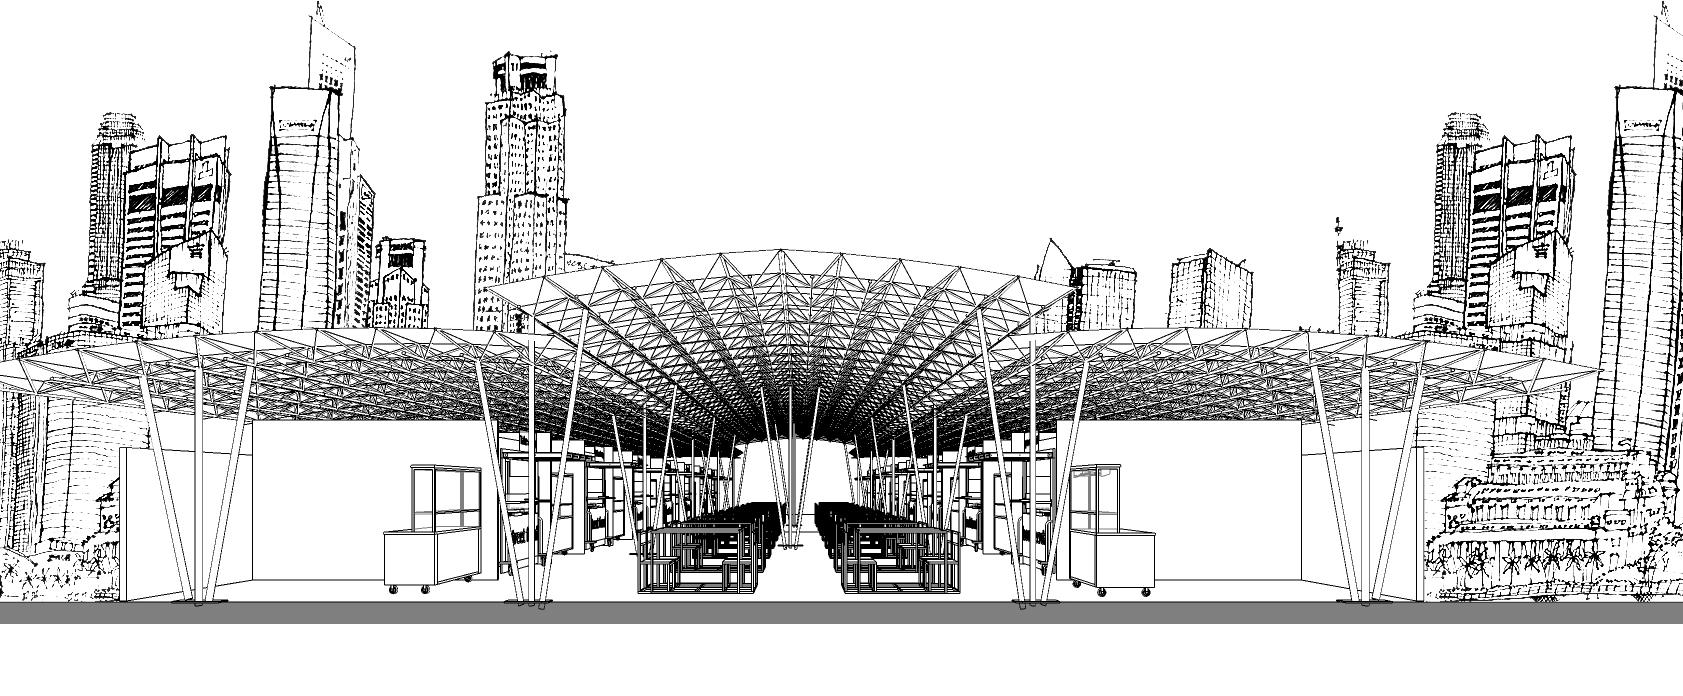
Singapore A-245
Figure 26 Section

Theories
A-246
and Methods of Urban Design Winter 2020
Figure 28 Collage of the hawker centers in Singapore

Singapore A-247
INDONESIAN ARCHIPELAGO
REPUBLIC OF INDONESIA PAPUA NEW GUINEA EAST TIMOR
01 IDENTIFICATION OF THE TERRITORY AND LOCATION
The Indonesian Archipelago is located in Southeast Asia, between the Indian Ocean and Pacific Ocean and north of Australia. The equator penetrates this region giving it high temperature and a humid climate all year round.
Three major islands — the Sunda Islands, the Maluku Islands, and New Guinea — make up this archipelago which consists of over 17,500 islands and has a coastline of 81,000 kilometers1. These islands start from the Soloman Sea sprawling westward all the way, for almost 4,200 miles, to the Bay of Bengal embracing the Java Sea and Banda Sea at the center of the archipelago. The islands have different shapes, sizes, and topographies and share distinctive ethnicities, languages, cultures, nationalities, population densities, and development levels.
The shaping of the Indonesian Archipelago derives from plate tectonics and is highly unstable. These primitive yet powerful forces generated numerous volcanoes scattered across the islands that release energy periodically and produce natural disasters, such as earthquakes, tropical cyclones, and tsunamis, impacting this tropical and oceanic habitat.2
The Republic of Indonesia covers the majority of the land while the Javanese people are the largest and politically dominant ethnic group in this territory. Java Island has the largest population of the Indonesian Archipelago and Jakarta, the second largest urban area on the planet with a population over 30 million.3 Around 20% of the Indonesian Archipelago’s population lives in the Jakarta metropolitan area. This creates a scenario of a high concentration of population living on the sprawling islands.4
1. Faculty of Geography UGM and The Indonesian Geographers Association. “Urbanization and Regional Imbalances in Indonesia” Indonesian Journal of Geography Vol. 49, No. 2, Dec. 2017.
2. BBC News, “Indonesia: Volcano nation,” BBC News, Nov. 5, 2015
3. City Population. “Indonesia.” Accessed Jan. 21, 2020. https://www.citypopulation.de/ Indonesia.html
4. Guilmoto, Christophe Z. Contemporary Demographic Transformations in China, India and Indonesia. Cham: Springer, 2016.
Theories and Methods of Urban Design Winter 2020 A-248
[Critical DATA]
Geographical Delimitation
The Sunda Islands, the Maluku Islands, and New Guinea
Area
Land: 2,279,340 km²
Water Coverage: 7.43% [of Earth]
Population
277.46 million [as of 2018]
Social Indicators
The Indonesian Archipelago has more than 300 native ethnic groups with over 700 regional languages. Islam is the prevailing religion in which more than 85% of the population believes.5 The territory possesses a relatively young population with a median age of 30 years.
Economic Indicators
The territory is the largest economy in Southeast Asia. The Republic of Indonesia is one of G20 as well as a newly industrialized country.6 The largest industry of Indonesia is the services, while Papua New Guinea and East Timor agriculture. The three countries also have a relatively high GDP growth between 5% to 10%.7
Environmental Indicators
This archipelago contains 2 of the 25 global biodiversity hotspots8 and 10% of the world’s flowering species (29,000 flowering plants) as well as one of the centers for agricultural biodiversity — plant cultivars and domesticated livestock.9 It also possesses 12% of mammal species, placing it second in the world, after Brazil.10
5. “Peringatan / Warning.” Peringatan. Accessed March 7, 2020. https://sp2010.bps.go.id/index. php/site/tabel?tid=321&wid=0.
6. G20 2020 Saudi Arabia. Accessed March 7, 2020. https://g20.org/en/Pages/home.aspx.
7. “GDP Growth (Annual %) - Indonesia.” The World Bank Data. Accessed March 25, 2020. https://data.worldbank.org/indicator/ NY.GDP.MKTP.KD.ZG?locations=ID&year_ high_desc=true.
8. “Indonesia - Main Details.” Convention on Biological Diversity. Secretariat of the Convention on Biological Diversity. Accessed March 20, 2020. https://www.cbd.int/ countries/profile/?country=id.
9. “Flowering Plants of Indonesia.” iNaturalist. Accessed March 25, 2020. https://www. inaturalist.org/projects/flowering-plants-ofindonesia?tab=about.
10. “The Rich Biodiversity in Indonesia.” Biodiversity Conservation in Indonesia. Accessed March 7, 2020. https://blogs.ntu.edu. sg/hp331-2014-03/?page_id=27.
Indonesian Archipelago A-249
INDONESIA PAPUA NEW GUINEA EAST TIMOR
Indonesian Archipelago REPUBLIC OF
11. Jose C. Borrero. “Field Survey northern Sumatra and Banda Aceh, Indonesia and after the Tsunami and Earthquake of 26 December 2004.” Accessed Jan. 21, 2020. https://www.eeri.org/ lfe/clearinghouse/sumatra_tsunami/reports/ EERI_report_indonesia_jcb_2-11-05.pdf
12. “The World Factbook: Indonesia.” Central Intelligence Agency. Central Intelligence Agency, February 1, 2018. https://www.cia. gov/library/publications/the-world-factbook/ geos/id.html.
13. “Indonesia Foreign Direct Investment [1981 - 2020] [Data & Charts].” CEIC, December 1, 2019. https://www.ceicdata.com/en/indicator/ indonesia/foreign-direct-investment double-the-government-s-official-rate/.
14. “IS THE WORLD URBAN?” GSD Urban Theory Lab. Accessed March 22, 2020. http:// www.urbantheorylab.net/videos/is-the-worldurban/.
15. Rochmyaningsih, Dyna. “Jakarta Clips ‘Great Garuda’ Wings.” Eco-business, May 17, 2016. https://www.eco-business.com/news/ jakarta-clips-great-garuda-wings/.
16. Song, Lily K. “Planning with Urban Informality: A Case for Inclusion, CoProduction and Reiteration.” International Development Planning Review 38, no. 4 (1/10/2016): 359–81. doi:10.3828/idpr.2016.21.
02 RELEVANCE FROM THE POINT OF VIEW OF URBAN DESIGN THEORY AND PRAXIS
The archipelago’s peculiar environment — harsh natural threats, growing economic entity, high population concentration, and the diverse and lively lifestyle — had nurtured one of the most unique urban conditions on the planet.11 This investigation interrogates such conditions via three urban design provocations.
Exposed to natural disasters, the territory originally possessed an efficient and inherent system protecting life and alleviating pollution.12 But, with a growing number of new developments, the system is crumbling at an alarming speed. Those new developments driven by foreign capital display the structure of exploitation and capitalism on a global scale.13 Such situations had endangered the urban areas in the Indonesian Archipelago, particularly in those areas with high population density. However, to respond to the damage, several even more problematic urban responses are generated across the Indonesian Archipelago.
03 METHODS TO CONDUCT YOUR INVESTIGATION
We use different lenses of urban design to approach the three projects. The three projects are “Mangrove and Palm Plantation,” “The Great Garuda and Land Reclamation,” and “Street Vendors and Formalization.”
Through the lens of Planetary Urbanism, I trace the continuity of ecological functions of the mangrove forests across national boundaries.14 The Great Garuda is a classical example of Visionary Urbanism that it seeks to redirect future reality. Via this lens, we see the ambition of the Indonesian government trying to rechannel its precarious capital which entails the subsequent ecological and environmental concerns of mega-urban design projects.15 I use the Informal Urbanism to examine the street vendors scattered in the urban fabric of the Indonesian Archipelago. The lens lets us question and revisit the use of the informality in urban design and planning.16

Theories and Methods of Urban Design Winter 2020 A-250
Figure 01. Greater Natuna Island, Indonesian Archipelago (stratman²/Flickr/CC BY-NC-ND 2.0)
TIMELINE : HISTORY, ACTORS AND EVENTS
Joko Widodo announced a plan to relocate the capital from Jakarta to Kalimantan on the island of Borneo and the government will spend $40 billion on saving Jakarta from sinking in the next decade: The Great Garuda.
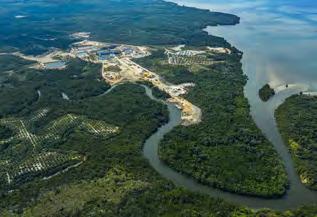
Sulawesi earthquake struck the Indonesia with estimated magnitude 7.5 resulting in, combined effects of the earthquake and tsunami, 4,340 deaths.
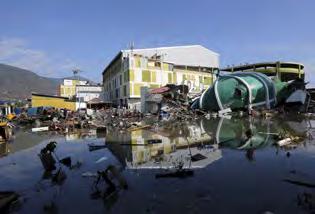
This year, the territory produced over 34.5 million tons of palm oil, and exported nearly 73% of it.
It is recorded that Jakarta has around 56,000 street vendors and the spaces for them reached just 18,000. The rest occupies the city’s pedestrian’s sidewalks13
Joko Widodo became the first president elected from outside the military and political elite.
Indonesia had surpassed the rate of deforestation in Brazil and become the fastest forest clearing nation in the world15

Following strong economic performance and rapid urbanization, the former capital Jakarta ranked, with more than 30 million, the world’s second most populous urban area after Tokyo. Indonesia took only 20 years to increase the urban population by 44%14

1960
The 2006 Yogyakarta earthquake occurred on 27 May causing 5,700 dead, tens of thousands injured, and financial losses of $3.1 billion.
The first direct presidential election was held. Though political and economical instability along with terrorism remained in early 2000s, the nation performed strongly in recent decade. It was also the year that Indian Ocean earthquake and subsequent tsunami killed 130,000 people.
Asian financial crisis hit the nation hard that it brought out a series of riots due to the corruption and political suppression, ending Suharto’s ruling.
Suharto was appointed as the new president supported by the United States after an anti-communist purge killing 500,000 to 1,000,000. His “New Order” administration allowed foreign investments to enter the Indonesian Archipelago resulting in the following three-decade significant economic growth.
The political status was changed from democracy to authoritarianism by Sukarno via a balance of the military and Communist Party of Indonesia (PKI).
After the Japanese invasion in WWII, the Dutch rule ended. Soon after the surrender of Japan, the Indonesian independence was proclaimed.
Indonesian Archipelago A-251
2010 2005 2000 1990 1980 1970 1960 1950 2015
1968 1945
1997 2004
2006 2014 2016 2015 2019 2018 2020 2010 2012
Figure 02. Jakarta (Josh Haner/The New York Times)
Figure 04. Mangrove in Indonesia (Ardiles Rante/Vox)
Figure 05. Deforestation (Ardiles Rante/Vox)
Figure 03. Sulawesi earthquake and tsunami (Tatan Syuflana/Associated Press)
Each project is accompanied sequentially by human interventions: palm plantation, land reclamation, and formalization. These interventions allow us to explore the extended contexts or the mechanisms of these projects. They also reveal the hidden relationships among globalization, commercial networks, exploitation, developments, and urban design.
Every project consists of a series of photographs, drawings, and diagrams. Projects are divided into two parts: the project itself and the related intervention. In the first part, I use cartography and aerial view to locate and measure each project. Figure ground plan illustrates the potential tree loss, proposed plan of the Great Garuda, and the space that street vendors occupied. The diagram of process shows how mangrove forest is cut, how the great sea wall is built, and how street vendors appear and disappear. The relation chart of actors uncovers who supports the project and how the funds link to the potential damage or consumer. Transect identifies the spatial relation within each project and synthetic collage displays the essence of the project.
In the second part, drawings are deployed differently depending on projects. For palm plantation, I use the cartography of mapping to display the connection of mangrove decrease and tree loss from developments. Cartography and taxonomy are used to construct the global oil network and the private oil developer. For land reclamation, the cartography demonstrates the mechanisms of the Great Garuda and taxonomy other similar projects. For formalization, taxonomy shows the variety and vitality of street vendors while the cartography indicates the removal of such qualities.
05 ANTICIPATED FINDINGS
Mangrove has a reputation for protecting the coastline and mitigating carbon dioxide emissions. Also, the Indonesian Archipelago is renowned for its high biodiversity and expansive coverage of mangroves. But the need for oil has produced numerous palm plantations, which cause serious deforestation.17 Mangroves are cut or burned to produce palm oil to fulfill the need of people

17. Warr, Peter, and Yusuf, Arief Anshory. “Reducing
based
Article. Australian Journal of Agricultural and Resource Economics 55, no. 3 (7/2011): 297–321. doi:10.1111/j.1467-8489.2011.00540.x.
Theories and Methods of Urban Design Winter 2020 A-252
Figure 06. The typical untouched coastline in the Indonesian Archipelago (Ashvin Mehta/Dinodia Photo Library)
Indonesia’s Deforestation
Greenhouse Gas Emissions.”
18. Harball, Elizabeth. “Deforestation in Indonesia Is Double the Government’s Official Rate.” Scientific American. Scientific American, June 30, 2014. https://www.scientificamerican. com/article/deforestation-in-indonesia-isdouble-the-government-s-official-rate/.
19. Sherwell, Philip. “$40bn To Save Jakarta: the Story of the Great Garuda.” The Guardian. Guardian News and Media, November 22, 2016. https://www.theguardian.com/ cities/2016/nov/22/jakarta-great-garudaseawall-sinking.

20. Elyda, Corry. “Jakarta Urged to Develop ‘Blueprint’ for Street Food Vendors.” The Jakarta Post. Accessed March 22, 2020. https:// www.thejakartapost.com/news/2015/11/27/ jakarta-urged-develop-blueprint-street-foodvendors.html.
21. Donohue, Terry. “The People Behind the Goods.” Indonesia Expat, January 28, 2018. https://indonesiaexpat.biz/lifestyle/streetvendors/.
living in city miles and miles away. The project seeks to reflect the structure of global production and consumption and the impacts of the urban area while its hinterland is developed.18 On the other hand, not just as an area being protected, mangroves should be a device that urban designers can use to respond to the ever-changing environment.
The Great Garuda is the most iconic land reclamation project in the Indonesian Archipelago. Land reclamation is a conventional means that displays how the government deals with flooding in the urban area.19 Through examining this project, we can uncover the assets and liabilities of land reclamation and provoke critical thinking about what kind of attitude an urban design project should acquire.
Moving the spotlight from the coastline to the inland urban area reveals a lively street scene. Street vendors are the ubiquitous urban phenomena that provide daily commercial activities and engender a public place for social connection among citizens.20 They also become famous for the tourists that this is a unique way to experience the Indonesian Archipelago.21 The nimbleness of street vendors allows them to appear and disappear very quickly which they can react to a sudden disaster such as flooding. This attribute challenges the traditional concept of urban design and zoning that are usually fixed and long-lasting.
The first and second projects track the inter-related responses of human behavior and environmental change. The two trajectories are essential resources considering coastline developments on the globe. They also speak the tension between resource extraction and existing environments, raising a call for the protection of nature. The third project highlights the daily life of residents in such environments. How the flexibilities and softness of the informalities support the rigors of the rigid? All three projects together construct the current condition of the Indonesian Archipelago, from a planetary scale to the human one.
Indonesian Archipelago A-253
Figure 07. The abandoned area in Jakarta due to flooding (Josh Haner/New York Times)


Theories and
of
A-254
Methods
Urban Design Winter 2020
2018 Sulawesi Earthquake
2004 Indian Ocean Earthquake
2006 Yogyakarta Earthquake
Jakarta
Relocation of Capital
Ninety East-Sumatra Orogeny
Philippines
Figure 08. (above) Natural disasters in the Indonesian Archipelago Figure 09. (below) Mapping of the Indonesian Archipelago’s current condition


Indonesian
Archipelago A-255
Orogeny


Theories and Methods of Urban Design Winter 2020 A-256 Plate Tectonics Daily Need: Water Economic Need: Oil Daily Need: Food Earthquake Underground Water Extraction Palm Plantation Nature Human INDONESIAN ARCHIPELAGO
Figure 10. Volcano eruption
Figure 11. Urban area after earthquake
Figure 12. The pumping equipment
Figure 13. The refinery of palm oil
Tsunami
Cause
Prevent from Worsen
Land Subsidence
Flooding

React
Project 2
The Great Garuda

Include
Land Reclamation


Tactically React
Deforestation
React Accelerate
Decrease of Mangrove

Project 1
Street Vendors

Relocation of Capital
Project 3

Indonesian
A-257
Archipelago
Figure 14. City after tsunami
Figure 15. Joko Widodo announcing the relocation
Figure 16. The flooding in Jakarta
Figure 17. Street vendors in urban area
Figure 18. Aerial view of the Great Garuda
Figure 19. A construction site of land reclamation
Figure 20. Deforestation in the archipelago

Theories and Methods of Urban Design Winter 2020 A-258 0 0.5 mile Cartography
22. Sidik, Frida, Supriyanto, Bambang, Krisnawati, Haruni, and Muttaqin, Muhammad Z. “Mangrove Conservation for Climate Change Mitigation in Indonesia.” ReviewArticle. Wiley Interdisciplinary Reviews: Climate Change 9, no. 5 (9/2018): e529-n/a. doi:10.1002/wcc.529.
23. Lustgarten, Abrahm, and Ashley Gilbertson. “Fuel to the Fire.” ProPublica, November 20, 2018. https://features.propublica.org/palm-oil/ palm-oil-biofuels-ethanol-indonesia-peatland/.
MANGROVES & PALM PLANTATION [ANTHROPOCENE URBANISM]
Mangrove is a common shrub or small tree growing in the tropical coastal region. It substantially contributes to the protection of the coastline and the reduction of global carbon dioxide emission.22
In the recent decade, several environmental laws were laid down by the Western nations, primarily led by the United States.23 These laws intended to reduce the reliance on fossil oil and promote the vegetable oil thereby curbing global warming. The intension led to an unexpected result of the rapid emergence of palm plantation, particularly in the Indonesia Archipelago where the weather suits for palms. Oil-processing factories and plantations of palm spread quickly causing serious deforestation in this archipelago. These plantations are swallowing the lands where mangroves originally grow.
Location
Year(s)
Status
Footprint

Designer
Additional Agents
Key Project Components Program(s)
Funding Streams
[Coastline, THE INDONESIAN ARCHIPELAGO]
[Ongoing]
[In Progress]
[81,000 km (coastline)]
[Nature and human interventions]
[Oil company; Government]
[Mangroves, palms, oil refineries]
[Wilderness, industrial]
[Private oil companies]
Indonesian Archipelago A-259
Figure 22. (left) The aerial view of the deforestation and mangrove forest
Figure 21. The distribution of mangrove forest
THE PALM PLANTATION AND ANTHROPOCENE URBANISM

Before impacted by the industry of oil extraction, the territory had abundant mangroves that prevent the land from being hit by natural disasters and contribute to improving global warming. These plants are also the homes for numerous indigenous species.24 However, the habitats of mangroves and palms are pretty similar that palm plantations have endangered mangroves, the guards of the coastline of the Indonesian Archipelago.
Deforestation signals the territory is part of the global exploitation of capitalism. It uncloaks the fact that the territory is the hinterland of the oil production chain.25 The national border becomes irrelevant since the importance of the global network has surpassed the traditional boundary. Such exploitation is created by the collaboration of the public and private sectors. The collaboration was also involved by both local administration and foreign investment.
In 2007 in West Kalimantan, an official map of areas prohibited for deforestation and development (black area) was released by the Indonesian government. The following year, two palm companies with a license to develop this area (magenta lines) asked the government for a revision. 5 years later, the map was revised that the protected area had been changed (white nets) so that it would not interfere with the oil companies’ plans. The boundary of the protected area is almost the same as the oil companies’ property line.
In the renowned project, Melun Senart, Rem Koolhaas asked, at the beginning of the competition, “where not to build” rather than “where to build.”26 At the age of the whole planet being urbanized, can we ask, on earth, “where not to develop?” Just like the forest in Melun Senart, maybe mangroves can be excluded from the map. The untouchable quality would make the mangroves’ habitat a device of urban design that keeps the safety of the coastline of the Indonesian Archipelago.
24. Rianta, Pratiwi, Ernawati, Widyastuti, Chen, Guangcheng, and Chen, Shunyang. “Diversity and Abundance of Mangrove Fiddle Crabs, Genus Uca (Decapoda, Ocypodidae) at a Mangrove in Kema, North Sulawesi, Indonesia.” Acta Oceanologica Sinica 37, no. 12 (12/2018): 92–96. doi:10.1007/s13131-018-1336-8.
25. Vos, de, Rosanne, Köhne, Michiel, and Roth, Dik. “‘We’ll Turn Your Water into Coca-Cola’ : The Atomizing Practices of Oil Palm Plantation Development in Indonesia.” Article. Journal of Agrarian Change 18, no. 2 (2018): 385–405. doi:10.1111/joac.12246.
26. Böck, Ingrid, and Koolhaas, Rem. “Six Canonical Projects by Rem Koolhaas.” Berlin: Jovis Berlin, 2015.
Theories and Methods of Urban Design Winter 2020 A-260
Figure 23. Deforestation: burning the forest
Figure 24. (right) How the developments influence the policy in West Kalimantan
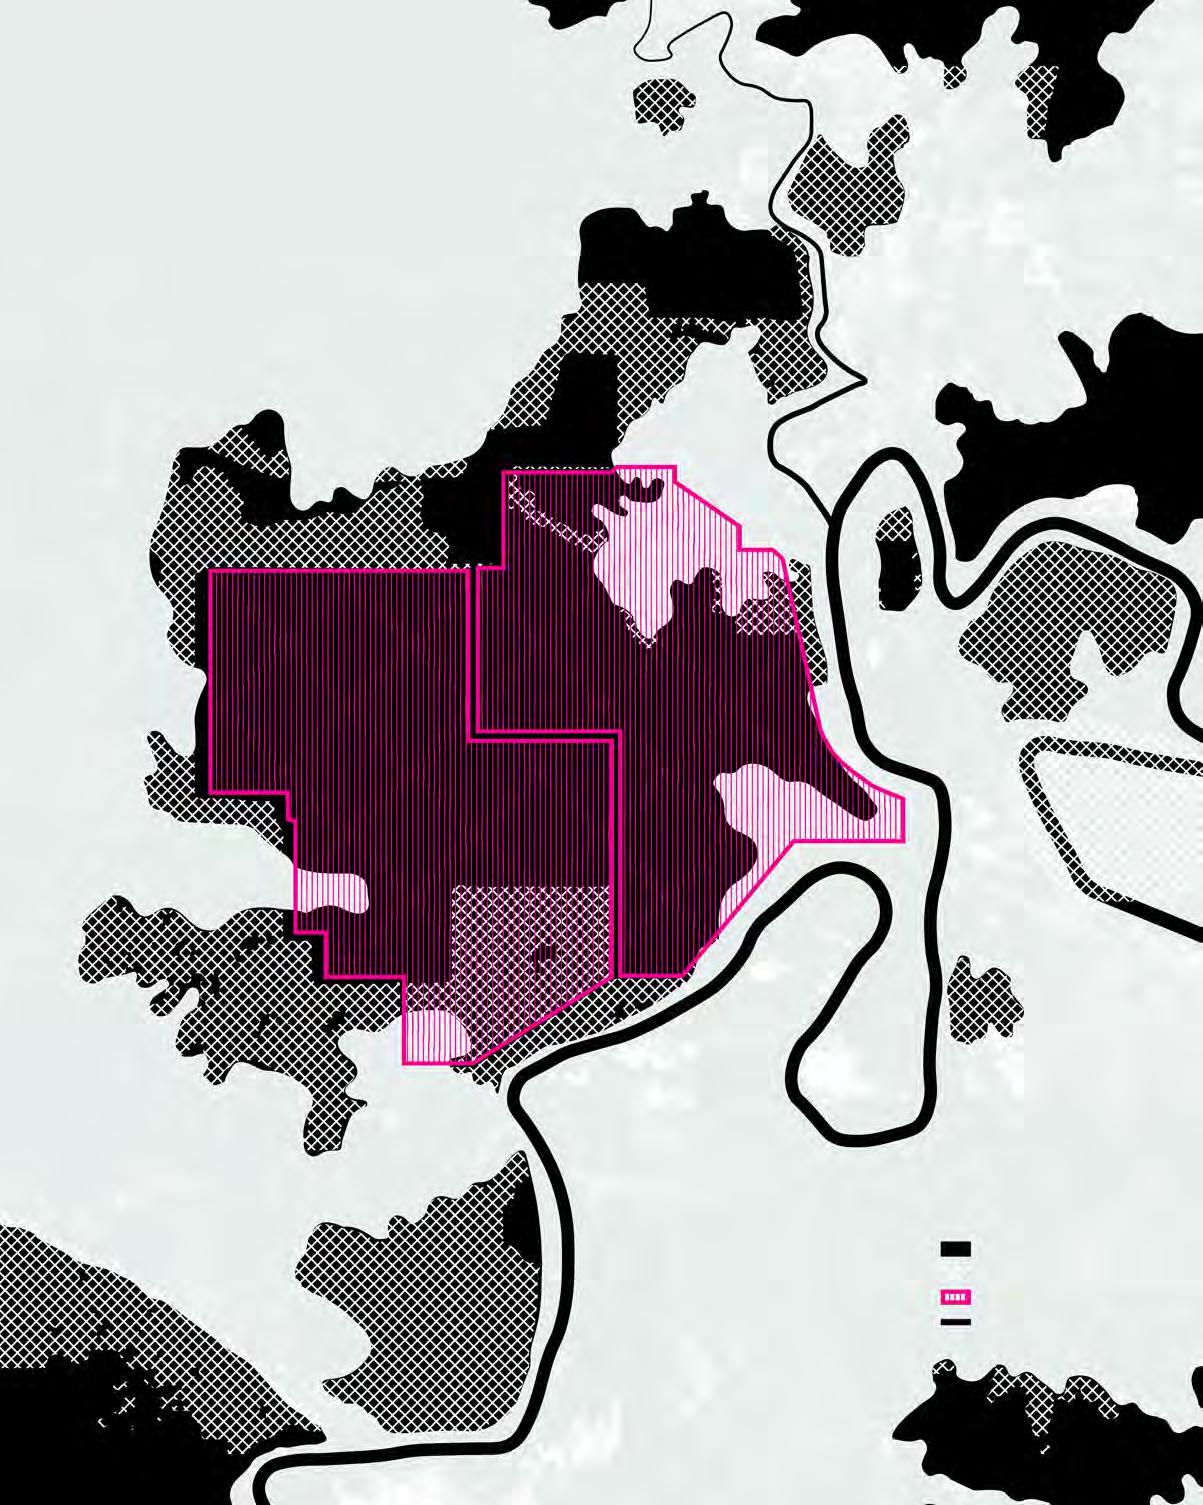
Indonesian Archipelago A-261 0 1 mile
Original protected area Revised protected area Planned development River
Figure Ground Plan


Theories
Process
and Methods of Urban Design Winter 2020 A-262
1/ Mangroves
2/ Remove
3/ Palms
Figure 26. Mangroves (Bachellier Christian/Flickr)
Figure 28. Palm plantation (Basten Gokkon)
Figure 27. Trees being removed (THINKSTOCK)
Figure 25. The process of turning mangrove forest to palm plantation
Actors
Global Warming Policy of Adopting Biofuel
Transect

Development of Palm Plantation Deforestation
Decrease of Mangroves
&

Indonesian
Archipelago A-263
Palm Plantation
Oil Factory Deforestation Expanding Mangroves Ocean
Private Developer Private Developer Private Developer Local Government
Figure 29. Process of developments and their consequences
Figure 30. The ever expanding palm plantation endangering the mangrove forest on the coastline
Synthetic Collage
 Theories and Methods of Urban Design Winter 2020 A-264
Figure 31. From the coastline to the inland
 Indonesian Archipelago A-265
Tree Loss in the Last 20 Years Mangroves

and Methods of Urban Design Winter 2020 A-266
Theories
Cartography
Figure 32. Mapping of the tree loss in the last 20 years and areas of mangrove forest
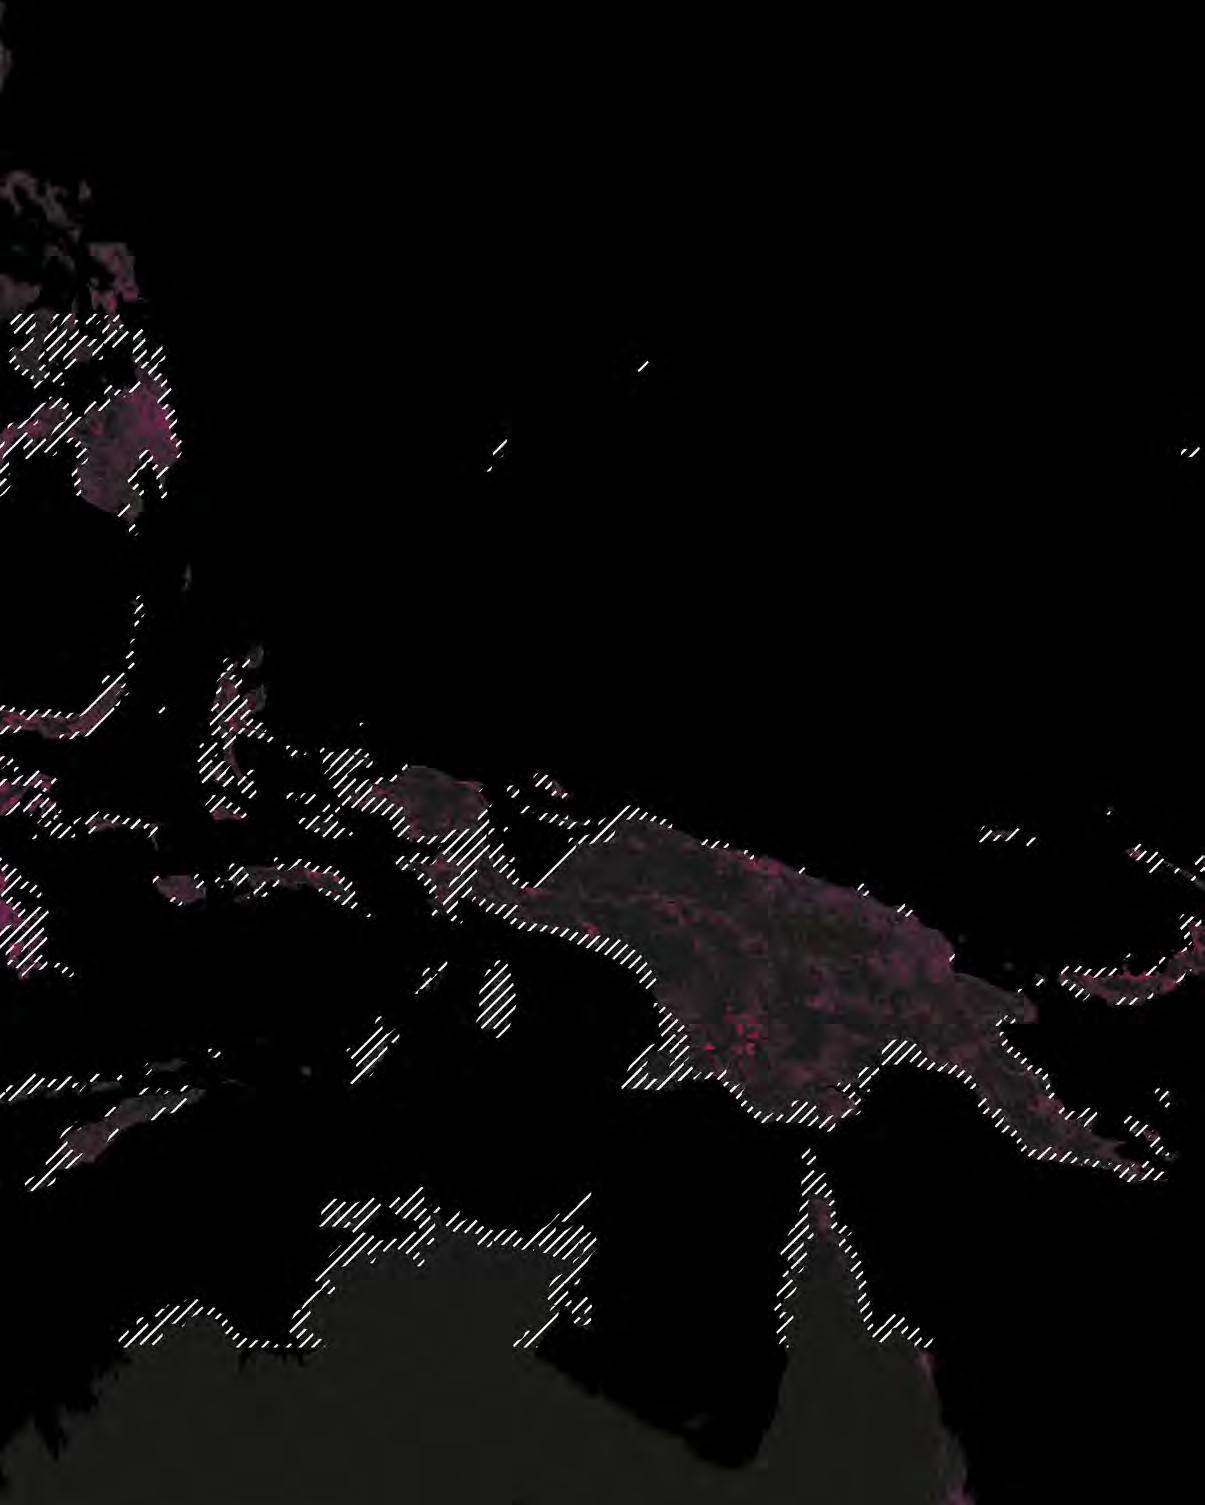 Indonesian Archipelago A-267
Taxonomy: Oil Companies


Theories and Methods of Urban Design Winter 2020 A-268 Cartography
Western Nations
The Indonesian Archipelago
Figure 33. In the mid-2000s, Western nations, led by the United States, began drafting environmental laws that encouraged the use of vegetable oil in fuels — an ambitious move to reduce carbon dioxide and curb global warming.
Figure 36. The actors behind the palm plantation and the global network
Figure 34. In Indonesia, owned and regional banks more than $8 billion worth development projects billion gallons of biofuel announced that Indonesia 13 million acres of additional palm production.
Indonesia, officials directed statebanks to make loans on worth of palm-oil-related and pledged to produce 5.9 biofuel within five years. They also Indonesia would convert more than additional forest to industrialized

 Indonesian Archipelago A-269
Archipelago
The Globe
Figure 35. As of 2011, there were 7.8 million hectares of palm oil plantations, with 6.1 million hectares of these being productive plantations under harvest, thus making Indonesia the global leader in crude palm oil (CPO) production.
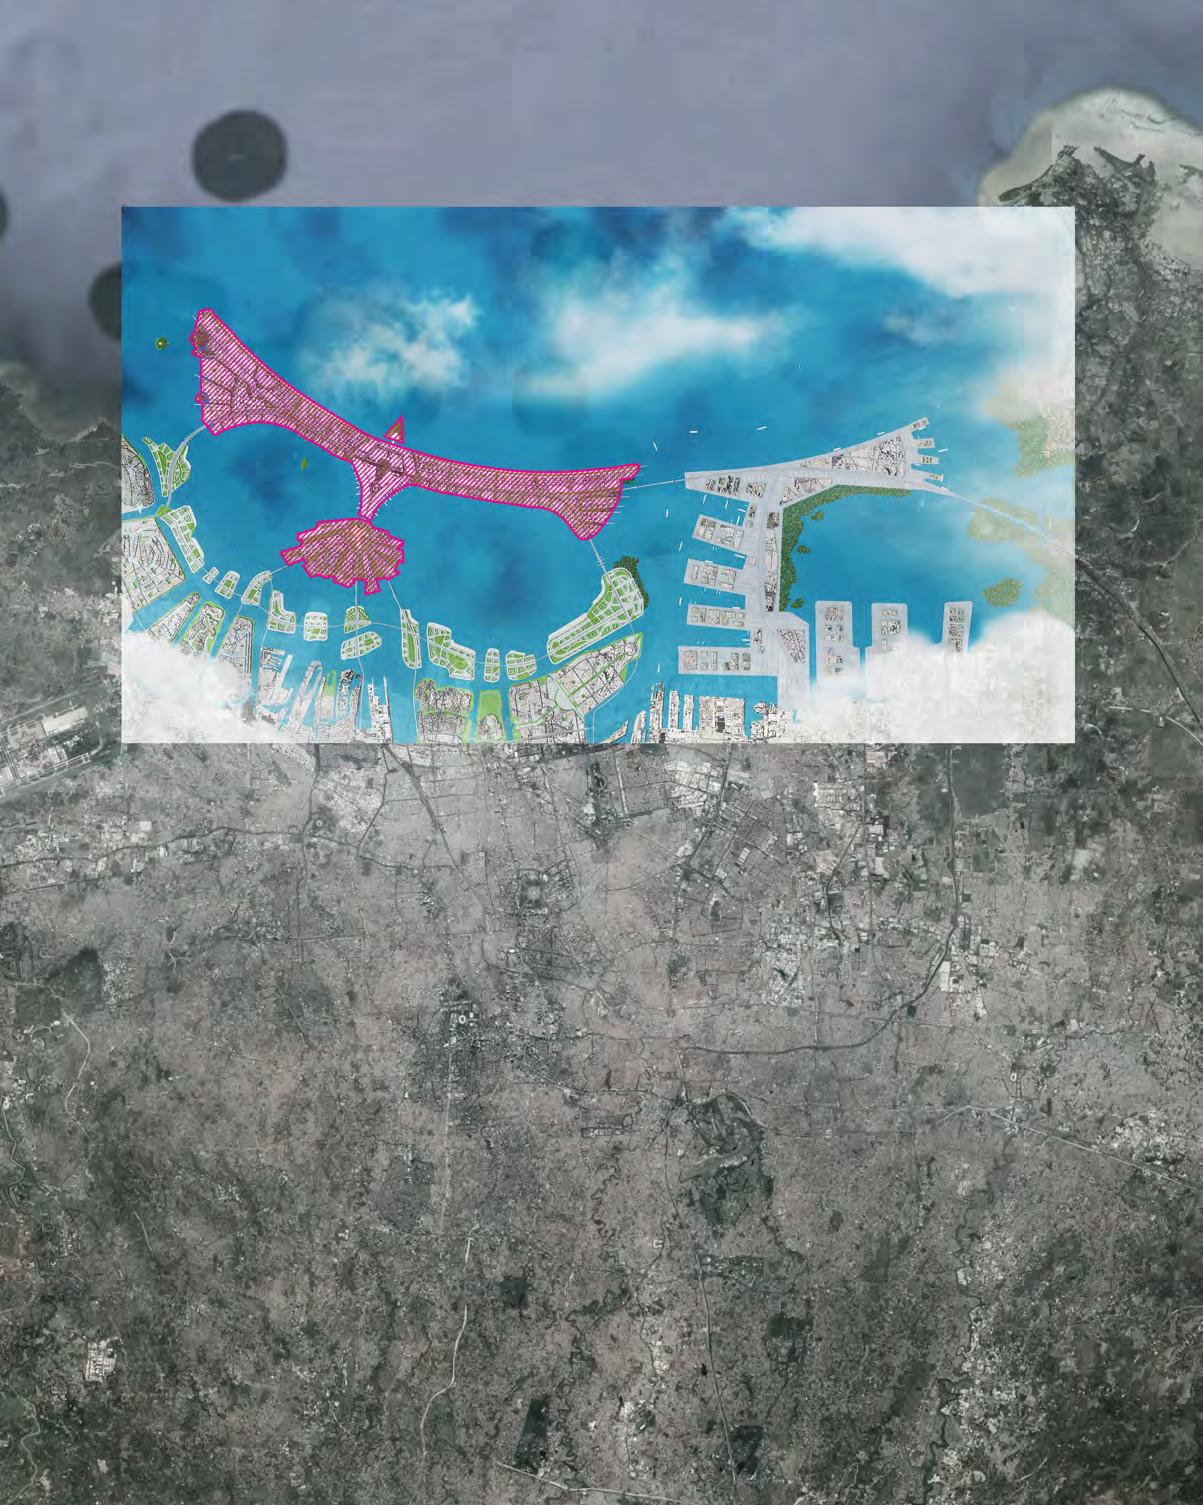
Theories and Methods of Urban Design Winter 2020 A-270 0 10 mile Cartography
27. “The Incredible Sinking City; Jakarta Submerged.” The Economist 434, no. 9176 (11/1/2020): 32.
28. Onodera, Shin-ichi, Saito, Mitsuyo, Sawano, Misa, Hosono, Takahiro, Taniguchi, Makoto, Shimada, Jun, Umezawa, Yu, Lubis, Rachmat Fajar, Buapeng, Somkid, and Delinom, Robert. “Erratum to ‘Effects of Intensive Urbanization on the Intrusion of Shallow Groundwater into Deep Groundwater: Examples from Bangkok and Jakarta.’” Science of the Total Environment 407, no. 9 (2009): 3209–17. doi:10.1016/j. scitotenv.2009.01.049.
29. Lin, Mayuri Mei, and Rafki Hidayat. “Jakarta, the Fastest-Sinking City in the World.” BBC News. BBC, August 13, 2018. https:// www.bbc.com/news/world-asia-44636934.
THE GREAT GARUDA & LAND RECLAMATION [VISIONARY URBANISM]
Garuda is the legendary bird or bird-like creature in Hindu, Buddhist, and Jain mythology and he is considered as a protector with power. This project, Great Garuda, takes this mythical representation to display its mighty ability to protect the people of Jakarta and save the city from falling into water — physically.27
The rapid urbanization had caused people flooding into Jakarta in the 21th century. The infrastructure could not afford such a surge in population, that people are forced to, without permission, obtain water from beneath their feet.28 Excessive illegal extraction of underground water results in Jakarta to become the fastest sinking city of the world.29 The situation gets worse when the tsunami or flood comes, the water can not recede because now Jakarta is just like the puddle on the road.
Location Year(s)
Status
Footprint Designer
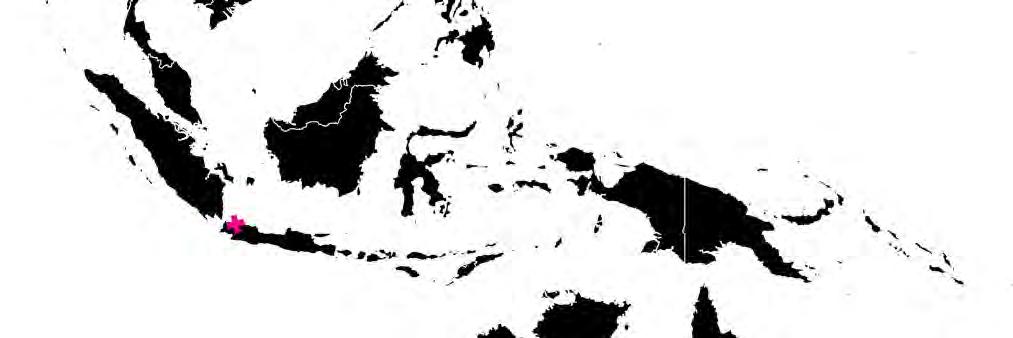
Additional Agents
Key Project Components Program(s)
Funding Streams
[Jakarta, REPUBLIC OF INDONESIA]
[2025]
[Canceled]
[About 4000 hectares]
[Kuiper Compagnons]
[Indonesia government; Witteveen+Bosa and Grontmij (Dutch consortium)]
[The great sea wall, 17 artificial islands]
[Airport, harbor, toll road, residential area, industrial area, waste treatment, water reservoir, green area, and dikes]
[Public and private]
Indonesian Archipelago A-271
The Great Garuda Other land reclamation projects
Figure 38. (left) The aerial view of the Great Garuda and Jakarta
Figure 37. The location of the Great Garuda and other land reclamation projects
THE LAND RECLAMATION AND VISIONARY URBANISM
The government of Indonesia needs to take action to save its sinking capital. Other than the relocation of the capital, in 2008, Indonesia started National Capital Integrated Coastal Development (NCICD) master plan, also known as The Great Garuda, with the collaboration between Indonesia, a consortium of Dutch companies, and an architecture firm from Rotterdam.30
The Great Garuda was proposed to respond to such urgency. It is an ambitious mega urban design project to build a giant sea wall, with a shape like the holy bird Garuda, to reject all tsunamis caused by earthquakes in the future and to regulate the water coming from the rivers in Jakarta. The great sea wall and 17 man-made islands form a lagoon on the coastline of Jakarta, with new developments including residential, commercial, and offices on them which just perfectly relieve the stress of the drastic population growth. Its renderings make itself, just like other projects of visionary urbanism, gorgeous, mighty, and convincing.31
The nature of The Great Garuda is land reclamation. Across the Indonesian Archipelago, the land reclamation has been chosen as a common means to react to natural disasters or the sinking ground. However, other than costly and laborious, land reclamation has another unignorable feature that it is impactive to the environment. It changes the ecosystem of the coastline forever and it is unlikely to return to the initial stage. That is exactly the very nature of land reclamation and other visionary projects — non-reversible.
Facing such ambition, I argue the definition of “visionary” with two approaches. Firstly, the projects taking the manner of visionary urbanism usually do not solve the problem from the beginning, but build the solution on the problem causing other potential and non-reversible problem. Here, land reclamation can destroy the whole ecosystem. Secondly, is visionary always embodied by big or omnipotent? Can it be just a minute change yet leading enormous overturn? Instead of the designs of heroism, maybe this is the new visionary.
30. Lyons, Kate. “Why Is Indonesia Moving Its Capital City? Everything You Need to Know.” The Guardian. Guardian News and Media, August 27, 2019. https://www.theguardian. com/world/2019/aug/27/why-is-indonesiamoving-its-capital-city-everything-you-need-toknow.
31. Wade, Matt. “Hyper-planning Jakarta: The Great Garuda and Planning the Global Spectacle.” Article. Singapore Journal of Tropical Geography 40, no. 1 (1/2019): 158–72. doi:10.1111/sjtg.12262.

Theories and Methods of Urban Design Winter 2020 A-272
Figure 39. The flooding in urban areas
Figure 40. (right) The proposed plan of the Great Garuda and developments on it

Indonesian Archipelago A-273 0 1 mile
Figure Ground Plan
1/ Land subsidence

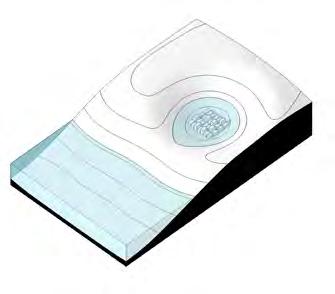


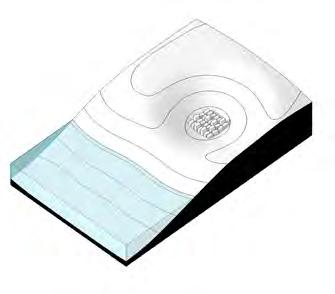
4/ Inner sea wall
2/ Flooding caused by tsunami
5/ Flooding caused by river
3/ Water being trapped inland
6/ Outer sea wall
Theories and Methods of Urban Design Winter 2020 A-274 Process
Figure 41. The process from land subsidence and flooding to the construction of the sea wall
Actors


Transect
 Indonesian Archipelago A-275
The Great Garuda
Jakarta Artificial Lagoon
Land Reclamation (Sea Wall) Ocean
Government
National Capital Integrated Coastal Development (NCICD)
Dutch Consortium Witteveen+Bosa and Grontmij
The Great Garuda
Architecture Firm Kuiper Compagnons
Figure 42. The actors and symbol behind the Great Garuda
Figure 43. Section of the Great Garuda: the artificial lagoon for regulating rivers in Jakarta and the sea wall for protecting Jakarta
Synthetic Collage

Theories
and Methods of Urban Design Winter 2020 A-276
Figure 44. The Great Garuda embodies the idea that the only way to rescue the abandoned area is through the construction of the great sea wall.
 Indonesian Archipelago A-277

Theories
A-278
and Methods of Urban Design Winter 2020
Cartography
Figure 46. The mechanisms and ambition of the Great Garuda include 17 artificial islands, 2 sea walls, and several embankments.


Land Reclamation
Indonesian Archipelago A-279
Figure 45. The coastal development project includes the construction of a seawall along the coast, building a water reservoir, and the reclamation of land.
The Great Garuda Land Reclamation Phase 1
Land Reclamation Phase 2 Artificial Lagoon River Outer Sea Wall Inner Sea Wall Embankment
Extended Port

Theories and Methods of Urban Design Winter 2020 A-280
Lhokseumawe Serang Kuala Tanjung Gresik Bengkong Benoa Bay Tanjung Carat Amahami Bima
Taxonomy
Figure 47. Other projects of land reclamation across the archipelago

Indonesian Archipelago A-281
Bitung Banggai
Manado Teluk Palu
Toli Toli Manakarra
Sepinggan Bulukumba
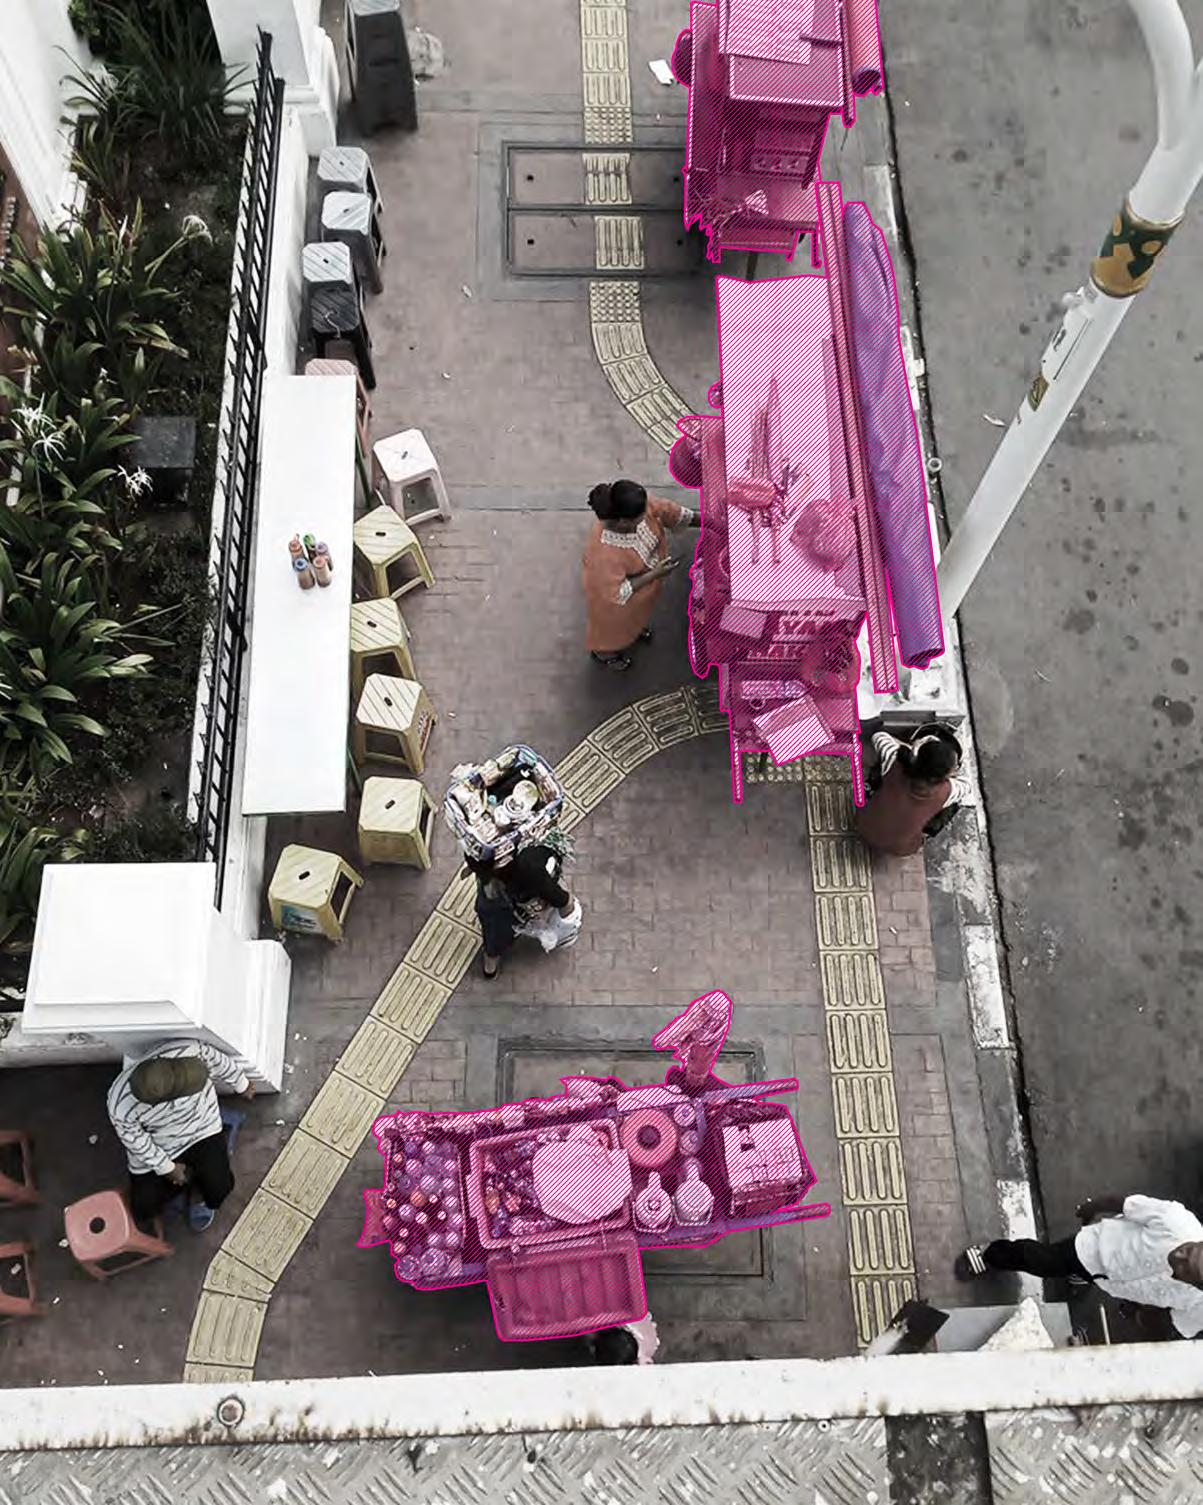
Theories and Methods of Urban Design Winter 2020 A-282 0 1 mile Cartography
2019).
156 (April 2009). https://www.adb.org/sites/default/files/ publication/28247/economics-wp156.pdf.
STREET VENDOR & FORMALIZATION [INFORMAL URBANISM]
The street vendors are the ubiquitous streetscape in the Indonesian Archipelago and the essence of the lifestyle in the urban fabric. They provide food at an affordable price to citizens and gains reputation among tourists visiting here.
There are two kinds of street vendors: mobile as food carts and stationed as food booths. These devices transform the pedestrian sidewalk into a social place that citizens or tourist can gather, chat, and enjoy the various traditional food.32 Street vendors also play a significant role in the labor market that, in 2008, 68% of the workers were employed in this informal sector, however, vendors do not exist in the urban code.33 Given that the representation is iconic and economic value is huge, formalizing street vendors become one of the critical topics in the field of urban design in the Indonesian Archipelago.
Location Year(s)
Status
Footprint Designer
Additional Agents
Key Project Components Program(s)
Funding Streams
[Urban area, THE INDONEISAN ARCHIPELAGO]
[Continuous state]

[Ephemeral]
[Pedestrian sidewalk in urban area]
[Vendor owners]
[Citizen]
[Vendors]
[Provision of food]
[Private]
Indonesian Archipelago A-283
32. Malasan, Prananda Luffiansyah. “The Untold Flavour of Street Food: Social Infrastructure as a Means of Everyday Politics for Street Vendors in Bandung, Indonesia.” Asia Pacific Viewpoint 60, no. 1 (February 27,
33. Cuevas, Sining, Christian Mina, Marissa Barcenas, and Aleli Rosario. “Informal Employment in Indonesia.” ADB Economics Working Paper Series
Figure 49. (left) The aerial view of the street vendors
Figure 48. The urban area across the Indonesian Archipelago
THE FORMALIZATION AND INFORMAL URBANISM
Street vendors are common in developing countries, but several issues are being discussed for a while like hygiene or city order.34 To improve these disadvantages, the official administration tends to persuade them to relocate to the permanent areas in malls provided by the government.
The famous case of vendor relocation in the Indonesian Archipelago is in the city of Solo (Surakarta) in 2005.35 The mayor of Solo at that time, Joko Widodo (now the president of Indonesia,) successfully convinced and relocated 989 street vendors from an attraction, Monument 45 Banjarsari, to a traditional market. This action had been considered as a success that it visually improved the street scape and made Solo “advanced” and this case has been mentioned for many times in Widodo’s propaganda when he is running for president.36
However, this move has several downsides. The relocation is under the shadow of the conventional mindset of urban planning that it removed those “illegal objects” and sent them to the legal site — a formalization by legalization. The removal erased the lively lifestyle in Solo and changed the pattern of trading system. The original way of how people buy foods is through walking in the urban fabric, but after the relocation, people commute to a point on the map of Solo to shop. The moving vendors now become fixed. The nimbleness and flexibility are canceled.
Here, I argue that such cancellation worsens the urban condition. The mobility of street vendors originally allows the commercial and social area to shrink, extend, morph, or migrate, thereby making the city more resilient considering the coming natural disasters. I also argue that to tackle the informality is not to reject, but to admit. A means of urban design that enhances the quality of street vendors without dropping the potential advantages should be proposed.
34. Vollaard, A M, Ali, S, van Asten, H A G H, Ismid, I Suhariah, Widjaja, S, Visser, L G, Surjadi, Ch, and van Dissel, J T. “Risk Factors for Transmission of Foodborne Illness in Restaurants and Street Vendors in Jakarta, Indonesia.” Research Support, Non-U.S. Gov’t. Epidemiology and Infection 132, no. 5 (10/2004): 863–72.
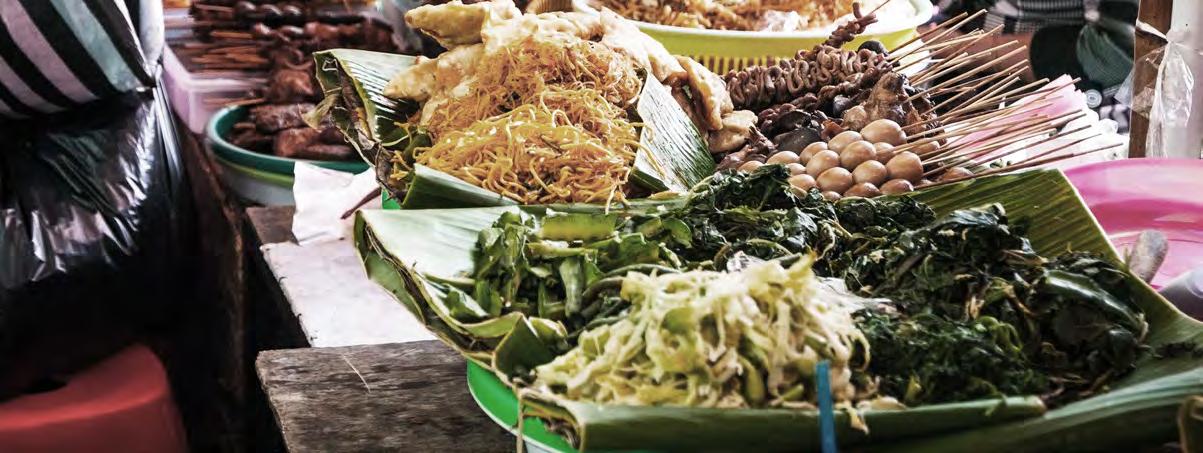
35. Majeed, Rushda. “The City with a Short Fuse.” Foreign Policy, September 11, 2012. https://foreignpolicy.com/2012/09/11/thecity-with-a-short-fuse/.
36. Widadio, Nicky Aulia, and Muhammad Latief. “Widodo from Furnisher to Two Time President.” Anadolu Agency, April 18, 2019. https://www.aa.com.tr/en/asia-pacific/profileindonesia-widodo-from-furnisher-to-two-timepresident/1456998.
Theories and Methods of Urban Design Winter 2020 A-284
Figure 50. The typical product provided by street vendors: food
Figure 51. (right) The street vendors at Monument 45 Banjarsari in Solo City before relocation

Indonesian Archipelago A-285 0 1 mile
Figure Ground Plan
1/ Setting up


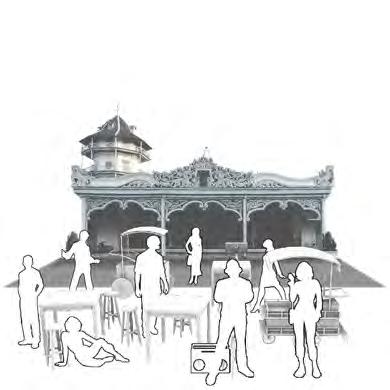

A-286 Process
Theories and Methods of Urban Design Winter 2020
2/ Social Space
3/ Leaving
Figure 52. Morning (Romeo Gacad/PRI)
Figure 53. Daytime
Figure 54. Evening (Alamy)
Figure 55. (right) The assembly and disassembly of street vendors in one day
Transect
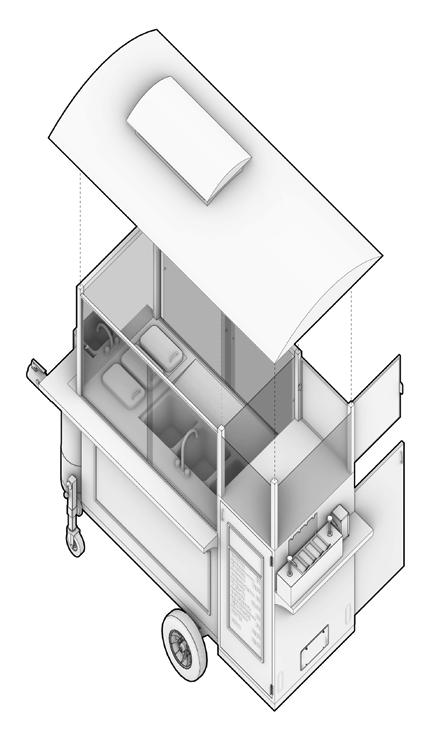
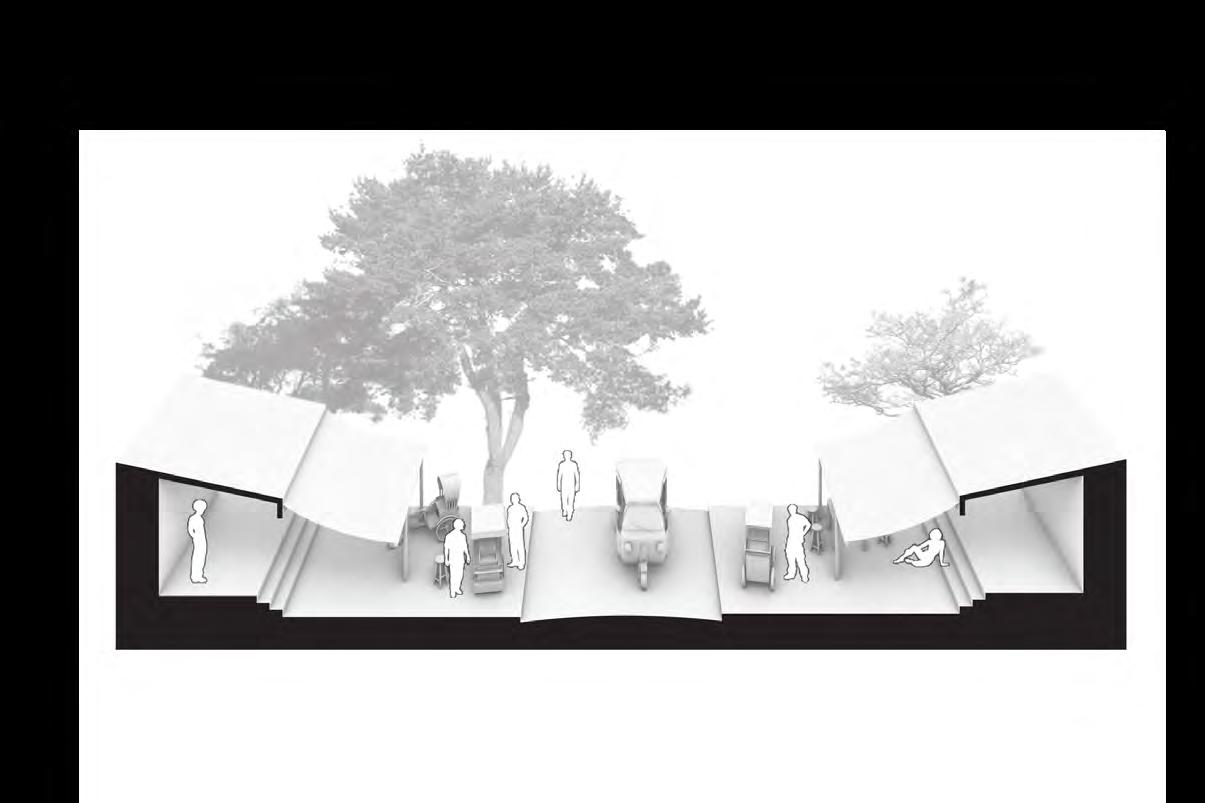
Indonesian Archipelago A-287
Actors
Residential Residential Vendors Vendors Street Street Vendors Provider Consumer Residents Locals Tourists Individual Businessman Individual Businessman Individual Businessman
Figure 56. The actors behind street vendors and their devices
Figure 57. Section of the typical street in the Indonesian Archipelago
Synthetic Collage

Theories and Methods of Urban Design Winter 2020 A-288
Figure 58. Street vendors in all kinds of urban areas
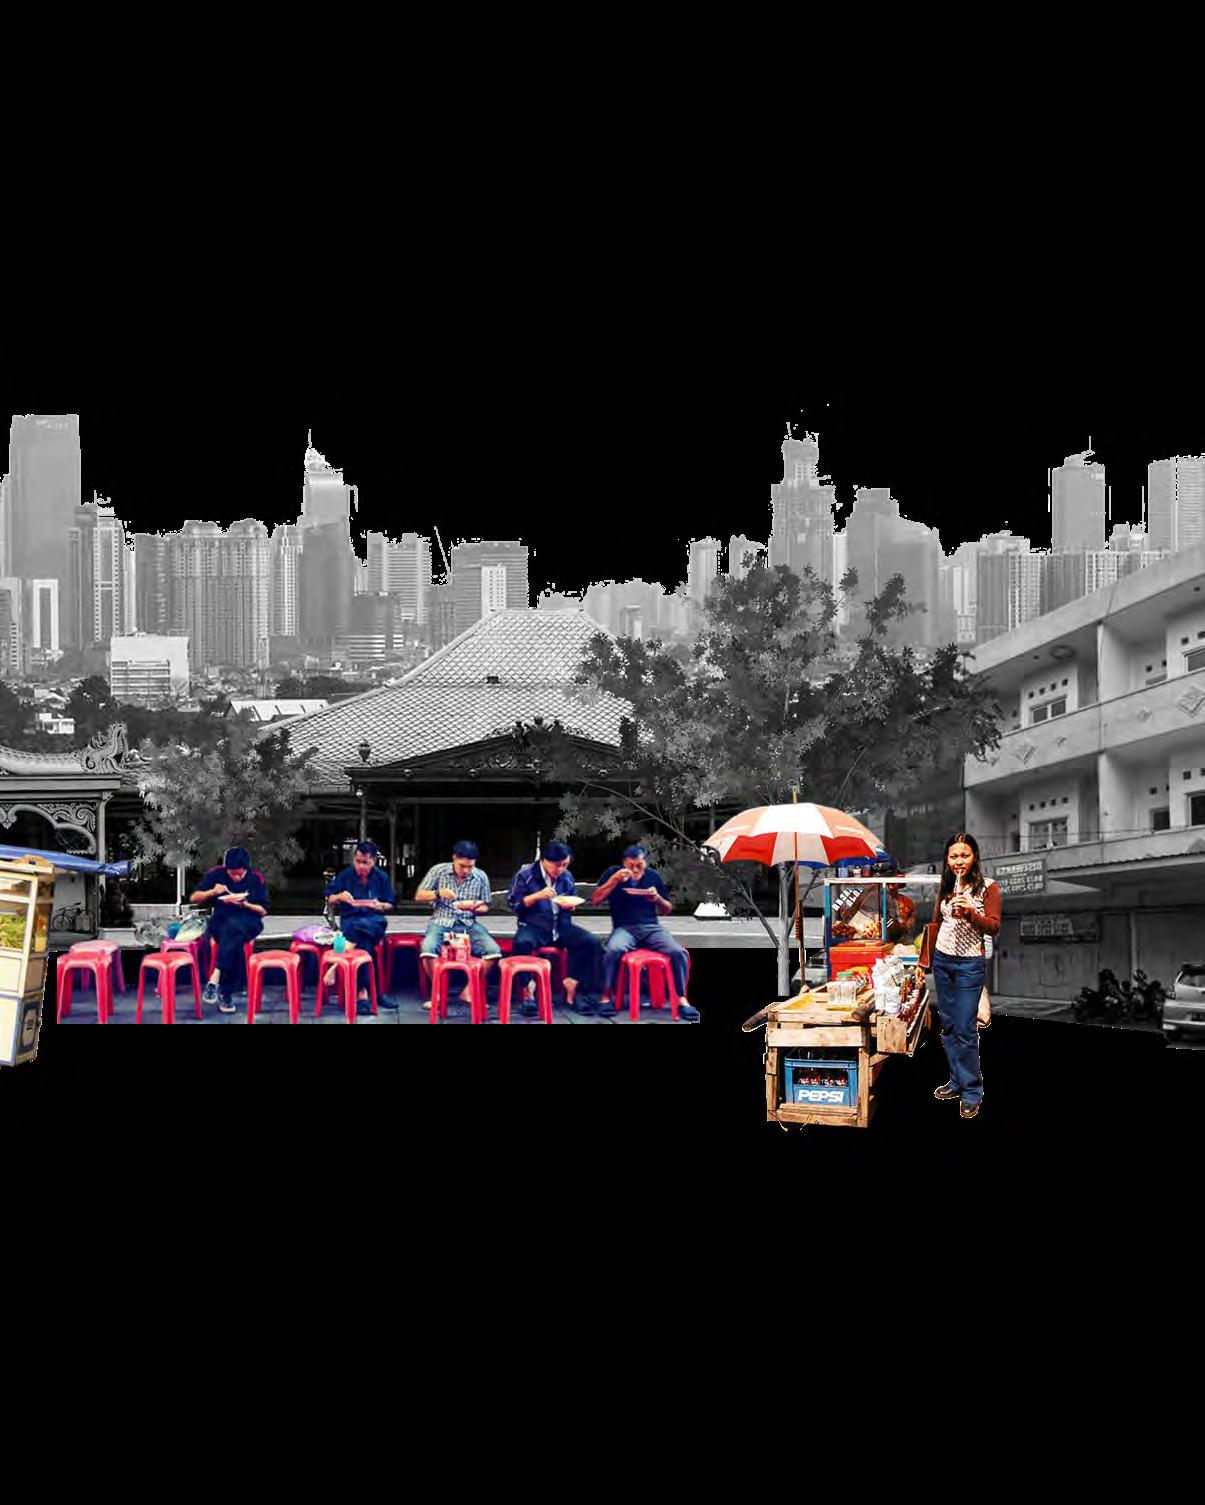
Indonesian Archipelago A-289


Theories and Methods of Urban Design Winter 2020 A-290
Cart Cart + Tent Cart + Cart Movable Table
Taxonomy
Figure 59. Different types of street vendors
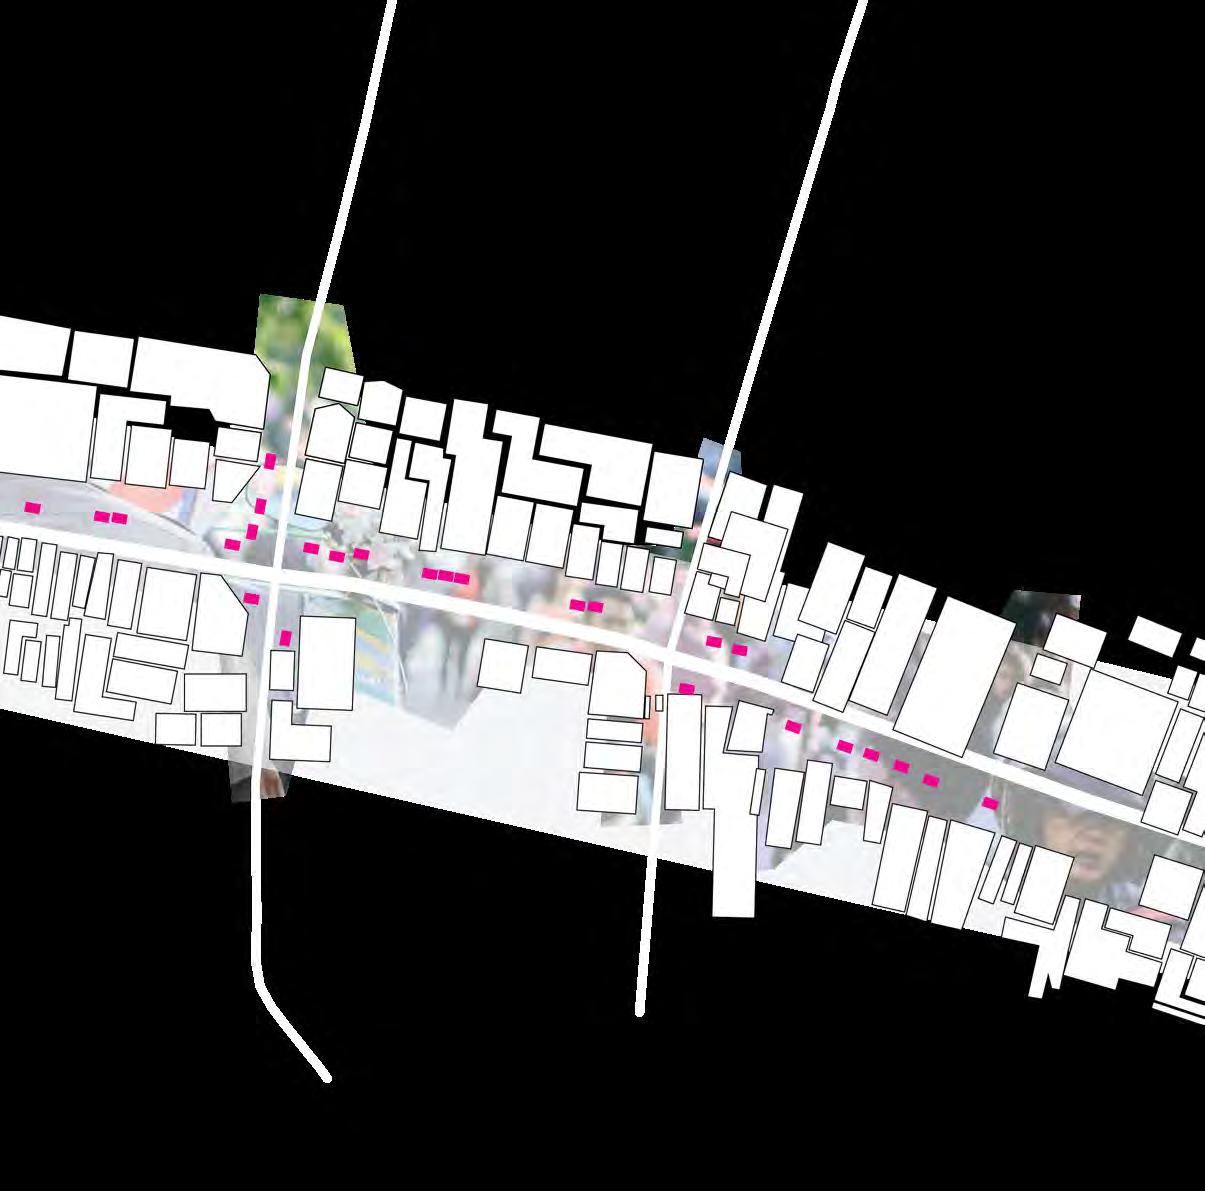


Indonesian Archipelago A-291 Food stand
Pedicab
Mini van


Theories and Methods of Urban Design Winter 2020 A-292 Cartography
Joko Widodo
Figure 61. In 2005, the newly elected mayor, Joko relocated 989 street vendors from the elite urban park of Banjarsari to Klitikan traditional market.
Figure 60. The project of relocating street vendors in Solo City in 2005
Figure Ground Plan

 Indonesian Archipelago A-293
Joko Widodo, monument
Figure 62. The relocation fundamentally changed the qualities of street vendors.
METROPOLITAN LOS ANGELES
UNITED STATES OF AMERICA
01 IDENTIFICATION OF THE TERRITORY AND LOCATION
Metropolitan Los Angeles, Southern California, is the second-largest metropolitan area in the United States, which has sixteen cities in an area of 4,850.3 sq mi. With a density around 2,744/sq mi, the Los Angeles-Long BeachAnaheim corridor is commonly known as the core of the metropolitan area. Under the theme of “decentralization“ after 1920s, suburbs and satellite cites emerged on its hinterland as the major force to reshape its territory, socioeconomically tied to the urban core, and a metropolis which is clearly measured by extensive commuting patterns.
02 RELEVANCE FROM THE POINT OF VIEW OF URBAN DESIGN THEORY AND PRAXIS

According to a zoning data in 2019, around 75% of residential land is zoned for detached single-family homes in Los Angeles. This general zoning policy in some way protects neighborhoods from being densified by large-scale developments, while still some people started to question that single family homes are the main culprits that make the city terribly dispersed, causing severe impacts on both human and natural conditions.
The nature and encouragement of car reliance also led urban designers of the past, and architects nowadays took Los Angeles as a modernist mecca, thinking that sprawling is an unchangeable urban process, which therefore made the LA Metropolitan topographically unique that the boundaries oftentimes juxtapose with wild habitants and residential houses.
Learning from Richard Neutra’s utopian work “Rush City Reformed“ (1928), the setting for the project 92 years ago shares a few similarities with the present LA Metropolitan, such as monotonicity and dispersion. However, what excited Neutra was the role of transport in human’s life, and the concern for demarginalizing people’s right to the city. As he noted, when cities are expanding,
Theories and Methods of Urban Design Winter 2020 A-294
1. Badger, Emily, and Quoctrung Bui. “Cities Start to Question an American Ideal: A House With a Yard on Every Lot.” The New York Times. The New York Times, June 18, 2019. https://www.nytimes.com/ interactive/2019/06/18/upshot/cities-acrossamerica-question-single-family-zoning.html.
2. Davis, Mike, and Robert Morrow. City of Quartz: Excavating the Future in Los Angeles. Brooklyn, NY: Verso, 1990.
3. Koglek, nuno. “> Introduction to Richard Neutra and Rush City Reformed.” UTOPICUS, January 1, 1970. http://utopicus2013.blogspot. com/2013/07/introduction-to-richard-neutraand-rush.html.
Figure 1. City of Quartz Mike Davis and Robert Morrow, 1990
[Critical DATA]
Geographical Delimitation

The Los Angeles metropolitan area comprises Los Angeles County (2010 population: 9,862,049) and Orange County (2010 population: 3,010,759).
Area
4,850.3 sq mi
Population
13,310,447[as of 2016]
Social Indicators
54.6% White (32.2% non-Hispanic White alone), 7.0% Black or African American, 0.5% American Indian and Alaska Native, 13.9% Asian, 0.3% Native Hawaiian and Other Pacific Islander, 20.6% from Some other race, and 3.2% from Two or more races. Hispanics or Latinos of any race made up 44.8% of the population.
Economic Indicators
With a fast-growing and immense high-tech industry, a 2010 Greyhill Advisors study indicated that the Los Angeles metropolitan area had a gross metropolitan product of $736 billion. As of 2017, the Combined statistical area of Greater Los Angeles had a $1.252 trillion economy.
Environmental Indicators
The climate is classified as a Mediterranean climate. There are, however, different microclimates depending on area, since the city covers a wide surface, it is situated on the coast, but it’s also surrounded by hills and mountains.The city is quite polluted, and pollutants can accumulate in the air especially in the dry season, from May to October.
Metropolitan Los Angeles A-295
4. Whyte, William Hollingsworth. The Exploding Metropolis. Berkeley: University of California Press, 1958.
5. Fogelson, Robert M., and Robert Fishman. The Fragmented Metropolis: Los Angeles, 1850-1930. Berkeley: University of California Press, 1993.
6. Sevtsuk, Andres The Future of Streets: Los Angeles. City Form Lab, 2019
Metropolis Los Angeles
Figure 2. The Exploding Metropolis William H. Whyte, 1958
the problem had only worsened the traffic, which had caused an “unreasonable and go back,” a waste of resources and destruction of the spirit of community.” Housing crisis is an ongoing problem for the Metropolitan Los Angeles. The role of urban design in this case therefore needs to be regionally sensitive in terms of increasing housing density and affordability, meanwhile keeping the low-slung character of each community.

03
METHODS TO CONDUCT YOUR INVESTIGATION
To understand the XL-scale sprawling builtscape of Metropolitan Los Angeles, I am collecting relevant information by GIS mappings, Google Earth Timelapse and a project by urban designer Omar Ureta’s “Built: LA“. Once the territory of sprawling is confirmed, the next area I will focus on is the one densely populated in the Metropolitan Los Angeles to learn possible urban conditions that might push/pull people away/in. After understanding the theme, I will investigate the city through measuring the levels of activity centering and the land use mix. Those collected information will be shown on a key map which is superimposed on the initial GIS layer.
05 ANTICIPATED FINDINGS
The city of Los Angeles has not only failed to create walkable communities by investing in transit-oriented development, but also struggled to offer affordable housing for Angelenos. Instead, the unbalanced condition has fueled the development to return back to the city center, building a city image filled with billboards, iconic plazas and fancy Blobitectures. By studying two recent cases and one unbuilt utopian project, I would like to figure out how designers with different expertise are elevating people’s life quality, and what sorts of schemes they conducted to meet people’s demands in a dispersed, segregated setting. I would also like to know the reason why community-driven developments in 21st century LA Metro Area are always less concerned, while the city government is obsessed with the model of decentralization. This finding will help me build

Theories and Methods of Urban Design Winter 2020 A-296
7. Age of Los Angeles. Accessed March 31, 2020. https://cityhubla.github.io/LA_Building_ Age/#12/34.0184/-118.2476.
8.Cuff, Dana. The Provisional City: Los Angeles Stories of Architecture and Urbanism. Cambridge, MA: MIT Press, 2000.
Figure 3. LA’s traffic congestion was relieved after the implementation of stay-at-home orders.
Figure 4. The Provisional City: Los Angeles Stories of Architecture and Urbanism Dana Cuff, 2000
Donald Trump becomes the 45th President, Mike Pence becomes Vice President.
Los Angeles Metro Rail has 73 miles of rail, averaging 308,653 trips per weekday.

Antonio Villaraigosa becomes mayor of Los Angeles, the city’s first mayor of Hispanic descent since 1872.
STAPLES Center opens.
Nelson Mandela visits Los Angeles as part of a historic 12-day, 8-city tour of the U.S.
Academic movement led by LA School Urbanists.
Los Angeles hosts the 1984 Olympics.

Jimmy Carter and Walter Mondale won the election as President and Vicepresident of the United States.
Sylmar earthquake, causing 64 dead and more than 2,500 were injured.
Los Angeles population: 2,479,015, surpassing Philadelphia as third in the nation. More than 6 million people live in Los Angeles County.
The proliferation of automobiles after the war had triggered the boom of freeway constructions.
Completion of the “four-level” interchange.
Chavez Ravine was slated to be the site of a massive public housing project called Elysian Park Heights, which would provide 3,600 affordable apartments.
Los Angeles International Airport(LAX) opened, currently the fourth busiest airport in the world.
With the arrival of D. W. Griffith, he and his crews unveiled the beginning of the movie industry in Hollywood.

The approval of Los Angeles Aqueduct.
The birth of the Port of Los Angeles.
The discover of oil near what is now Dodger Stadium.

Metropolitan Los Angeles A-297 TIMELINE : History, actors and events 1920 1950 1960 1980 1990 2000
1970 1971 1950s 1892 1907 1908 1910s
1945 1950 1953 1960 1930 End of World War II .
1976 1984 1990 1999 2005 2012 2017 1980s 2000s Urban sprawls came into play. 2020 2010 1900 1880 1910
Figure 5. metro Expo Line
Figure 6. 1984 Summer Olympics
Figure 7. Four level interchange
Figure 8. Hollywood
Figure 9. Los Angeles aqueduct
Figure 10. the first oil district in Los Angeles
arguments on what actions designers should prioritize when tackling with cities that have already sprawled for decades.

9. Davis, Mike. Ecology of Fear: Los Angeles and the Imagination of Disaster. Metropolitan Books, 1999.
10. Wolch, Jennifer R., Manuel Pastor, and Peter Dreier. Up against the Sprawl: Public Policy and the Making of Southern California. Minneapolis, MN: University of Minnesota Press, 2004.


Theories and Methods of Urban Design Winter 2020 A-298
Figure 11. Bird’s-eye view of single family home communities.
Figure 13. Metro LA Population Density Map
Figure 12. Up Against the Sprawl Jennifer Wolch, Manuel Pastor Jr., Peter Dreier , Manuel Pastor Jr. 2004

! ! ! ! ! ! ! ! ! ! ! ! ! ! ! ! ! ! ! ! ! ! !! ! !! ! ! !! ! ! ! ! ! ! !! ! ! ! !! ! ! ! ! ! ! ! !! ! ! !! ! ! !! ! ! ! ! ! !! ! ! ! ! ! ! ! ! ! !! !! !! !! !! !!! !!!!!! ! !!! ! !!!! ! ! !!!!! ! ! ! ! ! ! ! ! ! ! !! !! !! ! !! ! ! ! ! !!!! ! !! ! ! ! ! ! ! ! !! !! ! ! ! ! ! ! !! !! ! ! ! ! ! ! !! ! ! ! ! !! ! ! ! ! !! ! ! ! ! ! ! ! !! ! ! ! ! ! ! ! !! ! ! !! !!! ! ! ! ! !! ! ! !! ! ! !! !! ! ! ! ! ! ! ! ! ! ! ! ! ! !!! ! ! ! ! ! !! ! ! ! ! ! ! ! ! ! ! ! ! ! ! ! !!! !!! !!!!!!! ! ! !! !!!! !!! ! !!!! ! ! ! !! !! ! ! ! ! ! ! ! ! ! ! ! ! ! !! !!! !!! !! ! !! ! ! !! ! !! ! ! !! ! ! !! ! !! ! !!! !! !! ! ! !! !!! ! ! ! ! !! !!! ! ! !!!! ! ! ! ! ! ! ! !!!!! !! ! ! ! ! ! ! ! ! ! ! ! ! ! !! !! ! ! ! !! ! ! !! !! ! !! !! !! ! ! !! ! ! ! ! !! ! ! ! ! ! ! !! !!! ! ! ! ! !! ! ! ! ! ! ! ! ! ! ! ! ! ! ! ! ! ! ! ! ! ! ! ! ! ! ! ! ! ! ! ! ! ! ! ! ! ! Metropolitan Los Angeles A-299 0 1 mile Hydro Highway Plan Boundary City of Los Angeles Legends
Figure 14. Primitive GIS Mapping
By overlapping figure 3 and 4, it is clearly indicated that the footprints of residency roughly follow the network of the highway plan. Even though this model has been considered economically insufficient by many, as noted in Sprawl: A Compact History, Robert Bruegmann calls it a logical consequence of economic growth and the democratization of society, with benefits that urban planners have failed to recognize. The term sprawl also opens up an opportunity for people to have more mobility and privacy, which in a way turns the term even more complex and creates tons of self-contained towns and individual cities that are able to provide jobs, housing and shopping, treating residents locally rather than in a wider scale. This unexpected silver lining that comes with the sprawl has challenged the roles of urbanist and designer alike. Historically, if the metropolitan region is built upon a suburban assumption, then what is the appropriate way for designers to stop/ accelerate the process of sprawling?

Theories and Methods of Urban Design Winter 2020 A-300
Figure 15. The Sprawling builtscape of Los Angeles, San Fernando Valley area. (source: Built:LA)
Take the suburbanized condition in San Fernando Valley for instance, it is necessary to trace its history back to 1903, when Harry Chandler bought almost 50,000 acres of dry land in the valley, and turned it into a tax-funded water neighborhood with rail line routes surrounding it. In the late 1940s, San Fernando even became home to returning veterans. This early mode of investment on both its infrastructure and public amenities has continuously fueled the speed of decentralization, shaping the urbanized valley, home to 1.77 million people, up to now. This duplicable model also points out why the city is inclined towards preserving the sprawl: it creates local economics and better school system for certain income levels.
By comparing the three selected projects, the research also aims to explore appropriate large-scale approach that could mediate the tension in between the notorious sprawl and the lack of planning nature in the metropolitan, and to understand how both public and private sectors are working collaboratively/ separately to turn land into property as a way of strengthening the sense of community in a sprawling setting.

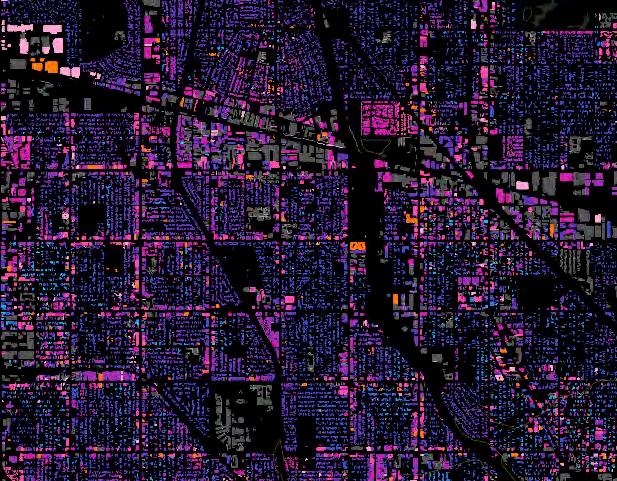
Metropolitan Los Angeles A-301
~1909 1910s 1920s 1930s 1940s 1950s 1960s 1970s 1980s 1990s 2000s
11. Bruegmann, Robert. Sprawl: a Compact History. Chicago: Univ. of Chicago Pr., 2005.
Figure 16. Sprawl: a Compact History Robert Bruegmann 2005

 Theories and Methods of Urban Design Winter 2020 A-302
Figure 17. Fab Civic Center Park
Figure 18. Fab Civic Center Park
12. OMA. Accessed January 23, 2020. https://oma.eu/news/mla-oma-ideoteam-selected-to-design-fab-park-indowntown-los-angeles?fbclid=IwAR01kkD3fA3YMCEbN5s_9TF_6scz-n-1l3Cw_ ElbDG3OtwEgcRui07quD0.
FAB CIVIC CENTER PARK [LANDSCAPE URBANISM]
The city is investing in an innovative park in the city center adjacent to Grand Park, which is expected to incorporate uses that bring life to the area. Situated on a site which is surrounded by governmental institutions, the FAB Park was initially positioned as a mediator to provide a lushly space for respite and cultural events, featuring a restaurant with three occupiable levels and sculpted shade canopies.
Since the meeting points were primarily designed for civil servants, the building shows two different power dynamics accordingly: quick and casual on the ground, while refined and elegant above. Another goal of the project is to curate largescale art events. Thus, the flexible plaza and other void spaces varying in scales are reserved for future larger-scale plan, elevating the commerce-driven civic space to an inclusive communal space in the heart of the city.
Location Year(s) Status
Footprint Designer
Additional Agents
Key Project Components Program(s)
Funding Streams
[Los Angeles, USA]
[2016]
[In Progress]
[1.96 acre]
[OMA, MLA, and IDEO]
[ARUP, Structural, MEP, Sustainability/Psomas, Civil Engineer/Development Industries, Constructability Review]
[A split level restaurant and array of sculpted shade canopies distributed among a lushly planted grove of mature trees]
[Restaurant, Park, Gallery]
[Public]
Metropolitan Los Angeles A-303
13. Lynch, Patrick. “OMA, MLA, and IDEO Selected to Design New Park for Downtown Los Angeles.” ArchDaily. ArchDaily, June 9, 2016. https://www.archdaily.com/789161/omamla-and-ideo-selected-to-design-new-park-fordowntown-los-angeles?utm_
0 1 mile
Figure 19. Figure ground
FAB CIVIC PARK AND LANDSCAPE URBANISM

According to Mia Lehrer and OMA partner Jason Long, the project itself has a high degree of accessibility- both visual and physical. Access points are allocated on all edges, giving pedestrians various paseo routes stretching diagonally across the site to connect to the surrounding buildings. Meticulously planned, the design team also concluded the ideal spots for restaurant and eating areas based on the back and forth collaboration between different design professions. Considered as a combination of landscaped and hardscaped area, the value of merging human actitvities with artificial nature in this case has been a universal approach for cities to adopt. However, in a place that people have a big love for sprawling and individual lot, how they treat this project in a setting that nature can be stingy and violent is worth being discussed.
As J. B. Jackson stated in 1984: “A landscape is not a natural feature of the environment but a synthetic space”. Rethink the role of urbanism, by providing new attractions and amenities, the project not only repositions itself as an ecology-based gathering point, but also encourages cultural, commercial and recreational activities to juxtapose with the built nature, imposing a resilient layer onto the existing greenery.
However, consider the context and examine it through the four themes identified by James Corner, which are the process over time, the staging of surfaces, the operational or working method and the imaginary. The most debatable one might be the horizontality in this project. To serve the physiological needs, designers oftentimes were unavoidably assigned to create “instant architecture in an instant townscape”. But if we project landscape architecture from a broader framework, seeing it as a mechanism to operate different scales of activities to intertwine with potential users, is it still necessary to provide such eyecatching building as a means to centralize the public open space, and to further overlap the master planning with the contemporary urbanism?

Theories and Methods of Urban Design Winter 2020 A-304
14. Jackson, John Brinckerhoff. Discovering the Vernacular Landscape. New Haven: Yale University Press, 1984.
15. Waldheim, Charles. The Landscape Urbanism Reader. New York: Princeton Architectural Press, 2006.
Figure 20. Fab Civic Center Park
Figure 21. Discovering the Vernacular Landscape John Brinckerhoff Jackson 1984

Metropolitan
0
Los Angeles A-305
250m
Figure 22. Master plan


Theories and Methods of Urban Design Winter 2020 A-306 EDUCATIONAL STREET OPEN SPACE
Bunker Man-made River


Metropolitan Los Angeles A-307
Figure 23. Urban Transect
Figure 24. Taxonomy
GRAND PARK INSTITUTIONAL
Flexible Gallery

Theories and Methods of Urban Design Winter 2020 A-308
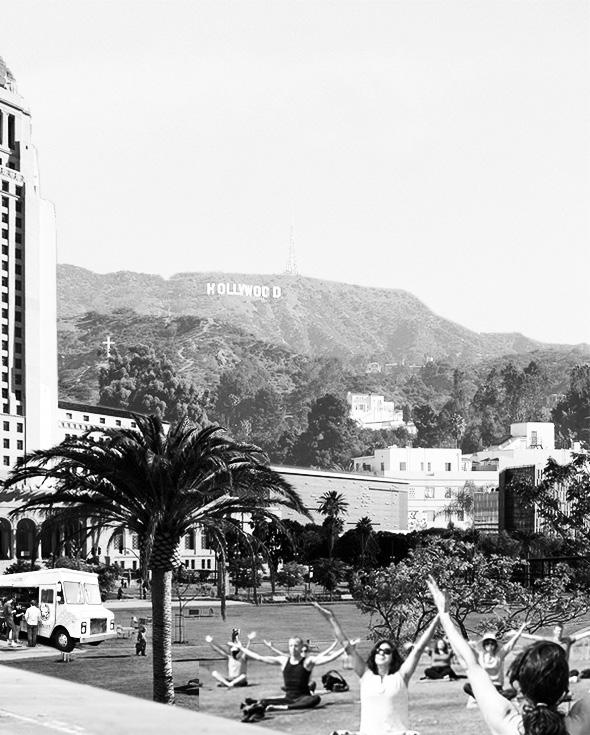 Metropolitan Los Angeles A-309
Figure 25. Urban Condition Collage

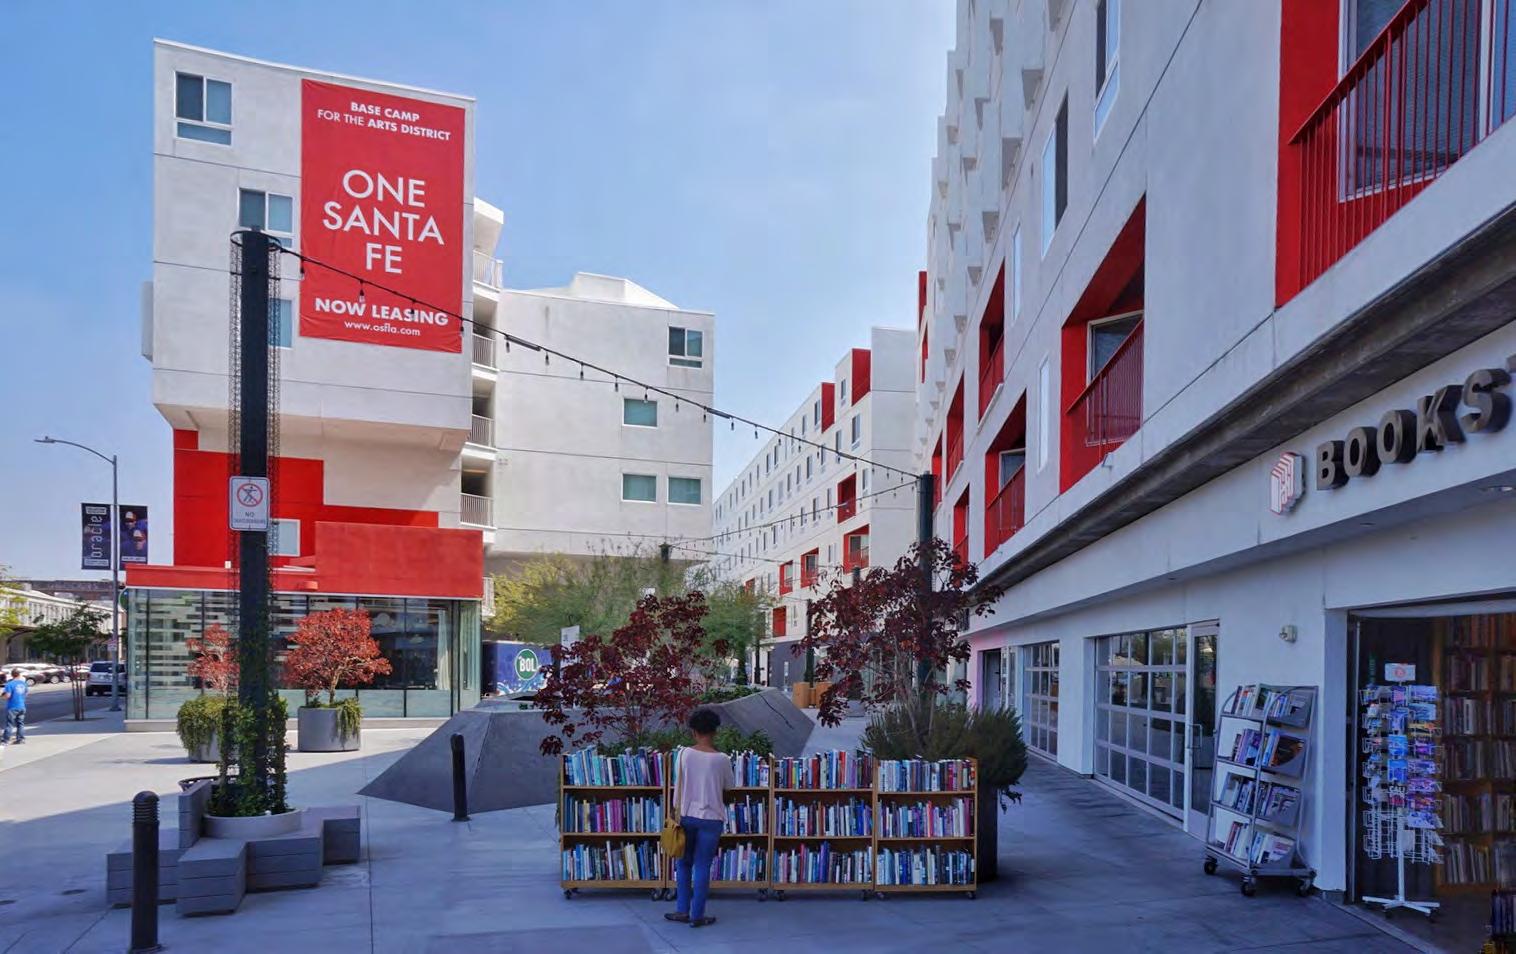 Theories and Methods of Urban Design Winter 2020 A-310
Figure 27. One Santa Fe
Figure 26. One Santa Fe
16.
https://www.mmaltzan.com/projects/onesanta-fe/.
ONE SANTA FE [NEW URBANISM]
Located in the midst of Downtown’s high-rise core and the Los Angeles River, Michael Maltzan proposed a hyper-dense, mixed-use scheme for a consortium of real estate developers and investors, claiming that architecture at present may have the power to drastically reshape the pattern of the formerly industrial Arts District. The project stretched over a long and narrow 4-acre site, co-existing with an adjacent railyard which is still being used now.
After the arrival of artist studios around 1982, institutions and infrastructure gradually took over some of the vacancy by following those first businesses, renovating the unused freight depots into museums, schools and other amenities one after another.
Location
Year(s)
Status
Footprint Designer
Additional Agents
Key Project Components Program(s)
Funding Streams
[Los Angeles, USA]
[2015]
[Completed]
[473.8 acre]
[Michael Maltzan Architecture]
[Weidlinger Associates, Inc., Structural/KPFF Consulting Engineers, Civil Engineer/Green MEP Engineering Consulting, Inc., MEP]
[The building includes 438 residential units with a total length of more than a quarter mile, echoing the surrounding regional infrastructure.]
[Residential, Retail, Commercial]
[Private]
Metropolitan Los Angeles A-311
“One Santa Fe: Michael Maltzan Architecture.” One Santa Fe | Michael Maltzan Architecture. Accessed February 15, 2020.
17. Fortmeyer, Russell. “One Santa Fe.” Architectural Record RSS. Architectural Record, November 6, 2019. https://www. architecturalrecord.com/articles/10168-onesanta-fe.
0 500 m
Figure 28. Figure ground
ONE SANTA FE AND THE NEW URBANISM


Running roughly parallel to SCI-Arc and the railroads, One Santa Fe is considered to share many characteristics with OMA’s recent masterplan project “Entrepôt Macdonald” in terms of transforming an industrial fringe into a housing complex, and bridging the gap between the isolated periphery and the city center. As the architect stated: “One Santa Fe is a seam between the east and the west sides of the city, a threshold that acts as a middle-ground landscape”. In this spirit, the longitudinal complex is still in a state of becoming a transitional state that seeks to promote affordability by deploying a community development–oriented funding scheme.
From a New Urbanism perspective, the two six story buildings successfully re-packaged the industrial site into a small-scale community with 438 residential units that has its own economic potential. However, beyond the spirit of promoting walkability and density that new urbanism has addressed, the argument might fall as to what extent can a 21st century mixed-use housing model impact its surroundings and change the traditional neighborhood structure that Angelenos have for so long appreciated?
Therefore, by using “The rural-to-urban Transect” as a tool to examine the allocation of the elements that shape One Santa Fe an appropriate habitat for humans, it is clear that the intermix of neglected waterway, industrial site and the art district opens an opportunity for the birth of the linear complex. It is also being said that the public investment in the Los Angeles River in 2007 was the main force to draw developer’s attention to the area. Rethink the role of urbanism, using high-profile investment to activate developments seems practical and efficient, while fixing fundamental qualities of space as a way to promote accessibility to the city is not widely adopted in Los Angeles. To address this issue, this unusual dimension project can not only be taken as a wise methodology in linking affordable housing with neglected landscape, but also be used as a model for urban designers to avoid the format of creating artificial diversity as a means to improve living environments.
Theories and Methods of Urban Design Winter 2020 A-312
18. “OMA Rework a Brutalist Paris Warehouse: Architecture: Agenda.” Phaidon. Accessed April 21, 2020. https://www.phaidon.com/agenda/ architecture/articles/2016/july/14/omarework-a-brutalist-paris-warehouse/.
19. “One Santa Fe.” ULI Case Studies, December 13, 2019. https://casestudies.uli.org/ one-santa-fe/.
Figure 30. Entrepôt Macdonald OMA(masterplan) 2007
Figure 29. One Santa Fe
Figure 31. The urban-to-rural transect Andrés Duany 2008

Metropolitan Los Angeles A-313 0 500m
Figure 32. Master plan

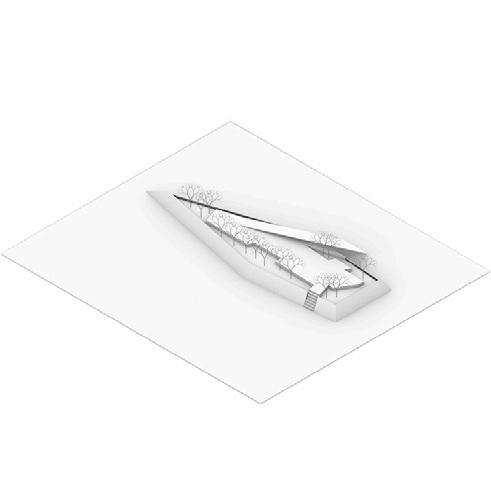

Theories and Methods of Urban Design Winter 2020 A-314 SCI-ARC RESIDENTIAL STREET
Parking Tower
Landscape INDUSTRIAL
Elevated


Metropolitan Los Angeles A-315 Topography x Transit Infrastructure Night Market HYDRO INDUSTRIAL
Figure 33. Urban Transect
Figure 34. Taxonomy

Theories and Methods of Urban Design Winter 2020 A-316
 Metropolitan Los Angeles A-317 Figure 35. Urban Condition Collage

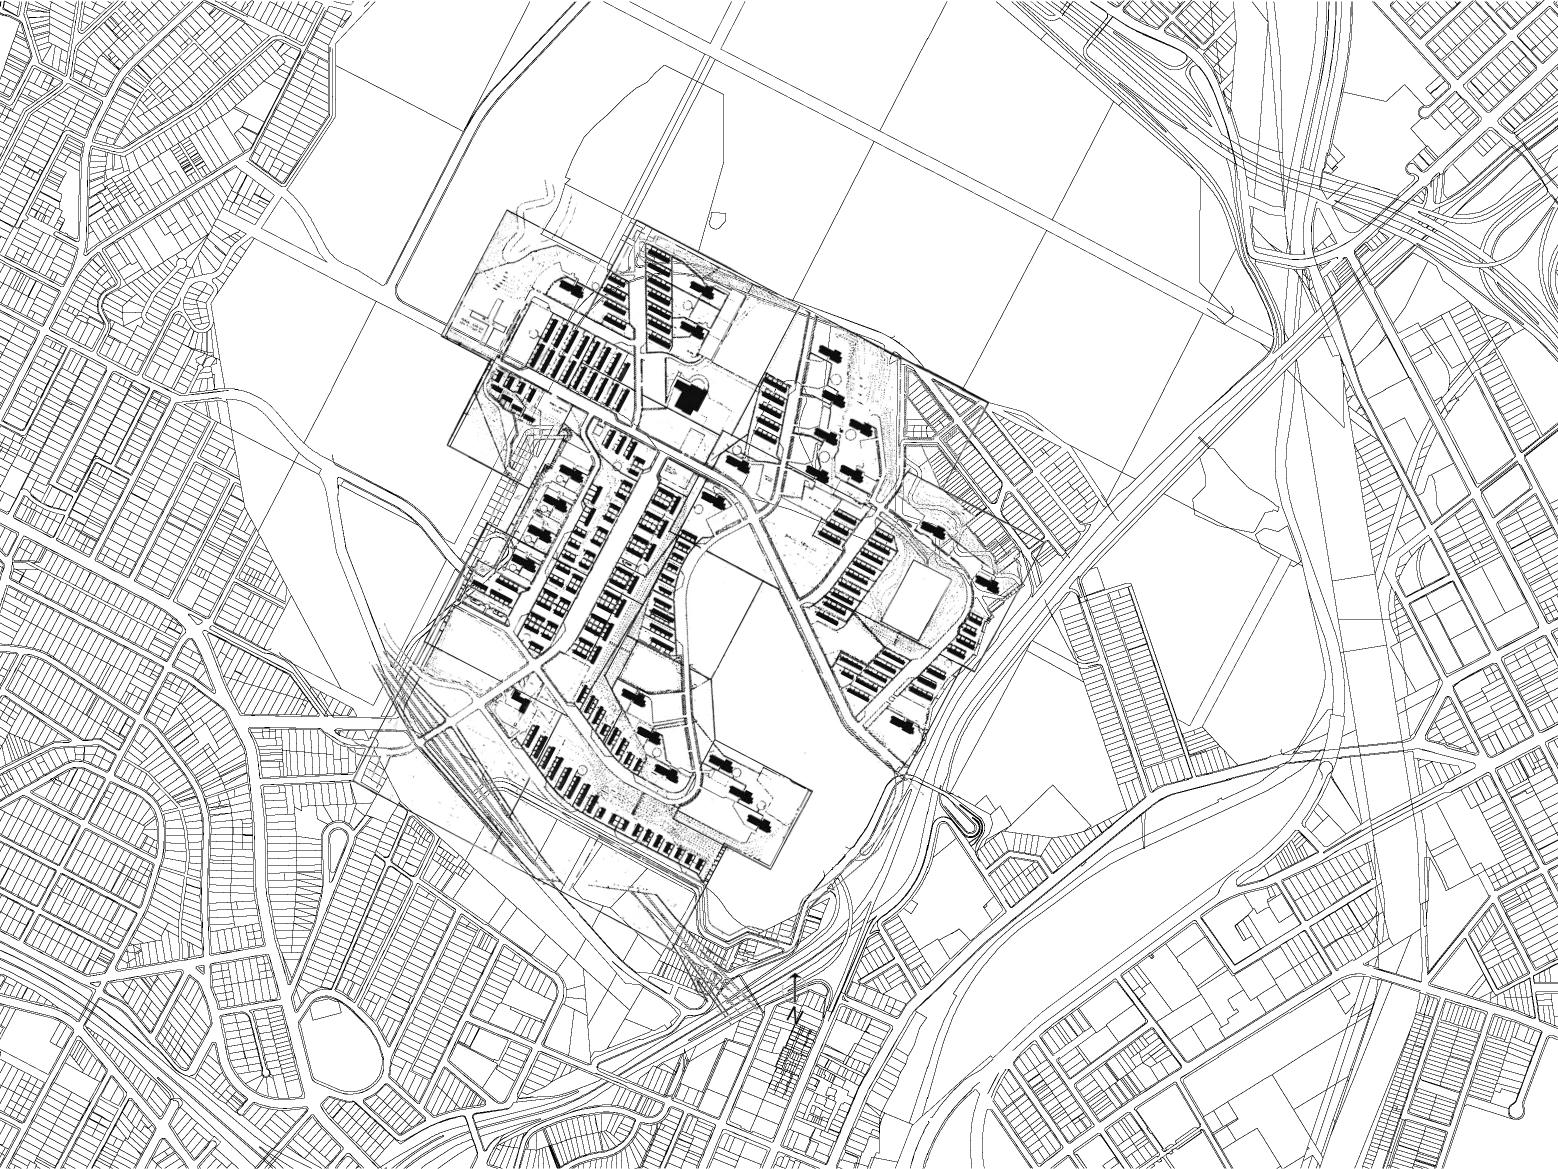



Theories and Methods of Urban Design Winter 2020 A-318
Figure 36. Chavez Ravine, 1948
Figure 36-1. Chavez Ravine 1948
Figure 36-2~3. Chavez Ravine 1948
Figure 36-4. Chavez Ravine 1948
Figure 36-5. Chavez Ravine 1948
1950
Figure 37. Elysian Park Heights,
https://www.kcet.
ELYSIAN PARK HEIGHTS [UTOPIAN URBANISM]
By the late 1940s, mayor of L.A. assigned five commisioners to the Community Redevelopment Agency in the task of removing informal dwellings in rural and urban areas to make rooms for new commercial and residential units. Most of the Chavaz Ravine’s dwellings were considered “slums” and the “substandard”, City officials then took the situation as an opportunity to turn the originally Mexican-American neighborhoods into a massive public housing project, which was known as Elysian Park Heights. With an area of 254 acres, Chavez Ravine held the strongest potential in terms of building large over other site selections in L.A.. However, by the early 1950s, the city started to convince residents into selling their homes, developers on the other hand, offered immediate cash payments as exchange for the properties, which made the residents, by choice or by force, leave Chavez Ravine by 1953, which was also the time the social housing plan fell apart.

Location Year(s) Status
Footprint Designer
Additional Agents
Key Project Components Program(s)
Funding Streams
[Los Angeles, USA]
[1950s]
[Never Built]
[254.4 acres]
[Richard Neutra, Robert Alexander, Architects/ Simon Eisner, Site Planniner/ Garrett Eckbo, Landscape]

[The project includes two dozens of 13-story buildings and more than 160 twostory townhouses.]
[Public Housing]
[Public]
11. Masters, Nathan. “Chavez Ravine: Community to Controversial Real Estate.” KCET, January 11, 2017.
org/shows/lost-la/chavez-ravine-communityto-controversial-real-estate.
Metropolitan Los Angeles A-319 1948 1948 1948
12. “What Was Never Built in Chavez Ravine?” SoundCloud. Accessed February 15, 2020. https://soundcloud.com/kcrw/what-wasnever-built-in-chavez.
Figure 38. Perspective view of the Elysian Park Heights
ELYSIAN PARK HEIGHTS AND UTOPIAN URBANISM

Beyond the goal of accommodating 17,000 people in two dozen 13-story buildings and more than 160 two-story townhouses, the plan also included two schools, a community building with indoor and outdoor theaters, playgrounds, nurseries and four churches in a Radburnian plan where only local traffic was allowed to enter. The clean and ordered plan, however, was modified by the topography and terrain, giving the architects the chance of utilizing the slopes to increase the low-rises’ privacy. With several buildings and amenities allocated along the primary axis, the plan also showed an early example of design for disabilities and residents with special needs.
By reviewing the project through Ebenezer Howard’s “Three Magnets diagram” first proposed in 1898, with an intention of bringing the low-income residents back, first as a priority after the completion, the project was seeking to solve the urban crisis concerning housing equity, overpopulation and social justice, blending the sub-rural community with nature into a Town-Country which enjoys both the benefits of the town and the country. However, the nature of utopian urbanism can also be justified: the project was suspended due to political corruption, and eventually dominated by the capitalist power.
The standards for measuring the success of utopian urbanism is still debatable, while one certainty is that utopian visions can bring clarity into the real world market, and go a step further in providing foreseeable hypothesis for urban designers at present. The dilemma of implementing utopian visions into reality is restricted by particular expectations related to urban problems that are typically unsolvable by simply proposing spatial schemes, instead it requires a broader approach to identify the balance between private and public power in creating a socially inclusive environment for all. This initial spirit can be found in Elysian Park Heights, which I found is relevant to urban study if designers are able to learn from the complex state of immigrant neighborhoods, and address social issues in a more integrated, practical level concerning regulation, financing and equity, which are vital factors that designers are usually not aware of when discussing utopian ideology in an academic setting and real world practice alike.

Theories and Methods of Urban Design Winter 2020 A-320
Figure 39. Bird’s-eye view of the Elysian Park Heights
Figure 40. The Three Magnets from Garden Cities of Tomorrow Ebenezer Howard 1902
13. Fishman, Robert. “MultimediaPublicSpace.” PUBLIC SPACE. Accessed February 15, 2020. https://www.publicspace. org/multimedia/-/post/beyond-utopiaurbanism-after-the-end-of-cities.
14. Cuff, Dana. The Provisional City: Los Angeles Stories of Architecture and Urbanism. Cambridge, MA: MIT Press, 2000.


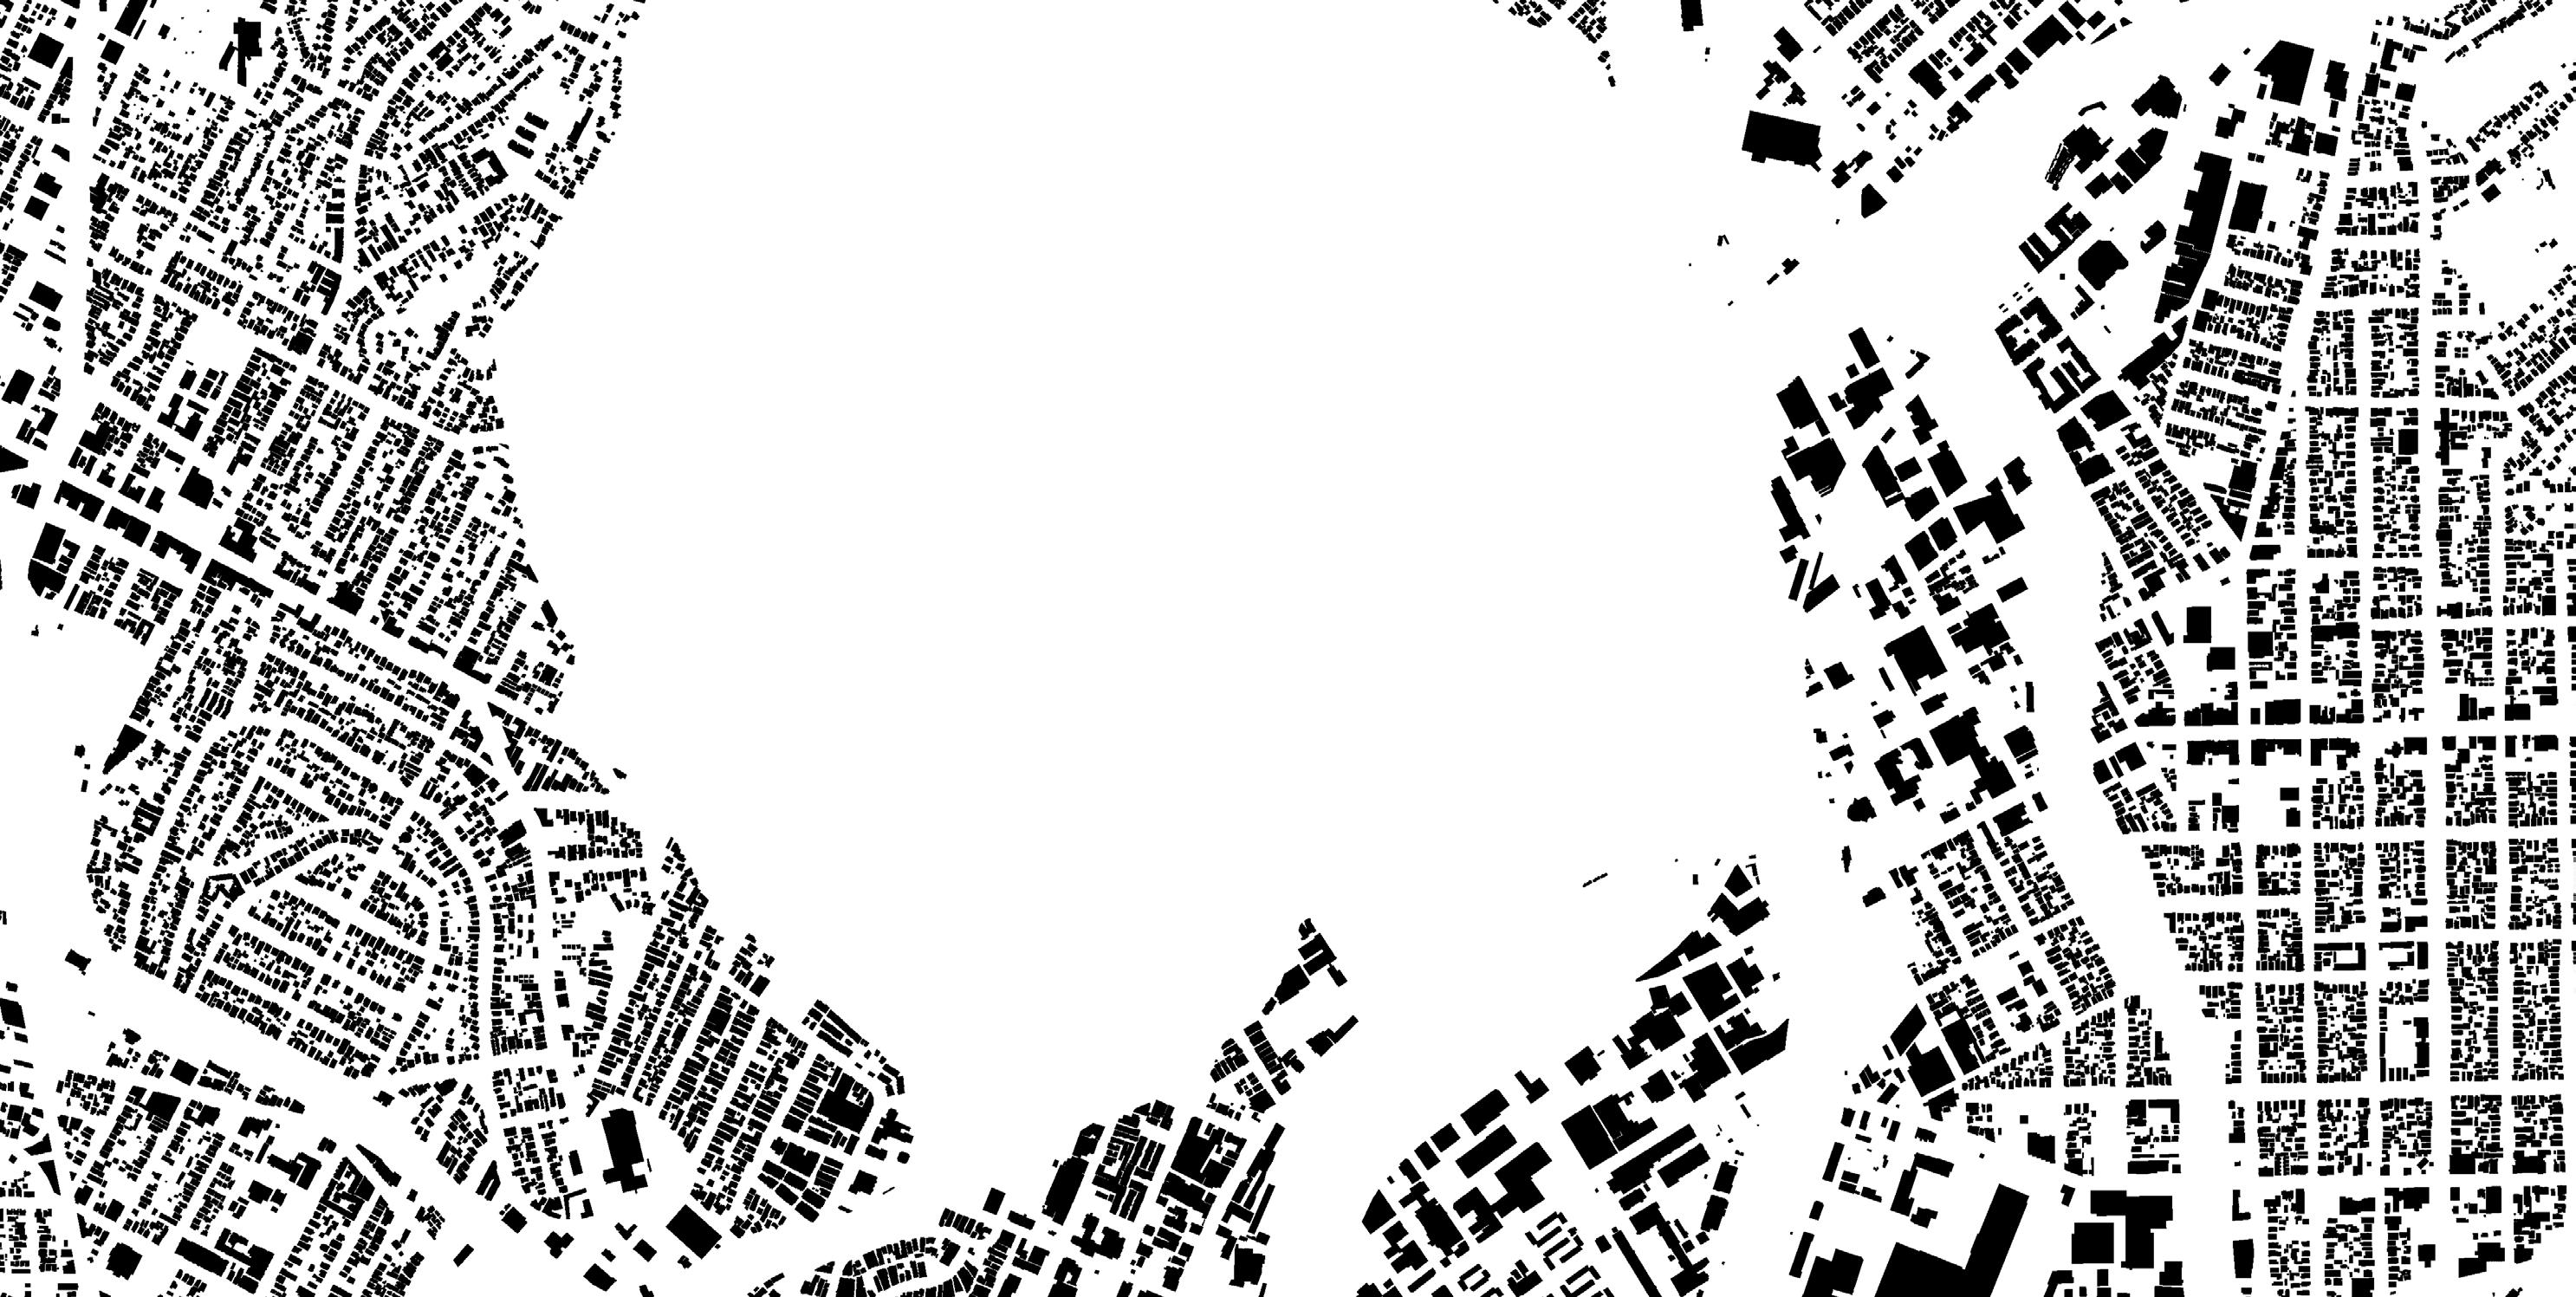

 Metropolitan Los Angeles A-321
Figure 41. Elysian Park Neighborhood, 2020





Theories and Methods of Urban Design Winter 2020 A-322
Rocks for plants Wooden Van
Rocks for camping Tent
Bamboo
fence
Livestock
Clapboard Staircase


Metropolitan Los Angeles A-323
Wooden fence Clapboard Staircase Window frame Mailbox Door frame Wheelbarrow Elevated Porch Gas
Figure 42. Taxonomy (1950 in Chavez Ravine)
tank


Theories and Methods of Urban Design Winter 2020 A-324 RESIDENTIAL OPEN SPACE PUBLIC TRANSIT OPEN SPACE LANDSCAPE
PRIVATE SEMIPUBLIC
Figure 43. Urban Transect of Elysian Park Heights Plan


Metropolitan Los Angeles A-325 (1) CENTRAL PARK Central Park Hillside Open Frontyard RESIDENTIAL
Figure 44. Urban Transect of Elysian Park Heights Plan (2)
Public Transit
Figure 45. Taxonomy of Elysian Park Heights

Theories and Methods of Urban Design Winter 2020 A-326
 Figure 46. Urban Condition Collage
Metropolitan Los Angeles A-327
LAKE ST CLAIR WATERSHED US & CANADA
01 IDENTIFICATION OF THE TERRITORY AND LOCATION
The Lake St. Clair Watershed was formed by melting glaciers around 14,000 years ago in the likeness of the Great Lakes System in which it exists. Advancing slowly for thousands of years, the land and water bodies are shaped into systems of tributaries, rivers, streams, wetlands, drylands, and lakes. Contributing to the Great Lakes System, the Lake St. Clair Watershed services the Lake Erie Watershed. The region is rich with histories of frontier expansion and fur trading. Founded by French colonists in 1701, Detroit, Michigan is along the narrow Detroit River, across from Windsor, Ontario. These cities sit in an optimal location for communication and trade along the connected waterways of the Great Lakes paired with the dense forests in the land body of Michigan. The early French colonists contested with the Five Nations of the Iroquois over occupation of the land. Occupation by the French was driven by the fur trade, as produced within the wilderness of Lake St. Clair Watershed and beyond, as its location proved to be strategic for the fur trade as well as preventing British expansionism West. The monumental fur trade was sourced from the beaver, dependent on access to water and once thriving in the area, and later on the trade shifted to the waterfowl - meaning that the urbanism of the Lake St. Clair Watershed was established based on its healthy water system and the ecology of the region. The region is tied together through its water system, the watershed.
Within the Lake St. Clair Watershed, the coastline of the Detroit River established itself as a strategic location for the French, as the settlements on each side of the Detroit River essentially serve as a trading post and serves as a gateway North to Lake St. Clair and the remaining Great Lakes. Today, the passage still has the same purpose and has an extremely high frequency of use. There are several bridges and tunnels that connect US(Michigan) and Canada(Ontario), and are clustered around two metropolitan regions: Detroit/Windsor and Port Huron/Sarnia. These throughways are major conductor of trade for the US and Canada(Ontario) and provide a thousands number of jobs – influencing the labor market and therefore the economy immensely. 6 It is estimated that in 2019, the Michigan-Canada connections, including bridges, tunnels, and waterways
1. “Encyclopedia Of Detroit.” Detroit Historical Society - Where the past is present. Accessed March 25, 2020. https:// detroithistorical.org/learn/encyclopedia-ofdetroit/ribbon-farms.
2. Sadler, Richard Casey, and Lafreniere, Don J. “Racist Housing Practices as a Precursor to Uneven Neighborhood Change in a PostIndustrial City.” Original Articles. Housing Studies 32, no. 2 (17/2/2017): 186–208. doi:10. 1080/02673037.2016.1181724.
3. Sugrue, Thomas J. The Origins of the Urban Crisis: Race and Inequality in Postwar Detroit. Princeton: Princeton University Press, 2014.
Theories and Methods of Urban Design Winter 2020 A-328
Water is a human right and a public good. When we understand that every inch of land is a part of a watershed, we recognize that all the water that passes on the earth ends up in a larger body of water which is accessible and used by all.
Economic Indicators
It is estimated that in 2019, the Michigan-Canada connections, including bridges, tunnels, and waterways exported over half of the merchandise of international trade between the US and Canada. This means that out of the $292.6 Billion exported by the US to Canada, over $22.65 Billion worth of goods passed through Michigan connections. The Detroit River is crucial to the economy of both the region and the economies of both the US and Canada.
Environmental Indicators
In the context of Lake St. Clair, for the sake of this research, it is considered the largest watershed to be investigated. The Lake St. Clair Watershed is a Part of the Lake Erie Basin. Lake St. Clair is made up of seven sub-watersheds. Detroit’s boundary proper includes these three watersheds: Rouge, Detroit/St. Clair, and Clinton.
4. Redlinger, Savannah. “U-M Report Details Phosphorus Sources-Both Urban and Agricultural-in Detroit River Watershed.” University of Michigan News, May 14, 2019. https://news.umich.edu/u-m-reportdetails-phosphorus-sources-both-urban-andagricultural-in-detroit-river-watershed/.
5. Waldheim, Charles. “Landscape as Urbanism.” US: Princeton University Press, 16/2/2016.
6. Clement, Daniel, and Miguel Kanai. “The Detroit Future City: How Pervasive Neoliberal Urbanism Exacerbates Racialized Spatial Injustice.” American Behavioral Scientist 59, no. 3 (March 2015): 369–85. doi:10.1177/0002764214550306.
Lake St. Clair Watershed A-329
Geographical Delimitation United States of America (Michigan, Ohio) & Canada (Ontario) Area 15358.138 km2 Population 1,817,144
Indicators
Lake St Clair Watershed US & Canada [Critical DATA]
Social
exported over half of the merchandise of international trade between the US and Canada. This means that out of the $292.6 Billion exported by the US to Canada, over $22.65 Billion worth of goods passed through Michigan connections.12 The jobs supported by the international connection have influenced the regional and international economies beyond calculation. The Detroit River is crucial to the economy of both the region and the economies of both the US and Canada.
A Watershed, also often called a water basin, is a large body of water in which all the water runoff from surrounding sources end up. Every surface of land is a part of a watershed. A watershed usually contains a multitude of various sub-watersheds. It is important to include sub-watersheds into the understanding of watersheds because these smaller parts are the mechanics in which the greater watershed operates. Each sub-watershed acts as a tributary, or a source that feeds into a larger body of water. In the context of Lake St. Clair, for the sake of this research, it is considered the largest watershed to be investigated. The Lake St. Clair Watershed is a Part of the Lake Erie Basin. Lake St. Clair is made up of seven sub-watersheds, including the Lower Thames, Upper Thames, Sydenham, Rouge, Detroit/St Clair, Cedar Creek, and Clinton. Detroit’s boundary proper includes these three watersheds: Rouge, Detroit/St. Clair, and Clinton.
The current health of the water in the Lake St. Clair Watershed can threaten this economy of trade, but its current situation is not being taken seriously. Additionally, water-based recreation at Lake St. Clair accumulates $200 million on the Michigan side in a single year, but as climate change presses on serious effects can happen to the watershed, and therefore the economy and health of the region’s populations. 8 Climate change increases the frequency of major natural events, including heavy rainfall and flooding. These sorts of occurrences are likely in this region because of the high volume of water currently existing in the watershed, and the low-lying, relatively shallow slope of the watershed – water takes longer to drain.

Theories and Methods of Urban Design Winter 2020 A-330
7. Ewen, Lynda Ann. 1978. Corporate Power and Urban Crisis in Detroit. Princeton: Princeton University Press. Accessed March 26, 2020. ProQuest Ebook Central.
8. Schindler, Seth. “Detroit after Bankruptcy: A Case of Degrowth Machine Politics.” Urban Studies 53, no. 4 (March 2016): 818–36. doi:10.1177/0042098014563485.
Figure 01. Lake St. Clair water edge
TIMELINE : HISTORY, ACTORS AND EVENTS
Detroit must pay the EPA $1 Billion if the outfall problem is not resolved
Great Lakes Water Authority formed Detroit files for bankruptcy
Dan Gilbert of Quicken Loans develops downtown
Chrysler and GM declare bankruptcy
President Bush gives a provisional $17.4 billion bailout to GM and Chrysler.
General Motors buys Renaissance Center
Detroit People Mover is installed in the image of New Urbanism

Safe Drinking Water Act is established
Clean Water Act and Wetland Protection Act established
Beginning of river industrial clean-up begins in Detroit
Cuyahoga River in Cleveland, OH burns as result of careless industrial waste Detroit Resistance
Packard plant closed
Urban sprawl and white flight begin in Detroit
Detroit declared as “Arsenal of Democracy” by Franklin D. Roosevelt because of contributions made to WWII efforts

Economic Depression
Detroit Agricultural Committee is formed by Pingree, Detroit’s beginning as a Garden City
Fire in Detroit inspires a redesign of the city by Woodward
French Indian War ends
Detroit founded by French explorer, Antoine Laumet de La Mothe
Lake St. Clair Watershed A-331
1940 1950 1960 1701 1980 1990 2000 2010
1970 1972 1970s 1969 1967 1958 1950s 2022 2014 2013 2000s 1763 1893 1884 1805 1940s
1974 1987 1996
2009 2008 2025 2020 1850 1800 1700 1900
Figure 02. People mover
Figure 03. Detroit resistence
Figure 04. Arsenal of Democracy
Figure 05. Lake St. Clair water edge
02 RELEVANCE FROM THE POINT OF VIEW OF URBAN DESIGN THEORY AND PRAXIS

There are many metropolitan regions, cities, and towns included in the Lake St. Clair watershed, including Sarnia, Dearborn, Detroit, Windsor, ChathamKent, and London. These cities and their metro region all contribute to the same water source. The cities and towns within the watershed become crucial parts in a larger machine, the greater watershed. Understanding urban design as wheels in a greater operation, helps to expand the context of what is urban, and thinking of ways in which to use urban design as a tool for urban and regional health. Studying watersheds, a system of thinking around ecology strengthens around one of the key components of our existence – water.
Water is a human right and a public good. When we understand that every inch of land is a part of a watershed, we recognize that all the water that passes on the earth ends up in a larger body of water which is accessible and used by all. Urban design has the capacity to account for its inputs and outputs. Meaning design can influence how much is imported into the city, what is produced within the city, and what influences the labor market within the city and region. It also considers what is produced, goods that are improved from original sourcing, and then used within the region and exported beyond.
Lake St. Clair Watershed is an essential area in the conversation of urban design practice and theory for its identification of the “link”, both through built and natural environments, that tie us all together and what we depend on. The landscape is healing, both rurally and urban-ly throughout the Lake St. Clair Watershed. By identifying conditions of urbanisms, systems of thought, productions, corruptions, and functions may be exposed in order to be reevaluated within the context of a new framework. 7
Theories and Methods of Urban Design Winter 2020 A-332
Figure 06. Hilberseimer’s Decentralized City
Figure 07. Macob County aerial waterfront
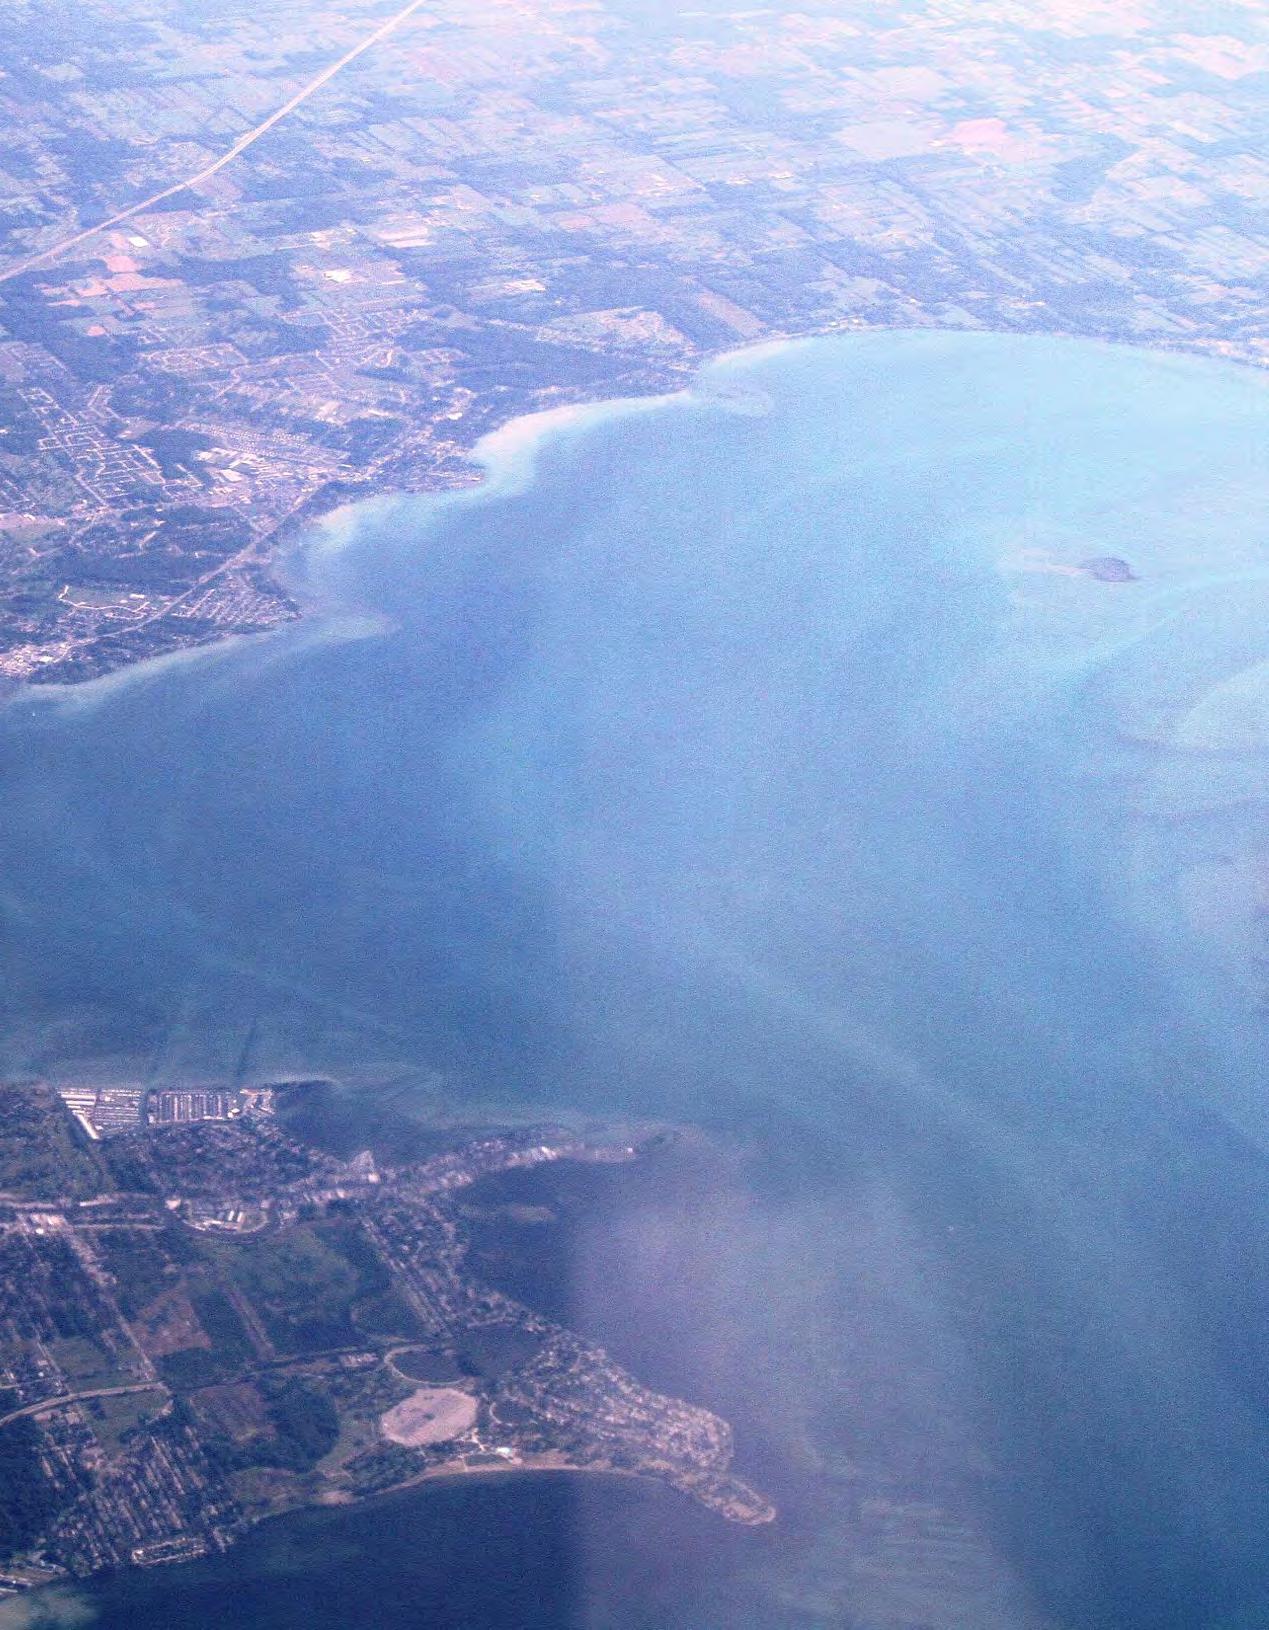 Lake St. Clair Watershed A-333
03 METHODS TO CONDUCT YOUR INVESTIGATION
Critical research and various methods of production will lead the conversation around the dissection of a set of three projects as responses and results from three different urbanisms. The projects and urbanisms are selected based on the current state of the region, Lake. St. Clair Watershed with the international connection between Michigan and Ontario, and the narratives that surround the contexts. The urbanism investigations are founded in capitalist practices and a society still existing today embedded in the urbanisms of the Lake St Clair watershed.
The research begins with a thorough literature review, looking at the region throughout time and through various perspectives. There is an in depth understanding of the formations of the Watershed through mapping studies. Relevant narratives around Detroit’s historic foundation and growth will be rooted in agrarian, infrastructure, and post-industrial accounts. Regarding these accounts, a variety of research methods will be used, spanning from written narratives to visual analysis. A method of mapping will be established for each account/project including an encompassing mapping and diagramming of taxonomies, regions, activated spaces, along with other strategies that each project may call for. These techniques account in which the project’s narrative is presented. It is important to identify intention and the history behind each project, as this informs its execution and better frames the effects. The urbanism projects and their narratives transcend into the politics, infrastructure, food systems, architecture, public spaces, housing, and the economy. There are narratives to be told through the lens of urbanisms and urban design representation in these projects.
In the account of post-industrial urbanism, in the context of the Detroit River waterfront in both Windsor and Detroit, there is an argument here behind the urban environment as a gateway, the condition of the waterfronts to exude strategy and dominance while contesting with the unflattering outfall problem occurring. In the account of infrastructure urbanism, the development and impact of suburbia is looked at with a critical eye, as the author’s hypothesis
Theories and Methods of Urban Design Winter 2020 A-334
Figure 08. Lake St. Clair and surrounding urbanisms
9. Sabourin, Claire. “Responding to the Detroit water crisis: the Great Lakes Water Authority and the City of Detroit.” Washington University Journal of Law & Policy 51 (2016): 305+. Gale General OneFile (accessed March 26, 2020). https://link-gale-com. proxy.lib.umich.edu/apps/doc/A477337834/ ITOF?u=umuser&sid=ITOF&xid=3488fb32.
10. ArcGIS Web Application. Accessed March 29, 2020. https://mdeq.maps. arcgis.com/apps/webappviewer/index. html?id=36c48f4a7d144c21a79291ba280cf50b.
11. “Global Logistics.” Detroit Regional Chamber. Accessed April 7, 2020. https://www. detroitchamber.com/econdev/data/industryclusters/global-logistics-2/.
12. “Lake St. Clair Coastal Habitat Assessment: with recommendations for conservation and restoration planning. PDF,” 2006.
stand that suburbia and built up infrastructure harms the watershed. Finaly, in the account of agrarian urbanism, the project will contain research methods that speak to a larger infrastructure of vacant land, ownership, and taxes, and the effects of these on the health and finances of watershed citizens all under the magnifier of water rights and food justice.
04 ANTICIPATED FINDINGS
There is a direct link between the quality of water in the watershed and by the industrialized cities. How do cities perpetuate the problems? Can it make it better? By tying into the history and present-day activity of agriculture, these systems of green infrastructure can restore value, quality, and as resistance to these larger institutions/infrastructures. The outcome of the investigation will hopefully prove a greater connection of the importance of water infrastructure, water rights, and water health. When water is prioritized, it will seep into every facet of the economy, into each person’s well being.
Both human and natural conditions have shaped and have been shaped the events listed below, referencing some major shifts in urbanisms. The shifts are embodied in the chosen projects. Their aesthetic qualities enhance the ideas they were founded in, the conversations around their presence are purposeful propaganda for their continuing existence. By absorbing the dense history and context of the Lake St. Clair Watershed, it appears that one of the most critical things here is the fact that many of the issues in the region are exacerbated by the fragmentation of political power and the lack of cooperation among municipal entities. 7
Lake
A-335
St. Clair Watershed

Theories and Methods of Urban Design Winter 2020 A-336
13. Millington, Nate. “Post‐Industrial Imaginaries: Nature, Representation and Ruin in Detroit, Michigan.” Article. International Journal of Urban and Regional Research 37, no. 1 (1/2013): 279–96. doi:10.1111/j.14682427.2012.01206.x.
14. King, Colby, and Crommelin, Laura. “A Different Perspective on Post-Industrial Labor Market Restructuring in Detroit and Pittsburgh.” Journal of Urban Affairs, 26/8/2019, 1–20. doi:10.1080/07352166.2019 .1645569.
WATERFRONTS OF DETROIT RIVER
[POST-INDUSTRIAL
URBANISM]
Detroit’s major legacy is industry. Situated in the Rust Belt Detroit has established itself as the pinnacle and nadir Manuel Moroun of what an industrial city can be. Throughout the history of Detroit, the focus of where industrial efforts have been focused has shifted. Known as a resilient city, a part of the legacy is Detroit’s ability to persevere, adapt, and thrive despite certain challenges. As noted in the timeline, in World War II the car manufacturing industry was the uphill towards success for Detroit, as well as its decline. For a hundred years, heavy industry occupied Detroit in the regional and urban sense. Heavy industry also inevitable fed into watershed with toxic runoff. 14
Location Year(s)
Status
Footprint
Designer
Additional Agents
Key Project Components Program(s)
Funding Streams
[Detroit, Michigan/USA, Windsor, Ontario/CANADA]
[1701-Present]
[Unbuilt / Partially Built / In Progress/ Built / Ephemeral / Demolished]
[60 miles of shoreline]
[So many]
[Trade, Recreation, industrial transportation]
[Maintenence, esthetic appeal]

[Bridges, tunnels, boating, driving, barging, trading]
[Both public and private]
Lake St. Clair Watershed A-337
Figure 09. Ambassador Bridge Figure 10. Figure-ground/Waterfronts discussed/Image made by author
THE WATERFRONTS AND POST-INDUSTRIAL URBANISM


The Ambassador Bridge, a bridge connecting Detroit and Windsor, is privately owned by Manuel Moroun, an American businessman. Built in 1929, the bridge has always and continues to charge tolls for Detroit city, as well as collecting profit. The bridge is accountable for approximately a quarter of the trade occurring on the boarder of Michigan and Ontario, serving as both a critical economic component to the urban form, specifically of Detroit and Windsor. When travelling via air, car, or boat, the Ambassador Bridge is one of the main conditions that define the landscape. When providing a necessary service yet collecting a profit and ultimately becoming a billionaire from the privilege of owning the bridge, there should be an expectation of maintenance and beautification that the bridge should provide. The United States and Canada have decided to build a new bridge. The Gordie Howe International Bridge will be finished construction in 2024 and will serve as another international connection from the US to Canada. There has been great opposition to the construction of the Gordie Howe Bridge by Manuel Moroun since it rivals his leverage in handling trade.
The Renaissance Center is the epitome of post-industrial attitudes in Downtown Detroit. Erected in 1977, the Renaissance Center is a massive development built by Ford Motor Company as a new headquarters. The impeding complex, towers quite literally over Detroit and is the most prominent structure on the shoreline. This is the ultimate manifestation of post-modern, postindustrial embodiment of power. Contributing to the greater representation of Detroit, no other building rivals the Renaissance Center along the U.S.’s coast of the Detroit River, its complex stands alone, impeding over the downtowners and those crossing the international border, coming into the country from Windsor, Ontario(Canada). The Renaissance Center was renovated in 2003 by several large name architecture and landscaping firms. It is reported that the renovation was a positive influence on Detroit’s economy at that time. The added infrastructure was sure to create jobs for some period of time, but its long-lasting effects are unclear.
15. Psarra, Sophia, Conrad Kickert, and Amanda Pluviano. 2013. “Paradigm Lost: Industrial and Post-Industrial Detroit - an Analysis of the Street Network and its Social and Economic Dimensions from 1796 to the Present.” Urban Design International 18 (4) (Winter): 257-281. doi:http://dx.doi.org.proxy. lib.umich.edu/10.1057/udi.2013.4. https:// proxy.lib.umich.edu/login?url=https:// search-proquest-com.proxy.lib.umich.edu/ docview/1444442673?accountid=14667.
16. Ryzewski, Krysta. “Detroit 139: Archaeology and the Future-Making of a Post- Industrial City.” Journal of Contemporary Archaeology 6, no. 1 (January 2019): 85–100. doi:10.1558/jca.33835.
Theories and Methods of Urban Design Winter 2020 A-338
Figure 11. Synthetic collage/Waterfront edges/Image made by author
Figure 12. Transect/Bridges and tunnels/Image made by author


 Lake St. Clair Watershed A-339
Figure 13. Cartography/Perverious and impervious/Image made by author
0 1
Figure 14. Taxonomy/Tunnel and bridges/ Image made by author
mile
THE WATERFRONTS AND POST-INDUSTRIAL URBANISM
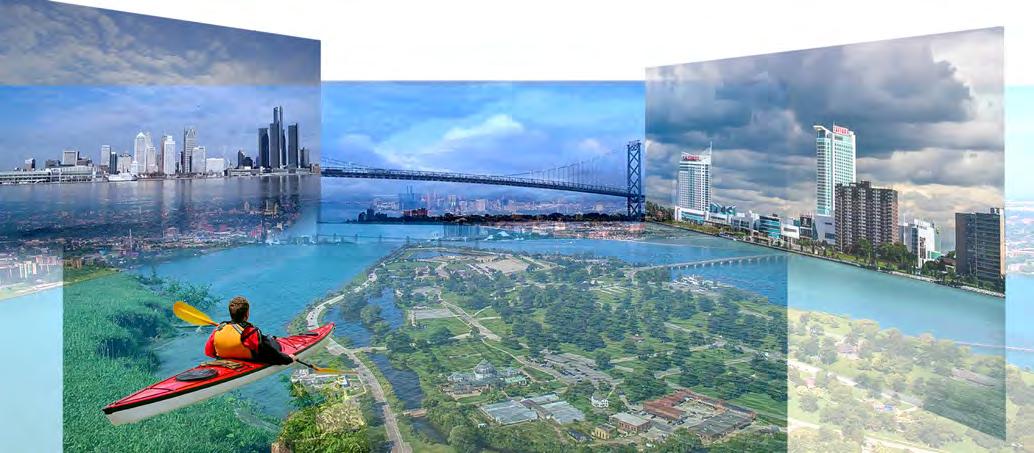
The post-industrial urban conditions are visible throughout all of Detroit, almost in every neighborhood and from every highway: homes, commercial corridors, factories, and industrial plants lay vacant. One may argue that the embodiment of post-industrial urbanisms is the presence of vacancy and even the gentrification of these vacant buildings into appropriated spaces. While these contribute to the state of Detroit, there is another perspective in which to understand post-industrial urbanisms, and that is the defiance of the postindustrial situation. This defiance can look many ways, one being a complete ignorance of the demise of industry; another is a revival of what there was before the demise; and a third is to look forward to identify the image that wants to be portrayed, something beyond and unrelated to heavy industry. 17
The esthetic qualities of the Detroit River passage are essential to its maintenance as well as the urban impression given upon citizens as well as tourists. When infrastructure in the light of post-industrial systems does not support existing industries, there is a decay of quality on the urban form. The Detroit River begins the journey into a new frontier and should be considered a gateway with intentional built conditions that honor the legacy of the industry and celebrates current industries.
17. Currans, Elizabeth. “Encountering Detroit: The Post-Industrial City as Stage.” Liminalities 14, no. 4 (October 2018): 1–24. http://search. ebscohost.com.proxy.lib.umich.edu/login.aspx? direct=true&db=ibh&AN=133754303&site=e host-live&scope=site.
18. Desiderio, Francis. “”A Catalyst for Downtown”: Detroit’s Renaissance Center.” Michigan Historical Review 35, no. 1 (2009): 83112. Accessed March 26, 2020. www.jstor.org/ stable/25652152.
19. Pinho, Kirk. 2018. “What does Detroit’s Renaissance Mean for the Renaissance Center?” Crain’s Detroit Business 34 (46) (Nov 19): 10. https://proxy.lib.umich.edu/login?url=https:// search-proquest-com.proxy.lib.umich.edu/ docview/2136612670?accountid=14667.
Theories and Methods of Urban Design Winter 2020 A-340
Figure 15. Actors and synthetic collage/Skylines, island, recreation/Image made by author


0 1 mile
Lake St. Clair Watershed A-341
Figure 16. Taxonomy/international means of transport/Image made by author
Figure 17. Actor/Renaissance Center/Image made by author
Figure 18. Cartography/Hardedged coastlines/Image made by author

Theories and Methods of Urban Design Winter 2020 A-342 0 1 mile
20. Yadan,
INFRASTRUCTURE TO
INFRASTRUCTURE--ADAPTABLE FUTURE ROADS IN AUTONOMOUS URBANISM.” Landscape Architecture Frontiers 7, no. 2 (2019): 92+. Gale Academic OneFile (accessed March 25, 2020). https:// link-gale-com.proxy.lib.umich.edu/apps/doc/ A598128834/
SUBURBIA IN THE WATERSHED [INFRASTRUCTURE URBANISM]
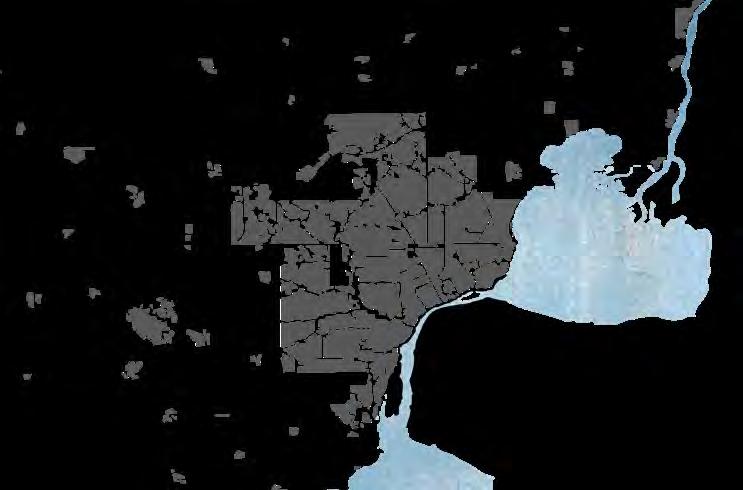
Green and blue infrastructure urban design relate to the greater conversation within the Lake St. Clair Watershed as a body of water reliant on sub-watersheds which maintains the health of all things in the region. Detroit within the Lake St. Clair Watershed is a city with heavy road and pavement infrastructure which renders the ground impermeable, which completely alters the role of Detroit in the Detroit/St. Clair (sub)watershed within the Lake St. Clair watershed. Implementing green and blue infrastructures aids in mending the impermeable surfaces, stimulating positive ecological maintenance, and promotes health of various species in the region. 20
Location Year(s)
Status
Footprint Designer
Additional Agents
Key Project Components Program(s)
Funding Streams
[Detroit, USA and Windsor, CANADA]
[1940-Present]
[Unbuilt / In Progress/ Built / Demolished]
[9986 sqm]
[N/A]
[White flight, infrastructure, industry, automobiles]
[Densification, reduction of infrastructure]
[Housing, mixed-use, operational, waste water treatment]
[Private]
Lake St. Clair Watershed A-343
Luo, Wang Ying, and Tina Tian. “FROM TRANSPORTATION
GREEN
Figure 19. Suburbia, Michigan Figure 20. Figure-ground/Urban and water/Image made by author
THE SUBURBIA AND INFRASTRUCTURE URBANISM

The infrastructure of suburbia within the Lake St. Clair Watershed is one of the main causes of expansion of these impermeable surfaces. There needs to be a decrease in paved surfaces, a reduction of vehicular housing, and a reduction of single-family housing built. The 1950s marked the beginning of white flight taking hold in Detroit. The causes of this run deep into the exploitative labor market and racially charged conversations of class and labor. White Flight is the phenomena of white citizen Detroiters moving out of Detroit, to the suburbs for primarily class distinction with supposed benefits of larger houses in privatized communities.1 In Figure 24, the decentralization of populations is clear, and this movement of populations is correlated with a less dense building planning methods, increasing surface area of built surfaces. There is a clear shift that is happening from urban Detroit to the surrounding areas, mainly suburban neighborhoods.
Decreasing the area of suburban infrastructures is relevant to the conversation around water rights and watershed health shifts the conversation to not only what does suburbia do socially, but what it produces. By producing more paved surfaces and increasing the use of cars produces more toxic runoff. While this is problematic in and of itself, the problem comes in as the responsibility of the Great Lakes Water Authority (GLWA) fails. 21 The more area the GLWA must process water for, the more likely the system will overflow, causing outfalls.

Theories and Methods of Urban Design Winter 2020 A-344
21. “Green Infrastructure Projects.” City of Detroit. Accessed March 25, 2020. https:// detroitmi.gov/departments/water-andsewerage-department/stormwater-managementand-drainage-charge/green-infrastructureprojects.
22. Matucheski, Claire, Julia Ruedig, Kristine Schantz, and Jacob Talbot. “Planet Blue.” Planet Blue. University of Michigan, 2014. http:// sustainability.umich.edu/media/files/dow/ Green-Infrastructure-Detroit.pdf.
Figure 21. Cartography/Sub-watersheds/Image made by author Figure 22. Transect/region of study/Image made by author


 Lake St. Clair Watershed A-345
Figure 23. Taxonomy/enablers and effects of suburbia/Image made by author
0 1
Figure 24. Cartography/Re-densification/Image made by author
mile
THE SUBURBIA AND INFRASTRUCTURE URBANISM
Outfalls are volumes of water that have bypassed the process used to clean the water and take out toxins. This means that water has the potential to be released directly to the Detroit River without being cleaned. 24 The outfall problem is exasperated by the combined sewage system, commonly present in Rust Belt cities, such as Detroit. The combined sewage treats runoff as well as domestic sewage – this volume is often overwhelming to the system and enables the outfalls. The outfall problem is clear in its detriment economically, socially, and environmentally. If the GLWA does not solve the outfall problem by 2022, $1 billion must be payed to the EPA. 12 For the health of residents of the watershed, both urban and non-urban, and for the habitat of the wetland, surface area of infrastructure must be reduced. Additionally, infrastructure can be damaged by the newfound climate change effects and connections; therefore, water is extending its impact into yet another realm of economy and labor. Responsibility by the GLWA needs to be claimed, as it needs to be able to handle outfall conditions for the safety of the watershed and the larger Lake Erie Watershed.
23. Benton-Short, Lisa, Melissa Keeley, and Jennifer Rowland. “Green Infrastructure, Green Space, and Sustainable Urbanism: Geography’s Important Role.” Urban Geography 40, no. 3 (2017): 330–51. https://doi.org/10.1080/02723 638.2017.1360105.

24. McElmurry, Shawn, Greg Holman, Khalil Ligon, and Valerie Strassberg. “Great Lakes Week 2015.” Great Lakes Week 2015. 3AD. https://www.youtube.com/ watch?v=h1d6TYB15zE&feahttps:// www.youtube.com/ watch?v=h1d6TYB15zE&feature=youtu. beture=youtu.be.
25. “Southeast Michigan Greenways.” The Greenway Collaborative. The Greenway Collaborative, Inc. Accessed March 25, 2020. https://greenwaycollab.com/projects/ southeast-michigan-greenways/#toggle-id-4.
Theories and Methods of Urban Design Winter 2020 A-346
Figure 25. Synthetic Collage/Transition - to and from/Image made by author
 Figure 26. Actors/Suburban homes and space/ Image made by author
0 1
Lake St. Clair Watershed A-347
mile

Theories and Methods of Urban Design Winter 2020 A-348
26. Dickson, James David. 2017. “The Detroit River Renaissance.” Planning 83 (11) (12): 32-36. https://proxy.lib.umich.edu/login?url=https:// search-proquest-com.proxy.lib.umich.edu/ docview/1976408153?accountid=14667.
27. Dunnigan, Brian Leigh. “Detroit’s ribbon farms: ‘their way of Settlment is much more plaisant & less convenient than ours’.” Michigan History Magazine, March-April
2013, 54+. Gale General OneFile (accessed March 23, 2020). https://link-gale-com. proxy.lib.umich.edu/apps/doc/A319975274/ ITOF?u=umuser&sid=ITOF&xid=75f2c8d6.
FOOD JUSTICE AND WATER RIGHTS AT MUFI [AGRARIAN URBANISM]
The current state of the coastline and block conditions in Detroit and along all coast lines that are considered a part of the Lake St. Clair Watershed, were informed by the Ribbon Farms. Ribbon farms, perpendicular to the Detroit River, were very narrow plots of land maximized space to grow and slope to drain. The history of their formation is key to understanding agrarian urbanism of Detroit today. In their original state, ribbon farms allowed natural waterflow and maximized access to the Detroit River.27 Ribbon Farms were established in Detroit by French Canadians and have influenced the urban form of Detroit and Windsor to this day.

Location Year(s)
Status
Footprint Designer
Additional Agents
Key Project Components Program(s)
Funding Streams
[Detroit, USA]
[1884-Present]
[Partially Built / In Progress/ Built]
[3017 sqm]
[Community members]
[Farmers, community members, markets, shoppers, growers]
[Food rights, food justice, water rights, water justice, ]
[Farming, community gathering, activity, exercise]
[Both public and private]
Lake St. Clair Watershed A-349
Figure 27. Ribbon Farms
Figure 28. Figure-ground/green network/Image made by author
THE FOOD JUSTICE AND WATER RIGHTS AND AGRARIAN URBANISM


Founded in trade and forestry, the attitude of the region to sustain is founded in agricultural principles and networks. Agrarian Urbanism has been present in Detroit since its foundation, inherently linked to the food system, this approach to existing has been supported by many that moved north for refuge from Jim Crow laws. The food system of Detroit is very dynamic, but also comes with a lot of systemic issues, often stemming from the charged context of Detroit. Affordable, healthy food is a privilege in many parts of Detroit. With limited access to public transportation for most Detroiters, this can prohibit their access to the necessity. Agrarian Urbanism in the context of trade and labor of Detroit, situated in a key location to perform valuable trade and gain access to water. It is strange to think that now, even when most land by area is for agriculture, it is the second largest industry to recreation in the region, not including trade industry. 28
The Michigan Urban Farming Initiative (MUFI) is an urban farm in Detroit that pulls together these inequities from the linked systems of infrastructure (green and blue infrastructures; systems of transportation; and the economic labor market). MUFI’s director has occupied city owned land, without permits or written/approved permissions, however they continue to generate revenue. As well, on certain days, the farm gives out free vegetables. At first this may seem like a nice gesture, but Detroiters are in fact paying for this food; it also changes the system of dependency, meaning people rely on this daily food, yet it can be at the expense of themselves. Instead of investment going to markets, where accessible, healthy, affordable (and subsidized) food is, those in need of affordable/ subsidized food must go to MUFI. As a name, Michigan Urban Farming Initiative implies that it itself is taking an initiative and founding the concept of urban farming in Michigan. By staking this claim, they are diminishing all the southern influences of food and labor surrounding agriculture. In Detroit specifically, the idea of urban farming began with Pingree’s potato patches which revolutionized growing and producing in an urban context. There is well over 1,000 urban farms in Detroit operating productively, sustainably, legally, and ethically; MUFI is not the only farm producing food and making an impact on the community. 30
28. Waldheim, Charles. “Notes Toward a History of Agrarian Urbanism.” Places Journal, November 1, 2010. https://placesjournal.org/ article/history-of-agrarian-urbanism/.
29. Shuman, M.H. Economic Impact of Localizing Detroit’s Food System. Fair Food Foundation, 2007 fairfoodnetwork.org
30. Pothukuchi, K. 2015. “Five Decades of Community Food Planning in Detroit: City and Grassroots, Growth and Equity.” Journal of Planning Education and Research no.35(4) : 419 434. doi:10.1177/0739456x15586630.
Theories and Methods of Urban Design Winter 2020 A-350
Figure 29. Taxonomy/Watershed functions/Image made by author
Figure 30. Taxonomy/Projective green network/Image made by author
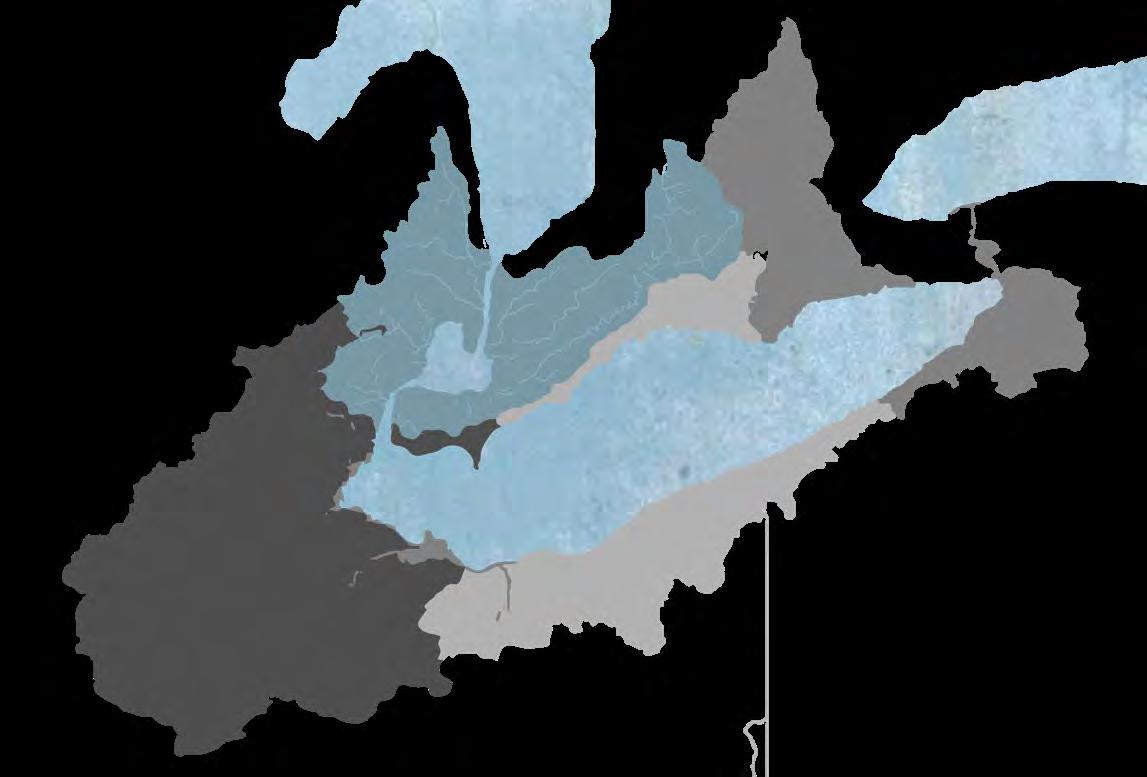


 Lake St. Clair Watershed A-351
Figure 27. Cartography/Watershed context/Image made by author
Figure 31. Actors/Water intake and outfall/Image made by author
Figure 32. Transect/Water sources/Image made by author 0 1 mile
THE FOOD JUSTICE AND WATER RIGHTS AND AGRARIAN URBANISM
Detroit’s recent history of bankruptcy should be called into question, as well as how it is continues to be handled. The GLWA services the area including MUFI. This begs the question, is MUFI getting water and producing runoff and not contributing financially? MUFI is capitalizing on their g ood actions for the exploitations of services by the city. This is specifically how Detroiters are being exploited and affecting the larger economy. By not having their own water processing system, runoff is being sent to the city to process for free and contributing to potential outfalls. Overall, a celebration of the agricultural roots in the Lake St. Clair Watershed should produce healthy relationships between the city, GLWA, and farmers in the interest of a equitable watershed for all.

Theories and Methods of Urban Design Winter 2020 A-352
Figure 33. Synthetic collage/Watering the lake/Image made by author

0 1
Figure 34. Threatening taxonomy/Waterjugs for purchase/Image made by author Lake St. Clair Watershed A-353
mile
MEDELLIN METROPOLITAN AREA COLOMBIA
01 IDENTIFICATION OF THE TERRITORY AND LOCATION
The Aburrá Valley Metropolitan Area is the second most populated urban agglomeration in Colombia with 4 million inhabitants distributed in ten municipalities. Medellín, the capital of the Antioquia Department, has become well-known in recent years by its miraculous urban transformation.
Medellín’s metropolitan area grew from 350,000 inhabitants to 3 million as people fled into the city from violence in rural Colombia during the 1950s and the 1990s. The rural migrants settled in the city’s periphery, where cheap land was available, and quickly developed into informal settlements. Nowadays, 30 percent of the city’s territory accommodates 90 percent of the population. Nearly 80 percent of about 600,000 households lack adequate access to formal jobs and facilities in the city’s central area.1
The Aburrá Valley faces intense risks due to landslides and flooding due to the local influence of El Niño. The deforestation caused by the construction of informal dwellings has severely diminished the soil’s capacity against natural disasters, living informal dwellers overexposed to the impacts of those natural episodes. Apart from these issues, the Medellín River is highly polluted due to industrialization and intense anthropization. The infrastructural capacity as a result of socio-economic interplay is reinforcing the existing disparities.
The tension between human activities and environmental characteristics is magnified in the land of Medellín where settlement density is tenfold of the rest 9 municipalities through the course of urbanization, so are the social unrests that stem from the rampant expansion. A thorough research in the field Medellín is to analyze the Aburrá Valley under microscope with a more focused and foreseeing lens.
1. “Medellín: Introduction.” MedellínIntroduction. Graduate School of Design, Harvard University. Accessed January 22, 2020. https://urbandesignprize.gsd.harvard.edu/ porto-medellin/medellin/.
2. Coupé, Françoise. “IN-Between Metropolitan Strategies Programme Interview #6 | Medellin, Colombia.” INTA, n.d. https://inta-aivn. org/en/481-inta/activitities/exchange/ roundtables/20122013-inbetween/1686metropolitan-medellin-en.
3. Smith, Alex Warnock. “Story of Cities #42: Medellín Escapes Grip of Drug Lord to Embrace Radical Urbanism.” The Guardian. May 13, 2016. https://www.theguardian. com/cities/2016/may/13/story-citiespablo-escobar-inclusive-urbanism-medellincolombia?CMP=share_btn_link.
Theories and Methods of Urban Design Winter 2020 A-354
[Critical DATA]
Geographical Delimitation
The capital of the department of Antioquia. It is located in the Aburrá Valley, a central region of the Andes Mountains in South America.
Area
1152 km²
Population
3.73 million [as of 2018]
Social Indicators
Self-built settlements are an important conceptual, political and socio-spatial category because of their global scale and the fact that there has been an increase in the absolute numbers of slum dwellers over the past 24 years, from 791 million in 2000 to 881 million in 2014 (UN-Habitat, 2016: 57–58). Attention to self-built settlements in the context of resilience and adaptation planning is critical because of the long trajectories of displacement, relocation, vulnerability to new evictions and unsecure land tenure that their residents often face
Economic Indicators
During the 19th century, Medellín was a dynamic commercial center, first exporting gold, then producing and exporting coffee. Medellín is important to the region for its universities, academies, commerce, industry, science, health services, flower
Environmental Indicators
Cities confronted with unsustainable development and climatic changes are increasingly turning to green infrastructure as an approach for growth and climate risk management. Green infrastructure interventions produce or exacerbate urban socio-spatial inequities in self-built settlements
4. Echeverri, Alejandro. “Slums Are Growing around the World—but a City in Colombia Has a Solution.” QUARTZ, September 25, 2018. https://qz.com/1381146/slums-are-growingaround-the-world-but-a-city-in-colombia-has-asolution/.
5. Ed, Vulliamy. Medellín, Colombia: reinventing the world’s most dangerous city. 9 June 2013, The Guardian
6. Gandy, Matthew. the fabric of space: water, modernity, and the urban imagination. 2014, The MIT Press
Medellin Metropolitan Area A-355
Medellín Metropolitan COLOMBIA
Figure 01. World map
4. In 1982, Escobar launched his “Medellín Without Slums” programme – a politically motivated but nonetheless heartfelt campaign to rid the city of its slums and provide a “life of noble dignity” for the urban poor. WarnockSmith, Alex. “Story of Cities #42: Medellín Escapes Grip of Drug Lord to Embrace Radical Urbanism.” The Guardian. Guardian News and Media, May 13, 2016. https:// www.theguardian.com/cities/2016/may/13/ story-cities-pablo-escobar-inclusive-urbanismmedellin-colombia?CMP=share_btn_link.

5. ibid
6. Mumford, Eric. The CIAM Discourse on Urbanism 1928-1960. Cambridge, MA: MIT Press, 2002.
7. Harvey, David. “The Right to the City.” The Emancipatory City?: Paradoxes and Possibilities, n.d., 236–39. https://doi. org/10.4135/9781446221365.n15.
8. Romero, Simon. “Mayor of Medellín Brings Architecture to the People.” The New York Times. The New York Times, July 15, 2007. https://www.nytimes.com/2007/07/15/world/ americas/15iht-colombia.1.6660612.html.
9. Maclean, Kate,. “Social Urbanism and the Politics of Violence : The Medellín Miracle.” Book. Basingstoke, Hampshire, UK ; New York, NY : Palgrave Macmillan, 2014.
02 RELEVANCE FROM THE POINT OF VIEW OF URBAN DESIGN THEORY AND PRAXIS
With its infamous history of social inequity, violence, and drug cartels, Medellín was not a safe haven for the urban poor prior to its recent urban transformation. Drug lord Pablo Escobar’s “Medellin without slums”4 campaign radicalized the inequality issues into civic violent opposition5, yet grounding an environment for the informal dwellers to have a voice. At the time of his death in December 1993, the city came to a point of hope in desperation. According to Ortiz, “1991 was a key turning point for the whole country. It was the worst and the best moment – a time of complete crisis and a moment of hope.”4
Since the wake of 21th Century1901, social sustainability has become a collective agenda and main driver for a series of public investment. The term Social Urbanism has been used to describe the urban strategies undertaken by the Medellín municipality in terms of administration, programming, and shaping the future imagination. Learning from the Barcelona Model, the mode of participatory governance characterizes the regeneration process. Inviting people into the process of urban transformation is nothing new: the “linking of architectural form with positive urban social change”6 ties back the CIAM X time. In the case of Medellín, the part that triggers people’s inspiration and pride is that the exercise of future urban imagination casts focus on people who have remained deliberately ignored or invisible under “the astonishing pace and scale of urbanization over the last hundred years”7. Under this new approach, a large part of the government’s agenda aims to focus on the informal settlements or “comunas” facing the most spatial and material inequalities. As Mayor Fajardo put it,“our most beautiful buildings must be in our poorest areas,” 8 delineating the actions in the urban transformation process. The story of Medellín centers around the interplay of drug cartels and the succeeding government, politics and urban form, and urban poor and formal citizens, to exemplify how policies and projects are initiated incubated and enacted “in a context of extreme violence, inequality, exclusion, and informality.”9
Theories and Methods of Urban Design Winter 2020 A-356
Figure 02. “Today Medellin feels new-born. It helps that the setting is gorgeous”
1990
The winner of the Biennial Lee Kuan Yew World City Prize, which is awarded by the Singapore government
31 Flagship projects by Medellín’s mayor Aníbal Gaviria
The “Integral Urban Projects” (PUIs) – “projects that incorporate multiple programs simultaneously, from transport to landscaping, from street lighting to cultural centres” – implemented, highly dependent on a set of national and local political enabling factors
Election mayor Sergio Fajardo
1982
Mayor Luis Perez initiated a process that was for the majority carried out during the term of mayor Farjado
1974
The government was at the point of collapse as well as the economy. Consejeria also proposed the Integrated Slum Upgrading Program of Medellin–PRIMED “Pacification” campaign as a response to urban violence
Escobar launched his “Medellín Without Slums” programme – a politically motivated but nonetheless heartfelt campaign to rid the city of its slums and provide a “life of noble dignity” for the urban poor who, in Escobar’s words, had been living in an “inferno of garbage”.
Giving more autonomy to the individual republics
1950
As the population of Medellín grew quickly during the 1950s, industrialists, traders and local government created the “Medellín Master Plan” (MMP) (Plan Piloto), a plan for the expansion of the city into the Aburrá Valley that would lead to the creation of the first metropolitan area in Colombia.
1900
1899
Arrival of the railroad and the predominance of Medellín increased as coffee production became more important and permitted the country to enter the world economy.
The Thousand Days War (1899–1902) stopped the industrial development of the city, Under reforms by President Rafael Reyes after the conflict, the city continued its industrial development.
Medellín was proclaimed capital of the Department of Antioquia
Medellín was founded by Spain by francisco de Herrera Campuzano
Medellin Metropolitan Area A-357 1820 1850 1900 1950 1616 1980 1990 2000 TIMELINE : HISTORY, ACTORS AND EVENTS 1970 2012 2016 2004 2000 2020 2010 1600 1826
The political and ideological issues went surprisingly smoothly when compared to the unsettling issues in the urban periphery and the over-domesticated Medellín River. Urban expansion ousted the city’s capacity for providing basic living infrastructure, high land price drove newcomers to settle in the mountains far away from education and employment, and unreachable for public transportation. To some extent, the geographical condition in the Aburrá Valley contributes to the segregation where the slope has made it impossible to commute via public transportation. The lack of proper education in the periphery cut people’s chances in finding a job and results in the deficient infrastructure and facilities due to insufficient tax revenue form a vicious cycle. Since the industrialization of the valley, the Medellín River has been a backbone for the city’s prosperity but also a most degraded environment. Intense construction and uncontrolled waste disposal deprive the river of its natural characteristics. Besides its natural identity, the river plays a pivotal role in citizens’ life socially, economically, environmentally and psychologically. Medellín River is a drainage canals for industrial waste and human waste collected by its tributes, and the impacts of pollution in the Medellín River extend beyond the Medellín Metropolitan Area as the river runs 104 km through the Aburrá Valley.
However, “to leave nature alone is also to leave poverty and injustice unchanged”10 solving the problems demands more than an individual’s effort in caring for the environment, “for the city of the future, the concept of the balanced stable and diverse city ecosystem needs to be recognized as a goal and planned in both strategic and detailed policies.” 11 The issues in Medellín without any doubt call for “a deep concern with landscape’s conceptual scope”, and “the capacity to theorize sites, territories, ecosystems, networks, and infrastructures, and to organize large urban fields.”12
03 METHODS TO CONDUCT YOUR INVESTIGATION
Through the development of geographical and demographic mapping, I will illustrate the urban structure, the patterns of urban expansion, and the distribution of inequality, fear and violence affecting the urban realm. A review of existing
10. Gandy, Matthew. The Fabric of Space: Water, Modernity, and the Urban Imagination. Cambridge, MA: The MIT Press, 2017. p3
11. ibid
12. Corner, James. Terra Fluxus. Princeton. Princeton architctural Press. 2006.
13. Maclean, Kate,. “Social Urbanism and the Politics of Violence : The Medellín Miracle.” Book. Basingstoke, Hampshire, UK ; New York, NY : Palgrave Macmillan, 2014.
14. Turok, Ivan, Ivan Turok, Ivan TurokGuest Author, Carlos Amato, Carlos Amato, Carlos Amato, George Ogola, et al. “Medellín’s ‘Social Urbanism’ a Model for City Transformation.” The Mail & Guardian, May 15, 2014. https:// mg.co.za/article/2014-05-15-citys-socialurbanism-offers-a-model/.
15. On the ‘Medellin Miracle’ and the ‘Social Urbanism’ Model by Cosima Malandrino | Oct 11, 2017 | The Urban Media Lab

Theories and Methods of Urban Design Winter 2020 A-358
Figure 03. Colourful Comuna 13
16. Echeverri, Alejandro. “Slums Are Growing around the World—but a City in Colombia Has a Solution.” QUARTZ, September 25, 2018. https://qz.com/1381146/slums-are-growingaround-the-world-but-a-city-in-colombia-has-asolution/.

17. Ed, Vulliamy. Medellín, Colombia: reinventing the world’s most dangerous city. 9 June 2013, The Guardian
city government’s policies and regulations will enable me to further sharpen the understanding of the integrated project methodology. Through a case study approach of government interventions at municipal and regional levels, I will further dive into the impact of site specific interventions in the actual or projected remaking of place. In these cases, I will pay special attention to the financial mechanisms and implementation strategies.
05 ANTICIPATED FINDINGS
In the following sections, I will give an introduction of three projects: the Metrocable, the Circumvent Garden, and The River That Is Not. The three projects will be discussed in the contexts of different types of urbanism they indicate, together with the adjustments that deviate from conventional approaches to fit in the socio-economic background of Medellín. The case of the Metrocable will be accessed based on how well the system is doing in reconciling the division of city center and the peripheries. The mechanism of the catalytic impact of cable car station on shaping and fostering community life shall be under study. In the case of the Circumvent Garden, I will mainly look at its performance on leashing the urban expansion, the greater ambition projected by the city municipalities, the sustainability of project in terms of environmental influence and programming strategy, and the civic engagement that this project promotes. In the last project The River That Is Not, which is part of design competition formulated by the city government, the role of design competition in the city transformation process and in broadcasting the city image to the world will be under discussion. The choice between this project by LCLA and prize winning proposal undoubtedly shows the imagination of the city government and the direction for urban development for the decades to come. By the analysis of three projects with its situational approach in the city, I hope to build up a framework to think about the question whether the impact of these projects that contribute to the “Medellín Miracle” is overexaggerated in the course of city branding competition.
Medellin Metropolitan Area A-359

Theories and Methods of Urban Design Winter 2020 A-360 0 1 mile residential J J K K L H M M commercial station metro line metrocable line planned metrocable line
Figure 04. Map of Medellin land use and metro system
15. Brand, Peter. Dávila, Julio. Aerial cable-car systems for public transport in low-income urban areas: lessons from Medellin, Colombia. 4-8 July 2011, World Planning Schools Congress, Perth, Western Australia
16. Dávila, Julio. Daste, Diana. Medellín’s aerial cable-cars: social inclusion and reduced emissions. 2012, Development Planning Unit, University College London
17. “TransMiCable.” Wikipedia. Wikimedia Foundation, October 16, 2019. https:// en.wikipedia.org/wiki/TransMiCable.
18. “Metro Cable.” U. Accessed April 21, 2020. http://u-tt.com/project/metro-cable/.
THE METROCABLE [INFRASTRUCTURE / SOCIAL URBANISM]
The metrocable spatial strategy is self-explanatory in its intention to increase mobility between the highly inaccessible slums in the steep hills. The division of the informal settlements in Medellín is, to a large extent, caused by the physical location in relationship with the steep topography. Inhabitants spent several hours walking to work or school because the hills are too steep for buses to climb. The Metrocable sets a model for transportation in hilly regions and has been adopted in many cities, for instance, the TransMiCable17 implemented by the city of Bogotá, Colombia, and the Metro Cable18 in Caracas of Venezuela.
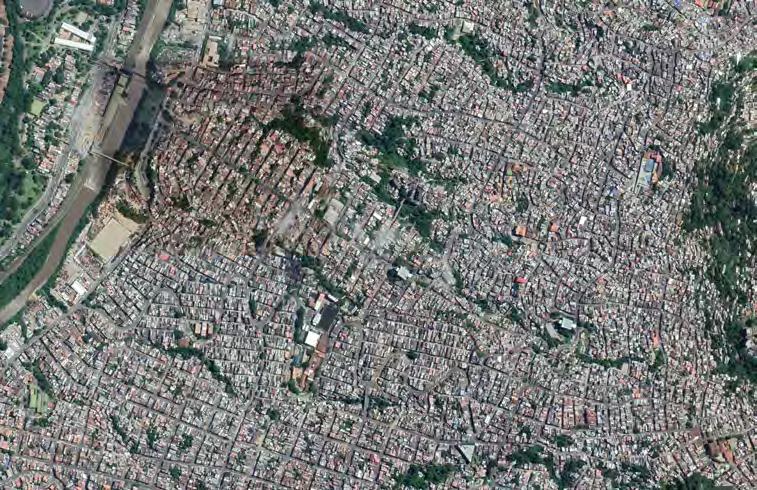
Location Year(s)
Status
Footprint
Designer
Additional Agents
Key Project Components Program(s)
Funding Streams
[Medellín, COLOMBIA]
[2010]
[Built]
[4 lines, Linea J, Linea K, Linea H, Linea L]
[City Council of Medellín]
[City Council of Medellín, Medellin Metro]
[Public service, Promoting mobility, Connectivity, Eroding the boundary of formal and informal areas]
[City services, Commuting, Public space]
[City budget, Energy company EPM]
Medellin Metropolitan Area A-361
Figure 05. Aerial map of line K line L
THE METROCABLE AND THE SOCIAL URBANISM
The inequality between the formal and informal city has been a major cause of social violence. Better connecting marginalized communities across the city is the way to advance social mobility and revitalize the periphery of Medellín. The Metrocable project is one of the first few attempts to ease the socio-political tension that dates back to Escobar time. To minimize the negative impacts of introducing new public bus routes and the displacement of residents, Metro de Medellín proposed a cable car system that incorporated plug-in joints to host community activities.
All three projects analysed here can be discussed under the term Social Urbanism given their nature of participatory governance, a focus on social sustainability, and the large scale of impact. The initiation of the Metrocable project is a response to the asymmetry between central area and urban fringes. Space, in the case of Medellín, does not “reflect” but “expresses” the socio-economic urban geography (income, zoning, building population density...). At the same time, geographical attributes (mountain slope, land cover, etc.…) “ is a fundamental dimension of society, inseparable from the overall processes of social organization and social change.” 19 Before the implementation of the cable lines, the city organised a group of investigators into communities in informal areas collecting citizens’ concerns with living conditions inviting the informal dwellers’ participation into the transformation process. Inaccessibility to city center was the major issue, along with the movability within comunas. The objective is a collective decision, whereas the designing and overall implementation would call for the government’s larger scope into the city. Through the agency of mapping of overlaying demographic information and the cable routes, the relative location of commercial and residential land uses, it is clear that the layout of the Metrocable system manifests the interplay of demographic economy and geography.

Theories and Methods of Urban Design Winter 2020 A-362
19. Castells, Manuel. “Space of Flows, Space of Places: Materials for a Theory of Urbanism in the Information Age.” In Comparative Planning Cultures, 1/1/2012. doi:10.4324/9780203826508.
Figure 06. Imgae of Metrocable structural pole and squares

Medellin Metropolitan Area A-363 station station
Figure 07. Figure-ground map with contour lines and sectional drawing near line L and line K
THE METROCABLE AND THE INFRASTRUCTURE URBANISM
Infrastructure is “the built world of connections”20. There are four lines of metro cable together with the metro system bridging the conversation of the peripheries and the central city area. Three of them, Linea J, Linea K, and Linea H, are commuting lines; one of them, Linea L, connects residents to Parque Arvi, a large green space located on the outskirts. The metrocable system exerts connection at two scales. One is by fabricating the interaction between the urban fringes and the central area, the other is by inserting acupunctural urban intervention into the neighborhoods associated to the stops. The cable station and structural poles are integrated with catalytic public spaces to host activities. The introduction of this highly visible infrastructure is a way to vitalize the neighborhoods and to reduce violence.
20. Belanger, Pierre. “Landscape As Infrastructure.” Landscape Journal 28, no. 1 (1/1/2009): 79–95. doi:10.3368/lj.28.1.79.

21. Dale, Steven. “MEDELLIN/CARACAS, PART 3.” SCJ Alliance, March 14, 2010. http://gondolaproject.com/2010/03/14/ medellincaracas-part-3/.
22. “A Sustained Commitment to Transformation.” SCJ Alliance. Accessed March 24, 2020. https://www.clc.gov.sg/docs/defaultsource/urban-solutions/urb-sol-iss-9-pdfs/cityfocus-medellin.pdf.
Theories and Methods of Urban Design Winter 2020 A-364
1.pole square
4. station 2. cabel car 3. lighting pole
Figure 08. Taxonomy of Metrocable

Medellin Metropolitan Area A-365 0 1/10 mile 0 1 mile J J K K L H H M M L very low low high very high highest
Figure 09. Map of Medellin population density and metro system
THE METROCABLE AND THE INFRASTRUCTURE URBANISM

This project is government funded and socio-politically oriented, it plays a pivotal part in the city branding campaign. Beside the economic catalytic effects that it has brought to the city in attracting foreign investment, individual citizens are the beneficiaries in many aspects. Seeing through the cable line users are empowered with a sense of dignity and appreciation for both the formal and informal urban environment. The metrocable has become no.1 tourist attraction, the incentive role generates revenue and promotes resident-owned businesses along the routes. Despite the uplifting stories, the acupunctural effect on each stop might inevitably migrates the asymmetry inside the entire city to a microscale one inside the comunas.

Theories and Methods of Urban Design Winter 2020 A-366
1.pole square
4. station 2. cabel car
3. lighting pole
Figure 10. Zoomtional drawing of Metrocable line and station
Figure 11. Diagram of Metrocable project actors

Medellin
Metropolitan Area A-367
Figure 12. Metrocable collage drawing

Theories and Methods of Urban Design Winter 2020 A-368 0 1 mile circumvent garden observatory greenland road
Figure 13. Map of Medellin transportation and garden system
23. Zone 3 - Center east, Commune 8 - Villa Hermosa.
Esteban Fernández Vázquez; Fernando Rubiera Morollón (11 January 2013). Defining the Spatial Scale in Modern Regional Analysis: New Challenges from Data at Local Level. Springer Science & Business Media. p. 240. ISBN 978-3642-31994-5.
24. A Greenbelt Plan to contain urban expansion, manage growth, reduce risks, and preserve and enhance the green hill areas. Barrows, Lissa, Lingjun Bu, And Ellis Calvin.
“Growth Management in Medellin, Colombia.”
AICP Student Project Awards. AICP. Accessed April 21, 2020. https://planning-org-uploadedmedia.s3.amazonaws.com/document/AICPStudent-Project-Awards-2016-ColumbiaReport-rev.pdf.
Location Year(s) Status
Footprint Designer
Additional Agents
Key Project Components Program(s)
Funding Streams
JARDIN CIRCUNVALAR DE MEDELLÍN [ECOLOGICAL / LANDSCAPE URBANISM]
The Circumvent Garden in Comuna 823 addresses environmental, ecological, and socio-economical considerations driven by uncontrolled urban expansion due to the influx of migrants. Natural episodes of flooding and hill sliding in the watershed of the Aburrá Valley further exacerbate this situation. As the pilot project of the Greenbelt Plan24 pin down by Medellín’s mayor Aníbal Gaviria (2012–2015), this project focuses on urban and environmental sustainability.

Jorge Alberto Pérez Jaramillo, Medellín’s Director of Planning from 2012 to 2015 stated that “it is not possible to solve informalities with formal procedures, so we found new ways to intervene with a re-urbanization methodology.” Given the intertwining co-relationship of the built and natural environment, the Circumvent Garden Project offers an integrated approach.
[Medellín Aburra Valley, COLOMBIA]
[2012]
[Built]
[75 kilometer-long park]
[Alejandro Echeverri]
[Empresa de Desarrollo Urbano (EDU), City authority]
[Restrict urban sprawl, Nature reservation, Activity vitalize city, Sequestering carbon emissions]
[Footpaths, Farming Sites, Sport, Eco-gardens, Environmental classrooms, Bike path system, Risk mitigation actions, Environmental reforestation]
[Public, Energy company EPM]
Medellin Metropolitan Area A-369
Figure 14. Aerial map of the Circumvent Garden and Comuna 8
THE CIRCUMVENT GARDEN AND THE LANDSCAPE URBANISM
The shifting of land use from forest to housing decreases the land’s resilience against natural disasters. As the mayor Gaviria acknowledged, “we are a city of mountains, and many of our citizens live in informal settlements in parts of the mountains. This is a problem because sometimes we have landslides and people are killed.26” In this regard, the importance of the green belt is the balance of quality of life for metropolitan residents and the restoration and protection of the natural elements. Moreover, the garden works as a barrier against unregulated urban expansion that may exacerbate the inequality between formal and informal areas.

“Live, ecological systems can be designed as infrastructures that shape contemporary urban economies.”28
The circumvent garden exemplifies and magnifies the capacity of green in actively shaping and directing urbanization not just by planting trees. This garden aims to barricade the uncontrolled urban expansion in Medellín where the infrastructure system has lagged behind urbanex pansion, causing issues like segregation and social imbalance. In order to get there, other than plants, designers invite the agency of people with programming and porous forms to the surrounding neighborhoods. The circumvent garden also connects to the cable car system for better accessibility.
25. Cheong, Koon Hean. Seeking a Better Urban Future. Singapore: World Scientific Publishing Co. Pte. Ltd., 2019.
26. Mega, Voula. Eco-Responsible Cities and the Global Ocean: Geostrategic Shifts and the Sustainability Trilemma. Berlin: Springer, 2019.
27. Zapata, Johana Betancur. “En El Jardín Circunvalar También Hay Espacio Para Los Mercados Agroecológicos.” ElPalpitar.com, March 15, 2016. http://www.elpalpitar.com/ medellin-2/2016/03/en-el-jardin-circunvalartambien-hay-espacio-para-los-mercadosagroecologicos/.
28. Belanger, Pierre. “Landscape As Infrastructure.” Landscape Journal 28, no. 1 (1/1/2009): 79–95. doi:10.3368/lj.28.1.79.
Theories and Methods of Urban Design Winter 2020 A-370
Figure 15. Bird-eye view from observatory in the Circumvent Garden

Medellin Metropolitan Area A-371 sports field farmland path 0 1/4 mile
Figure 16. Figure-ground drawing of the Circumvent garden
THE CIRCUMVENT GARDEN AND THE LANDSCAPE URBANISM
The programming strategy is an integrated approach toward community engagement and public amenities that vitalize social life. Being part of the Comuna Improvement Plan31, the Circumvent Garden is more of an active contributor than a static spatial component. Prior to the construction, a team of engineers and social workers have been negotiating the possible eviction and the relocational job lose. They came up with practical plans that assail the life of affected families. As a response, the project introduces programs within the garden that create jobs for comuna dwellers and the activities promote local products. As an example, the agroecological markets seed and advance agriculture in this area. The project initiates a broad palette of recreational and environmental activities appealing to a wide range of demographic groups. There is also equipment for water and forest protection as well as farmland as active participation in environmental restoration.
29. Maclean, K. (2015). Social Urbanism and the Politics of Violence: The Medellín Miracle. London: Palgrave Macmillan UK.
30. Anguelovski, Isabelle & Irazabal, Clara & Connolly, James. (2018). Grabbed Urban Landscapes: Socio-spatial Tensions in Green Infrastructure Planning in Medellín: GRABBED URBAN LANDSCAPES. International Journal of Urban and Regional Research. 43. 10.1111/1468-2427.12725.
31. “Develop a more comprehensive and just Approach to growth management by Bolstering the role of the community in A public-community partnership.” Barrows, Lissa, Lingjun Bu, And Ellis Calvin.

Theories and Methods of Urban Design Winter 2020 A-372
1.observataory
4. stairecase
2. participatory farm
5. farm
6. path
7. recreation field
3. sports field
Figure 17. Taxonomy of the Circumvent Garden

Medellin Metropolitan Area A-373 0 1/10
mile
4. stairecase
6. path
3. sports field
Figure 18. Sectional drawing of one path in the Circumvent Garden
THE METROCABLE AND THE INFRASTRUCTURE URBANISM
Similar to the Metrocable, the Circumvent Garden is the result of tremendous governmental investment and collective efforts. As such, it is subject to political will and unfortunately, it is now put on halt. Current mayor Federico Gutiérrez Zuluaga made the decision to redirect the resource to the Medellín River Park project (Proyecto del Rio)30 which will be discussed in the next section. While these two park projects share an ambition of city green branding, they cater very different constituencies, the urban poor in the periphery and the formal city in the center. The current city leadership leaned towards the latter.

Theories and Methods of Urban Design Winter 2020 A-374
32. Sheila R. Foster, Urban Informality as a Commons Dilemma, 40 U. Miami Inter-Am. L. Rev. 261 (2009)
Figure 19. Diagram of the Circumvent Garden actors
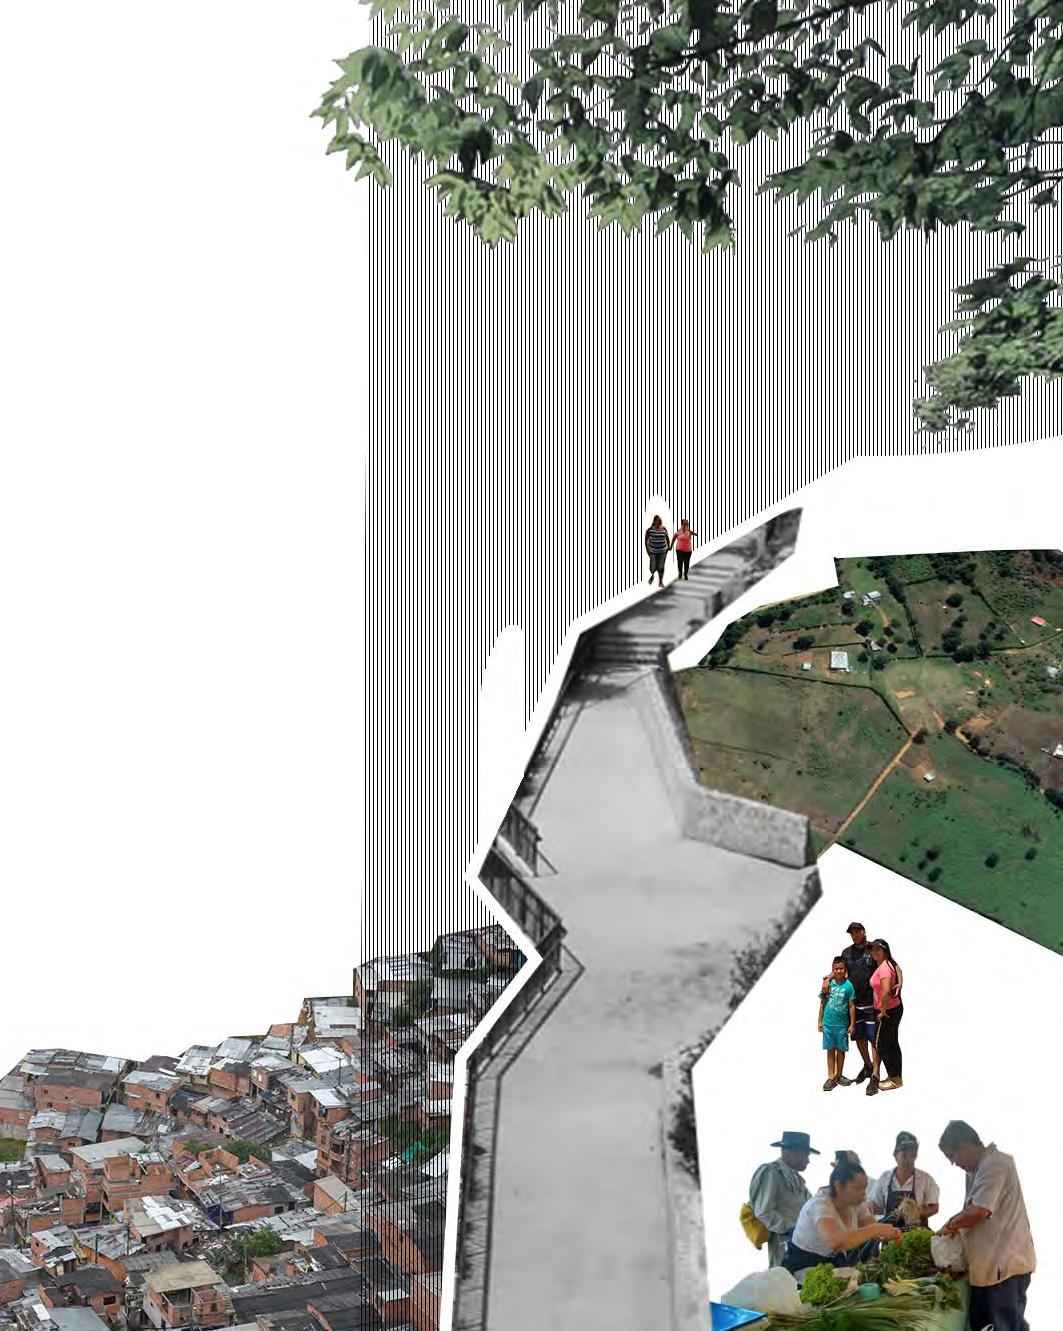
Medellin
Metropolitan Area A-375
Figure 20. Collage drawing of the Circumvent Garden
University of Antioquia
Cerro El Volador Natural Park
National University of Colombia at Medellín

public library
Plaza de Toros La Macarena
Nutibara Hill
Industriales station
Santa Fe Zoo
Politecnico Colombiano Jaime Isaza Cadavid
Institución Educativa Inem
José Félix De Restrepo
University EAFIT industrial commercial
Ayurá Station
San Fernando plant
Theories and Methods of Urban Design Winter 2020 A-376 0 1 mile recreational cultural equipment
Puente Madre Laura
Puente del Mico
Figure 21. Map of Medellin land use and river system
HISTORIA CRITICA. BOGOTA: UNIV LOS ANDES, FAC CIENCIAS SOC, 1/2017. doi:10.7440/ histcrit63.2017.09.
THE RIVER THAT IS NOT [VISIONARY URBANISM]

23, 2020. https://www. luiscallejas.com/MEDELLIN-The-river-thatis-not.
Location
Year(s)
Status
Footprint Designer
Additional Agents
Key Project Components Program(s)
Funding Streams
“The river that is not” is an entry for the Medellín River Park competition. This proposal is not a fixed set of components aiming to be constructed, but a provocative process that has the capacity to reshape the social and environmental attributes of an urban river. The Medellin River has undergone irreversible pollution due to intense urbanization and industrialization. Instead of spending the money on the impossible mission of re-naturalization, this proposal initiates a process to claim public occupation as well as environmental remediation at the river-stream joints.The River That Is Not is composed of regional plan for the river bank and catalytically programmatic buildings on the river which they refer as “territorial impact buildings”. The objective of this project is to restructure the urban fabric by implementing a series of long-term localized interventions based on their specific conditions and potentiality that will be further explored in correspondence with focal points along the project .
[Medellín River, COUNTRY]
[2013 competition]
[Short list]
[The entire river and riverfront areas]
[LCLA office + Agenda]
[City council of Medellín]
[River corridor to restructure a diverse public space, Remediation of water and biological species]
[Parks, Sports, Remediation of industrial lots, Economic zone, Real estate, Education]
[City budget]
Medellin Metropolitan Area A-377
33. Sanchez-Calderon, V. “Channeling to Be Industrialized. The Domestication of the Medellin River in the First Half of the XX Century.” Book Review.
34. MEDELLIN / The river that is not - LCLA office. Accessed January
Figure 22. Aerial map of line K line L
THE RIVER THAT IS NOT AND THE VISIONARY URBANISM
Visionary as it is, the proposal is committed to action. The idea is grounded in meticulous observation and objective assessment of the current river conditions in terms of eco-diversity, eco-capacity, and civic engagement. The proposal redirects the future river imaginaries from re-naturalization to civic attraction given the fact that human domestication has caused irreversible changes to the river. The implementation takes a long period of commitment, yet is totally practicable. However, the unconventional thinking against renaturalizion of the Medellín River calls for a daring decision.
Apart from “territorial impact architectures” on the river, the project The River That is Not operates beyond the Medellín River and has a series of economic environmental and social considerations on the riverbank. Based on the current condition, the project consists of four major regional focuses: South Section for sowing, Central Section 1 between Ayurá station and Industriales station remedical development of industrial land and real estate, Central Section 2 between metro industrial station and the Mico bridge as major metropolitan commercial zone, North Section as “city dormitory”. These interventions are built on a tight collaboration with environmental quality, economic potentiality, and social indicator, as well as with a time component. For instance, Central Section 1 has a combined urban condition (figure 21) of preponderant industrial use on the west side and an educational corridor with potential creative industry development on the east side. Major acts involve utilization of existing resources, improvement/remediation of environmental condition, introduction of soft transportation, and increment of real estate value. Accordingly, the “territorial impact architectures” are pools, playgrounds, and bicycle rents that facilitate the realization of the regional goal.
36.Parques Del Río: A Guide to Medellín’s River Parks. (2020, January 19). Retrieved from https://medellinguru.com/parques-del-rio/

Theories and Methods of Urban Design Winter 2020 A-378
35. 2 Architects 10 Questions on Program Rem Koolhaas + Bernard Tschumi. PRAXIS 8
Figure 23. Sectional perspective drawing of intervention near Ayurá Station
Kindergarden + Playground
North Library
Pool+Hotel
Treatment Palns IV
Garden + Cultural Facilities
Playground+Treatment
Kindergarden
Treatment Palns III

Soccer Fields
Garden Museum
Open Air Cinema
Amrket Bridge
Treatment Plant
Kindergarden
Tennis Courts
East West Pools
Garden Bridge
Bycicle Rent III
Bycicle Rent III
Bycicle Rent II
Bycicle Rent
Divin Pools
Playground + Treatment Plant
Cafe + Bridge
Kindergarden
Competition Pools
Greenhouse Bridge
Greenhouse
Cross Playground
Pool + Strands
Medellin Metropolitan Area A-379
Pools
Figure 24. Figure-ground drawing of The River That Is Not
THE RIVER THAT IS NOT AND THE VISIONARY URBANISM

Zooming into the focal points, the proposal claims its consistency in reciprocity to surrounding programs. Designers’ ambition for programming is doubtlessly place-based and a magnet to invite citizens out. Continuity in The River That Is Not is hinted and implied as “not the continuity of the planned, efficient, and legitimated city, but of the flows, the energies, the rhythms established by the passing of time and the loss of limits.” 37

The OHL winning entry in the competition proposed a continuous botanical public space focusing on environmental sustainability and mobility. The outcome is a seven-lane road and a civic education goal with cultivation of native species and a systematic park network throughout the city.31 While largely enjoyed by citizens, compared with LCLA’s proposal, it lacks the strong imagination of the very river park as a beacon of urban sustainability.
38. image https://www.luiscallejas.com/filter/ territorial/MEDELLIN-The-river-that-is-not
39. “On the ‘Medellin Miracle’ and the ‘Social Urbanism’ Model.” LabGov, October 11, 2017. https://labgov.city/theurbanmedialab/onthe-medellin-miracle-and-the-social-urbanismmodel/.
Theories and Methods of Urban Design Winter 2020 A-380
37. de Solà-Morales, I. (1995). Terrain Vague. In C. Davidson (Ed.). Anyplace (pp. 118–123). Cambridge, MA: MIT Press.
Figure 25. Sectional and plan drawing of The River That Is Not focal points
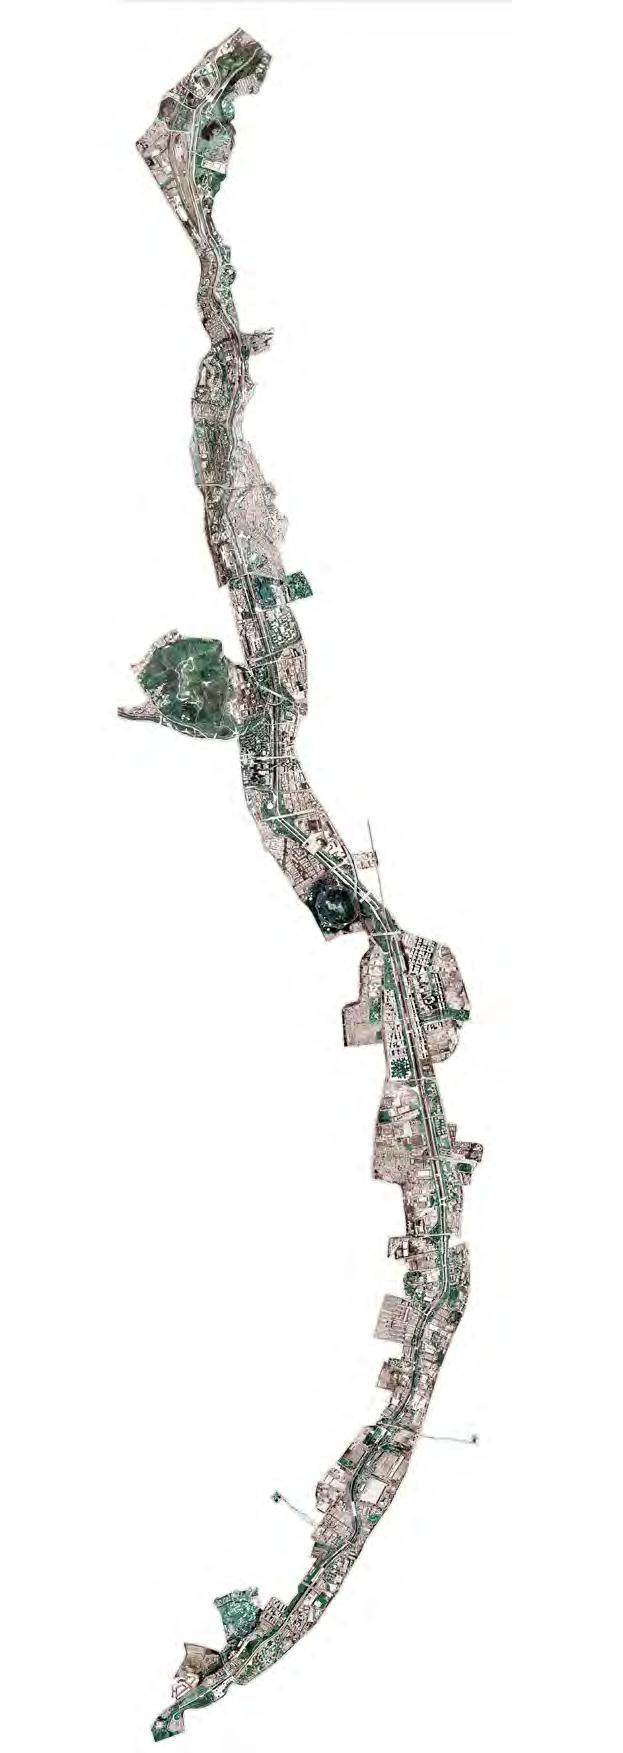
Medellin Metropolitan Area A-381 0 1
mile
Figure 26. Master plan of The River That Is Not


Theories and Methods of Urban Design Winter 2020 A-382
Figure 28. “Territorial Impact Buildings” of The River That Is Not
Figure 27. Diagram of The River That Is Not actors

Medellin Metropolitan Area A-383
Figure 29. Collage drawing of The River That Is Not
SOUTH AMERICAN INFRASTRUCTURAL INTEGRATION
01 IDENTIFICATION OF THE TERRITORY AND LOCATION
South America is one of the seven continents, with many countries and abundant natural resources. South America continent has the Andes Mountains to the west, the plateau to the east, and the plains to the middle, including the Amazon forest and basins.
South America covers an area of 17.84 million square kilometers, accounting for 3.5% of the Earth’s surface and 12% of the total land area. Countries in South America include Brazil, Colombia, Argentina, Peru, Venezuela, Chile, Ecuador, Bolivia, Paraguay, Uruguay, Guyana, Suriname, French Guiana, Falkland Islands, and South Georgia and South Sandwich Islands. South America had a population of 380 million, ranking fifth in the world.
02 RELEVANCE FROM THE POINT OF VIEW OF URBAN DESIGN THEORY AND PRAXIS
In the early stages of the development of South American countries, markets and development usually existed within national borders, and infrastructure sometimes failed to fully connect and cover different regions of the same country. Cross-country competition and hostility have broken infrastructure between countries. However, as the social environment became more stable and with the development of globalization, countries gradually realized the market expansion and huge benefits that would be brought about by the establishment of transnational infrastructure1. The cross-country construction of roads, railways and energy in South America began to be gradually implemented, bringing the countries into a common market and profoundly affecting the development of South America. For example, on the basis of the booming international trade and the convenience of transportation, people, goods, and raw materials can all flow more efficiently on the South American continent2 .
Theories and Methods of Urban Design Winter 2020 A-384
1. Tanzi, Vito. Building regional infrastructure in Latin America (Working Paper IECI= Documento de Trabajo SITI; n. 10). Vol. 10. BID-INTAL, 2005.
2. Kessides, Ioannis. Reforming infrastructure: Privatization, regulation, and competition. The World Bank, 2004.
3. Van Dijck, Pitou. The impact of the IIRSA road infrastructure programme on Amazonia. Routledge, 2013.
[Critical DATA]
Geographical Delimitation
The South American Continent is located in the souther hemisphere, between the coordinates 34 ° 46 ‘west longitude, 7 ° 09’ south latitude, 71 ° 18 ‘south longitude, 53 ° 54’ south latitude, 81 ° 20 ‘west longitude, 4 ° 41’ south latitude, 71 ° 40 ‘north longitude and 12 ° 28’ north latitude. To the east is the Atlantic Ocean, to the west is the South Pacific, and to the north is largely surrounded by the Caribbean Sea.
Area 17,840,000 km²
Population
380 million [as of 2010]
Economic Indicators
South America has diverse environmental resources, and the existing countries are all developing countries. Brazil and Argentina are the most developed countries. The industrial structures of countries in South America are relatively single, with a low degree of industrialization and relying heavily on the export of goods such as agriculture, animal husbandry and mining to develop their economies. Such an economic structure has resulted in many cities serving a single population and purpose, such as many mining cities in Chile.
Environmental Indicators
For South America, the most serious problem is the destruction of forests by development. Whether it is the demand for logs, the reclamation of farmland or the construction of infrastructure, it has greatly reduced the forest coverage in South America. Since 1970, South America has lost 20% of its forests, about 800,000 square kilometers. Such sustained damage has catastrophic consequences for the global ecological environment.
SOUTH AMERICAN INFRASTRUCTURAL INTEGRATION
South America A-385
4. Oporto, Graciela, Av Paseo Colón, Ángela Guariglia, and Subsecretaría de Planificación Territorial. “Initiative for the Integration of Regional Infrastructure in South-America (IIRSA).” (2005).
5. Kanai, J. Miguel. “The pervasiveness of neoliberal territorial design: Cross-border infrastructure planning in South America since the introduction of IIRSA.” Geoforum 69 (2016): 160-170.
South America has a large-scale infrastructure system that is rare in the world and cities that have emerged along with it. At the same time, large-scale construction and environmental conflicts are present on this land. Therefore, the research on infrastructure integration in South America can help to understand the impact of large infrastructure on the city and its surrounding natural environment.
I selected three case studies to illustrate the different impacts of South American infrastructure construction on this land.
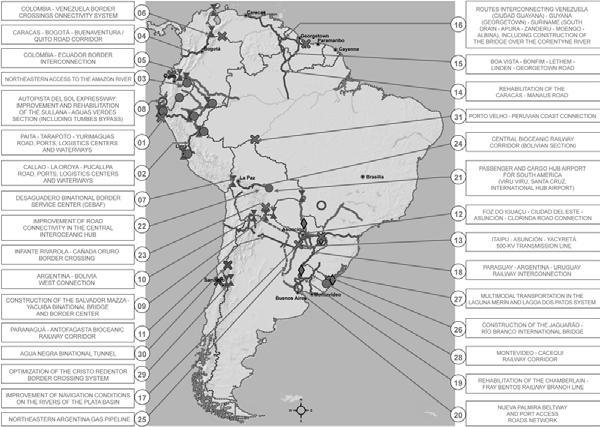

The first one is IIRSA. The Initiative for the Integration of the Regional Infrastructure of South America (IIRSA) is a development plan to link South America’s economies through new transportation, energy, and telecommunications projects. This project gives more connectivity and opportunities to the areas covered, and also promotes new urban development. The IIRSA project was developed by the Union of South American Nations that once comprised twelve South American countries aiming to build a common market and infrastructure system of South America3. Also, the Mercosur(the Southern Common Market) established in 1991 Rely on this infrastructure system to achieve efficient and massive transactions and transportation5
However, according to Tim Killeen, a scientist of Conservation International, in his book A Perfect Storm in the Amazon Wilderness, the construction of roads and railways in current IIRSA plans could lead to the destruction of the Amazon rainforest and have profound and far-reaching consequences6
This gives us another perspective to think about the relationship between urban design and urban planning and the natural environment. How to balance development and environment is a question worth considering.
Another type worth studying is those cities formed by resource extraction and large infrastructural energy construction. For example, Chile’s mining towns and the towns created for the construction of hydropower stations. The unprecedented development of infrastructure has provided better transportation
Theories and Methods of Urban Design Winter 2020 A-386
6. Killeen, Timothy J. “A perfect storm in the Amazon wilderness.” Adv. Appl. Biodivers. Sci 7 (2007): 102.
7. Moreira, Mauricio Mesquita. “IIRSA economic fundamentals.” ITD/INT, InterAmerican Development Bank, Aug (2006).
Figure 01. South American Infrastructure Distribution and Data, LATERAL OFFICE
The AIIB has approved six Latin American countries’ accession applications to achieve greater development.
China and Argentina issued a joint statement that Argentina participates in China’s “Belt and Road” plan.

The IIRSA approved by the “South American Infrastructure and Planning Commission” of the Association of South American Nations included 581 projects with a total investment of approximately 191.4 billion U.S. dollars. There are 259 highway projects with an investment of approximately 63.7 billion US dollars; 61 railway projects with an investment of approximately 47.9 billion US dollars; 25 power station projects with investment The amount is about 46.9 billion US dollars.
China-Latin America Community Forum established.
IIRSA was included into South America Infrastructure and Planning Commission.
Petrocaribe was founded. It is an oil alliance involving Caribbean member states. The alliance was founded on 69 June 2005 in Puerto La Cruz, Venezuela, Venezuela offering the other member states oil supplies based on a concessionary financial agreement.

Indicative regional planning of South America Infrastructure was made.

Southern Common Market is established.
Dutch Guiana (Suriname) breaks away from colonial rule and gains independence.
British Guiana gains independence from colonial rule.
10 nationally independent nations have been established.
South America is no longer colonized by Portugal and Spain.
At the end of the 16th century, British, French, and Dutch settlers fought fiercely to separate Guyana and some offshore islands; since then, the entire continent of South America has entered a period of 300 years of colonial rule.

Portugal colonized Brazil, and Spain colonized much of South America, except Brazil.

America A-387
South
is proposed. 1850 1990 2000 2015 2016 2017
IIRSA plan
TIMELINE : HISTORY, ACTORS AND EVENTS 2010 2011 2014 1810 1826 1966 1975 1991
2003 2005
2018 1700
Figure 02-07. Events description image
conditions and connectivity with other regions for the traditional mining industry in South America7. Therefore, the development of the mining industry has been greatly stimulated, and a number of distinctive mining towns have been born8. They are usually located near the mining area and highways. The transportation of the collected ore and external supplies are transported through the road infrastructure. The rich water resources in South America have also enabled countries to establish a series of hydropower projects. The construction of such infrastructure has a great influence on the surrounding areas, and sometimes even small towns are built to support such large construction.
I believe that the study of infrastructure integration in South America is very helpful and important to understand urban design and planning from a macro perspective, so I chose this territory as my research object.
03 METHODS TO CONDUCT YOUR INVESTIGATION
In order to obtain relevant data for the road construction and resource mining of the IIRSA project, I intend to collect it from the IIRSA official website and authoritative data sources such as the World Bank and then process it through data analysis software such as GIS and SPSS.
I will find bibliographic references from papers and related books that can be found in library or online.
Visual analysis is also essential. I am going to use historical satellite maps to compare and find out the construction process of different parts of the IIRSA project and the urban development process in the region. Such resources are available in Google Earth.

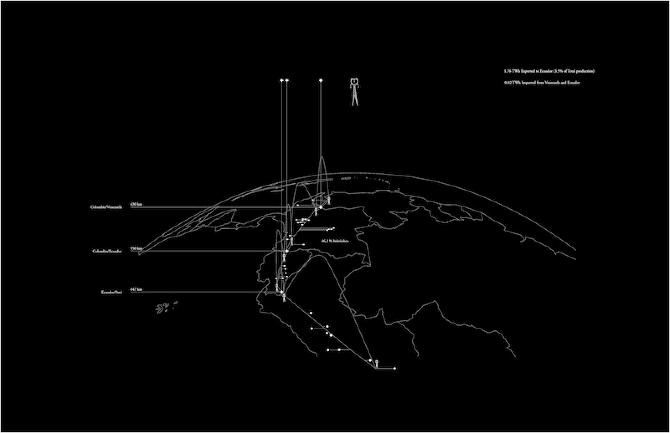
Theories and Methods of Urban Design Winter 2020 A-388
Figure 08-11. Distribution of South America infrastructure projects, LCLAOFFICE Luis Callejas Landscape Urbanism Architecture
8. Moreira, Mauricio Mesquita. “Trade costs and the economic fundamentals of the Initiative for Integration of Regional Infrastructure in South America (IIRSA).” INTAL-ITD Working Paper 30 (2007): 39.
05 ANTICIPATED FINDINGS

In this paper, I will study three cases, Panamerican Highway, Maria Elena and Vila Piloto.
The first is an infrastructure project that spans the entire South America. Through it, I want to explore how such projects shape the urban space and natural environment along the line, and how we should maintain the relationship between the two.

The second and third cases are small towns built for infrastructure-related reasons with specific purpose and simple functions. They exist by relying on large infrastructure in South America, such as the Pan American Highway and hydropower stations. I will explore how the spatial form and functional structure of these small cities are shaped by large infrastructures, and how these urban built-up areas are transformed into new type of cities after completing the initial mission of their design.
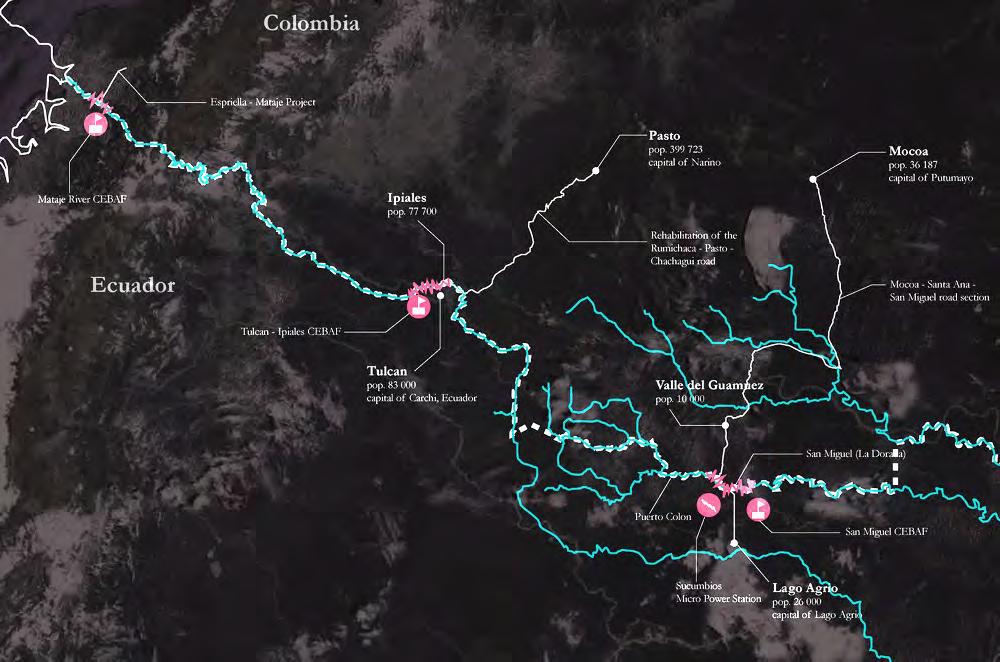
South America A-389

0 500 mile Theories and Methods of Urban Design Winter 2020 A-390
Location Year(s) Status
Footprint Designer
Key Project Components Program(s)
Funding Streams
PAN-AMERICAN HIGHWAY [INFRASTRUCTURE URBANISM]

The Pan-American Highway is a network of roads stretching across the American continents and measuring about 30,000 kilometers (19,000 mi) in total length. Except for a rainforest break of approximately 106 km (70 mi), called the Darién Gap, the roads link almost all of the Pacific coastal countries of the Americas in a connected highway system9. According to Guinness World Records, the Pan-American Highway is the world’s longest “motorable road”. However, because of the Darién Gap, it is not possible to cross between South America and Central America with conventional highway vehicles. Without an all-terrain vehicle, it is necessary to safely circumnavigate this terrestrial stretch by sea.
The establishment of the Pan-American Highway has brought great development to the cities along the route. However, during its construction, it caused great damage to South American ecosystems such as the Amazon jungle. Pitou Van Dijck said in his book The impact of the IIRSA road infrastructure programme on Amazonia, “This is an initiative that envisages the construction of highways through these jungles and the facilitation of access to territories and natural resources.”
[The South America Continent]
[1950]
[Built]
[30,000 kilometres(19,000 mi)]
[Pan-American Conference]
[Colombia and Venezuela; Peru, Ecuador, Chile, Argentina and Paraguay; Brazil and Uruguay; Guyana, Suriname and French Guyana]
[Highway system]
[Public]
South America A-391
9. Rutkow, Eric. The Longest Line on the Map: The United States, the Pan-American Highway, and the Quest to Link the Americas. Scribner, 2019.
PAN-AMERICA HIGHWAY AND INFRASTRUCTURE URBANISM
The history of the Pan-America Highway can be traced back to 1923. In order to facilitate the convenient passage of roads between countries in South America, the idea of building the “Pan American Highway” was proposed at the Fifth International Conference of American States in 1923. In 1925, the first meeting was held in Buenos Aires. A Pan American Highway Conference and the Pan American Peace Consolidation Conference signed the Pan American Highway Agreement in 193610. Mexico was the first Latin American country to complete the construction of a domestic highway. As a rare-scale infrastructure in human history, the Pan-America Highway passes through and connects 18 countries, including 9 countries in South America. It is also the longest highway in the Guinness Book of Records. Within South America, the major cities that the Pan-American Highway passes through are Panama City, Cali, Quito, Lima, Antofagasta, Valpalaiso, Quellon, Buenos Aires, and Ushuaia.

In fact, the Pan-America Highway is not fully connected, and the Pan American Highway is divided in half by the marshland and jungle of approximately 100 kilometers between Darién Gap, Panama and Colombia. Although many countries in history have tried to build this highway, many reasons such as environmental protection, respect for local culture, and prevention of disease transmission have not been achieved11
However, in any case, the Pan-American Highway has actually strengthened the links between countries. Under this infrastructure system, trade, cargo transportation, and personnel mobility have become more convenient and faster. At the same time, it has also led to the rapid development of industry, tourism and logistics. Many small and medium-sized new cities have also emerged on both sides of the Pan-American Highway. These cities provide services for the entire large highway system and enjoy the resources and opportunities brought by the Pan-American Highway. Plan on the right shows a section of the Pan American Highway in Chile. The town grows along both sides of the highway, providing functions such as industrial transportation, basic housing and storage.
Theories and Methods of Urban Design Winter 2020 A-392
10. Ficek, Rosa E. “Imperial routes, national networks and regional projects in the PanAmerican Highway, 1884–1977.” The Journal of Transport History 37, no. 2 (2016): 129-154.
11. Ficek, Rosa Elena. The Pan American Highway: An ethnogrpahy of Latin American integration. University of California, Santa Cruz, 2014.
Figure 14. Trucking transportation on Pan-America Highway
Figure 15. Transect of Pan-America Highway section in Chile

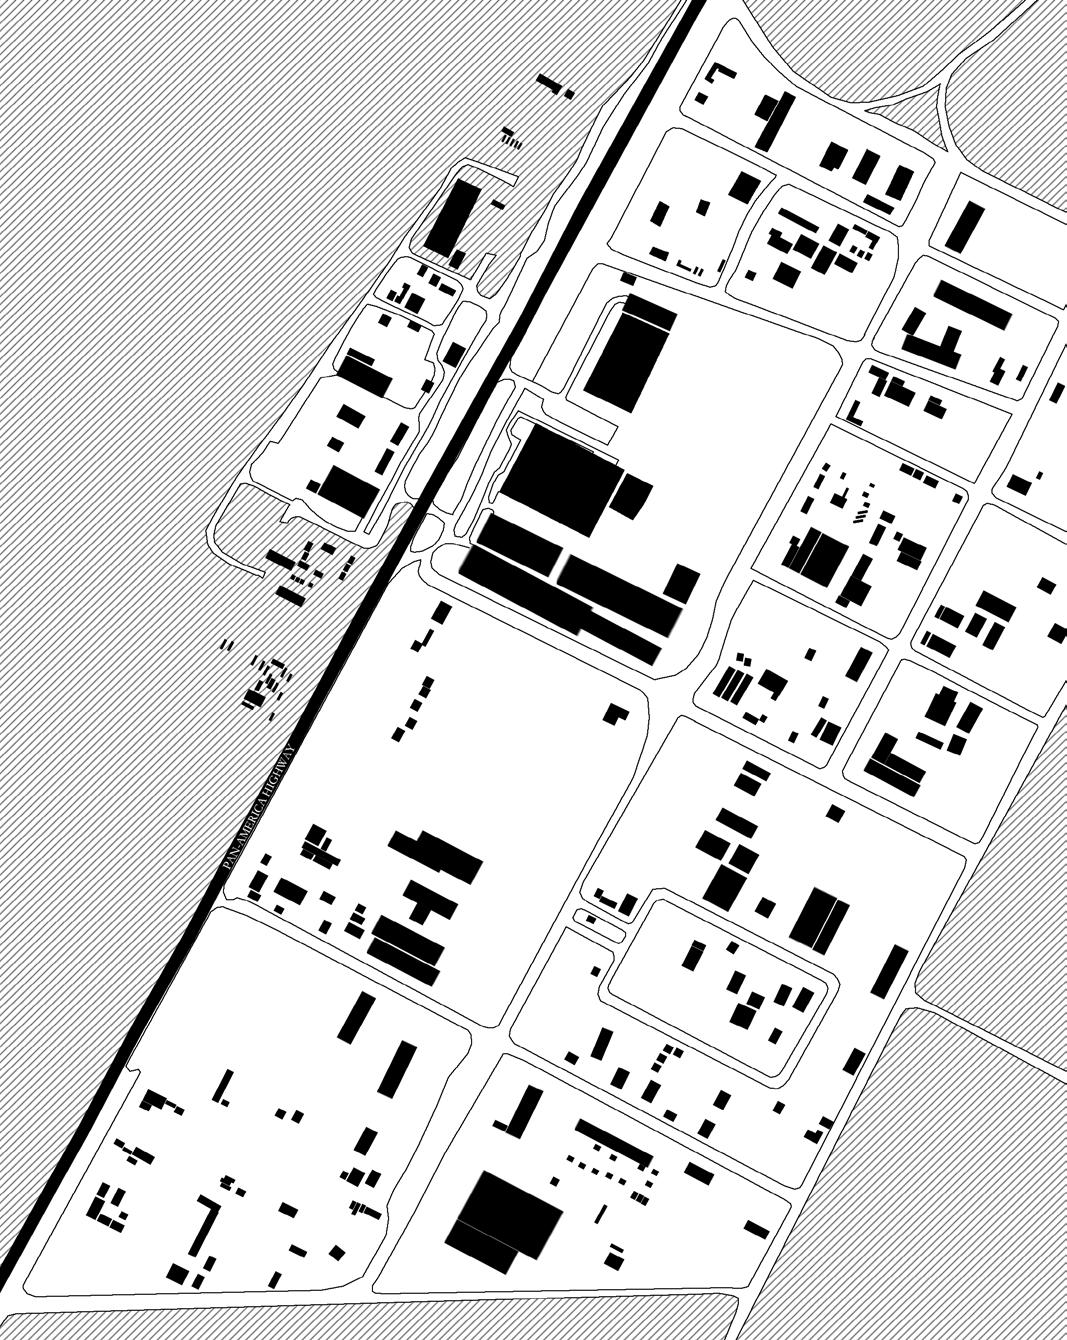
0 0.1mile South America A-393
Figure 16. Figure ground plan of a section of the Pan-American Highway in Chile

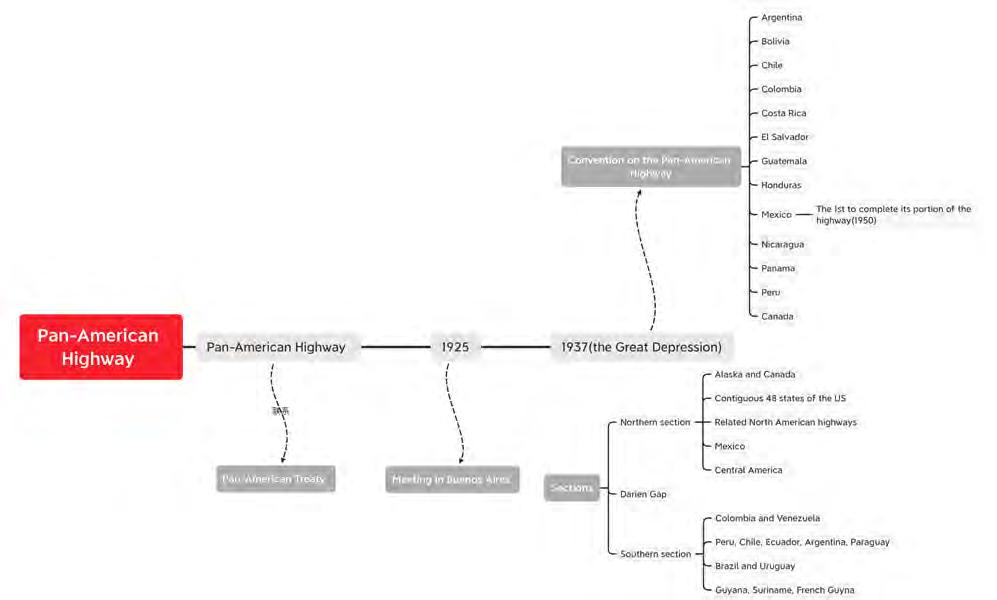
Theories and Methods of Urban Design Winter 2020 A-394
Figure 17. Actors of Pan-American Highway
Figure 18. Component taxonomy of Pan-American Highway

South
America A-395
Figure 19. Synthetic Collage of Pan-American Highway
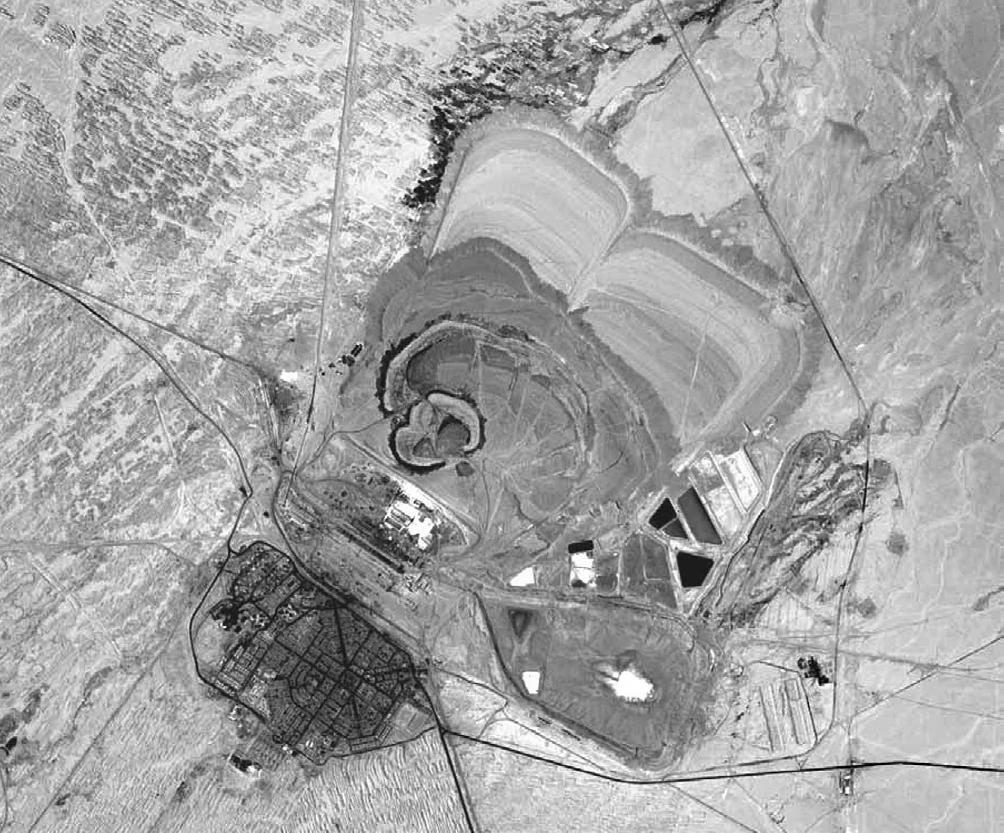

0 500 mile Theories and Methods of Urban Design Winter 2020 A-396
Figure 20. Actors of Maria Elena
Figure 21. María Elena Satellite imagery
Location Year(s) Status
Footprint Designer
Key Project Components Program(s)
Funding Streams
MARÍA ELENA [POST-EXTRACTION URBANISM]
Maria Elena is named after Mary Ellen Comdon, the wife of the first saltpeter refinery works (oficina salitre) manager, Elias Cappelens. Originally, the name of the works was “Coya Norte”. Situated on land purchased from the Treasury in 1924, the plant was opened in 1926 using a sodium nitrate extraction system patented by the Guggenheim Brothers which had replaced the Shank system. It was laid out on the basis of the flag of the United Kingdom. Together with the former refinery at Pedro de Valdivia built-in 1931, it was the largest saltpeter works with a combined output of over one million tons per year12
In 1965 both were taken over by the state, through the Sociedad Química y Minera (SQM or “Chemicals and Mining Company”, which was privatized in 1980. This privatization explains why most land and buildings are owned by SQM and not by individuals or the Chilean state.
Maria Elena’s minerals rely heavily on South American integrated infrastructure, such as roads, railways, ports, etc. for transportation to countries in South America and around the world.
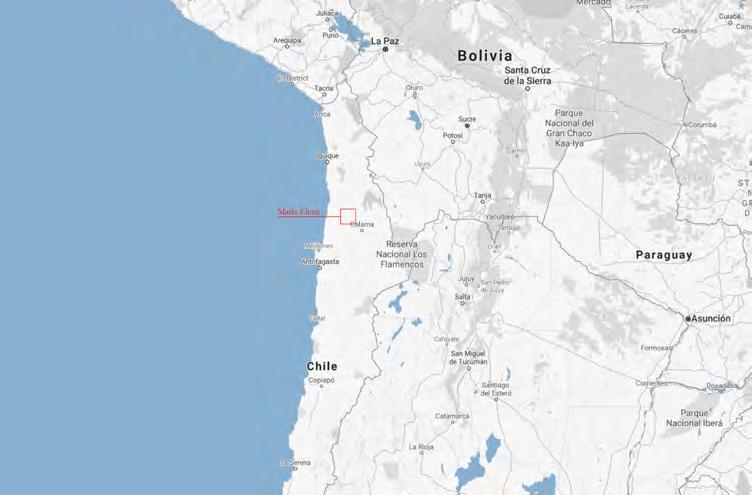
[Tocopilla Province, Antofagasta Region, Chile]
[1924]
[Built]
[12,197.2 km2 (4,709.4 sq mi)]
[Name / Firm / Academic Institution]
[María Elena; Quillagua; Rica Aventura; Toco; Francisco Vergara; Pedro de Valdivia]
[A Mining Town Constellation]
[Public and Private]
South America A-397
12. Ericksen, George Edward. Geology of the salt deposits and the salt industry of northern Chile. USGS, 1963.
Figure 22. Location of Maria Elena
MARÍA ELENA AND POST-EXTRACTION URBANISM
Before Chile vigorously mined copper, it had a period of booming nitrate mining. It was during this period that unprecedented urbanization began in the deserts of Chile. María Elena is one of the existing oldest town developed during that period.
María Elena is a Chilean town and commune in Tocopilla Province, Antofagasta Region. As one of Chile’s important producers of nitrate minerals, it has had a history of mining nitrate minerals for nearly a century13. In the northeast of the town are large mining sites, and between the site and the town are highways for trucks. These highways connect the town to the network of highways in South America, transporting the nitrate minerals mined here, and bringing the town all kinds of necessary living and production materials. Following the European model of industrial towns, it is equipped with mining facilities, office space and a full-service residential area for company employees14 .
Since the small town emerged with the development of nitrate mining, the structure of the entire small town is different from the traditional city that develops on both sides of the main road at the same time, but forms a regular symmetrical structure on the southwest side of the highway.

María Elena is a concentric octagonal structure. The center is Maria Elena Square. The main business is distributed on two diagonal streets, and the remaining areas are mainly housing. The buildings in the town are not more than two stories, and the density is low.
As the main mining industry in Chile is copper, the nitrate mining industry in Maria Elena has been declining15, and now all the workers and their families are left behind, and the population of the town has fallen from 7,530 in 1992 to the present of 2689 people. It can be said that the city was born because of the extraction of minerals, and it was also declining because of this. After the decline of the nitrate mining industry, María Elena faced a series of problems, including an aging mobile infrastructure network, a lack of basic services, and a decline in population in post-nitrate areas. At the same time, a large number of oficinas salitreras that exist today in complete disrepair. A more sustainable long-term recovery strategy for these towns will require the introduction of a new set of economies and uses such as Arts, entertainment and tourism to ensure that there is a new impetus to keep the towns running.
13. Correa, Felipe. Beyond the city: resource extraction urbanism in South America. University of Texas Press, 2016.
14. Rodríguez Torrent, Juan Carlos, and Pablo Andrés Miranda Bown. “Tiempo industrial y tiempos sociales en María Elena, la última ciudad del salitre.” Chungará (Arica) 40, no. 1 (2008): 81-97.
15. Diaz, Guillermo Chong. “The nitrate deposits of Chile.” In Tectonics of the Southern Central Andes, pp. 303-316. Springer, Berlin, Heidelberg, 1994.
Theories and Methods of Urban Design Winter 2020 A-398
Figure 23-26. Taxonomies of María Elena, Road network and housing types
Figure 27. Transect of María Elena

 Figure 28. Figure ground plan of Maria Elena 0 0.1km
South America A-399

Theories
and Methods of Urban Design Winter 2020
A-400
Figure 29. Synthetic Collage of Maria Elena

South America A-401


Theories and Methods of Urban Design Winter 2020 A-402
0 500 mile
Figure 30. Actors of Vila Piloto
Figure 31. Vila Piloto Aerial View
Location Year(s) Status
Footprint Designer
Key Project Components Program(s)
Funding Streams
VILA PILOTO [UTOPIAN URBANISM]
The development of the Usina Hidrelétrica Jupiá (today Engenheiro Souza Dias), at the confluence of the Paraná and Sucuriú Rivers, was one of the first planning projects in the region to bring together energy infrastructure and urbanization strategies16.

Vila Piloto was constructed in 1961, with a built-in expiration date of five to seven years, Vila Piloto became an experimental project to provide housing for the massive migration of the dam construction workers. While the supply of housing for temporary workers in remote locations had previously been resolved through the militaristic deployment of prefabricated barracks, at Vila Piloto Mange saw an opportunity to conceive a new form of urban development—a project that could strive to be something more spatially ambitious than the “technical favelas” built next to the construction sites of previous hydroelectric power plants17.
From a more pragmatic standpoint, they saw the concentric strategy as the most efficient way of deploying infrastructure. Electricity, potable water, and sewerage could be organized radially, significantly reducing linear distances.
[Tres Lagoas, Brazil]
[1961]
[Built]
[0.95km2(0.37 sq mi)]
[Hydro power plant]
[Bachelor housing; Open and recreational spaces; Majority of the housing; Neighborhood unit; ]
[Self-contained town]
[Public and Private]
South America A-403
16. Bittencourt, Karla Porto. “Toponímia urbana da cidade de Três Lagoas–MS: interfaces entre léxico, cultura e história.” (2015).
17. Correa, Felipe. Beyond the city: resource extraction urbanism in South America. University of Texas Press, 2016.
Figure 32. Location of Vila Piloto
VILA PILOTO AND UTOPIAN URBANISM

Vila Piloto was built on the edge of Três Lagoas as a small town that originally provided residence for the workers of the Jupia Hydropower Station. Vila Piloto is next to the BR-262 highway, and there are also roads directly to the Jupia Hydropower Station on the Paranã River18.
It is not difficult to see from the shape of Vila Piloto that it is deeply influenced by the Garden city idea proposed by Ebenezer Howard in 1898. In fact, the designers of Vila Piloto are indeed advocates of the concept19 Therefore, this small town born of the infrastructure of the hydropower station is also full of utopia.
Vila Piloto’s urban structure is a concentric circle pattern, divided by radial roads into 7 different sectors. The seven sectors that made up the circle contained the basic infrastructure for an instant city. Sector one grouped most of the bachelor housing, sectors two and seven were open and recreational spaces, and sectors three through six aggregated the majority of the housing, in addition to a neighborhood unit in each sector20
At the center of the circle town, a series of administrative, educational, religious, and recreational facilities made up the civic center. Among these were a church, a swimming pool, a cinema, and commercial stores. Some basic business and leisure functions are more evenly distributed in Vila Piloto, while larger functional residents can go to the neighboring cities to use, with only an Av. Ponta Porã separated between them21. In order to make part of the infrastructure available to the expanding town of Três Lagoas, service buildings such as hospitals are designed and constructed as independent buildings, located outside the circle, and inside the circle, a series of administrative, educational Religious and recreational facilities form the civic center.
Vila Piloto gives a good example of how to deal with the built-up area left over from the construction of large-scale infrastructure. By transforming into settlement surrounding big cities, it has been full of vitality so far even has passed the original design aging.
19. Howard, Ebenezer. Garden cities of tomorrow. London: Faber, 1946.
20. Correa, Felipe. Beyond the city: resource extraction urbanism in South America. University of Texas Press, 2016.
21. Correa, Felipe. Beyond the city: resource extraction urbanism in South America. University of Texas Press, 2016.
Theories and Methods of Urban Design Winter 2020 A-404
18. Tassinari, C. A., S. H. Bonilla, F. Agostinho, C. M. V. B. Almeida, and B. F. Giannetti. “Evaluation of two hydropower plants in Brazil: using emergy for exploring regional possibilities.” Journal of Cleaner Production 122 (2016): 78-86.
Figure 32-35. Taxonomies of Vila Piloto, Road network and sector types
Figure 36. Transect of Vila Piloto
Figure


0 0.1mile
South America A-405
Figure 37.
Figure ground plan of Vila Piloto

Theories
and Methods of Urban Design Winter 2020 A-406
Figure 38. Synthetic Collage of Vila Piloto

South America A-407
FIGURE RESOURCES
Territory/Iceland
Figure 01. By the author.
Figure 02. Hot Springs and Cultural Spots in Iceland. n.d., https://guidetoiceland.is/Travel-Info/Maps-of-Iceland
Figure 03. Wikimedia, Nautical Area of Three Cod Wars. n.d., https://en.wikipedia.org/Wiki/ Cod_Wars
Figure 04. Wergeland, Oscar. Norsemen Landing in Iceland in 872. n.d., https://en.wikipedia.org/ Wiki/Settlement_of_Iceland
Figure 05. Community in Reykjavik. n.d, https:// www.royalcaribbean.com/Sgp/En/Cruise-to/ Reykjavik-Iceland
Figure 06. Landscape in Iceland. n.d., https:// www.geoex.com/Destinations/Europe/Iceland/
Figure 07. Google Earth, Aerial view of the Runways to Greenways, Google Earth
Figure 08. By the author.
Figure 09. Lateral Office. Rendering of Runways to Greenways. n.d., http://lateraloffice.com/Filter/ Energy/RUNWAYS-GREENWAYS-2007-08
Figure 10~16. By the author.
Figure 17. Vik Campsite. n.d., https://www. fjordnorway.com/Planning-Your-Trip/Accommodation/Vik-Camping-p814273
Figure 18~22. By the author.
Figure 23. Google Earth, Aerial view of Reykjavik
Figure 24. By the author.
Figure 25. Diagrams of Reykjavik Municipal Plan 2010-2030. n.d, https://Reykjavik.is/ Sites/Default/Files/Reykjavik-Municipal-Plan-2010-2030.Pdf
Figure 26~30. By the author.
Territory/Ruhr Valley
Figure 01. By the author.
Figure 02. Aerial view of Emscher river, RhineHerne Canal, Emscherkunst, https://www. robertharding.com/preview/832-118710/ aerial-view-emscher-river-rhineherne-canal-emscherkunst-art/
Figure 03. Emscher River before and after its denaturation in the city of Dortmund, Dietwald Gruehn 2012. Gruehn, Dietwald. “Germany Goes Green-Innovations towards a Sustainable Regional Development.” World Technopolis
Review 1, no. 4 (2013): 235.
Figure 04. Ruhr Industry, https://pixabay.com/ es/photos/industria-cuenca-del-ruhr-4413924/
Figure05. Aerial view of shaft xii in Zollverein, Zeche Zollverein, https://www.publicspace. org/works/-/project/k127-zollverein-parkorg/ works/-/project/k127-zollverein-park
Figure 06~10. By the author.
Figure 11. Simple and robust furnishing in Zollverein Park, Claudia Dreyße, https://www.publicspace. org/works/-/project/k127-zollverein-park
Figure 12~18. By the author
Figure19. Phoenix Lake view, Dumitru Brinzan, 2013, https://www.brinzan.com/2013/10/ phoenix-see-dortmund-germany-october-2013/
Figure 20~26. By the author.
Figure 27. View of the plaza during the event, by Agence Ter, https://afotw.tumblr.compost/129578978518/koenig-heinrich-averdungplatz-by-agence-thttps://afotw.tumblr.com/ post/129578978518/koenig-heinrich-averdungplatz-by-agence-terer
Figure 28~32. By the author.
Territory/Southern Nigeria
Figure 01. Map of Nigeria showing the geopolitical zones in the southern region, Image by author
Figure 02. Map of Nigeria accessed April 2020 https://reliefweb.int/map/nigeria/nigeriapopulation-density-04-october-2010
Figure 03~07. cross-section of environmental challenges in Nigeria accessed in May 2020, https:// www.cnn.com/2018/04/26/africa/nigeriaportharcourt-soot/index.html
Figure 08~10. Cross-section of Nigerian Culture accessed in April 2020, http://outravelandtour. com/seven-most-popular-traditional-festivalcelebrated-in-yoruba-land/Figure 05~08. Cross-section of Nigerian Culture, http:// outravelandtour.com/seven-most-populartraditional-festival-celebrated-in-yoruba-land/
Figure 11. Map of Okrika waterfront in Nigeria, Image by author
Figure 12. Aerial view of Okrika waterfront community, www.maps.google.com
Figure 13. Image of environmental justice campaign in Okrika Water-front accessed in April 2020,https:// homef.org/2019/08/12/fish-not-oil-okrikawaterfront-declaration-of-the-fishnet-alliance/
Figure 14. Illustration by author
Figure 15. Synthetic Collage by author
Figure 16~19. Taxonomy components of the Okrika Waterfront town hall, Image by the author
Figure 20~21. Taxonomy components of the Chicoco radio station, Image by the author
Figure 22. Actors and agents, Drawings by author
Figure 23. Figure ground drawing of the Okrika waterfront community, Drawing by author
Figure 24. Transect drawing, By the author.
Figure 25. Map of Eko Atlantic city in Nigeria, Image by author
Figure 26. Aerial view of Eko Atlantic city accessed May 2020 , www.maps.google.com\
Figure 27.The development process of the Eko Atlantic city accessed in April 2020, https://www. ekoatlantic.com/education/sea-wall/
Figure 28. A 3d-rendering of the Eko Atlantic city accessed in April 2020, https://www.ekoatlantic. com
Figure 29. Illustration by author
Figure 30. Synthetic illustration by author
Figure 31~35. Taxonomy components of the Eko Atlantic city, Graphics by author
Figure 36. Actors and Agents, Drawings by author
Figure 37. Figure ground drawing of Eko Atlantic city, Image by author
Figure 38. Transect Drawing, Image by author
Figure 39. Map of Makoko community in Nigeria, Image by author
Figure 40. Aerial image of the Okrika waterfront community, Image by author
Figure 41~43. Cross-section images of living conditions in Makoko Slum community accessed in April 2020 , https://www.amusingplanet. com/2014/04/makoko-floating-slum-in-nigeria. html
Figure 44. Illustration, Image by author
Figure 45. Synthetic Collage, by author
Figure 46~50. FTaxonomy component of the Makoko Neighborhood Hotspot project , Image by author
Figure 51. Actors and Agents, Image by author
Figure 52. Figure ground drawing of Makoko community, Image by author
Figure 53. Transect drawing, Image by author
Territory/Southern Nigeria
Figure 01. Fu Wang, Jian-fen Li, Pei-xin Shi, Zhi-wen Shang, Yong Li, Hong Wang, The impact of sea-level rise on the coast of Tianjin-Hebei, China. China Geology 1 (February 2019): 26−39, Figure 4.
Figure 02. By the author.
Figure 03. Ganf Li, Huludao, http://mp.ofweek.com/emc/a345653629456
Figure 04. Xu, Jinyong, Zhang, Zengxiang, Zuo, Lijun, Wen, Qingke, Liu, Bin, Temporal and Spatial Analysis of Coastline Changes in the Bohai Rim Based on RS and GIS, International Conference on Remote Sensing, Environment and Transportation Engineering, RSETE 2013. Doi: 10.2991/ rsete.2013.177, Figure 1
Figure 05. Lloyd’s List, Dalian Free Trade Zone, https://lloydslist.maritimeintelligence.informa. com/LL1128080/16-Dalian-China.
Figures 06~07. By the author.
Figure 08. renssbj, http://bbs.zol.com.cn/ dcbbs/d32_29450.html#picIndex1
Figures 09~15. By the author.
Figure 16. Turenscape, https://www.turenscape. com/paper/detail/412.html
Figures 17~23. By the author.
Territory/Sichuan
Figure 01. By the author.
Figure 02. https://j.17qq.com/article/ qruqctaqx.html
Figure 03. “9 Days Chengdu Jiuzhaigou Tour.” China silk road tour package, silk road travel,
Theories and Methods of Urban Design Winter 2020 A-408
https://www.china-silkroad-travel.com/citytours/9-days-chengdu-jiuzhaigou-tour.html.
Figure 04. “The Hailuogou Glacier.” China silk road tour package, silk road travel, https://www. china-silkroad-travel.com/attractions/thehailuogou-glacier.html
Figure 05. https://www.sohu. com/a/77573026_425277
Figure 06. “The Hailuogou Glacier.” China silk road tour package, silk road travel, https://www. china-silkroad-travel.com/attractions/the-hailuogou-glacier.html
Figure 07. http://k.sina.com.cn/article_1280512524_4c53120c0010065ab.html
Figure 08. Google Search. Google, https://www.google.com/search?q=SICHUAN&tbm=isch&tbs=isz:l&rlz=1C1CHBD_enUS868US868&hl=en&ved=0CAEQpwVqFwoTCNjKsrPoj-kCFQAAAAAdAAAAABAC&biw=1688&bih=802
Figure 09~13. https://xw.qq.com/cmsid/20200411A0AT7T00
Figure 14. https://www.google.com/ search?q=CHENGDU&tbm=isch&ved=2ahUKEwixhtH984_pAhWNf6wKHb3-DQQQ2-cCegQIABAA&oq=CHENGDU&gs_lcp=CgNpbWcQAzIECAAQQzIECAAQQzIECAAQQzICCAAyAggAMgIIADICCAAyAggAMgQIABBDMgQIABBDOgUIABCDAVDsiBFY5I0RYOiPEWgAcAB4AIABmQKIAfgMkgEDMi02mAEAoAEBqgELZ3dzLXdpei1pbWc&sclient=img&ei=qKOqXrGSCI3_sQW9_ bcg&bih=802&biw=1688&rlz=1C1CHBD_ enUS868US868&tbs=isz%3Al&hl=en
Figure 15. By the author.
Figure 16. Generated from Google earth
Figure 17. https://item.taobao.com/item. htm?id=605118430828
Figure 18. By the author.
Figure 19. https://item.taobao.com/item. htm?id=605118430828
Figure 20. By the author.
Territory/Kashmir
Figure 01. By the author.
Figure 02~07. Photograph by Aamir Wani (Kashmir through my lens)
Figure 08. Cartoon by Mir Suhail Figure 09. change.org/p/governments-of-india-and-pakistan-stop-exchange-of-fire-alongthe-loc-jammu-kashmir-resume-dialogue
Figure 10~11. andrewwhitehead.net/kashmir-47
Figure 12~18. By the author.
Figure 19. gwadarcentral.com/the-silk-routetale/
Figure 20. By the author.
Figure
tale/
Figure 24~27. By the author.
Figure 28~29. Cartoon by Mir Suhail
Figure 30. thekashmirmonitor.net/citizen-parkinside-tattoo-ground-garrison-may-be-thrownopen-this-year/
Figure 31. newsbharati.com/Encyc/2019/12/25/J-K-bunker-construction.amp. html
Figure 32. Photograph by Aamir Wani (Kashmir through my lens)
Figure 33~36. By the author.
Figure 37~38. Cartoon by Mir Suhail
Territory/Ganges Basin
Figure 01. By the author.
Figure 02. https://www.britannica.com/place/ Ganges-River
Figure 03. https://www.vice.com/en_us/article/avad55/bathing-in-the-toxic-ganges-river
Figure 04. https://theculturetrip.com/asia/ india/articles/along-the-ganges-the-cultural-attractions-of-india-s-holiest-river/ Figure 05. https://www.atlasobscura.com/ articles/160yearold-ganges-canal-superpassages-are-an-engineering-marvel
Figure 06. https://www.reuters.com/article/ us-india-ganges/dying-mother-ganga-indias-holy-river-succumbs-to-pollution-idUSKBN19V0OG
Figure 07. By the author.
Figure 08. Google Maps.
Figure 09. By the author. Figure 10. https://www.everfest.com/ magazine/the-commonalities-of-burning-man-and-kumbh-mela
Figure 11. By the author.
Figure 12. https://desirewebworld.in/kumbhmelaallahabad/kumbh-mela-tent-booking-in-allahabad.php
Figure 13. https://www.theguardian.com/ cities/2019/mar/28/kumbh-mela-cleaning-upafter-the-worlds-largest-human-gathering
Figure 14~17. By the author.
Figure 18. Google Maps.
Figure 19. By the author.
Figure 20. https://commons.wikimedia.org/ wiki/File:Victoria_Memorial_(Kolkata)-_Top_ side_View.jpg
Figure 21. By the author.
Figure 22. https://www.wikiwand.com/en/ Fort_William,_India
Figure 23. https://puronokolkata. com/2018/02/25/calcutta-maidan-in-18th-and19th-centuries/
Figure 24~27. By the author.
Figure 28. Google Maps.
Figure 29. By the author.
Figure 30. https://www.fortuneindia.com/ ideas/highway-to-heaven/103518
Figure 31. By the author.
Figure 32. https://www.fortuneindia.com/ ideas/highway-to-heaven/103518
Figure 33. https://www.varanasiguru.com/ kashi-vishwanath-corridor-project/
Figure 34~37. By the author.
Territory/Singapore
Figure 01. https://www.google.com/ url?sa=i&url=https%3A%2F%2Fwww.shipmap. org%2F&psig=AOvVaw0HmGfmV_MGzD2xkYTL7SZX&ust=1588327286277000&source=images&cd=vfe&ved=0CAMQjB1qFwoTCJCCgbDyj-kCFQAAAAAdAAAAABAN
Figure 02. Government of the United Kingdom http://www.nmm.ac.uk/searchbin/searchs. pl?exhibit=it0975j&axis=1134180803&flash=true&dev=.
Figure 03. State Library of Victoria Image H98.101/182
Figure 04. No 9 Army Film & Photographic Unit, http://media.iwm.org.uk/iwm/mediaLib//51/ media-51207/large.jpg This is photograph IND 4826 from the collections of the Imperial War Museums.
Figure 05-06. By the author.
Figure 07. Winning concept plan, https://www. nikken.co.jp/cn/expertise/urban_design_and_ planning/seeking_an_Ideal_public_space.html
Figure 08-13. By the author
Figure 14. http://bukitbrown.com/ main/?p=6096
Figure 15-21. By the author.
Figure 22. http://www.nas.gov.sg/archivesonline/photographs/record-details/ b026d257-1162-11e3-83d5-0050568939ad
Figure 23-27. By the author.
Territory/Indonesian Archipelago
Figure 01. Stratman². Shoals off Natuna Island 2012. Flickr, https://www.flickr.com/photos/ stratman2/6970575580/
Figure 02. Haner, Josh. Jakarta. 2019. The New York Times, https://www.nytimes. com/2019/08/26/world/asia/indonesia-capital-jakarta-borneo.html
Figure 03. Syuflana, Tatan. Sulawesi Earthquake and Tsunami. Associated Press, https://www. habitat.org.au/our-impact/news-events/sulawesi/
Figure 04. Rante, Ardiles. Supertrees: Meet Indonesia’s Carbon Guardian. 2019. Vox, https://pulitzercenter.org/reporting/supertrees-meet-indonesias-carbon-guardian
Figure 05. Rante, Ardiles. Supertrees: Meet Indonesia’s Carbon Guardian. 2019. Vox, https://pulitzercenter.org/reporting/supertrees-meet-indonesias-carbon-guardian
Figure 06. Mehta, Ashvin. Andaman Islands 2019. Dinodia Photo Library, https://www-britannica-com.proxy.lib.umich.edu/place/Anda-
Figure Resources A-409
21~22. Cartoon by Mir Suhail Figure 23. gwadarcentral.com/the-silk-route-
man-Islands#ref823055
Figure 07. Haner, Josh. Jakarta Is Sinking So Fast, It Could End Up Underwater. 2019. The New York Times, https://www.nytimes.com/interactive/2017/12/21/world/asia/jakarta-sinking-climate.html
Figure 08. By the author. Figure 09. By the author.
Figure 10. Hidayat, Nurul. Bisnis Indonesia. 2018. Associated Press, https://gulfnews. com/world/asia/indonesian-tsunami-volcano-anak-krakatoa-lost-two-thirds-of-itsheight-1.1546073872492
Figure 11. Earthquake Response in Indonesia. Habitat for Humanity, https://www.habitatforhumanity.org.uk/what-we-do/disaster-response/ response-yogyakarta-earthquake-in-indonesia/
Figure 12. Lin, Mayuri Mei & Hidayat, Rafki. Groundwater Extraction. BBC News, Agence France-Presse, https://www.bbc.com/news/ world-asia-44636934
Figure 13. Hilton, Paul. A Palm Oil Mill. 2016. Audubon, https://www.audubon.org/magazine/fall-2016/as-global-demand-palm-oil-surges-indonesias
Figure 14. Tsunami. Corbis, Bettmann, NPR, https://www.npr.org/sections/thetwo-way/2016/01/12/462708068/aleutianquake-zone-could-shoot-big-tsunamis-to-hawaii-california
Figure 15. Joko Widodo. The Financial Express, Reuters, https://www.thefinancialexpress.com. bd/views/sinking-cities-over-extraction-ofground-water-1567003090
Figure 16. Marha, Diva. Floodwaters In Bengkulu Agence France-Presse, Al Jazeera, https:// www.aljazeera.com/news/2019/04/indonesia-floods-29-people-dead-thousands-displaced-190429074356137.html
Figure 17. Uzunova, Lilyana. The Many Faces of Indonesia. 2014. European Youth Voice, http:// www.europeanyouthvoice.eu/2014/12/the-many-faces-of-indonesia/
Figure 18. Kuiper Compagnons. The Great Garuda. 2016. Abitare, http://www.abitare.it/ en/habitat-en/urban-design-en/2016/01/24/ the-great-garuda-the-masterplan-to-save-jakarta/
Figure 19. Putro, Wahyu. Reclamation Construction Activities. 2016. The Jakarta Post, https://www. thejakartapost.com/academia/2016/04/07/ qa-the-problem-with-jakartas-land-reclamation. html
Figure 20. Indonesian rangers. Agence France-Presse, Post Magazine, https://www. scmp.com/magazines/post-magazine/longreads/article/2187593/cheap-versatile-palm-oileverywhere-and-has
Figure 21~22. By the author.
Figure 23. Gilbertson, Ashley. Indonesian Rainforest. 2018. The New York Times, https://www. nytimes.com/2018/11/20/magazine/
palm-oil-borneo-climate-catastrophe.html
Figure 24~25. By the author.
Figure 26. Christian, Bachellier. Mangrove. 2017. UICN, Flickr, https://www.iucn.org/fr/ node/28668
Figure 27. Thinkstock. Deforestation. 2015. Planete Energies, https://www.planete-energies. com/en/medias/close/dealing-deforestation
Figure 28. Hanafiah, Junaidi. Mongabay Indonesia. 2019. EcoWatch, https://www. ecowatch.com/major-brands-source-palm-oilillegal-2640845143.html?rebelltitem=1#rebelltitem1
Figure 29 - 32. By the author.
Figure 33. United Nations. UN Conference on Environment and Development. 1992. United Nations, https://www.researchgate. net/figure/1992-UN-Conference-on-Environment-and-Development-Source_ fig5_301897944
Figure 34. Ismoyo, Bay. Palm Oil Plantation. 2018. Agence France-Presse, Getty Images, https://psmag.com/environment/brands-arenot-living-up-to-their-palm-oil-promises
Figure 35. Stena Bulk. Stena Impero. 2019. Associated Press, https://www.timesofisrael. com/iran-guards-say-theyve-confiscated-britishtanker-in-strait-of-hormuz/
Figure 36 - 38. By the author.
Figure 39. Roszandi, Dasril. A Horse Pulls A Carriage Through A Flooded Road. 2020. Agence France-Presse, Getty Images, https://www. insurancejournal.com/news/international/2020/01/02/553326.htm
Figure 40 - 44. By the author.
Figure 45. Suparto, Agus. Reclamation Project. 2016. The Jakarta Post, https://www.thejakartapost.com/news/2016/04/16/minister-susi-asks-jakarta-to-stop-reclamation-projects.html
Figure 46 - 49. By the author.
Figure 50. Dinozaver. Street Food In Indonesia 2019. Tripsavvy, https://www.tripsavvy.com/ top-must-try-street-foods-in-indonesia-1629379
Figure 51. By the author.
Figure 52. Gacad, Romeo. Street Vendor. 2010. Public Radio International, https://www.pri. org/stories/2012-09-28/worlds-biggest-millionaire-boom-its-indonesia
Figure 53. Street Vencor. MaHKU, http:// www.mahku.nl/ma_studies/public_space_design_alumni_1073.html
Figure 54. Elena, Ermakova. Indonesian food vendor. 2018. iStock, Getty Images, https://www. istockphoto.com/photo/kuta-street-un der-the-rain-bali-gm942325390-257529773
Figure 55 - 60. By the author.
Figure 61. Schäfer, Saskia. Jokowi’s Way. 2014. The Nation, https://www-thenation-com.proxy. lib.umich.edu/article/archive/jokow is-way/
Figure 62. By the author.
Territory/Metropolitan Los Angeles
Figure01. City of Quartz, https://en.wikipedia. org/wiki/City_of_Quartz
Figure2. The Exploding Metropolis, https://www. amazon.com/EXPLODING-METROPOLIS-assault-urbanism-Illustrated/dp/B000E7RQHO
Figure03. Coronavirus stay-at-home orders have reduced traffic accidents by half, https://www. latimes.com/environment/story/2020-04-01/ coronavirus-stay-at-home-orders-have-reducedtraffic-accidents-by-half
Figure 04. The Provisional City: Los Angeles Stories of Architecture and Urbanism, https://www. goodreads.com/book/show/703506 The_Provisional_City
Figure 05. metro Expo Line, https://www.google.com/search?q=santa+monica+metro+station&hl=zh-TW&source=lnms&tbm=isch&sa=X&ved=2ahUKEwjAkIDb2ZHpAhXPKs0KHepZBckQ_AUoAXoECA0QAw&biw=1297&bih=613#imgrc=EetGfTs7rTLAnM
Figure 06. 1984 Summer Olympics, https://www. lacoliseum.com/olympic-history-at-the-coliseum/
Figure 07. Four level interchange, https://www. google.com/search?q=four+level+interchange&hl=zh-TW&source=lnms&tbm=isch&sa=X&ved=2ahUKEwiW5MSv2pHpAhUCCs0KHa4tBSsQ_AUoAXoECBAQAw&biw=1297&bih=613#imgrc=LbXI83OhpdsyPM
Figure 08. Hollywood, https://www.google.com/ search?q=hollywoodland+1923&hl=zh-TW&source=lnms&tbm=isch&sa=X&ved=2ahUKEwjDwObA2pHpAhVPVs0KHc7pBTcQ_ AUoAXoECBkQAw&biw=1297&bih=613#imgrc=Ni0BaY2G6NBTEM
Figure 09. Los Angeles aqueduct, https:// en.wikipedia.org/wiki/Los_Angeles_Aqueduct
Figure 10. the first oil district in Los Angeles, https://www.timetoast.com/timelines/porfiriato-f88c8fd2-b74a-4660-89e4-ce190ec9f53f
Figure 11. Bird’s-eye view of single-family home communities, https://www.lamag.com/citythinkblog/ milton-curry-usc/
Figure 12. Up Against the Sprawl, https://www. upress.umn.edu/book-division/books/upagainst-the-sprawl
Figure 13. Metro LA Population Density Map, https://mapmaker.nationalgeographic.org/ zyUPgeeUlixlZ9nnTOpeG/
Figure 14. By the author.
Figure 15. The Sprawling builtscape of Los Angeles, San Fernando Valley area. (source: Built:LA), http://cityhubla.github.io/LA_Building_ Age/#12/34.0267/-118.2621
Figure 16. Sprawl: A Compact History, https:// press.uchicago.edu/ucp/books/book/chicago/S/bo3614185.html
Figure 17. Fab Civic Center Park, https://oma. eu/projects/fab-civic-center-park
Theories and Methods of Urban Design Winter 2020 A-410
Figure 18. Fab Civic Center Park, https:// bustler.net/news/tags/downtown-los-angeles/105438/4952/mia-lehrer-oma-to-designnew-fab-park-in-downtown-los-angeles
Figure 19. By the author.
Figure 20. Fab Civic Center Park, https://oma. eu/projects/fab-civic-center-park
Figure 21. Discovering the Vernacular Landscape, https://www.google.com/search?q=discovering+the+vernacular+landscape&source=lnms&tbm=isch&sa=X&ved=2ahUKEwibufOI3pHpAhVBQ80KHT_8DBQQ_AUoAXoECBEQAw&biw=1297&bih=613#imgrc=nphm2YcSOUFHEM
Figure 22~25. By the author.
Figure 26. One Santa Fe, https://casestudies.uli. org/one-santa-fe/
Figure 27. One Santa Fe, https://casestudies.uli. org/one-santa-fe/
Figure 28. By the author.
Figure 29. One Santa Fe, https://www. mmaltzan.com/projects/one-santa-fe/
Figure 30. Entrepôt Macdonald, https://www. phaidon.com/agenda/architecture/articles/2016/july/14/oma-rework-a-brutalist-paris-warehouse/
Figure 31~36. By the author.
Figure 36-1~36-5. Chavez Ravine, https:// epdf.pub/the-provisional-city-los-angeles-stories-of-architecture-and-urbanism.html
Figure 37. By the author.
Figure 38. Perspective view of the Elysian Park Heights, https://www.google.com/ search?q=los+angeles+chavez+ravine&hl=zh-TW&source=lnms&tbm=isch&sa=X&ved=2ahUKEwiXmb_E4JHpAhWDAp0JHbixBCMQ_AUoAXoECBUQAw&biw=1297&bih=613#imgrc=Wx1j8TTHJaYojM
Figure39. Bird’s-eye view of the Elysian Park Heights, https://www.walteromalley.com/en/ features/chavez-ravine/Overview
Figure 40. The Three Magnets from Garden, https://www.google.com/ search?q=ebenezer+howard+three+magnets&sa=G&hl=zh-TW&biw=1297&bih=613&tbm=isch&source=iu&ictx=1&fir=5jNP3xM4ENCrBM%253A%252CwHiCbsVNHyGZeM%252C_&vet=1&usg=AI4_-kTvewvofqZ VYftR_kjrO1NwwRZn1w&ved=2ahUKEwi_ ovTT4JHpAhXKVs0KHdYGCNcQ9QEwAXoECAoQFw#imgrc=5jNP3xM4ENCrBM
Figure 41~46. By the author.
Territory/Lake St. Clair Watershed
Figure 01. http://www.asti-env.com/ techbits/2013/11/1/asti-project-wins-awardfor-lake-st-clair-coastal-wetland-restoration
Figure 02. https://www.freep.com/story/ news/local/michigan/detroit/2020/02/01/
detroit-people-mover-direction/4632898002/
Figure 03. https://www.history.com/topics/1960s/1967-detroit-riots
Figure 04. https://civilianmilitaryintelligencegroup.com/24904/arms-manufacturing
Figure 05. https://imgur.com/gallery/LjTL1
Figure 06. http://www.a-u-r-a.eu/upload/research_radicalurbanism_100dpi_2.pdf
Figure 07. https://de.wikipedia.org/wiki/ Datei:Michigan_Macomb_county_Anchor_ Bay_Selfridge_AFB_IMG_1814.JPG
Figure 08. https://www.bassmaster.com/slideshow/look-st-clair
Figure 09. https://www.wilx.com/home/headlines/Ambassador-Bridge-Owner-Keeps-UpEfforts-on-Own-Bridge-Plan-296198081.html
Figure 10~26. By the author.
Figure 27. https://www.youtube.com/ watch?v=CyJjHdGB2Ms
Figure 28~35. By the author.
Territory/Medellin Metropolitan Area
Figure 01. By the author.
Figure 02. “Today Medellin feels new-born. It helps that the setting is gorgeous” Stewart, Stanley. “How Medellin Went from Murder Capital to Hipster Holiday Destination.” The Telegraph. Telegraph Media Group, January 4, 2018. https://www. telegraph.co.uk/travel/destinations/southamerica/colombia/articles/medellin-murdercapital-to-hipster-destination/
Figure 03. Colourful Comuna 13 “3 Days in Medellín.” TravelMag, July 24, 2018. https:// www.travelmag.com/articles/3-days-medellin/
Figure 04. By the author.
Figure 05. Aerial map of line K line L Screenshot from Google Earth
Figure 06. Imgae of Metrocable structural pole and squares “Medellín in Pictures - Model for Urban Innovations.” Lee Kuan Yew World City Prize. https://www.leekuanyewworldcityprize.com.sg/ resources/in-pictures/medellin/ Figure 07~13. By the author.
Figure 14. Aerial map of the Circumvent Garden and Comuna 8 Screenshot from Google Earth
Figure 15. Bird-eye view from observatory in the Circumvent Garden En Nuestra Nueva Medellín Se Construye Un Jardín Circunvalar Para La Vida EDU Medellín, 2015. https://www.youtube. com/watch?v=IWbslsP7rps&feature=emb_title
Figure 16~21. By the author.
Figure 22. Aerial map of line K line L Screenshot from Google Earth
Figure 23. Sectional perspective drawing of intervention near Ayurá Station MEDELLIN / The river that is not - LCLA office. https://www. luiscallejas.com/MEDELLIN-The-river-thatis-not
Figure 24. Figure-ground drawing of The River That Is Not MEDELLIN / The river that is not
- LCLA office. https://www.luiscallejas.com/ MEDELLIN-The-river-that-is-not
Figure 25. Sectional and plan drawing of The River That Is Not focal points MEDELLIN / The river that is not - LCLA office. https://www. luiscallejas.com/MEDELLIN-The-river-thatis-not
Figure 26. Master plan of The River That Is Not MEDELLIN / The river that is notLCLA office. https://www.luiscallejas.com/ MEDELLIN-The-river-that-is-not
Figure 27. Diagram of The River That Is Not actors
Figure 28. “Territorial Impact Buildings” of The River That Is Not MEDELLIN / The river that is not - LCLA office. Accessed January 23, 2020. https://www.luiscallejas.com/MEDELLINThe-river-that-is-not
Figure 29. By the author.
Territory/South America
Figure 01. http://lateraloffice.com/HYDROBORDERS-2011-12
Figure 02. http://www.oushinet.com/wap/international/guojinews/20181206/307935.html
Figure 03. https://www.bormatto.com.br/ blog/metodologia-bim-aplicaco-a-projetos-de-infraestrutura-de-transportes/
Figure 04. https://www.spinagroup.com/en/ projects/central-electrique-congolese-cec-power-plant-expansion/
Figure 05. https://www.mercosur.int/en/ Figure 06. https://www.haikudeck.com/ latin-america-revolution-education-presentation-581861edee
Figure 07. http://www.tnhistoryforkids.org/ history/in-search-of/in-search-of/de-soto.2469734
Figure 08~11. https://www.luiscallejas.com/ LATIN-AMERICA-Hydroborders
Figure 12. By the author.
Figure 13. https://luxury-inside.vn/conduong-dai-nhat-the-gioi-tuong-duong-motvong-trai-dat.htm
Figure 14. https://luxury-inside.vn/conduong-dai-nhat-the-gioi-tuong-duong-motvong-trai-dat.htm
Figure 15~20. By the author.
Figure 21. http://pablosaric.com/en/project/ sqm-guggenheim/
Figure 22~30. By the author.
Figure 31. https://commons.wikimedia.org/ wiki/File:Vila_Piloto_-_hist%C3%B3rica_-_ panoramio_-_Carlos_Alves_(1).jpg
Figure 32~38. By the author.
Figure Resources A-411


 Theories and Methods of Urban Design Winter 2020 A-24
Figure 22. Collage of Vik Campsite


 Iceland A-33


 Ruhr Valley A-49


 Ruhr Valley A-55
Industrial Site
Lake Phoenix
Playground
Re-naturalization of River Bank Lake
Figure 22. Taxonomy of Lake Phoenix.
 Theories and Methods of Urban Design Winter 2020 A-56
Figure 24. Collage of Lake Phoenix.
 Ruhr Valley A-57


 Ruhr Valley A-63
Events Amenity
Sculpture
Fountain
Figure 30. Taxonomy of Averdung Plaza.
 Theories and Methods of Urban Design Winter 2020 A-64
Figure 32. Collage of Averdung Plaza.
 Ruhr Valley A-65


 Southern Nigeria A-75
Figure 14- Illustration by Author


 Community gathering space for citizenship action
Southern Nigeria A-77
Figure 20-21 Taxonomy components of the Chicoco radio station by author
dissemination
Participatory planning and building to instill a sense of community
Figure 16-19- Taxonomy component of the Okrika Waterfront Town Hall showing programs and uses (by author)

 Figure 23- Figure ground drawing of Okrika waterfront (drawing by author)
Southern Nigeria A-79
Figure 24- Transect drawing by author


 Southern Nigeria A-83
Figure 29- Illustration by Author
Figure 28- A 3D-rendering of the Eko Atlantic city


 Southern Nigeria A-87
Figure 38- Transect drawing by Author
Figure 37- Figure ground drawing by author


 Southern Nigeria A-91
Fig 44
Illustration by Author


 Figure 13 Jiaozhou Bay Bridge Collage
Theories and Methods of Urban Design Winter 2020 A-108
 Bohai Economic Rim A-109
 Theories and Methods of Urban Design Winter 2020 A-110


 Bohai Economic Rim A-113


 Figure 21 Qinhuangdao Beach Restoration Collage
Theories and Methods of Urban Design Winter 2020 A-116


 Figure 25 798 Art District Figure Plan


 Figure 28 798 Art District District Collage
Theories and Methods of Urban Design Winter 2020 A-124
 Bohai Economic Rim A-125


 Sichuan A-139
Tower Crane
Stupa
Construction Fence
Prayer Flag Solar Streetlight
Prayer Wheel
Figure 27~32: Taxonomy of Serta Buddhist Academy
Figure 33: Section of Serta Buddhist Academy
 Theories and Methods of Urban Design Winter 2020
A-140
Figure 34: Collage of Yingxiu Town


 Sichuan A-149
Figure 54: Collage of Heming teahouse


 Sichuan A-153
Figure 59: Interior of Heming Teahouse


 Kashmir A-171
Figure 25 Image by the author


 Kashmir A-177
Figure 34 Image by the author


 Ganges Basin A-189


 Project 1: Kumbh Mela
Project 2: Maidan


 Ganges Basin A-197
Electric Poles Pontoon Bridges
River Edge
Tents A
Tents B
Tents C
Figure 13. Temporary Metal Road during Kumbh Mela Festival
Figure 14. Taxonomy


 Ganges Basin A-205
European Palace Eden Gardens
Residential Buildings
European Gardens Race Course
Fort William
Figure 24. Taxonomy
Figure 23. Aerial View of Maidan in the 1800s


 Ganges Basin A-213
Stairs Stairs + Temple Stairs + Platform
Temple Housing + Temple Housing
Figure 34. Taxonomy


 Singapore A-237
Figure 18 Section


 Theories and Methods of Urban Design Winter 2020 A-264
Figure 31. From the coastline to the inland
 Indonesian Archipelago A-265

 Indonesian Archipelago A-267


 Indonesian Archipelago A-269
Archipelago
The Globe
Figure 35. As of 2011, there were 7.8 million hectares of palm oil plantations, with 6.1 million hectares of these being productive plantations under harvest, thus making Indonesia the global leader in crude palm oil (CPO) production.


 Indonesian Archipelago A-275
The Great Garuda
Jakarta Artificial Lagoon
Land Reclamation (Sea Wall) Ocean
Government
National Capital Integrated Coastal Development (NCICD)
Dutch Consortium Witteveen+Bosa and Grontmij
The Great Garuda
Architecture Firm Kuiper Compagnons
Figure 42. The actors and symbol behind the Great Garuda
Figure 43. Section of the Great Garuda: the artificial lagoon for regulating rivers in Jakarta and the sea wall for protecting Jakarta

 Indonesian Archipelago A-277


 Indonesian Archipelago A-293
Joko Widodo, monument
Figure 62. The relocation fundamentally changed the qualities of street vendors.


 Theories and Methods of Urban Design Winter 2020 A-302
Figure 17. Fab Civic Center Park
Figure 18. Fab Civic Center Park


 Metropolitan Los Angeles A-309
Figure 25. Urban Condition Collage

 Theories and Methods of Urban Design Winter 2020 A-310
Figure 27. One Santa Fe
Figure 26. One Santa Fe


 Metropolitan Los Angeles A-317 Figure 35. Urban Condition Collage


 Metropolitan Los Angeles A-321
Figure 41. Elysian Park Neighborhood, 2020


 Figure 46. Urban Condition Collage
Metropolitan Los Angeles A-327


 Lake St. Clair Watershed A-333


 Lake St. Clair Watershed A-339
Figure 13. Cartography/Perverious and impervious/Image made by author


 Lake St. Clair Watershed A-345
Figure 23. Taxonomy/enablers and effects of suburbia/Image made by author

 Figure 26. Actors/Suburban homes and space/ Image made by author


 Lake St. Clair Watershed A-351
Figure 27. Cartography/Watershed context/Image made by author
Figure 31. Actors/Water intake and outfall/Image made by author
Figure 32. Transect/Water sources/Image made by author 0 1 mile


 Figure 28. Figure ground plan of Maria Elena 0 0.1km
South America A-399


