
SHEN WENCHENG,ZHU JIAQI,XU XIN
MA Sustainablity Design SUSTAINABLITY DESIGN WUXI
2016

Wuxi is a famous tourist city,which has two prefecture-level cities named Yixing and Jiangyin From this diagram,we list 7 main sites to help you know this beautiful city.
According to the World map of Köppen-Geiger climate classification, Wuxi belongs to the climate zone of Cfa, which means it is in warm temperate, fully humid and has hot summer.

A subtropical humid monsoon climate
Distinct seasons, sufficient heat
Abundant precipitation, rain heat the same
The spring weather is changeable.
Prevailing southeast wind in summer, hot and rainy weather. The autumn is cool.
27 0
亚热带湿润季风气候 四季分明,热量充足 降水丰沛,雨热同季 春季天气多变 夏季盛行东南风,天气炎热多雨 秋季秋高气爽 冬季大多吹偏北风 17 -4


18 -3
30 4
31 13
34 17
37 19
38 22
32 17 26 10
26 -3
Context & Climate Diagrams 4 // WUXI// TOWN ANNUAL CLIMATE SUMMARY
85 100
160 120
165 100
200
405 105 44
17 -3 The Average Max and Min Temperature of Wuxi /℃ 无锡市月平均极值温度 /℃ The Average Percipitation of Wuxi /mm 无锡市月平均降雨量 /mm
130 103
A F M A M J J A S O N D
23.80% 1.90% 74.30% Wind Speed Ratio of Wuxi /m 无锡市全年风速占比 /m
Environmental protection engineering/环境保护工程
In 2015, centered on the "structural reduction, project emissions, management of emissions", 127 projects on emission reduction of water pollution and 110 air pollution
abatement
Less than the breeze Gentle breeze and Moderate breeze Moderate breeze and Fresh breeze 2015年 , 全市围绕 “ 结构减排 、 工程减排 、 管理减排 ” , 实施水污染减排项目 127个 、 大气污染减排项目 110 个 。 全市四项主要污染物化学需氧量 、 氨氮 、 二氧化硫和氮 氧化物分别在 2014年基础上削减 3 10%、 2 05%、 3 49%和 9 21%, 超额完成年度及 “十二五”减排目标任务。
projects are implemented Four major pollutants, chemical oxygen demand, ammonia, sulfur dioxide and nitrogen oxides of the city were reduced by 3 10% on the basis of 2 05%, 3 49% and 9 21% of 2014, overfulfilled the annual and the " twelfth five-year " targets and tasks
According to the hardiness zone map, Wuxi belongs to the zone of 8b, which indicates that its mean annual minimum temperature for plants arranges from -9.4 to -6.7 degree. And the average PH value of Wuxi’s soil is 4.6~8.1.

Tipical flowers in Wuxi are as follows: plum flower (the city flower of Wuxi) in winter, peach blossoms in spring, lotus in summer and chrysanthemum in fall... With them, you can enjoy different views at any season.

References:

[1] 佚名. 江苏省地方志[J]. 江苏地方志, 2014(1).
[2] website: http://www.backyardgardener.com/zone/china.html
[3] website: www.plantmaps.com/interactive-china-plant-hardiness-zone-map-celsius.php
Ihin Etratum. conves opostra Sena, esse Quo intem Catorbem Etraet; prit ato essatilin aurbit; nihicae ultu sed vidii pato seniculium et, con duciemor etrum consultuam menit? Ti se pat quonsu
Informa�on indicated from data below:
Dew point: 19.4 Wet Bulb Value: 21

City:Nanjing
Time:10:00a.m.Sept.23rd Dry Bulb Temperature:24℃ Rela�ve Humidty:22.77%
This is an annual psychrometric chart of Nanjing, Jiangsu, CHN, which shows the comfort indoors plot hourly in a year

. -
According to the chart ,the comfort hrs are 415 hours out of 8760 hrs(4.7%).
Cause Wuxi is close to Nanjing, it also has dis�nct seasons and pleasant climate for living. It is a pity that the annual Psychrometric Chart of Wuxi is not available. However, similar situa�on can be found in Wuxi.
.


Legend
Source point water pollution
Water run off
Drains to storm sewer
Drop inlet to storm
Non-source point water pollution


These two below are pictures we shot on rainy days to show a much more convincing rule of how water flows around D&I.

The windiest month of a year in Wuxi should be March, according to related data on Nansoutheast. All above are the reasons why we choose March in Wuxi and especially southWanda Apartment, Binghu District, Wuxi, which is marked on the map.
of Wuxi.


The windiest month of a year in Wuxi should be March and during this month, wind comes

ing we choose. It also indicates clearly how the

BEFORE AFTER
ORIENTATION FOR WINDS & PASSIVE COOLING 14 // WUXI // IMPROVED ORIENTATION
Add Windows
master bedroom living room
bathroom bathroom locker
balcony dining room kitchen Add Windows

The target building is located in Wuxi Wanda Plaza. It is designed to face south-east according to the fact that wind in Wuxi comes mostly in the direac�on of that.
The orange arrow means heat gain from the sun, while the yellow one represents deligh�ng strength. Massing for solar heat gain is stronger in the direc�on of southeast from the data analysis and diagram.

This diagram vividly shows the ven�la�on, solar gains and openings of our target building. It is a 25-floor apartment building with 2 family suits on each floor. To make it easy to understand, we simplify the building shape as it is shown in the graph. The higher rooms are, the stronger winds they are faced with. The whole building get heat from the solar energy. Moreover, lower floors accept day ligh�ng reflected by the ground.
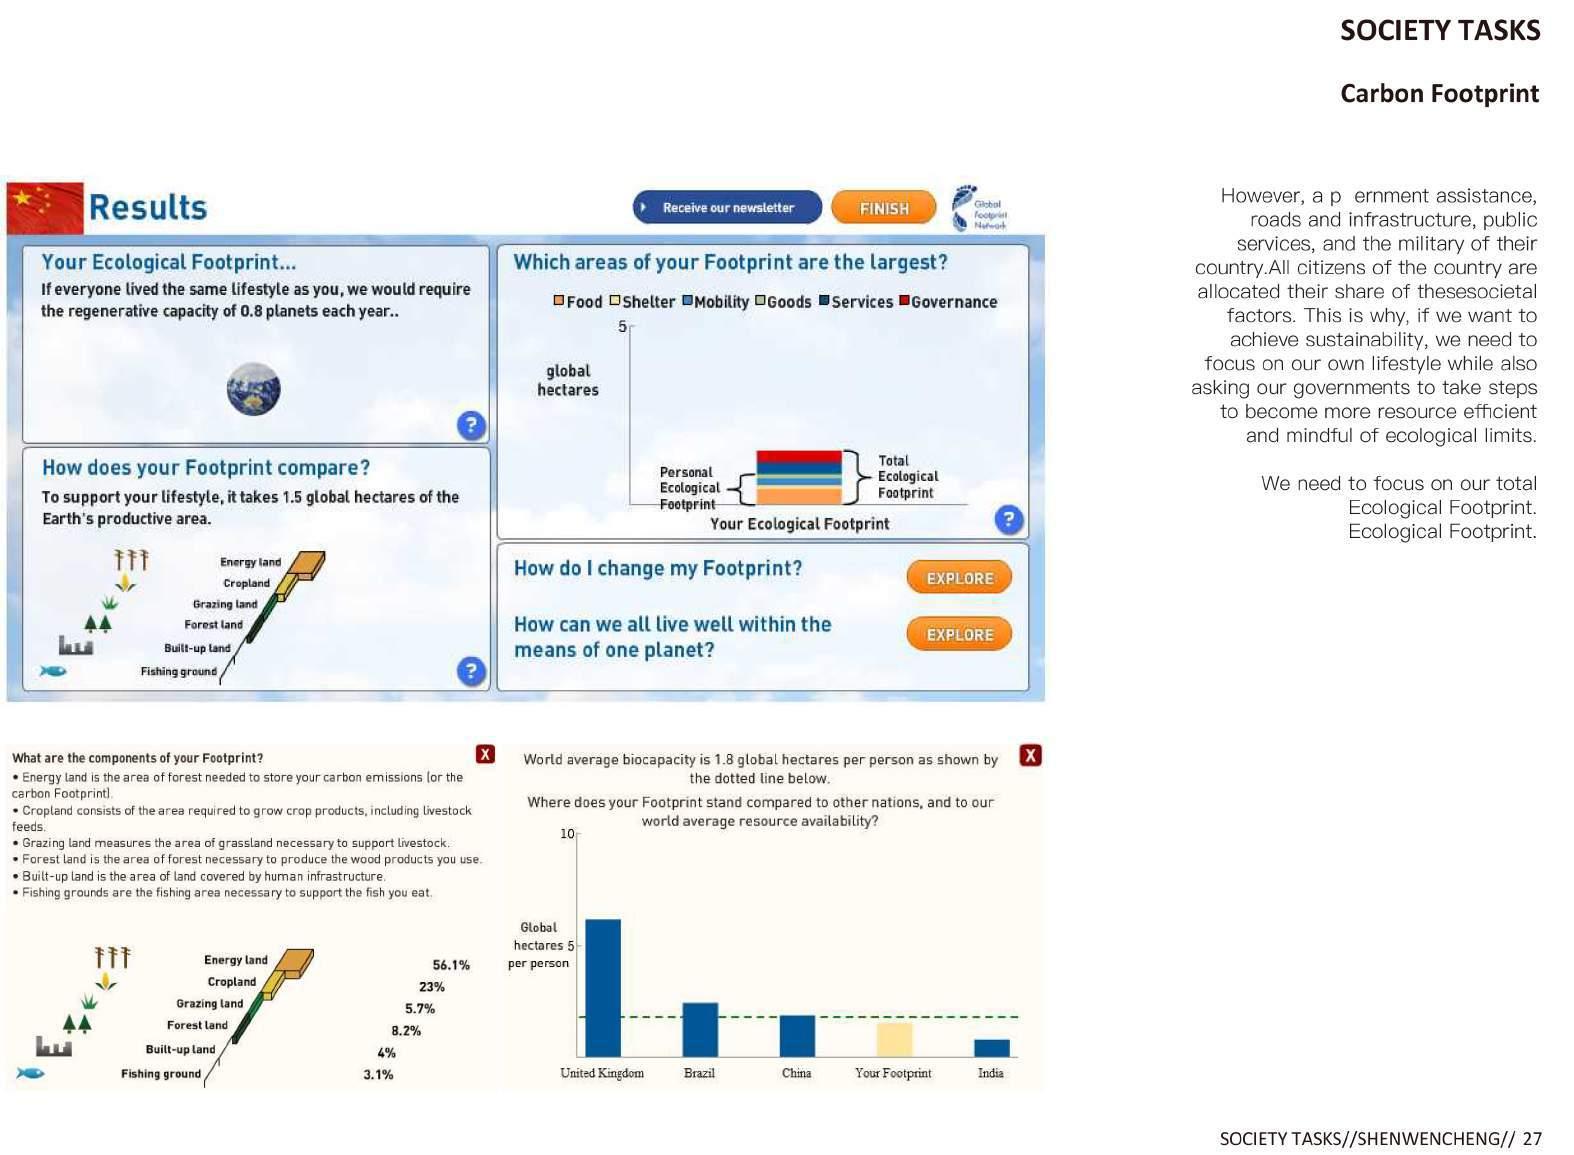
The ini�al calcula�on of my Carbon Footprint is as below. If everyone lives the same lifestyle as me, the regenera�ve capacity of 1.2 planets each year will be needed to supply. As it is vividly shown in the chart, food area of my footprint is the largest,which was unexpected before.


The new result of my carbon footprint is be�er than before. I have reduced my ecological footprint from 2.1 global hectares to 1.7 global hectares. If everyone lived the same lifestyle as me, the regenera�ve capacity of 1 planet each year, which is encouraging for me to work be�er to help the earth.


Before having done the test on my Slavery Footprint, I never no�ced that there is so much slavery behind different aspects of my daily life, such as seafood consump�on, make-up consump�on and e-products consump�on.


As the test result shows, 25 slaves work for me. Gladly, 25 is less than both the average score for other women my age and average score for others from Shanghai. However, I s�ll feel guilty for my existed living habits. That is to say, there is s�ll much for me to improve.


From the chart below, you can see my initial calculator.Food takes a great part of it and goods occupies top second. If everyone lived the same lifestyle as me ,we would require the regenerative capacity of 1.1 planets each year.

My current Ecological Footprint is 2.0 global hectares. I decided to reduce my Foodprint by 12%, so that I changed some options of services,goods and others.
My current Ecological Footprint is 2.0 global hectares.

After changing some options,the result is better than before.I have reduced my Ecological Footprint from 2 global hectares to 1.7.Sheler and mobility are much reduced.

This picture shows where are my clothes come from.Most clothes made in China,one hoody made in the U.S.A and 3 pieces of sweater made in Japan

To be honest,even though I didn’t receive the final E-mail,this result shocked me a lot, I never thought that so many people worked for me.I think over and over again, what I should do to change this situation,maybe reduce the consumption of clothes and cosmetics.

My current ecological footprint was 2.1 global hectares a week ago and I set my goal to reduce my footprint by 10%. To achieve this target, I made several adjustments on my daily behaviors such as avoid too much meat consumption, too long-distance of flight or travelling, too much expense on entertainment. Besides, I try to notice the efficient lighting of my surroundings. With these efforts, I do the test again to see what have changed.
My Current Ecological Footprint is 2.1 global hectares.


This is the whole systems map of air condi�oner. An air condi�oner is used for cooling or hea�ng in most of families. It is usually used with a remote control to set the mode and temperature.
Some�mes we are awareless when we use air condi�oner to adjust environment temperature that actually it does great impacts on environment in many aspects.

stainless steel,primary Iron Aluminum Copper Rubber Plas� PP-R Glass Other materials TOTALS
kg % Where used
24.5 1.8 0.6 1.7 0.33 2.9 0.42 0.4 3.85 36.5
67% 5% 1.5% 4.6% 0.9% 8% 1.2% 1.1% 10.7% 100%
Condenser,Machine shell ,Stent, Fixed plate Valve
LCA of Air Condi�oner
To get an overall view of all the impacts of the life cycle of air condi�oner, an inventory of everything within the chosen boundaries that causes environmental impacts are listed below:
Manufacturing Use

Life�me Hours / Day Use
Hea�ng Power Cooling power Yearly Power Use
Transportring Disposal
Heat exchanger fins Piping system,Valve Pipeline Machine shell ,Filter, wind mill Nets Display Misc... Material produc�on Manufacturing Transport Use Disposal 82.6 15.5 21.3 59.3 45.8
1. Okala Impact of use was the biggest among the life cycle of a wok. While using an air condi�oner, it takes large amount of energy, which means the electricity factory may cause related pollu�on to the environment. Also, the process speeding the global warming.
-
8-15 years 12 1050 w 910 w 4233.6 kWh/year
2. Material and Manufacturing come the second when comparing the levels of Okala Impact .
If we use more shipping transporta�on rather than land transporta�on, the environmental impact caused by transporta�on will reduce substan�ally.
In the dispose stage, if metal and plas�c of aircondi�oner can be recycled, it will be more environmental-friendly.
Stages of produc�on and use make the most impact on environmental. If we use greener way of produc�on and lower power consump�on, then there is high possiblity to cut down the environmental impact.


