2 minute read
Numbers Business


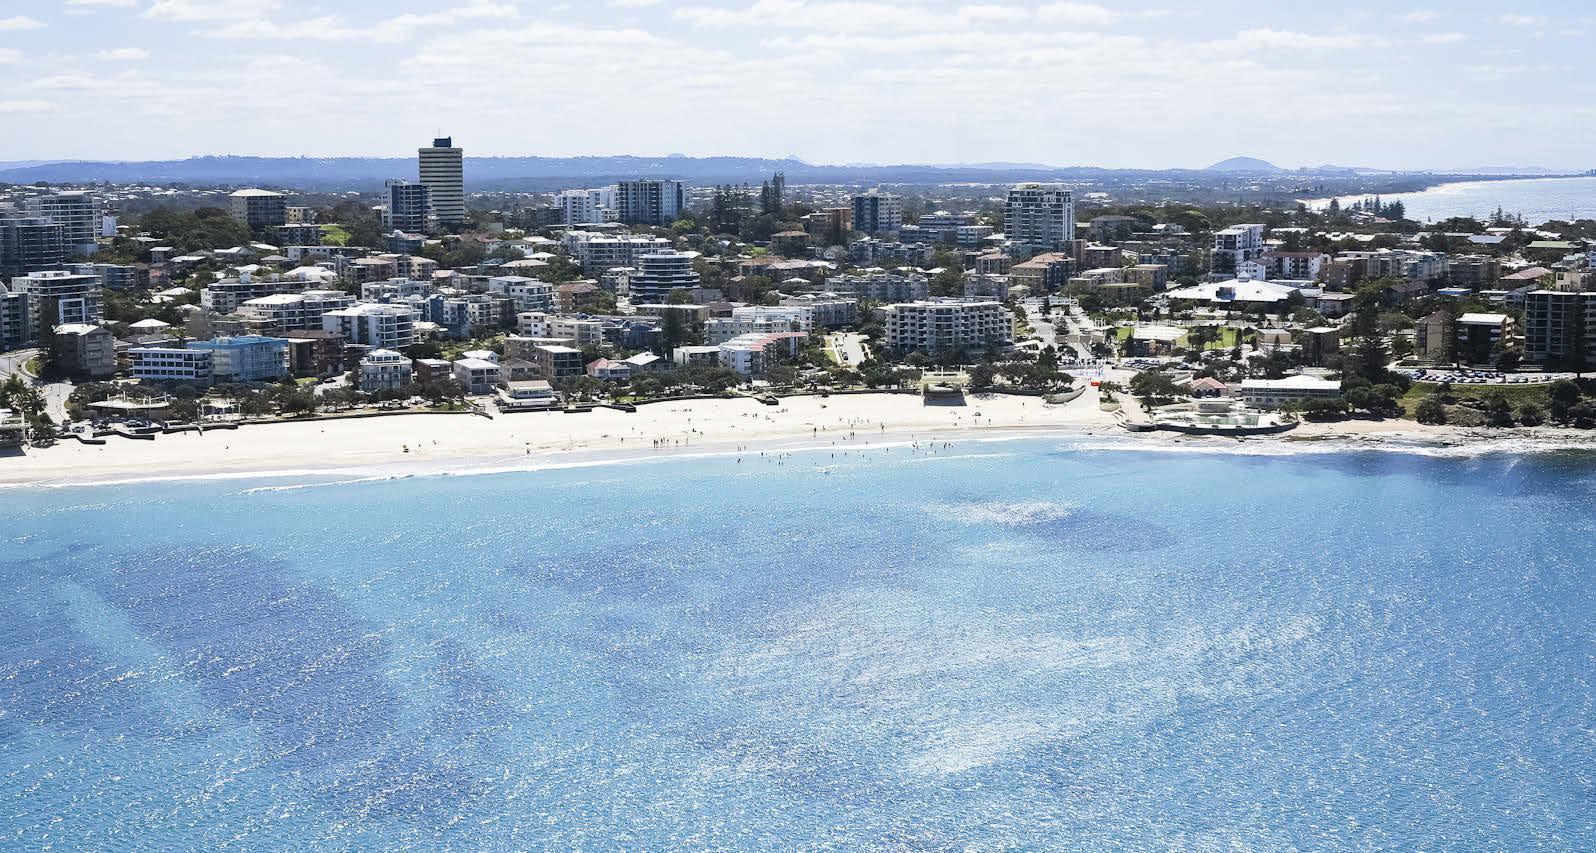
Who’s rising and who’s falling? WHERE ARE THE COAST’S BIG INCOME EARNERS?
The two reliable sources for data on incomes are the Australian Bureau of Statistics (ABS) and the Australian Tax Office (ATO). Each publish figures on personal incomes, business incomes and social service incomes.
Advertisement
ABS Census data is released every five years, the latest being 2011. ATO figures are annual, with a lag of around three years, with latest available 2012/13. Both sources point to an increasing number of higher income earners living in coastal suburbs between Wurtulla and Buderim.
With some exceptions, the ‘image’ of Noosa and Buderim as the areas where most high income earners live, is a thing of the past. Residential property prices confirm Noosa and Buderim are still preferred locations for some (usually older) ‘high net wealth’ people. However, for most Coast business people, the key interest in income figures by location is understanding where the largest volume of younger higher income earners live, as they are most likely to be regular and higher spenders and therefore good customers for day to day goods and services.
The shift southwards in higher income shows up clearly comparing personal income data from the 2001 and 2011 Census.
Top 5 personal income areas 2001 Census 1 Noosa Heads
2 Mountain Creek 3 Buderim South 4 Mooloolaba | Alexandra Heads 5 Sunshine Beach
Top 5 personal income areas 2011 Census 1 Buderim South 2 Mountain Creek 3 Buddina | Minyama
4 Buderim North 5 Peregian
The fastest rise in personal incomes (often off a lower base) from 2001 to 2011 also confirm the trends
Fastest rising personal incomes 2001-2011 1 Parrearra | Warana 2 Golden Beach | Pelican Waters 3 Beerwah
4 Wurtulla | Birtinya 5 Peregian
ATO data for 2012/13 confirm trends emerging from the earlier Census data.
Highest annual salaries by suburb 2012/13 1 Kawana 2 Buderim 3 Beerburrum 4 Mooloolah | Glenview
The figures above for Beerwah, Beerburrum and Mooloolah / Glenview can be misleading as the number of high income earners (often rural residential) is actually smaller than other locations with greater numbers of ‘average’ income earners. This echoes the Noosa experience where the high values reported on a limited number of properties tends to suggest the ‘wealth effect’ is widespread, when in fact it is not.
It reminds one of the logic ‘exercise’ in which one is asked ‘If you have met a few redheads who are quick tempered, is it reasonable to assume that all redheads are quick tempered?’ Of course not!
How might business people put the location/income figures to useful effect? First, it points where to focus marketing. Second, in a ‘free market’ the only constant is change. Each business (ie the supply side) will strive and bend the market to capture customers. But ultimately it is the ‘demand side’ where the constant flow of money comes from! A vital part of your continuing success will depend on knowing as much as possible about where most customers live, the level of their incomes, and a number of other key characteristics that determines their spending priorities and volumes.


