EDWARD C. NOLAN
JULI K. DIXON
GEORGE J. ROY
JANET B. ANDREASEN
Copyright © 2017 by Solution Tree Press
Materials appearing here are copyrighted. With one exception, all rights are reserved. Readers may reproduce only those pages marked “Reproducible.” Otherwise, no part of this book may be reproduced or transmitted in any form or by any means (electronic, photocopying, recording, or otherwise) without prior written permission of the publisher.
555 North Morton Street
Bloomington, IN 47404
800.733.6786 (toll free) / 812.336.7700
FAX: 812.336.7790
email: info@SolutionTree.com
SolutionTree.com
Visit go.SolutionTree.com/mathematics to download the free reproducibles in this book.
Printed in the United States of America
Solution Tree
Jeffrey C. Jones, CEO
Edmund M. Ackerman, President
Solution Tree Press
President: Douglas M. Rife
Editorial Director: Tonya Maddox Cupp
Managing Production Editor: Caroline Weiss
Senior Editor: Amy Rubenstein
Media Editor: Peggie Howard
Copy Chief: Sarah Payne-Mills
Copy Editor: Evie Madsen
Proofreader: Elisabeth Abrams
Text and Cover Designer: Abigail Bowen
Compositor: Laura Cox
Editorial Assistants: Jessi Finn and Kendra Slayton
Writers: Edward C. Nolan, Juli K. Dixon, George J. Roy, and Janet B. Andreasen

iii Notes to the Facilitator . . . . . . . . . . . . . . . . . . . . . . . . . . . . . . . . . . 1 Conducting the Workshop . . . . . . . . . . . . . . . . . . . . . . . . . . . . . . . . . . 2 Video Program . . . . . . . . . . . . . . . . . . . . . . . . . . . . . . . . . . . . . . . . 3 Other Resources . . . . . . . . . . . . . . . . . . . . . . . . . . . . . . . . . . . . . . . 3 Print . . . . . . . . . . . . . . . . . . . . . . . . . . . . . . . . . . . . . . . . . . . . . . . . 3 Video 3 Workshop Overview at a Glance . . . . . . . . . . . . . . . . . . . . . . . . . . . . . 5 Workshop Steps and Teaching Suggestions: Statement of Purpose . . . . . . . . . 7 Learning Objectives. . . . . . . . . . . . . . . . . . . . . . . . . . . . . . . . . . . . . . 7 Program Overview . . . . . . . . . . . . . . . . . . . . . . . . . . . . . . . . . . . . . . 7 Materials . . . . . . . . . . . . . . . . . . . . . . . . . . . . . . . . . . . . . . . . . . . 7 Activities . . . . . . . . . . . . . . . . . . . . . . . . . . . . . . . . . . . . . . . . . . . 8 Welcome and Opening . . . . . . . . . . . . . . . . . . . . . . . . . . . . . . . . . . . . . . . 8 Considering the Learner’s Role 9 Using the TQE Process . . . . . . . . . . . . . . . . . . . . . . . . . . . . . . . . . . . . . . . 9 Creating a Shared Vision 11 Engaging With Tasks . . . . . . . . . . . . . . . . . . . . . . . . . . . . . . . . . . . . . . . 12 Making Sense of Mathematical Progressions 13 Challenging Thinking. . . . . . . . . . . . . . . . . . . . . . . . . . . . . . . . . . . . . . . 15 Providing Just-in-Time Support 15 Closing . . . . . . . . . . . . . . . . . . . . . . . . . . . . . . . . . . . . . . . . . . . . . . 16 Reproducible Handouts . . . . . . . . . . . . . . . . . . . . . . . . . . . . . . . . . . 17 Task 1: Using the TQE Process 18 TQE Analysis Tool 19 Task 2: Creating a Shared Vision 20 Task 3: Engaging With Tasks 21 Classroom Video Analysis Tool . . . . . . . . . . . . . . . . . . . . . . . . . . . . . . . . .22 Task 4: Making Sense of Mathematical Progressions . . . . . . . . . . . . . . . . . . . . . . .23 Task 5: Challenging Thinking . . . . . . . . . . . . . . . . . . . . . . . . . . . . . . . . . . 24 Task 6: Providing Just-in-Time Support . . . . . . . . . . . . . . . . . . . . . . . . . . . . . 25
Reproducible pages are in italics .
Table of Contents
Notes to the Facilitator

This workshop provides participants with the opportunity to engage in mathematics as learners in order to make sense of that mathematics for teaching. This workshop is intended to support teachers and teacher leaders in situating this knowledge within learning progressions, classrooms, and the TQE (tasks, questioning, and evidence) process. The TQE process describes three key aspects of the teacher’s role: (1) selecting, adapting, or creating worthwhile tasks to address a specific learning goal; (2) using targeted and appropriate questioning strategies to support all learners; and (3) collecting evidence of students’ conceptual understanding and misconceptions related to the learning goal.
This workshop addresses three specific learning goals.
1. To explore meaningful tasks as learners of mathematics for teaching
2. To make sense of the TQE process
3. To create a shared vision of classrooms where teachers are supporting the TQE process and students are engaged in meaningful mathematics learning experiences
These goals are accomplished through the use of challenging tasks for teachers, questions related to using those tasks in classrooms, and classroom video where the tasks are modeled during instruction. Series authors introduce classroom video by highlighting important aspects of this workshop specifically, and making sense of mathematics for teaching in general.
The workshop is divided into nine segments, and the corresponding video clip titles are listed in parentheses.
1. Welcome and Opening: This segment describes the series’ organization around a common structure—The Challenge, The Progression, The Mathematics, The Classroom, and The Response. Participants discuss the importance of making sense of mathematics for teaching in their own teaching and related roles.
2. Considering the Learner’s Role: This segment allows participants to set their own goals for the workshop and connect to their role as learners in the teaching of mathematics.
3. Using the TQE Process (Making Sense of Models): Participants explore a pattern task and consider multiple representations that might be challenging for students. They discuss the processes they use to find solutions and anticipate how students might solve the same task. Participants then watch the video of a Making Sense of Mathematics for Teaching series’ author as she defines and shares the importance of the TQE process. The participants go on to watch the classroom video using the same task they just explored. A follow-up discussion will connect what the participants observed in the video clip to the TQE process and the importance of planning for the TQE process.
1
4. Creating a Shared Vision (Solving a Percent Problem): This segment starts with participants viewing an author video discussing the importance of creating a shared vision of classroom discussion. Participants then anticipate how sixth-grade students might respond when asked to make sense of the whole when they are given a part of the whole and a percent of the whole.
5. Engaging With Tasks (Exploring Different Ways That Lines Can Intersect): In this segment, participants consider how their thinking as learners impacts the way they teach. They view an author video discussing the role of teaching professionals as a community of learners, engaging in thinking about mathematics in rich and deep ways, and then using that to teach their students. The classroom video then explores how students make sense of intersecting lines, and how teachers should best support students during instruction.
6. Making Sense of Mathematical Progressions (Interpreting Graphs to Create Context): This segment helps participants make connections between making sense of lines in middle school and interpreting the context of situations using graphs in high school. Participants discuss how the topics are related and fit into a learning progression that crosses grades.
7. Challenging Thinking (Dividing Fractions in Context): In this segment, participants consider how tasks can challenge their teaching by exploring a task involving modeling the division of fractions in context. After considering different ways to make sense of the task, the classroom video presents a student misconception based on a specific type of manipulative and how students interpret the manipulative.
8. Providing Just-in-Time Support (Using a Table to Reason Proportionally): This segment connects how teachers support one another in collaborative teams to how they support students during instruction. Participants watch a video that shows multiple ways to complete a ratio table during classroom instruction.
9. Closing: In this segment, participants reflect on what they have learned in the workshop and plan for next steps.
Conducting the Workshop
This workshop is designed to last about eight hours. It can be scheduled for a single day consisting of two sessions or be scheduled over two days. All the professional development materials you need to conduct this workshop—the facilitator’s guide with detailed teaching suggestions and the video resources— are provided in this package. To conduct a successful learning event, please consider the important issues that follow.
Preparation: Please view the entire video program, read all materials, and complete all activities yourself before leading the workshop.
Location: The workshop should take place in an area that is large enough for individual, team, and whole-group work.
Equipment: You will need a DVD player, a projector, and one or more monitors. You will also need a computer projector to show PowerPoint slides.
MAKING SENSE OF MATHEMATICS FOR TEACHING GRADES 6 – 8 2
Reproducible handouts and PowerPoint presentation: Reproducible handouts are included with this guide (starting on page 18 and on the CD). The handouts should be duplicated before the workshop begins and be distributed to participants according to the workshop instructions. A PowerPoint presentation is also included (on the CD).
Additional equipment: You will also need colored toothpicks, pattern blocks or other manipulatives, flip charts, chalkboards, or whiteboards with appropriate writing materials (blank paper and markers, pens, or pencils) to conduct the workshop.
Refreshments: The workshop’s agenda should include one or more breaks at which beverages are offered. Snacks and lunch are optional, but water should be available throughout the workshop.
Video Program
This workshop incorporates a video program that is approximately forty-five minutes in length. The video will be used throughout the workshop. It is used to introduce some segments and to close others. Most often, the video provides both a suggestion for what to look for during planning and instruction as explained by series authors as well as an example of what model instruction looks like in the classroom through authentic classroom video. It might be helpful to replay certain video portions for participants and also to pause so participants can reflect on what they have seen.
Other Resources
Print
Making Sense of Mathematics for Teaching Grades K–2
Making Sense of Mathematics for Teaching Grades 3–5
Making Sense of Mathematics for Teaching High School
Video
Making Sense of Mathematics for Teaching Grades K–2: The TQE Process
Making Sense of Mathematics for Teaching Grades 3–5: The TQE Process
Making Sense of Mathematics for Teaching High School: The TQE Process
Notes to the Facilitator 3
Workshop Overview at a Glance
15–30
15–30

Welcome and Opening
Considering the Learner’s Role
Slides 1–2
60–90 Using the TQE Process (Making Sense of Models) Slides 3–12
“Task 1: Using the TQE Process” “TQE Analysis Tool”
45–60
45–60
45–60
45–60
Creating a Shared Vision (Solving a Percent Problem)
Engaging With Tasks (Exploring Different Ways That Lines Can Intersect)
Making Sense of Mathematical Progressions (Interpreting Graphs to Create Context)
Slides 13–17
“Task 2: Creating a Shared Vision” “TQE Analysis Tool”
Slides 18–22
“Task 3: Engaging With Tasks”
“Classroom Video Analysis Tool”
Slides 23–29
“Task 4: Making Sense of Mathematical Progressions”
“TQE Analysis Tool”
Challenging Thinking (Dividing Fractions in Context) Slides 30–33
“Task 5: Challenging Thinking” “TQE Analysis Tool”
45–60
Providing Just-in-Time Support (Using a Table to Reason Proportionally)
Slides 34–39
“Task 6: Providing Just-in-Time Support”
30–45 Closing Slides 40–41
5
Time
minutes)
(in
Segment PowerPoint Slides and Reproducible Handouts
Workshop Steps and Teaching Suggestions: Statement of Purpose

It is important for participants to first engage in productive struggle around high-cognitive-demand tasks as learners, and then to plan for how those same tasks might be supported during instruction through the use of appropriate questioning as teachers. Use the videos to explore how evidence can be collected as part of the formative assessment process during instruction.
Learning Objectives
After viewing the video and participating in the workshop activities, participants will be able to:
Identify high-cognitive-demand tasks
Adapt existing low-cognitive-demand tasks to make them high-cognitive-demand tasks
Plan questions to support students to engage in productive struggle around high-cognitivedemand tasks
Collect evidence of student conceptions and misconceptions through productive questioning while students work to solve tasks
Program Overview
The video associated with this workshop offers perspectives from Making Sense of Mathematics for Teaching series’ authors Edward C. Nolan, Juli K. Dixon, George J. Roy, Janet B. Andreasen, and Thomasenia Lott Adams related to mathematics content knowledge for teaching, the TQE process, and progressions for learning mathematics. Edward, Juli, and George model best practices through authentic classroom video to create a shared image of students engaged in meaningful experiences related to mathematics learning.
Materials
Video program: Making Sense of Mathematics for Teaching Grades 6–8: The TQE Process
PowerPoint presentation slides
Reproducible handouts:
“Task 1: Using the TQE Process”
“TQE Analysis Tool”
7
“Task 2: Creating a Shared Vision”
“Task 3: Engaging With Tasks”
“Classroom Video Analysis Tool”
“Task 4: Making Sense of Mathematical Progressions”
“Task 5: Challenging Thinking”
“Task 6: Providing Just-in-Time Support”
Flip charts, chalkboards, or whiteboards and appropriate writing materials
Pattern blocks or other manipulatives
Activities
It is best to follow the activities as outlined in the workshop teaching suggestions and pause the video when prompted. After showing each video segment, allow participants time to comment or ask questions about the material. If requested, you can replay video portions as participants consider the questions and activities.
Welcome and Opening
1. Welcome participants to the workshop, and introduce yourself and anyone else serving as a workshop host, cofacilitator, or organizer.
2. If participants do not know one another well, conduct an icebreaker. Ask participants to form pairs and interview each other for about five minutes. Then ask the pairs to introduce each other to another pair, stating the person’s name, something interesting or different about the person, and what the person hopes to gain from the workshop.
3. Begin the workshop showing PowerPoint slide 1, then begin the DVD as Juli discusses the need for making sense of mathematics for teaching. Juli describes how the text is organized as well as how teachers experience mathematics tasks within the text as learners and then as facilitators of mathematics learning. Pause the video at the “Pause for group work” screen. Have the participants provide their perspectives on their role in this process. Use the following questions as a guide.
i. When was the last time you experienced mathematics as a learner?
ii. Where are you in understanding the progression of the 6–8 standards?
iii. What should those standards look like in a classroom? Who decides?
iv. How do you respond to students when they do or do not understand?
v. What questions do you ask to assess students’ understanding in relation to a specific standard?
4. Show slide 2 to provide a general overview of the session goals. Within this session, participants will explore various mathematics tasks as learners, make sense of those tasks through the TQE
MAKING SENSE OF MATHEMATICS FOR TEACHING GRADES 6 – 8 8
process, and create a shared image of classrooms where teachers use the TQE process to ensure students are engaged in meaningful mathematics learning experiences.
Considering the Learner’s Role
This segment is designed to help participants set their own goals for the workshop and connect to their role as learners in the teaching of mathematics.
1. Click on “Next Segment” to watch Edward discuss some of the ways the book can be used to support effective mathematics learning and teaching.
2. Pause the video at the “Pause for group work” screen. Then ask participants, “What are your goals for this workshop?” “How do you expect participating in mathematics tasks as a learner to impact your teaching?”
Using the TQE Process
This segment is designed to help participants see the value of using the TQE process by being intentional about selecting tasks, asking students targeted questions, and collecting evidence of students’ conceptions and misconceptions.
1. Show slide 3, then show slide 4 and distribute the handout “Task 1: Using the TQE Process.” This task will help participants see the value of using the TQE process by exploring a pattern task and considering multiple representations that might be challenging for students.
2. Ask participants to complete the task. Make sure that participants see there are 7 beams in a bridge of length 2 and 11 beams in a bridge of length 3.
i. Ask participants how they determined the bridges of lengths 5 and 10.
ii. Observe the different ways participants make sense of the task. Look to see if everyone is using the same strategy or if they are using different ones.
a. How many drew the new picture (and drew length 4 first)?
b. How many looked for a pattern in the numbers?
c. How many remembered that we skipped 4?
3. Show slide 5. Ask participants to create a general formula for the number of beams in any bridge. How do they create the equation, and how can they use the diagram to justify their equation? As participants create a general formula, look for what expressions they create and ask them to justify each expression with the diagram.
4. Show slide 6 and ask participants which expressions, if any, they came up with. Have participants justify each expression, beginning with the ones they came up with themselves. Consider using colored toothpicks or colored markers to show each representation and to help highlight the reasoning and justification with the diagram. Possible reasoning:
i. 3 + 4 (n – 1)— Start with one triangle, then add a triangle and a top connector one fewer times than the length of the bridge.
Workshop Steps and Teaching Suggestions: Statement of Purpose 9
ii. n + 2n + (n – 1)—Use the base beam and two beams to complete a triangle, and then one fewer number than the length of the bridge to create the top.
iii. 3n + (n – 1)—The length is the same as the number of triangles, so participants need three beams for each triangle and then one fewer beam than the length along the top.
iv. 4 (n – 1) + 3—Four beams comprise one set of three beams in a triangle and one beam extending along the top of the bridge. There is one less of these sets than the length n and a triangle of three beams at the end.
v. 4n – 1—Four times the number of triangles, then remove one beam.
5. Show slide 7. The goal of this task is to support participants to make sense of the TQE process. They explored the task, so now they will explore the questions they might use with students. Eventually, they will watch the video to see what evidence was collected. Ask participants to consider how to support multiple strategies that students would use for the task.
6. Show slide 8 and click on “Next Segment” to watch Thomasenia discuss the TQE process. Pause the video at 2:00.
7. Show slide 9 as an overview of the TQE process. Then, show slide 10. Resume the video, showing the clip “Making Sense of Models.” As participants watch the video clip of students exploring the task they just completed, the participants should be looking for the ways the teacher implemented the TQE process in the classroom.
i. Have participants use the “TQE Analysis Tool” to capture what they see in the video. Suggested pauses:
a. Pause at 4:26—Ask participants, “How did the teacher use questioning with the first group of students?” “What types of questions did she ask?” “How did the student responses guide her follow-up questions?”
b. Pause at 5:16—A student answers the question of how many beams in a bridge of length 10. Ask, “Why did the teacher not ask students to justify this?” “What evidence had she collected?” “How did she add to the task at this point?”
ii. Ask participants to discuss in small groups how the teacher helped the last group at the end of the video clip. Ask:
a. “How did she help the group make sense of 4n – 1?”
b. “How are these representations different?”
c. “How are these the same?”
d. “How did the teacher use the TQE process to help her?”
8. Pause the video at the “Pause for group work” screen.
9. Show slide 11. Ask participants if the classroom video was what they anticipated. Discuss the importance of using classroom video to develop a shared understanding and vision of the mathematics and how to support mathematics in the classroom. After this discussion and after entertaining participants’ questions, ask participants how the teacher supported students to
MAKING SENSE OF MATHEMATICS FOR TEACHING GRADES 6 – 8 10
Workshop Steps and Teaching Suggestions: Statement of Purpose 11
engage in a challenging task. Participants should indicate that the teacher did not give away the answers but rather assessed for understanding and then asked probing questions to guide students to the important relationships with patterns and multiple representations that are often challenging for them to grasp.
10. Show slide 12 as a review of the TQE process. Ask if participants have any questions.
Creating a Shared Vision
This segment is designed to help participants see the value of using classroom video to create a shared image of classroom instruction.
1. Show slide 13. Click on “Next Segment” to watch Juli discuss using classroom video. Pause the video at 39 seconds.
2. Show slide 14. Ask participants, “How might sixth-grade students solve the percent problem?” “What would instruction centered around the percent problem look like?”
3. Facilitate a discussion so participants can compare their visions for classroom discussion to see if they are the same. They are likely not the same.
4. Distribute the handout “Task 2: Creating a Shared Vision,” and ask participants to solve its problem. Look for whether participants are using the same strategy or different ones. Look for pictorial and numerical responses. Distribute the handout “TQE Analysis Tool.” Show slide 15. Ask participants, “How does the task lend itself to a wide range of responses?”
5. Resume the video to watch the clip “Solving a Percent Problem” focusing on how the students engage with the task. Have participants use the “TQE Analysis Tool” to capture what they see in the video. Discuss the TQE process by pausing the video throughout the classroom section. Suggested pauses:
i. Pause at 2:55—Ask participants:
a. “Why does the teacher ask a student to finish another student’s reasoning?
b. “Why does the teacher go back to the original student?”
c. “How do the teacher’s questions support the reasoning of both students?”
ii. Pause at 4:05—Put participants in small groups and ask, “How do the students’ drawings provide evidence of their understanding?”
6. Pause the video at the “Pause for group work” screen.
7. Show slide 16 and debrief as a whole group. Ask participants:
i. “What did you notice?”
ii. “What questions do you have?”
iii. “How did the teacher use the TQE process?”
8. Ask participants about the TQE process, what questions the teacher used, and what evidence the teacher was able to collect after this discussion and after entertaining participants’ questions.
9. Ask participants what they think the teacher should do next.
10. Discuss how viewing the video together helps guide a productive discussion regarding next steps in creating a shared classroom vision.
11. Show slide 17. Connect what participants observed with the questions they considered and the anticipated evidence for Mathematical Practices. Remind participants that the practices are about what the students are doing, not the teacher.
Engaging With Tasks
This segment is designed to help participants consider how their thinking as learners impacts the way they teach, and the impact of their team on their teaching practices.
1. Show slide 18.
2. Show slide 19 and distribute the handout “Task 3: Engaging With Tasks.” Ask participants, “How might your thinking about this task impact how you guide instruction for your students?”
3. Discuss different points of view.
4. Show slide 20. One goal of this discussion is for participants to learn the importance of completing tasks in their professional learning communities to better prepare for the types of questions and responses they can anticipate during instruction.
5. Click on “Next Segment” to watch George discuss these questions. Pause the video at 31 seconds. Ask:
i. “How does being part of a community of learners help create a shared vision of classroom instruction?” (This question bridges the previous segment.)
ii. “How does the selection of tasks impact the type of learning environment in your classroom?”
iii. “How does engaging in rich mathematical tasks yourself impact how you teach?”
iv. “How does working collaboratively in your teacher team help you work with your students?”
6. Show slide 21 and have participants discuss:
i. “What types of successes and challenges do you anticipate students having with the task shown on slide 19?”
ii. “What questions would you ask students during this task?”
iii. “What responses do you anticipate, and what will you do based on each response?”
7. Distribute the handouts “Classroom Video Analysis Tool” and “TQE Analysis Tool.” Resume the video, showing the clip “Exploring Different Ways That Lines Can Intersect.” Ask participants to use the “Classroom Video Analysis Tool” and “TQE Analysis Tool” to capture what they see in the video clip. To discuss the TQE process, pause the video throughout. Suggested pauses:
MAKING SENSE OF MATHEMATICS FOR TEACHING GRADES 6 – 8 12
i. Pause at 1:17—Ask participants, “Why is having students predict an important part of their mathematical thinking?” “How would the teacher change the problem’s rigor if he told students they were correct or incorrect?”
ii. Pause at 2:19—Ask participants, “Why didn’t the teacher provide feedback to the students after this discussion?”
iii. Pause at 2:58—Ask participants, “Why did the teacher purposefully choose not to show the graphs when students made their predictions?” “How does each representation (algebraic and graphical) help students reason about the problem?”
iv. Pause at 4:48—Ask participants, “How do the teacher’s questions support the students’ thinking?”
8. Pause at the “Pause for group work” screen. Ask participants, “How did the teacher facilitate a whole-class discussion to highlight the number of intersection points between two lines?”
9. Show slide 22. Ask participants if the classroom video was what they anticipated. Specifically, ask:
i. “What did you notice?”
ii. “What questions do you have?”
iii. “How did questioning support student engagement with the task?” “What different questions would you ask?” “Why?”
iv. “What evidence did the teacher collect?”
10. Wrap up the section by asking:
i. “How did the teacher incorporate the TQE process in instruction?”
ii. “Why did the teacher sequence the tasks the way he did?”
iii. “How did completing the task and considering questions prior to watching the video change what you observed and how you were impacted by it?”
Making Sense of Mathematical Progressions
This segment is designed to help participants explore teaching with coherence and learning progressions.
1. Show slide 23 and distribute the handout “Task 4: Making Sense of Mathematical Progressions.”
2. Show slide 24. Allow time for participants to write and share stories. Listen carefully for accuracy about the meaning of the actions at points A, B, and C, as well as the use of terms such as speed, rate, and distance. Stories about graphs allow participants to make mathematical connections among multiple representations. Have participants consider how this is a rich task.
i. Discuss the merits of the task and how it engages students.
ii. Discuss possible misconceptions students may demonstrate and what to do about them (through questioning and the collection of evidence). One misconception is a student’s visual misunderstanding of the rate of change; she sees the father and son running uphill. Other misconceptions involve what happens at the point of intersection. Students say the son starts to run faster.
Workshop Steps and Teaching Suggestions: Statement of Purpose 13
3. Show slide 25. Have participants discuss how this task is similar to or different from the previous task on the number of intersections between lines.
4. After listening to ideas from participants, click on “Next Segment” to watch Edward provide the foundation for this segment on learning progressions. Pause the video at 22 seconds. Ask participants, “Why is it important for teachers to know what comes before and after their grade levels’ or courses’ content?”
5. Show slide 26. The following question helps guide participants with what to look for in the video. Ask participants, “How does the teacher incorporate the TQE process?”
6. Show slide 27. Review the TQE process.
7. Distribute the handout “TQE Analysis Tool.” Resume the video to view the clip “Interpreting Graphs to Create Context.” Have participants use the “TQE Analysis Tool” to capture what they see in the video. Suggested pauses:
i. Pause at 1:41—Ask participants, “Why didn’t the teacher correct the students about the ‘son starting to go faster’ than the father?” “What is the common misconception students have?”
ii. Pause at 2:18—Ask participants, “Why doesn’t the teacher provide feedback to the students yet?”
iii. Pause at 3:58—Ask participants, “What moves did the teacher make to help the students make sense of the problem?”
iv. Pause at 6:35—Ask participants:
a. “How does whole-class discussion help surface misconceptions?”
b. “How does the graph help students understand the problem?”
c. “How do common errors provide a learning opportunity for students?”
d. “How do you create an environment where students feel comfortable sharing their thinking?”
8. Pause at the “Pause for group work” screen.
9. Show slide 28. Ask participants if the classroom video was what they anticipated. Then ask participants, “What misconceptions did the students demonstrate?” “How did the teacher address these misconceptions?”
10. Ask participants how the teacher incorporated the TQE process in instruction.
11. Show slide 29. Ask participants:
i. “How is this video similar to or different from the previous video focused on the number of intersections between lines?”
ii. “How would you make connections to the TQE process?”
iii. “What other mathematics topics cross grade bands in similar ways?”
MAKING SENSE OF MATHEMATICS FOR TEACHING GRADES 6 – 8 14
Challenging Thinking
This segment is designed to help participants consider how making sense of tasks can challenge their teaching and possibly create student misconceptions.
1. Show slide 30 and distribute the handout “Task 5: Challenging Thinking.” This task is designed to allow participants to explore different ways to make sense of a task, specifically fraction division.
2. Show slide 31. Distribute pattern blocks or other manipulatives. Ask participants to solve the problem through modeling. Pattern blocks used in the video provide a helpful link to what is observed. Encourage participants to link their solution to their models, particularly if the solution includes an equation or algorithm.
3. Click on “Next Segment” to see Janet discuss challenging the thinking of all learners—teachers and students. Pause at 38 seconds. Ask participants, “Why is it important to continually challenge the views of the learner (sometimes a teacher, sometimes a student) when learning mathematics?” “How does the light-bulb moment for teachers impact the way they teach the task?”
4. Show slide 32 and distribute the handout “TQE Analysis Tool.” Ask participants how they think students will engage with this task.
5. Resume the video, showing the clip “Dividing Fractions in Context.” Have participants fill in the “TQE Analysis Tool” as they watch the video. Suggested pauses:
i. Pause at 2:17—Ask, “How did this group engage in the task?”
ii. Pause at 3:17—Ask, “How did this group engage in the task?” “How has the teacher used questioning as she engages with the groups?”
6. Pause at the “Pause for group work” screen.
7. Show slide 33. Ask participants if the classroom video was what they anticipated.
i. Participants should see that the teacher used questions to assess the different levels of students’ thinking. Notice also that the teacher does not provide feedback to students about whether their answers are correct, but waits until the whole-class discussion to determine the correct solution.
ii. The teacher collected evidence that showed some students began with misconceptions but then came to a good understanding. Some students represented a common error, but the whole-class discussion was used to allow the students to learn from one another.
Providing Just-in-Time Support
This segment is designed to show participants how they support one another in collaborative teams and students during instruction.
1. Show slide 34.
2. Show slide 35 and distribute the handout “Task 6: Providing Just-in-Time Support.” Challenge participants to use different strategies to complete different pieces of the table, thinking about what strategy would be appropriate for different reasons.
Workshop Steps and Teaching Suggestions: Statement of Purpose 15
3. Show slide 36. Ask participants to consider the questions and allow time for discussion.
4. Click on “Next Segment” to watch Juli discussing just-in-time support. Pause at 34 seconds. Help participants make connections between the support offered by the authors and how they can support one another and students. This kind of support provides the correct type of support at the correct time and the teacher asking questions instead of giving answers. This support can also be linked back to the TQE process and the goal of asking the best questions to gain evidence of student understanding.
5. Show slide 37. Resume the video and have participants watch the clip “Using a Table to Reason Proportionally.” Consider ways the teacher guides the students to make sense of particular strategies.
6. Pause at 4:28. Ask, “What strategy was this group using?” “What strategy was the teacher trying to direct them to use?” After this discussion ask, “How did the teacher connect different strategies to complete the ratio table?”
7. Ask participants, “How might a focus on unit rate and between and within relationships in ratio equivalence connect to topics in later grades?”
8. Play the video to the end. Connect how the teacher supported students in making sense of the different strategies, and how that connection parallels the support teachers provide one another in collaborative teams.
9. Show slide 38. Ask participants if the classroom video was what they anticipated.
10. Show slide 39. Revisit the TQE process. Ask, “How was the TQE process illustrated in the last video?”
Closing
This segment reviews the TQE process.
1. Show slide 40 and revisit the session goals.
2. Click on “Next Segment” to watch Edward discussing the connections between the workshop and the book series.
3. Show slide 41 and ask participants, “What is your biggest takeaway from the workshop, and how will you use what you learned?”
4. Ask participants what kind of support they might need as they implement the things they have learned during the workshop.
MAKING SENSE OF MATHEMATICS FOR TEACHING GRADES 6 – 8 16

REPRODUCIBLE HANDOUTS
Task 1: Using the TQE Process
Bridge length: 2 beams
Bridge length: 3 beams
Making Sense of Mathematics for Teaching Grades 6–8: The TQE Process © 2017 Solution Tree Press • SolutionTree.com Visit go.SolutionTree.com/mathematics to download this free reproducible. REPRODUCIBLE 18
1. How many beams are in each bridge?
2. How many beams are in a bridge of length 5?
3. How about a bridge of length 10?
Making Sense of Mathematics for Teaching Grades 6–8: The TQE Process © 2017 Solution Tree Press • SolutionTree.com Visit go.SolutionTree.com/mathematics to download this free reproducible.
19
Describe the Task Describe the Questioning Describe the Evidence Collected
REPRODUCIBLE
TQE Analysis Tool
Task 2: Creating a Shared Vision
Solve the problem: How many students are in a class if 75% of the students equals 24?
Making Sense of Mathematics for Teaching Grades 6–8: The TQE Process © 2017 Solution Tree Press • SolutionTree.com Visit go.SolutionTree.com/mathematics to download this free reproducible.
20
REPRODUCIBLE
REPRODUCIBLE 21
Task 3: Engaging With Tasks
Predict which two equations will be parallel when graphed and which two equations will intersect when graphed.
Equation 1 x + 3y = 3
Equation 2 y = –1/ 3 x – 2
Equation 3 y = 3x + 1
Equation 4 2x = –6y + 6
Making Sense of Mathematics for Teaching Grades 6–8: The TQE Process © 2017 Solution Tree Press • SolutionTree.com Visit go.SolutionTree.com/mathematics to download this free reproducible.
REPRODUCIBLE 22
Classroom Video Analysis Tool
Describe the student discourse.
Describe the teacher actions that support student engagement.
Which Mathematical Practices are emphasized?
What expectations (spoken or understood) are communicated to the students?
Making Sense of Mathematics for Teaching Grades 6–8: The TQE Process © 2017 Solution Tree Press • SolutionTree.com Visit go.SolutionTree.com/mathematics to download this free reproducible.
Task 4: Making Sense of Mathematical Progressions
This task involves a father (F) and son (S) 100-meter race. Write a story that matches the graph. Be sure to include what is occurring at A, B, and C as well as the intervals in between.
Making Sense of Mathematics for Teaching Grades 6–8: The TQE Process © 2017 Solution Tree Press • SolutionTree.com Visit go.SolutionTree.com/mathematics to download this free reproducible. REPRODUCIBLE 23
0 2 4 6 8 10 Distance (meters) A B S F C Time (seconds) 100 80 60 40 20 0
Task 5: Challenging Thinking
Solve the problem: Douglas ordered 5 small pizzas during the great pizza sale. He ate 1/6 of one pizza and wants to freeze the remaining 4 5 /6 pizzas. Douglas decides to freeze the remaining pizza in serving-size bags. A serving of pizza is 2/ 3 of a pizza. How many servings can he make if he uses up all the pizza?
Making Sense of Mathematics for Teaching Grades 6–8: The TQE Process © 2017 Solution Tree Press • SolutionTree.com Visit go.SolutionTree.com/mathematics to download this free reproducible.
24
REPRODUCIBLE
REPRODUCIBLE 25
Task 6: Providing Just-in-Time Support
Solve the problem: You work in a grocery store. Your boss gives you the following table to make sure the prices of various sizes of lemonade are proportional.
Fill in the missing values in order to determine the price or size of each lemonade container.
Making Sense of Mathematics for Teaching Grades 6–8: The TQE Process © 2017 Solution Tree Press • SolutionTree.com Visit go.SolutionTree.com/mathematics to download this free reproducible.
Price ($) 1.50 3 9 16 Container Size (ounces) 8 10 24 32 64 116
Making Sense of Mathematics for Teaching Grades K–2
Juli K. Dixon, Edward C. Nolan, Thomasenia Lott Adams, Lisa A. Brooks, and Tashana D. Howse
Develop a deep understanding of mathematics. With this user-friendly resource, grades K–2 teachers will explore strategies and techniques to effectively learn and teach significant mathematics concepts and provide all students with the precise, accurate information they need to achieve academic success.
BKF695
Making Sense of Mathematics for Teaching Grades 3–5
Juli K. Dixon, Edward C. Nolan, Thomasenia Lott Adams, Jennifer M. Tobias, and Guy Barmoha
Develop a deep understanding of mathematics. With this user-friendly resource, grades 3–5 teachers will explore strategies and techniques to effectively learn and teach significant mathematics concepts and provide all students with the precise, accurate information they need to achieve academic success.
BKF696
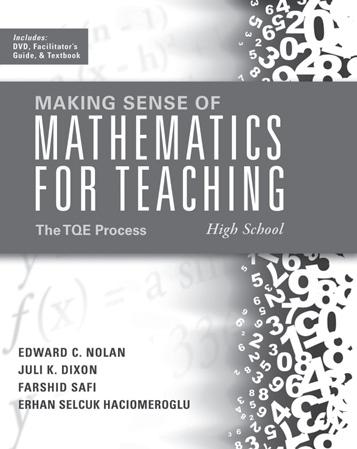
Making Sense of Mathematics for Teaching High School
Edward C. Nolan, Juli K. Dixon, Farshid Safi, and Erhan Selcuk Haciomeroglu
Develop a deep understanding of mathematics. With this user-friendly resource, high school teachers will explore strategies and techniques to effectively learn and teach significant mathematics concepts and provide all students with the precise, accurate information they need to achieve academic success.
BKF698
Making Sense of Mathematics for Teaching Grades 3–5: The TQE Process
Juli K. Dixon, Edward C. Nolan, Thomasenia Lott Adams, Jennifer M. Tobias, and Guy Barmoha
This multimedia workshop helps create a shared vision of classrooms where teachers and students are engaged in meaningful mathematics learning experiences.
DVF068
Making Sense of Mathematics for Teaching High School: The TQE Process
Edward C. Nolan, Juli K. Dixon, Farshid Safi, and Erhan Selcuk Haciomeroglu
This multimedia workshop helps create a shared vision of classrooms where teachers and students are engaged in meaningful mathematics learning experiences.
DVF070

Visit SolutionTree.com or call 800.733.6786 to order.
Bonus Online Video Content
Video Content
DIG DEEP INTO CONTENT
DIXON NOLAN ADAMS
Bring Dixon Nolan Adams Mathematics experts to your school


Our Services
1. Big-Picture Shifts in Content and Instruction
Janet B. Andreasen
Guy Barmoha
Lisa Brooks
Kristopher Childs
Craig Cullen
Brian Dean
Lakesia L. Dupree
Jennifer Eli
Erhan Selcuk Haciomeroglu
Tashana Howse
Stephanie Luke
Amanda Miller
Samantha Neff
George J. Roy
Farshid Safi
Jennifer Tobias
Taylar Wenzel
3. Implementation Workshops
2. Content Institutes
Introduce content-based strategies to transform teaching and advance learning.
Build the capacity of teachers on important concepts and learning progressions for grades K–2, 3–5, 6–8, and 9–12 based upon the Making Sense of Mathematics for Teaching series.
Evidence of Effectiveness


Support teachers to apply new strategies gained from Service 2 into instruction using the ten high-leverage team actions from the Beyond the Common Core series.
4. On-Site Support
Discover how to unpack learning progressions within and across teacher teams; focus teacher observations and evaluations on moving mathematics instruction forward; and support implementation of a focused, coherent, and rigorous curriculum.


▶
Juli K. Dixon
Thomasenia
Lott Adams
Edward C. Nolan
Pasco County School District
Land O’ Lakes, FL Demographics •4,937 Teachers •68,904 Students •52% Free and reduced lunch Discovery Education Benchmark Assessments Grade EOY 2014 % DE EOY 2015 % DE 2 49% 66% 3 59% 72% 4 63% 70% 5 62% 75%
|
Clouse, Geometry PLC leader, River Ridge High School, New Port Richey, Florida Contact your local representative 888.409.1682
MATHEMATICS The River Ridge High School Geometry PLC went from ninth out of fourteen high schools in terms of Geometry EOC pro ciency in 2013–2014 to rst out of fourteen high schools in Pasco County, Florida, for the 2014–2015 school year.” Katia


