5 minute read
4. Modelling of EV smart charging benefits at end-user level


Figure 2 summarizes key values for each category and how they must ultimately coordinate to realize those benefits.
The first area to focus on is end-user economics, as the primary decision maker and investor. Customer side charging optimization focuses on the management of energy resources inside the building energy system. It is essentially based on retail tariff data and management of local loads and resources. But these optimization levers also generate some implicit/benefits to system operators.
Advertisement
Then, the system operator can also leverage EVs for grid side optimization. It focuses on the response of the EV to a real-time signal from the grid or electricity market (explicit flexibility). The primary beneficiaries of this optimization are the grid and system operators, even though the end-user is ultimately compensated for the service.
The core focus of this report is to clarify benefits of smart charging at end user level, thru a detailed modelling exercise to quantify those in different contexts (chapter 2). Grid optimization is also reviewed, leveraging current literature on the topic, and feedbacks from existing projects in operations (chapter 3).
Customer side
Charging cost reduction
EV Charging optimization
Avoided building electrical system costs CO2 emissions reduction from mobility Additional revenues
ImplicitValue transfer Remuneration
Grid-side
Grid optimization thanks to EVs
Avoided Infrastructure costs
Avoided Operational costs
Figure 2: Sources of customer and grid benefits from smart charging under study4
Page 2
4. Modelling of EV smart charging benefits at end-user level
The key instrument we use to quantify these benefits is the Total Cost of Charging (TCC). It is derived from the cost of electricity used for charging, as well as upfront costs (Capex) and other operational expenses (Opex) of the charging system. Around 120 charging use cases were modeled.
The general idea driving our use case building methodology is to get as close as possible to real-life conditions in any given context. The constraints and opportunities stemming from these different situations help define the relevant smart charging strategy which is then modelled thru a specific algorithm.
Key parameters are regrouped in three blocks (Figure 3), with each block being influenced by the choices made in the previous one5 .
Figure 3: Method for use case modelling and charging strategy design
Confidential Property of Schneider Electric | Energy Management Business | Industrial Design & Ergonomic | Page 3

Our model focuses on 3 building types which represent the bulk of end-user charging opportunities: Households (H), Multi-dwelling (MD) residential and Commercial and Industrial buildings (C&I)6. Four different geographies are selected to understand how local rules and specificities impact the value of smart charging: France, Germany, Spain, and California state. For each geography, public charging costs are retrieved7 . This cost is the first element of comparison for our modeling results.
The exact site configuration can then be retrieved (Block 2): retail electricity tariffs depend on the local retailer offers, building size and electric loads depend on climate and local behaviors, the number of chargers and their size differ in each segment (and are derived from market forecasts). Distributed Energy Resources (PV, BESS) are sized following optimization prior to any charger installation, and their Capex is not taken into account in our economic analysis. Finally, EV presence patterns are designed to reflect driver’s behaviors in each segment8 .
In block 3, the level of control (or smartness) of charging is defined. Beyond uncontrolled charging, a load management systems (LMS) is a first step towards smart charging, limiting the power drawn from a set of multiple chargers. Then comes smart charging, which can be unidirectional or bidirectional. This is defined from the charger standpoint, not the building. Where public charging relies on charging optimization that can be done directly with the grid (V-to-G), in buildings, optimization is done with the building loads (V-to-B), or with both, in sequence (V-to-B-to-G)(Figure 4).
5 Further details are given in Annex 2 6 In fleet depot buildings, energy for mobility is by far the main component of the energy bill, which makes the relation between EV charging and the building less interesting. 7 As these costs vary significantly today, they have generally been aggregated to a mean value. See Annex 2 for details on this. 8 Further detail for each segment is available in Annex 2.
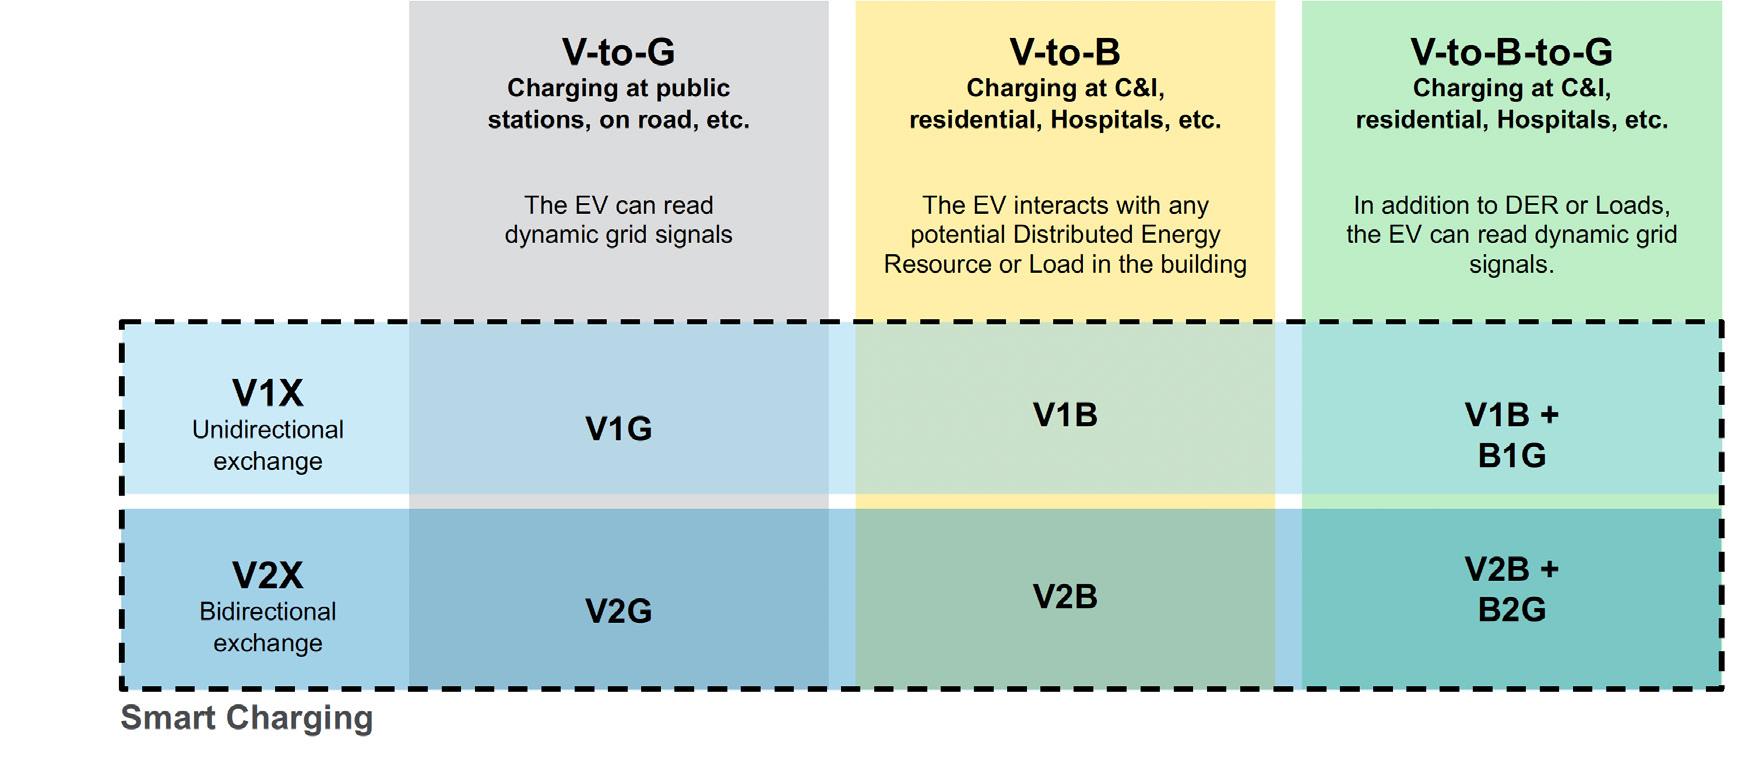
Figure 4: Smart charging framework description
Finally, the charging strategy is defined (Figure 5). It is a balance between the extent of optimization possible (across different paradigms: scheduling, power, energy, self-consumption) and the actual upfront cost of the solution (capex of solution: LMS, unidirectional, bidirectional, etc.).
The simulations were run using the Schneider Electric proprietary Micro-Grid Design Tool (MGDT). This tool is designed to size components of a Micro-Grid (PV, Battery, Genset, etc.) depending on a real-life building or site configuration. It takes into account retail and grid injection tariffs, solar irradiance, and economic data to derive the Micro-Grid’s behavior and economic benefits. [5] A specific module models EV presence patterns which in turn helps determine charging loads9 .
EV charging Scheduling Simple charging LMS LMS + Unidirectional LMS + Bidirectional
No schedule : aim to charge at 100% SOC asap At arrival, the user sets a departure time and a targeted SOC
Power optimization
Energy optimization
Selfconsumption optimization No rule
Power limit set by operator
No rule
Charge when kW is cheapest
Charge when kWh is cheapest
Discharge when kWh is expensive
Local energy is consumed first
Figure 5: Smart charging strategy
Confidential Property of Schneider Electric | Energy Management Business | Industrial Design & Ergonomic | Page 5
9 Further details are given in Annex 3. The model assumes that the EV end-user always complies to set departure times, and that PV outputs, grid retail tariffs and building loads are perfectly predictable for the whole charging period. Such assumptions yield a slight overestimation of the savings reachable in real-life. However, these issues are found to be irrelevant compared to the intrinsic sensitivity of the results to initial assumptions.