
Acceptance of Google Classroom for Teaching and Learning in Bhutanese Secondary Schools. Budhiman
, Sonam Dhendup
Yangchen Gatshel HSS, Thimphu
Received: 01 Sep 2022; Received in revised form:23 Sep 2022; Accepted: 30 Sep 2022
The Author(s).Published by TheShillonga.Thisis an openaccess article under the CC BY license (https://creativecommons.org/licenses/by/4.0/)
Abstract
The purpose of this study was to determine the factors that influence Bhutanese secondary students' behavioural intention and their despondency to accept google classroom platform as a learning management system. The study utilized structural equation modelling (SEM) to examine the direct effects using students self reported answers. The endogenous variable was Behavior intention (BI) while the exogenous variables were perceived usefulness (PU); perceived ease of use (PEOU); facilitating conditions (FC), and tutor quality (TQ) The data for this study was collected from 340 secondary students from four schools under Thimphu district. The SEM analysis suggested that there was no evidence for a direct link between FC and TQ toward BI. However, a significant positive effect was found from FC>PEOU; TQ>PEOU; PEOU>PU; and finally, from PU>BI The model proposed and tested in this study reveals that neither the FC nor TQ were strong determinants of secondary students’ behaviour intention to use GC.
Keywords Behaviour intention; facilitating conditions, Google classroom; perceived usefulness, perceived ease of use; secondary students, and tutor quality.
I. INTRODUCTION
The application of information and communication technology (ICT) is turning into an increasingly vital part of the functioning of educational establishments. A considerable number of educational institutions, including schools, have shifted their focus toward blended learning over the course of the previous few years. According to Kattoua et al. (2016), the introduction of e learning technology will significantly alter at least a portion of traditional classroom methods for material delivery. This is common in developing nations where the COVID 19 required quarantine has forced schools to close.
Bhutanese schools implemented a blended learning technique that has now become a complementary method for providing high quality education (OECD, 2020). Teachers and students are urged to use ICT into the teaching and learning process in Bhutan, where the digitization of education is brand new (Ministry of Education [MoE], 2020). Learning management systems (LMS) are self contained websites with built in teaching tools that allow teachers to organize academic content and getstudentsinvolvedintheirlearning(Gautreau,2011,p.2). They are a powerful technology that hasn't reached its full potential yet. They are also very important for education in
the information age (Watson & Watson, 2007). Aldiab et al. (2019)saidthattheLMSplays abigpartinmakingteaching and learning better and easier (Turnbull et al., 2020).
Google Classroom (GC) is a free blended learning LMS that is widely used for teaching and learning all over the world, both in schools and colleges and universities (Alotumi, 2022). There are many benefits to using GC, such as cutting down on classroom time (Kaizer et al., 2020), making it easier for teachers and students to talk to each other and work together (Kado et al., 2020), and getting more students involved in online classrooms (Alotumi, 2022).
GC use in Bhutan was initially observed during the COVID 19 pandemic (Dorji, 2021). Since then, secondary schools in Bhutan have relied on the usage of GC to support continuous learning, but without sufficient training (Dhendup & Kezang, 2023; Dorji, 2021). It is still unclear to this day how secondary students utilize the GC platform, despite its recent adoption in schools. In addition, the application of GC in Bhutanese secondary schools remains under investigated, despite the existence of a few descriptive studies (see Dorji, 2021; Kado et al., 2020; Wangmo et al., 2020). Hence, our study extends the Technology acceptance model (TAM) proposed by Davis
ISSN: 2581 8651 Vol 4, Issue 5, Sep Oct 2022 https://dx.doi.org/10.22161/jhed.4.5.6 Peer Reviewed Journal Journal of Humanities and Education Development (JHED) https://theshillonga.com/index.php/jhed Page | 31
’
Rai*
©2022
(1989) by adding two new exogenous variables; tutor quality (TQ) and facilitating conditions (FC) to predict the acceptance and the use GC, thus contributing to scholarship, to an already widely used TAM considering a developing country's perspective.
Previous research indicates that the BIofend users is a critical factor in determining the effectiveness and success of an implementation (Chou et al., 2019; Wicaksono et al., 2020). The notion is that users' BI represents their actual behavior while interacting with technology, whether for classroom or non classroom applications (Ajzen, 1991; Wati & Koo, 2012). This is why a number of well established theories and models derived from previous research have explored the behavioral intentions of technology users. Several generally accepted theories in education include the Technological Acceptance Model (TAM) by Davis (1989), the Unified Theory of Acceptance and Use of Technology (UTAUT) by Venkatesh et al. (2003), and the Theory of Planned Behavior (TPB) (Ajzen, 1991). TAM was utilized in a number of different contexts (Venkatesh & Bala, 2008), largely to explain users' behavior and acceptance to use technology (Tarhini et al., 2015) GC in this instance. The existing literature indicates that TAM is commonly employed in education and technology. TAM is relatively unexplored with user intention to use (students) despite its significance and appeal in domains of technology based teaching and learning, particularly in underdeveloped nations such as Bhutan, where technology for teaching and learning is seldom implemented (Choeda et al., 2016; Gautam et al., 2021). In order to better understand the multifaceted elements that drive technology adoption in different contexts, Legris et al. (2003) suggested that academics examine adding additional variables to the first two variables in TAM's model. The purpose of our study is
to analyze the aspects that influence students' behavioral intention to utilize technology using facilitating conditions (FC) and tutor quality (TQ) as independent variables.
By addressing these gaps, our work contributes to the growing body of research on the intention to use technology It contributes to theoretical development by adding facilitating conditions and tutor quality to the existing TAM framework. As a result, this study provides significant contributions by attempting to solve several gaps. To begin, our study contributes to the scant research on the intention to use technology GC as the LMS platform by the secondary students. Our study is one of the first to examine FC and TQ as predictors of end user desire to use technology in a developing cultural setting.
II. TECHNOLOGICAL ACCEPTANCE MODEL
The TAM model consists of three variables: one exogenous variable is perceived usefulness (PU), and the other being perceived ease of use (PEOU), and one endogenous variable, behavioral intention to use technology, google classroom in this case. PU stands for perceived usefulness, and PEOU stands for perceived ease of use (PEOU). PU is defined by Davis (1989) as "the degree to which a person believes that utilizing a certain system would boost his or her job performance" (p.320), and PEOU is defined as "the degree to which an individual believes that utilizing a given system would be effort free" (p.320). It is widely believed that these two characteristics are powerful determinants of users' intentions and acceptance to utilize technology in educationalsettings.However,notalotofresearch hasbeen done on the connection between FC and BI, and much less on the connection between TQ and BI, particularly in the context of Asia and Bhutan.
III. RESEARCH MODEL AND HYPOTHESES
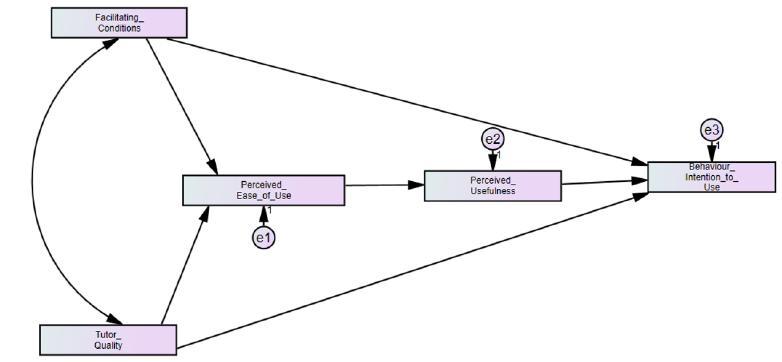
Fig.1. Proposed research model
Dhendup and Rai Journal of Humanities and Education Development (JHED) 4(5) 2022 https://theshillonga.com/index.php/jhed Page | 32
Facilitating Conditions (FC)
Venkatesh et al. (2003) defines FC as “an individual's belief that an organizational and technical infrastructure exists to support the system's use" (p 453). The results of a past study by Sukendro et al. (2020) found FC to be a significant predictor of BI and PU. However, Rahmi and Birgören (2020) emphasized the criticalnature of FCin e success and adoption Based on the few past studies, the following is hypothesized:
H1. FC is positively related to Behaviour Intention to use GC.
H2. FC is positively related to PEOU.
Tutor Quality (TQ)
The quality of the instructor is crucial to the success of any learning program, regardless of the learning setting. Due to the shift in roles, tutors in the context of the e learning environment now have increased duties (Mtebe & Raphael, 2018). The function of the instructor in an e learning environment moves from knowledge transmission to facilitator and guide (Teo, 2011). Previous research indicates a correlation between tutor quality and pre service teachers' satisfaction (Ouajdouni et al., 2021; Teo, 2010). Similar to this, Ouajdouni et al. (2021) found that differences in PU can also be explained by instructor quality, this in our case is tutor quality. As a consequence of this, it is predicted that the quality of the tutors would contribute to the students' enjoyment of their e learning experiences. There have been other hypotheses proposed, including the following:
H3 TQ is positively related to Behaviour Intention to use GC
H4. TQ is positively related to PEOU
Perceived usefulness and perceived ease of use
According to the findings of a number of research, PEOU and PU are effective indicators of users’ propensity to adopt new technologies (Al Emran et al., 2020; Davis, 1989). As a direct consequence of this, previous researchers have made an effort to study the connection between PEOU and PU. The vast majority of them identified a favorable connection between the two (Verma & Sinha, 2018; Vululleh, 2018). Hence, our study proposes two hypotheses related to PEOU and PU and then from PU to BI:
H5. PEOU is positively related to PU
H6 PU is positively related to BI
IV. METHODOLOGY
Research design
This cross sectional quantitative study evaluates students' intentions to use technology with facilitating conditions (FC) and tutor quality (TQ) to understand the multi dimensional factors of original TAM model in adopting GC by Bhutanese secondary students. To this end, a convenience sample technique was utilized to collect the data.
Participants and context of the study
The data was collected via a web based survey from 340 secondary students from five secondary students under Thimphu district in Bhutan, as structural equation modelling need more than 200responses (Boomsma, 1987), unlike smart PLS SEM where small sample sizes and complex models effectively (Hair et al., 2019). Of the respondents, 47% (159) were males while others 53% (181) were female respondents. The age range of the respondents ranged from 14 19 years. Typically, in Bhutanese education system, secondary levels are grades 9 12. The ethical approval for this study was granted by the district education office.
Survey instrument
The survey questionnaire was adapted from several pre existing instruments relevant for our study (for details see appendix 1) The items for the factor perceived usefulness, perceived ease of use, and behavioral intention were taken from the seminal study on TAM (Davis, 1989) and previously published studies on technology acceptance; Facilitating conditions from (Thompson et al. 1991); Tutor Quality (TQ) from E learning Acceptance Measure (ElAM) by Teo (2010). The anchors for all the items range from strongly disagree (1) to 5 (strongly agree)
Data Analyses
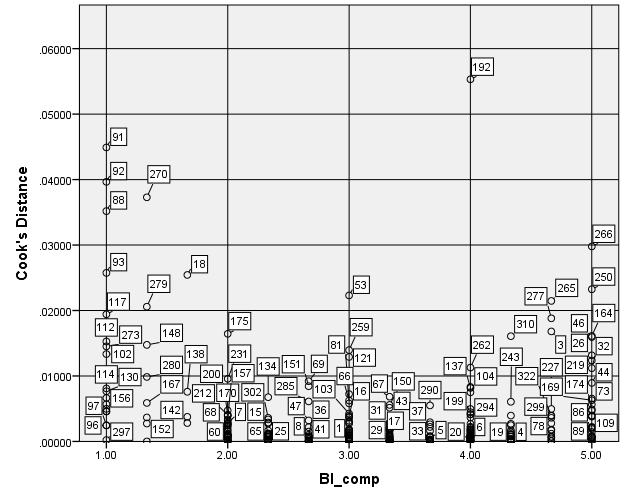
The finaldata screening tocheck for respondentmisconduct was carried out using excel (Standard deviation <.25) in the response variance were deleted. Therefore, 7 responses had to be deleted. Secondly data screening for impermissible respondent values were carefully checked using the SPSS software using the maximum and minimum value. Further there were cases of missing data and to check for multivariate outliers, cooks distance measure (see figure 2 for details) and hence data imputation using a linear interpolation technique was applied.
Dhendup and Rai Journal of Humanities and Education Development (JHED) 4(5) 2022 https://theshillonga.com/index.php/jhed Page | 33
Fig 2. Multivariate outliers using Cooks distance
Then after the data screening process were completed, numerous stages in data analysis process were considered. Third, to assess Common Method Bias (CMB) we applied correlation matrix method, followed by confirmatory factor analysis (CFA), which is frequently required prior to doing structural equation modelling (SEM) (Collier, 2020). Finally, a path model analysis was applied using the maximum likelihood estimation (MLE) to assess and test the hypothesized models.
Common Method Bias
TwoCMBstatisticaltestswererunusingSPSStodetermine the probability of common method bias (CMB) between the independent and dependent variables. To begin, Harman's one factor test was employed, in which all items from all constructions were combined into a single factor via unrotated exploratory factor analysis (EFA). This resulted in a total Eigenvalue of 7.836 (see Table 1), and a variance extraction of 35.62 percent, less than the 50% advised by Podsakoff et al. (2012) or even less than the conservative thresh holdof40%varianceadvocatedbyHairetal.(2019).
Table 1 Total Variance Explained using Harman's one factor test using unrotated EFA
Initial Eigenvalues
Component
Extraction Sums of Squared Loadings
Rotation Sums of Squared Loadings
Dhendup and Rai Journal of Humanities and Education Development (JHED) 4(5) 2022 https://theshillonga.com/index.php/jhed Page | 34
Total % of Variance Cumulative % Total % of Variance Cumulative % Total % of Variance Cumulative % 1 7.832 31.330 31.330 7.832 31.330 31.330 4.215 16.860 16.860 2 2.583 10.333 41.663 2.583 10.333 41.663 3.485 13.940 30.800
1.311 5.245 46.907
5.245 46.907 2.338 9.353 40.153
1.200 4.801 51.708 1.200 4.801 51.708 2.167 8.669 48.822
1.184 4.736 56.444
.963 3.851 60.295
.907 3.626 63.921
.805 3.219 67.140
.756 3.025 70.165
.718 2.871 73.036
.674 2.697 75.733
.656 2.625 78.357
.605 2.418 80.776
.570 2.280 83.056
.544 2.176 85.231
.530 2.119 87.350
.481 1.924 89.274
.458 1.834 91.108
.425 1.699 92.806
.407 1.627 94.433
.365 1.462 95.895
.324 1.297 97.193
.289 1.156 98.349
.245 .982 99.331
.167 .669 100.000
Extraction Method: Principal Component Analysis
V. RESULTS
Descriptive statistics
a descriptive statistic such as mean and standard deviation was utilized. Next, the assumption of normality of the data was tested using skewness and kurtosis coefficients. The
4.736 56.444 1.905 7.622 56.444
descriptive analysis of skewness and kurtosis coefficients revealed that the value of the data set is normally distributed with skewness values ranging from .001 to 0.73 and kurtosis values rangingfrom 0.07 to 94. The skewness and kurtosis value of all the items was within the recommended value of ±3 (Kim, 2015).
Table 2 Descriptive statistics
N Mean SD Skew CR Kurto sis CR
PU1: Using the google classroom system will enhance my efficiency.
PU2: Using the google classroom system will enhance my productivity.
PU3: Using the google classroom system will enable me to accomplish tasks more quickly.
PU4: Using the google classroom system will improve my work.
340 3.01 1.06 0.61 4.59 0.33 1.26
340 3.04 1.01 0.12 0.87 0.96 3.60
340 3.29 1.20 0.21 1.56 0.94 3.54
340 3.17 1.22 0.01 0.10 0.26 0.99
Dhendup and Rai Journal of Humanities and Education Development (JHED) 4(5) 2022 https://theshillonga.com/index.php/jhed Page | 35 3
1.311
4
5
1.184
6
7
8
9
10
11
12
13
14
15
16
17
18
19
20
21
22
23
24
25
PU5: Using the google classroom system will save my time.
PEOU1: google classroom system is easy to use.
PEOU2: Interaction with google classroom system is clear and understandable.
PEOU3: Google classroom system is convenient and user friendly
PEOU4: Google classroom system is easy to access.
BI 1: I will use google classroom system in the future.
BI 2: I will continue to use google classroom system in the future
BI 3: I expect that I would use google classroom system in the future.
FC1: When I need help to use the computer, guidance is available to me
FC2: When I need help to use the computer, specialized instruction
FC3: When I need help to use the computer, a specific person is available to provide assistance
TQ1: My tutor could explain the concepts clearly
340 3.66 1.14 0.01 0.11 0.36 1.36
340 3.79 1.17 0.39 2.91 0.58 2.20
340 2.87 1.28 0.35 2.64 0.20 0.77
340 3.47 1.01 0.14 1.06 0.96 3.63
340 3.49 1.11 0.73 5.50 0.31 1.17
340 3.20 1.21 0.26 1.93 0.74 2.79
340 3.21 1.16 0.18 1.36 0.65 2.46
340 3.24 1.17 0.16 1.22 0.77 2.89
340 3.22 1.25 0.05 0.39 0.57 2.13
340 3.10 1.08 0.13 1.01 0.48 1.83
340 3.00 1.09 0.15 1.16 0.94 3.54
340 3.38 0.99 0.27 2.01 0.40 1.50
TQ2: My tutor was knowledgeable in ICT 340 3.56 1.05 0.07 0.54 0.40 1.50
TQ3: I was satisfied with the answers given by my tutor
340 3.49 1.01 0.43 3.27 0.13 0.47
TQ4: My tutor was focused on helping me to learn 340 3.60 1.03 0.48 3.61 0.28 1.04
TQ5: The tutorial activities were well managed 340 3.39 0.93 0.39 2.94 0.14 0.54
TQ6: My tutor was accessible when I needed to consult them 340 3.31 0.96 0.55 4.17 0.17 0.63
TQ7: My tutor was patient when they interacted with me 340 3.51 1.00 0.36 2.74 0.07 0.25
Total 340
Note. CR= Critical ratio (t value)
Measurement model assessment
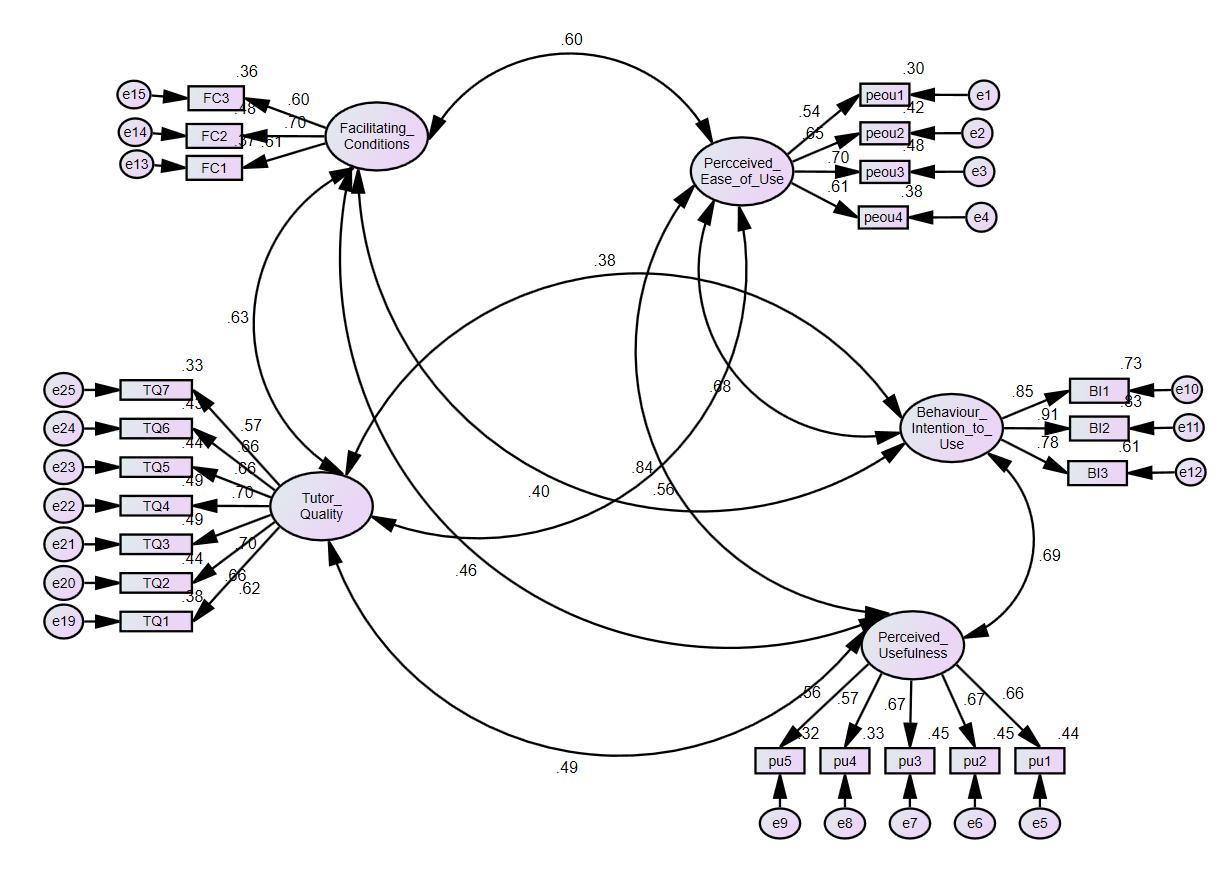
A Confirmatory Factor Analysis was performed for the 22 items (see figure 4) used in this study using the Maximum likelihood estimation (MLE). MLE is the most common technique used in parameter estimation (Hair et al., 2019).
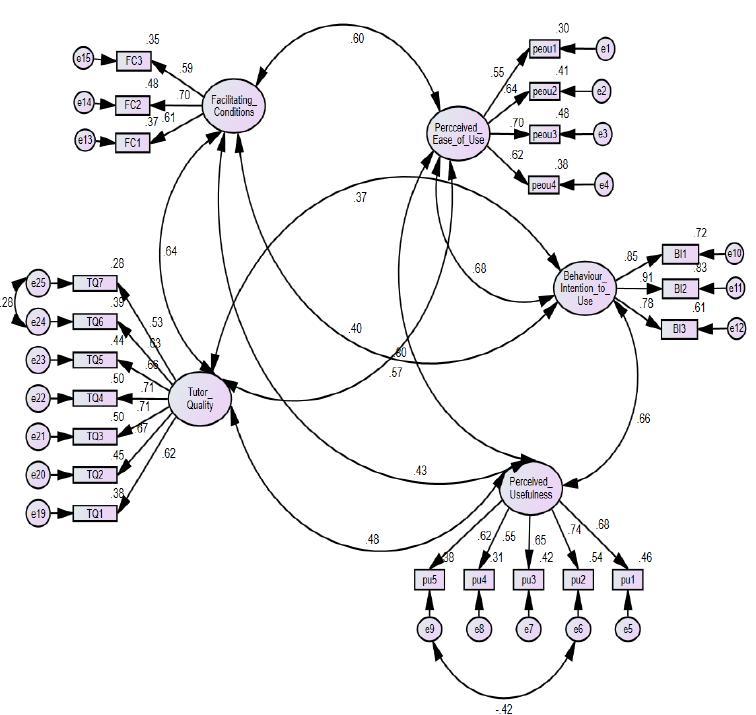
Following Hair et al. (2019) recommendation, the respective indicator variable loadings were first tested. A good rule of thumb is that the standardized loading estimates should be at least 0.50 or higher, ideally 0.70 (see figure 3). In AMOS, modification indices to improve the model are suggested; we have considered the suggestion
and correlated (e24 ↔ e25; e6↔e9) to obtain abetter model fit in this study (see figure 4 for corrected measurement model). The model returned these values (χ2= 400 22; χ2/df=2 02; p=0.001), TLI=0. 928, CFI = 0.93, RMSEA = 0.056|0.048 0.064|,SRMR= 0.052)showninTable3. The data in the formofthis presentstudy achieved thepreferable relativechi squaretestof<3(Hairetal.,2019; Kline,2016). The Tucker Lewis index or TLI |0 92| has values close to 0> 0.95] (Hu & Bentler, 1999). Therefore, we can proceed to assess convergent validity, discriminant validity, and reliability to evaluate if the psychometric properties of the measurement model are deemed adequate.
Dhendup and Rai Journal of Humanities and Education Development (JHED) 4(5) 2022 https://theshillonga.com/index.php/jhed Page | 36
Fit Index
Table 3 The measurement model fit summary
Recommended value References
χ2 NS at p < 0.05 400.22(p=.001)
χ 2 /df <5 2.02
CFI >0.90 0.93
Hu & Bentler, 1999
SRMR <0.10 0.052 Hair et al. 2010
RMSEA <0.08 0.056 [.048 .064] Hair et al. 2010
TLI >0.90 0.92 Hu & Bentler, 1999
Note. NS= Not significant; df = Degrees of freedom, CFI = Comparative fit index, RMSR= Root mean square residuals, RMSEA = Root Mean Square Error of Approximation, TLI = Tucker Lewis Index
Fig 3. The uncorrected Measurement Model
Dhendup and Rai Journal of Humanities and Education Development (JHED) 4(5) 2022 https://theshillonga.com/index.php/jhed Page | 37
Fig 4. The corrected Measurement Model
Construct reliability and convergent validity
The internal consistency reliability, was tested using Cronbach's alpha (α) and Composite Reliability (CR). The cut off value is ≥ 0.70 for both tests (Collier, 2020; Kline, 2016 (see Table 4 for details). Composite reliability for all
the factors was > 0.7. Similarly, according to Fornell and Larcker (1981), in order for convergent validity to be established, the average variance extracted (AVE) was ≥ 0.50. The convergent validity for this paper is achieved as all the CR>AVE for all the constructs.
Table 4 Internal consistency reliability and convergent validity results
Constructs Cronbach's alpha
α ≥ 0.70
Composite Reliability
CR ≥ 0.70
AVE ≥ 0.50
FC 0.73 0.72 0.55
PU 0.81 0.74 0.51
PEOU 0.79 0.73 0.52
TQ 0.78
0.54
BI 0.82 0.88 0.75
Further, the data presented in Table 5 clearly showed that our data had no discriminant validity concerns. Discriminant validity is an assessment of how each construct within the model varied from othervariables (Hair
et al., 2019). The HTMT is a criterion proposed by Henseler et al. (2015) and is applied to assess the discriminant validity.AllHTMTvaluesare withintheacceptedthreshold values ≤ 0.90, as shown in Table 5
Dhendup and Rai Journal of Humanities and Education Development (JHED) 4(5) 2022 https://theshillonga.com/index.php/jhed Page | 38
0.86
Table 5 Discriminant Validity HTMT Analysis
TQ FC BI PU PEOU
TQ
FC 0.61
BI 0.41 0.37
PU 0.36 0.42 0.72
PEOU 0.58 0.55 0.72 0.83
Path analysis
A path analyses was used to examine five proposed constructs for both direct relationships (see Figure 4). Before estimating the model’s path, the multicollinearity assumptions, a Kock (2015), variance inflation factor (VIF) and tolerance were calculated using the SPSS software package were assessed for FC, TQ, PEOU, PU and BI. A VIF and tolerance are both measure of checking multicollinearity Hair et al. (2019). According to Hair et al. recommendation,VIFvaluesacceptedthresholdis<5(Hair et al., 2019). The collinearity statistics of where BI was
taken as the dependent variable (see Table 6 for details). Further, a composite score for each item within the construct was also computed to generate VIF. The VIF is presented in Table 6; the first value, while the tolerance value is presented as the second value alongside their construct but within the brackets. For FC (1.38; 0.72); TQ (1.42; 0.70); PU (1.75; 0.57) and PEOU (1.91; 052). The Further, the Tolerance value for the four constructs was significant > 0.2. Therefore, the generated VIF and Tolerance values confirm that this study has no multicollinearity issues.
Table 6 Collinearity statistics Model
Collinearity Statistics Tolerance VIF
1 (Constant)
FC .72 1.38
PU_ .57 1.75
PEOU .52 1.91
TQ .70 1.42
Dependent Variable: BI
BI=behaviour intention, FC=facilitating conditions, PU= perceived usefulness, PEOU= perceived ease of usefulness, TQ= tutor quality.
Hence, the overall model fitness was evaluated, the model returned (χ2= 281 738; χ2/df=1.76; p=0.001), TLI=0.949, CFI = 0.948, RMSEA = 0.048 |0.039 0.058|; SRMR = 0.051). The results of this have met the preferred relative chi square test <3 (Hair et al., 2019; Kline, 2016) which is a “badness of fit" measure. The Tucker Lewis index or TLI (0.949) has a value greater [.90].
Dhendup and Rai Journal of Humanities and Education Development (JHED) 4(5) 2022 https://theshillonga.com/index.php/jhed Page | 39
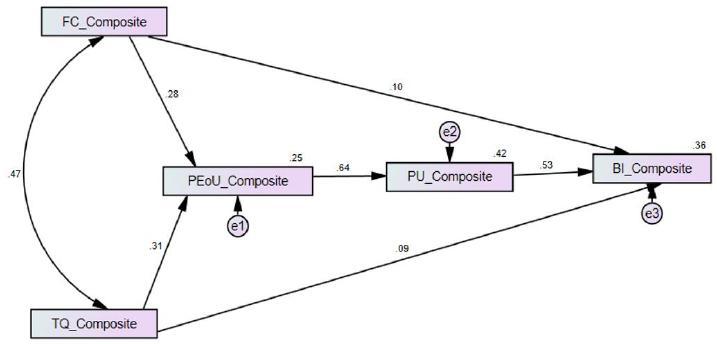
Figure 5. Path analysis of the research model.
Hypothesis Testing
Weexamined sixdirectrelationships;the resultsofhypothesestestingarepresentedinTable 7 Outofsixproposed hypotheses, H1 and H3 were rejected, while H2, H4, H5, and H6 were accepted. The detailed estimates (β), critical ratios, p value, and CI is presented in (for details see Table 7).
Table 7 Direct effects with a 95% Confidence Interval
Relationships β t values p value Decision
1 FC>BI .095 1.87 .061 Not supported
2 FC>PEOU .279 5.13 .000 Supported
3 TQ>BI .093 1.81 .069 Not supported
4 TQ> PEOU .306 5.64 .007 Supported
5 PEOU>PU .645 15.19 .000 Supported
6 PU>BI .529 11.29 .000 Supported
Note. Critical ratios are significant at [*p<.05; **p<.001; p < 0.001]; CR (t values) exceeding 1.96 BI=behaviour intention, FC=facilitating conditions, PU= perceived usefulness, PEOU= perceived ease of usefulness, TQ= tutor quality.
VI. DISCUSSION
This study's primary purpose was to investigate the extended TAM framework (eTAM) for assessing students' behavioral intention to utilize GC. The combined components in the suggested model accounted for 36% of the variance in students' behavioral intention to use GC. In this model, six direct effects were hypothesized, as shown in Table 7.
The evaluations of the path model revealed that FC had no significant direct link with BI; consequently, H1 obtained no empirical support. The result somewhat validates Mohammad Salehi et al. (2021), but contradicts Fahadi and Khan (2022) study. Mohammad Salehi et al. (2021) and Joo et al. (2018) both concluded that FC has no effect on students' BI, citing a little impact of FC on BI. Consequently, the results of the present study indicate that
FC have no direct positive effect on BI. Further this is an indication that FC had no effect on Bhutanese secondary pupils' intention to utilize GC. Despite the fact that this result is fairly surprising, it is may be possible that FC is not necessarily tied to the student’s acceptance or the rejection of GC. This seemingly is conflicting conclusion that may be due to the fact that Bhutanese students do not utilize any web based learning management systems in the past As pointed by Dorji (2021), GC as a web based learning platformwasonlyused bybothteachersandstudentsduring the quarantine and school closures. Issues similar to this were communicated in contexts of higher education (Choeda et al., 2016) even though higher education institutions in Bhutan used virtual learning environments a decade ago.
The lack of influence of TQ on BI, which led to the rejection of hypothesis 3 (H3), was a unique finding of this
Dhendup and Rai Journal of Humanities and Education Development (JHED) 4(5) 2022 https://theshillonga.com/index.php/jhed Page | 40
study. Although this conclusion is consistent with the findings of earlier research, Guo et al. (2020), who reported that TQ had a favorable but non significant influence on BI. Moreover, the findings of our investigation indicated that TQ accounted for about 9 % (non significant) variance in BI. The probable non significance result in this instance; could be attributable to the lack of proper professional development opportunities for teachers and students alike (Kado et al., 2020; Wangmo et al., 2020). As stated above, the Bhutanese institutions and education system still lack the proper infrastructure to successfully implement technology for teaching and learning(Dorji,2021). Besides, the finding indicates that students’ BI is likely to depend on individualpassionandgoalstolearnnewthings,technology in this case, rather than on accessibility to the experts and support from the institutions they are working for. Several research in the past (Koehler & Mishra, 2009; Yang et al., 2019) indicated that a lack of assistance may have an effect on students' intent to utilize technology.
On the other hand, a statistically significant association has been established between FC and PEOU (H2), FC and PEOU (H4), PEOU and PU (H5), and PU and BI (H6) (H6). In this regard, our finding is consistent with the findings of (Yang et al., 2021), which demonstrated a statistically significant positive connection between FC and PEOU.On the other hand, a statistically significant association has been established between FC and PEOU (H2), FC and PEOU (H4), PEOU and PU (H5), and PU and BI (H6) (H6). In this regard, our finding is consistent with the findings of (Yang et al., 2021), which demonstrated a statistically significant positive connection between FC and PEOU. Students are more inclined to utilize technology (GC) when they consider it to be user friendly and beneficial for instruction and learning (Teo, 2011). Likewise, for the rest of the hypotheses, FC on PEOU (H4), PEOU on PU (H5), and PU on BI (H6), there was a significant positive influence, thus accepting these hypotheses. The importance of FC as a strong predictor of users' behaviour to use technology was further echoed by recent educational research (e.g., Peñarroja et al., 2019), however in our case no support could be provided both for FC and TQ as the determinants of student’s acceptance of GC in the Bhutanese context.
In addition, a lot of studies indicate that PEOU and PU are reliable indicators of users' propensity to use technology (Laosethakul & Leingpibul, 2021; Yuen et al., 2021). Prior research has hypothesized that FC has a favorable effect on PEOU (Al Shamsi et al., 2022; Ji et al., 2019). In this regard, the present findings were consistent with the results of previous research.
VII. CONCLUSION AND IMPLICATIONS
This study's primary purpose was to extend and then assess the application of TAM with two new constructs. To achieve this objective, we first examined six direct relationships: FC to BI, FC to PEOU, TQ to PEOU, PEOU to PU, and PU to BI. The results indicated that the direct association between FC and BI and TQ and BI could not be supported, however empirical evidence was found for the relationshipsbetweenTQandPEOU,FCandPEOU,PEOU andPU,andPUandBI. Taken together,theproposed model was found capable of predicting students’ behavioral intention (BI) to use GC explaining around 36 % of the variance in students’ acceptance of GC On the basis of these results, we conclude that FC and TQ are not favorable predictors of Bhutanese students' propensity to employ GC in emerging cultural situations.
Overall, this study broadens TAM in terms of Bhutanese secondary students'acceptability andintention to adopt GC, as well as its associated outcomes (PEOU, PU) toward BI. The current study focuses on likely theoretical contributionsintheuseoftechnology,specificallytheusage of Google Classroom in developing country context that is Bhutan. According to the evidence based literature, not much has been written about the role of FC and TQ, particularly on secondary students' behavioral intention to use GC. Responding to this gap, this study investigated the latent roles of FC and TQ on students’ willingness to accept GC. In doing so, the current findings drew on a few earlier studies, for details see (Joo et al., 2018) for FC and (Guo et al., 2020) study for TQ.
Finally, our study shows that the acceptability of GC as a web based learning management system by Bhutanese students is undesirable when FC and TQ are considered. However, the full model comprising FC, TQ, PEOU, and PU was found suitable for describing the acceptability of GC among secondary students in Bhutan. Hence the findings of our study may be utilized for future policy directions, and has uses to curriculum developers, and policy formulators and other stake holders who play roles in improving quality of education in Bhutan.
REFERENCES
[1] Ajzen, I. (1991). The theory of planned behavior. Organizational behavior and human decision processes, 50(2), 179 211. https://doi.org/10.1016/0749 5978(91)90020
[2] Aldiab, A., Chowdhury, H., Kootsookos, A., Alam, F., & Allhibi, H. (2019). Utilization of Learning Management Systems (LMSs) in higher education system: A case review for Saudi Arabia. EnergyProcedia, 160, 731 737.
Al Emran, M , Arpaci, I , & Salloum, S A. (2020). An empirical examination of continuous intention to use m
Dhendup and Rai Journal of Humanities and Education Development (JHED) 4(5) 2022 https://theshillonga.com/index.php/jhed Page | 41
T
[3]
learning: An integrated model Education and information technologies, 25(4),2899 2918
[4] Alotumi, M. (2022). Factors infuencing graduate students’ behavioral intention to use Google Classroom: Case study‑mixed methods research, Education and Information Technologies, https://doi.org/10.1007/s10639 022 11051 2
[5] Boomsma, A. (1987). Therobustnessofmaximumlikelihood estimation in structural equation models. Cambridge University Press.
[6] Choeda,Penjor,T.,Dupka,D.,&Zander,P.(2016).Thestate of Integration of the Virtual Learning Environment and ICT into the pedagogy of the Royal University of Bhutan: A descriptive study. International Journal of Education and Development using Information and Communication Technology,12(1), 71 88.
[7] Collier, J. E. (2020). Applied structural equation modelling usingAMOS:Basictoadvancedtechniques. Routledge.
[8] Davis, F D. (1989). Perceived usefulness, perceived ease of use, and user acceptance of information technology. MIS quarterly,319 340.
[9] Dhendup, S., & Sherab, K. (2023). Exploring Bhutanese primary school teachers’technological knowledge. Journal of Global Education and Research, 7(2), 116 130. https://www.doi.org/10.5038/2577 509X.7.2.1213
[10] Dorji,T.(2021).Problemand ChallengesFaced by Students, Parents, and Teachers in Google Classes &Television Lessons. International Journal of Asian Education, 2(1), 88 97. https://doi.org/10.46966/ijae.v2i1.98
[11] Fornell, C., & Larcker, D. F. (1981). Evaluating structural equation models with un observable variables and measurement error. Journal of Marketing Research, 18(1), 39 50.
[12] Gautam, K. P., Sharma, D., Wangpo, K., Dema, S. (2021). The acceptance and use ofthe Virtual Learning Environment (VLE) in higher education: A contextual study of Royal University of Bhutan. Asian Research Journal of Arts & Social Sciences, 13(3), 20 36. https://doi.org/10.9734/arjass/2021/v13i330215
[13] Gautreau, C. (2011). Motivational factors affecting the integration of a learning management system by faculty. Journal of Educators Online, 8(1), 1 25. https://www.learntechlib.org/p/52833/
[14] Guo, J., Huang, F., Lou, Y., & Chen, S. (2020). Students' Perceptions of Using Mobile Technologies in Informal English Learning during the COVID 19 Epidemic: A Study inChineseRuralSecondarySchools. JournalofPedagogical Research, 4(4), 475 483.
[15] Hair,J.F.,Black,W.C.,Babin,B.,&Anderson,R.E.(2019). Multivariatedataanalysis (8th ed.). Cengage Learning.
[16] Henseler, J., Ringle, C. M., & Sarstedt, M. (2015). A new criterionforassessingdiscriminantvalidityinvariance based structural equation modeling. Journal of the Academy of Marketing Science,43(1), 115 135.
[17] Hu, L. T., & Bentler, P. M. (1999). Cutoff criteria for fit indexes in covariance structure analysis: Conventional criteria versus new alternatives. Structural equation modelling:a multidisciplinaryjournal, 6(1), 1 55.
[18] Joo, Y J, Park, S , & Lim, E. (2018). Factors influencing preservice teachers’ intention to use technology: FC, teacher self efficacy, and technology acceptance model Journal of EducationalTechnology& Society, 21(3),48 59.
[19] Kado, K., Dem, N., & Yonten S. (2020). Effectiveness of Google classroom as an online learning management system in the wake of COVID 19 in Bhutan: Students’ perceptions. In I. Sahin &M.Shelley (Eds.),Educationalpracticesduring theCOVID 19viraloutbreak:Internationalperspectives(pp. 121 142). ISTES Organization
[20] Kattoua, T., Al Lozi, M., & Alrowwad, A. A. (2016). A review of literature on E learning systems in higher education. International Journal of Business Management & Economic Research, 7(5), 754 762.
[21] Kaizer, B.M., Silva, C.E.S., de Pavia, A.P. and Zerbini, T. (2020),E learningtrainingin work corporations:areviewon instructional planning", European Journal of Training and Development, 44 (6/7),615 636. https://doi.org/10.1108/EJTD 08 2019 0149
[22] Kim, N. (2015). Tests Based on Skewness and Kurtosis for Multivariate Normality. Communications for Statistical Applications and Methods The Korean Statistical Society. https://doi.org/10.5351/csam.2015.22.4.361
[23] Kline, R.B. (2016). Principles and Practice of Structural EquationModelling (4th ed.).Guilford Press.
[24] Laosethakul, K., & Leingpibul, T. (2021). Investigating Student Perceptions and Behavioral Intention to Use Multimedia Teaching Methods for the SAP ERP System e Journal ofBusiness Education and Scholarship of Teaching, 15(1),1 27
[25] Legris,P.,Ingham,J.,&Collerette,P.(2003).Whydopeople use information technology? A critical review of the technology acceptance model. Information & management, 40(3), 191 204.
[26] Liebenberg, J., Benade, T., & Ellis, S. (2018). Acceptance of ICT:Applicabilityoftheunifiedtheoryofacceptanceanduse of technology (UTAUT) to South African students. The African JournalofInformation Systems, 10(3), 1.
[27] Liu, Z Y , Lomovtseva, N , & Korobeynikova, E. (2020). Online learning platforms: Reconstructing modern higher education. International Journal of Emerging Technologies in Learning (iJET), 15(13),4 21
[28] Ministry of Education. (2014). Bhutan education blueprint 2014 2024: Rethinking education Thimphu.
[29] Ministry of Education. (2020). COVID 19 response plan: Guidelines for Curriculum Implementation Plan for Education in Emergency (EiE). Thimphu.
[30] Peñarroja, V., Sánchez, J., Gamero, N., Orengo, V., & Zornoza, A. M. (2019). The influence of organisational facilitating conditions and technology acceptance factors on the effectiveness of virtual communities of practice. Behaviour & Information Technology, 38(8), 845 857. https://doi.org/10.1080/0144929X.2018.1564070
[31] Podsakoff, P. M., MacKenzie, S. B., & Podsakoff, N. P. (2012).Sourcesofmethodbiasinsocialscienceresearchand recommendations on how to control it. Annual review of psychology, 63,539 569.
Dhendup and Rai Journal of Humanities and Education Development (JHED) 4(5) 2022 https://theshillonga.com/index.php/jhed Page | 42
[32] Tarhini, A , Arachchilage, N A G, & Abbasi, M S. (2015). A critical review of theories and models of technology adoption and acceptance in information system research International Journal of Technology Diffusion (IJTD), 6(4), 58 77.
[33] Teo, T. (2010). Examining the influence of subjective norm and facilitating conditions on the intention to use technology among pre service teachers: a structural equation modelling of an extended technology acceptance model. Asia Pacific Education Review, 11(2), 253 262.
[34] Teo, T. (2011). Modelling the determinants of pre‐service teachers' perceived usefulness of e‐learning. Campus Wide Information Systems, 28(2),124 140. http://dx.doi.org/10.1108/10650741111117824
[35] Thompson, R L , Higgins, C A, & Howell, J M. (1991). Personal computing: Toward a conceptual model of utilization MISquarterly,125 143
[36] Turnbull, D., Chugh, R., & Luck, J. (2020). Learning management systems: a review of the research methodology literature in Australia and China. International Journal of Research & Method in Education, 1 15. https://doi.org/10.1080/1743727X.2020.1737002
[37] Venkatesh, V , & Bala, H. (2008). Technology acceptance model 3 and a research agenda on interventions Decision sciences, 39(2),273 315
[38] Venkatesh, V , Morris, M G, Davis, G B , & Davis, F D (2003). User acceptance of information technology: Toward a unified view MISquarterly,425 478
[39] Vululleh, P. (2018). Determinants of students’e learning acceptance in developing countries: An approach based on Structural Equation Modelling (SEM). International Journal ofEducation andDevelopmentusing ICT, 14(1).
[40] Wangmo, U., Nesor, M. R., Choki, S., Om, L., Dorji, K., Dema, N., ... & Tshering, N. (2020). Students’ Perception on E Learning in Punakha Dzongkhag in Bhutan. Asian Journal of Education and Social Studies, 11(2), 18 24. https://doi.org/10.9734/ajess/2020/v11i230286
[41] Watson, W. R., & Watson, S. L. (2007). What are Learning Management Systems, what are They Not, and What Should They Become? TechTrends, 51(2), 28 34.
[42] Wati, Y , & Koo, C. (2012, January). Toward green IS adoption behaviors: A self determination perspective In 2012 45th Hawaii International Conference on System Sciences (pp. 1207 1216). IEEE.
[43] Wicaksono, B. S., Jubaedah, J., & Hidayati, S. (2020). Understanding Investment Behavior Intention to Adopt Online Mutual Funds Based on Unified Theory of Acceptance and Use of Technology Model International Journal of Multicultural and Multireligious Understanding, 7(10),94 107
Appendix 1 (Survey questionnaire)
Variable
PU1.Using the google classroom system will enhance my efficiency.
PU2. Using the google classroom system will enhance my productivity.
PU3. Using the google classroom system will enable me to accomplish tasks more quickly.
PU4. Using the google classroom system will improve my work.
PU5. Using the google classroom system will save my time.
PEOU1. google classroom system is easy to use.
PEOU2. Interaction with e google classroom system is clear and understandable.
PEOU4. Google classroom system is convenient and user friendly.
PEOU5. Google classroom system is easy to access.
BI1. I will use google classroom system in the future.
BI2. I will continue to use google classroom system in the future.
BI3. I expect that I would use google classroom system in the future.
FC1 When I need help to use the computer, guidance is available to me
FC2 When I need help to use the computer, specialized instruction is available to help me
FC3 When I need help to use the computer, a specific person is available to provide assistance
Dhendup and Rai Journal of Humanities and Education Development (JHED) 4(5) 2022 https://theshillonga.com/index.php/jhed Page | 43
1 1 2 2 3 3 4 4 5 5
PI1 My classmates think that using the Internet (Google, learning platform) is valuable for learning
PI2 My classmates’ opinions are important to me
PI3 If most of my classmates started to use the Internet to support their learning, this would encourage me to do the same
TQ1 My tutor could explain the concepts clearly
TQ2 My tutor was knowledgeable in ICT
TQ3 I was satisfied with the answers given by my tutor
TQ4 My tutor was focused on helping me to learn
TQ5 The tutorial activities were well manage
TQ6 My tutor was accessible when I needed to consult them
TQ7 My tutor was patient when they interacted with me
Dhendup and Rai Journal of Humanities and Education Development (JHED) 4(5) 2022 https://theshillonga.com/index.php/jhed Page | 44