
FACT BOOK 2017–2022 Institutional Data Reference for the Morehouse Community
On January 5, 2021, Reverend Dr. Raphael G. Warnock, `91, pastor of Ebenezer Baptist Church, was elected to the United States Senate as the junior senator representing Georgia. He is the first Black American ever elected to the U.S. Senate from Georgia and the first Black Democrat elected to the U.S. Senate representing a southern state since Reconstruction.

2
The Office of Data Analytics, Institutional Research and Effectiveness (DIRE) serves as a clearinghouse for current and historical statistical information about various facets of Morehouse. Our primary responsibilities are collecting, analyzing, and reporting data from various sources about students, faculty, and staff supporting institutional planning and decision-making. DIRE is also responsible for mandatory reporting to federal, state, and other external agencies and supports the College’s accreditation review cycles.





Published by DIRE, the Fact Book is a static compilation of the most recent data reported externally. This publication contains data on student admissions statistics, enrollment, demographics, majors, retention and graduation rates, degree completions, faculty information, facilities, financial aid, and finances. It is distributed to members of the Morehouse community to serve as a comprehensive source of key institutional data answering the most frequent questions and supporting planning and evaluation.
Morehouse adjusted operational and educational processes in response to the COVID-19 global pandemic, some of which impacted the data reported in this year’s Fact Book. Most metrics, data definitions, and reporting methodologies remain consistent. The footnotes explain adjustments in the few cases in which data are reported differently.
The latest version of the Fact Book, which includes updates and corrections, is posted on DIRE’s website.
GA
830 Westview Avenue SW | Atlanta,
30314 | data@morehouse.edu
SHARMYNE EVANS Director
JILL ELLIS Senior Research & Assessment Analyst
DIYANNA JILES Associate Director
SHEREE JONES Project Specialist
DIRE STAFF
3 MOREHOUSE COLLEGE FACT BOOK 2017–2022

4 INSTITUTIONAL DATA REFERENCE FOR THE MOREHOUSE COMMUNITY
A MESSAGE FROM THE PRESIDENT
Over the past five years, Morehouse College has strengthened its positioning as an institution unique in its mission, our ability to impact society, and our role in driving social and cultural change. To highlight our work in those areas, Morehouse College presents its 2017-2022 Fact Book, which shares key institutional facts, data, and information. This publication explores various institutional characteristics, such as admissions, enrollment, academic, completion, and financial data. This edition is the first printed Morehouse College Fact Book available in digital and print form.
As underscored by the information in the Fact Book, Morehouse is on a trajectory for sustainable success. For example, at the height of the COVID-19 pandemic, we experienced remarkable new student growth in fall 2021, enrolling 619 first-time, full-time, first-year students, compared to 523 enrolled in fall 2020. The fall 2021 total registered headcount was 2,554, with an FTE of 2,337. Thirty percent of Morehouse students were from Georgia, with other top states of residence including California, Illinois, Maryland, and New York. Despite the growth in the number of new students, we have maintained a low student-to-faculty ratio of 12:1. Nearly 300 faculty members provide instruction, of which more than 50 percent are full-time, and nearly 60 percent of the full-time faculty are tenured. Morehouse awarded 432 degrees between July 2020-June 2021, including 326 Bachelor of Arts, 101 Bachelor of Science, and five (5) Bachelor of Science General Studies.
Throughout its history, Morehouse has continued to be a leader in educational innovation and societal impact. In the mold of the recently launched Morehouse Online degree program, the Black Men’s Research Institute, and our trailblazing “Morehouse in the Metaverse,” the College has embarked on a $500 million “Making Men of Consequence” capital campaign to create the future-focused programs needed for collective societal advancement. Just as important, we continue to open new doors for our students by developing strategic corporate alliances, increasing the number of student scholarships awarded, enabling post-graduate study, expanding job placement opportunities, and elevating opportunities for global learning. Additionally, the College has invested in creating world-class facilities to engage students and the wider public, including the recently renovated Martin Luther King Jr. International Chapel, B.T. Harvey Football Field, and Edwin C. Moses Track & Field.
Founded in 1867 as the only college in the country with a mission to educate men of color, Morehouse College is one of the nation’s top liberal arts institutions. It is the leading producer of Black men who earn doctorates nationwide and the top producer of Rhodes Scholars among Historically Black Colleges and Universities (HBCUs). While Morehouse’s highly ranked curriculum, faculty expertise, and student experience uniquely position us to produce scholars and leaders committed to service, Morehouse’s legacy as the epicenter for thought leadership on social justice underscores our commitment to using knowledge to help the world address inequity. With more than 18,000 alumni in 14 countries, Morehouse Men are transforming the communities where they live and serve.
We invite you to explore this publication and learn more about how Morehouse continues to use education.
Sincerely, David A. Thomas President


5 MOREHOUSE COLLEGE FACT BOOK 2017–2022

6 INSTITUTIONAL DATA REFERENCE FOR THE MOREHOUSE COMMUNITY
TABLE OF CONTENTS
GENERAL INFORMATION 10
Institutional Characteristics 10
Timeline . . . . . . . . . . . . . . . . . . . . . . . . . . 12
Founder and Presidents 14
Board of Trustee 15
Organizational Structure. . . . . . . . . . . . . . . . . 16
Mission & Strategic Pillars 17
Rankings and Designations 18
Annual Quick Facts — Fall 2021 . . . . . . . . . . . . . 20
ADMISSIONS 22
FIRST-TIME, FIRST-YEAR (FTFY) ADMISSIONS PROFILE
FTFY Fall Admissions × (TABLE 1) 23
FTFY Fall Admissions × (FIGURE 1) . . . . . . . . . . . 23
Fall Transfer Admissions × (TABLE 2) 24
Fall Transfer Admissions × (FIGURE 2) 24
2021-22 FTFY Grade Point Average (GPA) × (TABLE 3) . 25
ENROLLMENT 26
INSTITUTIONAL ENROLLMENT PROFILE
12-Month Enrollment × (TABLE 4) . . . . . . . . . . . . 27
12-Month Enrollment Trend × (FIGURE 3) 27
Fall Enrollment by Enrollment Status × (TABLE 5) 28
Fall Enrollment by Enrollment Status × (FIGURE 4) . . 28
Fall 2021 Online Enrollment × (TABLE 6) 29
Enrollment by Ethnicity × (TABLE 7) 30
Enrollment by Ethnicity + Status × (TABLE 8) . . . . . . 30 Enrollment by Age × (TABLE 9) 32
Fall 2021 Enrollment by Age × (FIGURE 5) 32
Enrollment by Age + Status × (TABLE 10) . . . . . . . . 33
Enrollment by Classification × (TABLE 11) 34 Enrollment by Classification × (FIGURE 6) 34
Fall 2021 Enrollment by Classification + Status × (TABLE 12) 35
Fall 2021 Enrollment by Classification × (FIGURE 7) 35
Enrollment by Division × (TABLE 13) . . . . . . . . . . . 37
Fall 2021 Enrollment by Division × (FIGURE 8) 37
Enrollment by Major × (TABLE 14) 38
Fall 2021 Enrollment by Major + Classification × (TABLE 15) 40
Fall 2021 STEM Enrollment × (TABLE 16) . . . . . . . . 41
Fall 2021 Enrollment (Top 10 Majors) × (FIGURE 9) 43
Enrollment by State or Region × (TABLE 17). . . . . . . 44 International Enrollment × (TABLE 18) 45
First Generation Enrollment × (TABLE 19) 46
First Generation Enrollment by Status × (TABLE 20) 46
Fall 2021 First Generation Enrollment by Classification × (TABLE 21) 46
First-Time, First-Year Fall Enrollment by Status × (TABLE 22) 48
First-Time, Full-Time Cohort Enrollment × (FIGURE 10) 48
First-Time, First-Year Enrollment by Ethnicity × (TABLE 23) 49
First-Time, First-Year Enrollment by Ethnicity + Status × (TABLE 24) 49
First-Time, First-Year Enrollment by Age × (TABLE 25) 51
First-Time, First-Year Enrollment by Age + Status × (TABLE 26) 51
First-Time, First-Year by Majors × (TABLE 27) 52
First-Time, First-Year Enrollment by Division × (TABLE 28) 53
First-Time, First-Year STEM Enrollment × (TABLE 29) 53
Fall 2021 First-Time, First-Year Top 10 Majors × (FIGURE 11) 54
First-Time, First-Year Enrollment by State × (TABLE 30) 55
ACADEMICS 56
ACADEMIC OFFERINGS
Academic Divisions 57
Programs of Study × (TABLE 31) 58 Centers & Institutes . . . . . . . . . . . . . . . . . . . 59
Special Programs 60
Robert W. Woodruff Library: Library Collections and Access × (TABLE 32) 61
FACULTY 62
INSTRUCTIONAL FACULTY PROFILE
Instructional Faculty Headcount × (TABLE 33) 63 Instructional Faculty by Employment Status × (TABLE 34) 63
7 MOREHOUSE COLLEGE FACT BOOK 2017–2022
TABLE OF CONTENTS... CONT’D
Student Faculty Ratio × (TABLE 35) 64
Full-time Instructional Faculty by Tenure × (TABLE 36) 64
Full-time Instructional Faculty by Rank × (TABLE 37) 64
Full-time Instructional Faculty by Ethnicity × (TABLE 38) 65
Full-time Instructional Faculty by Gender × (TABLE 39) 65
RETENTION, PROGRESSION, AND GRADUATION 66
INSTITUTIONAL RETENTION PROFILE
First-Time, Full-Time Cohort Retention Rate (Fall to Fall) × (TABLE 40) 67
INSTITUTIONAL GRADUATION PROFILE
FTFT Cohort Graduation Rates × (TABLE 41) 68
IPEDS Completions + Awards by Ethnicity × (TABLE 42) 70 Graduates by Degree × (TABLE 43) . . . . . . . . . . . . 70
Graduate Awards by Major × (TABLE 44) 71
STEM Graduate Awards by Major × (TABLE 45) 72
2020-21 Graduate Awards by Major (Top 5 Majors) × (FIGURE 12) 73
GRADUATE EXIT SURVEY
Highest Level of Education Completed by Parents or Guardians × (FIGURE 13) 74
Relatives of Graduates Who Attended Morehouse × (FIGURE 14) 76 Participated in Internships While Enrolled at Morehouse × (FIGURE 15) 76
Post-Graduation Activity × (FIGURE 16) 77 Companies that Hired 2021 Graduates × (FIGURE 17) . 78 2021Graduates Overall Satisfaction × (FIGURE 18) 79
FINANCIAL AID 80
INSTITUTIONAL FINANCIAL AID PROFILE
Grant Aid Awarded × (TABLE 46) . . . . . . . . . . . . . 81
2020-21 First-Time, Full-Time Grant Aid Awards × (TABLE 47) . . . . . . . . . . . . . . . . 81
2020-21 First-Time, Full-Time Loan Aid Awarded × (TABLE 48) . . . . . . . . . . . . . . . 82
First-Time, Full-Time Students Awarded Grant Aid × (TABLE 49) 82
FINANCES 84
INSTITUTIONAL FINANCIAL PROFILE
Annual Budget × (TABLE 50) 85 Unrestricted Expenses + Revenue × (FIGURE 19) 86
FY 2021 Unrestricted Revenue Distribution × (FIGURE 20) 87
FY 2021 Unrestricted Expenses Distribution × (FIGURE 21) 87
ADVANCEMENT 88
GIVING PROFILE
Strategic Partnership Levels and Discernment × (TABLE 51) . . . . . . . . . . . . . 89
INSTITUTIONAL ALUMNI PROFILE
Alumni Giving × (TABLE 52) . . . . . . . . . . . . . . . . 90 Alumni by State × (TABLE 53) 92 Alumni by Top 10 States × (FIGURE 22) 93
CAMPUS LIFE 94
INSTITUTIONAL CAMPUS LIFE PROFILE
Clubs 95 Fraternities . . . . . . . . . . . . . . . . . . . . . . . . 95 Popular Campus Events 95
ATHLETICS 96
INSTITUTIONAL SPORTS PROFILE
Intercollegiate Sports 97 Intercollegiate Sports Participation × (TABLE 54) 98 Sports Complex. . . . . . . . . . . . . . . . . . . . . . 99
RESIDENTIAL LIFE 100
INSTITUTIONAL RESIDENTIAL PROFILE
Residence Halls . . . . . . . . . . . . . . . . . . . . . 101 Occupancy by Residential Assignment × (TABLE 55) . . . . . . . . . . . . . . . 102
CAMPUS MAP 104
8 INSTITUTIONAL DATA REFERENCE FOR THE MOREHOUSE COMMUNITY


…once a man bears the insignia of Morehouse Graduate, he will do exceptionally well.
Benjamin E. Mays, Ph.D. 6th President of Morehouse College
9 MOREHOUSE COLLEGE FACT BOOK 2017–2022
INSTITUTIONAL CHARACTERISTICS
PRESIDENT Dr. David A. Thomas, 12th President of Morehouse College
FOUNDING DATE 1867
CONTROL
CLASSIFICATION
MISSION
VISION
Private, not-for-profit independent (no religious affiliation)
Men’s College
Morehouse College, a private historically Black liberal arts college for men, aims to develop men with disciplined minds who will lead lives of leadership and service.
Morehouse aspires to be a world-renowned liberal arts college that attracts and educates Black men and other men who share the values of Morehouse College. The College also aims to be a national and global voice in education for Black men and strives to be a thriving, financially healthy institu tion committed to excellence and social justice and renowned for producing leaders.
MOTTO Et Facta Est Lux
CARNEGIE CLASSIFICATION
Baccalaureate College - Arts and Sciences Focus
CAMPUS SIZE 54 acres, 44 Buildings
INSTITUTIONAL ACCREDITATION
PROGRAM ACCREDITATION
Southern Association of Colleges and Schools Commission on Colleges (SACSCOC) 1866 Southern Lane, Decatur, GA 30033, 404-679-4500
National Association of Schools of Music (NASM) Association to Advance Collegiate Schools of Business (AACSB)
MEMBERSHIPS
Atlanta Regional Council for Higher Education (ARCHE), Atlanta University Center Consortium, American Chemical Society, American Association of Higher Education, American Council on Education, Associated Colleges of the South, Association of NROTC Colleges and Universities, Georgia Independent Colleges Association (GICA), National Association for Equal Opportunity in Higher Education, and National Association of Independent Colleges and Universities
ACADEMIC CALENDAR Semester, 6-week summer session
DEGREES OFFERED B.A., B.S., B.S.G.S.
MAJORS 32 majors in 4 academic divisions
ADDRESS 830 Westview Drive SW Atlanta, Georgia 30314
PHONE (470) 639-0999
WEBSITE morehouse.edu
10 INSTITUTIONAL DATA REFERENCE FOR THE MOREHOUSE COMMUNITY General Information INSTITUTIONAL CHARACTERISTICS
INSTITUTIONAL CHARACTERISTICS
SOCIAL MEDIA
LINKEDIN: linkedin.com/school/morehouse-college FACEBOOK: facebook.com/Morehouse1867
TWITTER: twitter.com/Morehouse
YOUTUBE: youtube.com/MorehouseCollege INSTAGRAM: instagram.com/morehouse1867
FALL 2021 ENROLLMENT 2,554
IPEDS FULL-TIME EQUIVALENT (FTE) 2,337 (fall)
STUDENT-FACULTY RATIO 12:1
RETENTION RATE (1ST TO 2ND YEAR) 86% (fall 2020 first-time, full-time freshman)
6-YR. GRADUATION RATE 47% (fall 2015 first-time, full-time freshman)
TUITION & FEES $29,468
ROOM & BOARD $14,272
VARSITY TEAMS Baseball, Basketball, Cross Country, Football, Golf, Tennis, Track & Field, and Volleyball
AFFILIATION NCAA Division II
CONFERENCE Southern Intercollegiate Athletic Conference (SIAC)
ATHLETICS
COLORS Maroon & White
MASCOT Maroon Tigers
MASCOT’S NAME King
FACILITIES B.T. Harvey Stadium, Edwin C. Moses Track, Forbes Arena-McAfee Court
11 MOREHOUSE COLLEGE FACT BOOK 2017–2022 General Information INSTITUTIONAL CHARACTERISTICS
HISTORICAL TIMELINE
1867
Augusta Theological Institute is founded in the basement of Springfield Baptist Church by William Jefferson White, an Augusta Baptist Minister at the request of Edmund Turney, of the National Theological Institute for Educating Freedmen, and Richard C. Coulter, a former slave.

1871
Reverend Dr. Joseph T. Robert becomes the first president of Augusta Institute.



1879
Augusta Theological Institute moves to the basement of Friendship Baptist Church in Atlanta and becomes Atlanta Baptist Seminary.
1884
1885
The Atlanta Baptist Seminary holds its first graduation and David Foster Estes is named acting president after death of Joseph Robert.
Dr. Samuel T. Graves is named president.

1888
Atlanta Baptist Seminary purchases 14 acres at a cost of $7,500 to relocate the campus to Atlanta’s West End community.
1889 Graves Hall becomes the first building erected on campus.

1890
Dr. George Sale is named the Seminary’s third president.
1897 Atlanta Baptist Seminary is renamed Atlanta Baptist College.

1906
Dr. John Hope becomes the College’s first African American president.

1911
The Glee Club is organized by Kemper Harreld.
1913 Atlanta Baptist College is renamed Morehouse College in honor of Henry L. Morehouse, the corresponding secretary of the American Baptist Home Mission Society.
1931
Dr. Samuel H. Archer becomes Morehouse’s fifth president and leads the College through the Depression.

1937 Dr. Charles D. Hubert is appointed acting president. 1940

Dr. Benjamin E. Mays becomes Morehouse’s sixth president.
1948
Martin Luther King Jr. earns a Bachelor of Arts degree in sociology from Morehouse at age 19.

1955 The Merrill Study Travel Program - the College’s first study abroad program (for students and faculty) is established with funding from Charles E. Merrill.
1957
Morehouse College receives full accreditation by the Southern Association of Colleges and Schools.

1967
Morehouse celebrates its Centennial; and A Candle in the Dark: A History of Morehouse College, written by Edward A. Jones is published; and Dr. Hugh Morris Gloster ‘31, becomes the first alumnus to serve as president of Morehouse College.
1968 Delta of Georgia Chapter of Phi Beta Kappa Honor Society is established. The funeral of Martin Luther King Jr. ‘48, is held on campus.
THE COLLEGE’S
12 INSTITUTIONAL DATA REFERENCE FOR THE MOREHOUSE COMMUNITY General Information HISTORICAL TIMELINE
HISTORICAL TIMELINE
1969
With a grant from the Olin Mathieson Charitable Trust, the Dual Degree Engineering Program is established through a partnership between the Atlanta University Center undergraduate institutions and Georgia Institute of Technology.
1970–75 Charles D. Hubert Hall, Benjamin G. Brawley Hall, Howard Thurman Hall, Frederick Douglass Commons, W.E.B. DuBois Hall, John H. Wheeler Hall, and Walter R. Chivers Hall are constructed.
1975
Louis W. Sullivan ’54, is appointed dean of the Medical Education Program at the College, which eventually became an independent institution, the Morehouse School of Medicine, in 1981.
1978 The Martin Luther King Jr. International Chapel and Hugh M. Gloster Hall are completed.

1987
Dr. Leroy Keith Jr. ’61, becomes the second alumnus to lead the College as president.
1989 “The Candle in the Dark” Gala, featuring the Bennie and Candle Awards ceremony is inaugurated.
1993
Nima A. Warfield ’94, an English major, becomes the first Morehouse student and the second HBCU student awarded the prestigious Rhodes Scholarship.
1994 Mr. Wiley Abron Perdue ’57, is appointed acting president.
1995 The Andrew Young Center for Global Leadership established.


1996
Dr. Walter Eugene Massey ‘58 is named ninth President of Morehouse and the Center for Excellence in Science, Engineering, and Mathematics is established with a $6.7 million grant from the U.S. Department of Defense.

1997 The Division of Business Administration and Economics receives accreditation from the American Association of Schools and Colleges of Business.
2005
The Leadership Center opens (renamed for Walter E. Massey in 2012).
2006
Morehouse completes a $118 million capital campaign and becomes permanent custodian of the Morehouse College Martin Luther King Jr. Collection.
2007
Dr. Robert Michael Franklin Jr. ’75, becomes Morehouse’s tenth president.

2010
The Ray Charles Performing Arts Center and Music Academic Building is completed.
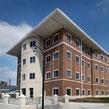

2013
Dr. Willis B. Sheftall ’64, becomes acting president. Dr. John Silvanus Wilson Jr. ‘79, becomes Morehouse’s eleventh president. President Barack Obama delivers the 129th Commencement Address.

2017
Morehouse celebrates its Sesquicentennial, “A House United,” recognizing 150 years of educating and developing global leaders.

Mr. William “Bill” Taggart becomes interim president; upon his unexpected passing, Michael Hodge becomes acting president.
Mr. Harold Martin Jr. ’02 becomes Interim President.
Dr. David A. Thomas appointed as the 12th President of Morehouse College


THE COLLEGE’S
13 MOREHOUSE COLLEGE FACT BOOK 2017–2022 General Information HISTORICAL TIMELINE
FOUNDERS AND PRESIDENTS
FOUNDER
William Jefferson White


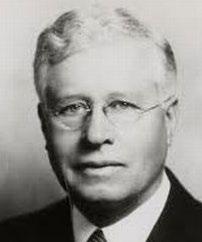


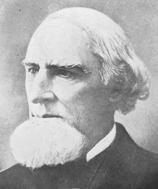


ASSOCIATE FOUNDERS
Richard C.
Turney
PRESIDENTS OF MOREHOUSE COLLEGE

JOHN
CHARLES
WILEY
WILLIAM
Coulter & Edmund
HELD
THE OFFICE OF PRESIDENT WITH THE TITLE “ACTING” OR “INTERIM”
JOSEPH T. ROBERT 1871–1884
HUGH M. GLOSTER ’31 1967–1987
BENJAMIN E. MAYS 1940–1967
DAVID
FOSTER ESTES 1884–1885
HOPE 1906
D. HUBERT ’09 1937–1940
A. PERDUE ’57 1994–1995
WILLIS
B.
SHEFTALL
JR. ’64 2013
JAMES TAGGART 2017
MICHAEL
E.
HODGE
2017 HAROLD L. MARTIN JR. ’02 2017
SAMUEL GRAVES 1885–1890
LEROY KEITH JR. ’61 1987–1994
GEORGE SALE 1890–1906
WALTER E. MASSEY ’58 1995–2007
JOHN HOPE 1906–1931
ROBERT M. FRANKLIN ’75 2007–2012
SAMUEL H. ARCHER 1931–1937
JOHN S. WILSON JR. ’79 2013–2017 DAVID A. THOMAS 2018–
14 INSTITUTIONAL DATA REFERENCE FOR THE MOREHOUSE COMMUNITY General Information FOUNDERS + PRESIDENTS
BOARD OF TRUSTEES
A. SCOTT BOLDEN ’84 (SECRETARY) Partner Reed Smith LLP
JAMES “JIM” CASSELBERRY JR. Chief Investment Officer 4S Bay Partners LLC
ALLEN M. CHAN President and CEO Robertson Scholars Leadership Program
DELMAN L. COATES ’95 Senior Pastor Mt. Ennon Baptist Church
CHRISTOPHER B. COWAN ’87
Managing Director Overseas Private Investment Corp.
JAVARRO EDWARDS President JME Group LLC
ALAN H. FLEISCHMANN
Founder, President, and CEO Laurel Strategies Inc.
EDDIE S. GLAUDE JR. ’89 Professor and Department Chair Department of African American Studies Princeton University
DOUG HERTZ President & CEO United Distributors Inc.
FREDERICK S. HUMPHRIES JR. ’83
Vice President, U.S. Government Affairs Microsoft Corp.
SAMUEL R. JOHNSON ’88
Americas Vice Chair, Market & Accounts Ernst & Young

HAROLD MARTIN JR. ’02 CEO Taco Mac Restaurant Group
JOHN O’NEILL
President, Central Region Cushman & Wakefield
VERDUN S. PERRY ’94
Senior Managing Director and Global Head of Strategic Partners Blackstone
ALFREDO RIVERA President, Coca-Cola North America The Coca-Cola Company
RICHARD THALER JR. (TREASURER) Managing Partner Lieutenant Island Partners LLC
JOHN L. THORNTON (VICE CHAIRMAN) Executive Chairman Barrick Gold Corp. F. EUCLID WALKER ’94 Managing Partner Parkway Investment Management LLC
STANLEY WASHINGTON ’85
Founder and CEO Pantheon Business Consulting
WILLIE E. WOODS ’85 (CHAIRMAN)
President and Managing Partner ICV Partners
COLLEGE ADMINISTRATOR/ EX-OFFICIO TRUSTEE
DAVID A. THOMAS President Morehouse College
FACULTY TRUSTEES
MELVIN FOSTER Associate Provost for Student Success and Associate Professor of Voice
DUANE M. JACKSON ’74 Professor of Psychology
ULRICA WILSON Associate Professor of Mathematics
STUDENT TRUSTEES
MARK NICHOLS ’23 91st President SGA
KAMAR MONTGOMERY ’23 Senior Board of Trustees Representative SGA
MALCOLM TUCKER ’24
Junior Board of Trustees Representative SGA
Chairmen Emeriti
ROBERT C. DAVIDSON JR. ’67
JAMES L. HUDSON ’61
OTIS MOSS JR. ’56
TRUSTEES EMERITI
BILLYE S. AARON
BENJAMIN A. BLACKBURN II ’61
ROBERT DAVIDISON JR. ’67
DALE E. JONES ’82
ROBERT LEVIN
C. DAVID MOODY JR. ’78
JAMES L. HUDSON ’61
JIM MOSS ’70
AVERY A. MUNNINGS ’86
JOHN A. WALLACE
DOROTHY COWSER YANCY
ANDREW JACKSON YOUNG JR.
15 MOREHOUSE COLLEGE FACT BOOK 2017–2022 General Information BOARD OF TRUSTEES
Chief of Staff Office of the President
THELBERT SNOWDEN
ORGANIZATIONAL STRUCTURE
BOARD OF TRUSTEES
DAVID A. THOMAS, PH.D. President


Provost and SVP Office of Academic Affairs
KENDRICK T. BROWN, PH.D.


SVP and Chief Financial Officer Office of Business and Finance
UNDRIA STALLING
SVP and Chief Administrative Officer Office of Administrative Services
KAREN MILLER
VP and Chief Advancement Officer Office of Institutional Advancement
BRENDA WILSON-HALLE


VP and Chief Brand Officer
Office of Strategic Communications, Marketing, and Admissions
PAULA RESLEY
VP, Office of External Relations and Alumni Engagement
HENRY M. GOODGAME JR. ’84
Associate VP Director of Title III Programs Office of Strategy and Planning


CAMILYA ROBERTSON
VP, Office of Student Services and Dean of the College
KEVIN BOOKER ’90
Director, Office of Data Analytics, Institutional Research and Effectiveness
SHARMYNE EVANS
VP and Chief Information Officer Office of Information Technology
KIMBERLEY MARSHALL, PH.D.
Director of Athletics
CURTIS CAMPBELL
16 INSTITUTIONAL DATA REFERENCE FOR THE MOREHOUSE COMMUNITY General Information LEADERSHIP
REALIZING EXCELLENCE
MISSION AND STRATEGIC PILLARS
MOREHOUSE COLLEGE VISION
PARTNERSHIPS OF PURPOSE
MOREHOUSE BEYOND BORDERS
ELEVATING THE MISSION
Graduates Serving the World
A Connected and Impactful Networks of Supporters
Invest in Predictive Analytics & Data for Retention
Intentional High-Impact Practices & Processes
The National & Global Voice on Educating Men of Color
Education for a Lifetime
From Consortium to Community Financial Modeling
Capital Campaign and Alumni/Stakeholder Engagement
Extraordinary Academics Leading to Careers of Influences
Internal Operational and Service Excellence
An Agile and Action-Oriented Campus
Innovative & Robust Program Offerings for Non-Traditional Students
Technology, Knowledge Dissemination & Strategic Communications
Amplifying Our Reach Through Marketing and Technology
Enhancing Space and Place
MISSION
The mission of Morehouse College is to develop men with disciplined minds who will lead lives of leadership and service.
17 MOREHOUSE COLLEGE FACT BOOK 2017–2022 General Information MISSION & STRATEGIC PILLARS


Morehouse College is nationally recognized as a top producer of Black male leaders. Graduates follow predetermined paths to leadership, creativity, and innovation. RANKINGS + DESIGNATIONS 2019– 2020 Fulbright Historically Black College and University (HBCU) Institutional Leader #4 2022 Historically Black Colleges and Universities #4 2022 National Liberal Arts Colleges #128 2022 Most Innovative Schools #42 2022 Top Performers on Social Mobility #18 2022 Best Undergraduate Teaching #36 18 INSTITUTIONAL DATA REFERENCE FOR THE MOREHOUSE COMMUNITY General Information RANKINGS AND DESIGNATIONS

19 MOREHOUSE COLLEGE FACT BOOK 2017–2022
ADMISSIONS


14% PA RT TIME REGISTERED HEADCOUNT 2,554 86% FULL TIME ANNUAL QUICK FACTS – FALL 2021 65.2% YIELD ADMITTE D OFFERED ADMISSION | 2,462 25.5% YIELD ENROLLED ENROLLED | 629 (OF THOSE ADMITTED) C OMPLETE APPLICA TIONS 3,777 57.5% YIELD ADMITTED OFFERED ADMISSION | 397 C OMPLETED APPLICA TIONS 690 61.2% YIELD ENROLLED ENROLLED | 243 (OF THOSE ADMITTED) BY ETHNICITY 2,554 98.4% BL A CK/AFRICAN AMERICAN BY CL ASSIFICATION 2,554 28.3% SOPHOMORES 8.2% O THER 1S T YRS 24.6% FTF Y18.8% SENIORS 20.2% JUNIORS BY RESIDENC Y 2,554 69.2% OTHER S TA TES + TERRITORIES 30.2% GEORGIA 0.5% FOREIGN COUNTRIES FIRST-TIME, FIRST-YEAR REGISTERED HEADCOUNT BY ETHNICITY BY CLASSIFICATION Full-Time 2,197 86.0% Part-Time 357 14.0% TOTAL 2,554 100.0% IPEDS Fall Enrollment FTE 2,337 Black/African American 2,514 98.4% Bi-Racial/Bi-Cultural (two or more races) 20 0.8% Non-Resident Alien (International) 14 0.5% Asian 0 0.0% Hispanic American/ Latino 3 0.1% American Indian/ Alaska Native 1 0.0% White/Caucasian 2 0.1% TOTAL 2,554 100.0% First-Time, First-Year (full-time & part-time) 629 24.6% Other First-Years 209 8.2% Sophomores 722 28.3% Juniors 515 20.2% Seniors 479 18.8% TOTAL 2,554 100.0% Georgia 772 30.2% Other States & Territories 1,768 69.2% Foreign Countries 14 0.5% TOTAL 2,554 100.0% TRANSFERS FALL COHORT (FTFT) 619 TOP 5 STATES Georgia California Illinois Maryland New York STATES REPRESENTED: 42 TOP 2 COUNTRIES Nigeria The Bahamas FOREIGN COUNTIRES REPRESENTED: 9 BY RESIDENCY
STUDENT POPULATION 20 General Information 2020–21 SUMMARY STATISTICS


YEARLY COSTS FACULTY ANNUAL QUICK FACTS – FALL 2021 GRADUATES 432 75.5% B.A. DEGREES 1.1% B.S. G.S. DEGREE S 23.4% B.S. DEGREES INSTRUCTIONAL FACULTY HEADCOUNT Tenured 87 58.8% On Tenure Track 13 8.8% Not On Tenure Track 48 32.4% TOTAL 148 100.0% Tuition $27,038.00 54.8% Required Fees $2,430.00 4.9% Room & Board $14,272.00 28.9% Books and Supplies $2,000.00 4.1% Other Expenses (Transportation & Personal Expenses) $3,560.00 7.2% TOTAL $49,300 100.0% B.A. Degrees Awarded 326 75.5% B.S. Degrees Awarded 101 23.4% B.S.G.S Degrees Awarded 5 1.1% TOTAL 432 100.0% IPEDS 2021-22, 6-yr Graduation Rate (2015 Cohort) 47% IPEDS 2021-22, 2nd Year Retention Rate (2020 Cohort) 86% FT-FACULTY BY TENURE STATUS Full-Time 148 54.2% Part-Time 125 45.8% TOTAL 273 100.0% FTE 190 STUDENT to FACULTY RATIO 12:1 GRADUATES COST OF ATTENDANCE 32.4% NOT ON TENURE TRAC K FT F A CUL TY BY TENURE S TA TUS 148 8.8% ON TENURE TRAC K 58.8% TENURED 45.8% PA RT TIME INSTRUC TIONAL FA CULTY HEADCOUNT 273 54.2% FULL TIME $ YEARLY COSTS $49,300 4.9% REQUIRED FEES 54.8% TUITION 7.2% OTHER EXPENSE S4.1% BOOK S + SUPPLIES 28.9% R OOM + BOARD 21 MOREHOUSE COLLEGE FACT BOOK 2017–2022

ADMISSIONS 22 INSTITUTIONAL DATA REFERENCE FOR THE MOREHOUSE COMMUNITY

ADMISSIONS FIRST-TIME, FIRST-YEAR FALL ADMISSIONS TABLE 1 ENROLLED FRESHMEN Academic Year Applied Accepted Full-Time First-Time, Full-Time Cohort Part-Time First-Time, Part-Time Total First-Time, First-Year Accepted Yield (%) Admissions Yield (%) 2017–18 2,349 1,748 617 0 617 74.4 35.3 2018–19 3,554 2,057 604 1 605 57.9 29.4 2019–20 2,030 2,026 563 5 568 99.8 28.0 2020–21 3,258 2,511 523 12 535 77.1 21.3 2021–22 3,777 2,462 619 10 629 65.2 25.5 Source: Integrated Postsecondary Education Data System (IPEDS), Admissions Survey, Winter Collection; Banner data as of 10-15-2021 Note: The accepted yield represents the number accepted out of the number applied. The admissions yield represents the number enrolled out of the number accepted (enrolled first-time, firstyear freshmen). First-time, first-year includes full-time (≥ 12 credit hours) and part-time (< 12 credit hours) students. However, the IPEDS cohort comprises only first-time, full-time students. 0 500 1000 1500 2000 2500 3000 3500 4000 2,349 1,748 617 605 568 535 629 2,057 2,026 2,511 2,462 3,554 2,030 3,258 3,777 2017–18 2018–19 2019–20 2020–21 2021–22 APPLIED ACCEPTED ENROLLED (FTFY) FIGURE 1 23 MOREHOUSE COLLEGE FACT BOOK 2017–2022
FALL
TRANSFER ADMISSIONS TABLE 2 Academic Year Applied Accepted Enrolled Transfers Accepted Yield (%) Admissions Yield (%) 2017–18 98 98 61 100.0 62.2 2018–19 215 77 43 35.8 55.8 2019–20 54 53 57 98.1 107.5 2020–21 135 75 39 55.6 52.0 2021–22 690 397 243 57.5 61.2 Source: Integrated Postsecondary Education Data System (IPEDS), Admissions Survey, Winter Collection; Banner data as of 10-15-2021 Note: The accepted yield represents the number accepted out of the number applied. The admissions yield represents the number enrolled out of the number accepted). In 2019-20, enrolled transfer students exceeded the number of transfer applicants. FIGURE 2 0 100 200 300 400 500 600 700 800 215 98 54 135 690 397 75 57 53 39 243 7798 61 43 2017–18 2018–19 2019–20 2020–21 2021–22 ENROLLED TRANSFERS APPLIED ACCEPTED 24 INSTITUTIONAL DATA REFERENCE FOR THE MOREHOUSE COMMUNITY Admissions FIRST-TIME, FIRST-YEAR (FTFY) ADMISSIONS PROFILE

TABLE 3 GPA 2021-22 (#) Accepted (%) 3.50 or Higher 289 48.4 3.00–3.49 238 39.9 2.50–2.99 57 9.5 2.00–2.49 12 2.0 Below 1.99 1 0.2 TOTAL 597 100.0 Source: Morehouse College Common Data Set (CDS), CDS-C First-Time First-Year (Freshman) Admissions; Banner data as of 10-15-2021 Note: The total represents the number of available GPAs in Banner reported by incoming freshmen for the academic year 2021-22. The total may not reflect the total number of enrolled FTFY students. 2021-22 FIRST-TIME, FIRST-YEAR GRADE POINT AVERAGE (GPA) 3.48 2021-22 FTFY AVERAGE GPA 25 MOREHOUSE COLLEGE FACT BOOK 2017–2022 Admissions FIRST-TIME, FIRST-YEAR (FTFY) ADMISSIONS PROFILE

ENROLLMENT 26 INSTITUTIONAL DATA REFERENCE FOR THE MOREHOUSE COMMUNITY

12-MONTH ENROLLMENT TABLE 4 2017–18 2018–19 2019–20 2020–21 Unduplicated Headcount 2,326 2,441 2,341 2,482 Instructional Activity 66,661 68,865 68,423 35,259 Full-time Equivalent Enrollment (FTE) 2,222 2,296 2,281 1,175 Source: Integrated Postsecondary Education Data System (IPEDS), 12-Month Enrollment Survey, Fall Collection; Banner data as of 06-15-2020, 10-15-2020, and 03-15-2021 Note: 12-month enrollment reflects an unduplicated headcount from the summer, fall, and spring terms and provides a composite of the annual enrollment. Instructional activity represents the total number of credit hours all students are engaged in during the 12 months. 2020-21 instructional activity is significantly lower than the prior year’s value, reflecting the impact of the Coronavirus pandemic. The full-time equivalent (FTE) of students is a single value providing a meaningful combination of full-time and part-time students. IPEDS has two calculations of FTE students, one using fall student headcounts and the other using 12-month instructional activity. FTE is calculated using the IPEDS definition full-time + (part-time * 0.392857). ENROLLMENT 0 10000 20000 30000 40000 50000 60000 70000 80000 66,661 68,865 68,423 35,259 2017–18 2018–19 2019–20 2020–21 INSTRUCTIONAL ACTIVITY INSTRUCTIONAL ACTIVITY 0 500 1000 1500 2000 2500 2,326 2,222 2,441 2,296 2,341 2,281 1,175 2,482 2017–18 2018–19 2019–20 2020–21 FULL TIME EQUIVALENT ENROLLMENT (FTE UNDUPLICATED HEADCOUNT 12- MONTH ENROLLMENT FIGURE 3 27 MOREHOUSE COLLEGE FACT BOOK 2017–2022
FALL ENROLLMENT BY ENROLLMENT STATUS TABLE 5 2017–18 2018 19 2019 20 2020–21 2021 22 [ # ] [ % ] [ # ] [ % ] [ # ] [ % ] [ # ] [ % ] [ # ] [ % ] Full-Time 2,090 94.9 2,146 97.3 2,145 95.8 2,008 93.4 2,197 86.0 Part-Time 112 5.1 60 2.7 93 4.2 143 6.6 357 14.0 TOTAL 2,202 100.0 2,206 100.0 2,238 100.0 2,151 100.0 2,554 100.0 Source: Integrated Postsecondary Education Data System (IPEDS), Fall Enrollment Survey, Spring Collection; Banner data as of 10-15-2021 Note: Full-time students are enrolled in a minimum of twelve credit hours. PART-TIMEFULL-TIME 2017 –18 2018–19 2019–20 2020–21 2021–22 0% 20% 40% 60% 80% 100% 86.0% 14.0% 6.6% 4.2% 2.7% 5.1% 93.4% 95.8% 97.3% 94.9% FALL ENROLLMENT BY ENROLLMENT STATUS FIGURE 4 28 INSTITUTIONAL DATA REFERENCE FOR THE MOREHOUSE COMMUNITY Enrollment INSTITUTIONAL ENROLLMENT PROFILE

FALL 2021 ONLINE ENROLLMENT TABLE 6 Full-Time Part-Time TOTAL [ # ] [ % ] [ # ] [ % ] Traditional On-Campus 2,187 99.5 145 40.6 2,332 Online 10 0.5 212 59.4 222 TOTAL 2,197 100.0 357 100.0 2,554 Source: Integrated Postsecondary Education Data System (IPEDS), Fall Enrollment Survey, Spring Collection; Banner data as of 10-15-2021 Note: Full-time students are enrolled in a minimum of twelve credit hours. 29 MOREHOUSE COLLEGE FACT BOOK 2017–2022 Enrollment INSTITUTIONAL ENROLLMENT PROFILE
ENROLLMENT BY ETHNICITY
ENROLLMENT BY ETHNICITY
STATUS
TABLE 7 2017–18 2018–19 2019–20 2020–21 2021–22 Nonresident Alien 31 15 16 14 14 Hispanic/Latino 14 10 9 6 3 American Indian/Alaska Native 4 5 4 2 1 Asian 2 0 0 1 0 Black/African American 2,069 2,080 1,618 2,082 2,514 Native Hawaiian or Other Pacific Islander 0 0 0 0 0 White 5 7 5 4 2 Two or More Races 46 62 51 42 20 Race and Ethnicity Unknown 31 27 535 0 0 TOTAL 2,202 2,206 2,238 2,151 2,554 Source: Integrated Postsecondary Education Data System (IPEDS), Fall Enrollment Survey, Spring Collection; Banner data as of 10-15-2021 Note: The 2020-21 Black/African American headcount will differ from IPEDS because of revisions to “unknown” ethnicities coded in Banner. International students are coded as non-resident alien and registered on the Student Exchange Visitor Information System (SEVIS).
+
TABLE 8 2017–18 2018–19 2019–20 2020–21 2021–22 FULL-TIME PART-TIME FULL-TIME PART-TIME FULL-TIME PART-TIME FULL-TIME PART-TIME FULL-TIME PART-TIME Nonresident Alien 31 0 14 1 16 0 14 0 13 1 Hispanic/Latino 14 0 9 1 9 0 6 0 3 0 American Indian/ Alaska Native 4 0 5 0 4 0 1 1 1 0 Asian 2 0 0 0 0 0 1 0 0 0 Black/African American 1,961 108 2,024 56 1,532 86 1,942 140 2,163 351 Native Hawaiian or Other Pacific Islander 0 0 0 0 0 0 0 0 0 0 White 5 0 7 0 4 1 4 0 2 0 Two or More Races 46 0 61 1 50 1 40 2 15 5 Race and ethnicity unknown 27 4 26 1 530 5 0 0 0 0 TOTAL 2,090 112 2,146 60 2,145 93 2,008 143 2,197 357 Source: Integrated Postsecondary Education Data System (IPEDS), Fall Enrollment Survey, Spring Collection; Banner data as of 10-15-2021 Note: The 2020-21 Black/African American headcount will differ from IPEDS because of revisions to “unknown” ethnicities coded in Banner. International students are coded as non-resident alien and registered on the Student Exchange Visitor Information System (SEVIS). Full-time students are enrolled in a minimum of twelve credit hours. 30 INSTITUTIONAL DATA REFERENCE FOR THE MOREHOUSE COMMUNITY Enrollment INSTITUTIONAL ENROLLMENT PROFILE

31 MOREHOUSE COLLEGE FACT BOOK 2017–2022
ENROLLMENT BY AGE TABLE 9 AGE GROUP 2017–18 2018–19 2019–20 2020–21 2021–22 Under 18 80 50 28 41 27 18-19 1,086 989 1,016 925 1,021 20-21 746 861 864 860 950 22-24 230 239 263 267 278 25-29 48 54 50 35 60 30-34 7 8 7 10 49 35-39 1 2 6 8 59 40-49 3 3 2 4 77 50-64 1 0 2 1 32 65 and over 0 0 0 0 1 TOTAL 2,202 2,206 2,238 2,151 2,554 Source: Integrated Postsecondary Education Data System (IPEDS), Fall Enrollment Survey, Spring Collection; Banner data as of 10-15-2021 88.1% AGE 18–24 4.3% AGE 25–34 6.6% AGE 35 AND OLDER 1.1% UNDER AGE 18 FIGURE 5 FALL 2021 ENROLLMENT BY AGE 32 INSTITUTIONAL DATA REFERENCE FOR THE MOREHOUSE COMMUNITY Enrollment INSTITUTIONAL ENROLLMENT PROFILE
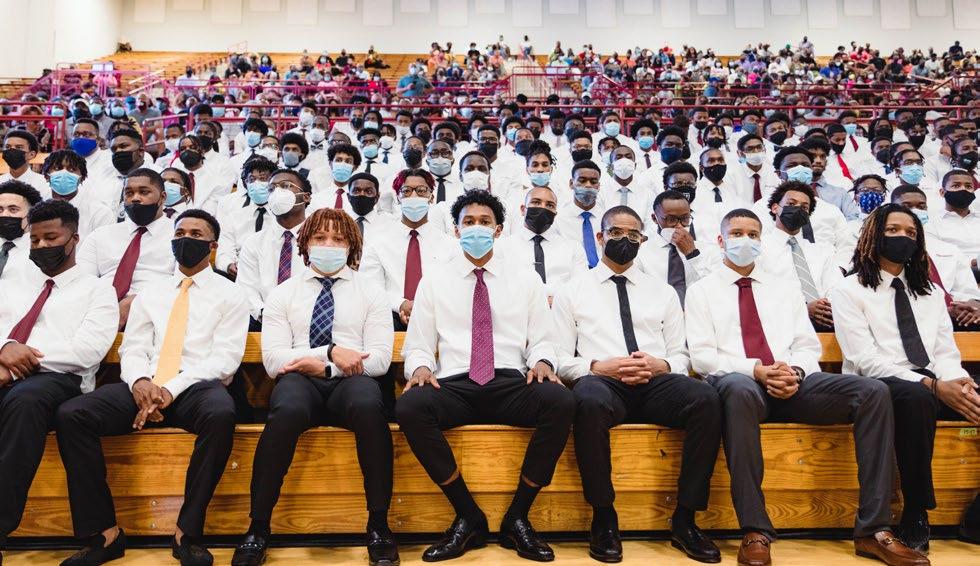
ENROLLMENT BY AGE + STATUS TABLE 10 2017–18 2018–19 2019–20 2020–21 2021–22 FULL-TIME PART-TIME FULL-TIME PART-TIME FULL-TIME PART-TIME FULL-TIME PART-TIME FULL-TIME PART-TIME Under 18 80 0 50 0 28 0 41 0 27 0 18-19 1,065 21 985 4 1,002 14 892 33 993 28 20-21 713 33 849 12 834 30 828 32 911 39 22-24 193 37 210 29 227 36 208 59 212 66 25-29 33 15 41 13 41 9 22 13 25 35 30-34 5 2 8 0 5 2 8 2 10 39 35-39 0 1 1 1 5 1 4 4 10 49 40-49 1 2 2 1 2 0 4 0 9 68 50-64 0 1 0 0 1 1 1 0 0 32 65 and over 0 0 0 0 0 0 0 0 0 1 TOTAL 2,090 112 2,146 60 2,145 93 2,008 143 2,197 357 Source: Integrated Postsecondary Education Data System (IPEDS), Fall Enrollment Survey, Spring Collection; Banner data as of 10-15-2021 Note: Full-time students are enrolled in a minimum of twelve credit hours. 33 MOREHOUSE COLLEGE FACT BOOK 2017–2022 Enrollment INSTITUTIONAL ENROLLMENT PROFILE
535 114 539 534 429 629 209 722 515 479 0 100 200 300 400 500 600 700 800 FIRS T- TIME, FIRS T- YEAR O THER FIRS T- TIME SOPHOMORE JUNIOR SENIOR 2020–21 2021–22 ENROLLMENT BY CLASSIFICATION FIGURE 6 ENROLLMENT BY CLASSIFICATION TABLE 11 2020–21 2021–22 [ # ] [ % ] [ # ] [ % ] First-Time, First-Year 535 24.9 629 24.6 Other First-Year 114 5.3 209 8.2 Sophomore 539 25.1 722 28.3 Junior 534 24.8 515 20.2 Senior 429 19.9 479 18.8 TOTAL 2,151 100.0 2,554 100.0 Source: Integrated Postsecondary Education Data System (IPEDS), Fall Enrollment Survey, Spring Collection; Banner data as of 10-15-2021 Note: First-time, first-year students, are classified as 1st-time freshmen, admitted in the fall semester of the noted year, and all classifications (to account for students that earned college credit during high school). Other first-year students are classified as freshmen, excluding 1st-time freshmen, and including transfer, continuing, and returning student-types. 34 INSTITUTIONAL DATA REFERENCE FOR THE MOREHOUSE COMMUNITY Enrollment INSTITUTIONAL ENROLLMENT PROFILE
535 619 10 158 51 569 153 450 65 401 78 0 100 200 300 400 500 600 700 800 FIRS T- TIME, FIRS T- YEAR O THER FIRS T- TIME SOPHOMORE JUNIOR SENIOR FULL TIME PART-TIME FALL 2021 ENROLLMENT BY CLASSIFICATION FIGURE 7 FALL 2021 ENROLLMENT BY CLASSIFICATION + STATUS TABLE 12 First-Time, First-Year Other First-year Sophomore Junior Senior TOTAL Full-Time 619 158 569 450 401 2,197 Part-Time 10 51 153 65 78 357 TOTAL 629 209 722 515 479 2,554 Source: Integrated Postsecondary Education Data System (IPEDS), Fall Enrollment Survey, Spring Collection; Banner data as of 10-15-2021 Note: First-time, first-year students, are classified as 1st-time freshmen, admitted in the fall semester of the noted year, and all classifications (to account for students that earned college credit during high school). Other first-year students are classified as freshmen, excluding 1st-time freshmen, and including transfer, continuing, and returning student-types. Full-time students are enrolled in a minimum of twelve credit hours. 35 MOREHOUSE COLLEGE FACT BOOK 2017–2022 Enrollment INSTITUTIONAL ENROLLMENT PROFILE

36 INSTITUTIONAL DATA REFERENCE FOR THE MOREHOUSE COMMUNITY
ENROLLMENT BY DIVISION TABLE 13 Fall 2020 Fall 2021 [ # ] [ % ] [ # ] [ % ] Business and Economics 691 32.1 943 36.9 Humanities, Social Sciences, Media, and Arts 585 27.2 627 24.5 Professional and Continuing Studies 129 6.0 124 4.9 Science, Technology, Engineering, and Mathematics 702 32.6 809 31.7 Undeclared 44 2.0 51 2.0 TOTAL HEADCOUNT 2,151 100.0 2,554 100.0 Source: Integrated Postsecondary Education Data System (IPEDS), Fall Enrollment Survey, Spring Collection; Banner data as of 10-15-2021 FIGURE 8 24.5% HUMANITIES, SOCIAL SCIENCES, MEDIA, AND ARTS 2.0% UNDECL ARED 36.9% BUSINESS AND ECONOMICS 4.9% PROFESSIONAL AND C ONTINUING STUDIES 31.7% SCIENCE, TECHNOLOGY, ENGINEERING, AND MATHEMATICS FALL 2021 ENROLLMENT BY DIVISION 37 MOREHOUSE COLLEGE FACT BOOK 2017–2022 Enrollment INSTITUTIONAL ENROLLMENT PROFILE
Fall
Africana Studies 4 0.2 13 0.5
African-American Studies 7 0.3 3 0.1 Applied Physics (DDEP) 6 0.3 72 2.8 Art 12 0.6 20 0.8
Art History 2 0.1 3 0.1 Biology 215 10.0 237 9.3 Business Administration 614 28.5 862 33.8 Chemistry 35 1.6 23 0.9
Chinese Studies 3 0.1 1 0.0
Cinema, Television and Emerging Media Studies 46 2.1 70 2.7 Communication Studies 60 2.8 74 2.9 Computer Science 118 5.5 176 6.9 Dance and Choreography 0 0.0 1 0.0
Drama 46 2.1 5 0.2
Early Childhood Education 7 0.3 1 0.0 Economics 77 3.6 81 3.2 Education Studies 7 0.3 10 0.4
English 58 2.7 46 1.8 French 2 0.1 0 0.0
General Science (DDEP) 138 6.4 92 3.6 History 19 0.9 20 0.8
International Studies 15 0.7 13 0.5
Journalism in Sports, Social Justice, and Culture 0 0.0 9 0.4 Kinesiology, Sport Studies, and Physical Education 115 5.3 113 4.4 Mathematics 20 0.9 19 0.7 Music 30 1.4 29 1.1 Philosophy 24 1.1 24 0.9 Physics 24 1.1 25 1.0 Political Science 158 7.3 166 6.5 Psychology 117 5.4 133 5.2 Religion 6 0.3 8 0.3 Sociology 87 4.0 83 3.2 Software Engineering 29 1.3 32 1.3 Spanish 3 0.1 2 0.1 Theater and Performance 0 0.0 32 1.3 Urban Studies 3 0.1 5 0.2 Undeclared 44 2.0 51 2.0
TOTAL HEADCOUNT 2,151 100.0 2,554 100.0
Source: Integrated Postsecondary Education Data System (IPEDS), Fall Enrollment Survey, Spring Collection; Banner data as of 10-15-2021 Note: Students earn two bachelor’s degrees through the Dual Degree Engineering Program (DDEP) – one degree from Morehouse and one degree from one of fourteen participating engineering schools. In Banner, students coded as Pre-Engineering majors are counted as General Science (DDEP) majors, Pre-Psychology majors are counted as Psychology majors, and Pre-Cinema, Television & Emerging Media Studies (CTEMS) are counted as CTEMS majors.
ENROLLMENT BY MAJOR TABLE 14
2020 Fall
2021
[ # ] [ % ] [ # } [ % ]
38 INSTITUTIONAL DATA REFERENCE FOR THE MOREHOUSE COMMUNITY Enrollment INSTITUTIONAL ENROLLMENT PROFILE

First-Time
%
Africana Studies 3 0.5 1 0.5 4 0.6 4 0.8 1 0.2 13
African-American Studies 0 0.0 1 0.5 1 0.1 0 0.0 1 0.2 3
Applied Physics (DDEP) 58 9.2 3 1.4 5 0.7 2 0.4 4 0.8 72
Art 11 1.7 0 0.0 3 0.4 3 0.6 3 0.6 20
Art History 1 0.2 0 0.0 1 0.1 0 0.0 1 0.2 3
Biology 74 11.8 9 4.3 64 8.9 36 7.0 54 11.3 237 Business Administration 171 27.2 94 45.0 298 41.3 164 31.8 135 28.2 862 Chemistry 2 0.3 0 0.0 7 1.0 6 1.2 8 1.7 23
Chinese Studies 0 0.0 0 0.0 0 0.0 1 0.2 0 0.0 1
Cinema, Television and Emerging Media Studies 24 3.8 7 3.3 16 2.2 14 2.7 9 1.9 70
Communication Studies 13 2.1 1 0.5 21 2.9 25 4.9 14 2.9 74
Computer Science 65 10.3 16 7.7 35 4.8 27 5.2 33 6.9 176 Dance and Choreography 0 0.0 0 0.0 1 0.1 0 0.0 0 0.0 1 Drama 0 0.0 2 1.0 0 0.0 1 0.2 2 0.4 5
Early Childhood Education 0 0.0 0 0.0 1 0.1 0 0.0 0 0.0 1 Economics 12 1.9 4 1.9 27 3.7 18 3.5 20 4.2 81
Education Studies 5 0.8 1 0.5 4 0.6 0 0.0 0 0.0 10 English 7 1.1 2 1.0 7 1.0 15 2.9 15 3.1 46 French 0 0.0 0 0.0 0 0.0 0 0.0 0 0.0 0
General Science (DDEP) 4 0.6 15 7.2 34 4.7 25 4.9 14 2.9 92 History 0 0.0 0 0.0 10 1.4 5 1.0 5 1.0 20 International Studies 1 0.2 2 1.0 1 0.1 4 0.8 5 1.0 13 Journalism in Sports, Social Justice, and Culture 2 0.3 2 1.0 4 0.6 1 0.2 0 0.0 9
Kinesiology, Sport Studies, and Physical Education 23 3.7 5 2.4 33 4.6 28 5.4 24 5.0 113 Mathematics 2 0.3 0 0.0 5 0.7 5 1.0 7 1.5 19 Music 6 1.0 3 1.4 6 0.8 4 0.8 10 2.1 29 Philosophy 3 0.5 1 0.5 6 0.8 11 2.1 3 0.6 24 Physics 4 0.6
9 1.2 3 0.6 9 1.9 25 Political Science 48
44 8.5 30 6.3 166 Psychology 31 4.9
20 3.9 26 5.4 133 Religion 3 0.5
2 0.3 3 0.6 0 0.0 8 Sociology 6 1.0
17 2.4 29 5.6 28 5.8 83 Software Engineering 7
2.1
0.8
0.2 1 0.2
0.8
2.5
0.0
FALL 2021 ENROLLMENT BY MAJOR + CLASSIFICATION TABLE 15
First-Year Other First-Year Sophomore Junior Senior TOTAL [ # ] [
] [ # ] [ % ] [ # ] [ % ] [ # ] [ % ] [ # ] [ % ]
0 0.0
7.6 12 5.7 32 4.4
15 7.2 41 5.7
0 0.0
3 1.4
1.1 2 1.0 8 1.1 11
4
32 Spanish 0 0.0 0 0.0 0 0.0 1
2 Theater and Performance 4 0.6 1 0.5 11 1.5 4
12
32 Urban Studies 2 0.3 0 0.0 3 0.4 0 0.0 0
5 Undeclared 37 5.9 7 3.3 5 0.7 1 0.2 1 0.2 51 TOTAL HEADCOUNT 629 100.0 209 100.0 722 100.0 515 100.0 479 100.0 2,554 Source: Integrated Postsecondary Education Data System (IPEDS), Fall Enrollment Survey, Spring Collection; Banner data as of 10-15-2021 Note: Students earn two bachelor’s degrees through the Dual Degree Engineering Program (DDEP) – one degree from Morehouse and one degree from one of fourteen participating engineering schools. In Banner, students coded as Pre-Engineering majors are counted as General Science (DDEP) majors, Pre-Psychology majors are counted as Psychology majors, and Pre-Cinema, Television & Emerging Media Studies (CTEMS) are counted as CTEMS majors.First-time, first-year students, are classified as 1st-time freshmen, admitted in the fall semester of the noted year, and all classifications (to account for students that earned college credit during high school). Other first-year students are classified as freshmen, excluding 1st-time freshmen, and including transfer, continuing, and returning student-types. 40 Enrollment INSTITUTIONAL ENROLLMENT PROFILE
Integrated Postsecondary Education Data

10-15-2021
all classifications
Emerging Media
and returning student-types.
for
FALL 2021 STEM ENROLLMENT TABLE 16 First-Time First-Year Other First-Year Sophomore Junior Senior TOTAL [ # ] [ % ] [ # ] [ % ] [ # ] [ % ] [ # ] [ % ] [ # ] [ % ] Applied Physics (DDEP) 58 23.5 3 5.0 5 2.4 2 1.5 4 2.5 72 Biology 74 30.0 9 15.0 64 30.8 36 26.7 54 34.0 237 Chemistry 2 0.8 0 0.0 7 3.4 6 4.4 8 5.0 23 Computer Science 65 26.3 16 26.7 35 16.8 27 20.0 33 20.8 176 General Science (DDEP) 4 1.6 15 25.0 34 16.3 25 18.5 14 8.8 92 Mathematics 2 0.8 0 0.0 5 2.4 5 3.7 7 4.4 19 Physics 4 1.6 0 0.0 9 4.3 3 2.2 9 5.7 25 Psychology 31 12.6 15 25.0 41 19.7 20 14.8 26 16.4 133 Software Engineering 7 2.8 2 3.3 8 3.8 11 8.1 4 2.5 32 TOTAL 247 100.0 60 100.0 208 100.0 135 100.0 159 100.0 809 Source:
System (IPEDS), Fall Enrollment Survey, Spring Collection; Banner data as of
Note: Students earn two bachelor’s degrees through the Dual Degree Engineering Program (DDEP) – one degree from Morehouse and one degree from one of fourteen participating engineering schools. In Banner, students coded as Pre-Engineering majors are counted as General Science (DDEP) majors, Pre-Psychology majors are counted as Psychology majors, and Pre-Cinema, Television &
Studies (CTEMS) are counted as CTEMS majors. First-time, first-year students, are classified as 1st-time freshmen, admitted in the fall semester of the noted year, and
(to account
students that earned college credit during high school). Other first-year students are classified as freshmen, excluding 1st-time freshmen, and including transfer, continuing,
41 MOREHOUSE COLLEGE FACT BOOK 2017–2022 Enrollment INSTITUTIONAL ENROLLMENT PROFILE

42 INSTITUTIONAL DATA REFERENCE FOR THE MOREHOUSE COMMUNITY
COMMUNICA
APPLIED
THEA
FALL 2021 ENROLLMENT (TOP 10 MAJORS)
BUSINESS ADMINS TRA TION
Source: Integrated Postsecondary
Note:
Pre-Psychology
Psychology
Pre-Cinema, Television & Emerging Media Studies (CTEMS)
0 200 400 600 800 1000 BIOL OG Y COMPUTER SCIENCE P OLITICAL SCIENCE PS YC HO LO GY KINESIOL OG Y, SPORT S TUDIES & PHY SICAL EDUCA TION GENERAL SCIENCE (DDEP ) SOCIOL OG Y ECONOMIC S
TIONS S TUDIES
PHY SICS (DDEP ) CINEMA, TELEVISION AND EMERGING MEDIA S TUDIES UNDECLARED ENGLISH
TER AND PERFORMANCE SOFTWARE ENGINEERING MUSIC PHY SIC S PHIL OSOPHY CHEMIS TR Y HIS TORY AR T MA THEMA TIC S AFRICANA S TUDIES INTERNA TIONAL S TUDIES EDUCA TIONAL S TUDIES JOURNALISM IN SPORTS, SOCIAL JUS TICE, AND CUL TURE RELIGION URBAN S TUDIES DRAMA ART HIS TORY AFRICAN-AMERICAN S TUDIES SP ANISH DANCE CHOREOGRAPH Y EARLY CHILDHOOD EDUCA TION CHINESE S TUDIES FRENCH
862 237 176 166 133 113 92 83 81 74 72 70 51 46 32 32 29 25 24 23 20 20 19 13 13 10 9 8 5 5 3 3 2 1 1 1 0
FIGURE 9
Education Data System (IPEDS), Fall Enrollment Survey, Spring Collection; Banner data as of 10-15-2021
Students earn two bachelor’s degrees through the Dual Degree Engineering Program (DDEP) – one degree from Morehouse and one degree from one of fourteen participating engineering schools. In Banner, students coded as PreEngineering majors are counted as General Science (DDEP) majors,
majors are counted as
majors, and
are counted as CTEMS majors. 43 MOREHOUSE COLLEGE FACT BOOK 2017–2022 Enrollment INSTITUTIONAL ENROLLMENT PROFILE
[
ENROLLMENT BY STATE
Fall
Alabama 30 1.4 36 1.4
Arizona 8 0.4 10 0.4
Arkansas 9 0.4 9 0.4
California 132 6.1 179 7.0
Colorado 12 0.6 14 0.5
Connecticut 11 0.5 18 0.7
Delaware 4 0.2 7 0.3
District of Columbia 66 3.1 65 2.5
Florida 73 3.4 82 3.2
Georgia 654 30.4 772 30.2
Hawaii 1 0.0 1 0.0
Illinois 134 6.2 168 6.6
Indiana 13 0.6 9 0.4
Iowa 2 0.1 3 0.1
Kansas 3 0.1 3 0.1
Kentucky 6 0.3 3 0.1
Louisiana 35 1.6 48 1.9
Maryland 170 7.9 167 6.5
Massachusetts 23 1.1 26 1.0
Michigan 52 2.4 72 2.8 Minnesota 12 0.6 13 0.5 Mississippi 16 0.7 18 0.7
Missouri 22 1.0 34 1.3
Nebraska 3 0.1 2 0.1
Nevada 6 0.3 8 0.3
New Hampshire 2 0.1 2 0.1
New Jersey 65 3.0 76 3.0
New Mexico 0 0.0 1 0.0
New York 120 5.6 141 5.5
North Carolina 89 4.1 101 4.0
Ohio 43 2.0 53 2.1
Oklahoma 7 0.3 9 0.4 Oregon 2 0.1 3 0.1
Pennsylvania 54 2.5 70 2.7
Puerto Rico 0 0.0 1 0.0
South Carolina 23 1.1 42 1.6
Tennessee 45 2.1 50 2.0
Texas 103 4.8 129 5.1
Virginia 52 2.4 69 2.7
Washington 9 0.4 14 0.5
West Virginia 1 0.0 0 0.0
Wisconsin 9 0.4 6 0.2
International State Code 17 0.8 15 0.6
UNKNOWN 13 0.6 5 0.2
Source:
OR REGION TABLE 17
2020 Fall 2021
# } [ % ] [ # } [ % ]
TOTAL HEADCOUNT 2,151 100.0 2,554 100.0
Integrated Postsecondary Education Data System (IPEDS), Fall Enrollment Survey, Spring Collection; Banner data as of 10-15-2021 Note: International students are registered on the Student and Exchange Visitor Information System (SEVIS). Students with an international state code may not be international students. 44 INSTITUTIONAL DATA REFERENCE FOR THE MOREHOUSE COMMUNITY Enrollment INSTITUTIONAL ENROLLMENT PROFILE

INTERNATIONAL ENROLLMENT TABLE 18 Fall 2020 Fall 2021 Bermuda 1 1 British Virgin Islands 1 1 Cameroon 0 1 Canada 0 1 China 1 1 Cote D'Ivoire 0 1 Ethiopia 2 0 Kenya 1 0 Nigeria 5 5 South Africa 0 1 The Bahamas 3 2 TOTAL 14 14 Source: Integrated Postsecondary Education Data System (IPEDS), Fall Enrollment Survey, Spring Collection; Banner data as of 10-15-2021 Note: International students are registered on the Student and Exchange Visitor Information System (SEVIS). 45 MOREHOUSE COLLEGE FACT BOOK 2017–2022 Enrollment INSTITUTIONAL ENROLLMENT PROFILE
FIRST GENERATION ENROLLMENT
FIRST GENERATION
BY
TABLE 19 Fall 2020 Fall 2021 [ # ] [ % ] [ # ] [ % ] First Generation 366 17.0 461 18.1 Non-First Generation 1,785 83.0 2,093 81.9 TOTAL 2,151 100.0 2,554 100.0 Source: Integrated Postsecondary Education Data System (IPEDS), Fall Enrollment Survey, Spring Collection; Banner data as of 10-15-2021
ENROLLMENT
STATUS TABLE 20 Fall 2020 Fall 2021 1st-Gen Non-1st-Gen TOTAL 1st-Gen Non-1st-Gen TOTAL Full-Time 344 1,664 2,008 346 1,851 2,197 Part-Time 22 121 143 115 242 357 TOTAL 366 1,785 2,151 461 2,093 2,554 Source: Integrated Postsecondary Education Data System (IPEDS), Fall Enrollment Survey, Spring Collection; Banner data as of 10-15-2021 Note: Full-time students are enrolled in a minimum of twelve credit hours.. FALL 2021 FIRST GENERATION ENROLLMENT BY CLASSIFICATION TABLE 21 First-Time First-Year Other First-year Sophomore Junior Senior TOTAL [ # ] [ % ] [ # ] [ % ] [ # ] [ % ] [ # ] [ % ] [ # ] [ % ] Full-Time 87 95.6 34 64.2 89 59.3 70 77.8 66 85.7 346 Part-Time 4 4.4 19 35.8 61 40.7 20 22.2 11 14.3 115 TOTAL 91 100.0 53 100.0 150 100.0 90 100.0 77 100.0 461 Source: Integrated Postsecondary Education Data System (IPEDS), Fall Enrollment Survey, Spring Collection; Banner data as of 10-15-2021 Note: First-time, first-year students, are classified as 1st-time freshmen, admitted in the fall semester of the noted year, and all classifications (to account for students that earned college credit during high school). Other first-year students are classified as freshmen, excluding 1st-time freshmen, including transfer, continuing, and returning student-types. Full-time students are enrolled in a minimum of twelve credit hours. 46 INSTITUTIONAL DATA REFERENCE FOR THE MOREHOUSE COMMUNITY Enrollment INSTITUTIONAL ENROLLMENT PROFILE

47 MOREHOUSE COLLEGE FACT BOOK 2017–2022
FIRST-TIME, FIRST-YEAR FALL ENROLLMENT BY STATUS TABLE 22 2017–18 2018–19 2019–20 2020–21 2021–22 [ # ] [ % ] [ # ] [ % ] [ # ] [ % ] [ # ] [ % ] [ # ] [ % ] Full-Time 617 100.0 604 99.8 563 99.1 523 97.8 619 98.4 Part-Time 0 0.0 1 0.2 5 0.9 12 2.2 10 1.6 TOTAL 617 100.0 605 100.0 568 100.0 535 100.0 629 100.0 Source: Integrated Postsecondary Education Data System (IPEDS), Fall Enrollment Survey, Spring Collection; Banner data as of 10-15-2021 Note: First-time, first-year students, are classified as 1st-time freshmen, admitted in the fall semester of the noted year, and all classifications (to account for students that earned college credit during high school). Full-time students are enrolled in a minimum of twelve credit hours. FIRST-TIME, FULL-TIME COHORT ENROLLMENT FIGURE 10 0 100 200 300 400 500 600 700 800 6 0 46 1 7 5 6 3 5 2 3 6 1 9 2017–18 2018–19 2019–20 2020–21 2021–22 48 INSTITUTIONAL DATA REFERENCE FOR THE MOREHOUSE COMMUNITY Enrollment INSTITUTIONAL ENROLLMENT PROFILE
FIRST-TIME, FIRST-YEAR ENROLLMENT BY ETHNICITY
FIRST-TIME, FIRST-YEAR
BY
TABLE 23 Ethnicity 2017–18 2018 19 2019–20 2020 21 2021 22 Nonresident Alien 3 5 2 1 2 Hispanic/Latino 2 2 0 0 0 American Indian/Alaska Native 0 1 0 0 0 Asian 0 0 0 0 0 Black/African American 568 571 89 534 627 Native Hawaiian or Other Pacific Islander 0 0 0 0 0 White 1 1 0 0 0 Two or More Races 37 19 1 0 0 Race and Ethnicity Unknown 6 6 476 0 0 TOTAL 617 605 568 535 629 Source: Integrated Postsecondary Education Data System (IPEDS), Fall Enrollment Survey, Spring Collection; Banner data as of 10-15-2021 Note: The 2020-21 Black/African American headcount will differ from IPEDS because of revisions to “unknown” ethnicities coded in Banner. International students are coded as non-resident alien are registered on the Student Exchange Visitor Information System (SEVIS). First-time, first-year students, are classified as 1st-time freshmen, admitted in the fall semester of the noted year, and all classifications (to account for students that earned college credit during high school).
ENROLLMENT
ETHNICITY + STATUS TABLE 24 2017–18 2018–19 2019–20 2020–21 2021–22 FULL-TIME PART-TIME FULL-TIME PART-TIME FULL-TIME PART-TIME FULL-TIME PART-TIME FULL-TIME PART-TIME Nonresident Alien 3 0 5 0 2 0 1 0 2 0 Hispanic/Latino 2 0 2 0 0 0 0 0 0 0 American Indian/ Alaska Native 0 0 1 0 0 0 0 0 0 0 Asian 0 0 0 0 0 0 0 0 0 0 Black/African American 568 0 570 1 89 0 522 12 617 10 Native Hawaiian or Other Pacific Islander 0 0 0 0 0 0 0 0 0 0 White 1 0 1 0 0 0 0 0 0 0 Two or More Races 37 0 19 0 1 0 0 0 0 0 Race and Ethnicity Unknown 6 0 6 0 471 5 0 0 0 0 TOTAL 617 0 604 1 563 5 523 12 619 10 Source: Integrated Postsecondary Education Data System (IPEDS), Fall Enrollment Survey, Spring Collection; Banner data as of 10-15-2021 Note: The 2020-21 Black/African American headcount will differ from IPEDS because of revisions to “unknown” ethnicities coded in Banner. International students are coded as non-resident alien are registered on the Student Exchange Visitor Information System (SEVIS). First-time, first-year students, are classified as 1st-time freshmen, admitted in the fall semester of the noted year, and all classifications (to account for students that earned college credit during high school). Full-time students are enrolled in a minimum of twelve credit hours. 49 MOREHOUSE COLLEGE FACT BOOK 2017–2022 Enrollment INSTITUTIONAL ENROLLMENT PROFILE

50 INSTITUTIONAL DATA REFERENCE FOR THE MOREHOUSE COMMUNITY
FIRST-TIME, FIRST-YEAR ENROLLMENT BY AGE
Under
Source: Integrated Postsecondary Education
FIRST-TIME, FIRST-YEAR ENROLLMENT BY AGE + STATUS
Source:
TABLE 25 2020–21 2021–22
18 41 27 18-19 488 593 20-21 5 8 22-24 0 0 25-29 1 0 30-34 0 0 35-39 0 1 40-49 0 0 50-64 0 0 65 and over 0 0 TOTAL 535 629
Data System (IPEDS), Fall Enrollment Survey, Spring Collection; Banner data as of 10-15-2021 Note: First-time, first-year students, are classified as 1st-time freshmen, admitted in the fall semester of the noted year, and all classifications (to account for students that earned college credit during high school).
TABLE 26 2020–21 2021–22 FULL-TIME PART-TIME FULL-TIME PART-TIME Under 18 41 0 27 0 18-19 476 12 584 9 20-21 5 0 8 0 22-24 0 0 0 0 25-29 1 0 0 0 30-34 0 0 0 0 35-39 0 0 0 1 40-49 0 0 0 0 50-64 0 0 0 0 65 and over 0 0 0 0 TOTAL 523 12 619 10
Integrated Postsecondary Education Data System (IPEDS), Fall Enrollment Survey, Spring Collection; Data as of 10-15-2021 Note: First-time, first-year students, are classified as 1st-time freshmen, admitted in the fall semester of the noted year, and all classifications (to account for students that earned college credit during high school). Full-time students are enrolled in a minimum of twelve credit hours. 51 MOREHOUSE COLLEGE FACT BOOK 2017–2022 Enrollment INSTITUTIONAL ENROLLMENT PROFILE
FIRST-TIME, FIRST-YEAR ENROLLMENT BY MAJORS
2020
%
2021
%
Africana Studies 3 0.6 3 0.5 Applied Physics (DDEP) 4 0.7 58 9.2 Art 3 0.6 11 1.7 Art History 1 0.2 1 0.2 Biology 54 10.1 74 11.8 Business Administration 171 32.0 171 27.2 Chemistry 9 1.7 2 0.3
Chinese Studies 0 0.0 0 0.0
Cinema, Television and Emerging Media Studies 10 1.9 24 3.8 Communication Studies 11 2.1 13 2.1 Computer Science 33 6.2 65 10.3 Dance 0 0.0 0 0.0
Drama 3 0.6 0 0.0
Early Childhood Education 3 0.6 0 0.0 Economics 15 2.8 12 1.9 Education Studies 3 0.6 5 0.8 English 6 1.1 7 1.1 French 0 0.0 0 0.0 General Science (DDEP) 59 11.0 4 0.6
History 3 0.6 0 0.0
International Studies 4 0.7 1 0.2 Journalism in Sports, Social Justice, and Culture 0 0.0 2 0.3 Kinesiology, Sport Studies, and Physical Education 16 3.0 23 3.7 Mathematics 3 0.6 2 0.3 Music 6 1.1 6 1.0 Philosophy 3 0.6 3 0.5 Physics 4 0.7 4 0.6 Political Science 34 6.4 48 7.6 Psychology 37 6.9 31 4.9 Religion 1 0.2 3 0.5 Sociology 6 1.1 6 1.0 Software Engineering 3 0.6 7 1.1 Theater and Performance 0 0.0 4 0.6 Spanish 0 0.0 0 0.0
Urban Studies 1 0.2 2 0.3 Undeclared 26 4.9 37 5.9
TOTAL HEADCOUNT 535 100.0 629 100.0
Source: Integrated Postsecondary Education Data System (IPEDS), Fall Enrollment Survey, Spring Collection; Banner data as of 10-15-2021 Note: Students earn two bachelor’s degrees through the Dual Degree Engineering Program (DDEP) – one degree from Morehouse and one degree from one of fourteen participating engineering schools. In Banner, students coded as Pre-Engineering majors are counted as General Science (DDEP) majors, Pre-Psychology majors are counted as Psychology majors, and Pre-Cinema, Television & Emerging Media Studies (CTEMS) are counted as CTEMS majors. First-time, first-year students, are classified as 1st-time freshmen, admitted in the fall semester of the noted year, and all classifications (to account for students that earned college credit during high school).
TABLE 27 Fall
Fall
[ # ] [
] [ # ] [
]
52 INSTITUTIONAL DATA REFERENCE FOR THE MOREHOUSE COMMUNITY Enrollment INSTITUTIONAL ENROLLMENT PROFILE
FIRST-TIME, FIRST-YEAR ENROLLMENT BY DIVISION
FIRST-TIME, FIRST-YEAR STEM ENROLLMENT
TABLE 28 Fall 2020 Fall 2021 [ # ] [ % ] [ # ] [ % ] Business and Economics 186 34.8 183 29.1 Humanities, Social Sciences, Media, and Arts 95 17.8 134 21.3 Professional and Continuing Studies 22 4.1 28 4.5 Science, Technology, Engineering, and Mathematics 206 38.5 247 39.3 Undeclared 26 4.9 37 5.9 TOTAL 535 100.0 629 100.0 Source: Integrated Postsecondary Education Data System (IPEDS), Fall Census 2021; Banner data as of 10-15-2021 Note: First-time, first-year students, are classified as 1st-time freshmen, admitted in the fall semester of the noted year, and all classifications (to account for students that earned college credit during high school).
TABLE 29 Fall 2020 Fall 2021 Applied Physics (DDEP) 4 58 Biology 54 74 Chemistry 9 2 Computer Science 33 65 General Science (DDEP) 59 4 Mathematics 3 2 Physics 4 4 Psychology 37 31 Software Engineering 3 7 TOTAL 206 247 Source: Integrated Postsecondary Education Data System (IPEDS), Fall Enrollment Survey, Spring Collection; Banner data as of 10-15-2021 Note: Students earn two bachelor’s degrees through the Dual Degree Engineering Program (DDEP) – one degree from Morehouse and one degree from one of fourteen participating engineering schools. In Banner, students coded as Pre-Engineering majors are counted as General Science (DDEP) majors and Pre-Psychology majors are counted as Psychology majors. First-time, first-year students, are classified as 1st-time freshmen, admitted in the fall semester of the noted year, and all classifications (to account for students that earned college credit during high school). 53 MOREHOUSE COLLEGE FACT BOOK 2017–2022 Enrollment INSTITUTIONAL ENROLLMENT PROFILE
2021 FIRST-TIME, FIRST-YEAR TOP 10 MAJORS
Source: Integrated Postsecondary Education Data System (IPEDS), Fall Enrollment Survey, Spring Collection; Banner data as of 10-15-2021
Note: Students earn two bachelor’s degrees through the Dual Degree Engineering Program (DDEP) – one degree from Morehouse and one degree from one of fourteen participating engineering schools. In Banner, students coded as PreEngineering majors are counted as General Science (DDEP) majors and Pre-Psychology majors are counted as Psychology majors. First-time, first-year students, are classified as 1st-time freshmen, admitted in the fall semester of the noted year, and all classifications (to account for students that earned college credit during high school).
FALL
FIGURE 11
05 0 100 150 200 BIOL OG Y COMPUTER SCIENCE APPLIED PHY SICS (DDEP ) P OLITICAL SCIENCE UNDECLARED PS YC HO LO GY CINEMA, TELEVISION, AND EMERGING MEDIA S TUDIES KINESIOL OG Y, SPORTS S TUDIES, AND PHY SICAL EDUCA TION COMMUNICA TIONS S TUDIES ECONOMIC S AR T ENGLISH SOFTWARE ENGINEERING MUSIC SOCIOL OG Y EDUCA TION S TUDIES GENERAL SCIENCE (DDEP ) PHY SIC S THEA TER AND PERFORMANCE RELIGION PHIL OSOPHY AFRICANA S TUDIES MA THEMA TIC S URBAN S TUDIES CHEMIS TR Y JOURNALISM IN SPORTS, SOCIAL JUS TICE, AND CUL TURE INTERNA TIONAL S TUDIES ART HIS TORY SP ANISH HIS TORY FRENCH EDUCA TION DANC E CHINESE S TUDIES BUSINESS ADMINS TRA TION171 74 65 58 48 37 31 24 23 13 12 11 7 7 6 6 5 4 4 4 3 3 3 2 2 2 2 1 1 0 0 0 0 0 0 54 INSTITUTIONAL DATA REFERENCE FOR THE MOREHOUSE COMMUNITY Enrollment INSTITUTIONAL ENROLLMENT PROFILE
FIRST-TIME, FIRST-YEAR ENROLLMENT BY STATE
Fall 2020 Fall 2021
Alabama 6 1.1 8 1.3 Arizona 0 0.0 2 0.3 Arkansas 2 0.4 2 0.3
California 19 3.6 48 7.6 Colorado 2 0.4 3 0.5 Connecticut 1 0.2 7 1.1
Delaware 0 0.0 4 0.6
District of Columbia 8 1.5 15 2.4
Florida 8 1.5 21 3.3
Georgia 166 31.0 169 26.9
Illinois 31 5.8 45 7.2
Indiana 1 0.2 1 0.2
Iowa 2 0.4 1 0.2 Kentucky 3 0.6 1 0.2 Louisiana 3 0.6 16 2.5
Maryland 25 4.7 37 5.9
Massachusetts 8 1.5 11 1.7 Michigan 9 1.7 16 2.5 Minnesota 3 0.6 3 0.5
Mississippi 2 0.4 8 1.3 Missouri 1 0.2 14 2.2 Nevada 2 0.4 2 0.3
New Jersey 11 2.1 18 2.9
New Mexico 0 0.0 1 0.2
New York 50 9.3 39 6.2
North Carolina 10 1.9 18 2.9 Ohio 25 4.7 12 1.9 Oklahoma 4 0.7 2 0.3 Oregon 1 0.2 1 0.2
Pennsylvania 30 5.6 17 2.7
Puerto Rico 0 0.0 1 0.2
South Carolina 10 1.9 11 1.7 Tennessee 21 3.9 16 2.5 Texas 58 10.8 28 4.5 Virginia 6 1.1 23 3.7 Washington 1 0.2 6 1.0
International State Code 1 0.2 2 0.3
UNKNOWN 5 0.9 0 0.0
TOTAL
Source:
TABLE 30
[ # ] [ % ] [ # ] [ % ]
535 100.0 629 100.0
Integrated Postsecondary Education Data System (IPEDS), Fall Enrollment Survey, Spring Collection; Banner data as of 10-15-2021 Note: International students are registered on the Student and Exchange Visitor Information System (SEVIS). Students with an international state code may not be international students. First-time, first-year students, are classified as 1st-time freshmen, admitted in the fall semester of the noted year, and all classifications (to account for students that earned college credit during high school). 55 MOREHOUSE COLLEGE FACT BOOK 2017–2022 Enrollment INSTITUTIONAL ENROLLMENT PROFILE

ACADEMICS 56 INSTITUTIONAL DATA REFERENCE FOR THE MOREHOUSE COMMUNITY
ACADEMICS
ACADEMIC DIVISIONS
Morehouse’s four academic divisions house 32 programs led by world-class faculty committed to fostering interdisciplinary learning.


Business and Economics (BE)

Humanities, Social Sciences, Media and Arts (HSSMA)
Science, Technology, Engineering, and Mathematics (STEM)
Professional and Continuing Studies (PCS)

57 MOREHOUSE COLLEGE FACT BOOK 2017–2022
BUSINESS AND ECONOMICS (BE)
CREDENTIAL ONLINE
Business Administration (Accounting, Finance, Management, and Marketing Concentrations)
PROGRAMS OF STUDY
CREDENTIAL ONLINE
B.A., Minor Professional Sales Minor
Economics B.A., Minor
HUMANITIES, SOCIAL SCIENCES, MEDIA, AND ARTS (HSSMA)
CREDENTIAL ONLINE
Africana Studies
B.A., Minor
CREDENTIAL ONLINE
Journalism in Sports, Social Justice, and Culture B.A., Minor
Art History Minor Latin American Studies Minor
Asian Studies Minor Leadership Studies Minor Chinese Studies B.A., Minor Music B.A., Minor Cinema, Television, and Emerging Media Studies B.A., Minor Philosophy B.A., Minor
Communication Studies B.A. – Political Science B.A., Minor –Criminal Justice Minor Public History Minor Curatorial Studies Minor Religion B.A., Minor Dance B.A., Minor Sociology B.A., Minor English B.A., Minor Spanish B.A., Minor European Studies Minor Theater & Performance B.A., Minor French B.A., Minor Urban Studies B.A., Minor History B.A., Minor Visual Art B.A., Minor International Studies B.A., Minor
PROFESSIONAL AND CONTINUING STUDIES (PCS)
CREDENTIAL ONLINE
CREDENTIAL ONLINE
Education B.A., Minor Kinesiology, Sport Studies, and Physical Education B.A.
SCIENCE, TECHNOLOGY, ENGINEERING, AND MATHEMATICS (STEM)
CREDENTIAL ONLINE
CREDENTIAL ONLINE
Applied Physics (DDEP) B.S. Naval Science Minor Biology B.S., Minor Neuroscience Minor Chemistry B.S., Minor Physics B.S., Minor Computer Science B.S. Psychology B.A., B.S., Minor
Environmental Studies Minor Public Health Sciences Minor General Science (DDEP) B.S.G.S. Software Engineering B.S. Mathematics B.S., Minor Sustainability Minor
Note: Through the Dual Degree Engineering Program (DDEP), students earn two bachelor’s degrees –one degree from Morehouse and one degree from one of fourteen participating engineering schools.
TABLE 31
58 INSTITUTIONAL DATA REFERENCE FOR THE MOREHOUSE COMMUNITY Academics ACADEMIC OFFERINGS
ANDREW YOUNG CENTER FOR GLOBAL LEADERSHIP
The Andrew Young Center for Global Leadership encompasses four interdependent institutes: Institute for Research, Civic Engagement, and Policy; Leadership Studies Program; Institute for International and Experiential Education; and Social Justice Inquiry and Praxis. Each institute is designed to provide institutional, national, and international leadership in the examination and generation of solutions for global challenges, the study of social justice-based leadership, social justice activism training, and the development of social change agents, and co-curricular experiences designed to prepare students for lives as global citizens and leaders.
BONNER OFFICE OF COMMUNITY SERVICE
The Bonner Office of Community Service encourages a culture of service, encouraging Men of Morehouse to be accountable leaders with the desire to steward positive
social change. Committed to Morehouse’s mission, the Bonner Office provides infrastructure and support for students, faculty, and staff to receive training and learn best practices to support the design, implementation, and assessment of community impact interventions.

The Bonner Office also supports faculty in implementing service-learning in their courses while providing servant leadership to community partners via community service scholarship programs.
BRISBANE INSTITUTE
The Brisbane Institute seeks to connect students to politics and political science beyond the classroom. Through internships, collaborative faculty-student research opportunities, and guest speakers, the Brisbane institute affirms Morehouse College’s commitment to investigating the most relevant questions in Black politics at the local and national levels.
CENTERS + INSTITUTES 59 MOREHOUSE COLLEGE FACT BOOK 2017–2022 Academics ACADEMIC OFFERINGS
ISTEM-XE
The Innovative Science Technology, Engineering and Mathematics Explore project engages rising 6th, 7th, and 8th-grade minority students in a three-year STEM technology program that includes a four-week summer program, hands-on field experience, and Saturday Academy during the academic year. The program uses a project-based framework designed to provide students with challenging technological learning experiences. The project exposes students to innovation and creativity in STEM disciplines within the context of real-world problem-solving scenarios using entrepreneurial concepts to promote academic success in middle and high school and prepare students academically to attend a college or university.
OFFICE OF HEALTH PROFESSIONS
The Office of Health Professions advises and assists students in preparing for careers in the health professions. Services help increase the awareness of pre-health professions, improve performance on standardized entrance exams into health professional schools, and assist students with all aspects of the application process to pre-health professions schools.
PUBLIC HEALTH SCIENCES INSTITUTE
The Public Health Sciences Institute supports and trains students, diversifying the public health workforce with culturally competent, well-trained minority students. PHSI was created under a cooperative agreement with the Centers for Disease Control and Prevention in 1988. Services include building public health career awareness and individualized career counseling.
SPECIAL PROGRAMS
CENTER FOR EXCELLENCE IN EDUCATION
The Center for Excellence in Education is focused on social justice, educational excellence, equity, and ethical leadership. Utilizing an interdisciplinary design allows students to customize their area of study by selecting the courses, programs, and activities that align with their career interests. Services prepare students to teach, explore, innovate, and lead with excellence. Programs range from educator preparation focuses on producing educators that become policymakers, researchers, innovators, and leaders equipped to revolutionize education.
INNOVATION AND ENTREPRENEURSHIP CENTER
The Innovation and Entrepreneurship Center connect education with student leadership development and community-focused resources and support. All programs and services are focused on increasing small business development. This is accomplished through industrycertified process improvement training; mentorship with prime contractors for project bid development; community resources to access information, services, and options for business start-up support; technical assistance to other historically Black and minorityserving institutions (HBCUs/MIs); research, consultative and program services to government agencies, corporations, and universities seeking to expand their small business supplier pool; and education and outreach to encourage college students and youth to consider entrepreneurship as a career choice.
CROWN FORUM TRIO PROGRAMS
THE HONORS PROGRAM
NEW STUDENT ORIENTATION (NSO)
SUMMER ACADEMY
DUAL DEGREE ENGINEERING PROGRAM (DDEP)
OTIS MOSS ORATORICAL CONTEST
DOMESTIC EXCHANGE
PRE-FRESHMAN SUMMER ENRICHMENT PROGRAM (PSEP DUAL ENROLLMENT
ARMY ROTC*
NAVY ROTC
AIR FORCE ROTC*
STUDY ABROAD
HOWARD THURMAN HONORS PROGRAM
OPRAH WINFREY SCHOLARS
*Morehouse College Army Reserve Officer Training Corps (ROTC) is a subsidiary of the Georgia State University ROTC program. Air Force ROTC is located on the campus of the Georgia Institute of Technology
60 INSTITUTIONAL DATA REFERENCE FOR THE MOREHOUSE COMMUNITY Academics ACADEMIC OFFERINGS


LIBRARY COLLECTIONS AND ACCESS TABLE 32 FY 2018-19 FY 2019-20 FY 2020-21 Print Volumes 348,386 345,563 346,021 Databases 344 321 323 e-Journals 155,193 163,585 163,585 e-Books 106,371 112,721 121,380 Linear Feet (lf) Archival Collections 8,356 (lf) 8,571 (lf) 9,105 (lf) CD, Videos and DVDs 8,496 8,510 5,903 Source: Robert W. Woodruff Library, Annual Report, https://www.auctr.edu/about/overview/reports/; Retrieved 3-9-2022 Robert W. Woodruff Library 61 MOREHOUSE COLLEGE FACT BOOK 2017–2022 Academics ROBERT W. WOODRUFF LIBRARY

FACULTY 62 INSTITUTIONAL DATA REFERENCE FOR THE MOREHOUSE COMMUNITY

INSTRUCTIONAL FACULTY BY EMPLOYMENT STATUS TABLE 34 2017–18 2018–19 2019–20 2020–21 2021–22 [ # ] [ % ] [ # ] [ % ] [ # ] [ % ] [ # ] [ % ] [ # ] [ % ] Full-Time 169 77.9 154 97.5 149 95.5 137 93.8 148 54.2 Part-Time 48 22.1 4 2.5 7 4.5 9 6.2 125 45.8 TOTAL 217 100.0 158 100.0 156 100.0 146 100.0 273 100.0 Source: Integrated Postsecondary Education Data System (IPEDS), HR Survey, Spring Collection; Banner HRIS data as of 11-01-2021 Note: Instructional faculty is an occupational category comprised of staff who are either: 1) primarily instruction or 2) instruction combined with research and/or public service. The intent of the Instructional Staff category is to include all individuals whose primary occupation includes instruction at the institution. INSTRUCTIONAL FACULTY HEADCOUNT TABLE 33 2017–18 2018–19 2019–20 2020–21 2021–22 Total Instructional Faculty 217 158 156 146 273 FTE 185 155 151 140 190 Source: Integrated Postsecondary Education Data System (IPEDS), HR Survey, Spring Collection; Banner HRIS data as of 11-01-2021 Note: Instructional faculty is an occupational category comprised of staff who are either: 1) primarily instruction or 2) instruction combined with research and/or public service. The intent of the Instructional Staff category is to include all individuals whose primary occupation includes instruction at the institution. FACULTY 63 MOREHOUSE COLLEGE FACT BOOK 2017–2022 Morehouse College Fact Book 2017–2022
STUDENT FACULTY RATIO
FULL-TIME INSTRUCTIONAL FACULTY BY TENURE
INSTRUCTIONAL
TABLE 36 2017–18 2018–19 2019–20 2020–21 2021–22 Tenured 84 114 91 84 87 On Tenure Track 18 1 9 21 13 Annual Contract 53 39 49 32 31 Less-than Annual Contract 14 0 0 0 0 Without Faculty Status 0 0 0 0 17 TOTAL 169 154 149 137 148 Source: Integrated Postsecondary Education Data System (IPEDS), HR Survey, Spring Collection; Banner HRIS data as of 11-01-20211 Note: Instructional faculty is an occupational category comprised of staff who are either: 1) primarily instruction or 2) instruction combined with research and/or public service. The intent of the Instructional Staff category is to include all individuals whose primary occupation includes instruction at the institution.
TABLE 35 2017 2018 2019 2020 2021 Student-to-Faculty Ratio 12:1 14:1 14:1 15:1 12:1 Source: Integrated Postsecondary Education Data System (IPEDS), Fall Enrollment Survey, Spring Collection; Banner data as of 10-15-2021 FULL-TIME
FACULTY BY RANK TABLE 37 2017–18 2018–19 2019–20 2020–21 2021–22 [ # ] [ % ] [ # ] [ % ] [ # ] [ % ] [ # ] [ % ] [ # ] [ % ] Professor 31 18.3 32 20.8 34 22.8 33 24.1 37 25.0 Associate Professor 63 37.3 63 40.9 59 39.6 59 43.1 53 35.8 Assistant Professor 48 28.4 48 31.2 46 30.9 40 29.2 51 34.5 Instructor 14 8.3 11 7.1 7 4.7 5 3.6 0 0.0 Lecturer 2 1.2 0 0.0 1 0.7 0 0.0 0 0.0 No Academic Rank 11 6.5 0 0.0 2 1.3 0 0.0 7 4.7 TOTAL 169 100.0 154 100.0 149 100.0 137 100.0 148 100.0 Source: Integrated Postsecondary Education Data System (IPEDS), HR Survey, Spring Collection; Banner HRIS data as of 11-01-2021 Note: Instructional faculty is an occupational category comprised of staff who are either: 1) primarily instruction or 2) instruction combined with research and/or public service. The intent of the Instructional Staff category is to include all individuals whose primary occupation includes instruction at the institution. Academic Rank is a status designated by the institution according to the institution’s policies. The IPEDS HR survey includes the ranks of Professor, Associate Professor, Assistant Professor, Instructor, and Lecturer. 64 INSTITUTIONAL DATA REFERENCE FOR THE MOREHOUSE COMMUNITY Faculty INSTRUCTIONAL FACULTY PROFILE
FULL-TIME INSTRUCTIONAL
BY
FULL-TIME
FACULTY
ETHNICITY TABLE 38 2017–18 2018 19 2019–20 2020 21 2021 22 Nonresident Alien 0 0 0 0 0 Hispanic/Latino 8 8 7 8 9 American Indian/Alaska Native 0 1 1 1 1 Asian 9 10 8 9 9 Black/African American 125 109 110 98 108 Native Hawaiian or Other Pacific Islander 0 0 0 10 0 White 24 25 22 10 19 Two or More Races 1 1 1 1 1 Race and Ethnicity Unknown 2 0 0 0 1 TOTAL 169 154 149 137 148 Source: Integrated Postsecondary Education Data System (IPEDS), HR Survey, Spring Collection; Banner HRIS data as of 11-01-2021 Note: Instructional faculty is an occupational category comprised of staff who are either: 1) primarily instruction or 2) instruction combined with research and/or public service. The intent of the Instructional Staff category is to include all individuals whose primary occupation includes instruction at the institution.
INSTRUCTIONAL FACULTY BY GENDER TABLE 39 2017–18 2018 19 2019–20 2020 21 2021 22 Male 103 95 93 87 91 Female 66 59 56 50 57 TOTAL 169 154 149 137 148 Source: Integrated Postsecondary Education Data System (IPEDS), HR Survey, Spring Collection; Banner HRIS data as of 11-01-2021 Note: Instructional faculty is an occupational category comprised of staff who are either: 1) primarily instruction or 2) instruction combined with research and/or public service. The intent of the Instructional Staff category is to include all individuals whose primary occupation includes instruction at the institution. 65 MOREHOUSE COLLEGE FACT BOOK 2017–2022 Faculty INSTRUCTIONAL FACULTY PROFILE
PROGRESSION,

RETENTION,
AND GRADUATION 66 INSTITUTIONAL DATA REFERENCE FOR THE MOREHOUSE COMMUNITY
RETENTION, PROGRESSION AND GRADUATION

FIRST-TIME, FULL-TIME COHORT RETENTION RATE (FALL TO FALL) TABLE 40 REPORTING YEAR ENROLLMENT FTFT RETENTION RATE TRACKING CENSUS IPEDS REGISTERED FRESHMEN Year Cohort Year 2nd-Year RR Total Enrollment Full-Time (First-Time, Full-Time Cohort) Part-Time (First-Time, Part-Time) TOTAL (First-Time, First-Year) FTFT Adjusted Cohort # Retained 1st to 2nd-YR 1st to 2nd-Year RR # Retained 2nd to 3rd-YR 2nd to 3rd- Year RR # Retained 3rd to 4th-YR 3rd to 4th-Year RR 2016–17 Cohort 2016 2017–18 2,108 608 3 611 608 509 84% 448 74% 403 66% 2017–18 Cohort 2017 2018–19 2,202 617 0 617 617 463 75% 401 65% 382 62% 2018–19 Cohort 2018 2019–20 2,206 604 1 605 604 501 83% 431 71% 407 67% 2019–20 Cohort 2019 2020–21 2,238 563 5 568 563 483 86% 439 78% 2020–21 Cohort 2020 2021–22 2,152 523 12 535 523 448 86% 2021–22 Cohort 2021 2022–23 2,554 619 10 629 629 Source: Integrated Postsecondary Education Data System (IPEDS), Fall Enrollment Survey, Spring Collection; Banner data as of 10-15-2021 Note: The IPEDS retention rate is based on individuals from the prior year’s first-time, full-time cohort that return the subsequent fall semester. The 1st to 2nd-year retention rate serves as the College’s official rate for the indicated reporting year. The adjusted cohort is used for calculating the retention rate. The adjusted cohort represents the number of remaining students from the cohort after the deduction of students who left the institution for any of the following reasons: died or were totally and permanently disabled; to serve in the armed forces (including those called to active duty); to serve with a foreign aid service of the Federal Government (e.g., Peace Corps); or to serve on official church missions. Blanked-out spaces indicate data is not available.
67 MOREHOUSE COLLEGE FACT BOOK 2017–2022
Year
CENSUS
REPORTING
Full-Time (First-Time, Full-Time Cohort)
ENROLLMENT
REGISTERED FRESHMEN
Part-Time (First-Time, Part-Time)
Total (First-Time, First-Year)
FTFT Adjusted Cohort
2010–11 Cohort 2010 2013–14 2014–15 2016–17 2018–19 2,586 525 6 531 525
2011–12 Cohort 2011 2014–15 2015–16 2017–18 2019–20 2,438 497 3 500 496
2012–13 Cohort 2012 2015–16 2016–17 2018–19 2020–21 2,374 567 3 570 567
2013–14 Cohort 2013 2016–17 2017–18 2019–20 2021–22 2,170 483 3 486 483
2014–15 Cohort 2014 2017–18 2018–19 2020–21 2022–23 2,109 540 0 540 539
2015–16 Cohort 2015 2018–19 2019–20
2016–17 Cohort 2016 2019–20
2017–18 Cohort 2017
2018–19 Cohort 2018
2019–20 Cohort
2020–21 Cohort 2020
2021–22 Cohort
Source:
Graduation
2023–24 2,167 598 0 598 573
2,108
3
TABLE 41
YEAR
IPEDS Total Enrollment
Cohort Year Expected Graduation Year 4-YR Completions (100%) 6-YR Completions (150%) 8-YR Completions (200%)
2021–22
2020–21 2022–23 2024–25
608
611 607
2020–21 2021–22 2023–24 2025–26 2,202 617 0 617
2021–22 2022–23 2024–25 2026–27 2,206 604 1 605
2019 2022–23 2023–24 2025–26 2027–28 2,238 563 5 568
2023–24 2024–25 2026–27 2028–29 2,151 523 12 535
2021 2024–25 2025–26 2027–28 2029–30 2,554 619 10 629
Integrated Postsecondary Education Data System (IPEDS), Graduation Rates Survey. Note:
rate cohort includes all full-time, first-time degree/certificate-seeking undergraduate students. The adjusted cohort represents all allowable exclusions for men who did not persist to graduation for the following reasons: deceased, permanently disabled, armed forces, foreign aid service of the federal government, and official church missions. Blanked-out spaces indicate data is not available. 68 INSTITUTIONAL DATA REFERENCE FOR THE MOREHOUSE COMMUNITY Retention, Progression, and Graduation INSTITUTIONAL GRADUATION PROFILE

FIRST-TIME, FULL-TIME COHORT GRADUATION RATES FTFT COHORT GRADUATION TRACKING COMPLETED IN 4 YEARS OR LESS (100%) COMPLETED IN 5 YEARS OR LESS COMPLETED IN 6 YEARS OR LESS (150%) COMPLETED IN 8 YEARS (200%) # Graduates 4-YR Graduation Rate # Graduates Cumulative Graduates 5-YR Graduation Rate # Graduates Cumulative Graduates 6-YR Graduation Rate # Graduates Cumulative Graduates 8-YR Graduation Rate 200 38% 57 257 49% 7 264 50% 20 284 54% 206 42% 58 264 53% 10 274 55% 26 300 60% 241 43% 47 288 51% 19 307 54% 10 317 56% 157 33% 66 223 46% 39 262 54% 218 40% 67 285 53% 19 304 56% 191 33% 58 249 43% 20 269 47% 69 MOREHOUSE COLLEGE FACT BOOK 2017–2022 Retention, Progression, and Graduation INSTITUTIONAL GRADUATION PROFILE
IPEDS COMPLETIONS + AWARDS BY ETHNICITY TABLE 42 Reported to IPEDS 2017–18 2018–19 2019–20 2020–21 Fiscal Year Completed 2016–17 2017–18 2018–19 2019–20 Completions Date Range 7/1/16 6/30/17 7/1/17 6/30/18 7/1/18 6/30/19 7/1/2019 6/30/20 Completers Awards Completers Awards Completers Awards Completers Awards Black/African American 270 320 371 371 378 378 373 376 Nonresident Alien 7 9 15 15 3 3 2 2 Race and ethnicity unknown 5 5 5 5 4 4 5 5 Hispanic/Latino 2 3 6 6 2 2 5 5 Two or more races 1 2 0 0 3 3 2 2 White 1 1 0 0 1 1 1 1 American Indian/ Alaska Native 0 0 1 1 1 1 1 1 Asian 0 0 0 0 0 0 0 0 Native Hawaiian/ Other Pacific Islander 0 0 0 0 0 0 0 0 IPEDS TOTAL 286 340 398 398 392 392 389 392 Source: Integrated Postsecondary Education Data System (IPEDS), Completions Survey, Fall Collection; Data as of October 15 for conferrals between July 01, 2019 - June 30, 2020 Note: IPEDS survey components collect a “snapshot” of an institution’s conferrals between July 01- June 30. The fiscal year 2019-20 is the most recent graduation data reported to IPEDS. Completers represent the unduplicated headcount of men receiving a degree. Awards represent a duplicated headcount and include 1st and 2nd majors, or all credentials awarded. Revisions made to the IPEDS Prior Year Revision System are not reflected in reported data available in the IPEDS Data Center. GRADUATES BY DEGREE TABLE 43 Fiscal Year Completed 2017–18 2018–19 2019–20 2020–21 Completions Date Range 7/1/17 6/30/18 7/1/18 6/30/19 7/1/19 6/30/20 7/1/2020 6/30/21 Completers Awards Completers Awards Completers Awards Completers Awards Bachelor of Arts 306 309 301 301 318 321 321 326 Bachelor of Science 101 105 91 97 69 69 100 101 Bachelor of General Science 2 2 3 3 2 2 5 5 TOTAL 409 416 395 401 389 392 426 432 Source: 2020-21 Graduation Census; Banner data as of August 30, 2021 Note: For the purposes of the Fact Book, data reflected in this table were retrieved on August 30, 2021, representing the total number of graduates for the fiscal year. Final IPEDS completers and awards may differ from Banner records, as of the indicated retrieval date. Completers represent the unduplicated headcount of men receiving a degree, and awards represent a duplicated headcount including 1st and 2nd majors or all credentials awarded. 70 INSTITUTIONAL DATA REFERENCE FOR THE MOREHOUSE COMMUNITY Retention, Progression, and Graduation INSTITUTIONAL GRADUATION PROFILE
GRADUATE AWARDS BY MAJOR
TABLE
Fiscal Year Completed 2017–18 2018–19 2019–20 2020–21
Completions Date Range 7/1/17 – 6/30/18 7/1/18 – 6/30/19 7/1/19 – 6/30/20 7/1/2020 – 6/30/21
Africana Studies 0 0 0 1 African-American Studies 0 1 1 0 Applied Physics (DDEP) 6 16 3 5 Art 1 4 0 2 Biology 39 34 30 45 Business Administration 113 86 107 108 Chemistry 6 3 8 8
Chinese Studies 2 1 5 5 Cinema, Television, and Emerging Media Studies 15 13 8 9
Communication Studies 0 0 6 15 Computer Science 24 22 14 21 Dance 0 0 0 0 Drama 8 6 11 10
Early Childhood Education 0 2 0 4 Economics 26 21 22 24
Education Studies (Non-Cert) 1 0 0 1
English 20 27 25 21 French 0 0 0 1 General Science (DDEP) 2 5 2 5 History 5 7 3 4
International Studies 4 3 8 4 Journalism in Sports, Social Justice, and Culture 0 0 0 0
Kinesiology, Sport Studies, and Physical Education 26 21 19 30 Mathematics 19 11 6 4 Music 7 6 9 3 Philosophy 8 5 8 9 Physics 11 13 6 10
Political Science 26 28 21 32 Psychology 25 23 27 27 Religion 1 11 2 1 Sociology 19 27 35 17
Software Engineering 0 0 0 3 Spanish 2 3 3 1
Urban Studies 0 2 3 2
TOTAL 416 401 392 432
Source: 2020-21 Graduation Census; Banner data as of August 30, 2021 Note: For the purposes of the Fact Book, data reflected in this table were retrieved on August 30, 2021, representing the total number of graduates for the fiscal year. Final IPEDS completers and awards may differ from Banner records, as of the indicated retrieval date. Completers represent the unduplicated headcount of men receiving a degree, and awards represent a duplicated headcount including 1st and 2nd majors or all credentials awarded. Students earn two bachelor’s degrees through the Dual Degree Engineering Program (DDEP) – one degree from Morehouse and one from one of fourteen participating engi neering schools. Africana Studies, Journalism in Sports, Social, Justice, and
Engineering are newer programs and may not have graduates during the period highlighted in the above chart.
44
Culture and Software
71 MOREHOUSE COLLEGE FACT BOOK 2017–2022 Retention, Progression, and Graduation INSTITUTIONAL GRADUATION PROFILE
STEM

GRADUATE AWARDS BY MAJOR TABLE 45 Fiscal Year Completed 2017–18 2018–19 2019–20 2020–21 Completions Date Range 7/1/17 – 6/30/18 7/1/18 – 6/30/19 7/1/19 – 6/30/20 7/1/2020 – 6/30/21 Applied Physics (DDEP) 6 16 3 5 Biology 39 34 30 45 Chemistry 6 3 8 8 Computer Science 24 22 14 21 General Science (DDEP) 2 5 2 5 Mathematics 19 11 6 4 Physics 11 13 6 10 Psychology 25 23 27 27 Software Engineering 0 0 0 3 TOTAL 132 127 96 128 Source: 2020-21 Graduation Census; Banner data as of August 30, 2021 Note: For the purposes of the Fact Book, data reflected in this table were retrieved on August 30, 2021, representing the total number of graduates for the fiscal year. Final IPEDS completers and awards may differ from Banner records, as of the indicated retrieval date. Completers represent the unduplicated headcount of men receiving a degree, and awards represent a duplicated headcount including 1st and 2nd majors or all credentials awarded. Students earn two bachelor’s degrees through the Dual Degree Engineering Program (DDEP) – one degree from Morehouse and one from one of fourteen participating engineering schools. Software Engineering is a newer program and may not have graduates during the period highlighted in the above chart. 72 INSTITUTIONAL DATA REFERENCE FOR THE MOREHOUSE COMMUNITY Retention, Progression, and Graduation INSTITUTIONAL GRADUATION PROFILE
CINEMA,
APPLIED
2020-21 GRADUATE AWARDS BY MAJOR (TOP 5 MAJORS)
Source: 2020-21 Graduation Census; Banner data as of August 30, 2021
Note: For the purposes of the Fact Book, data reflected in this table were retrieved on August 30, 2021, representing the total number of graduates for the fiscal year. Final IPEDS completers and awards may differ from Banner records, as of the indicated retrieval date. Completers represent the unduplicated headcount of men receiving a degree, and awards represent a duplicated headcount including 1st and 2nd majors or all credentials awarded. Students earn two bachelor’s degrees through the Dual Degree Engineering Program (DDEP) – one degree from Morehouse and one from one of fourteen participating engineering schools. Africana Studies, Journalism in Sports, Social, Justice, and Culture and Software Engineering are newer programs and may not have graduates during the period highlighted in the above chart.
FIGURE 12
02 04 06 08 0 100 120 BIOLOGY P OLITICAL SCIENCE KINESIOLOGY, SPORTS S TUDIES, AND PHYSICAL EDUCATION PSYCHOLOGY ECONOMIC S ENGLISH COMPUTER SCIENCE SOCIOLOGY COMMUNICATIONS STUDIES PHYSIC S DRAMA PHILOSOPHY
TELEVISION, AND EMERGING MEDIA STUDIES CHEMISTRY GENERAL STUDIES (DDEP ) CHINESE STUDIES
PHYSICS (DDEP) MATHEMATIC S INTERNATIONAL STUDIES HISTORY EARLY CHILDHOOD EDUCATION SOFTWARE ENGINEERING MUSIC URBAN STUDIES ART FRENCH RELIGION SPANISH EDUCATION STUDIES (NON-CERT ) AFRICANA STUDIES JOURNALISM IN SPORTS, SOCIAL JUSTICE, AND CULTURE D ANCE AFRICAN-AMERICAN STUDIES BUSINESS ADMINSTRATION108 45 32 30 27 24 21 21 17 15 10 10 9 9 8 5 5 5 4 4 4 4 3 3 2 2 1 1 1 1 1 0 0 0 73 MOREHOUSE COLLEGE FACT BOOK 2017–2022 Retention, Progression, and Graduation INSTITUTIONAL GRADUATION PROFILE

2021 GRADUATES | 337 RESPONDENTS 01 02 03 04 05 06 07 08 0 BACHELOR’S DEGREE DOCTORATE DEGREE LESS THAN HIGH SCHOOL COMPLETED MASTER’S DEGREE PROFESSIONAL DEGREE SOME COLLEGE, 2YR DEGREE, VOCATIONAL, OR TRADE SCHOOL NOT APPPLICABLE HIGH SCHOOL DIPLOMA OR EQUIVALENT MOTHER OR FEMALE GUARDIAN FATHER OR MALE GUARDIAN 79 69 26 18 57 77 12 23 79 41 17 17 66 79 1 13 HIGHEST LEVEL OF EDUCATION COMPLETED BY PARENTS OR GUARDIANS FIGURE 13 2020 GRADUATES | 352 RESPONDENTS 02 04 06 08 01 00 BACHELOR’S DEGREE DOCTORATE DEGREE LESS THAN HIGH SCHOOL COMPLETED MASTER’S DEGREE PROFESSIONAL DEGREE SOME COLLEGE, 2YR DEGREE, VOCATIONAL, OR TRADE SCHOOL NOT APPPLICABLE HIGH SCHOOL DIPLOMA OR EQUIVALENT MOTHER OR FEMALE GUARDIAN FATHER OR MALE GUARDIAN Source: Senior Exit Survey, retrieved on June 15, 2021 Note: The 2020 Senior Exit Survey had 377 respondents, and the 2021 survey had 389 respondents. The data above reflects the total respondents that answered the question. 87 74 23 13 46 78 8 17 81 57 26 28 80 64 1 21 Source: Senior Exit Survey, retrieved on June 15, 2021 Note: The 2020 Senior Exit Survey had 377 respondents, and the 2021 survey had 389 respondents. The data above reflects the total respondents that answered the question. MOTHER OR FEMALE GUARDIAN FATHER OR MALE GUARDIAN 74 INSTITUTIONAL DATA REFERENCE FOR THE MOREHOUSE COMMUNITY Retention, Progression, and Graduation GRADUATE EXIT SURVEY

75 MOREHOUSE COLLEGE FACT BOOK 2017–2022
2021 GRADUATES 134 RESPONDENTS 2020 GRADUATES 86 RESPONDENTS 15.3% BROTHER 25.7% COUSIN 24.3% UNCLE 4.2% GRANDFATHE R 19.4% FATHER 14.5% BROTHER 36.6% COUSIN 22.1% UNCLE 7.6% O THER REL ATIVE11.1% O THER REL ATIVE 6.2% GRANDFATHE R 13.1% FATHER 2021 GRADUATES 311 RESPONDENTS 2020 GRADUATES 341 RESPONDENTS 30% NO 33% NO 70% YES 67% YES Source: Senior Exit Survey, retrieved on June 15, 2021 Note: The 2020 Senior Exit Survey had 377 respondents, and the 2021 survey had 389 respondents. The data above reflects the total respondents that answered the question.. Source: Senior Exit Survey, retrieved on June 15, 2021 Note: The 2020 Senior Exit Survey had 377 respondents, and the 2021 survey had 389 respondents. The data above reflects the total respondents that answered the question. RELATIVE ATTENDED MOREHOUSE FIGURE 14 PARTICIPATED IN INTERNSHIPS WHILE ENROLLED AT MOREHOUSE FIGURE 15 76 INSTITUTIONAL DATA REFERENCE FOR THE MOREHOUSE COMMUNITY Retention, Progression, and Graduation GRADUATE EXIT SURVEY

EMPL O YED FT GRADUA TE OR PROFESSIONAL SCHOOL ENTREPRENEUR FT ENTREPRENEUR PT MILIT AR Y SERVICE EMPL O YED PT FREELANCE PT POS T GRADUA TE INTERNSHIP PT TEMPORAR Y/CONTRACT WORK FT VOLUNTEER SERVICE OTHER POS T GRADUA TE INTERNSHIP PT 02 04 06 08 01 00 94 17 13 8 8 7 4 3 3 2 2 2 2021 GRADUATES | 263 RESPONDENTS POST GRADUATION ACTIVITY FIGURE 16 EMPLOYED FT GRADUATE OR PROFESSIONAL SCHOOL ENTRPRENEUR PT MILITARY SERVICE EMPLOYED PT FREELANCE PT FREELANCE FT POST GRADUATE INTERNSHIP PT TEMPORARY/CONTRACT WORK FT VOLUNTEER SERVICE ENTREPRENEUR OTHER POST GRADUATE INTERNSHIP 03 06 09 01 20 15 0 135 98 18 16 8 8 8 7 7 7 3 3 2 2020 GRADUATES | 320 RESPONDENTS Source: Senior Exit Survey, retrieved on June 15, 2021 Note: The 2020 Senior Exit Survey had 377 respondents, and the 2021 survey had 389 respondents. The data above reflects the total respondents that answered the question. 77 MOREHOUSE COLLEGE FACT BOOK 2017–2022 Retention, Progression, and Graduation GRADUATE EXIT SURVEY
Retention, Progression, and Graduation


Source: Senior Exit Survey, retrieved on June 15, 2021


Note: The 2021 Senior Exit Survey had 389 respondents. The data above reflects the total respondents that answered the question.

COMPANIES THAT HIRED 2021 GRADUATES FIGURE 17
78 INSTITUTIONAL DATA REFERENCE FOR THE MOREHOUSE COMMUNITY
GRADUATE EXIT SURVEY
rated their academic experience as good, very good, or excellent
satisfied with the overall quality of instruction
satisfied with the overall quality of their undergraduate education
rated their social experience as good, very good, or excellent
rated the selection of student organizations and activities as good, very good, or excellent
would recommend Morehouse College to a friend or relative
satisfied with the overall size of general education and major courses
satisfied with the size of major classes
satisfied with their major
satisfied with the frequency of course offerings in their major
satisfied with the quality of instruction in their major
feel prepared for graduate studies
feel prepared to enter the workforce feel prepared for their chosen career field
reported their interest and knowledge of issues focusing on men of the African diaspora
reported involvement in volunteer services while enrolled at Morehouse
Source: Senior Exit Survey, retrieved on June 15, 2021
reported involvement in Academic clubs, honor societies, or professional associations while enrolled at Morehouse
Note: The 2021 Senior Exit Survey had 389 respondents. The data above reflects the total respondents that answered the question.
Morehouse College helped to develop their racial identity and sense of self
2021 GRADUATES OVERALL SATISFACTION FIGURE 18 88% 91% 87% 79% 84% 68% 85% 84% 91% 81% 81% 69% 82% 85% 89% 80% 79% 86%
79 MOREHOUSE COLLEGE FACT BOOK 2017–2022 Retention, Progression, and Graduation GRADUATE EXIT SURVEY

FINANCIAL AID 80 INSTITUTIONAL DATA REFERENCE FOR THE MOREHOUSE COMMUNITY

GRANT AID AWARDED TABLE 46 2018–19 2019–20 2020–21 Total Grant Aid Awarded to All Undergraduate Students $34,757,875 $33,423,241 $30,822,104 Number of Undergraduate Students Who Were Awarded a Pell Grant 1,064 1,069 997 Percentage of FTFT Awarded Financial Aid Awarded Any Financial Aid 95% 94% 100% Source: Integrated Postsecondary Education Data System (IPEDS), Student Financial Aid Survey, Winter Collection; Banner data as of10-15-2020 2020-21 FIRST-TIME, FULL-TIME GRANT AID AWARDED TABLE 47 % Awarded Average Awarded Federal Government 56% $6,142 Pell 56% $5,204 Other Federal 13% $3,958 State/Local Government 43% $2,214 Institutional 53% $15,507 TOTAL 84% $14,936 Source: Integrated Postsecondary Education Data System (IPEDS), Student Financial Aid Survey, Winter Collection; Banner data as of10-15-2020 Note: Total reflects first-time, full-time grant aid awards. FINANCIAL AID 81 MOREHOUSE COLLEGE FACT BOOK 2017–2022
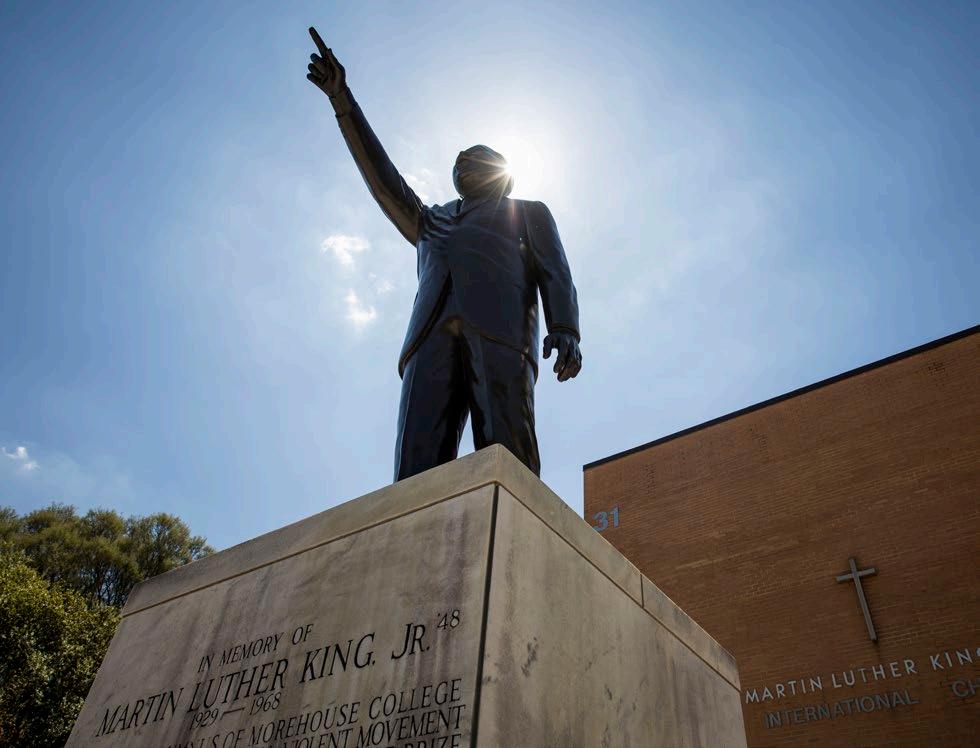
2020-21 FIRST-TIME, FULL-TIME LOAN AID AWARDED TABLE 48 % Awarded Average Awarded Federal 52% $6,148 Non-Federal 5% $19,383 TOTAL 57% $7,281 Source: Integrated Postsecondary Education Data System (IPEDS), Student Financial Aid Survey, Winter Collection; Banner data as of 10-15-2020 FIRST-TIME, FULL-TIME STUDENTS AWARDED GRANT AID TABLE 49 2018–19 2019–20 2020–21 Average Net Price $28,307 $30,839 $20,492 Source: Integrated Postsecondary Education Data System (IPEDS), Student Financial Aid Survey, Winter Collection; Banner data as of 10-15-2020 82 INSTITUTIONAL DATA REFERENCE FOR THE MOREHOUSE COMMUNITY Financial Aid INSTITUTIONAL FINANCIAL AID PROFILE

83 MOREHOUSE COLLEGE FACT BOOK 2017–2022

FINANCES 84 INSTITUTIONAL DATA REFERENCE FOR THE MOREHOUSE COMMUNITY

ANNUAL BUDGET TABLE 50 FY2019 FY2020 FY2021 UNRESTRICTED REVENUE Net Tuition Revenue $33,365,478 $36,764,516 $28,376,858 Private Gifts and Grants $3,750,000 $2,000,000 $2,000,000 Indirect Costs $650,000 $750,000 $800,000 Auxiliary Services $21,224,203 $22,302,793 $10,674,750 Other Income $2,000,000 $1,315,798 $2,100,000 Investment Income $7,500 $205,000 $210,000 TOTAL $60,997,181 $ 63,338,107 $44,161,608 UNRESTRICTED EXPENSES Salaries and Wages $28,372,956 $28,916,200 $21,408,000 Personnel Benefits $8,580,030 $8,963,049 $6,422,400 General and Administrative $31,333,724 $29,100,000 $16,131,209 TOTAL $68,286,710 $66,979,249 $43,961,609 SURPLUS/(DEFICIT) $ (7,289,529) $ (3,641,142) $199,999 Source: Morehouse College Institutional Data Set, Business and Finance Annual Expense Survey; Data as of 10-15-2021 FINANCES 85 MOREHOUSE COLLEGE FACT BOOK 2017–2022

UNRESTRICTED EXPENSES + REVENUE FIGURE 19 F Y2019 F Y2020 F Y2021 0 $10,000,000 $20,000,000 $30,000,000 $40,000,000 $50,000,000 $60,000,000 $70,000,000 $80,000,000 $68,286,710 $66,979,249 $43,961,609 $44,161,608 $60,997,181 $63,338,107 TOTAL UNRESTRICTED REVENUETOTAL UNRESTRICTED EXPENSES 86 INSTITUTIONAL DATA REFERENCE FOR THE MOREHOUSE COMMUNITY Finances INSTITUTIONAL FINANCIAL PROFILE
TRICTED
TRICTED
FY 2021 UNRESTRICTED REVENUE DISTRIBUTION FIGURE 20 FY 2021 UNRESTRICTED EXPENSES DISTRIBUTION FIGURE 21 0.5% INVESTMENT INCOME $210,000 4.8% OTHER INCOME $2,100,000 64.3% NET TUITION REVENUE $28,376,858 4.5% PRIVATE GIFTS AND GRANTS $2,000,000 1.8% INDIRECT COSTS $800,000 24.2% AUXILL ARY SERVICES $10,674,750 UNRES
REVENUE 48.7% SAL ARIES AND WAGES $21,408,000 14.6% PERSONNEL BENEFITS $6,422,400 36.7% GENERAL AND ADMINISTRATIVE $16,131,209 UNRES
EXPENSES 87 MOREHOUSE COLLEGE FACT BOOK 2017–2022 Finances INSTITUTIONAL FINANCIAL PROFILE

ADVANCEMENT 88 INSTITUTIONAL DATA REFERENCE FOR THE MOREHOUSE COMMUNITY

STRATEGIC PARTNERSHIP LEVELS + DISCERNMENT TABLE 51 Fiscal Year Raised Unrestricted Restricted Endowment Capital 2019 $19,952,043 $2,371,662 $8,999,974 $8,004,307 $576,100 2020 $107,163,868 $3,039,064 $84,621,599 $15,187,953 $2,315,252 2021 $62,632,746 $22,790,702 $25,394,069 $10,663,651 $3,804,324 Source: The Office of Institutional Advancement, Giving Impact Report; Data as of fall 2021 3,450 Alumni 1,353 Friends + Parents 236 Corporations + Foundations 68 Current Students 74 Faculty + Staff FY 2021 BENEFACTOR BREAKDOWN FY2020/FY2021 FIRST-TIME DONORS 1,431 # OF FIRST-TIME DONORS FY 2020 1,480 # OF FIRST-TIME DONORS FY 2021 ADVANCEMENT Photo Caption: Robert F. Smith, the founder, chairman, and CEO of Vista Equity Partners, featured in the photo above, pledged to wipe out $34 million in student loan debt owed by Morehouse College’s graduating Class of 2019. 89 MOREHOUSE COLLEGE FACT BOOK 2017–2022
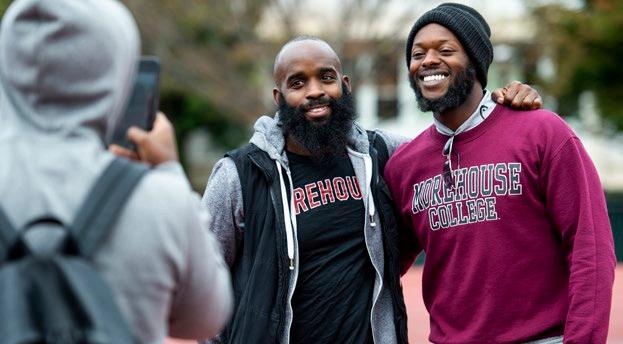
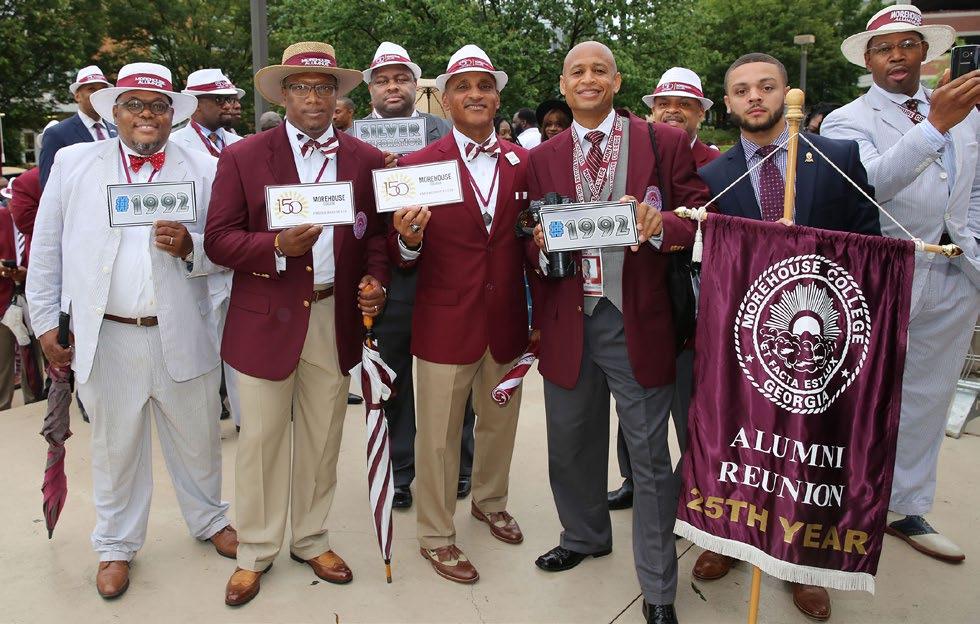
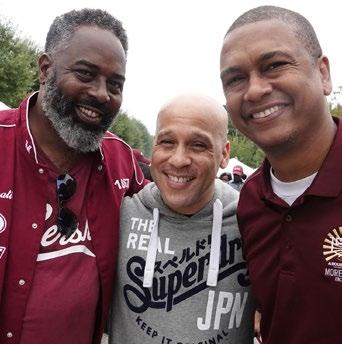
ALUMNI GIVING TABLE 52 Year Total Alumni Number Solicited Number Giving Participation Rate (%) Cash/Gifts in-kind 2018–19 20,187 17,747 2,393 13.5 $8,158,881 2019–20 21,562 19,219 3,499 18.2 $3,199,150 2020–21 21,531 19,066 3,450 18.1 $3,730,141 Source: Morehouse College Institutional Data Set, Advancement Alumni Giving Survey; Data as of fall 2021 90 INSTITUTIONAL DATA REFERENCE FOR THE MOREHOUSE COMMUNITY Advancement INSTITUTIONAL ALUMNI PROFILE

91 MOREHOUSE COLLEGE FACT BOOK 2017–2022
Oregon
Pennsylvania
Rhode
South
South
Tennessee
Texas
Utah
Vermont
Virginia
Washington
West
Source: Morehouse Institutional Data Set, Advancement Alumni Giving Survey; Data as of fall 2021 Note: No column total is provided because the total number of alumni reporting an address may not accurately reflect the total number of alumni. AK 5 OR 8 ME 1 UT 0 CO 19 AZ 24 OK 4 KS 8 RI 2 MA 63 NH 1 VT 0 CT 30 DE 24 IN 21 45 MS 12 NC 154 SC 58 KY 7 AL 80 IA 5 AR 6 NJ 120 MD 289 WASHINGTON D.C. 24 TN 88 WA 24 CA 298 NV 8 MT 0 WY 0 ND 0 SD 0 WV 5 NM 3 TX 242 NE 5 MN 19 MI 75 NY 232WI 9 IL 188 OH 82 FL 149 PA 80 VA 128 GA 1,275 MO 39 ID 0 HI 3 ALUMNI BY STATE TABLE 53 Alabama 80 Alaska 5 Arizona 15 Arkansas 6 California 298 Colorado 19 Connecticut 30 Delaware 14 Florida 149 Georgia 1,275 Hawaii 3 Idaho 0 Illinois 188 Indiana 21 Iowa 5 Kansas 8 Kentucky 7 Louisiana 45 Maine 1 Maryland 289 Massachusetts 63 Michigan 75 Minnesota 19 Mississippi 12 Missouri 39 Montana 0 Nebraska 5 Nevada 8 New Hampshire 1 New Jersey 120 New Mexico 3 New York 232 North Carolina 154 North Dakota 0 Ohio 82 Oklahoma 4
8
80
Island 2
Carolina 58
Dakota 0
88
242
0
0
128
24
Virginia 5 Wisconsin 9 Wyoming 0 Source: Morehouse Institutional Data Set, Advancement Alumni Giving Survey; Data as of fall 2021 Note: No column total is provided because the total number of alumni reporting an address may not accu rately reflect the total number of alumni. 92 INSTITUTIONAL DATA REFERENCE FOR THE MOREHOUSE COMMUNITY Advancement INSTITUTIONAL ALUMNI PROFILE
LOUISIANA
CONNEC
INDIANA MINNESO
WISCONSIN
KANSA
KENTUCK
ARKANSA

ALUMNI BY TOP 10 STATES FIGURE 22 0 300 600 900 1200 1500 1,275 298 289 242 232 188 154 149 128 120 88 82 80 80 75 63 58 45 39 30 24 21 19 19 15 14 12 9 8 8 8 7 6 5 5 5 5 4 3 3 2 1 1 0 CALIFORNIA MARYLAND TEXA S NEW YORK ILLINOIS NORTH CAROLINA FLORID A VIRGINIA NEW JERSEY TENNESSEE OHIO PENNSYLVANIA ALABAMA MICHIGAN MASSACHUSETTS SOUTH CAROLINA
MISSOURI
TICUT WASHINGTON
TA COLORADO ARIZONA DELAWARE MISSISSIPPI
OREGON NEVAD A
S
Y
S WEST VIRGINIA NEBRASKA IOWA ALASKA OKLAHOMA NEW MEXICO HAWAII RHODE ISLAND NEW HAMPSHIRE MAINE IDAHO, MONTANA, NORTH DA KOTA, SOUTH DA KOTA, UTAH, VERMONT, AND WYOMING
GEORGIA
93 MOREHOUSE COLLEGE FACT BOOK 2017–2022 Advancement INSTITUTIONAL ALUMNI PROFILE

CAMPUS LIFE 94 INSTITUTIONAL DATA REFERENCE FOR THE MOREHOUSE COMMUNITY
CAMPUS LIFE
There are over 50 organizations at Morehouse that help students develop as leaders while nurturing passions in academic, athletic, cultural, and artistic pursuits.
AUC COLLABORATIONS
AUC Esports Club
Code House
Delta Phi Delta Dance Fraternity Inc.
MakeWay
National Society of Black Engineers
Sunrise Atlanta University Center
The Collegiate 100 of Morehouse College
What (S)HE Said
YDSA Atlanta University Center
CULTURAL, ACADEMIC, PROFESSIONAL
AUC Vybz
Morehouse College Biology Club
Morehouse College Business Association
Morehouse College Chapter of the National Society of Black Physicists
Morehouse College Glee Club

Morehouse College Filmmakers Association
Morehouse College Institute of Mathematics
National Society of Collegiate Scholars
Sophomore Class Council
SERVICE + SOCIAL JUSTICE
Achieve M.O.O.R.E.
C.H.I.L.L (Counseling Humans in Life Lessons)
Lifting Our Voices
LYTEHouse
MH-SP Rotaract Club
Morehouse College Collegiate Chapter of the National Action Network (NAN)
Morehouse College Moregreen
National Residence Hall Honorary
The Next Great American Poet, Inc.
Utopia Atlanta
SPECIAL INTEREST
Black Arts Done Underground (BADU)
HBCU’s Let’s Talk
Morehouse College Adodi
Morehouse College Chapter of the National Society of Leadership and Success - Sigma Alpha Pi
Morehouse College “House of Funk” Marching Band and Wind Ensemble
Morehouse College Lacrosse Club
Morehouse College Polo Club
Morehouse College Rugby Club
Morehouse College Soccer Club
Morehouse College Tiger Sharks
Morehouse College Wrestling Club
The AUC Agency
The AUC Philly Club
Turnt Tigers
FRATERNITIES
Alpha Phi Alpha Fraternity, Inc.
Alpha Rho Chapter
Groove Phi Groove Social Fellowship Organization
Iota Phi Theta Fraternity, Incorporated - Alpha Pi Chapter
Kappa Alpha Psi Fraternity, Inc. Pi Chapter
Omega Psi Phi Fraternity, Inc. Psi Chapter
Pershing Rifles Military Fraternity Chapter B-16
Phi Beta Sigma Fraternity, Inc. Chi Chapter
Phi Delta Epsilon Medical Fraternity
Phi Mu Alpha Sinfonia Fraternity
Xi Eta Chapter
POPULAR CAMPUS EVENTS
Homecoming
Spring Fest
Alcohol, Drug and Risky Behavior Awareness Week
Disability Awareness Week
Depression Awareness Week
Diversity Awareness Week
95 MOREHOUSE COLLEGE FACT BOOK 2017–2022

ATHLETICS 96 INSTITUTIONAL DATA REFERENCE FOR THE MOREHOUSE COMMUNITY
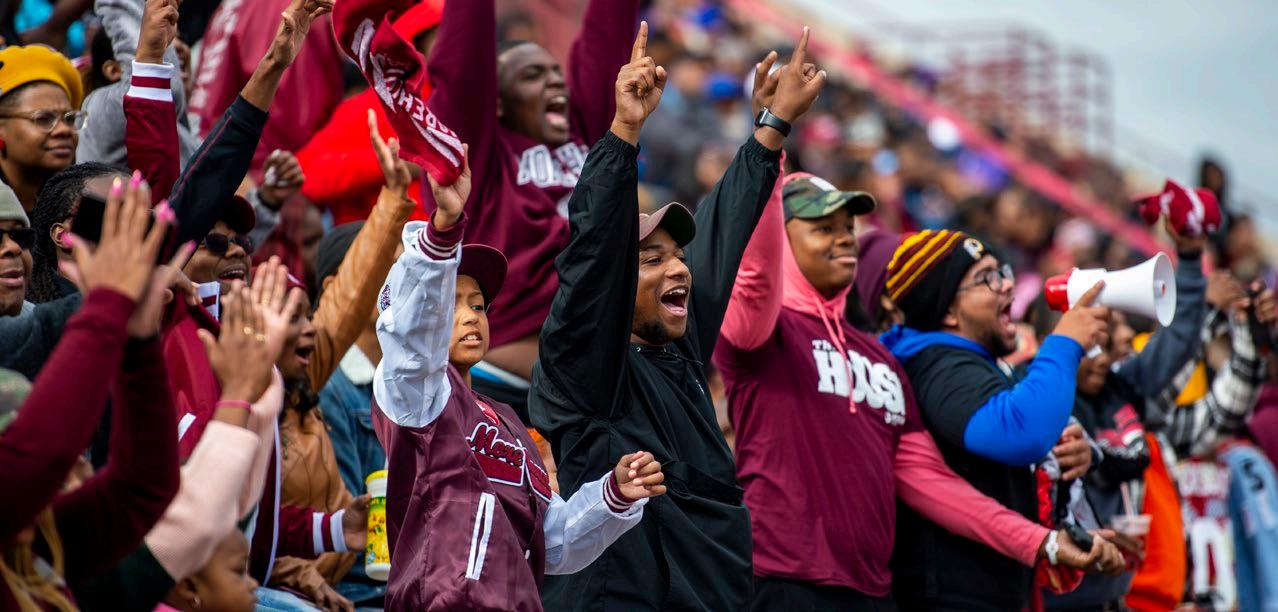


 INTERCOLLEGIATE SPORTS
BASEBALL
FOOTBALL
BASKETBALL GOLF TRACK AND FIELD VOLLEYBALL
CROSS COUNTRY TENNIS
ATHLETICS 97 MOREHOUSE COLLEGE FACT BOOK 2017–2022
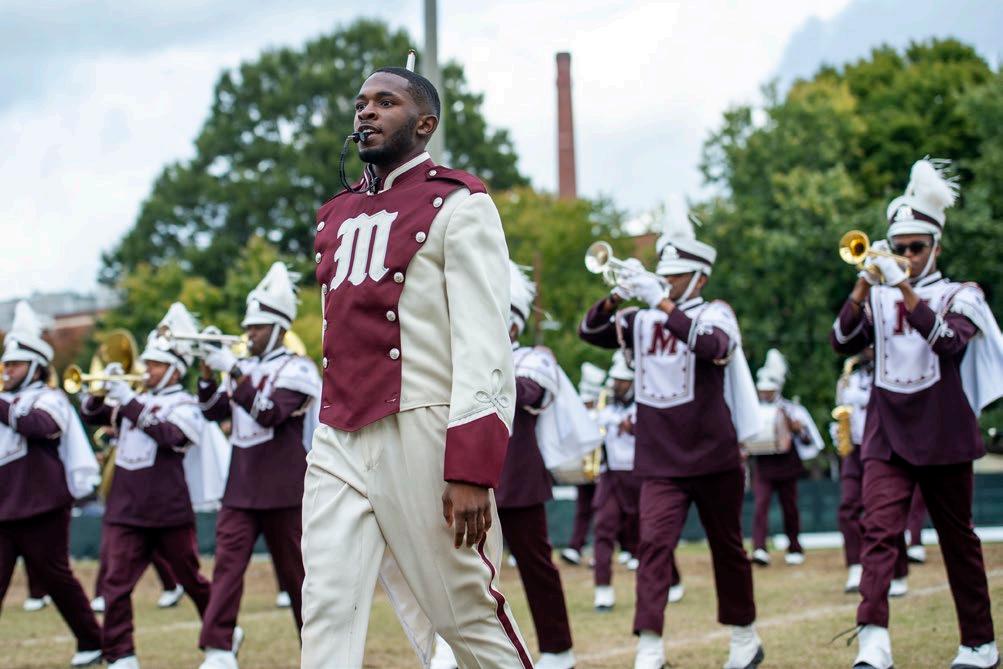

INTERCOLLEGIATE SPORTS PARTICIPATION TABLE 54 2017–18 2018–19 2019–20 2020–21 2021–22 Baseball 31 27 32 42 Basketball 22 21 22 23 Football 93 89 92 109 Golf 10 11 13 10 Cross Country 32 32 42 21 Tennis 10 10 9 7 Track and Field 40 41 58 49 Volleyball 18 TOTAL % Fall Enrollment Source: Morehouse College Institutional Data Set, Athletics Department Sports Participation Survey; Data as of fall 2021 Note: Due to Covid 19, no sports operated during the 2020-21 academic year. 2021-22 was Volleyball’s inaugural year. 98 INSTITUTIONAL DATA REFERENCE FOR THE MOREHOUSE COMMUNITY Athletics INSTITUTIONAL SPORTS PROFILE


B.T. HARVEY STADIUM Holds 9,000 Fans First Game Played on September 24, 1983 Against Fisk University EDWIN C. MOSES TRACK The Edwin C. Moses Track Is Named After Maroon Tiger and Olympic Legend Edwin C. Moses ‘78, Who Become an American Track & Field Great! FORBES ARENA Holds 6,000 Fans First Game Played on November 16, 1996 against Savannah State Universtiy SPORTS COMPLEX 99 MOREHOUSE COLLEGE FACT BOOK 2017–2022 Athletics INSTITUTIONAL SPORTS PROFILE

RESIDENTIAL LIFE 100 INSTITUTIONAL DATA REFERENCE FOR THE MOREHOUSE COMMUNITY
RESIDENTIAL LIFE
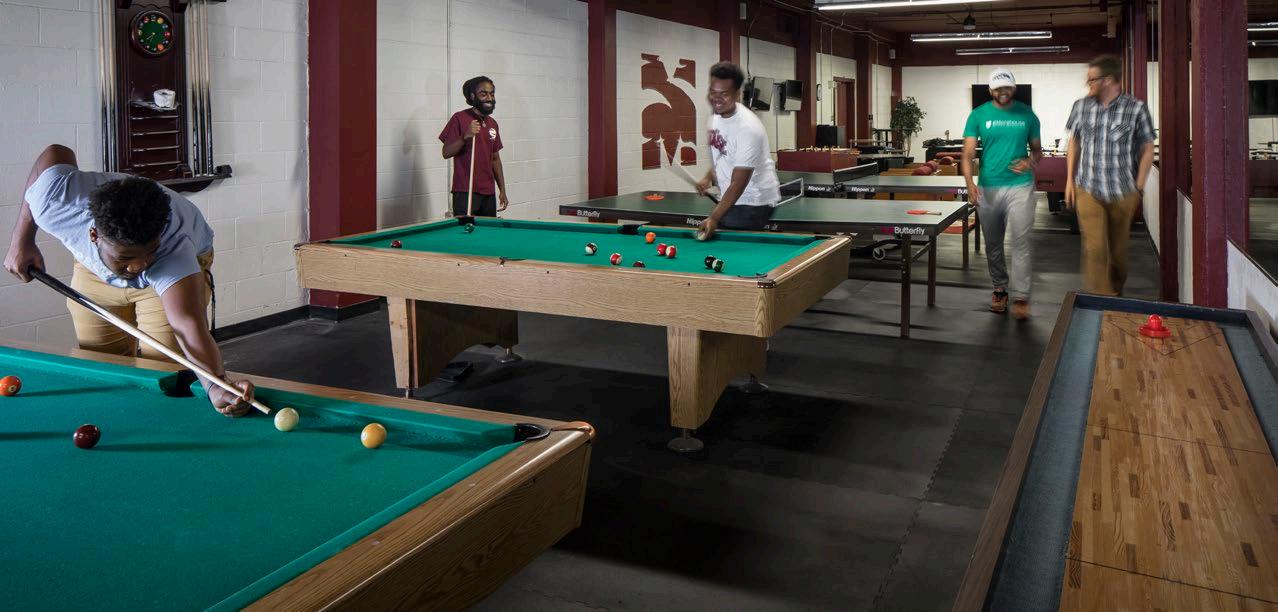
BRAILSFORD R. BRAZEAL HOUSE Designation: Freshman Constructed: 1989 Occupancy: 158
SAMUEL T. GRAVES HOUSE Designation: Freshman Constructed: 1889 Occupancy: 117
CHARLES HUBERT HOUSE Designation: Upperclassmen Constructed: 1970 Occupancy: 112
LIVING LEARNING CENTER Designation: Upperclassmen Opened: 1970 Occupancy: 138


BENJAMIN E. MAYS HOUSE Designation: Upperclassmen Opened: 1962 Occupancy: 116
OTIS MOSS RESIDENTIAL SUITES Designation: Upperclassmen Constructed: 2003 Occupancy: 372




WILEY A. PERDUE HOUSE Designation: Upperclassmen Constructed:1996 Occupancy: 238
JOSEPH T. ROBERT HOUSE Designation: Upperclassmen Constructed:1916 Occupancy: 40
THOMAS KILGORE JR HOUSE Designation: Upperclassmen Occupancy: 72

W.E.B. DUBOIS INTERNATIONAL HOUSE Designation: International Freshman Constructed: 1974 Occupancy: 144
WILLIAM JEFFERSON WHITE HOUSE Designation: ROTC Students Opened: 1982 Occupancy: 84
 RESIDENCE HALLS
101 MOREHOUSE COLLEGE FACT BOOK 2017–2022
Brailsford
Learning Center

House
OCCUPANCY


BY RESIDENTIAL ASSIGNMENT TABLE 55 2018–2019 2019–2020 2020–2021 2021–2022
R. Brazeal House 158 158 158 158 Charles Hubert House 112 112 112 112 Joseph T. Robert House 40 40 40 40 Living
138 138 138 130 Mays
116 116 116 90 Otis Moss Residential Suites 372 372 372 368 Samuel T. Graves House 117 117 117 117 Thomas Kilgore Jr House 72 72 72 72 W.E.B. Dubois International House 144 144 144 138 Wiley A. Perdue House 238 238 238 238 William Jefferson White House 84 84 84 84 TOTAL OCCUPANCY 1,591 1,591 1,591 1,547 TOTAL AVAILABLE BEDS 1,591 1,591 1,591 1,591 % OCCUPIED 100.0% 100.0% 100.0% 97.2% Source: Morehouse College Institutional Data Set, Residential Life; Data as of fall 2021 102 INSTITUTIONAL DATA REFERENCE FOR THE MOREHOUSE COMMUNITY Residential Life INSTITUTIONAL RESIDENTIAL PROFILE

103 MOREHOUSE COLLEGE FACT BOOK 2017–2022
MEMORIALS/MAIN CAMPUS AREAS


The Martin Luther King Jr. International Chapel serves as the “living room” of historic Morehouse College. The Chapel seeks to develop and promote clergy, laity and youth awakening through reconciliation, non-violence, science, spirituality and the building of global “communities of hope.” The Chapel is the world’s most prominent religious memorial to alumnus Martin Luther King Jr. ’48


The King Statue, located on the King Chapel plaza, is the only statue in the state of Georgia honoring Martin Luther King Jr. ’48. It was dedicated in May 1984 and has become the photo opportunity hotspot for thousands of campus visitors.
International Hall of Honor (31a)


The International Hall of Honor, located in the Martin Luther King Jr. International Chapel, honors persons from the 20th and 21st centuries who have made significant contributions to civil and human rights.

BUILDINGS
1. Samuel T. Graves Hall 2. Joseph T. Robert Hall/Post Office 3. Sale Hall Annex 4. Sale Hall 5a. John Hope Hall 5b. John H. Hopps Jr. Technology Tower 6. Charles Merrill Hall 7. Benjamin E. Mays National Memorial 8. William H. Danforth Chapel 9. Triplex 10. Nabrit-Mapp-McBay Hall 11. Physical Plant 12. Wiley A. Perdue Residence Hall 13. B.R. Brazeal Hall/James B. Ellison College Infirmary 14. Franklin L. Forbes Arena 15. Samuel H. Archer Hall 16a. Kilgore Residence Hall 16b. Thomas Kilgore Jr. Campus Center 17. Campus Police 18a. Chivers/Lane Dining Hall 18b. Benjamin E. Mays Hall 19. LLC Residence Hall 20. Charles D. Hubert Residence Hall 21. W.E.B. DuBois Residence Hall 22. Frederick Douglass Resource/Archives Center 23. William Jefferson White Residence Hall 24. Claude B. Dansby Hall 25. Tennis Courts 26. Benjamin G. Brawley Hall 27. John H. Wheeler Hall 28. Joseph E. Lowery Boulevard Security Booth 29. Physical Plant Maintenance Building 30. B.T. Harvey Stadium/Edwin Moses Track 31a. Martin Luther King Jr. International Chapel 31b. Gloster Hall 32. Howard Thurman National Obelisk 33. Martin Luther King Jr. Statue 34. Walter E. Massey Leadership Center 35. Shirley A. Massey Executive Conference Center 36. Gloster Hall Annex 37a. Parking Deck 37b. Morehouse Bookstore 37c. Jazzman’s/Freshens/Papa John’s 38. Westview Security Gate 39. The Visitors Center 40. The Ray Charles Performing Arts Center 40a. Aretha Robinson Hall 41. Campus Police 42a. Davidson House (Fair 42b. Davidson House (Milton 43. ROTC Building 44. Otis Moss Jr. Residential 45. TRIO Program 46. Century Campus 25 28 29 30 34
Martin Luther King Jr. International Chapel (31a)
Martin Luther King Jr. Statue (33)
Benjamin Elijah Mays National Memorial (7) Dr. Benjamin Elijah Mays was laid to rest on the Morehouse campus in 1984. A memorial in honor of Mays is on the College’s Century Campus, site of Morehouse’s Commencement exercises. Mays, considered the architect of Morehouse’s reputation for academic excellence, served as president of Morehouse from 1940 to 1967.
The Howard Thurman National Obelisk (32) The Howard Thurman National Obelisk honors a man known as a forerunner in the interdenominational religious movement. Thurman, a 1923 graduate of Morehouse, served as a teacher and preacher at Morehouse and Spelman colleges.
Century Campus (46)
The Century Campus is the College’s historic center. The beautiful green space annually serving as the site for Commencement exercises.
The Visitors Center houses the offices of Recruitment and Admissions, Alumni Relations and Communications. Guided tours of the campus begin in this building.
Davidson House serves as the executive center of Morehouse College. Named for alumnus Robert C. Davidson Jr. ’67, the house serves as a venue for meetings, conferences and fund-raising activities, as well as the residence of the president of the College. (Not open for tours.)
Gloster Hall (31b) Honoring former Morehouse President Dr. Hugh M. Gloster ’31 (1967-1987), the building houses the main administrative offices of the College, including the offices of the president and his cabinet. The building is also home to the offices of Admissions, Financial Aid, Records and Registration and Human Resources. Gloster’s memorial is outside the building.
Graves Hall (1) Honoring Samuel T. Graves, the second president of Morehouse College (1885-1890), Graves Hall is the oldest building on campus. It was the site of the entire school when it moved to Atlanta from Augusta.
MOREHOUSE COLLEGE CAMPUS WESTVIEW WELLBORNSTREETWESTENDAVENUE JOSEPHE.LOWERYBOULEVARD 40 40a 104 INSTITUTIONAL DATA REFERENCE FOR THE MOREHOUSE COMMUNITY
MAP WESTVIEWDRIVE
BROWNSTREET
WEBSTERSTREETEUHRLEESTREET MILTONSTREET
LEELANE
ENTRANCE
Relations center Hugh It
Kilgore Campus Center (16b)


Named in honor of civil rights activist and Morehouse alumnus the Rev. Thomas Kilgore Jr. ’35, the center is a multipurpose building that houses the President’s Dining Room, a snack bar, a game room, a student lounge, guest quarters and administrative offices.
Walter E. Massey Leadership Center (34)
This 70,000-square-foot facility houses the Division of Business Administration and Economics, the Andrew Young Center for Global Education, and the Emma and Joe Adams Public Service Institute. The building features state-ofthe-art technology that promotes collaboration among students, faculty, staff and administration.
Shirley A. Massey Executive Conference Center (35)
Named after the College’s former first lady, Shirley A. Massey, the Executive Conference Center houses conference room space, a number of seminar rooms, an atrium area used for receptions, and the Bank of America Auditorium.
The Ray Charles Performing Arts Center (40)


The 76,000-square-foot center for music teaching and performance is a $20-million facility that houses the Department of Music, the Emma and Joe Adams Concert Hall, 12 faculty studios, nine practice rooms, a digital/analog recording studio, and rehearsal space for the Morehouse College Marching Band and the Morehouse College Glee Club.
EATERIES

Chivers/Lane Dining Hall (18a)
The dining hall offers buffet dining. Included are a grill, salad bar, deli, pizza station and more. It is open 7 a.m. to 8 p.m., Monday through Friday, and for brunch and dinner on Saturday and Sunday.

Jazzman’s/Freshens/Papa John’s (37c)
The campus coffee shop provides a unique selection of coffees, smoothies, gourmet baked goods, specialty sandwiches, salads and pizza.
Jazzman’s is open Monday through Friday, 7 a.m. to 8 p.m. and is closed on weekends. Freshens/Papa John’s is open Monday through Thursday, 10:30 a.m to 11 p.m., Friday from 10:30 a.m. to 8 p.m., Saturday from 11 a.m. to 8 p.m., and Sunday from 8 p.m. to 11 p.m.
The Morehouse College Bookstore (37b)


The bookstore sells student textbooks, clothing, periodicals and electronics, as well as drinks and snacks. Tickets to various campus events are also sold at the bookstore. The bookstore is open Monday through Friday, 9 a.m. to 5 p.m., and Saturday from 10 a.m. to 2 p.m. It is closed on Sunday.
SPORTS VENUES

Morehouse College Tennis Courts (25)


The Morehouse College Tennis Courts is a world-class facility that is home to the Morehouse tennis team, the annual Southern Intercollegiate Athletic Conference Mens and Womens Tennis Tournament and informal play by faculty, staff and students.
Archer Hall (15)
Named after the fifth president of Morehouse College, Samuel Howard Archer, Archer Hall holds the College’s recreational facilities, including a gymnasium, swimming pool and game room. The gymnasium seats 1,000 people.
Street Entrance) (Milton Street Entrance) Residential Suites 2 3 4 5a 5b 6 7 9 11 10 16a 16b 18a 18b 24 26 27 17 37a 33 31b 37c 37b 36 34 39 38 31a 21 23 19 2022 12 43 44 42a 42b 14 15 13 41 8 1
Forbes Arena (14) Named in honor of Morehouse coach and administrator Franklin L. Forbes, the arena is a 6,000-seat facility that was built as part of the $51-million investment in the Atlanta University Center by the Atlanta Committee for the Olympic Games. The arena is home for the basketball team, the athletic department offices and the Department of Kinesiology, Sports Studies and Physical Education.
B.T. Harvey Stadium/Edwin Moses Track (30)
Morehouse’s stadium is named in honor of Burwell Towns Harvey, the most successful athletics coach in Morehouse history. He coached Maroon Tiger teams in football, basketball and baseball for 13 years. The track is named in honor of Morehouse alumnus and Olympic track star Edwin Moses ’78
FAIR STREET
32
Located near campus on James B. Brawley Drive, the Robert W. Woodruff Library is designed to serve the instructional, informational and research needs for member institutions of the Atlanta University Center Consortium, the world’s largest and oldest consortium of Historically Black Colleges and Universities. The institutions that make up the Atlanta University Center Consortium are Clark Atlanta University, Morehouse College, Morehouse School of Medicine and Spelman College.
35 45 CENTURY CAMPUS 46 105 MOREHOUSE COLLEGE FACT BOOK 2017–2022

107
2017–2022 Office of Data Analytics, Institutional Research & Effectiveness (DIRE) Institutional Data Reference for the Morehouse Community 830 Westview Avenue SW | Atlanta, GA 30314 data@morehouse.edu MOREHOUSE.EDU


 INTERCOLLEGIATE SPORTS
BASEBALL
FOOTBALL
BASKETBALL GOLF TRACK AND FIELD VOLLEYBALL
CROSS COUNTRY TENNIS


 RESIDENCE HALLS


