
Economic
February 2023
Village of McFarland
Strategic Plan
Acknowledgments
VILLAGE BOARD
Carolyn Clow, Village President
Stephanie Brassington, Trustee
Mike Flaherty, Trustee
Carrie Nelson, Trustee
TJ Jerke, Trustee
Hilary Brandt, Trustee
Ed Wreh, Trustee
PLAN COMMISSION
Village President Carolyn Clow, Chairperson
Trustee Stephanie Brassington
Peter Bloechl-Anderson, Citizen Member
Kathleen Pakes, Citizen Member
Scott Peters, Citizen Member
Christopher Reynolds, Citizen Member
Austen Conrad, Citizen Member
COMMUNITY DEVELOPMENT AUTHORITY
Stephanie Brassington, Chairperson - Village Trustee
TJ Jerke, Village Trustee
Ken Brost, Commissioner
Kristin Ellis, Commissioner
Dan Kolk, Commissioner
Anthony Hennes, Commissioner
Benjamin Tanko, Commissioner
VILLAGE STAFF
Andrew Bremer, AICP, Community & Economic Development Director
Kong Thao, Associate Planner
PREPARED BY:
This document was prepared by Redevelopment Resources with assistance from Village Staff.
2
3 content 6 1. Introduction » Overview » Maps » Population & Household Trends » Employment Trends & Characteristics » Income & Commutes » Interview Takeaways 26 3. Commercial/Retail Space Forecast » Regional Economic Growth Initiatives 4 EXECUTIVE SUMMARY 37 5. Recommendations » Recommendation Table 48 6. Appendices A B Appendix A - Methodology Appendix B - Additional Data 31 4. Re/Development Opportunities » Industrial Land Supply » TID Analysis » Redevelopment 21 2. Local Economy » Existing Business Mix » Consumer Spending » Tapestry Segmentation
eXecUtIVe sUmmARY
The Village of McFarland authorized completion of a market analysis and economic development strategic plan in conjunction with creation of the East Side Plan and Village-wide Housing Needs Assessment. This market analysis examines current market conditions and outlines McFarland’s position in the Madison Metropolitan Statistical Area. The economic development strategic plan sets out a series of recommendations for the economic and business development that will support job creation, property tax base development and wealth creation for residents.
Strategy: Focus on Improving Quality of Life
According to the Brookings Institute, quality of life community amenities such as recreation opportunities, cultural activities, and excellent services (e.g., good schools, transportation options, ensuring there are indoor and outdoor recreational facilities for residents) are likely bigger contributors to healthy local economies than traditional “business-friendly” measures. Leveraging these assets is becoming a more powerful force in practitioners’ toolboxes compared to previous activities engaged in for growth in communities. After estimating quality of life (what makes a place attractive to households) and quality of business environment (what makes a place especially productive and attractive to businesses) in communities across the Midwest, researchers at the Brookings Institute found quality of life matters more for population growth, employment growth, and lower poverty rates than quality of business environment.
The Village of McFarland should focus on improving quality of life for its residents to facilitate residential growth, which will support business growth and a thriving local economy.
Strategy: Expand Commercial and Industrial Land Base
McFarland only has one remaining vacant industrial zoned property and needs additional commercial and industrial land. The Village is in the unique position to be programming new space in the community via the East Side Plan as the property along McFarland’s east side is available and prime for development to meet the community’s needs for the next several years. Additional work to be done in tandem with development includes extending utilities, road construction, and potentially creating Tax Increment Districts.
Lack of available sites for development isn’t strictly a localized problem. The greater Madison metro area is short on available industrial properties so it is

recommended that the Village facilitate development of infrastructure which will serve future industrial development /business park sites. Sites of six to ten acres each, with interstate visibility will be highly sought after and meet the needs of industrial expansions/site searches which are being conducted in the area. Expanding the land available for commercial and industrial development is an invitation for investment which facilitates wage and income growth, growth in the tax base, and quality of life for residents. Expanding the land base allows for existing businesses to grow locally - retaining the relationships between themselves and their labor force as well as the communities that have nurtured them. Additionally, land availability can be a competitive advantage to attract outside investment into the community.
Strategy: Work with MadREP on Business Attraction for Primary
Industries
Major employers in McFarland are primarily local services including the school district, banks, and the grocery store. Only five employers with over 50 employees are considered to be importing revenue into the community from sales to customers outside the community. As a community served by the Madison Region Economic Partnership (MadREP), McFarland has a small number of employers which fall within the region’s targeted industries. Those industries include Advanced Manufacturing; Agriculture, Food, and Beverage; Healthcare; Information Communications Technology; and Bioscience. However, it is in McFarland’s best interest to work closely with MadREP to make available property for development that is in-demand and meets the needs of site searches which come to MadREP from the Wisconsin Economic Development Corporation (WEDC).
Strategy: Invest Resources on Business Retention and Expansion
Existing businesses account for 80% of a community’s growth. Establishing a formal Business Retention and Expansion (BRE) program is a solid strategy to devote time and energy on so that existing businesses will continue to grow and thrive. A formal BRE program identifies the hurdles and challenges facing local businesses and provides assistance to address those issues.
Technical assistance provided by a BRE program can help a business increase its competitiveness in the wider
4
marketplace through economic gardening initiatives, business intelligence and analytics programs. Site selection assistance helps existing businesses expand and add new jobs locally. BRE activities also include business continuity planning, pre-disaster planning and post-disaster recovery help which increases the likelihood of business survival through economic difficulties.
A successful BRE program organizes networking opportunities needed for success such as connecting businesses to networks such as MEPs, Chambers of Commerce, regional cluster initiatives, Angel investor networks, are additional responsibilities of the BRE program. Sometimes, the BRE program director acts as a broker between the sources of assistance and the company needing them, packaging several forms of assistance when available from different sources to assist the company or respond to firm issues identified in BRE surveys and site visits conducted annually.
A successful BRE program provides data and intelligence to strategically attract new companies to a community and foster the creation of new businesses. Local economic data includes:
• The competitive strengths and weaknesses of the local area as a business location

• The relative strength of the local economy
• Areas of interest and concern that can be used to formulate public policy, enhance development efforts, or improve the local business climate
• An understanding of the current workforce and the workforce needs of the business community
• Available buildings and sites

McFarland should create and implement a BRE program with the goal of meeting with all McFarland-based businesses at least once per year. This program will largely demand an investment of staff time.
Strategy: Facilitate Development of a Balanced Housing Stock
Economic Development is not just business attraction and retention. The entirety of the economy benefits from having adequate housing stock to ensure that workers at all wage levels can afford housing in the Village. To accomplish this, it is important to understand how the Village is expected to grow in not only population, but also age and income levels in order to meet various needs. The population of McFarland was estimated at 8,991 in 2022. McFarland’s population is expected to increase significantly between 2020 and 2040, with one estimate projecting an increase of as much as 61% or an additional 5,443 residents. The data indicate an aging population through 2040, with a projected increase of 92% in those aged 55-64 and increase of 132% in those aged 65-84. See the accompanying Housing Market
Analysis to understand how to meet the needs of all residents through housing supply. Preparing for this growth will make the Village not only more attractive place for people to live, but also more attractive to businesses because their workforce, at all levels, will be able to find quality, affordable housing in the Village.
Strategy: Attract New Commercial/Retail/Service Businesses
Prioritize aligning businesses attraction efforts with the types of businesses MadREP is focused on in Advance 2.0 including bioscience, information technology, healthcare, advanced manufacturing, and agriculture/ food/beverage. These efforts will have a higher return on the time and resources devoted to their attraction than those for commercial/retail/service space. Commercial/retail/service businesses depend on population density, population growth, traffic volume, particular demographic factors, adjacent businesses, and other amenities. Large housing developments and more densely populated areas attract retail businesses, restaurants, and other services to meet the needs of residents in the community.
Commercial and retail business recruitment is recommended but often retail and commercial businesses follow residential density and the demographics of those new residents. Because of this, development of housing will create a demand for retail and commercial businesses. Retail and commercial businesses will be best located in existing commercial corridors, downtown, and newly planned mixed-use buildings within the East Side neighborhood. Categories identified in the gap analysis and survey of residents include health and personal care stores, clothing stores/ boutiques, hobby/books/sporting goods/musical instrument stores, shoe stores, jewelry stores, and health services. Also popular within neighborhood business districts are coffee shops, wine bars, distillery tasting rooms and brew pubs.
5
5910 Hwy 51 McFarland, WI
1200 SF, $12/SF/YR
Source: CREXI.com
Source: Zillow.com
For Sale: 6166 Tuscobia Tr. Mcfarland, WI
6 1 IntroductIon
oVeRVIew
The following market assessment and economic development strategy has been developed to provide the Village of McFarland with the information and tools to guide decision-making and economic development activities over the next five years and beyond. This document works to implement the community’s vision, as laid out in the 2017 comprehensive plan:
“The Village will maintain and pursue a viable local economy built around responsible growth and revitalization; a proud heritage and downtown, adapted to serve modern demands; an emphasis on education and lifelong learning; safe and appealing places to live, work, shop, eat, and play; opportunities for recreation and respite, focused on our lakes and other resources”.
The market assessment provides a snapshot of trends and the direction the market is heading, informing recommendations for any impact the Village could and should make through its development efforts on the east side, and Village-wide. It will also be the basis for crafting marketing messages to new potential residents, businesses, and developers.
Due to McFarland’s geographic location in the Madison Metropolitan Statistical Area (MSA), it is uniquely situated to provide access to national transportation corridors and regional entertainment and recreational assets. Using this data to leverage those assets for economic growth will be critical to maximizing opportunities over the next five to ten years.
Market Area Definition
The Village of McFarland is a community located on the southeast side of the Madison market area and is counted as part of the Madison-Janesville-Beloit Combined Statistical Area (Dane, Columbia, Rock, Green, Iowa, and Sauk) for employment.

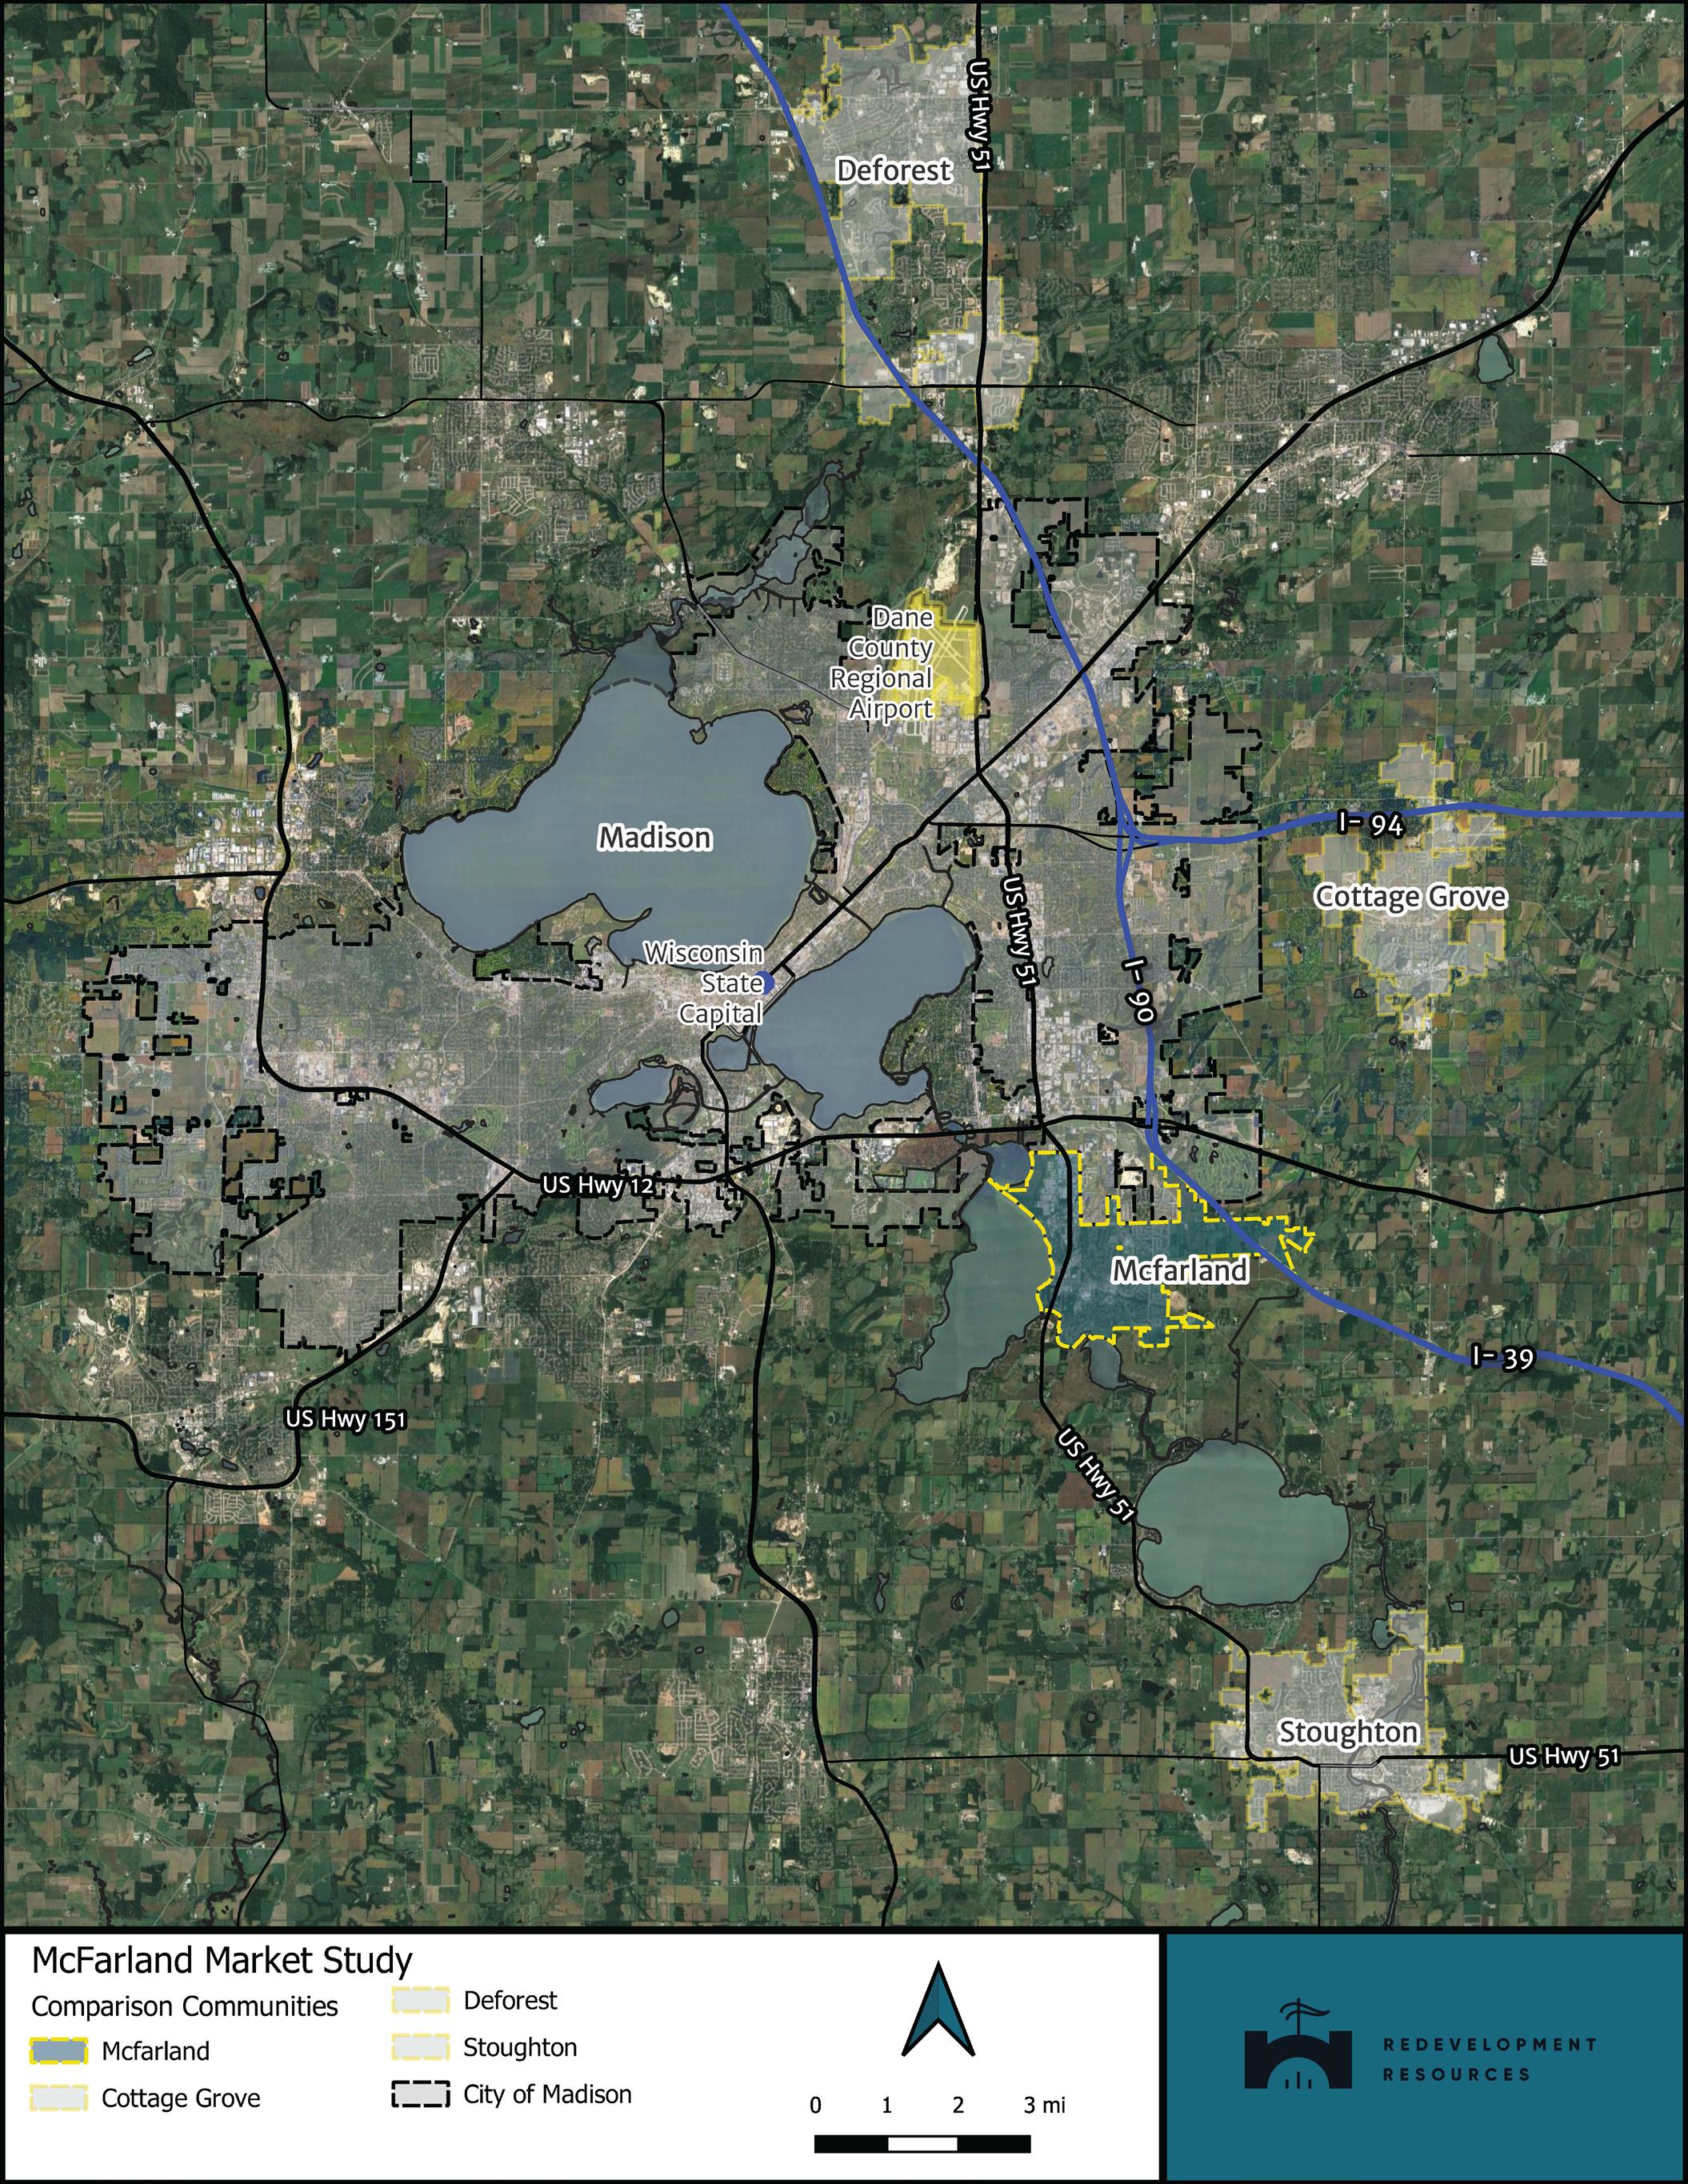
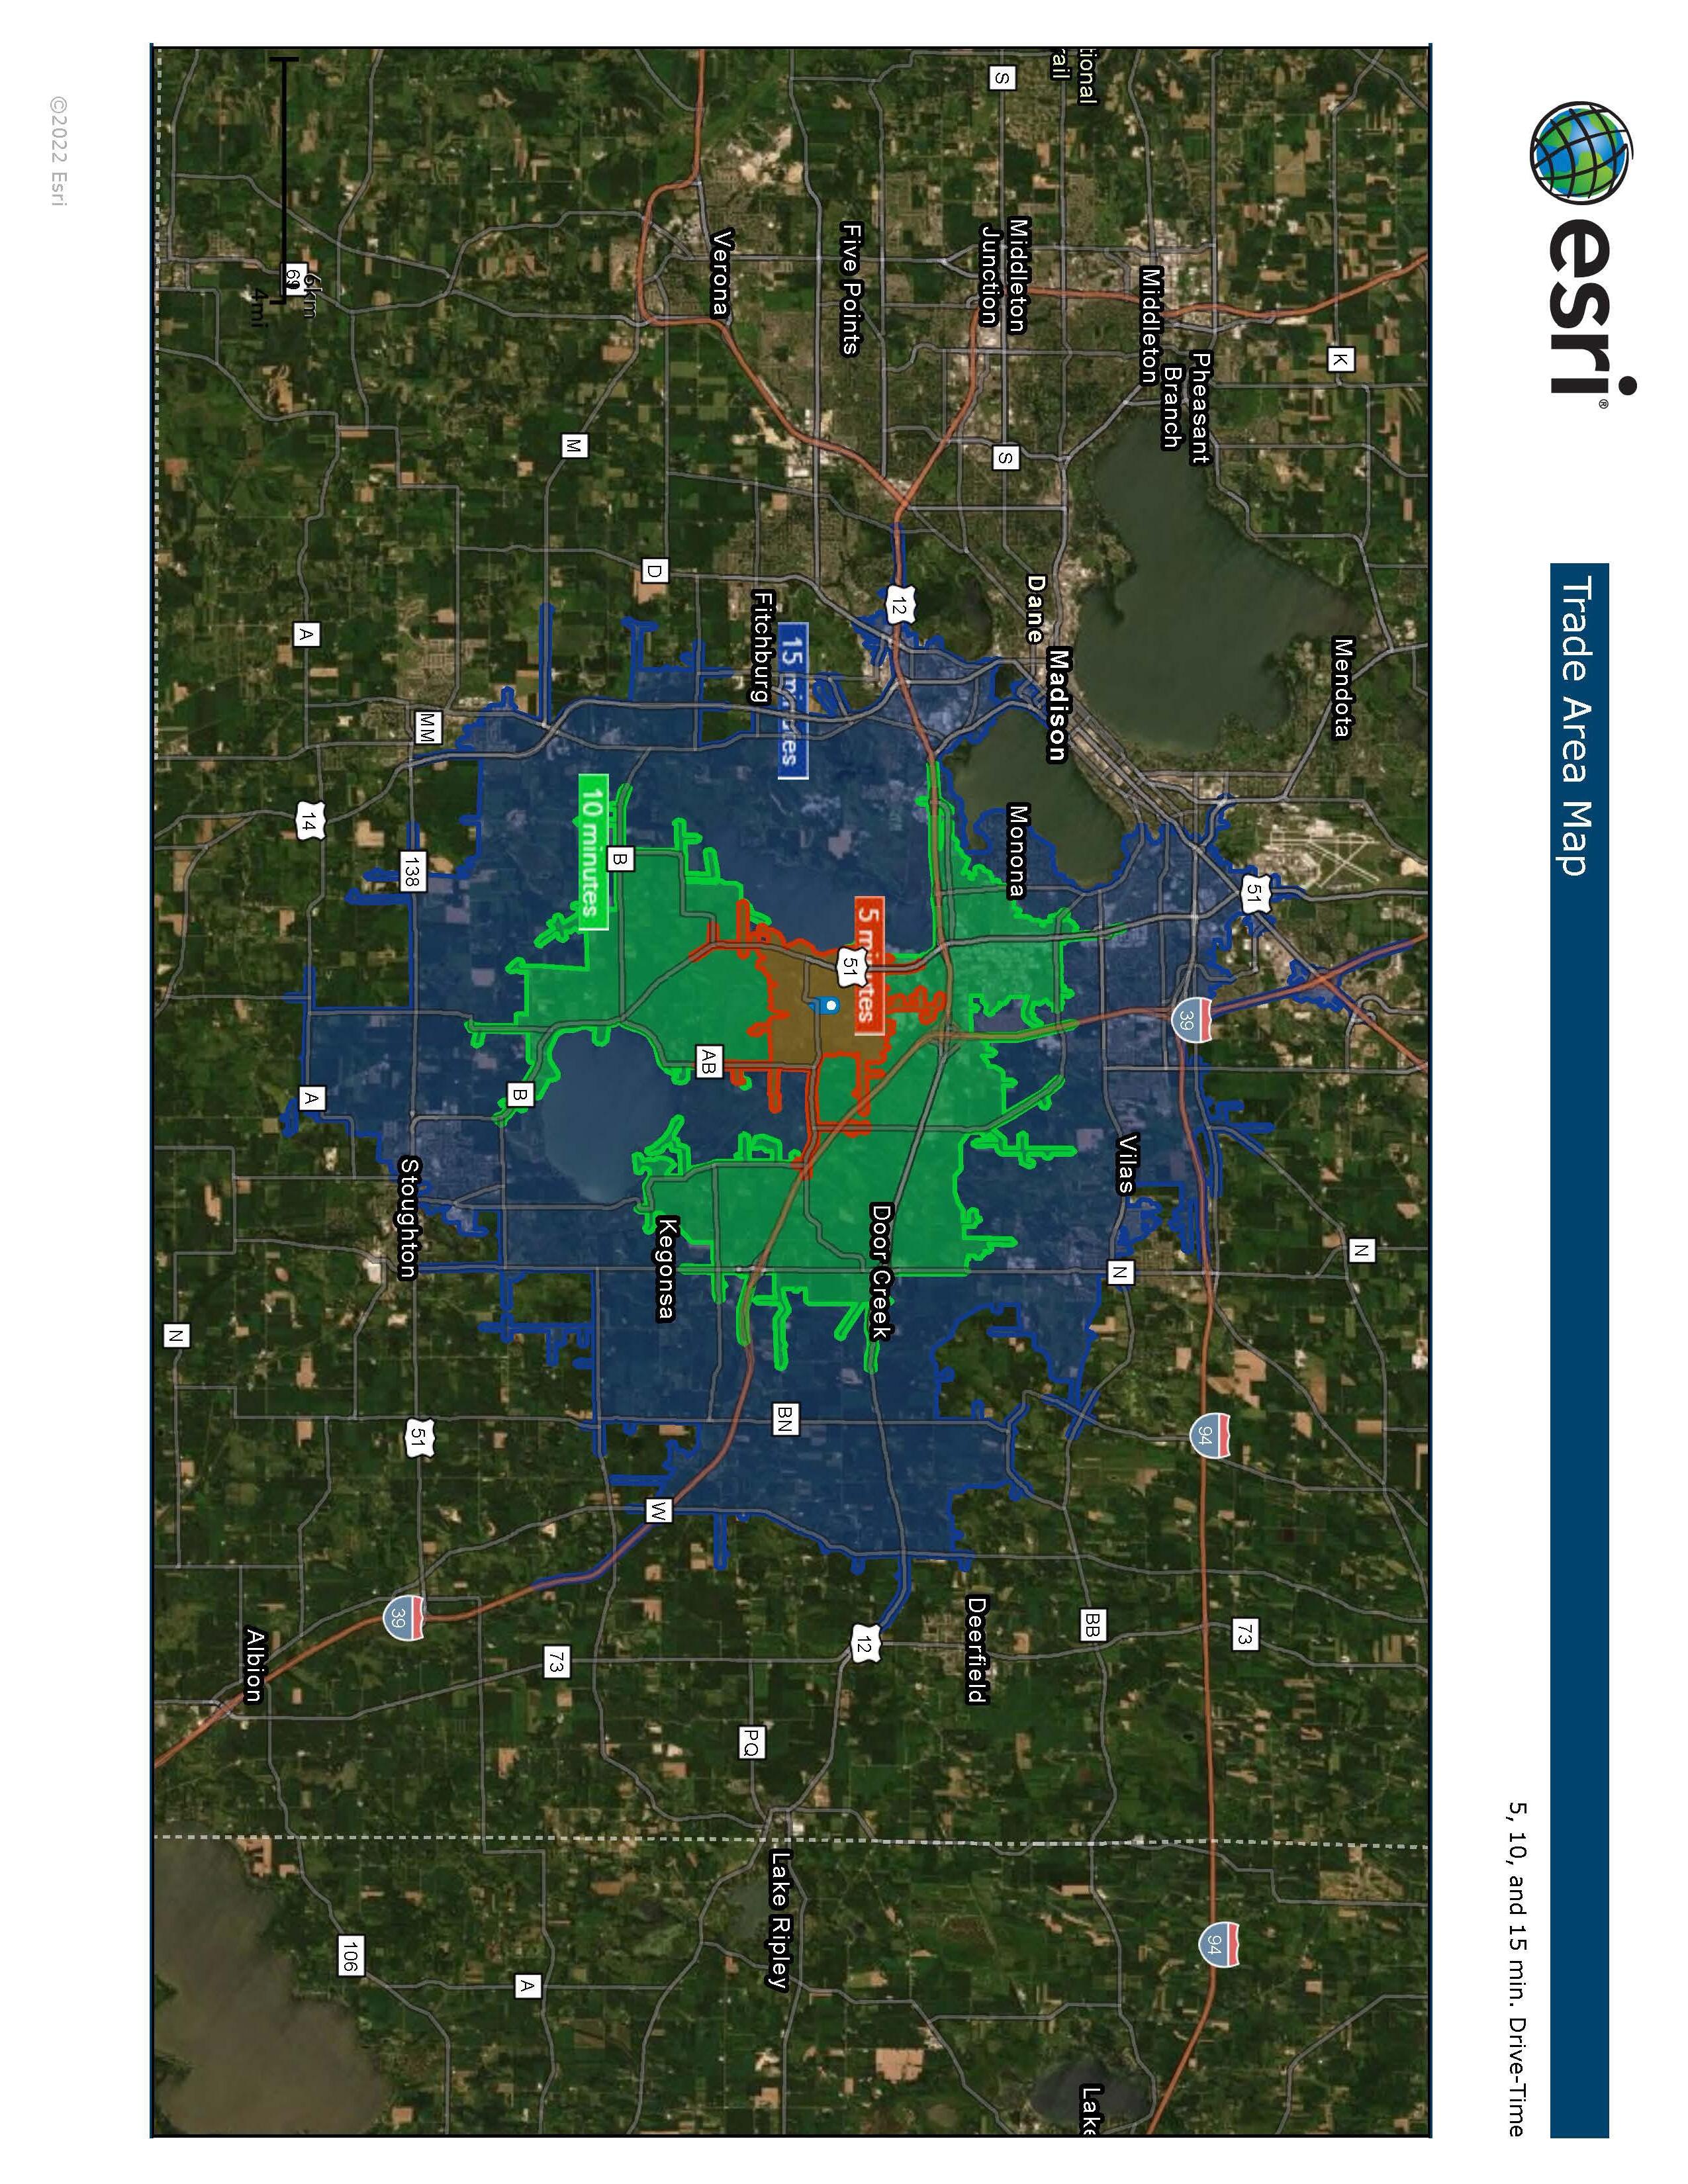
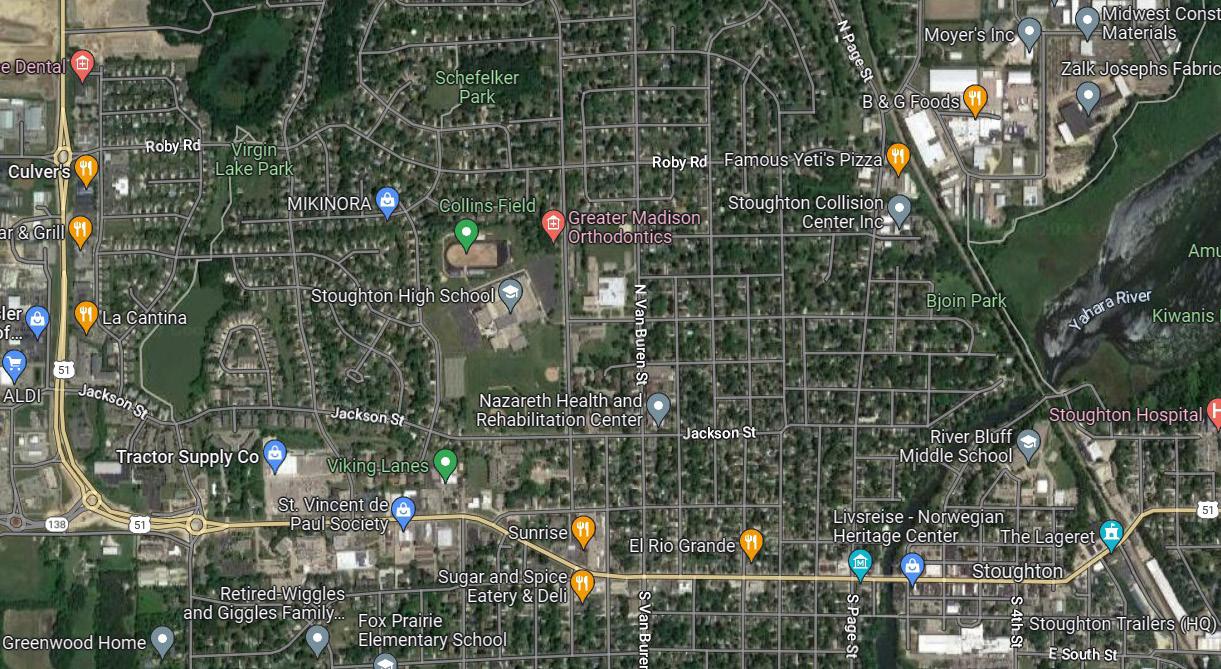
As a part of the Madison market area, the Village of McFarland is a full-service village with its own unique characteristics, assets and challenges. This portion of the study focuses on the Village of McFarland compared to four separate communities that were considered by the client as closely comparable to the Village of McFarland. The four communities identified are Cottage Grove, De Forest, and Stoughton. As shown in Figure 1.2, the populations of the comparable communities bracket McFarland in total household count and total population. Another factor for selecting comparable communities was their proximity to Madison. Stoughton, WI is located approximately 11 miles southeast of McFarland, while Cottage Grove is located 9.5 miles northeast of McFarland and De Forest is located approximately 20 miles north of McFarland. The local market trade area is defined as the area within a fifteen-minute drive time from the destination. Consumers will generally travel 25% of the time they intend to spend at a location. So, if a consumer is planning on shopping for an hour in McFarland, then they are willing to drive 15 min. Longer drive-times were not included due to the regional context and proximity to Madison.
The labor market however includes the MadisonJanesville-Beloit Combined Statistical area which includes Sauk, Columbia, Dane, Rock, Green and Lafayette Counties.
7
8
compARIson commUnItIes mAp
tRAde AReA mAp
9
Growth, employment, and income drive housing demand. The following sections outline our study area, explore the trends within each of these drivers, and suggest related implications of those trends.
#1
Number of advanced degrees among comparison communities.
McFarland’s population is expected to grow between 49%-61% (as many as 5,443 new residents) over the next 18 years (Figure 1.1). Households are expected to grow 17%-30% (as many as 1,077 new households) over the next 18 years. Over the next 18 years, the number of people in the 55-64 age category will increase 92% and the age category of 65- 84 increase 132%. Until 2032, the largest segment of the population will be residents aged 35-54, then those ages 55-64 and 65-84 will take over as the largest segments of the population.
McFarland has the second highest number of graduate/ professional degrees and the highest percent of residents employed in professional and management/business/ financial occupations combined when compared to De Forest, Cottage Grove, and Stoughton. Median household income in McFarland is competitive with peer communities.
Growth, employment, and income drive housing demand. The following sections outline our study area, explore the trends within each of these drivers, and suggest related implications of those trends.
Population Trends
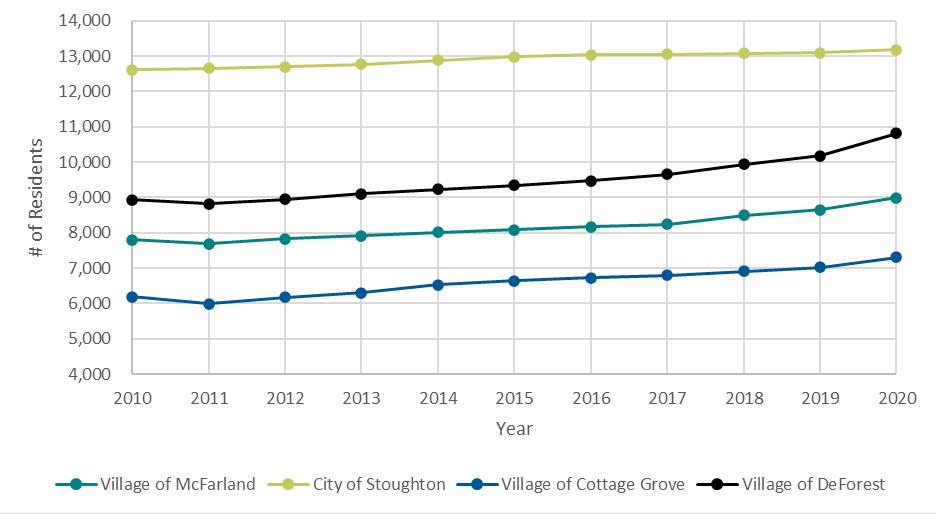
Population within the Village has increased over the past decade, as is consistent with neighboring communities, Dane County, and the State of Wisconsin. Between 2010 and 2020, McFarland saw a net increase of 1,417 residents – an 18.7% increase (Figure 1.2).
Household Trends
Total households are projected to increase between 2020 and 2040 (Figure 1.3). The most conservative projection expects households to increase by 17% or 605 households. More moderate projections estimate an increase of 24% or 857 households. The most liberal projection, however, estimates an increase of 30% or an additional 1,077 households. While it appears McFarland is steadily growing and is projected to continue to grow, neighboring communities are also growing. The Village of De Forest’s historical growth nearly mirrors that of the Village of McFarland. Stoughton’s historical growth did not consistently trend upward but appears to increase and decrease over time, with a net effect of a slight increase over the past ten years. The Village of Cottage Grove shows steeper increases in recent years. Cottage Grove has recently constructed a new elementary school and has several new subdivisions, in addition to investing heavily in the past 10 years on building out a new business park adjacent to I-94. These actions have set Cottage Grove up for continued growth.

10 popUlAtIon & HoUseHold
tRends
Figure 1.1: Population Projections Trends for McFarland (2020-2040)
Source: Village of McFarland, WI DOA Projections, CARPC 2050 Regional Development Framework
5,443 Projected population increase by 2040
Median household income in McFarland is competitive with peer communities. #2
Percent of residents employed in high-wage occupations among comparison communities.
Figure 1.2: Population Growth Trends in McFarland and Peer Communities (2010-2020)
Source: 2016-2020 ACS 5-Year Estimates
Figure 1.3: Household Projections Trends for McFarland (2020-2040)
Source: Village of McFarland, WI DOA Projections, CARPC 2050 Regional Development Framework

11
Source: 2016-2020 ACS 5-Year Estimates
Source: 2016-2020 ACS 5-Year Estimates
Age
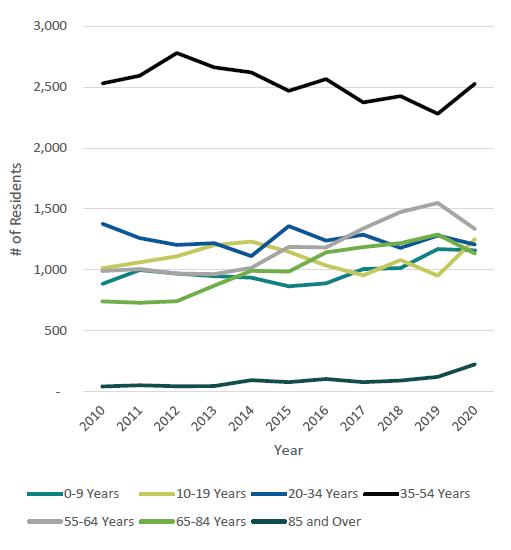
McFarland’s median age was 40.5 in 2020. This has decreased from 43.8 in 2016, but is higher than Stoughton, Cottage Grove, and De Forest. Figure 1.6 shows youth (ages 0-9), middle-aged adults (55-64), and older adults (65+) have had the largest increases since 2010. This indicates an increase in children and aging Baby Boomers.
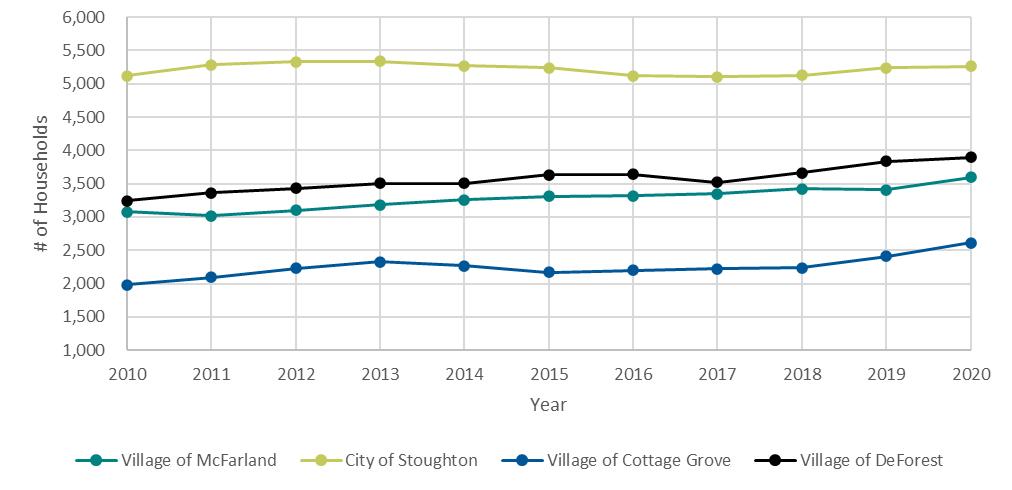
Figure 1.7 indicates a continued aging population through 2040 with a projected increase of 92% in those aged 55-64 and an increase of 132% in those aged 65- 84.

12
Figure 1.4: Household Growth Trends in McFarland and Peer Communities (2010-2020)
Figure 1.5: Median Age in McFarland (2010-2020)
Educational Attainment

Another attribute to compare the communities is the level of educational attainment. In the population over 25 years old in McFarland, about 28% have achieved a bachelor’s degree. Deforest and Stoughton have a lower percentage with bachelor’s degrees, whereas Cottage Grove has a significantly higher percentage with a bachelor’s degree. McFarland has the highest percentage of population with a graduate/professional degree (about 16%). See Figure 1.8.
High School Graduate Some College, No Degree
Associate Degree Bachelor's Degree
Graduate/Professional Degree
13
Figure 1.6: Age Cohort Trends in McFarland (2010-2020) Source: 2016-2020 ACS 5-Year Estimates
0.0% 5.0% 10.0% 15.0% 20.0% 25.0% 30.0% 35.0% 40.0%
Figure 1.7: Age Cohort Trend Projections for McFarland (2010-2040) Source: ACS 5-Year Estimates, algorithmic projection
McFarland Cottage Grove DeForest Stoughton
Figure 1.8 Comparison of Share of Population 25 Years Old and Older by Educational Attainment (2021) Source: Esri Community Profile
emploYment tRends & cHARActeRIstIcs
Employment Trends
The unemployment rate in the Madison-Janesville-Beloit combined area has been steadily declining up until the COVID-19 pandemic in early 2020, when many sectors of the economy were sidelined, and employers were concerned for worker safety and limited operations. As the graph shows, once things were opened back up, the unemployment rate has almost returned to prepandemic levels.
The labor force, as measured by the Bureau of Labor Statistics, has been steadily increasing from 2011-2021. The green area of Figure 1.9 shows the total employment, and the gap between the top of the blue area and the top of the green area represents the total number of unemployed members of the workforce. The total number of employed individuals in 2021 has passed 2019, prior to the economic shutdown.
Source: Madison-Janesville-Beloit Combined Statistical Area Local Area Unemployment Statistics from the Bureau of Labor Statistics Annual Averages 2011-2021
Employment Characteristics
The Village has high concentrations in occupational categories such as Professional, Transportation / Materials Moving, and Management/Business/Financial occupations compared to peer communities. However, among peer communities McFarland trails in Production, Services, Administrative Support, and Construction occupations (Figure 1.10).
Construction/Extraction
Transportation/Material Moving Sales
Administrative Support Services
Management/Business/Financial Professional
Employers in McFarland
Employers in McFarland who employee 50 employees or more are listed in the chart below. Of note, only five or six of the employers below are importers of revenue from outside the community. The grocery stores, banks, and schools are local businesses which revolve local dollars, primarily from residents.
14
30.2% 32.5% 28.3% 28.6% 24.7% 18.5% 18.7% 19.5% 10.3% 12.2% 10.9% 14.0% 10.4% 9.8% 12.9% 10.5% 8.1% 7.9% 7.2% 8.4% 7.4% 5.8% 6.4% 5.7% 2.9% 4.2% 5.6% 5.5% 3.9% 4.9% 5.7% 3.6%
Figure 1.10 Comparison by Occupation Type for Employed Population 16 Years Old and Older (2021) Source: Esri Community Profile
McFarland Cottage Grove DeForest Stoughton
Production
Figure 1.9 Madison-Janesville-Beloit Combined Statistical Area Labor Force & Employment Trends Over Time (2011-2021)
0.0% 1.0% 2.0% 3.0% 4.0% 5.0% 6.0% 7.0% 400,000 420,000 440,000 460,000 480,000 500,000 520,000 540,000 2011 2012 2013 2014 2015 2016 2017 2018 2019 2020 2021 Unemployment Rate Labor Force & Employment Labor Force Employment Unemployment Rate
Business Name Employee Size Green Lantern Restaurant & Bar 53 Wisconsin Virtual Academy 55 Madison Forms Corp 56 Ctw Abbey Carpet & Floor 62 Waubesa Intermediate School 67 Cubic Wall Systems Inc 70 Conrad Elvehjem Primary School 78 Indian Mound Middle School 78 One Community Bank 82 McFarland High School 107 Pick 'n Save 119 Amtelco 120
Table 1.1 Employers in McFarland Source: Datavue
Income & commUtes
Income
McFarland has a solid trend line regarding median household income growth over the past five years according to Figure 1.11.
Source: Financial Characteristics For Housing Units With A Mortgage, Income In The Past 12 Months (In Current Year Inflation-Adjusted Dollars), American Community Survey 5-Year Estimates
The comparison in Figure 1.12 shows McFarland as a solid leader regarding distribution of households by income level compared to peer communities. With a smaller percent of households at lower income levels (below $50,000) than three of the four communities, McFarland appears to have more households earning between $50,000 and $74,999 than De Forest or Cottage Grove. The percent of households in McFarland earning $100,000 - $149,000 is mid-range, with two communities having more households at that level and two with fewer households at that level. McFarland has the largest percent of households earning $150,000 but finds itself at the middle of the group again with the percent of households earning $200,000 or greater. Understanding this data will be helpful in directing the housing development for the community as it grows to the east.
15
$0 $20,000 $40,000 $60,000 $80,000 $100,000 $120,000 2011 2012 2013 2014 2015 2016 2017 2018 2019 2020 Median Houshold Income (All) Median Household Income (Households with a Mortgage)
Figure 1.11 Village of McFarland Median Household Income Trends (2011-2020)
0.0% 5.0% 10.0% 15.0% 20.0% 25.0% 30.0% 35.0% <$15,000 $15,000$24,999 $25,000$34,999 $35,000$49,999 $50,000$74,999 $75,000$99,999 $100,000$149,999 $150,000$199,999 $200,000+ Share of Households (%)
Figure 1.12 Comparison of Distribution of Households by Income Level (2021) Source: Esri Community Profile
McFarland Cottage Grove DeForest Oregon Stoughton
A significant portion of residents of McFarland work in Madison (47.2%). See Figure 1.13.
Employees working in McFarland live in a variety of communities, including McFarland (15%), Madison (19%), Stoughton, Fitchburg, Sun Prairie, Monona, Janesville, Cottage Grove, Milwaukee, and Oregon. However, Figure 1.14 illustrates that the most significant number of employees working in McFarland report living elsewhere (49%). Because the City of Madison host the largest number of jobs in the metro area, the comparative communities commuting patterns are very similar and
differ only from the aspect of whether or not there is a dominant local employer employing a large percent of the population. For example, a large employer in Stoughton WI is Stoughton Trailer, with more than 1,000 employees, is the largest employer in Stoughton. In De Forest, employers such as Ball Corporation (canning jars), American Girl, EVCO, and ABS, are listed as the largest employers in the community, and employ 1360 people combined in De Forest.
Source: U.S. Census Bureau, OnTheMap Application and LEHD Origin-Destination Employment Statistics
Source: U.S. Census Bureau, OnTheMap Application and LEHD Origin-Destination Employment Statistics (Beginning of Quarter Employment, 2nd Quarter of 2002-2019)
16
Figure 1.13 Where Workers are Employed Who Live in the Selection Area - by Places (Cities, CDPs, etc.)
47.2% 25.6% 10.0% 3.9% 2.7% 2.6% 2.2% 1.8% 1.5% 1.4% 1.0% Madison All Other Locations McFarland Monona Fitchburg Middleton Sun Prairie Verona Stoughton Milwaukee Waunakee
Figure 1.14 Where Workers Live Who are Employed in the Selection Area - by Places (Cities, CDPs, etc.)
49.2% 19.3% 15.3% 3.3% 2.7% 2.4% 2.2% 1.8% 1.4% 1.2% 1.1% All Other Locations Madison McFarland Stoughton Fitchburg Sun Prairie Monona Janesville Cottage Grove Milwaukee Oregon
InteRVIew tAkeAwAYs
Brokers and Developers were interviewed and asked about the strengths and opportunities, weaknesses and challenges of doing business in McFarland. The interviewees were also asked in their opinion what was the most likely types of businesses which would locate in McFarland given available real estate elsewhere in the metro-Madison area.
Strengths and Opportunities
• Great community to live and work
• Proximate to everything
• Community has most of what one needs
• Connectivity to Hwy. and Interstate system
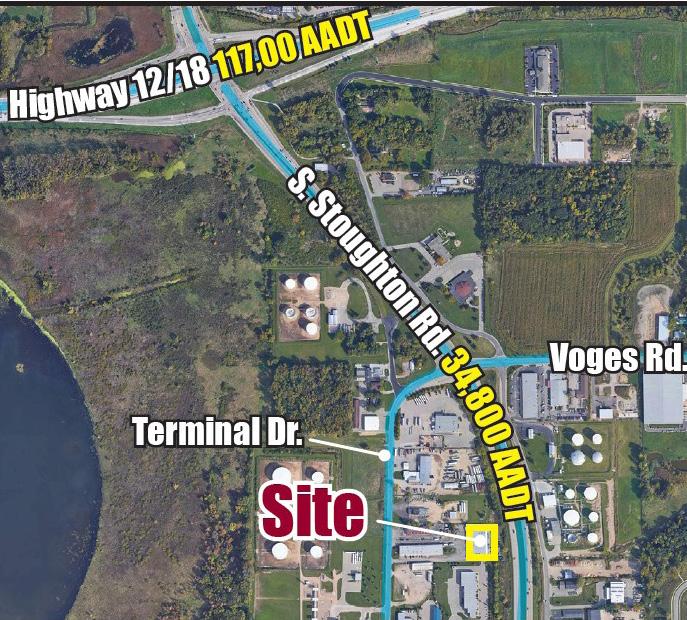
• There is a massive demand for industrial space throughout metro-area
• Opportunity to develop more housing and expand with industrial development on east side

• Best thing McFarland could do to grow is have space available
• Industrial/flex
• Corporate HQ /manufacturing-related
Weaknesses and Challenges
• Difficult play for office with so much remote work
• McFarland doesn’t have a “hook” or unique selling proposition
• Industrial has maintained itself through the pandemic, but brokers are seeing an uptick in activity for commercial/retail space throughout the metro area
• Try to recruit family entertainment and recreation options
• Approval process for conditional use and TIF incentives takes a long time (from the perspective of one local business owner).
17
Image Source: Lee & Associates brochure.
Image Source: Wisconsin Commercial Real Estate listing brochure.
RegIonAl economIc gRowtH InItIAtIVes
Madison Region Economic Partnership (MadREP)
MadREP is the regional organization that is tasked with marketing the seven-county region including and surrounding Dane County. The organization is operating according to the most recent strategic plan entitled, “Advance Now 2.0, Madison Region’s Strategy for Economic Growth”.
Advance Now 2.0 provides a framework to uplift the prospects of all Madison Region counties, but in order for the strategy to be most impactful, local communities must acknowledge and embrace key tenets of regionalism that underpin effective communication and collaboration.
Advance Now 2.0 has a series of high priority activities including actions such as a focus on broadband, education, organizational structure for regional planning and facilitating high-tech innovation. Specifically related to growth, the following activities impact and could be impacted by actions taken by the Village of McFarland.
Growth Capacity and Coordination
Key Strategic Drivers listed under growth capacity and coordination include:
1. Regional Planning
2. Development Product and Infrastructure
3. Coordination and Collaboration
Related to regional growth capacity and coordination, the plan recommends the creation of a Regional Planning Commission to serve the area. McFarland staff should be aware of this effort’s progress and understand how the services provided by a regional planning commission could benefit the Village.
The second key strategic driver focuses on development product and infrastructure. McFarland will contribute directly to this effort by expanding business park space in the East Side Growth Area.
The third Key Strategic Driver is listed as Coordination and Collaboration.
Competitive Location for Business and Talent
Related to Awareness and Differentiation, Advance Now
2.0 states that the Madison Region will be known as a competitive location for business and talent.
Business Expansion and Enterprise Creation
The Madison Region will foster economic growth through
targeted support of existing employers and innovators.
Opportunity, Access, and Equity
The Madison Region will ensure that all residents have equal opportunities for success.
Regarding the above initiatives, the Village of McFarland should be an active participant in the implementation of key initiatives of MadREP in their quest to achieve the goals outlined in Advance Now 2.0.
In 2021 and 2022, representatives of MadREP have had the opportunity to respond to over 65 requests for sites passed along from the statewide economic development agency, and companies seeking space. Due to a shortage of industrial space in Dane County, options are limited for businesses expanding or new to the region, to locate within Dane County. Conversations with a representative of MadREP revealed an ideal position for the Village of McFarland to be in would be for the planning and development of 40-100 acres of industrial and/or business park space, with parcels ranging in size from six (6) to ten (10) acres each.
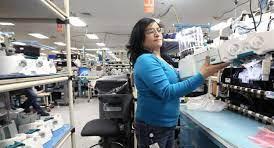
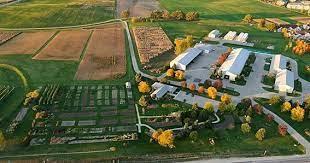
Top industries which have a strong presence in the region, and have been identified by MadREP as primary industries for the region include:
1. Advanced Manufacturing

2. Agriculture, Food, and Beverage
3. Healthcare
4. Information Communications Technology

5. Bioscience

18
McFarland’s opportunity to work with MadREP to attract businesses in the target industries identified above will most likely be realized in the advanced manufacturing, information communications technology, and agriculture, food, and beverage sectors. Other areas in the metro area are well established for healthcare and bioscience, particularly as they related to research and development stemming from the University of Madison, and the technology and bioscience campuses established in Fitchburg. McFarland has a small number of existing business identified on the MadREP website as contributing to the primary industries as shown in the graphic on the left.

Dane County Sustainability Campus
As of early fall, 2022, Dane County has an initiative underway for a Sustainability Campus. With less than 10 years of landfill space remaining at Dane County’s Rodefeld Landfill, the county has been planning to change its perspective on the waste stream and purposefully set the foundation to advance the County toward a circular economy.
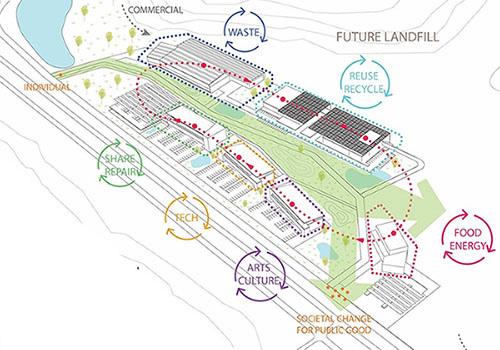
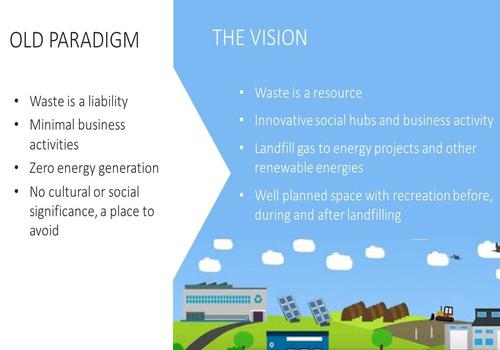
The vision for the next phase of the landfill includes development of a sustainable business park or “Sustainability Campus” to divert waste and create local circular economies. This will be accomplished by attracting reuse, repair, and recycling businesses; new waste management technologies; and research. The intent is to design the site for safe public access, education, and recreation where visitors can examine their relationship with waste and the Dane County community can move towards a future where waste is not a liability, but a resource and an opportunity. The site identified for this is near the existing landfill, and close to the Village of McFarland.
However, even though the project is not fully approved, space is already programmed at the Sustainability
Campus and from early estimates, this concept could easily attract more business related to recycling and new technology surrounding the circular economy than can be accommodated on site. This is an opportunity for McFarland to attract businesses needing space which are attracted to support or collaborate with others on the Sustainability Campus. McFarland’s location and visibility from the Interstate would be ideal for businesses wishing to have easy interstate access and connections to the innovative initiatives occurring at the Dane County Sustainability Campus.

19
Image Source: Dane County Sustainability Campus website:
LocaL Economy
20
2
eXIstIng BUsIness mIX
McFarland is a full-service Village in the midst of a larger metropolitan area. Because of this, many retail and service needs of residents can and will be met in the vicinity of the Village and won’t necessarily exist within the corporate boundaries. As evidenced by responses to a recent survey, 60% of respondents reported sourcing their non-grocery purchases from Madison (Figure 2.1).
While 60% of people who live in McFarland shop for non-grocery items in Madison, this does not necessarily indicate it’s just a matter of convenience. It is more likely that the specific non-grocery items shoppers buy in Madison are not available in McFarland.
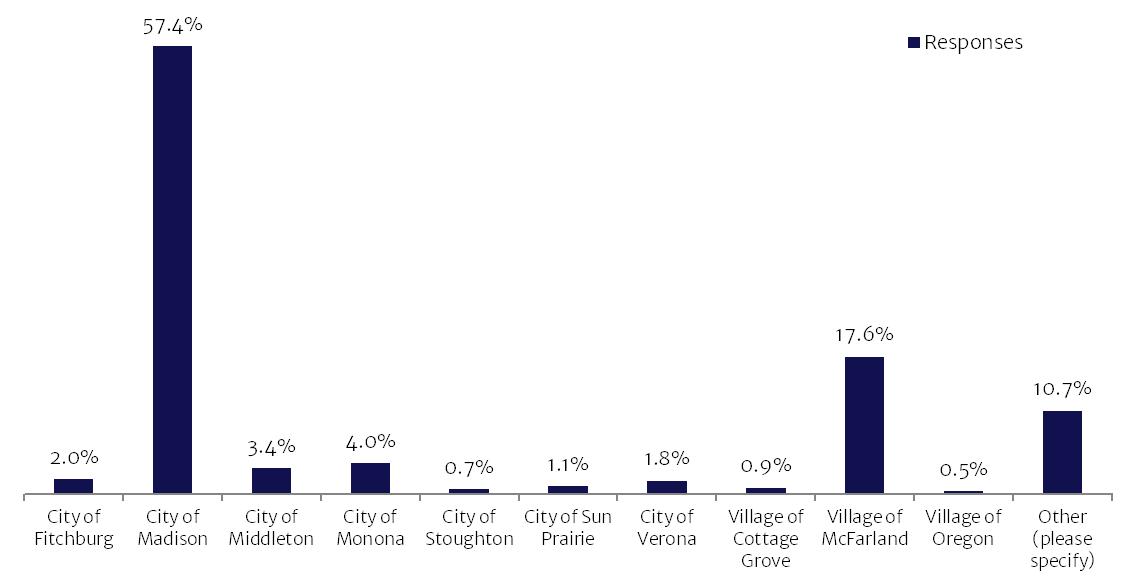
Nearly 57% of survey respondents work in Madison (Figure 2.2). Where people shop may or may not be tied to where they work, however, those workers would be more inclined to shop near their place of employment or in route to and from their homes McFarland.
21
5.1% 1.5% 6.0% 59.8% 0.3% 18.9% 8.4% Village of McFarland City of Fitchburg City of
City
Outside
specify) Responses
Monona
of Madison
of Dane County Internet and/or Mail Order Other (please
Figure2.1 Survey Question: Where do you do most of your NON-GROCERY shopping? Source: Community Survey
Figure 2.2 Survey Question: In what community is your primary place of work? Source: Resident Survey
Shopping for groceries, personal care items and professional services appears to be something most survey respondents do either regularly or monthly. Eating in a restaurant or café is also something that can be done in McFarland on a regular basis. However, a significant number of respondents rarely or never conduct nongrocery retail shopping, go to a tavern/bar, shop for personal care items or professional service in the Village (Figure 2.3).
According to Figure 2.4, survey respondents believe there are not enough options in McFarland for sit down restaurants, bakery/coffee shops, deli/butcher shops, clothing, furniture, special foods or arts and craft supplies. Respondents were satisfied with the number of fast-food restaurants in the community and believe there is an ample supply of hardware/building supply stores, personal care options, veterinary clinic /pet supply stores, medical/dental clinics, and professional services.
Source: Community Survey
Rarely/Never 1-2 times a Month
1-2 time s a Week 2-4 times a Week
5+ time is a Week
22
0% 10% 20% 30% 40% 50% 60% 70% 80% 90%
Figure 2.3 Survey Question: How often do you shop in McFarland for the following?
Sit-down restaurants Fast food restaurants Bakery/Coffee Shops Deli/Butcher Shops Clothing/Apparel Furniture/home furnishings Specialty/local food 0% 10% 20% 30% 40% 50% 60% 70% 80% 90% Not Enough Right Amount More than Enough No Opinion Arts/craft supplies Hardware/Building & Garden Supply Stores Personal Care Veterinary/pet supplies Clinics (medical, dental, etc.) Professional Services (accountants, insurance agents, etc.) 0% 10% 20% 30% 40% 50% 60% 70% 80% Not Enough Right Amount More than Enough No Opinion
Figure 2.4 Survey Question: Are there enough options in McFarland in the following categories? Source: Community Survey
consUmeR spendIng
According to Esri, the retail mix is solid but there are areas of opportunity. Interestingly, the community’s perceptions of demand categories align with Esri’s data in clothing/apparel, and arts/craft supplies. Though survey respondents believe there is just the right amount of health & personal care stores, Esri’s data shows a gap, or opportunity for more sales. The gap analysis in Figure 2.5 shows demand, (retail potential) which estimates the expected amount spent by consumers at retail establishments, and supply (retail sales), which estimates sales to consumers by establishments. The Leakage/ Surplus Factor presents a snapshot of retail opportunity.
Figure 2.5 identifies significant gaps, or opportunities for location of businesses in all categories shown, including health & personal care services, clothing stores, shoe stores, jewelry/luggage/leather goods stores, and sporting goods/hobby/musical instrument stores. Other categories showed minimal gaps, but not significant enough to warrant a strategy to attract. Because there is a retail gap, doesn’t automatically mean a new retail store in these categories will be successful. Other factors that play a role in a business’ success can also depend on the operator, the economy at the time, and circumstances around affordability of leasable space. However, according to the population and its consumer spending
habits, these categories could be supported by savvy retailers locating in McFarland.
Redevelopment Resources used data from Esri’s Retail Marketplace Profile report in Figure 2.5, which was sourced for McFarland’s zip code only. This report identifies retail gaps, or surpluses. The information shows the largest gaps in categories with the most potential to capture local sales. However, using this report alone as a basis for an economic development strategy without more local intel, especially in a community like McFarland where so much of the shopping is done in Madison, does not provide the best strategy. More retailers in the above categories aren’t in McFarland now because, unless they are really excellent local operators, they will not be successful based on the local economy alone. With the growing internet presence and dominance post-pandemic, it will be even more difficult to survive unless the operator has a significant online presence, and/or a customer base which travels to their store as a destination. In fact, Esri has discontinued offering the Retail Marketplace Profile report because that particular report was developed prior to e-commerce being such a big factor. Data hasn’t been perfected yet to understand by category, how online shopping figures into retail demand in a particular geographic area.
Retail MarketPlace Profile. Data Note: Supply (retail sales) estimates sales to consumers by establishments. Sales to businesses are excluded. Demand (retail potential) estimates the expected amount spent by consumers at retail establishments. Supply and demand estimates are in current dollars. The Retail Gap represents the difference between Retail Potential and Retail Sales. Esri uses the North American Industry Classification System (NAICS) to classify businesses by their primary type of economic activity. Retail establishments are classified into 27 industry groups in the Retail Trade sector, as well as four industry groups within the Food Services & Drinking Establishments subsector. For more information on the Retail MarketPlace data, please click the link below to view the Methodology Statement.
23
$3,472,453 $408,511 $5,438,809 $4,089,306 $921,861 $918,879 $3,188,160 $0 $1,000,000 $2,000,000 $3,000,000 $4,000,000 $5,000,000 $6,000,000 $7,000,000 $8,000,000 $9,000,000 Health & Personal Care Stores Clothing Stores Shoe Stores Jewelry, Luggage & Leather Goods Stores Sporting Goods/Hobby/Musical Instr Stores Retail Gap Supply Demand
Figure2.5 Selected Retail Demand, Supply, and Gap Analysis Source:
Figures 2.6-2.8 identify consumer spending by category, and the growth in demand/spending in the same categories within ten- and fifteen-minute drive times. This data provides some insight into what consumers will be spending their money on in the immediate vicinity of the Village of McFarland.
In both the ten-minute drive-time and fifteen-minute drive-time, consumers spend most of their money on financial products (such as investments and financing tools), their home and food. Insurance, transportation,
and entertainment/recreation round out the top five spending categories within the five-minute drive time from the center of McFarland. Within the 10-minute drive time, after home and food, consumers spend the most money on household operations, insurance, and entertainment/recreation.
Growth categories mirror the top three spending categories and include home, food and insurance within the 10-minute drive-time, and home, food and household operations within the 15-minute drive time.
Data Note: The financial category for consumer spending has been left off the chart as it is a
industry within the 10-minute drive-time radius and $7.5B within the 15-minute drive-time radius.
24
$0 $250,000,000 $500,000,000 $750,000,000 $1,000,000,000 Apparel and Services Computer Entertainment & Recreation Food Health Home Household Furnishings and Equipment Household Operations Insurance Transportation Travel 10 Min. Drive Time 15 min. Drive Time
Figure 2.6 Consumer Spending by Category within 10-Min. and 15-Min. Drive Time (2022) Source: Esri Retail Demand Outlook
$1.9B
$0 $2,000,000,000 $4,000,000,000 $6,000,000,000 Value of Stocks/Bonds/Mutual Funds Value of Retirement Plans Value of Other Financial Assets Vehicle Loan Amount excluding Interest Value of Credit Card Debt 15 Min. Drive-Time 10 Min. Drive-Time
Figure 2.7 Financial Consumer Spending by Category within 10-Min. and 15-Min. Drive Time (2022) Source: Esri Retail Demand Outlook
Figure 2.10 is indexed to the national average (100). Only categories in which Village residents exceed the national average are illustrated. The top five categories in which Village residents exceed the national average are:
1. Support Payments/Cash Contributions/Gifts in Kind (e.g. charitable donations, crowd-funding)
2. Travel
3. Credit Card Membership Fees
4. Shopping Club Membership Fees
5. Accounting Fees
The take-away here is that it wouldn’t be far-fetched for a travel agency to take up residence in a small downtown office building that provided services to help clients apply for and use credit card miles for airfare, lodging, and vehicle rental. Particularly if they were able to bundle the services together for additional savings.
Figure 2.10 Village of McFarland Products and Services with Spending Potential Index Greater than 110 Data Note: The Spending Potential Index (SPI) is household-based, and represents the amount spent for a product or service relative to a national average of 100. Detail may not sum to totals due to rounding.
Source: Esri forecasts for 2021 and 2026; Consumer Spending data are derived from the 2018 and 2019 Consumer Expenditure Surveys, Bureau of Labor Statistics
Housekeeping Supplies
Cemetery Lots/Vaults/Maintenance Fees
Checking Account/Banking Service Charges
Transportation
Shelter
Food Away from Home
Health Care
Apparel and Services
Alcoholic Beverages
Occupational Expenses
Personal Care Products & Services
Entertainment and Recreation
Household Operations
Household Furnishings and Equipment
Pensions and Social Security
Life/Other Insurance
Accounting Fees
Shopping Club Membership Fees
Credit Card Membership Fees
25
106 108 110 112 114 116 118 120 122
Payments/Cash Contributions/Gifts in Kind Travel
Support
Source: Esri Retail Demand Outlook
Data Note: Financial consumer spending, which includes investment and loan products is not included in this chart, however, it is projected to grow by $2.31B.
Source: Esri Retail Demand Outlook
Data Note: Financial consumer spending, which includes investment and loan products is not included in this chart, however, it is projected to grow by $1.54B.
26
Figure2.8 Projected Spending Growth by Category within 10 Min. Drive Time (2027)
Figure 2.9 Projected Spending Growth by Category within 15 Min. Drive Time (2027)
$0 $50,000,000 $100,000,000 $150,000,000 $200,000,000 $250,000,000 Apparel and Services Computer Entertainment & Recreation Food Health Home Household Furnishings and Equipment Household Operations Insurance Transportation Travel $0 $100,000,000 $200,000,000 $300,000,000 $400,000,000 Apparel and Services Computer Entertainment & Recreation Food Health Home Household Furnishings and Equipment Household Operations Insurance Transportation Travel
Tapestry is a market segmentation system built from using a large, well-selected array of attributes of demographic and socioeconomic variables to identify numerous unique consumer markets throughout the United States. Site selectors, commercial real estate brokers, and business location professionals use tapestry segmentation profiles to identify the potential market.


Dominant Tapestry segments for the Village of McFarland include Workday Drive, In Style, and Old & Newcomers and are summarized below.
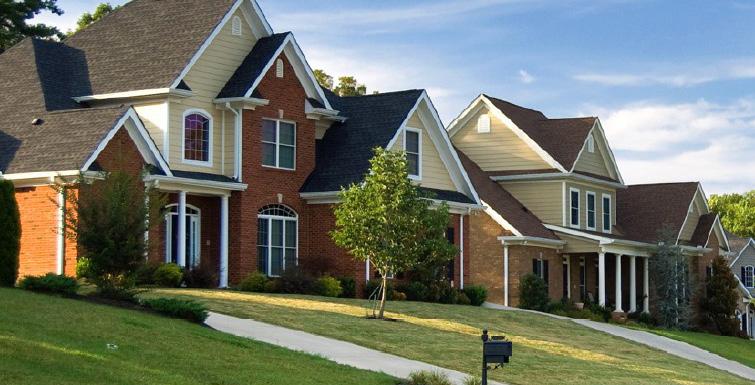
Workday Drive is an affluent, family-oriented market with a country flavor. Residents are partial to new housing away from the bustle of the city but close enough to commute to professional job centers. Life in this suburban wilderness offsets the hectic pace of two working parents with growing children. They favor time-saving devices, like banking online or housekeeping services, and family-oriented pursuits. Nationally this group’s average household size is 2.97 members, their median age is 37 years old, and their median household income is $90,500.


In Style denizens embrace an urbane lifestyle that includes support of the arts, travel, and extensive reading. They are connected and make full use of the advantages of mobile devices. Professional couples or single households without children, they have the time to focus on their homes and their interests. The population is slightly older and already planning for their retirement. Nationally this group’s average household size is 2.35 members, their median age is 42, and their median household income is $73,000.
Old and Newcomers feature singles’ lifestyles, on a budget. The focus is more on convenience than consumerism, economy over acquisition. Old and Newcomers is composed of neighborhoods in transition, populated by renters who are just beginning their careers or retiring. Some are still in college; some are taking adult education classes. They support charity causes and are environmentally conscious. Age is not always obvious from their choices. Nationally this group’s average household size is 2.12 members, their median age is 39.4, and their median household income is $44,900.

27
tApestRY segmentAtIon
InStyle OldandNewcome r s
WorkdayDrive
3 commErcIaL/rEtaIL SpacE ForEcaSt
28
The Village of McFarland has several commercial areas including downtown, the commercial district along US Hwy. 151, Farwell Drive, and Siggelkow west of US Hwy. 51. These business districts have distinct purposes. Small employers engage in production and services in mixeduse/flex and industrial uses north of the core of the Village along US Hwy. 51.
US Hwy. 51
Vehicle oriented convenience retail has clustered itself along the business district on US Hwy. 51, between the Yahara River and Larson Beach Road. These businesses include pharmacies, restaurants (fast food, cafes, and a supper club), gas stations, banks, veterinary clinics, a funeral home, the Pick-n-Save grocery store and an auto-repair shop or two. Because convenience retail and service-related businesses will be most successful where there is easy access and off-street parking, it is recommended that the commercial corridor along Hwy. 51 continue to be where these types of businesses are located. New or existing vacant space should be marketed to convenience retail and service-related businesses. In this commercial corridor, when there are opportunities for infill development as spaces open up, consider replacing existing development with mixed-use to densify and bring residential units into the commercial district. This will also create more opportunity for small commercial spaces.
spAce FoRecAst
Farwell
This commercial corridor has an interesting mix of retail and service businesses including a bank, a commercial strip with Ace Hardware and a small cluster of health and wellness businesses (plus a sandwich shop and a realtor), a carwash, laundromat, physical therapy clinic, automotive repair and supply, and a nicely done mixeduse development with an investment firm, gallery and restaurant. At the time this plan was created, a second phase of the Atwater was under construction and includes a multi-tenant 12,000 square feet commercial retail building. The properties across the street from the Atwater, are less densely developed and would be candidates for redevelopment in a similar mixed-use fashion as the Atwater.
Siggelkow (west of Hwy 51)
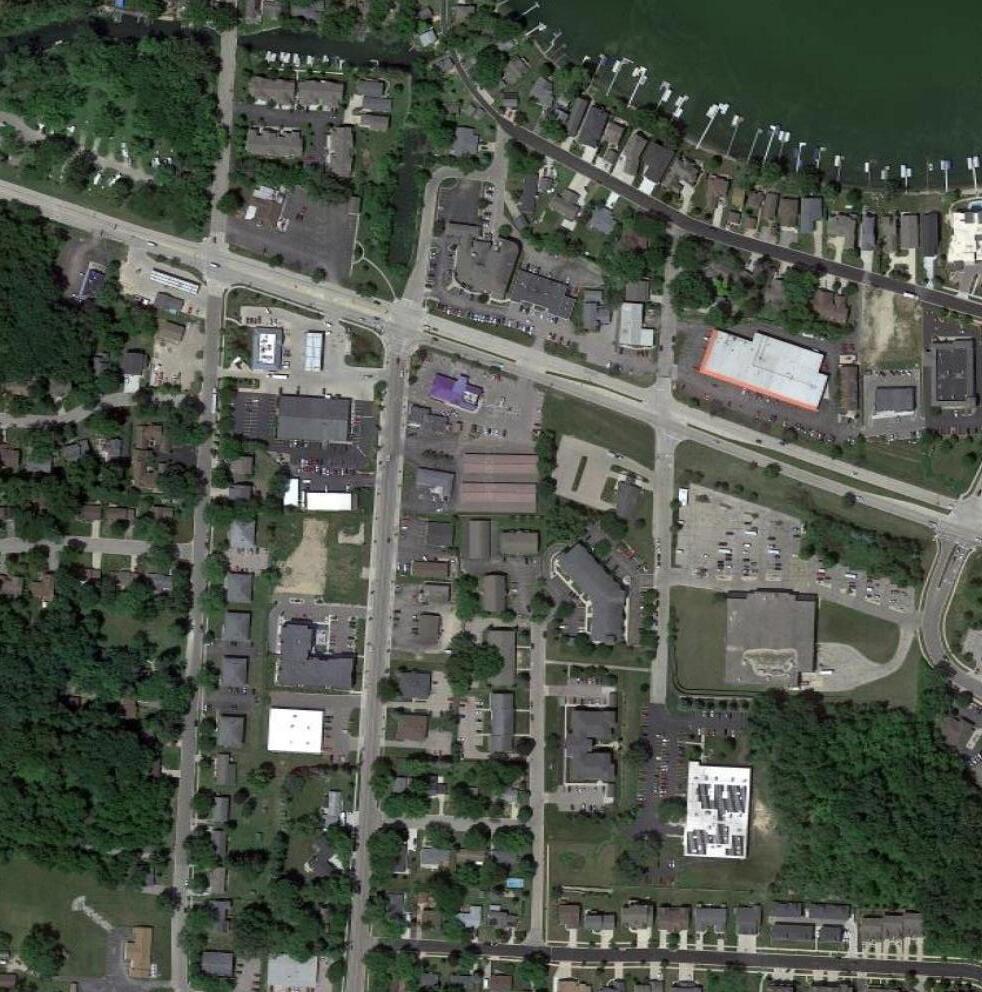
This commercial area is smaller than US Hwy 51 and Farwell areas. The mixed-use lakeside neighborhood includes several iconic restaurants including two restaurant/banquet (one currently closed) and another bar and grill. This neighborhood also includes several recreational amenities that draw residents and visitors including the Lower Yahara River Trail, Brandt Park, and the lakeside McDaniel Park. Recent redeveloment projects include a new mixed-use development (Waubesa Village) consisting of over 100 new residential apartments,
29 commeRcIAl/RetAIl
Image Source: Google Maps (2023) of State Highway 51 in McFarland, WI.
a daycare, engineering office, and investment firm. Due to the proximity of this neighborhood to US 51, the existing restaurants, lake access, and recreational amenities, there are more redevelopment opportunities for higher density residential, mixed-use and commercial development, as identified in the Village’s 2005 Terminal & Triangle Plan. For example, areas east and west of the Waubesa Village development and around the two Village parks. The Lower Yahara River Trail, Brandt Park and McDaniel Park are community assets and prime uses for Lake Waubesa waterfront. The park amenities are nicely done, with shelters, playground equipment, a sand volleyball court and bicycle rentals near the trail.
Downtown
As the heart of the community, the Downtown has more of a boutique/destination feel to it. There are several civic uses including the Village Municipal Center, Library, Historical Society, Post Office, and a Museum as well as a cafe, barber and salon, pizzeria, tavern, real estate offices, and a lumber yard.
The amount of commercial business located within the Downtown is modest for a community the size of McFarland and is partly a reflection of an under supply of commercial buildings. There are two commercial buildings that have been vacant for several years, 5902 and 5906 Main Street, that could be redevelopment opportunities, or simply need re-tenanting. The Village is currently completing a study of their Municipal Center to transition the portions of the building currently utilized for Fire, EMS, Police and Municipal Court services into a new multi-generational community center. Creation of the community center would further strengthen the Downtown as the civic hub of the Village and drive more residents and visitors to the Downtown daily, which in turn will create increased demand for new commercial and mixed-use developments. The lumber yard and several of the older residential lots present opportunities for redevelopment to higher density residential, mixeduse, and commercial development.
Destination retail and restaurants will do well and fill spaces within the downtown. For future business recruitment activities, the recommended strategy to encourage destination retail and restaurants is to secure space in the downtown area. This will further enhance the downtown’s ability to cater to visitors as well as residents.
the downtown than in the convenience retail areas, it is desired to have multiple places residents and visitors can visit in one trip by walking from store to store for public parking lots.

East Side
For new developments proposed in the East Side neighborhood, commercial and mixed-use developments will need to carefully plan their commercial space and aggressively market to appropriate tenants. Retail and restaurants follow residential density because they need to know there is an existing customer base they can easily access. Retail in a vertical development with multifamily creates a built-in customer base for the retail/ commercial tenants in any multi-family development, but these developments must attract customers from the community as well. Small market/bakery/specialty food stores, personal care businesses such as salons, coffee shops, microbrewery/winery/distillery, and experiential retail work well in these mixed-use spaces because they serve nearby residents but also draw customers from elsewhere in the community.
A projection for the amount of retail/commercial square footage which could be absorbed in McFarland’s Eastside Neighborhood is as follows:
These projections were based on how much commercial space a community the size of McFarland can support, existing demand and supply exists for industrial/business park space, and current absorption rates in the Madison metro-area. Within a business park, it is projected that there would be the demand for 870,000 – 1,500,000 square feet of industrial development plus approximately 50,000 square feet of big box or medium box commercial (retail, restaurant, service) development. Outside of the business park, there could also be free-standing restaurants, service (medical, personal care), or retail space totaling 40,000 square feet. Within mixed use developments where commercial space would anchor multi-family residential developments, the community could likely support 18,000 square feet of retail or commercial space.
30
Sq. Ft. Total Acres Commercial 40,000 2 Mixed-use 18,000 1 Business Park Industrial 870,000-1,500,000 40-100 Commercial 50,000 3
Photo Credit: Village of McFarland Facebook Page
Type
Table 2.2 Commercial Space Projections
Table 2.1 Commercial Space Projections Source: Redevelopment Resources
4 rE/dEvELopmEnt opportunItIES
31
31
IndUstRIAl lAnd sUpplY
McFarland
The Village of McFarland’s existing land zoned for Manufactured Intensive Commercial, Highway Commercial, and Commercial Park is primarily located along Hwy. 51 at the north end of the Village. The property is fully developed. Occasionally there is a vacancy within an existing building, but turnover is not high.
There is one active listing as of 2/9/2023 for a pair of vacant lots, already approved for multi-family residential at the south end of the area zoned for Manufactured Intensive Commercial. This property is zoned for planned unit development in the middle of Manufactured Intensive Commercial and Highway Commercial zoning. It is also located in TID 3. However, the expenditure period for TID 3 has ended.
The Village does not have land which is readily available for commercial or industrial development, in small or large parcels. (See map on next page.) To be competitive for new development and future Village growth, it is imperative the Village plan for new land, acquire it, and install infrastructure as soon as possible. Opportunities to identify land on the east side of the community put McFarland in the game since the land is visible from the interstate and has fairly easy access to transportation corridors. Identifying and preparing the land is significant, however, marketing it and exposing it to developers and end users is just as important. Information about this land should be marketed even before it is ready for development because the planning process on the developers part also takes time.
Industrial Land Supply
Available Acres Price/Sq.
Peer Communities
Three area industrial parks were surveyed to understand their inventory, pricing structure, and negotiating tactics. Cottage Grove, DeForest and Stoughton were the communities included in the inventory.
Cottage Grove
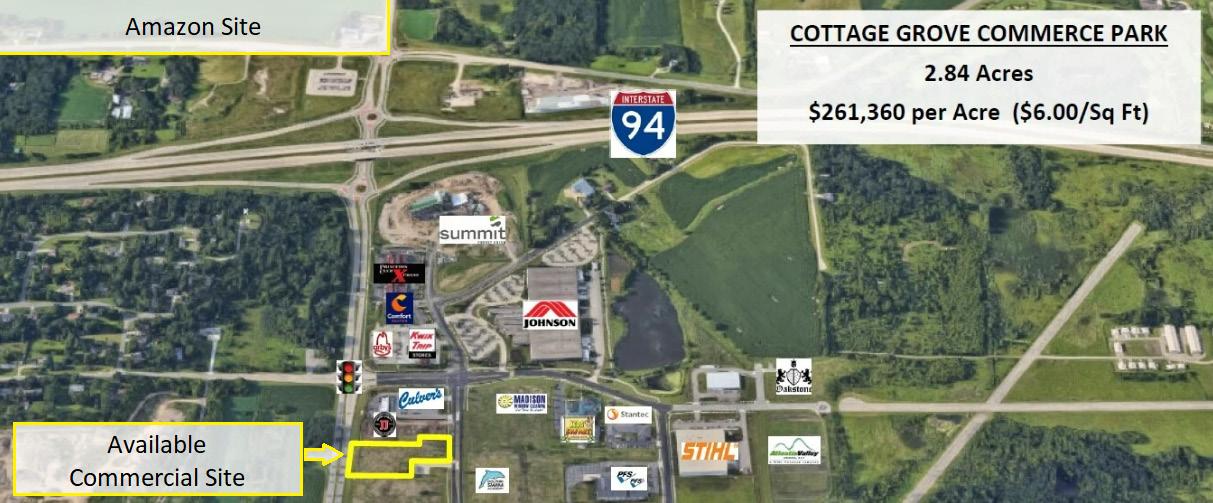
The Village of Cottage Grove does not have any publicly owned industrial park property available. Their original Commerce Park has one commercial site available but there is an accepted offer on that site. That particular commercial site is 2.84 acres and will sell for $6/sq. ft., or $742,262.40.
Also marketed by the community are several privately held sites, including a large commercial park recently purchased by Amazon on the southwest corner of the interchange at I94 and County Hwy N. Construction is expected to begin on the Amazon distribution center next year, and it was reported that Amazon acquired the entire site, however there are additional commercial sites available surrounding the proposed development (privately held).
There is no other available business park property being marketed in Cottage Grove with Interstate access and visibility.
32
Ft. Cottage Grove 2.84 (commercial) $6.00 DeForest 24, 7, 5, 2 $1.50-$.175 Stoughton 4, 2 $1.38 McFarland 4.3 (PUD) $8.20
Community




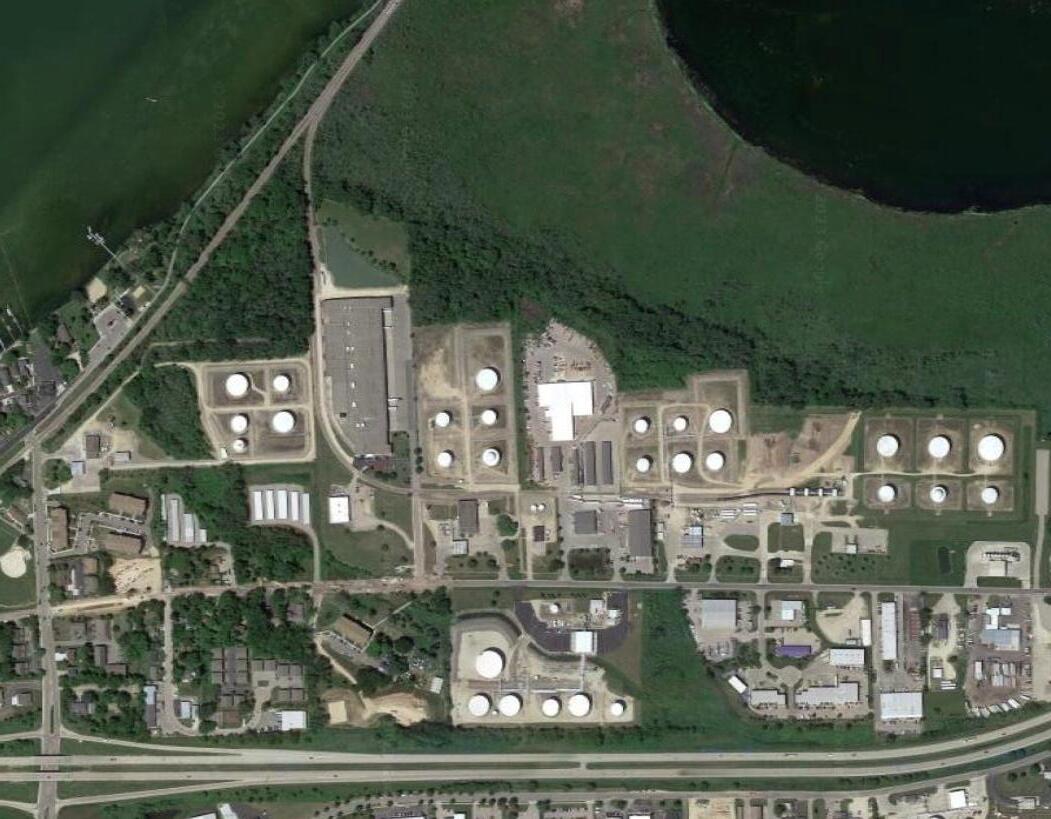


33 Z o n i n g T I D 3 P a r c e l s P D M1 C T I D 4 P a r c e l s CG C o n s e r v a n c y P DI CC R1 A R2 T I D 5 P a r c e l s CG CH CL I n d u s t r i a l P r o p e r t y F o r S a l e B o u n d a r i e s M c F a r l a n d T I D 3 T I D 4 T I D 5 M c F a r l a n d T I D M a p D S a r v e r F e b r u a r y 9 , 2 0 2 3
DeForest
The Village of DeForest has approximately 40 acres of industrial park property split up as follows: 24+ acre site, 7 acre site, 5 acre site and a 2 acre site. These are certified sites through the WEDC Certified Site program. The large site is served by rail and there is a possibility that a spur could be provided to a development on that site. The Village of DeForest generally expects a development to generate $850,000 of value per acre. There is no set price for the land, and each deal is negotiated based on its merits. The three most recent transactions have earned the Village a price of $1.50 - $1.75 / sq. ft. or approximately $65,000 - $76,000 per acre for the land.
Stoughton
The City of Stoughton has two industrial park properties available, 4.43 acres and 2 acres. They are marketing the properties for $60,113 per acre. The sites identified on the map below are served by city water and sewer. The City does not have any other publicly owned property for sale but is responsive to and supportive of development which occurs on privately owned property within the City, or adjacent to the City. The City recently annexed and approved incentives for a cheese plant which proposed to construct a facility on a parcel near their existing industrial area but not originally in the City. That property is currently under construction.


34
tId AnAlYsIs
McFarland currently has three open Tax Increment Districts (TID). As previously stated, the expenditure period for TID 3 has ended and it is set to close in 2027. Since it was created in 2004, it has generated over $66.7 million in additional tax revenue for the Village. Most of the district has been fully built out (Table 3.1).
TID 4 was created in 2008 as a funding mechanism to redevelop and address physically blighted properties and pedestrian access to complement the Village’s investment in the Civic Campus. Improvements to Arnold Park and some commercial property improvements have helped increase the taxable value generated, but there is more
RedeVelopment
There is opportunity to strategically target redevelopment within TID 4 and TID 5. Blighted and vacant parcels which could support a higher and better use should be evaluated for potential redevelopment. This would first entail an interview with the property owner to discern their interest and ability to invest in improvements or sell the property for redevelopment by another party. One creative approach often taken by municipalities to entice redevelopment and/or investment in rehabilitation, is for the Village to commission an architectural rendering of what the property could become, a future vision, so to speak. Once the vision for the property is tangible, it aids the property owner in decision making as to whether or not they are willing and able to undertake the project.
Financial analysis regarding future revenue potential presented to the owner goes a long way to help them understand their long-term financial benefits of investing in their property. If they can see their investment paying off, and they have the capability to initiate and follow through with the redevelopment, they could come on board. If the property has been vacant and neglected for a long time, it’s likely the owner is not interested or capable
work yet to be done.
Adopted in 2017, TID 5 was created to carry out various redevelopment, rehabilitation, conservation and urban renewal projects within the District, or within 0.5 miles of the boundary of the District. Infrastructure improvement projects included the reconstruction of Farwell Street in 2018, streetscape improvements, and improvements to storm water management basins. The expenditure period will end in 2039. Since the TID’s creation in 2017, $13.0M in additional tax increment has been generated. That is partially due to the completion of Phase I of the Atwater project in 2021. Phase II will be completed in 2024.
of rehabilitating or redeveloping the property. At that point, appropriate next steps would be encouraging the property owner to list their property for sale or having the CDA acquire the property.
If the CDA is not interested in acquiring the property, the Village should support the marketing of the property as much as possible. Direct outreach to rehab specialists or developers who would be well-suited for redevelopment is encouraged. If there are multiple buildings next to each other, there could be a larger, more impactful redevelopment opportunity available.
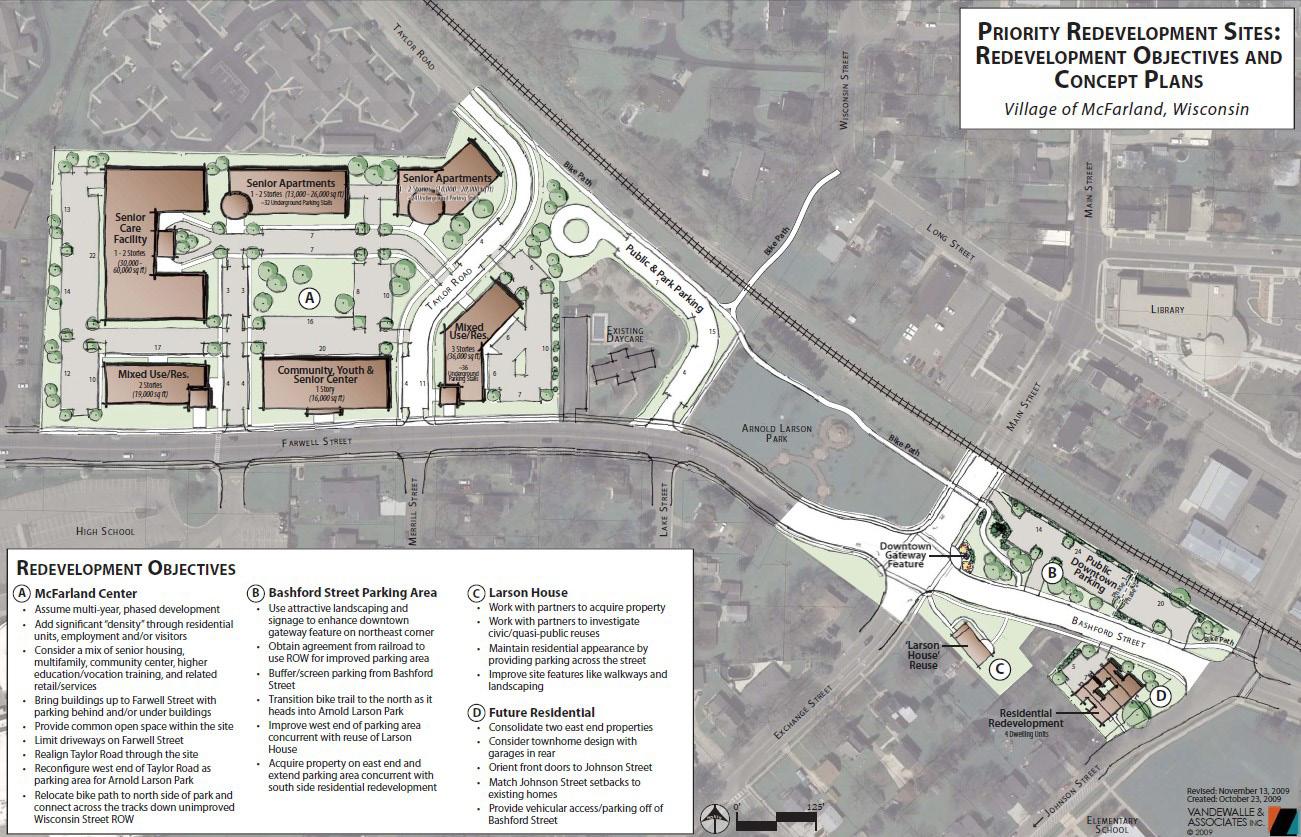
Since many of the parcels within TID 4 are also considered blighted within Redevelopment District #2, these properties are prime candidates for acquisition and redevelopment, or significant rehabilitation. The Village should review the proposed redevelopment concepts from the redevelopment district plan, (McFarland Center, Bashford St. Parking Area, Larson House and future residential from page 22 of Redevelopment District #2’s plan) and if they are no longer feasible or desirable, proactively target other redevelopment opportunities.
35
TID # BASE YEAR BASE VALUE INCREMENT VALUE CURRENT VALUE PERCENT CHANGE FROM PREVIOUS YEAR 003 2004 $26,997,400 $66,652,700 $93,650,100 25 004 2008 $7,583,100 $6,065,700 $13,648,800 8 005 2018 $17,030,100 $12,970,400 $30,000,500 11
Table 3.1McFarland TID Statement of Changes
Source: Wisconsin Department of Revenue
5906MainSt. Image Source:GoogleMaps.

For example, the properties at 5902 and 5906 Main Street should be evaluated for their potential redevelopment. Following a conversation with the property owner, they could be evaluated for their likely redevelopment by either rehabbing the existing structures or replacing them with new construction in a more comprehensive redevelopment. The fiscal impact to the TID would be significant, and new construction downtown would draw tenants who could afford the rent a new construction project would demand.
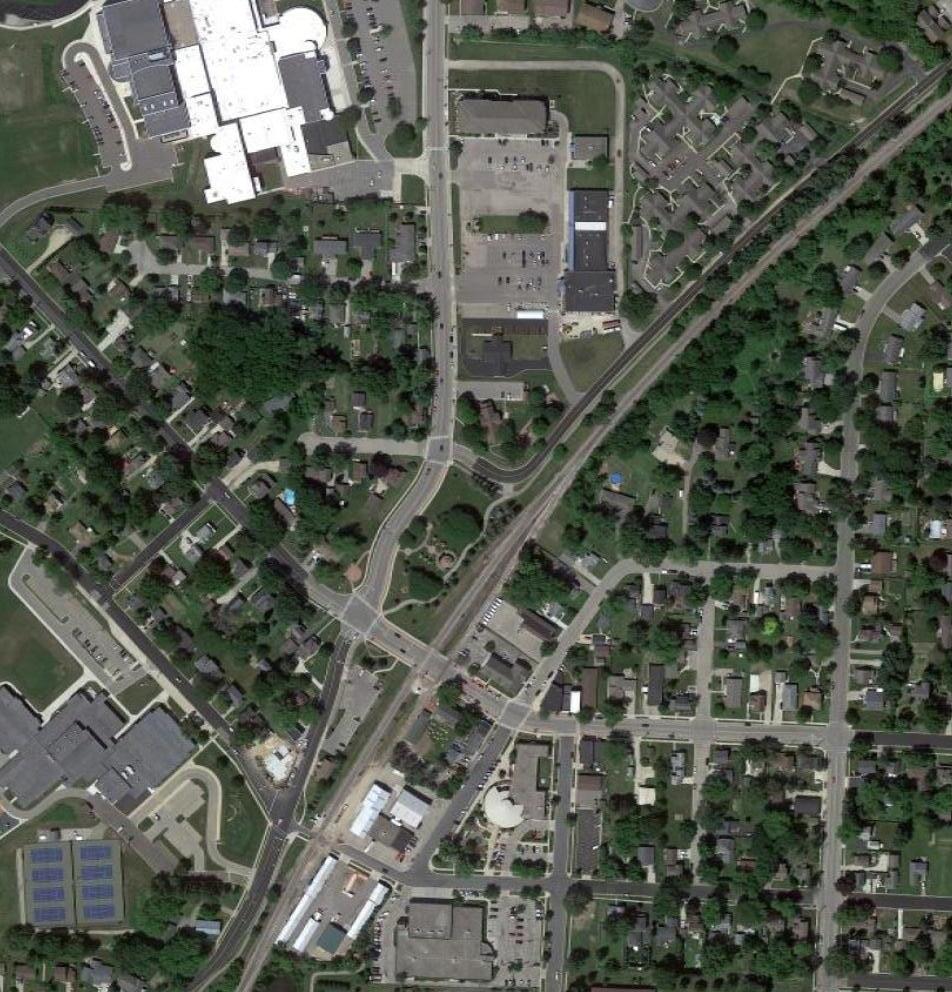
An inventory of redevelopment opportunities by property should be conducted, starting with the properties which are designated as blighted in the Redevelopment District Plans and including properties which have become a concern since those documents were created and approved. For example the images below show Google map images of the area in Redevelopment District No. 2 recommended for redevelopment.

36
Image Source: Google Maps (2023) of Farwell St. and Taylor Rd. in Redevelopment District No. 2 and TID 4
rEcommEndatIonS
37
5
37
RecommendAtIons
Given the data compiled during this process and insights into the regional strategy, the following recommendations are offered to the Village of McFarland, with the primary goal of increasing investment and economic activity in the Village.
Strategy: Focus on Improving Quality of Life
Quality of life – (according to the Brookings Institute) community amenities such as recreation opportunities, cultural activities, and excellent services (e.g., good schools, transportation options) are likely bigger contributors to healthy local economies than traditional “business-friendly” measures. A focus on this aspect of economic development is becoming a more powerful force in practitioners’ toolboxes than those activities that previously received the attention for growth in communities. After estimating quality of life (what makes a place attractive to households) and quality of business environment (what makes a place especially productive and attractive to businesses) in communities across the Midwest, researchers at the Brookings Institute found quality of life matters more for population growth, employment growth, and lower poverty rates than quality of business environment.
The Village of McFarland should focus on improving quality of life for its residents in order to facilitate residential growth, which will support business growth and a thriving local economy. We recommend the following activities to foster the quality of life in McFarland:
Organization:
1. Implement recommendations from the Outdoor Recreation and Open Space Plan (2019-2023), the Community Park and McFarland Park Master Plan (2021), Inclusive Playground Master Plan (2020), Public Facilities Needs Assessment for Parks (2020), and McFarland Aquatic Study (2019).
2. Work with private developers, the Parks department, the Chamber of Commerce, Historical Society, and regional arts groups to incorporate indoor and outdoor place making features, such as murals, sculptures, historical and educational markers and signage to enhance McFarland’s sense of place.
3. Ensure bicycle and pedestrian mobility is safe and accessible throughout the Village.
4. Village staff should work with McFarland Recreational Activities and Play (MRAP) to support and promote programs.
Funding:
1. Investigate and secure grant funding from state sources (DNR, WEDC, and Dane County), to improve recreational amenities such as bicycle trails, kayak launch, beach enhancements and other waterfront amenities.
2. Support physical improvements to community amenities (e.g. decorative street lighting, benches, and crosswalks) through excess TID revenue.
3. Seek out public-private-partnerships on improvements to specific recreational amenities by securing private donations or corporate sponsorships.
Business Recruitment:
1. Seek opportunities to recruit arts and culturerelated businesses such as dance studios, music instruction businesses, and experiential retail (such as paint & sip, ax throwing, or music studios/improv lounges).
2. Recruit kayak, snowshoe, cross country ski, paddleboard, and bicycle rental businesses.
3. Work with the public library to enhance their business incubation services by seeking funding for 3-D printing equipment, or graphic arts computer design equipment.

38
Photo Credit: Unsplash.com
Events:
1. Facilitate opportunities for existing events to leverage one another’s exposure. For example, connect the food pantry to Bands by the Boardwalk.

2. Through the coordination of the implementation of existing plans, bring in partners (non-profit organizations, school clubs, church groups) to create and schedule events to bring exposure to the great quality of life in McFarland.
3. Look for opportunities to tie the community in to the new Sustainability Campus and ways for residents to get involved with enhancing sustainability through the circular economy.
Marketing:
1. Promote large events on the home page of the Village of McFarland’s website, and link to sponsoring organization.
2. Promote all events listed on the community calendar via Village social media to create the impression that the community shares all aspects of quality of life.
3. Create short instructional/educational videos on using the Village’s parks and recreation assets, playgrounds, public library services, and other public amenities.
4. Market Village ties with the Dane County Sustainability Campus on the Village website.
Redevelopment Sites/Opportunities:
1. Eliminating blighted properties throughout McFarland will work to improve quality of life. Annually drive the community to seek out severely blighted properties, research ownership, contact owners and develop a plan to either secure commitment to improvements from owner, or plan for property transition.
Infrastructure Improvements:
1. Capitalize on the natural amenity offered by Lake Waubesa. Enhance access to the lake for four season activities. Work with Parks Dept. or outside entities to create opportunities for residents to use the Lake year-round and market those opportunities on the Village website.
2. Ensure way-finding signage directs residents and visitors to downtown, all parks and commercial areas, trails and paths, and public facilities.
3. Where bike paths are not available, plan for bike lanes on Village streets.
Strategy: Expand Commercial and Industrial Land Base
Expanding the land available for commercial and industrial development is an invitation for investment which facilitates wage and income growth, growth in the tax base, and quality of life for residents. Expanding the land base allows for existing businesses to grow locally - retaining the relationships between themselves and their labor force as well as the communities that have nurtured them. Additionally, land availability can be a competitive advantage to attract outside investment into the community.
The East Side Plan positions the Village in a unique position to program new commercial and industrial land uses. With only has one remaining vacant industrial zoned property, McFarland’s east side is prime for development to meet the needs of the community and the region for the next several years. Sites of six to ten acres each, with interstate visibility will be highly sought after and meet the needs of industrial expansions/site searches which are being conducted in the area. Utility extension, road construction, and the potential creation of Tax Increment Districts will need to be done in tandem with development.
Organization:
1. Identify, acquire, zone, and install infrastructure on new land for commercial and industrial uses.
Funding:
1. Prep for creation of a new TID or TIDs on east side and Terminal/Triangle district.
2. Leverage existing TIDs #4 & #5 for mixed-use Downtown and Farwell Street redevelopment, including leveraging excess increment from TID #3.
Business Recruitment/Marketing:
1. Marketing available industrial and commercial land on the east side will be instrumental
39
Photo Credit: Unsplash.com
in recruiting businesses. Focus on sectors supported in Advance 2.0 strategy including advance manufacturing, bioscience, ag/ food/beverage, information technology, and healthcare.
Re/development Sites/Opportunities:
1. Inventory opportunities for redevelopment by starting with properties already designated as blighted in the existing redevelopment district plans.
Infrastructure Improvements:
1. Typical infrastructure including streets, streetlights, water, sanitary sewer, storm water, plus high speed communications infrastructure is necessary.
Strategy: Work with MadREP on Business Attraction for Primary Industries
McFarland is in the unique position to be programming new industrial space in the community via the East Side Plan. Property along McFarland’s east side is available and prime for development to meet the community’s needs for the next several years.
The following strategies are recommended to attract business to the Village to continue its economic growth most effectively.
Organization:
1. Meet with MadREP bi-annually to review primary industries, current situations with metroarea wide space availability, and to promote McFarland’s space offerings and amenities.
2. Establish a close working relationship with MadREP so McFarland staff members know when a Village site is being submitted for a statewide or regional site search.
3. Forge partnerships with businesses incubating (startups and early state companies) at the Sustainability Campus in an effort to facilitate their future location within the Village.
Funding:
1. Tax Increment Financing is the Village’s best tool for business attraction. Prepare for new TID creation in East Side Growth areas for industrial development and mixed-use development.
2. Prepare a list of non-monetary incentives the Village can offer to businesses, such as access to utilities, efficient approval processes, access to
gap financing (if available), technical assistance on storm water management, grant writing services if available, and the Village’s willingness to support an industrial revenue bond request, or other WEDC program requiring municipal participation.
Business Recruitment:
1. Position the Village as a competitor to other mid-sized communities with interstate visibility. Market property through local brokers and collaboration with MadREP.
2. Engage with the Dane County Sustainability Campus – become a strategic partner to the Dane County Sustainability Campus. Stay close to the developments which locate there and work to attract complementary uses to McFarland’s business/industrial park.
Events:
1. Attend appropriate business attraction marketing events sponsored by MadREP.
2. Attend Mid-America Economic Development Competitiveness Conference held annually in December and make a point to connect with site selectors in primary industries.
Marketing:
1. Work with MadREP to understand the best way for the Village market its available sites for site searches and to developers. Stay top of mind with MadREP so when an opportunity comes up to locate a business in Dane County, MadREP thinks first of McFarland.
2. Ensure the Village website has quick and easy links to any newly available information on development or redevelopment sites.
3. Research and learn which developers/contractors build for businesses in primary industries and proactively market to them.
4. Work with MadREP to leverage their marketing efforts for the Village and enhance opportunities to connect with new prospects by promoting with MadREP and developing relationships with contacts they are marketing to.
5. Market the Village’s new business park space to companies innovating and growing in the circular economy.
6. Share future plans for Village development in a prominent location on the website.
7. Create a downloadable pdf marketing piece on the community so brokers can attach it to site searches. The piece should clearly list the
40
benefits of locating a business in McFarland and showcase Village efforts to grow the local economy.
8. As new space is created, it will be important for the community to assist the developer in marketing their space. Whether it is industrial/ business park space, or new retail/commercial space within a mixed-use development there are things the Village can do to help find new tenants.
9. Keep the Village website as up to date as possible and identify a section for available space in the community. This can be done in collaboration with existing property owners and brokers.
Redevelopment Sites/Opportunities:
1. Keep a database of businesses and property owners in the US Highway 51 corridor to identify opportunities for potential redevelopment and re-marketing.
Infrastructure Improvements:
1. Develop industrial/business park space –McFarland should maximize its opportunity to develop new industrial and/or business park space on the East Side. There is little vacant shovel ready land available in the County to accommodate industrial development. Given McFarland’s location with land visible from Interstate 39/90, land should be programmed and zoned for light industrial, R&D and office development.
a. Identify, zone, and prepare for development approximately 40-100 acres of light industrial /business park property.
b. Individual parcels should be sized between six (6) and ten (10) acres each.
2. Shovel-ready sites will help the Village more quickly and easily market and sell industrial development sites to new businesses. There are two programs through which McFarland could develop shovel-ready sites.
a. WEDC offers its Certified in Wisconsin® program which prequalifies sites of 50 acres or more as “shovel ready” to set consistent standards for the certification of industrial sites, putting in place all the key reviews, documents and assessments most commonly required for industrial use. This program can entail a significant

investment of time and financial resources to certify certain attributes of the site such as endangered species, wetlands, utilities access, soil contamination, flood plain, distances from major transportation resources, zoning pre-approvals, available incentives, and other attributes.
b. MadREP’s Gold Shovel program employs similar criteria as WEDC but at a lower cost and generally requires one level of verification compared to the more rigorous level of the certified program.

Strategy: Invest Resources on Business Retention and Expansion
Existing businesses account for 80% of a community’s growth. This statistic has been proven over the years and it is a solid strategy to focus time and energy on business retention so the businesses that already exist in a community will grow and thrive there.
Organization:
1. Community & Economic Development Department staff should be meeting regularly (annually) with all employers in the Village, to understand their business needs and how the Village can support their continued growth in the Village.
2. Add additional staff to the Community & Economic Development Department or create a Business Retention/Expansion (BREV) team to complete the annual visits. The team could be comprised of Village Administrator, C&ED Director, Village President, CDA Chair, Chamber President and Chamber Executive Director. Two or three members of the team could visit businesses together. Members will need training on how these meetings should be conducted for best practice and consistency across all team members.
3. Maintain a database of retention visits so that there is a record of the top needs of businesses in the community which can be used to shape future strategy.
4. Work with brokers and existing building owners/ landlords to keep a database of all the businesses and available space in the Village, and to market that space to new and existing businesses.
Funding:
1. This activity should not require funding beyond staff time, unless it becomes apparent that
41
the Village needs to expand its Community & Economic Development Department staff.
and outdoor recreational facilities for residents, and making sure businesses have the workforce they need to grow.
Organization:
1. Implement the recommendations made in the Housing Needs Assessment accompanying this report.
2. Maintain an ongoing conversation with residential real estate brokers to stay current on residential real estate trends.
Business Recruitment:
1. Business recruitment may stem from the Business Retention/Expansion activities if it is learned through a business visit that there is an opportunity to recruit a business to the Village that would support the growth of an existing business. These opportunities should be capitalized upon expeditiously.
Marketing:
1. By marketing a Business Retention/Expansion program on the Village website and through social media, businesses will understand the Village cares about their presence and continued growth in the community and will be more open to an annual visit from a Village representative.
2. Through the website and social media, let businesses know staff is interested in meeting with them and for them to contact the Village if they have a pressing need prior to receiving a call to set up an appointment from Village staff.
Redevelopment Sites/Opportunities:
1. Through business retention/expansion visits, Village staff may become aware of redevelopment opportunities. These should be logged and strategized with the property owner and then marketed for a new businesses or use.
Infrastructure Improvements:
1. Through business retention/expansion visits the Village will learn of any potential infrastructure improvement necessary to support existing business growth.
Strategy: Facilitate Development of a Balanced Housing Stock
Economic Development is not just business attraction and retention. The entirety of the economy benefits from having adequate housing stock, ensuring there are indoor
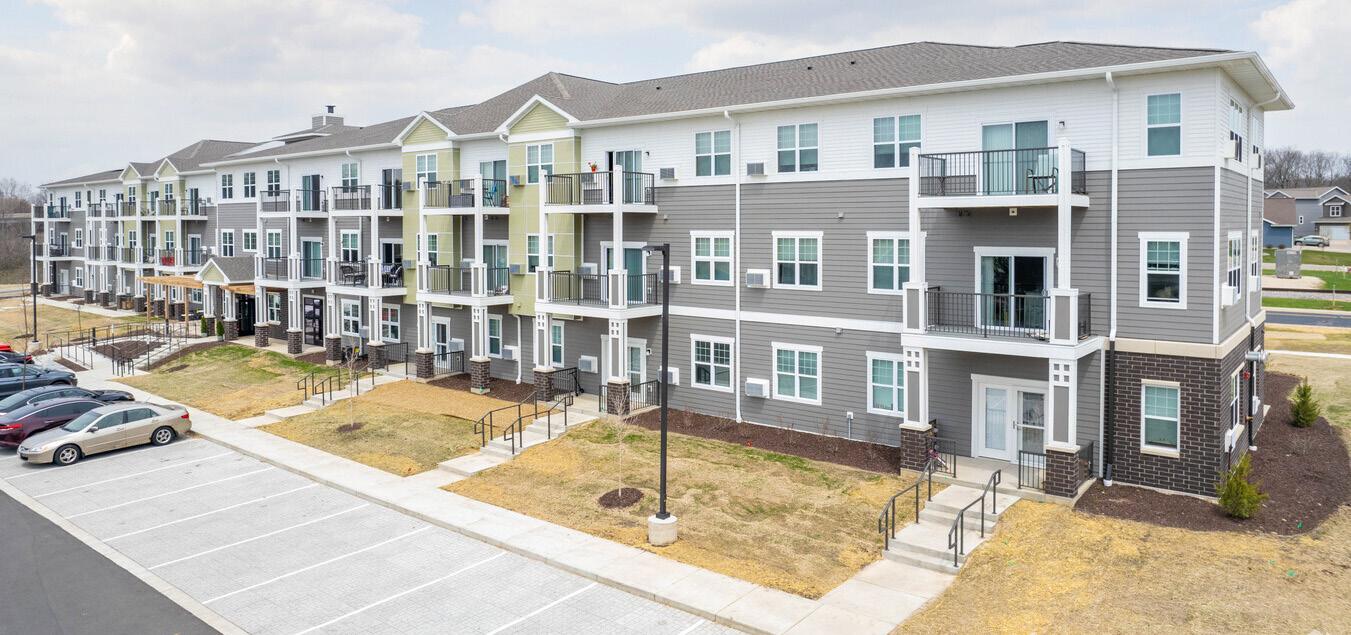
Funding:
1. Investigate the opportunity to use CDBG funds for residential infill development or homeowner rehab in lower income neighborhoods.
2. Develop a local affordable housing fund.
3. Utilize TIF affordable housing extensions prior to closing TIF districts.
Events:
1. If workforce recruitment issues are discovered through BRE visits and appear to be a Villagewide challenge, work with the Chamber to host a recruitment fair for interested employers.

Marketing:
1. Market new housing development opportunities to developers and new residents on the Village website. Include when new housing developments will be available and a list of community benefits which exist in McFarland.
2. Promote jobs being created and those which are available within the Village on the Village website as a celebration of success related to workforce attraction in the community.
Redevelopment Sites/ Opportunities:
1. Document and cite code violations.
2. Document blighted residential properties and develop a Village program for rehab or acquisition and redevelopment.
42
Photo credit charlesdeluvio on Unsplash
4845 Taylor Rd, Mc Farland, WI Photo Credit: ForRent.com
Infrastructure Improvements:
1. Implement recommendations stemming from the East Side Growth plan as they relate to creating space for housing, mixed use developments, and open space.
Strategy: Attract New Commercial/Retail/Service Businesses
Attracting new commercial, retail, and service businesses isn’t something the Village should invest as much time in as the types of businesses MadREP is focused on in Advance 2.0. Attracting businesses to commercial/retail/ service space is more difficult than attracting industrial or office space. These businesses largely depend on a mass of humanity to determine their location decisions. Large housing developments and more densely populated areas attract retail businesses, restaurants, and other services to meet the needs of residents in the community.
Organization:
1. Community & Economic Development Department staff should maintain a database of available property and the type of businesses best suited for each property.
Funding:
2. This activity should not take more funding than simply the expenditure of staff time.
3. If incentives were offered in the commercial, retail, service category of business attraction, they could be for the overall development of space, or used to entice a specific type of business which would help McFarland meet a specific goal; to improve quality of life, for example. The Village could establish an incentive (from TID funds) to incentivize arts/culture or recreation related businesses.
Business Recruitment:
1. For new space created in mixed use buildings, the most successful tenants will be those who provide day to day services or unique retail experiences to their customers.
a. Market spaces to businesses that show up in the high gap categories mentioned in the retail gap analysis previously
in this study; primarily health and personal care stores, clothing stores, hobby/book/sporting goods/musical instruments, shoe stores, and jewelry stores. There is a potential market for a clothing business in the Village. However, population, brand and comparative shopping opportunities generally dictate where clothing stores locate. Most residents leave McFarland to do this type of shopping since there are many clothing and accessory store options nearby in Madison. There are also a few department/big box stores nearby in Madison which offer these goods (e.g., Walmart, Kohls, etc.). Another point for consideration is that more and more clothing purchases are being done online (vs. in a “brick and mortar” store). Therefore, this opportunity may prove to be unsustainable, unless as noted elsewhere in this report, the proprietor cultivates complementary online business, and the business can pull customers from beyond the McFarland trade area. This generally requires a boutique selling unique items not found at major retailers or a chain retailer (with brand recognition and marketing dollars) that is not present within 30 minutes of McFarland.
b. Health care services such as orthopedic clinics, physical therapists, and other outpatient providers are solid tenants who will serve the community.

c. Health and Personal Care Store: This category includes pharmacies, drug stores, cosmetic/beauty supplies, optical products, etc. The likely market is for a smaller specialized business (e.g., cosmetic/beauty supplies and optical products), as drug store/pharmacy requires significantly more sales on average to be successful (see Business Demand Table).
d. Pet and pet supply stores are typically recession proof businesses which cater to peoples’ passion, their pets.
e. Hair/nail salons and barbershops: These businesses thrive in numbers in any market, as proximity, local preference and customer service are most important to a sustainable business. More importantly, individual businesses generally have a limit to the number of clientele it can serve based on the typical
43
Veridian Rosewood Fields Neighborhood Photo Credit: Veridian
1-5 employees per business.
f. Chiropractic, Dentist and Doctor Offices: Another consideration should be given to services that associate with number of providers per residents, rather than retail gap. For instance, a local chiropractic, dentist and doctor office can support up to 1,500 patients (depending on insurance and coverage). Based on a Google search, the number of businesses in McFarland and in each of the comparable communities, it appears there could be demand for another [chiropractic, dentist and/or doctor office].
g. Coffee shops, wine bars, distillery tasting rooms and brew pubs are also successful in mixed use neighborhood developments, and if they create a reputation for a unique experience, and will attract customers from outside the community.

districts.
Redevelopment Sites/Opportunities:
1. The current site of Chase Lumber near downtown is a prime redevelopment site. Village staff should engage in conversation with company representatives to initiate or continue the discussion.
Infrastructure Improvements:
1. Facilitate development of mixed use and commercial developments in the East Side Plan as indicated in the conceptual plan for new development.
Marketing:
1. Marketing for retail, commercial and servicerelated businesses is best done by Village staff maintaining close contact with listing brokers who are marketing individual spaces. Provide brokers with market data from this study to support recruitment of tenants best suited to the new developments and specific business
44
Photo Credit: Roman Bozhko on Unsplash
appEndIcES
47 6
The Village of McFarland is located to the southeast side of the City of Madison in Dane County. The City of Madison is the seat of state and county government, home to the prestigious University of Wisconsin-Madison, Edgewood College, and Madison College. The client identified four communities in Dane County of similar size and characteristics of McFarland to compare various performance metrics. They are Cottage Grove, De Forest, and Stoughton.
Secondary Data Sources
U.S. American Community Survey (ACS)
The 5-year estimates represent data collected over a period of time providing more statistically reliable data for less populated areas. ACS was used to provide population, household and age information for McFarland and the comparison communities. The most recent available 5-year estimate period is 2016-2020.
Esri
Esri is the global market leader in geographic information system (GIS) software and geospatial analytics. Using a variety of comprehensive and complex public and private data sets, estimates for the current year are provided as well as five-year projections. Projections are based on updated data sets and past performance of accuracy. Esri was used to understand the educational attainment, occupations and income levels of McFarland and its comparable communities. The Consumer Spending Index, Retail Demand, Supply and Gap Analysis and Retail Demand Outlook were Esri reports for the McFarland Trade Area. At the time of these reports were processed, the estimates were for 2021 with projections out to 2026.
U.S. Bureau of Labor Statistics (BLS)
The BLS is a public data source for labor information including participation, employment, unemployment, wages, working conditions, etc. At the time of the labor force information was pulled from BLS, the most recent data was from 2021. Due to economic impact of COVID-19, we wanted to go back to the last economic recovery cycle and at least 10 years, thus the time period selected was from 2011-2021. BLS was used to illustrate labor force, employment, and unemployment rate data.
U.S. Census Bureau, OnTheMap Application
The OnTheMap application was used to understand where employees that work in McFarland live and where those that live in McFarland work. It was used to understand the commuting patterns of McFarland and possible labor shed.
Primary Data Sources
One-on-one interviews were conducted with identified stakeholders as well as community and resident surveys disseminated in conjunction with East Side Growth Area. The quantitative and qualitative data gathered from these resources were analyzed to validate the dated secondary data and inform the recommended strategies.
48 48
AppendIX A: metHodologY
AppendIX B: AddItIonAl dAtA
Data Source & Note: Figures B.1-B.10 are from Esri forecasts for 2021 and 2026; Consumer Spending data are derived from the 2018 and 2019 Consumer Expenditure Surveys, Bureau of Labor Statistics. The Spending Potential Index (SPI) is household-based, and represents the amount spent for a product or service relative to a national average of 100. Detail may not sum to totals due to rounding.
49
0 20 40 60 80 100 120 140
Figure B.1 Comparison of Average Amount Spent per Household on Food Expenditures ($)
Spending Potential Index Food at Home Food Away from Home
McFarland Cottage Grove DeForest Oregon Stoughton
$21.7 $17.5 $22.7 $26.8 $28.1 $15.4 $12.6 $16.0 $19.0 $19.6 $0.0 $10.0 $20.0 $30.0 $40.0 $50.0
Total Expenditures ($M) Food at Home Food Away from Home
Figure B.2 Comparison of Total Amount Spent on Food Expenditures ($M)
McFarland
Cottage Grove DeForest Oregon Stoughton


50
$0 $200 $400 $600 $800 $1,000 McFarland
Average Amount Spent ($)
Figure B.3 Comparison of Average Amount Spent per Household on Alcohol Expenditures
($)
Cottage Grove DeForest Oregon Stoughton
$0.0 $2.0 $4.0 $6.0 $8.0 $10.0 $12.0 $14.0 $16.0
Grove
Total Expenditures ($M)
Figure B.6 Comparison of Total Amount Spent on Travel Expenditures ($M)
McFarland
Cottage
DeForest Oregon Stoughton
Figure B.7 Comparison of Average Amount Spent per Household on Entertainment & Recreation Expenditures ($)
($M) $0.0 $0.5 $1.0 $1.5 $2.0 $2.5 $3.0 $3.5 McFarland
Total Expenditures ($M)
Figure B.4 Comparison of Total Amount Spent on Alcohol Expenditure
Cottage Grove DeForest Oregon Stoughton
$0 $500 $1,000 $1,500 $2,000 $2,500 $3,000 $3,500 $4,000
Average Amount Spent ($)
Figure B.5 Comparison of Average Amount Spent per Household on Travel Expenditures ($)
McFarland Cottage Grove DeForest Oregon Stoughton
Figure B.8 Comparison of Total Amount Spent on Entertainment & Recreation Expenditures ($M)
$0 $500 $1,000 $1,500 $2,000 $2,500 $3,000
Average Amount Spent ($)
Figure B.9 Comparison of Average Amount Spent per Household on Apparel & Service Expenditures ($)
McFarland
Cottage Grove DeForest Oregon Stoughton
$0.00 $2.00 $4.00 $6.00 $8.00 $10.00 $12.00
Total Expenditures ($M)
Figure B.10 Comparison of Total Amount Spent on Apparel & Service Expenditures ($M)
McFarland
Cottage Grove DeForest Oregon Stoughton
51


