
grainger's grainger's Deluxe Deluxe SOCIAL SOCIAL media mRecap edia Recap JULY - SEPTEMBER M2022 .S. WALKER BRANDS
Q3 AT A QGLANCE 3 AT A GLANCE

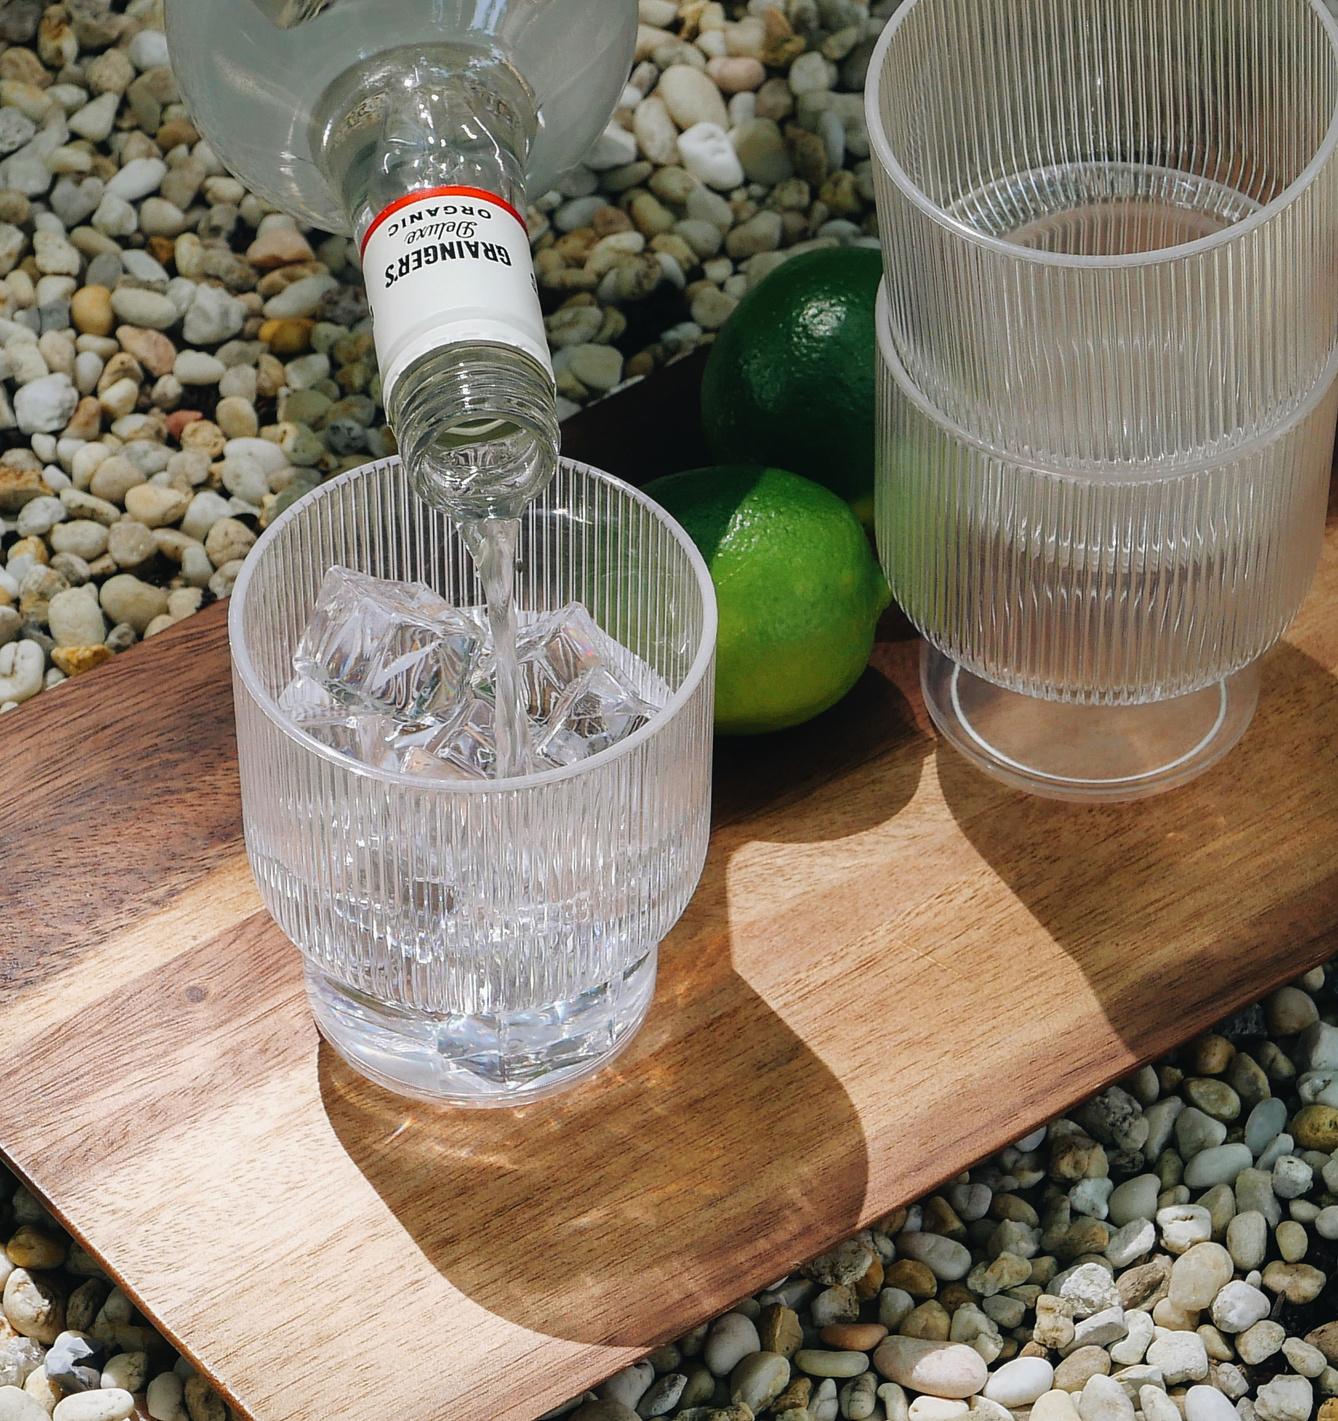
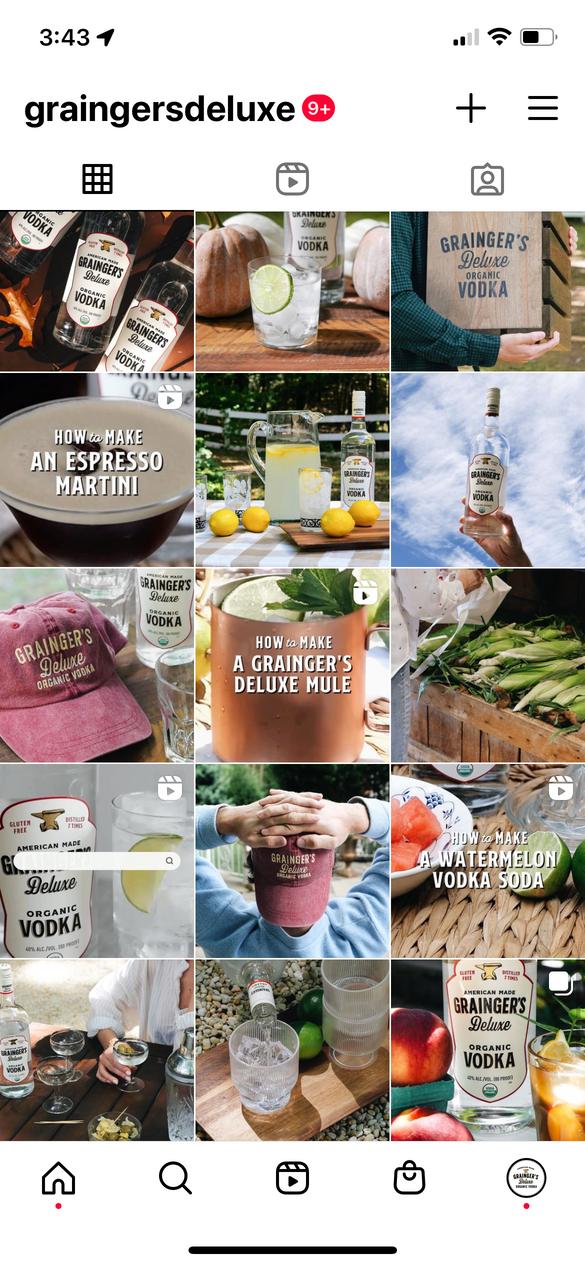
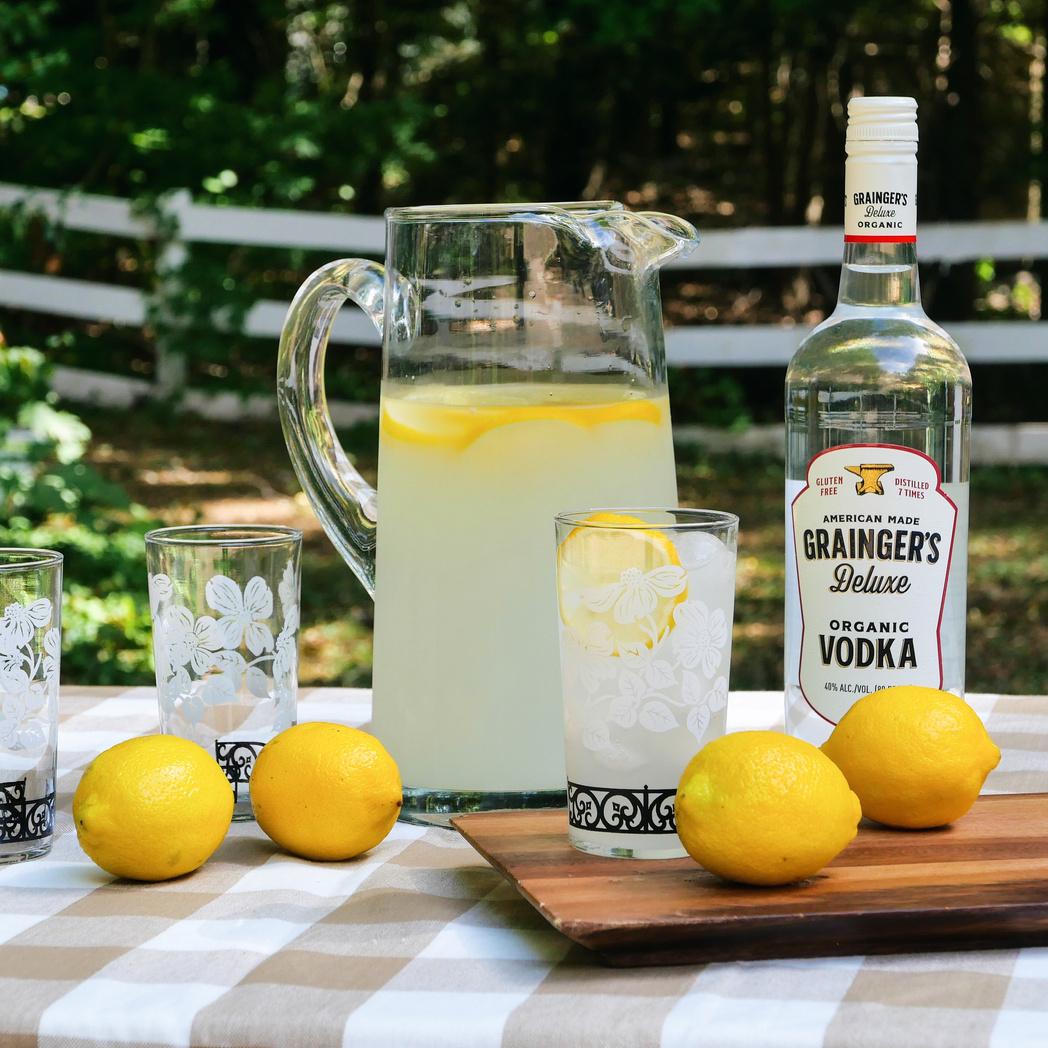
July, August & September brought sunshine & the outdoors to our content calendar with brightly lit lifestyle shots and bright summertime cocktails.
We ran our first Instagram giveaway for the brand, resulting in 987 entries and 257 new followers.
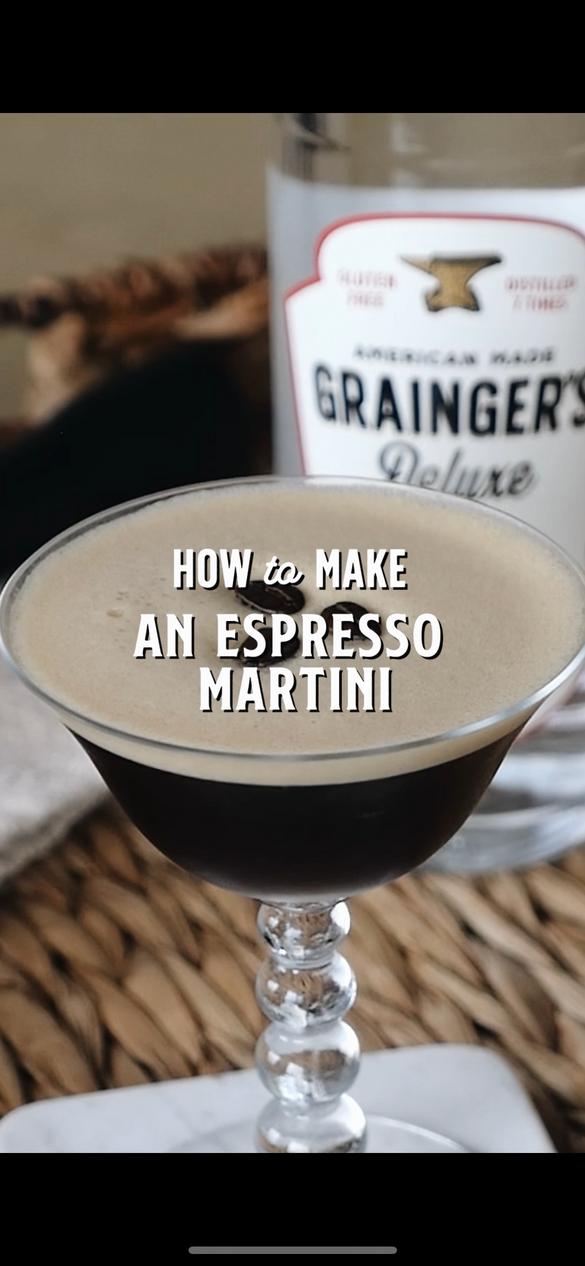
Instagram had multiple updates. The biggest change was the shift in video content, which is now exclusively shared as the Reel format – and this includes all past videos, stop motion and animated graphics.
Instagram also launched the ability to boost Reels, which will improve our social spending strategy moving forward.

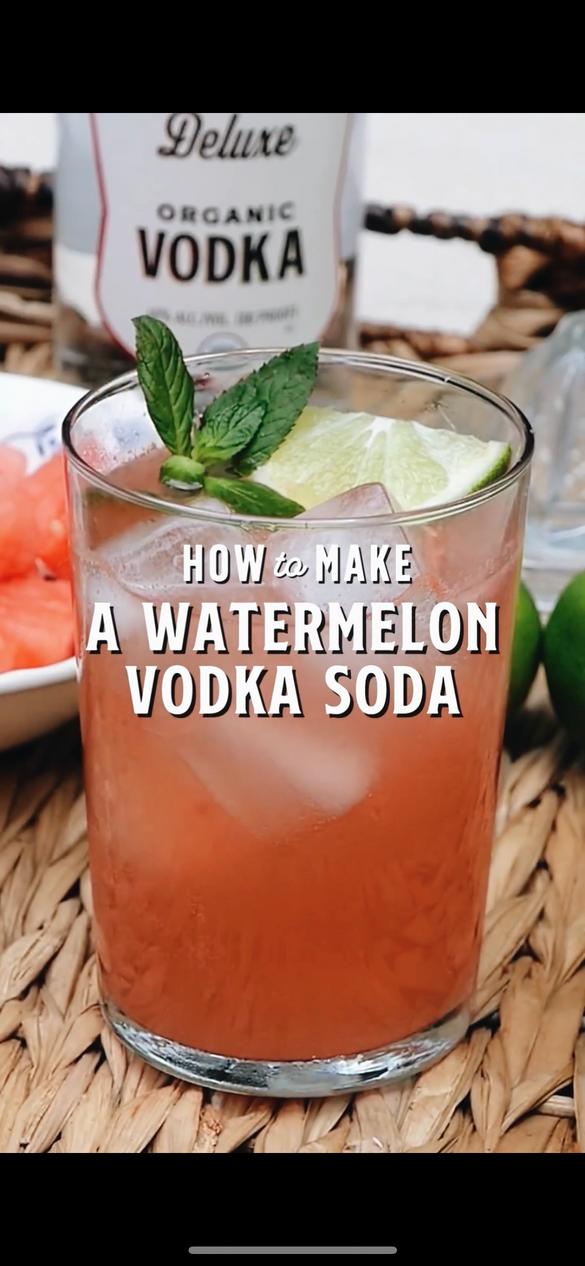
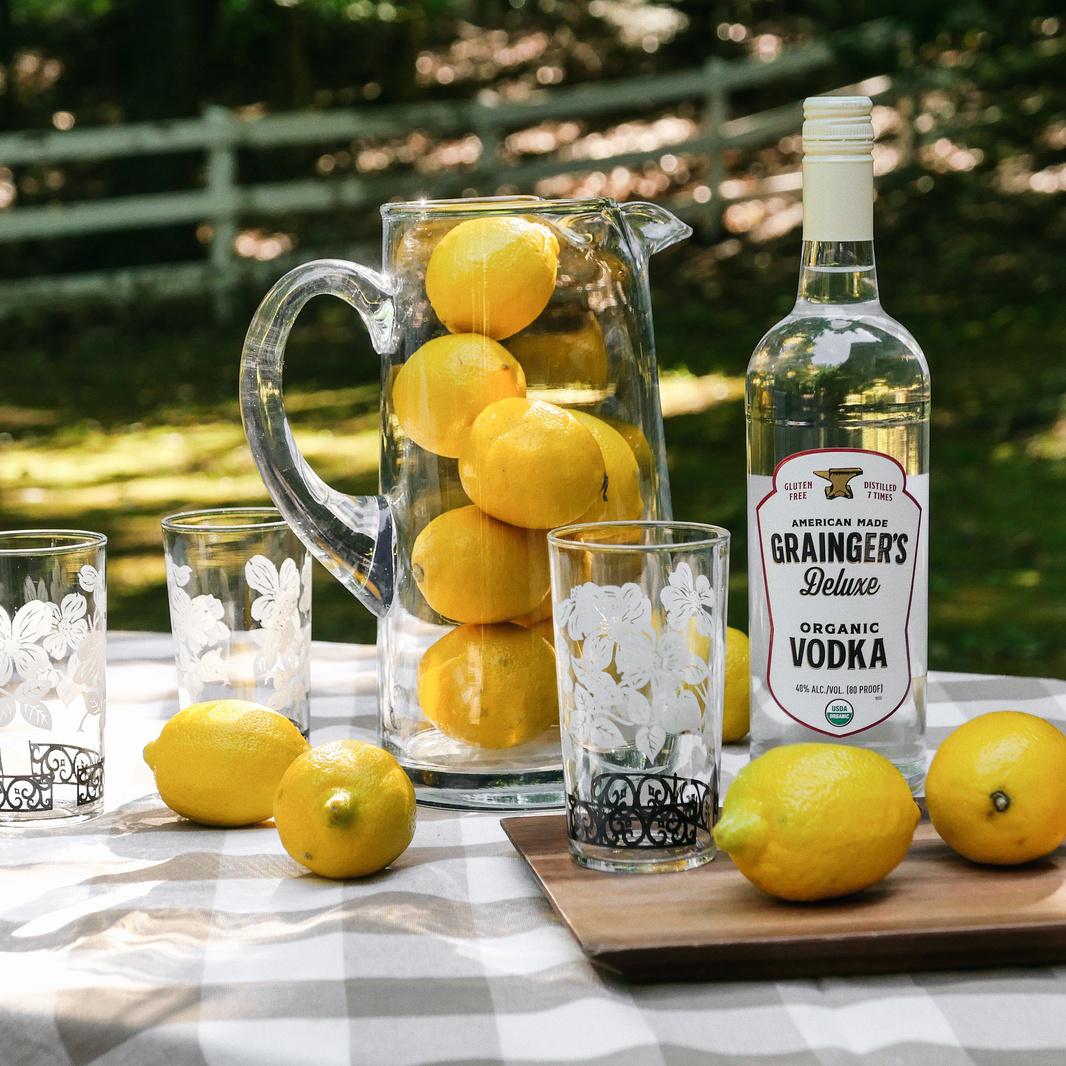
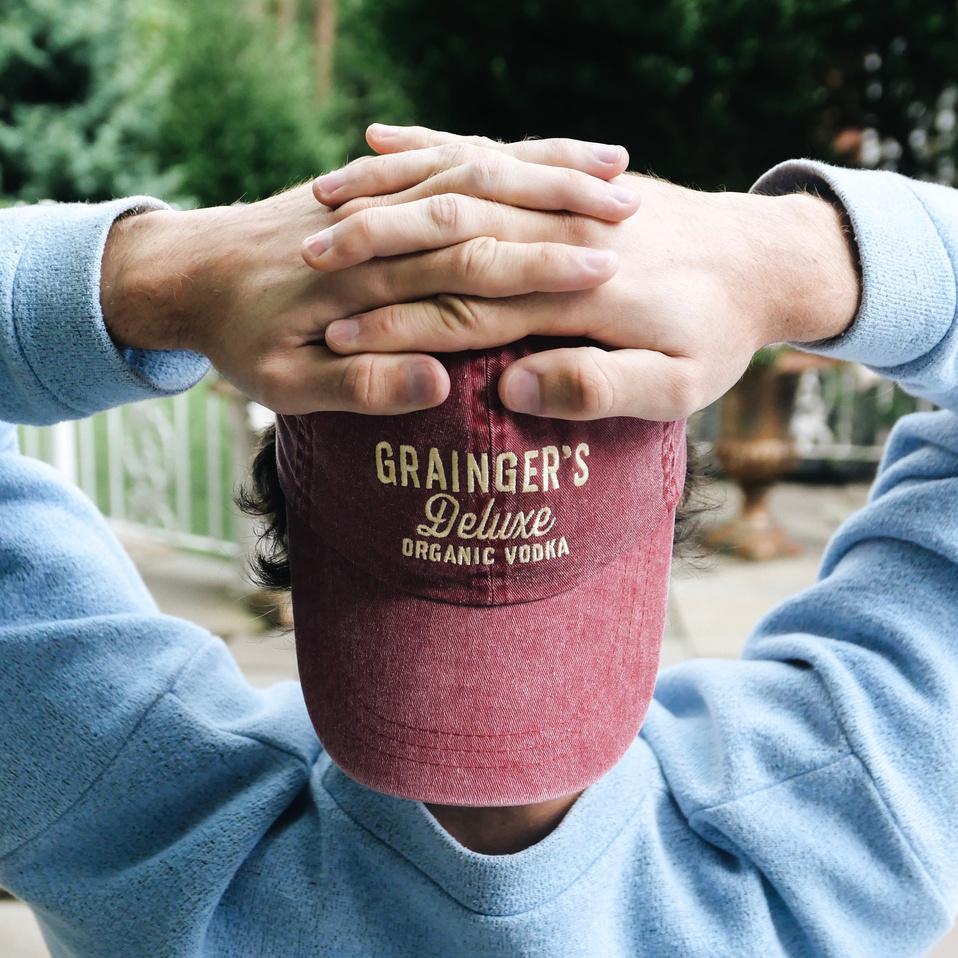
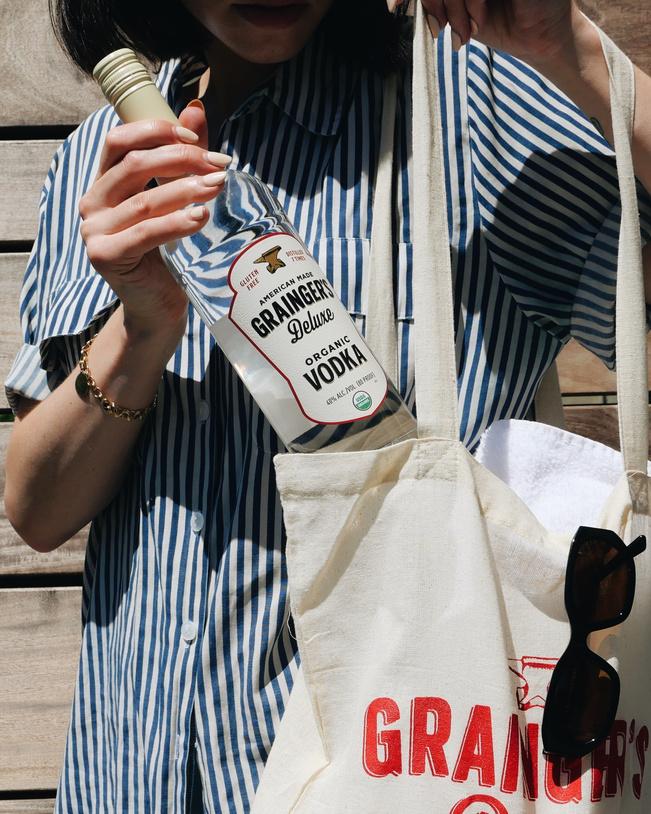
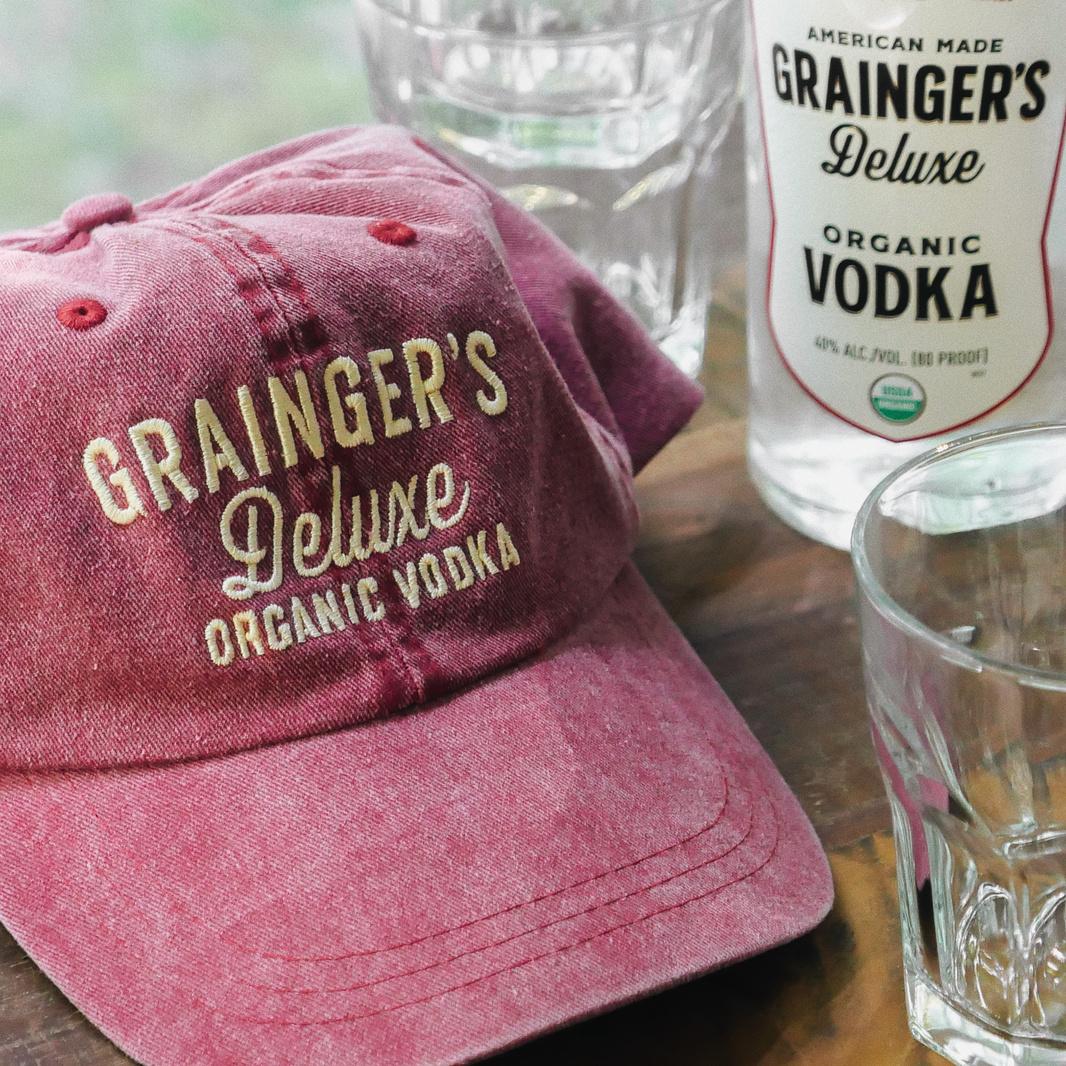

Q3 CONTENT QHIGHLIGHTS 3 CONTENT HIGHLIGHTS





SEPTEMBER 12TH JULY 25TH 332 POST INTERACTIONS $100 SPENT REEL 215 POST INTERACTIONS UNPAID REEL Q3 TOP POST QINTERACTIONS 3 TOP POST INTERACTIONS AUGUST 31ST 1,397 POST INTERACTIONS $350 SPENT STILL IMAGE AUGUST 12TH 532 POST INTERACTIONS $50 SPENT REEL Instagram post interactions = likes, comments, shares & saves


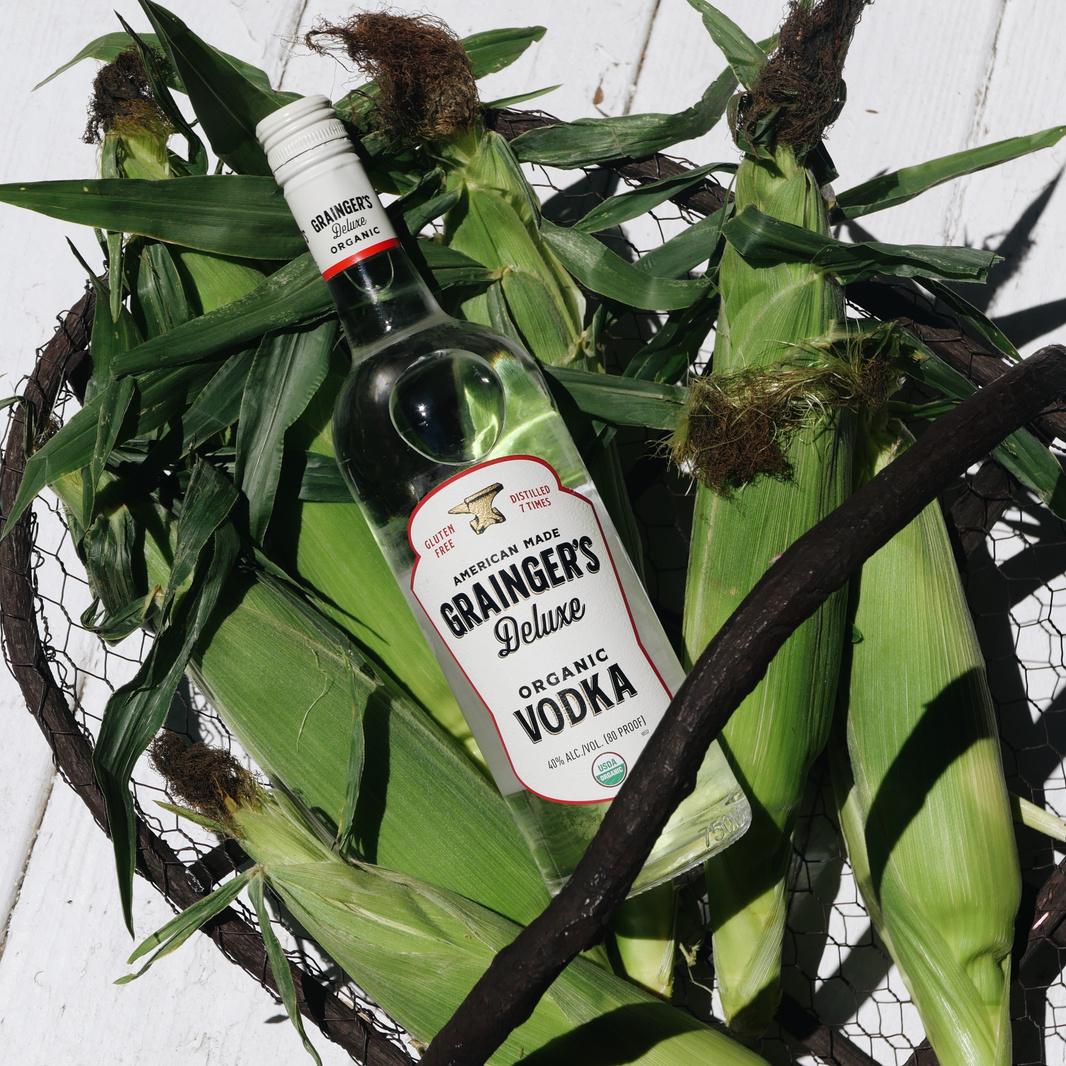
SEPTEMBER 29TH JULY 29TH REACHED 17,577 ACCOUNTS $150 SPENT STILL IMAGE AUGUST 5TH REACHED 23,238 ACCOUNTS $150 SPENT STILL IMAGE Q3 TOP QREACH 3 TOP REACH JULY 21ST REACHED 22,024 ACCOUNTS $200 SPENT STILL IMAGE REACHED 18,388 ACCOUNTS $150 SPENT STILL IMAGE


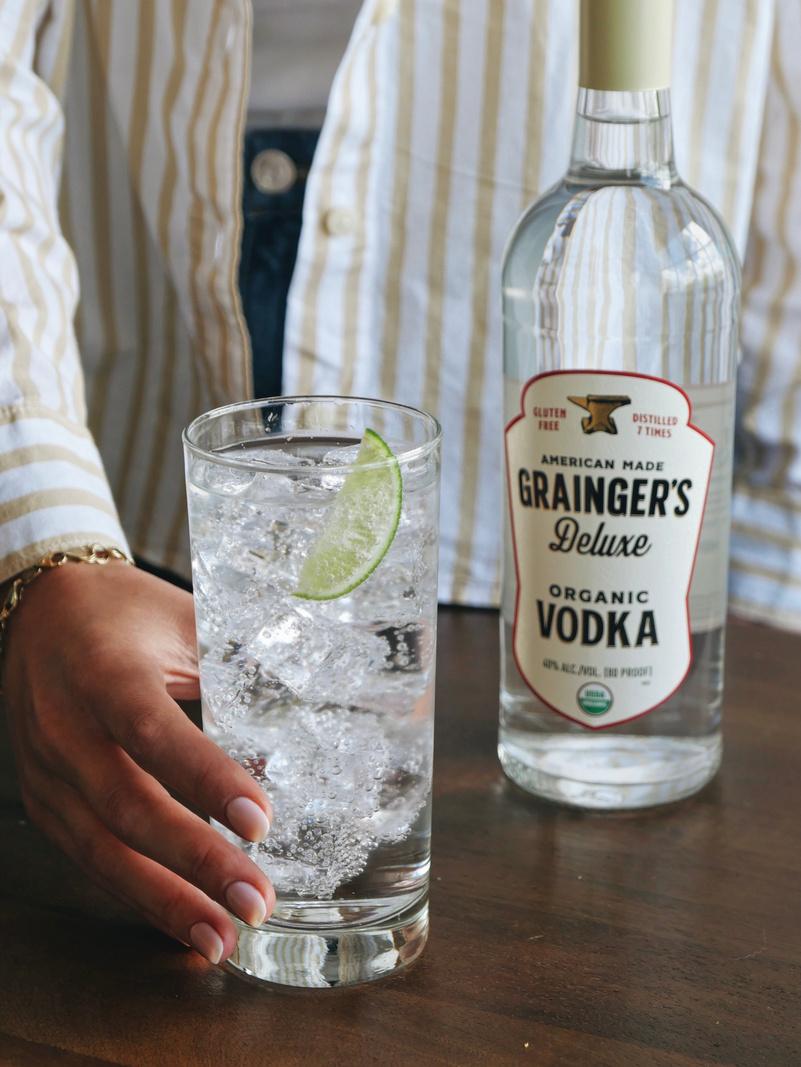
OCTOBER 18TH DECEMBER D23RD ECEMBER 31ST DECEMBER 21ST 38 FOLLOWERS $200 SPENT STILL IMAGE 30 FOLLOWERS $150 SPENT STILL IMAGE 40 FOLLOWERS $150 SPENT STILL IMAGE 257 FOLLOWERS $350 SPENT GIVEAWAY STILL IMAGE Q3 FOLLOWERS FROM A SINGLE QPOST 3 FOLLOWERS FROM A SINGLE POST METRIC UNAVAILABLE FOR INSTAGRAM REELS


AMOUNT SPENT: $2,000 5.9% ENGAGEMENT RATE ACCOUNTS REACHED: 193,984 IMPRESSIONS: 226,410 FOLLOWERS: 773 Q3 INSTAGRAM GROWTH QMETRICS 3 INSTAGRAM GROWTH METRICS average for Q3 - industry average .76% engagement rate = total content interactions ÷ reach
INSTAGRAM KEY QTAKEAWAYS 3 INSTAGRAM KEY TAKEAWAYS

GIVEAWAYS ARE A GAME GCHANGER IVEAWAYS ARE A GAME CHANGER
Not only did our Labor Day giveaway amass our highest content interactions of all time (1,397), it also accrued brought us 257 new followers in the span of 1 week. Moving forward, we will conduct 1 giveaway per quarter in an attempt to achieve the same success.
Reels lead overall content interactions and had the highest number of user saves out of all of the brand’s content.
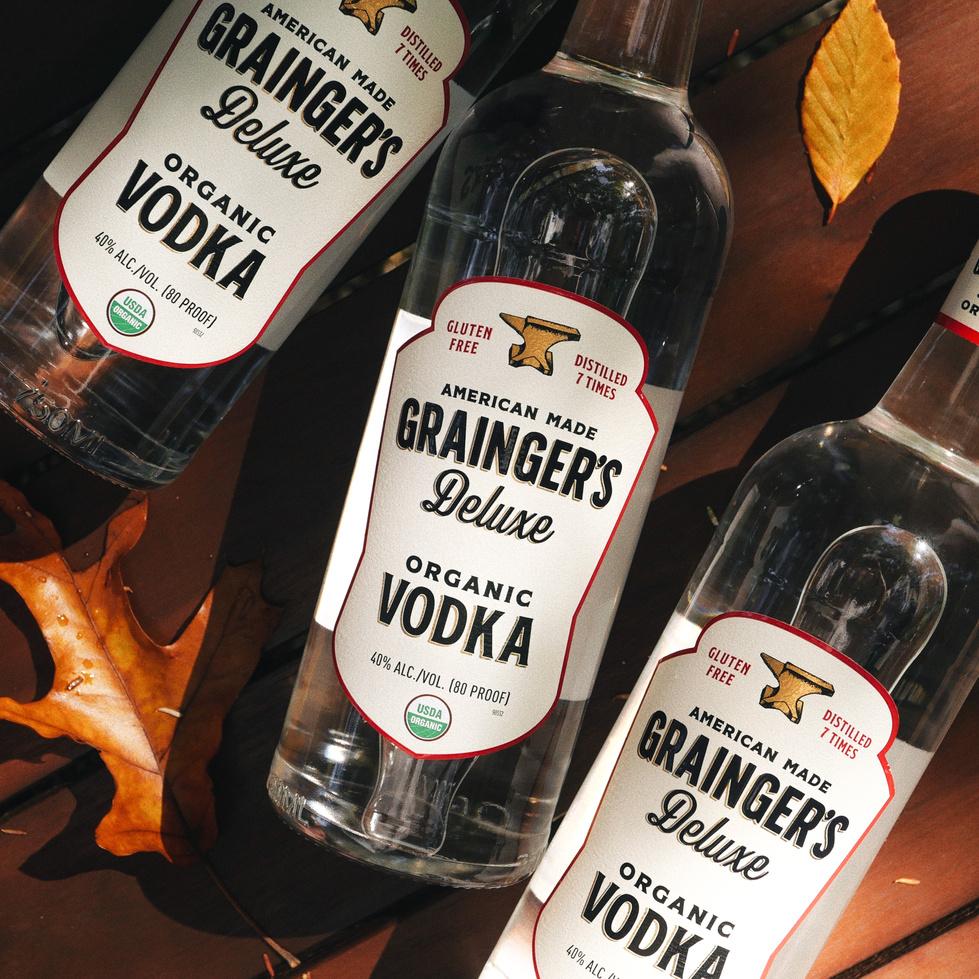
Product focused still images (supported by modest boosting budgets) had the largest reach and brought in the most new followers.

Q3
A "REEL-Y" BIG AIMPACT "REEL-Y" BIG IMPACT
PEOPLE LOVE THE PPRODUCT EOPLE LOVE THE PRODUCT


1,328 New PAGE likes 139,162 ACCOUNTS REACHED 2.4% Engagement Rate Q3 FACEBOOK QMETRICS 3 FACEBOOK METRICS average for Q3 - industry average .1% engagement rate = total post interactions ÷ total reach


JULY 8TH SEPTEMBER 22ND AUGUST 24TH 285 REACH 279 4REACH 56 REACH JULY 21ST 291 REACH Q3 FACEBOOK POST QREACH 3 FACEBOOK POST REACH


SEPTEMBER 29TH 24 JULY 8TH SEPTEMBER S5TH EPTEMBER 22ND Facebook post interactions = likes, comments & shares Q3 TOP FACEBOOK POST QINTERACTIONS 3 TOP FACEBOOK POST INTERACTIONS 20 18 14




SEPTEMBER 29TH 10% SEPTEMBER 2ND SEPTEMBER S22ND EPTEMBER 5TH Facebook post engagement rate = post interactions ÷ post reach Q3 TOP FACEBOOK POST ENGAGEMENT QRATE 3 TOP FACEBOOK POST ENGAGEMENT RATE 7.4% 7% 6%

Q3 AMOUNT SPENT: $1,625 ACCOUNTS REACHED: 28,366 PAGE LIKES FROM ADS: 1,300 COST PER LIKE: $1.25 Q3 FACEBOOK AD QMETRICS 3 FACEBOOK AD METRICS
KEY QTAKEAWAYS 3 FACEBOOK KEY TAKEAWAYS

INFORMATION DRIVEN IAUDIENCE NFORMATION DRIVEN AUDIENCE
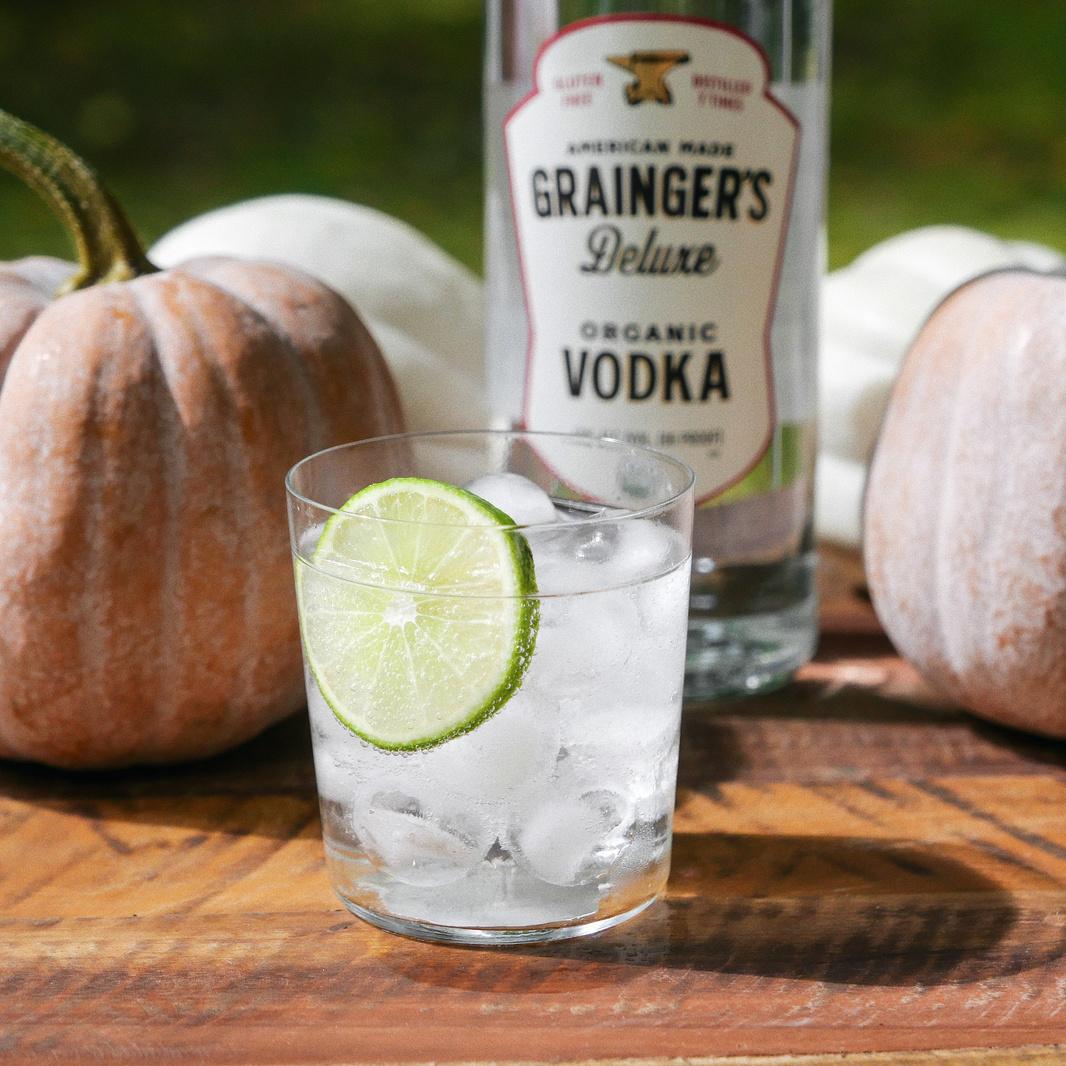
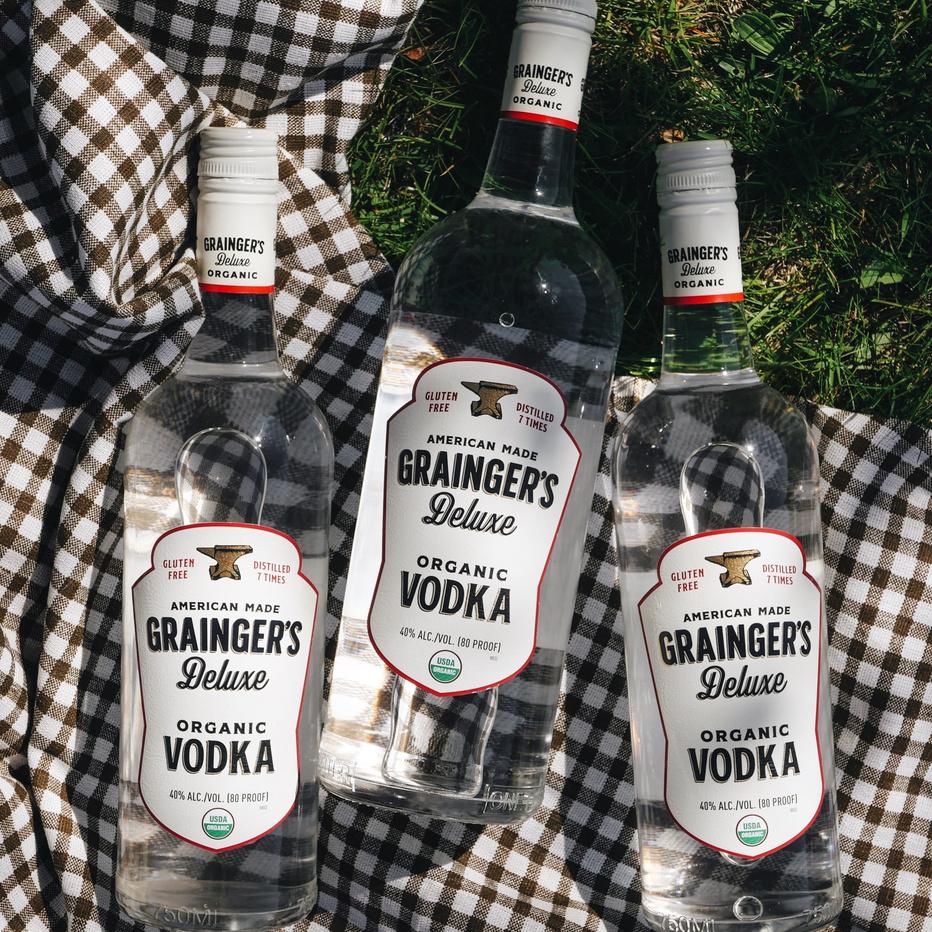
Bottle shots still reign supreme, which tracks for the more product centric content Facebook followers are drawn to. Whereas, lifestyle content tells the brand story on Instagram, Facebook attracts more information driven users.
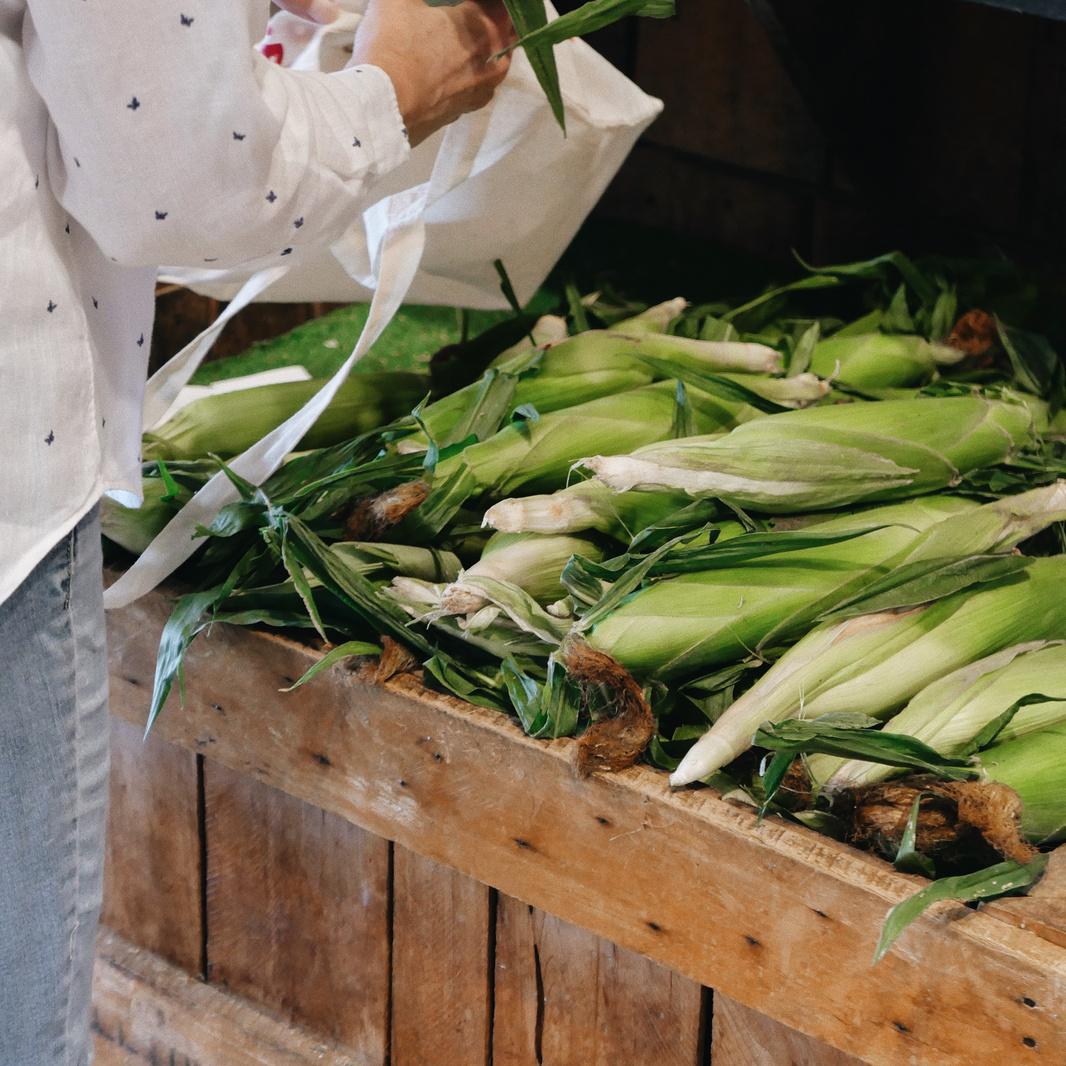
Branching off the above takeaway, content and copy that represents the products roots had the highest engagement. This includes images of corn, or outdoor images with an agriculture influence.

Q3 FACEBOOK
INGREDIENT IINFLUENCE NGREDIENT INFLUENCE


