1 minute read
5 Interpretation of results


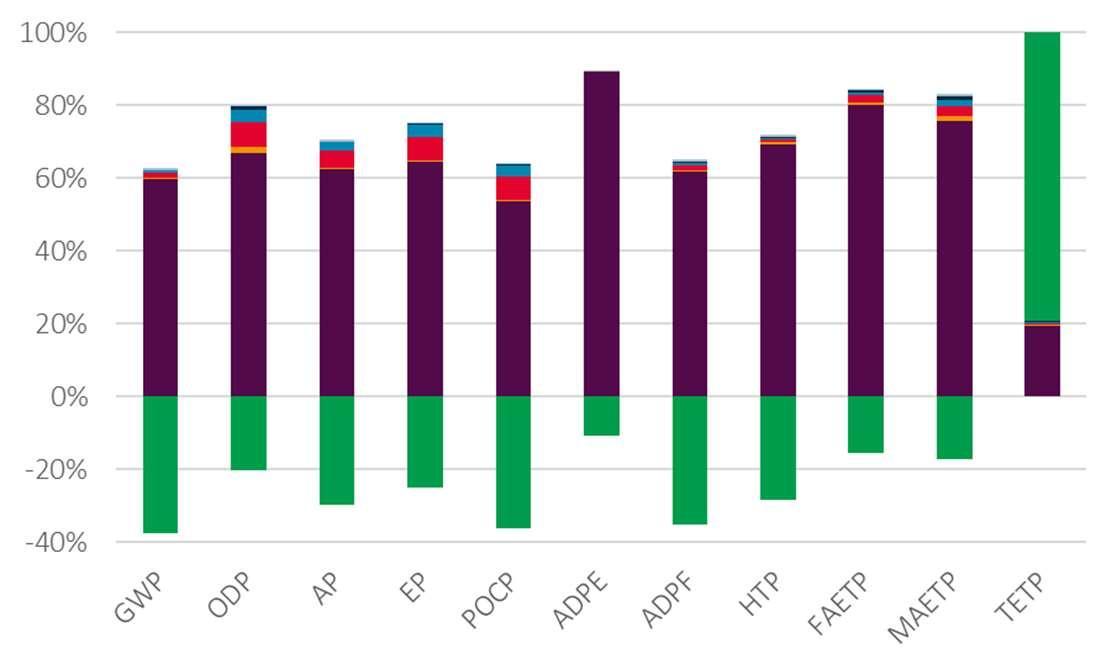
Figure 4showsthe relative contribution per lifecyclestage for each of the eleven environmental impact categoriesfor 1m2 of SAB35/1035 (reference)profiles. Each column represents100% of the total impact score, which is whyallthe columnshave been set with the samelength. A burden isshown aspositive (above the 0% axis)and a benefit is shown asnegative (belowthe 0% axis). The main contributorsacrossall impact categoriesare A1-A3(burdens)and D (benefitsbeyond the system boundary).
The manufacture of the hot dip galvanised coilduring stage A1-A3 isresponsible for around 90% of each impact in most of the categories, specifically, the conversion of iron ore into liquid steel which is the most energy intensivepart of the profile manufacturing process.
Advertisement
The primarysite emissionscome from use of coaland coke in the blast furnace, and from the injection of oxygen into the basicoxygen furnace, aswell ascombustion of the processgases. Theseprocesses give riseto emissions of CO2, which contributesover 95% of the Global WarmingPotential(GWP),andsulphuroxides,whichareresponsible for half of the impact in the Acidification Potential (AP) category. In addition, oxidesof nitrogen are emitted which contribute halfof the A1-A3Acidification Potential, and three quartersof the Eutrophication Potential(EP),andthe combined emissions of sulphur and nitrogen oxides, together with emissions of carbon monoxide,methane, and VOCsallcontribute to the PhotochemicalOzone indication (POCP).
Figure 4clearlyindicatesthe relativelymodest contribution to each impact from the other lifecycle stages, A4 and A5, and C1 through to C4. Of these stages, the mostsignificant contribution isfrom stageA5 (installation of the product on thebuilding). For the Acidification (AP) and Eutrophication (EP) Potential indicators, thisismainlythe result of nitrogen oxidesemissions from the combustion of diesel fuelused to power site machinery such asfork lift trucks, scissor lifts and cherry pickers and for the POCP and ODPindicators, it ismainlyVOC emissions from the same combustion source.
Consideration of the additional indicatorsthat have been declared to complywith NMD requirements, showsthat the largest contribution are from the A1-A3impacts. Themain source of impactsin thesetoxicitycategoriesare from emissionsof heavy metalsand inorganics to air and fresh water, during the mining of coal and iron ore and the subsequent smelting process, and during production of the zinc used in the galvanising process.
Module Dvaluesare largely derived using worldsteel’svalue of scrap methodologywhich isbased upon manysteelplantsworldwide, including both BF/BOF and EAF steelproduction routes. At end-oflife, the recovered steelismodelledwith a credit given as if it were remelted in an Electric Arc Furnace and substituted by the same amount of steelproduced in a Blast Furnace [23]. Thiscontributesa significant reduction to allbut oneof the environmental impact category results, with the specificemissions that represent the burden in A1-A3, essentiallythe same asthoseresponsiblefor the impact reductionsin Module D.


