WATERSCAPE
PIACENZA GREEN/BLUE BELT


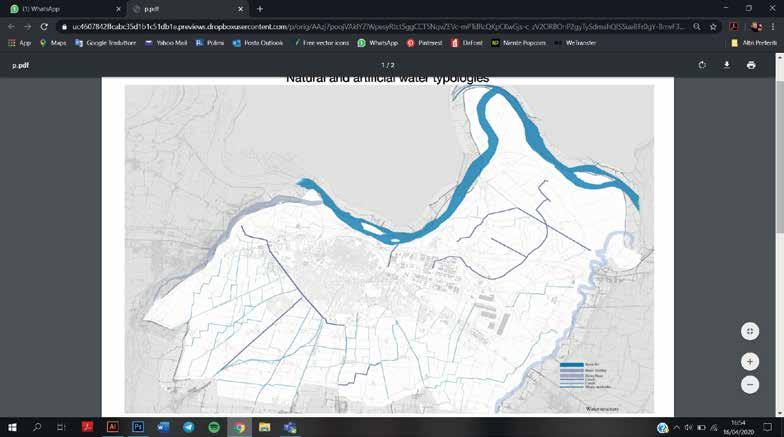
Waterscape Abstract
Unraveling the Territory 37
Assissitng Natural Recovery
WaterScape Blue+Green
Looking for Territorial Synergy
Harnessing Gravity
The Productive Culmination
Looking for Terri torial Synergy
This booklet is a story on how we envi sion an upgraded Piacenza Belt that brings together both sides (Rural and Urban) in one place and co-exisit. Through the crea tion of a Blue/Green Belt do we stabli shing a series of re-habitation strategies to see Piacenza from a new prespective.
The cocnept focuses on establishing a series of re-habitation strategies on site that is reclaimed for human development, and emphasizes the site as a seeding process for the natural systems, as well as environmen tal education and eco-tourism. The belt provides key ecosystem services, regene rate abandoned areas & offers recreational opportunities, contributing to healthy life styles.
Our goal is to redefine and diversify the existing landscape by emphasizing what is already there and showing all the multiple ways we can improve the life in the city.
Main focus in making landscape pro ductive and at the same time integrating people in the development of the land scape, by making a new, always changing, landscape pattern.
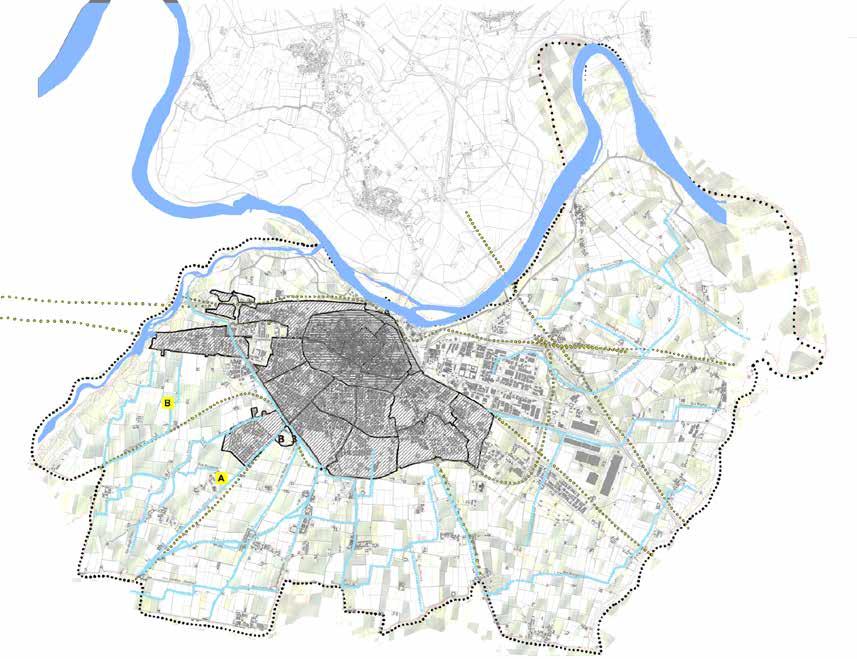
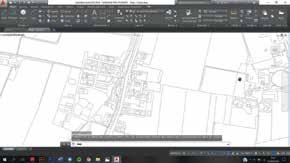
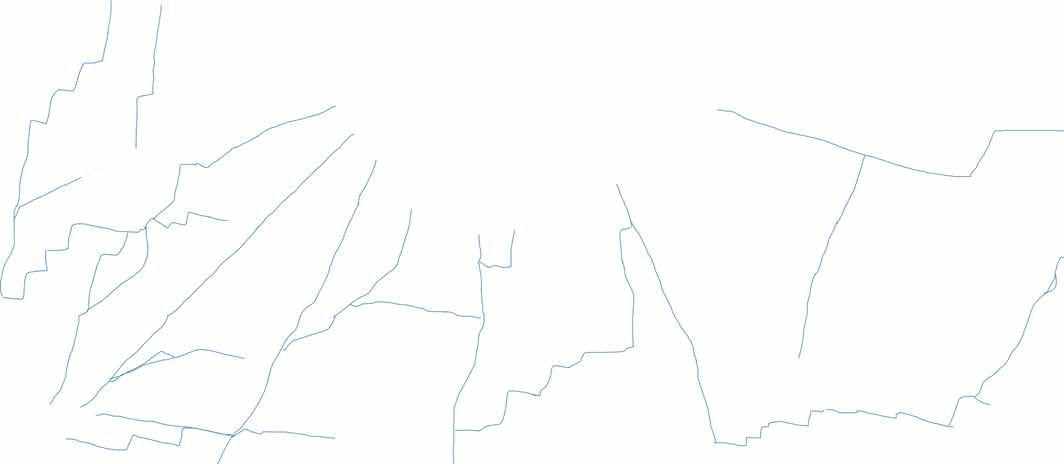
The rural landscape of Piacen za has a very intricate canal system in order to irrigate the lands considering their proxi mity to the river and the Treb bia Valley.
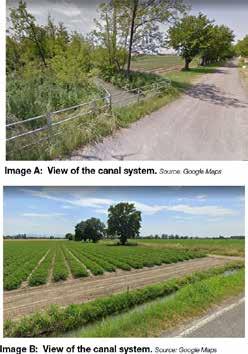
Bologna, Piacenza and Cremo na areas Drainage The canals were built by Mar cus Aemilius Lepidus to drain lower Po area from the sea sonal flooding and over time they became the main irriga tion network for the farmers.
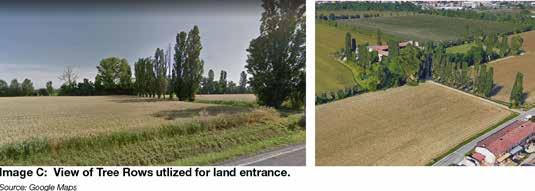
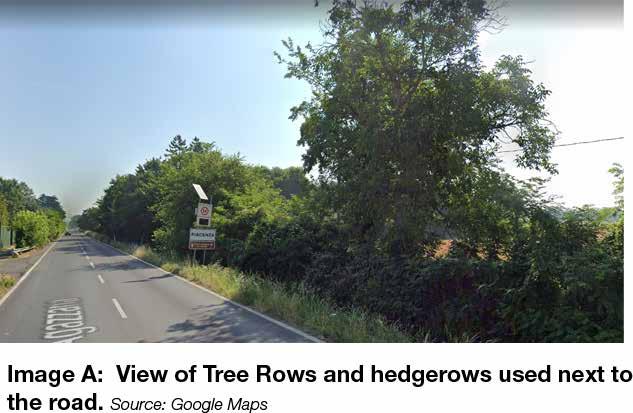
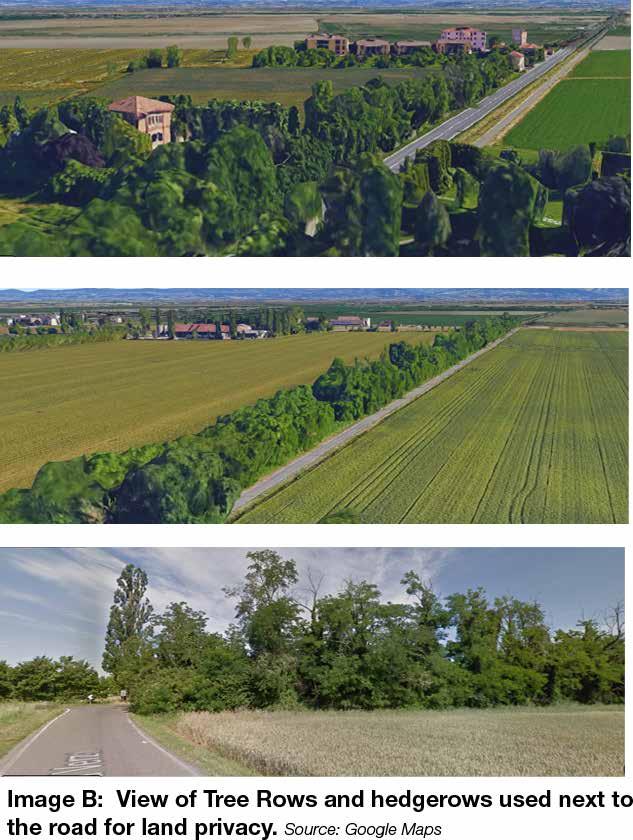
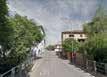
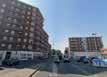
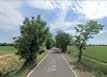
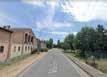
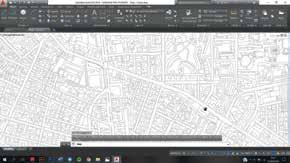
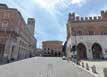
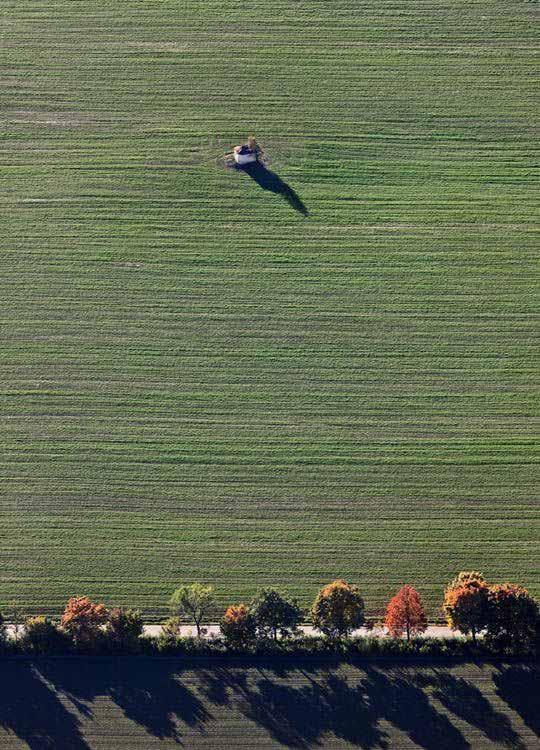
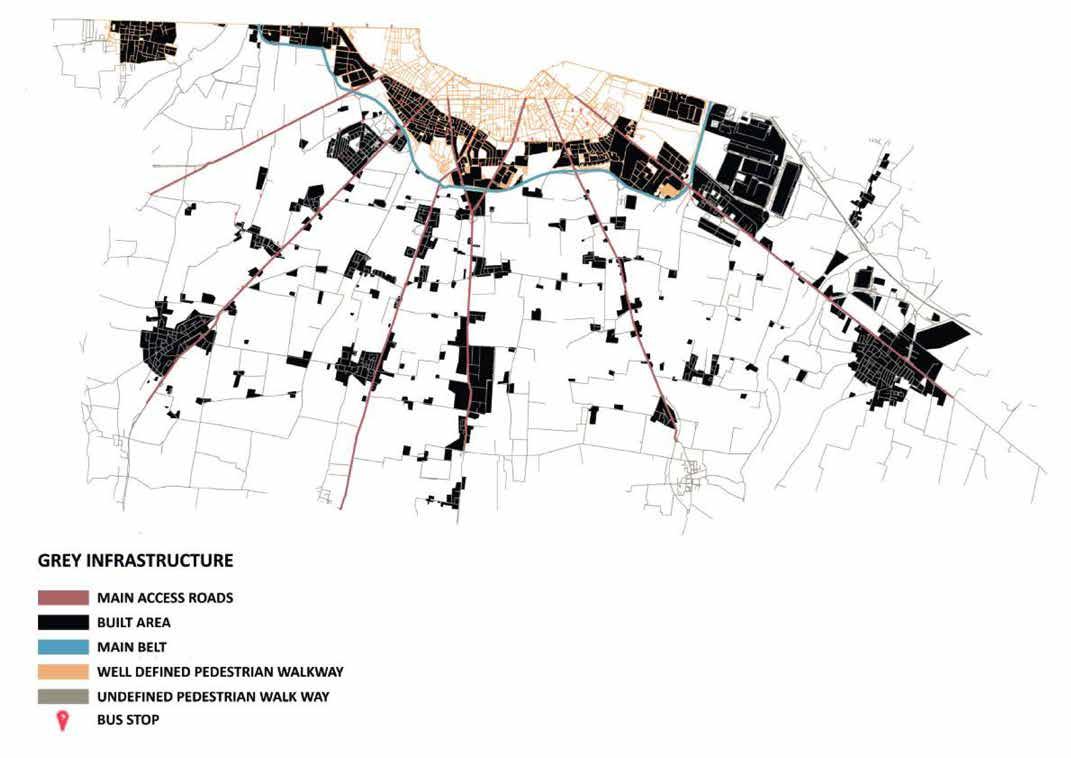
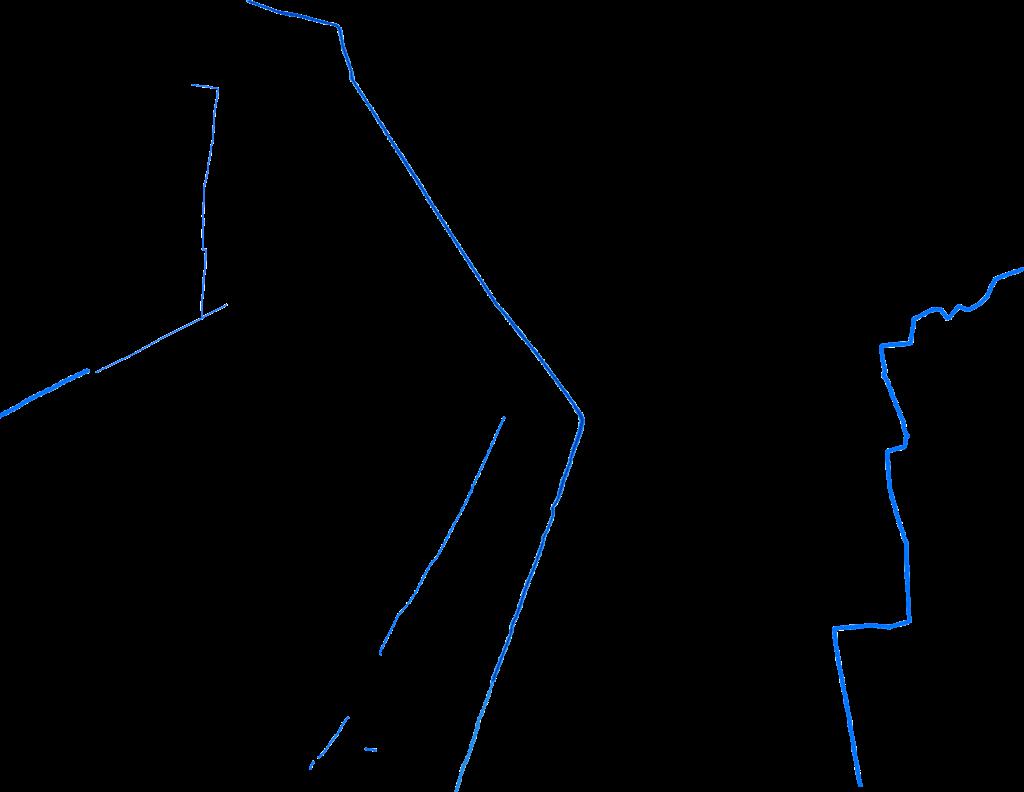
The main infrastructres in the rural are the roads and the wa ter network. The roads are divded into main and secondary road sy stem. The main roads are di rectly connected to the mo torway and the citycenter the secondary roads connect with the lands. it is a very de sne network. Tertiary Road Network usually have treerows becuase they are land borders or the main entrance to a villa
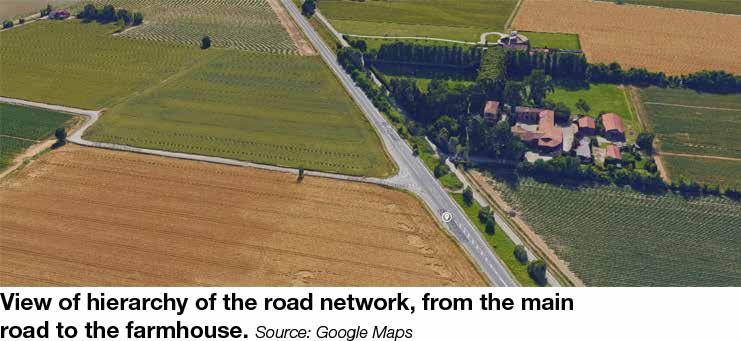
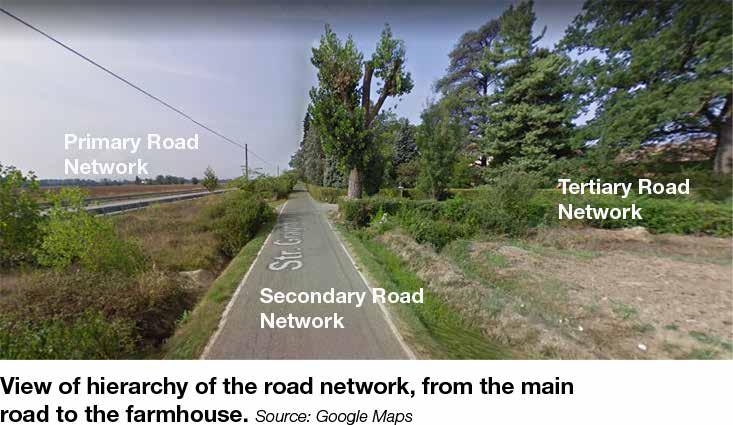
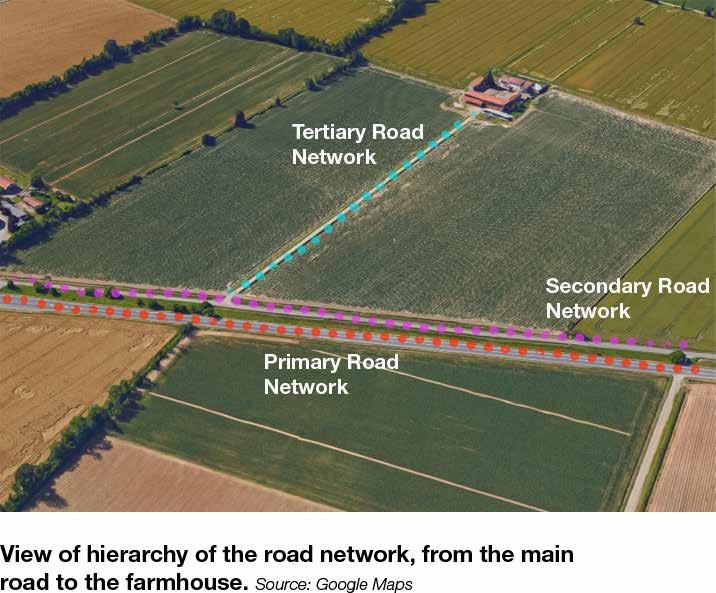
Figure 2
Map of the Canal network in Paicenza
Figure 3
Map of Secondary ro ads in the rural areas of Piacenza
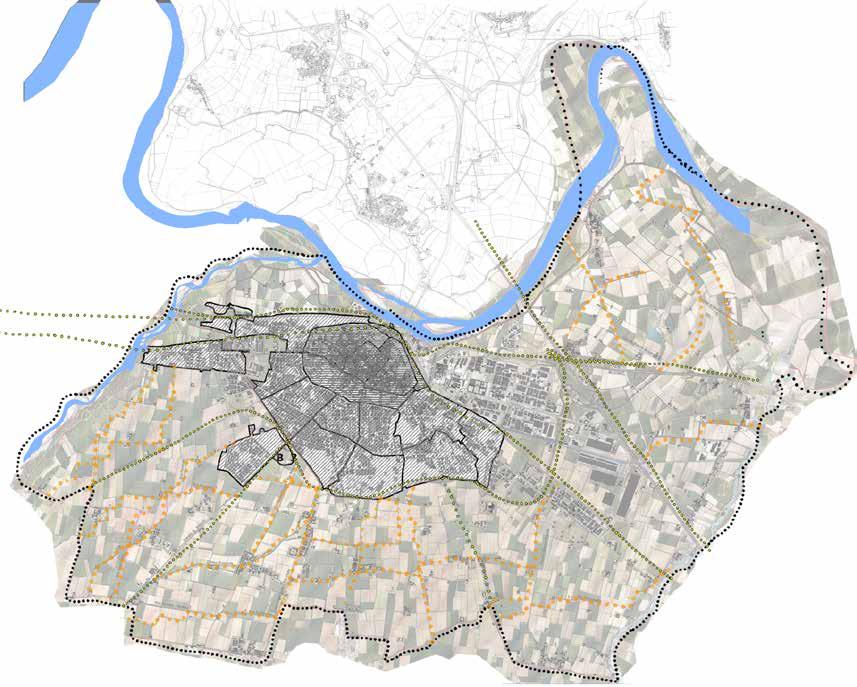
Most of the streets have tree rows, hedgerows to mark the land boundray and for privacy.
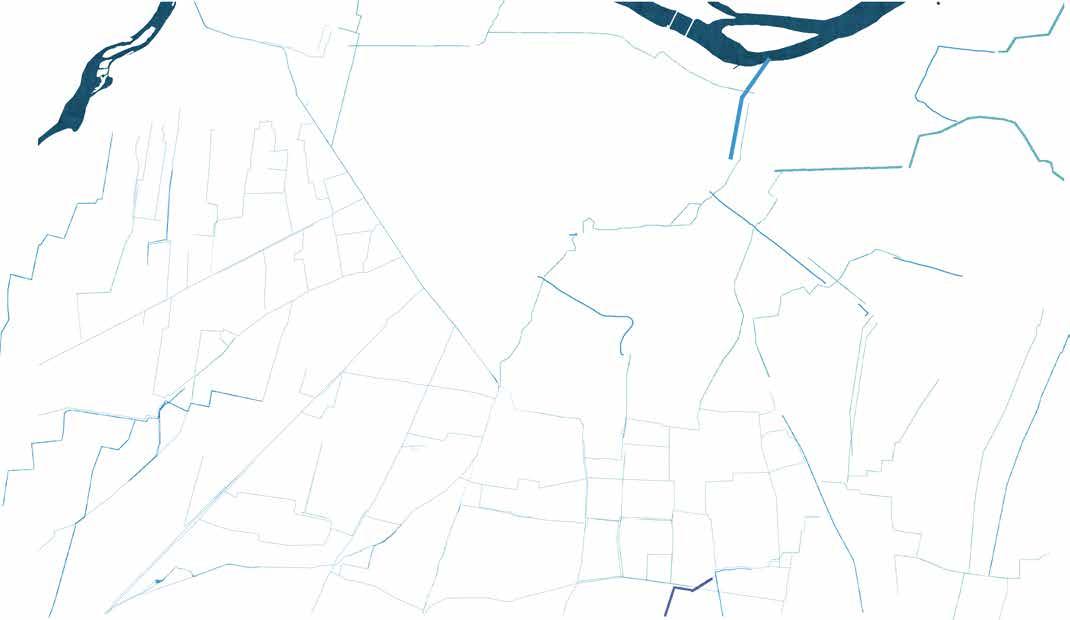
From the maps and imges from Google Maps and Street View, we were able to identify some of the important aspects in ter ms of the protected nature and its characteristics. That helped us understand the nature and diversity of the habitats in the rural areas of Piacenza. We were able to aspire to ex tend the lines of the protected areas and forest and replant them in our site in a way to
provide buffer.
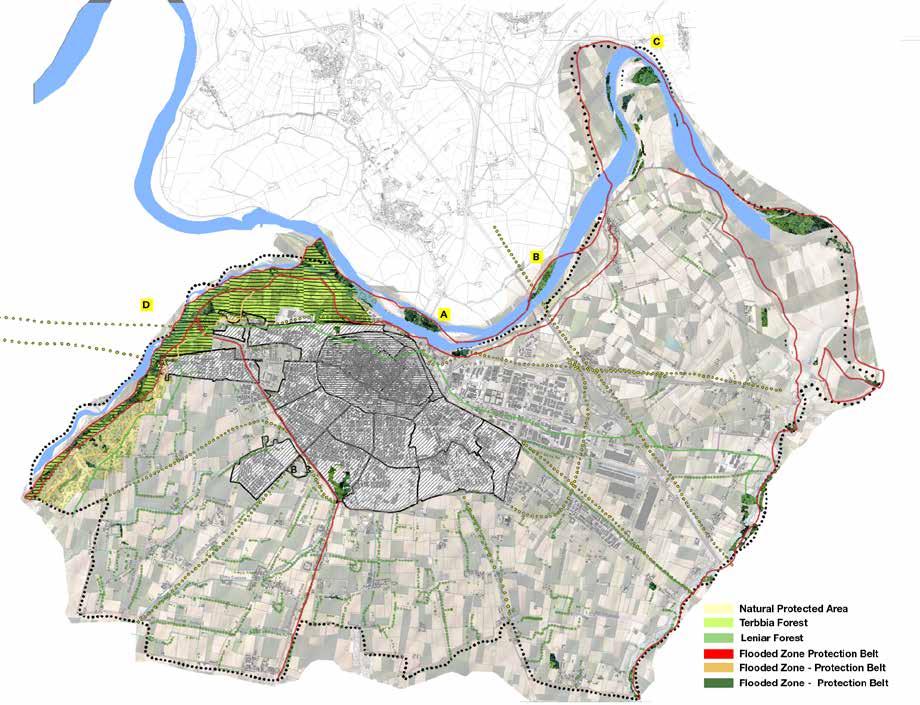
Moreover, using the flood pro tection lines, we were able to identify the main locations of the wetlands that will help with the water storage and char ging process during the flood seasons and the stormwater collection.
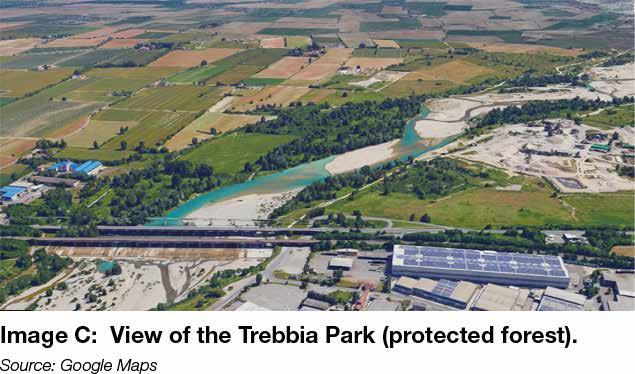
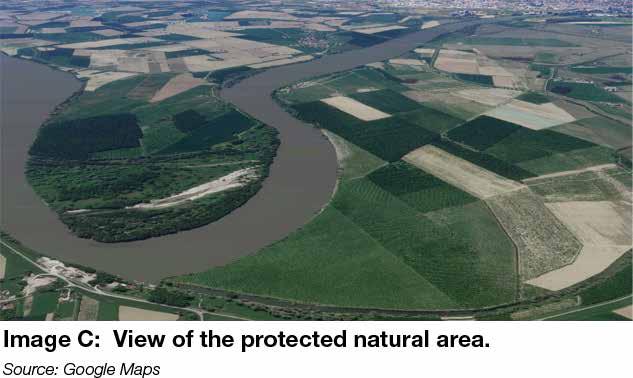
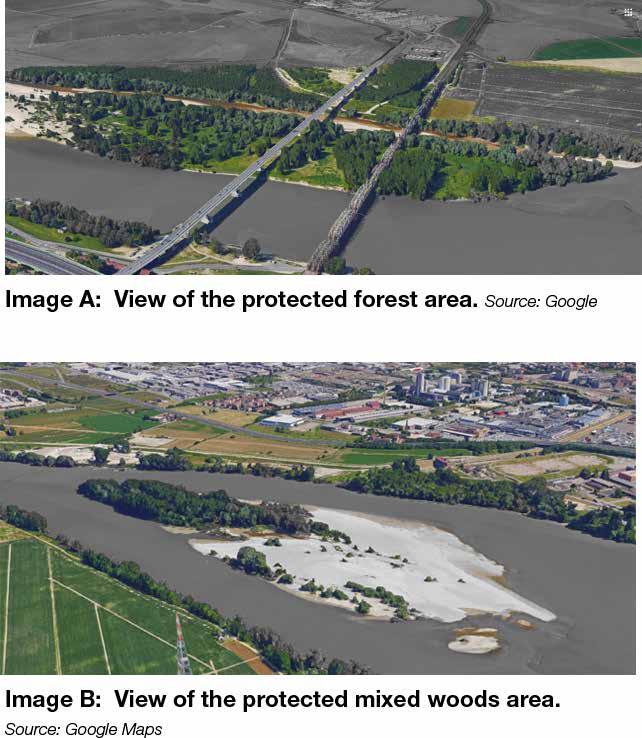
Figure 4
Map fo the vegetative elements selected.
Figure 5
Map of the Flood lines and protected Areas
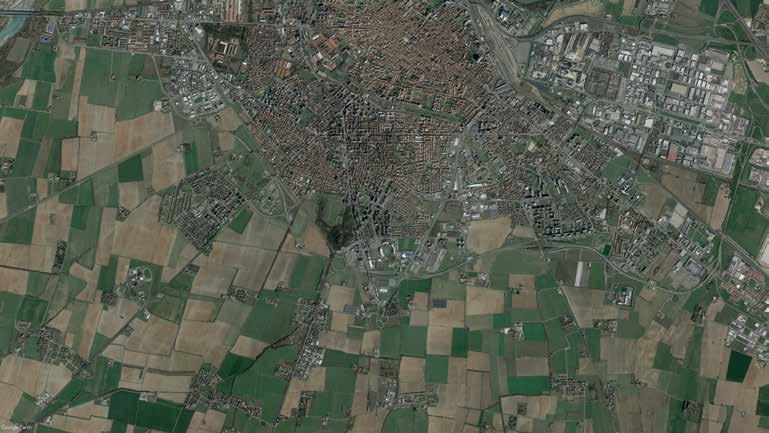
The southern area of Pia cenza Province is hilly and full of mountains. There are four valleys that pass throu gh them rivers and streams that some of them can still be traced in Piacenza today. The north of Piacenza, whi ch overlooks the Po River, is the plain side, the location makes it a very fertile land especially its surrounding, the small towns. As a re
sult agriculture is one of the most important economy in the city.
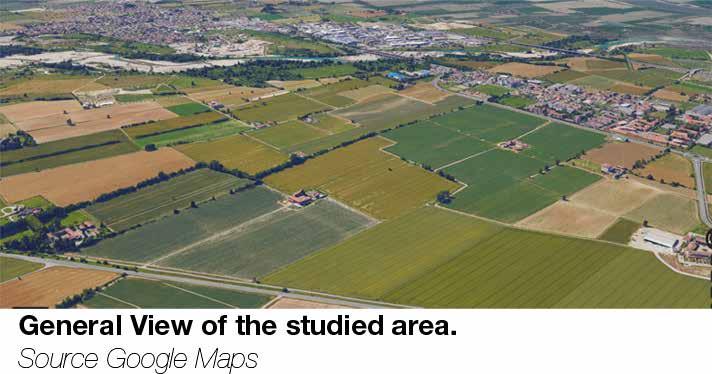
Piacenza covers an area in the Po valley, on the right bank of the river Po; it is a completely flat terrain, with an average altitude on the sea level of 61 meters (going from a minimum of 43 me ters to a maximum of 88 meters).
Agricultural activities in the ru ral plain of Piacenza. Cultivations around the Sett lements: Vegetable gardens (beans, wheat and corn) har vest from August till October, Fruit Garden (Tomatoes and Beets), harvest in the in Late summer early autumn (August – September).
Fodder crops: corn and maize, harvest from August till Octo ber.
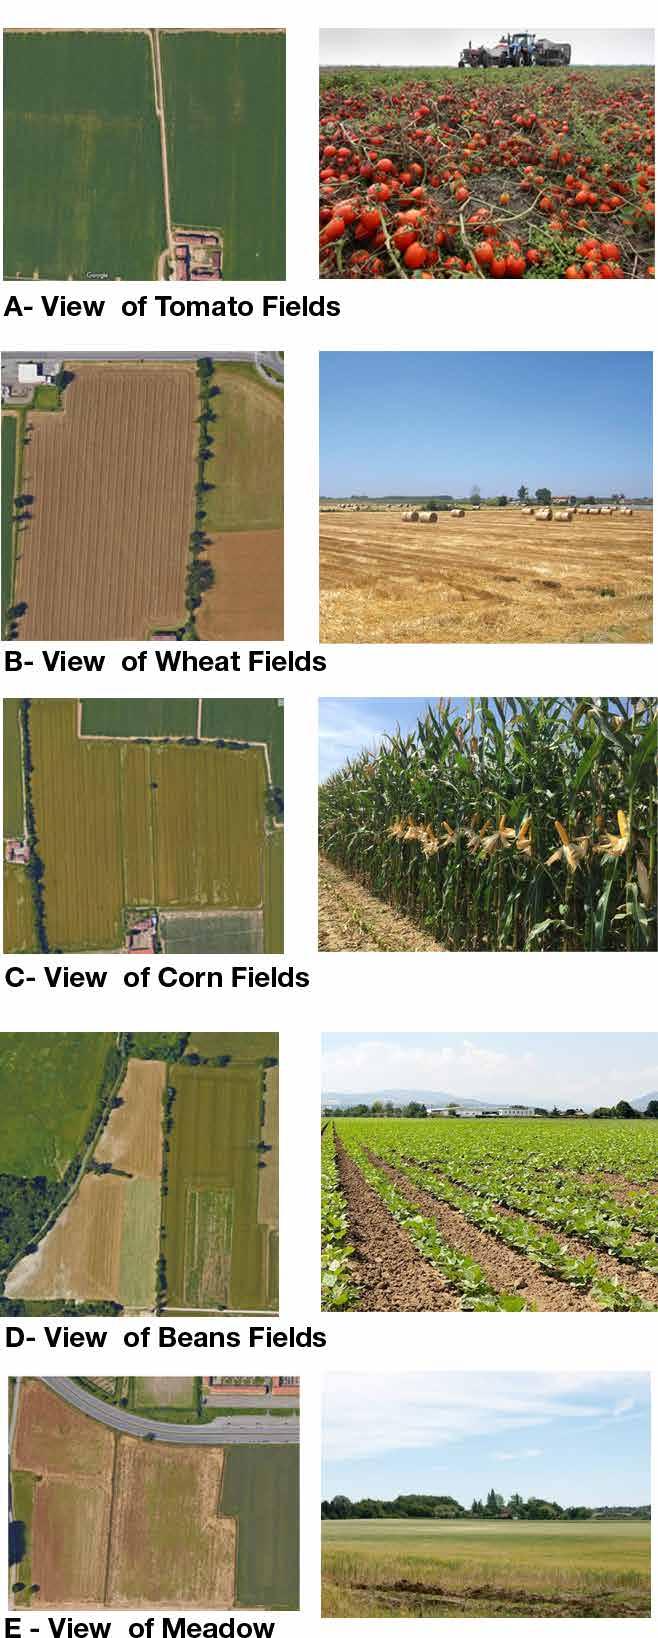
Cultivations near Po River: oli ve trees,vineyards and orchard grove. Harvest takes place
Green manure and Pastures: meadows spread over the plain terrain of the rural area for cattle grazing and feeding.
Pine woods and Mixed Forest near the Po River and Treb bia Valley (protected wooded area).
Main Activities: Farming Livestock and Dairy products Production Agritourism
The buildings marked are of historical and architectural im portance.
Figure 6
Map of the crop di stirbution in Piacenza
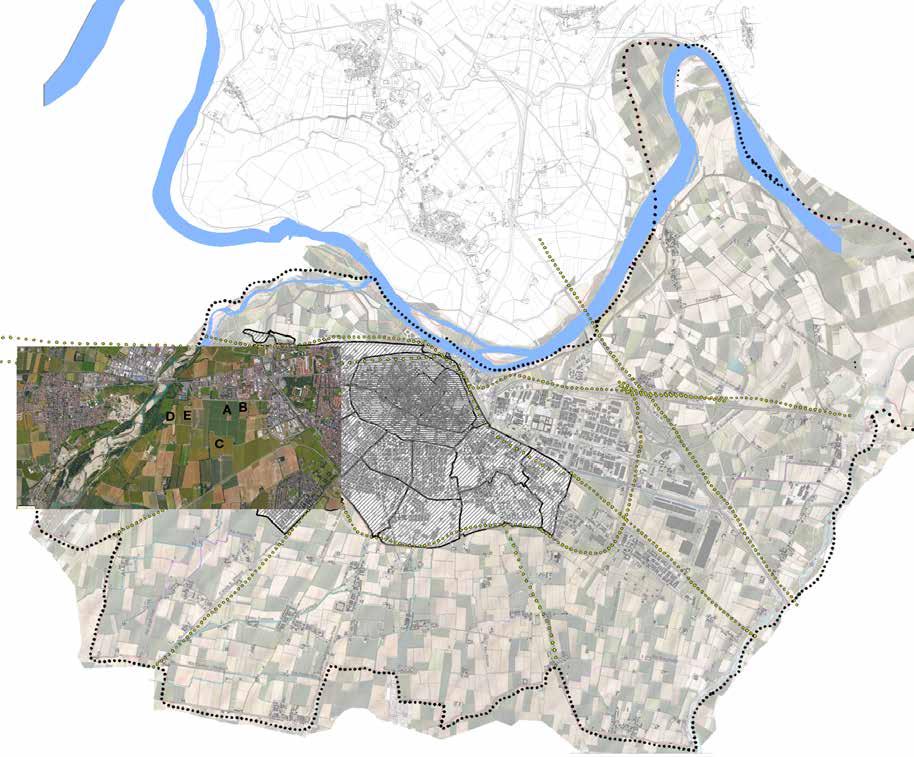
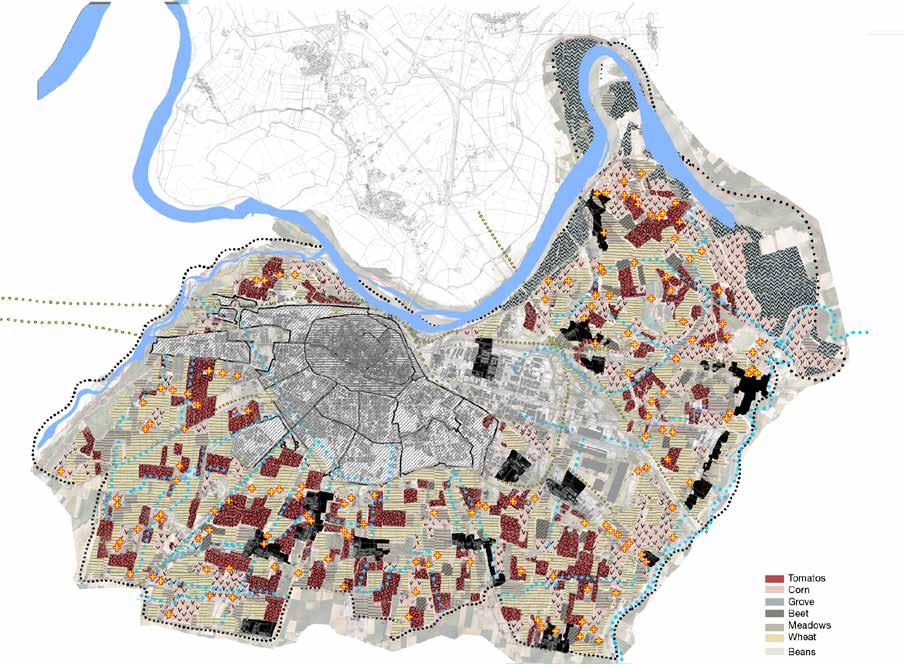
Figure 7
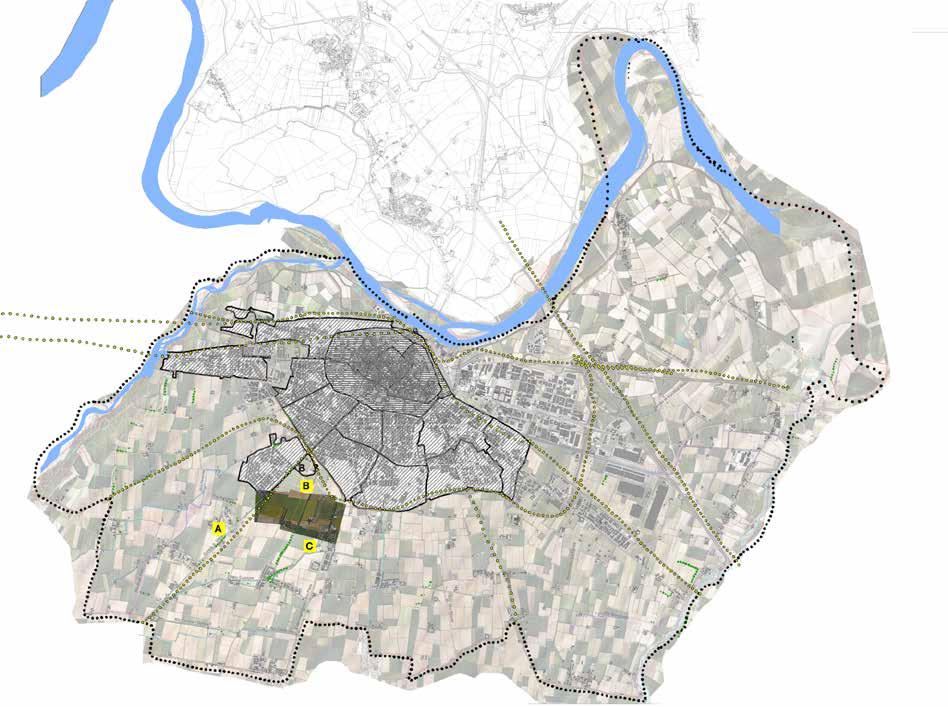
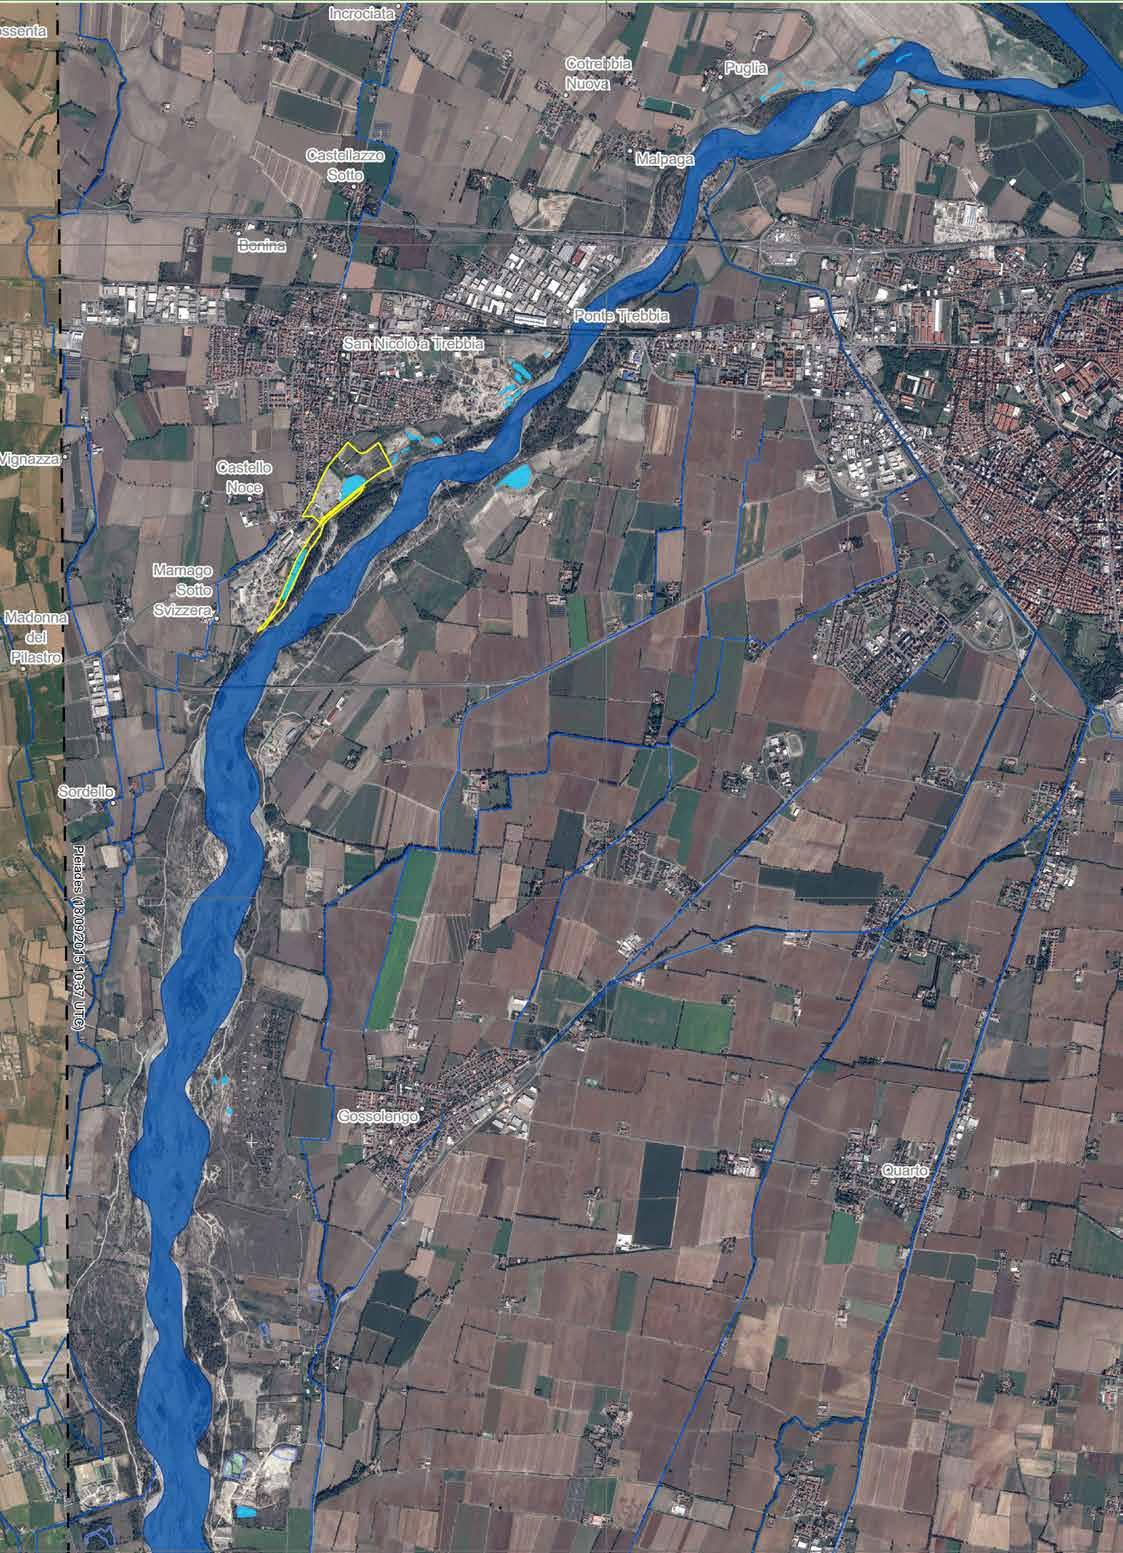
Map of the selected study area.
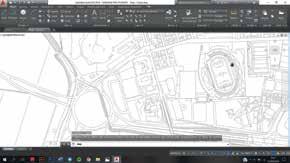
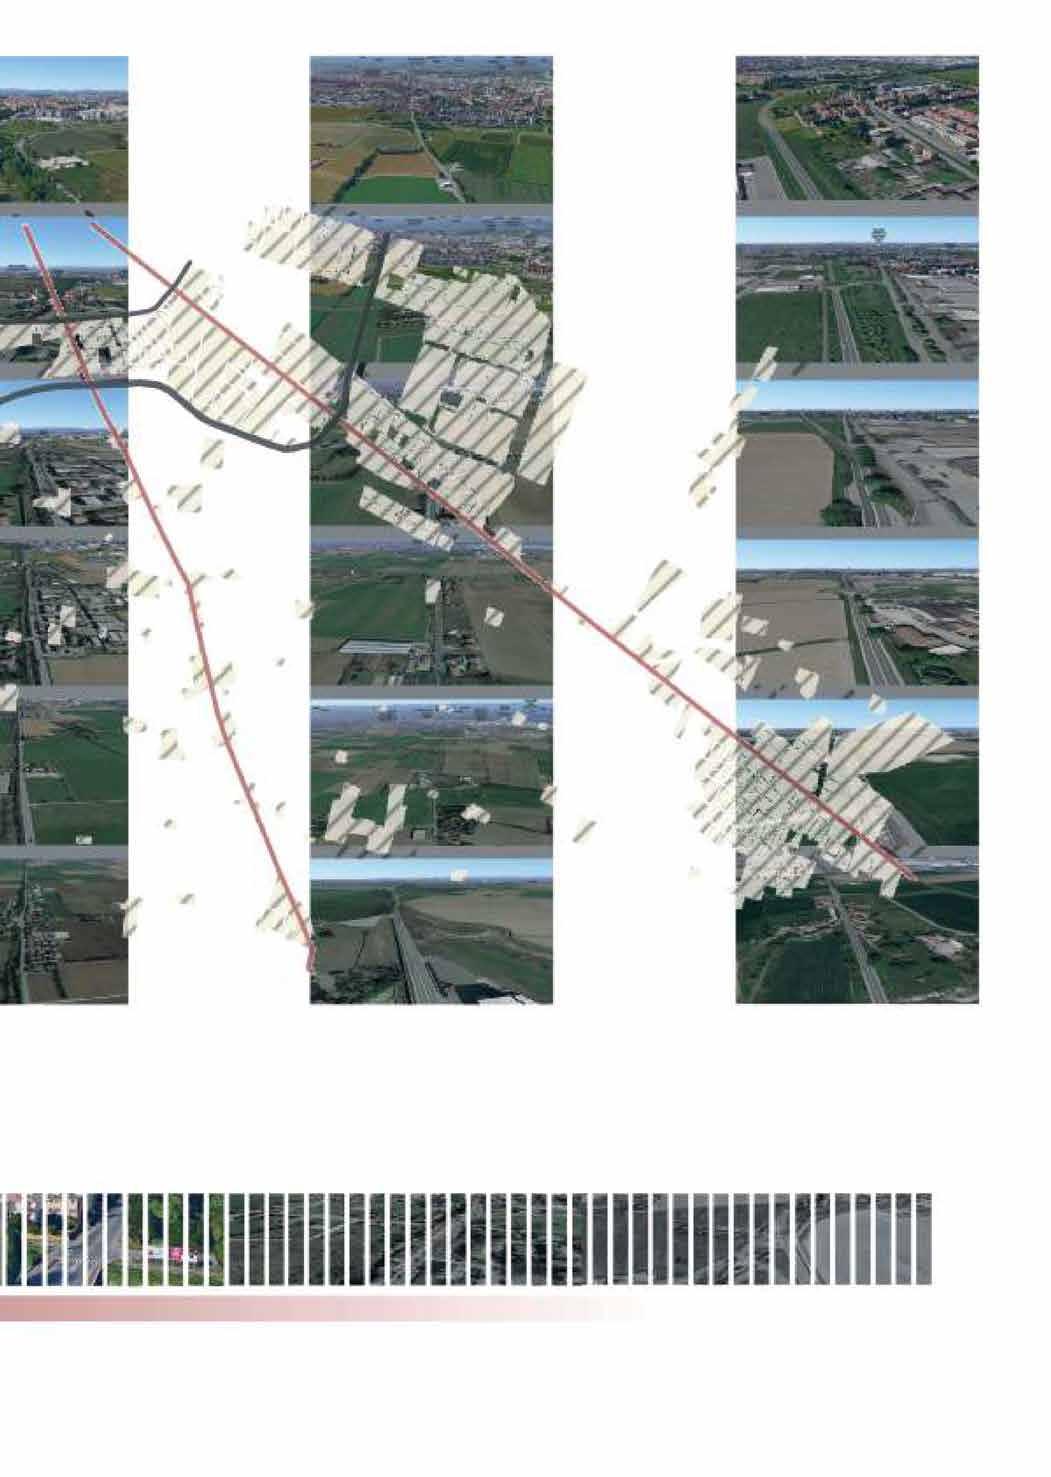
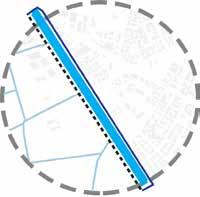
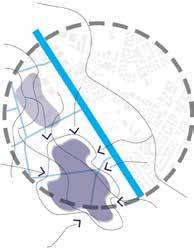
Two location were selected across the rural and city center for a sotry telling process in an attempt to unravel the land scape system of Piacenza and understand it better. The first 2 maps from the rural side and
the third is from the city center . We were able to understand the realtionship of the infra structure with the green and land and the lack of interaction between all rural elements.
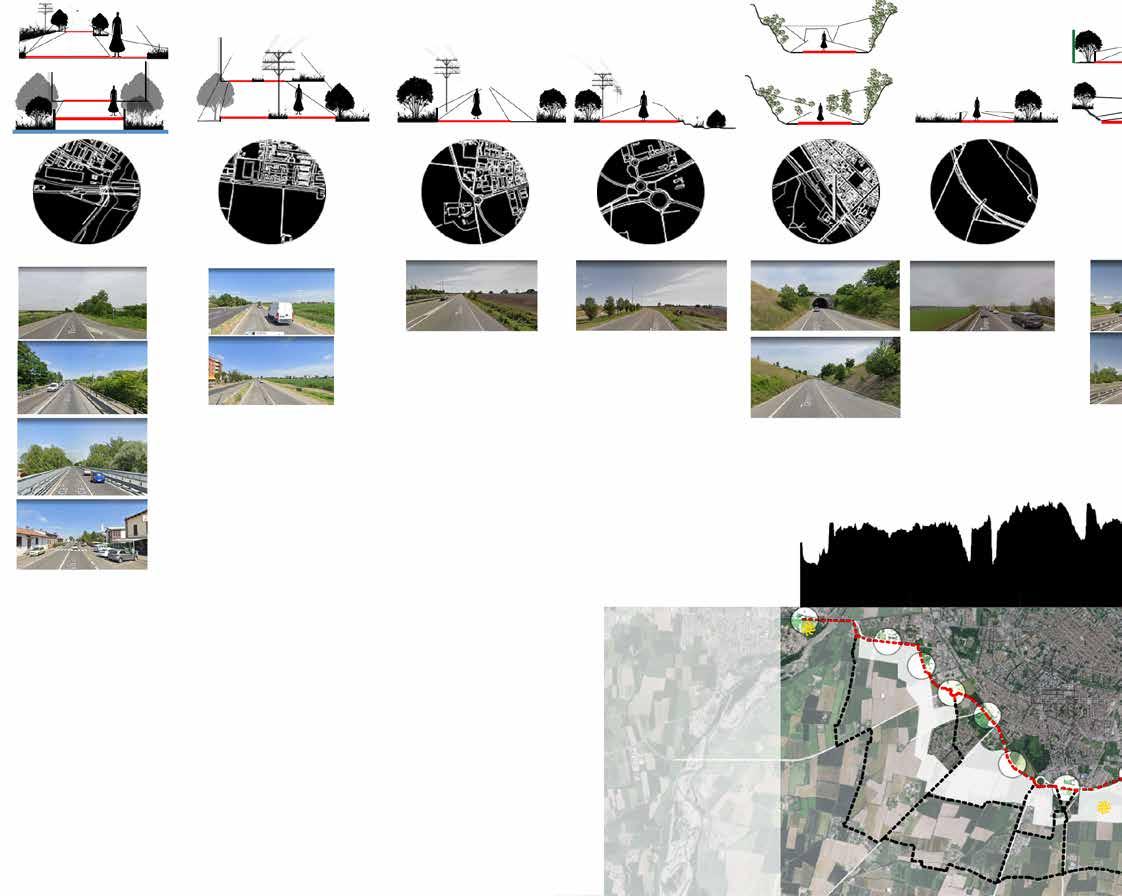
Diagram of the path of storytelling in Ru ral Piacenza
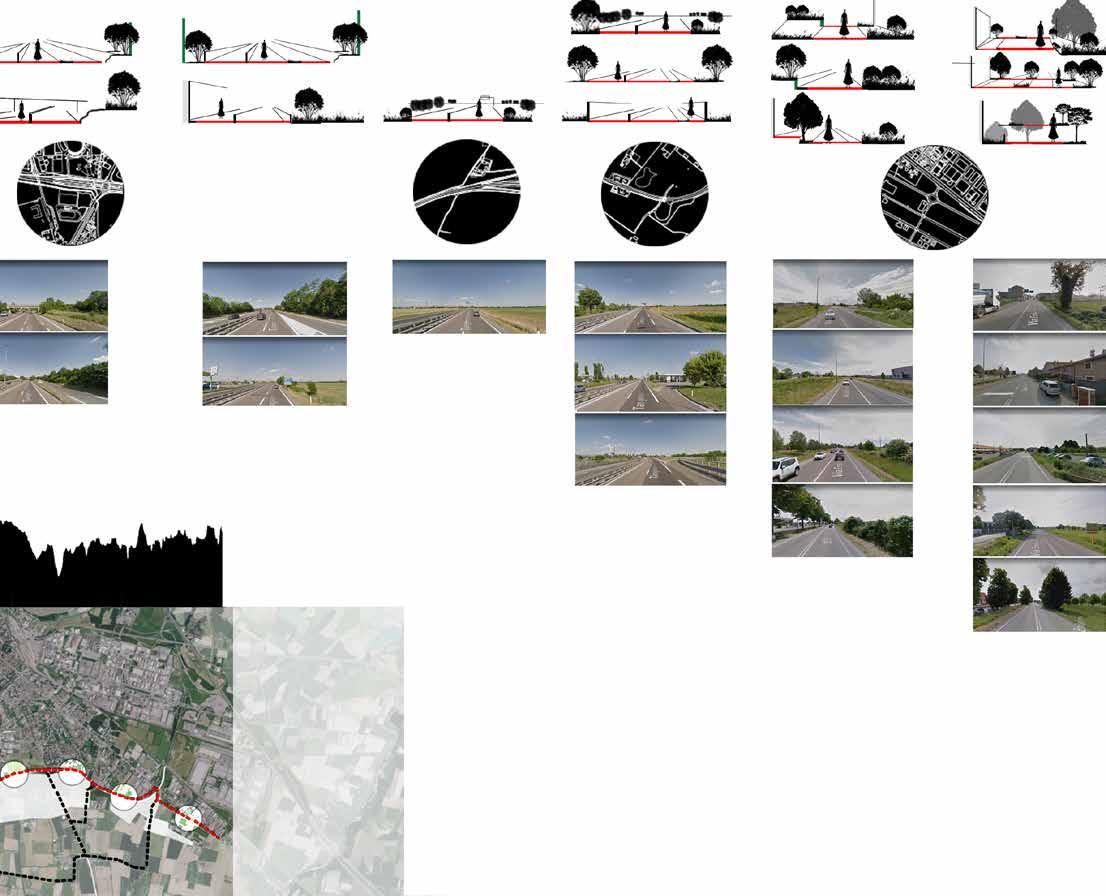 Figure 8
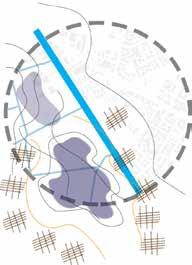
The second selected path in the rural area of Piacenza was the longer path, the one used for liesure, not for haste. Through this route we were able to indentify the different layers and their intensity at
different locations. From the small sections it is quite clear the depth and inntgration of the elements together to crea te this world of Cashinas.
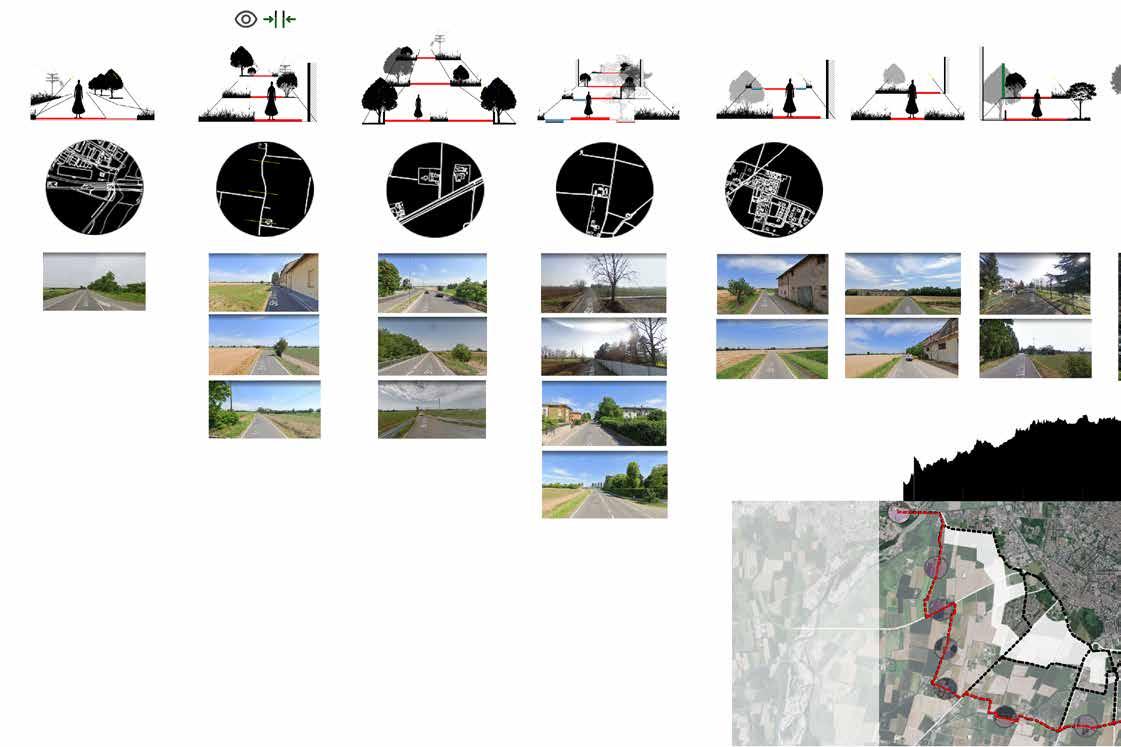
Diagram of the path of storytelling in Ru ral Piacenza
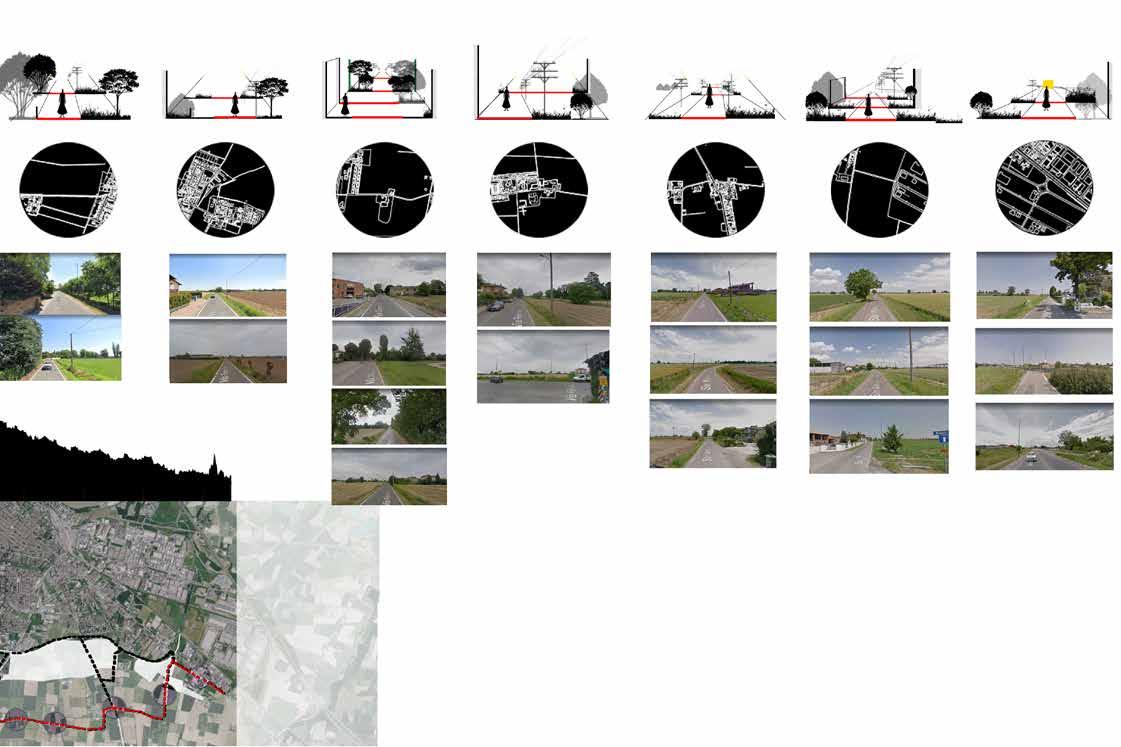 Figure 9
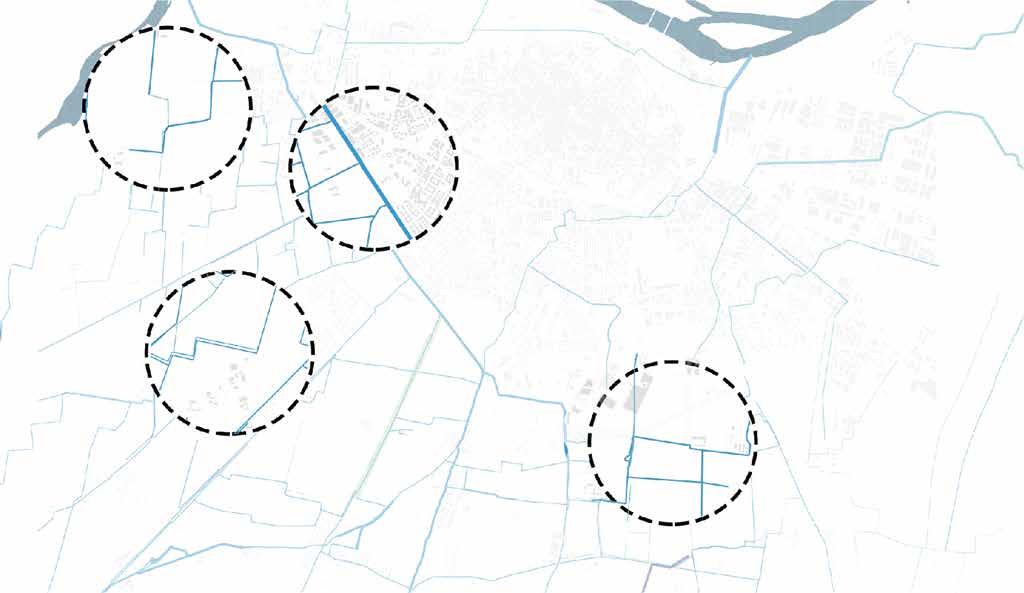
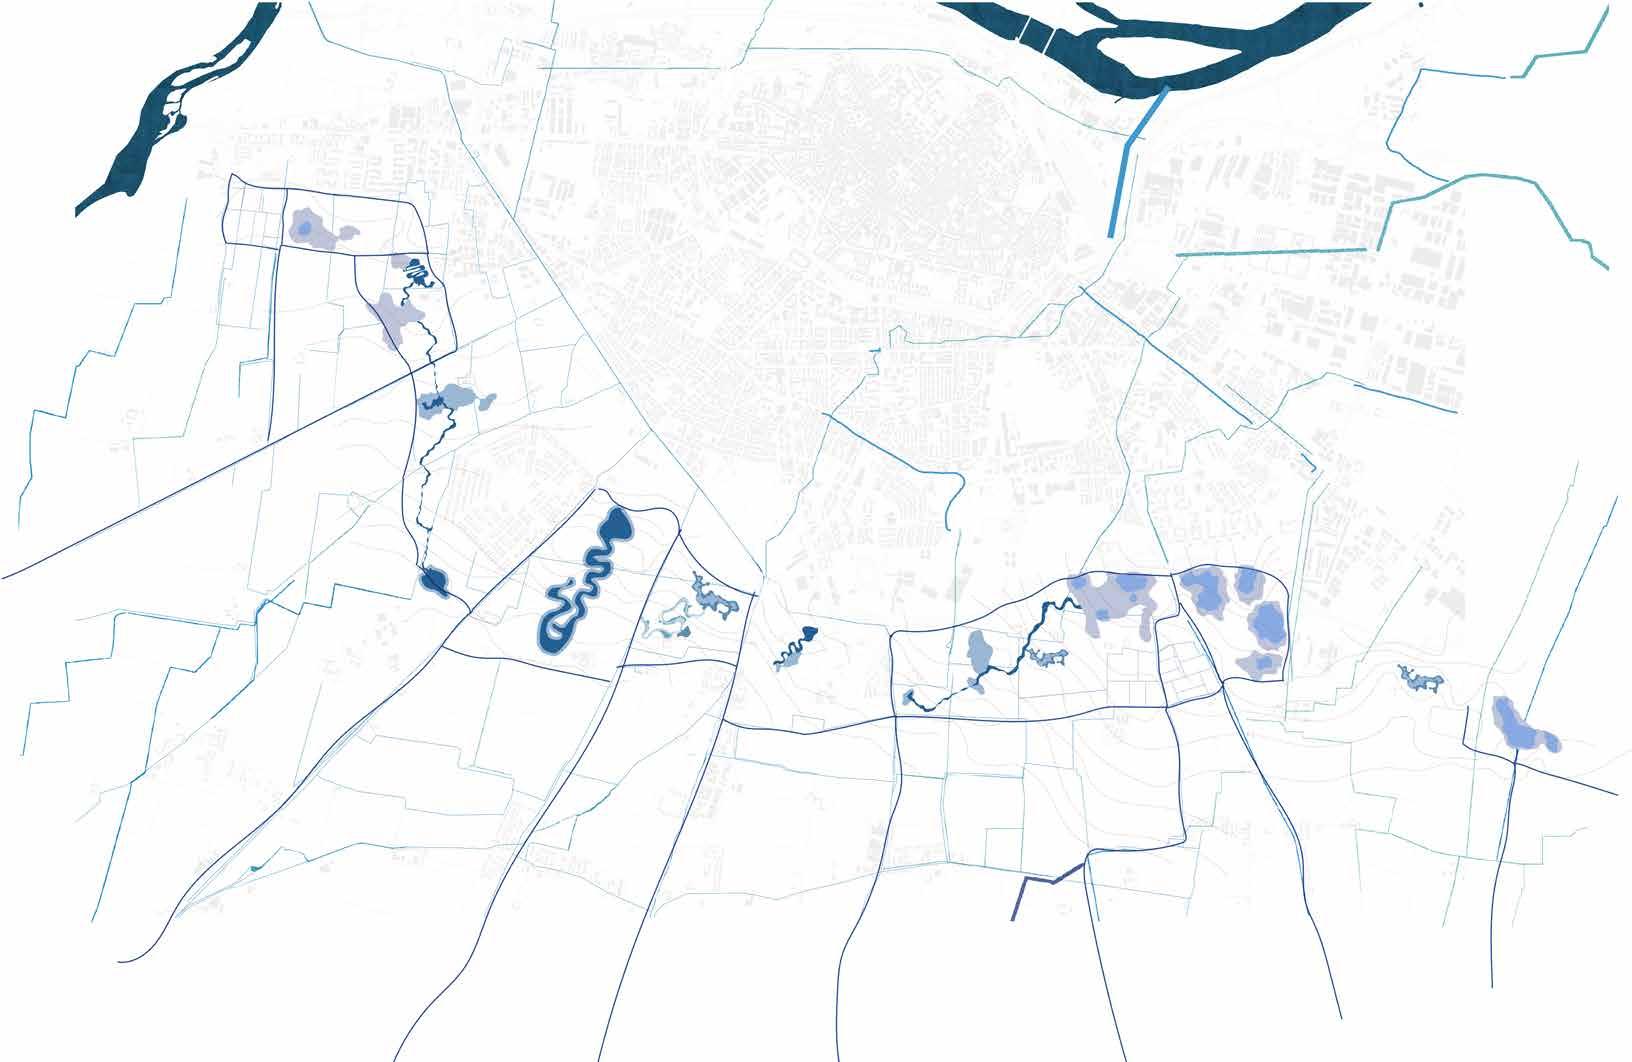
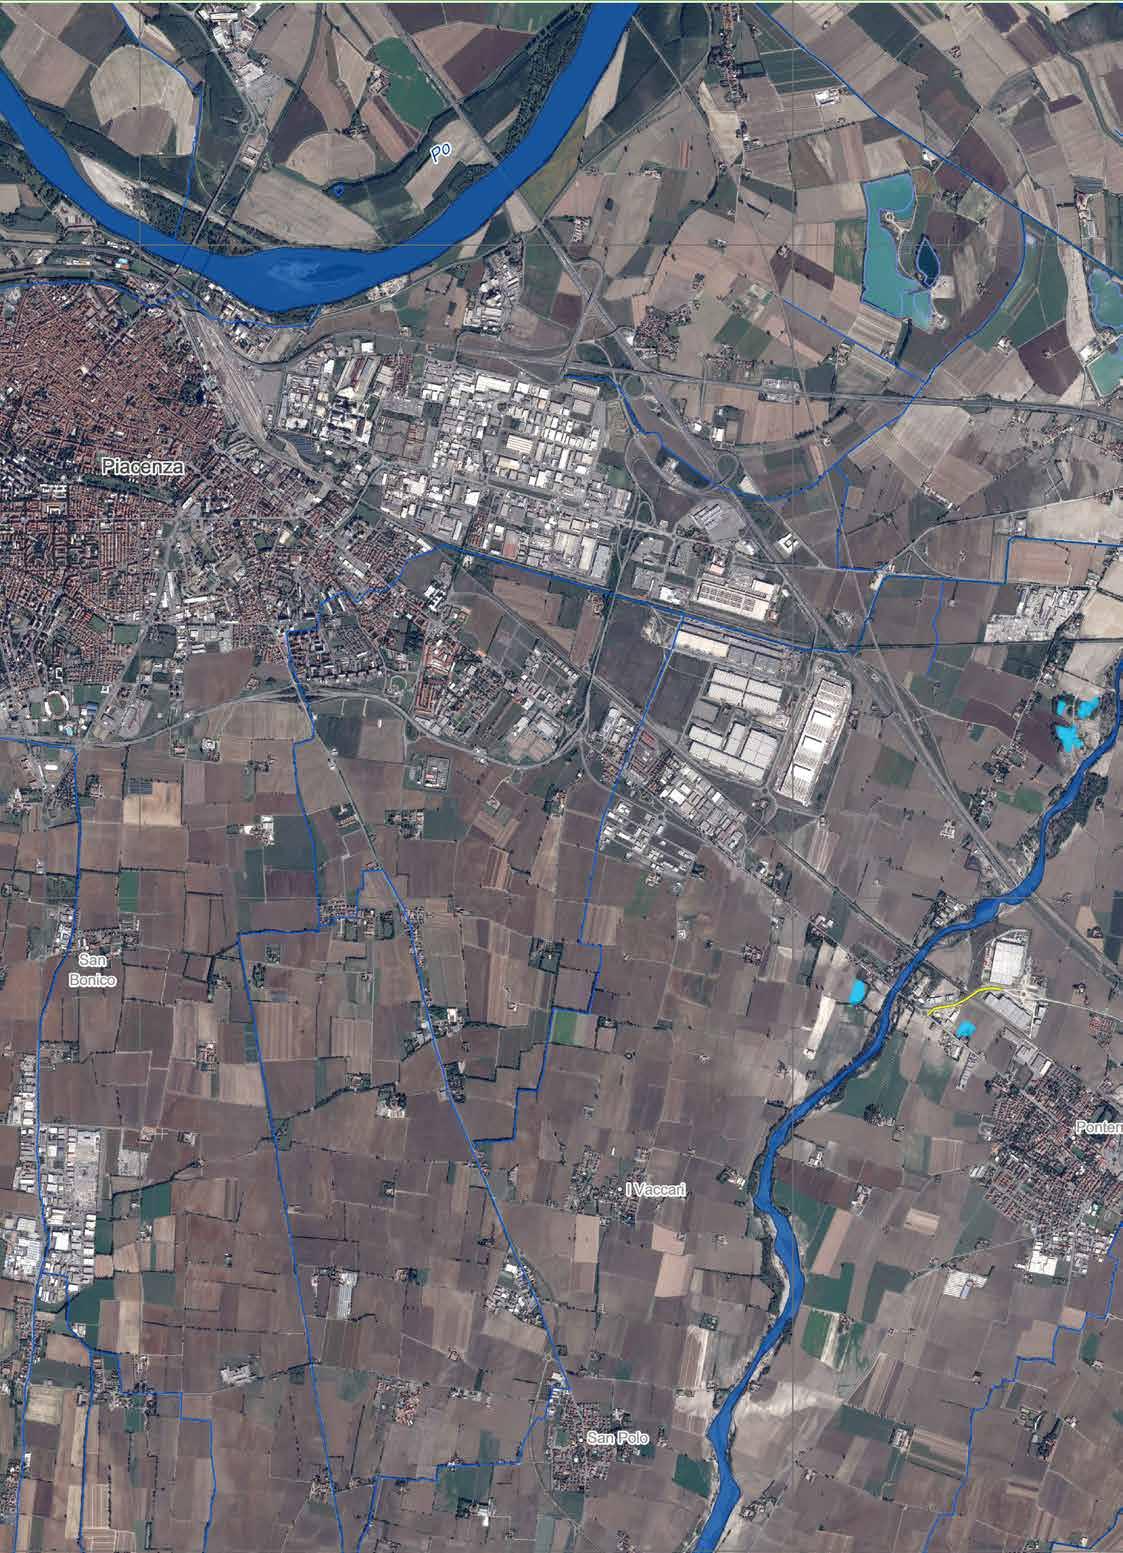
This Route is made to unravel the relationship between the city and the rural areas of Piacenza using the infrastrcuture. This storytelling route shows Piacenza context from nor th to south and allowed us to understand how is the con nection from the urban center to the rural landscape. The path inevitably intersects the ring road, which repre sents a physical barrier between these two main areas, for this reason street sections have been realised and analysed.
Sections allow us to interpret how the pedestrian faces with the surrounding landscape, in terms of buildings and monu ments, infrastructures, open green areas, parks and canals.
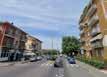
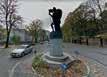
Starting from the center of Piazza Cavalli, the fulcrum of the histo ric center of the city of Piacenza, it is immediately possible to no tice that people walking on the streets are surrounded by historic buildings of great value, which act as a “theatrical background”.
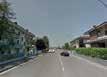
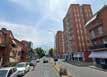
As the pedestrian move away from the historic center the sur rounding context expands and the view becomes wider, for this reason there are more parks, squares and articulated infra
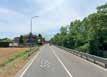
structures, still surrounded by buildings, characterised by re sidential houses higher than the previous historical buildings. When the pedestrian is near the ring road the path becomes more critical, in fact these areas in conjunction with the infra structure are not particularly designed to also be a crossing point.
As a result, pedestrians and bicycles are not in a safe condition. However, after the obstacle of the infrastructure, the pedestrian reach a more open and boundless place. There, the roads that intersect the rural areas are quite scattered and connected with a complex water network. The pedestrian often does not have a path dedicated to itself, but shares the roadway with motor vehicles. The surrounding green areas are very large and have different functions, including the main agricultural one. In this rural context there are also small cores detached from the urban center where, however, it is possible to find residences, few services but above all an interesting historical architectural heritage.
 PIAZZA CAVALLI
PITTOLO
Figure 10
Diagram of the path of storytelling in City Center
PIAZZA CAVALLI
PITTOLO
Figure 10
Diagram of the path of storytelling in City Center
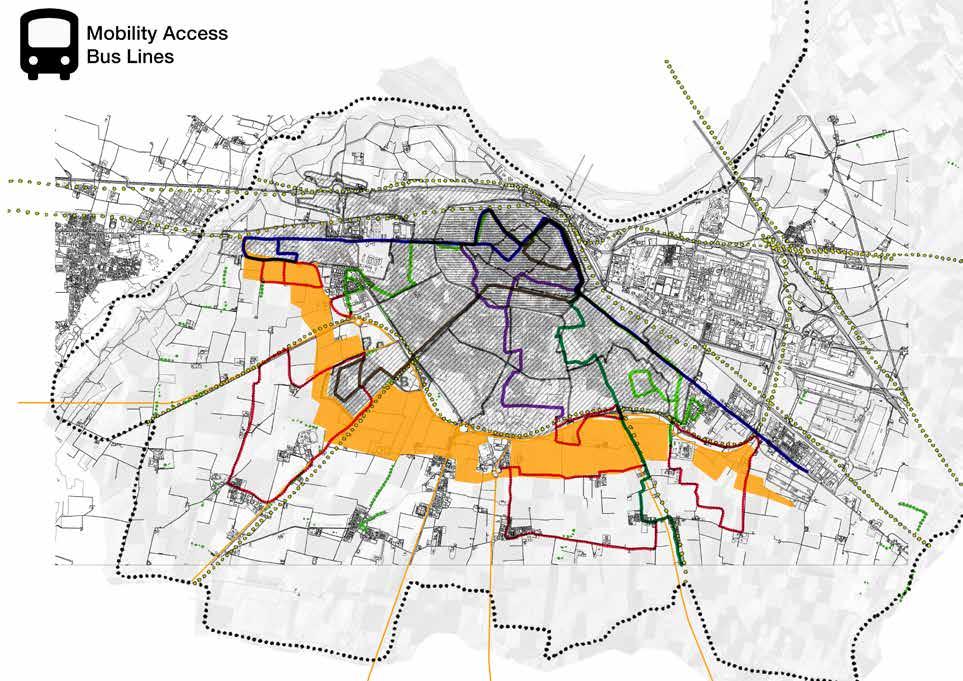
We were trying to map out the mobility lines from the cuty center to the rural area, mainly our site. We mapped out every bus line and suggested line ex tention in order to reach the site.
We noticed that not all the li nes have adeqaute interaction with the rural zone. Through this observation we were able to understand why not alot of visitors have a clear appricita ion of the rural world on this side of the ring road.
Figure 11
Map of exisiting and proposed mobility.
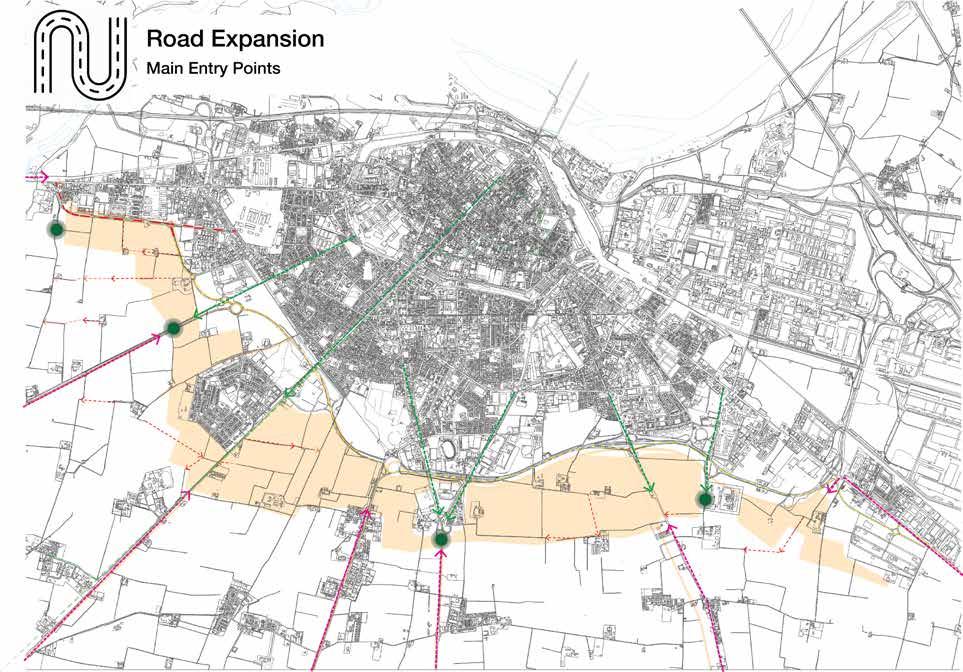
Once we mapped out the di rection of the connection from the city to the farms. We mo ved on to the farms and the disconnection they have. So we proposed a series of con nections between the inner streets and the enhancment of the cycling lanes along with the having gate like streets that take you from the Motorway to the farms. We want to have an organized network, yet still preserving the charm of the ru ral landscape.
Figure 12
Map of linking the missing mobility con nections.
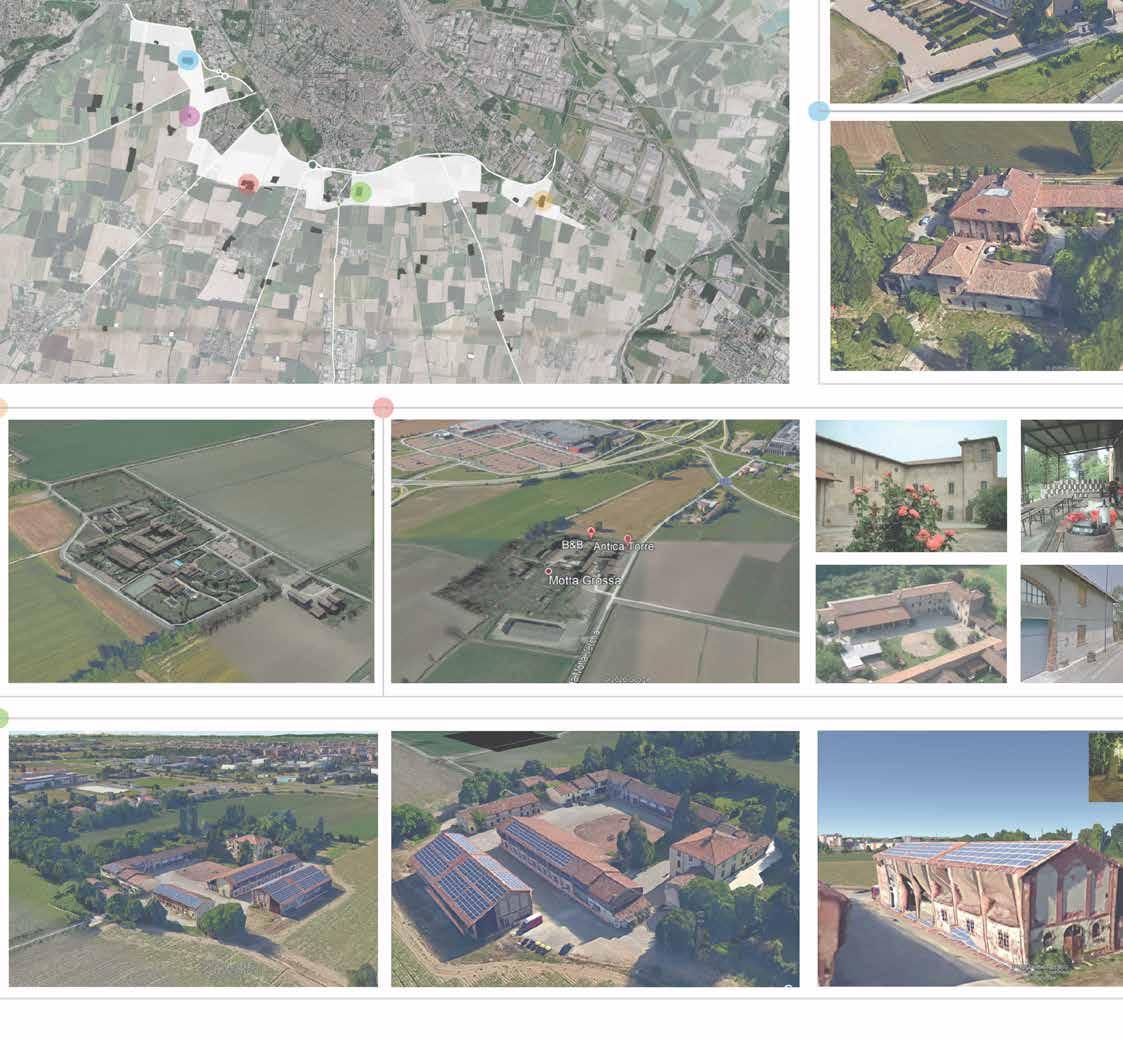
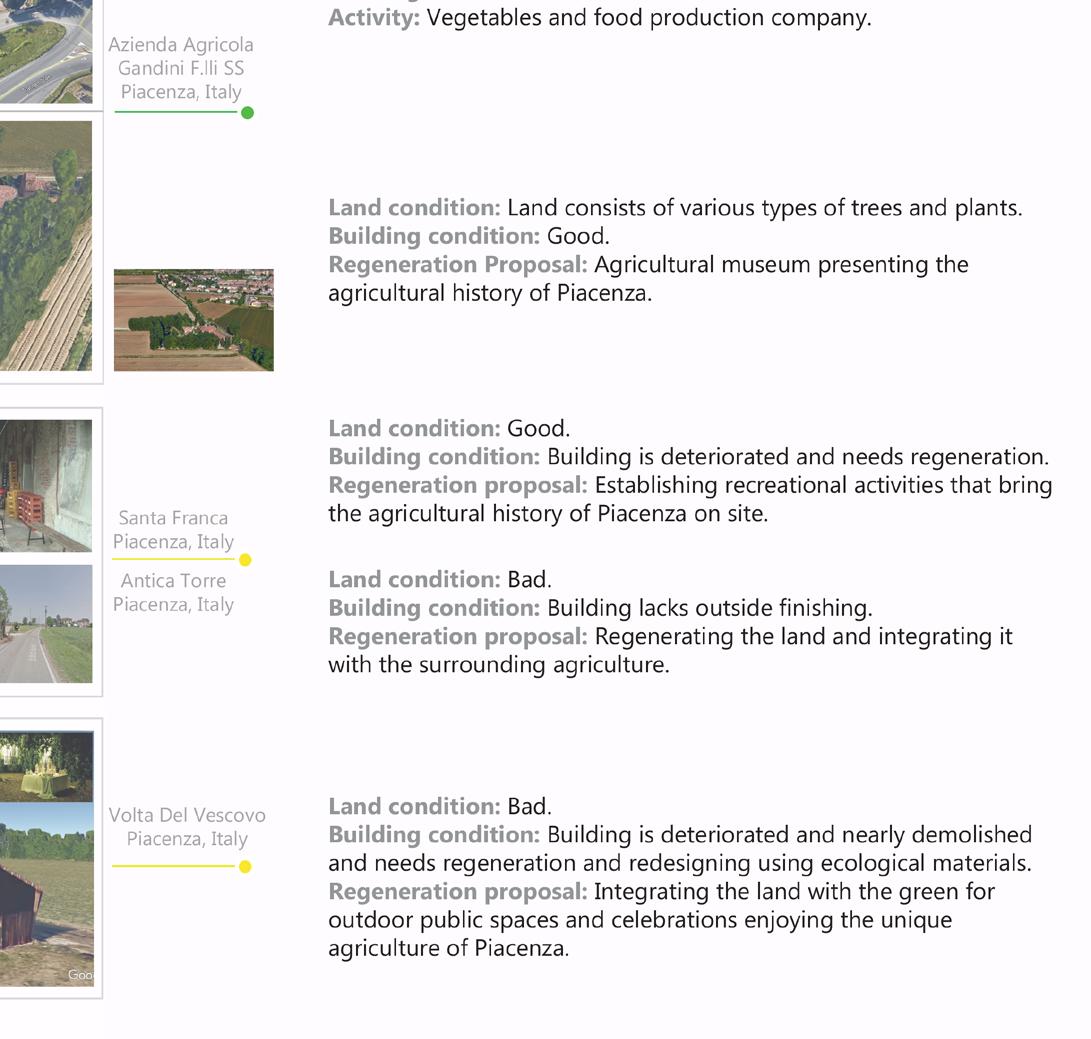

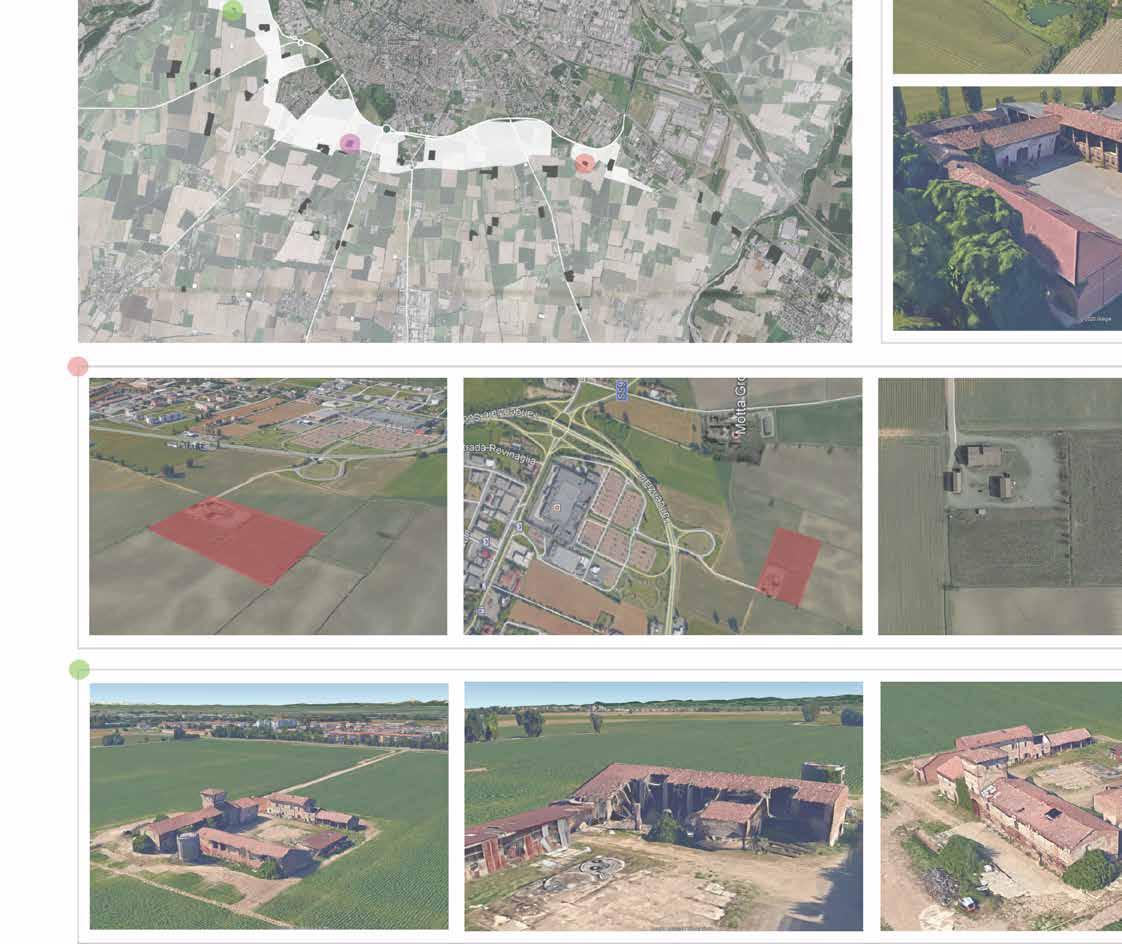
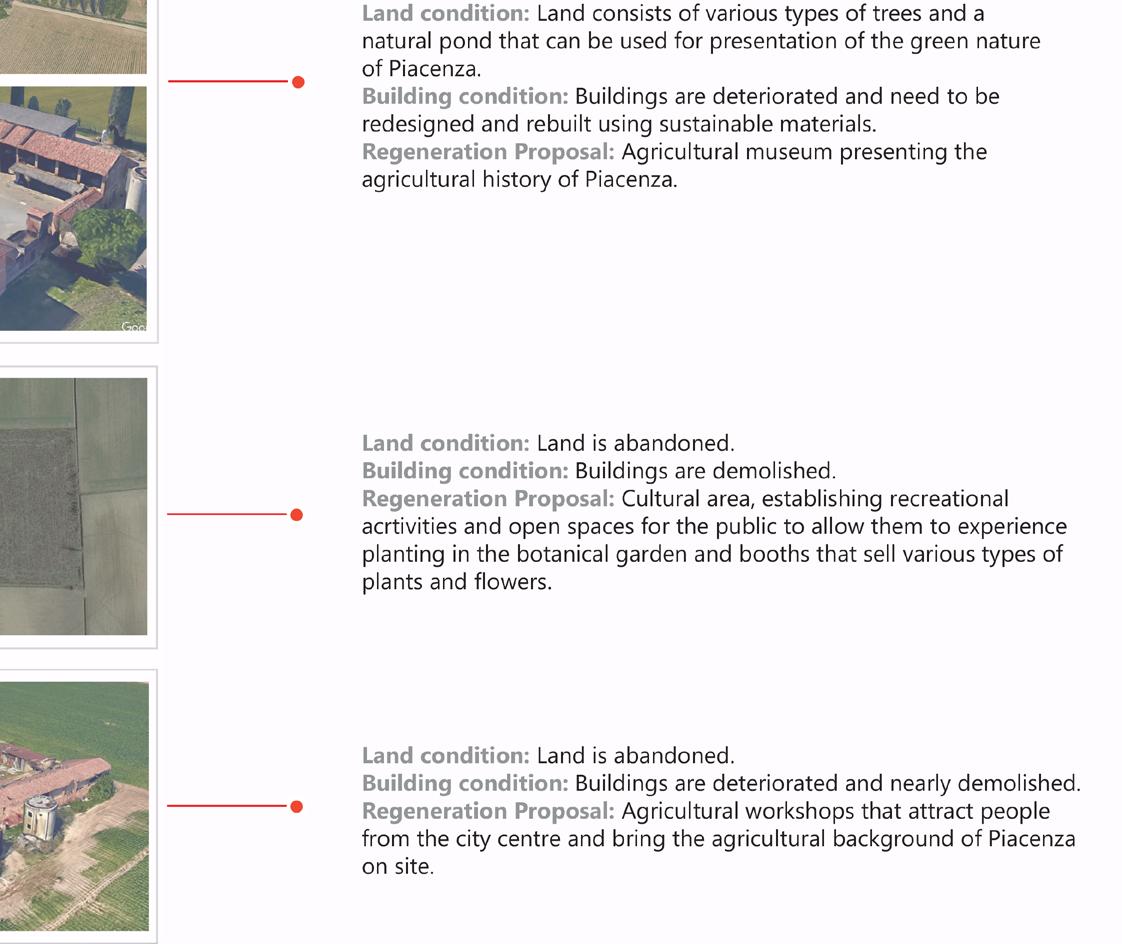
A series of survyes were conducted on the exisiting buildings in order to understand the potential of reusing them again in the new vision of the land
Reviving the History, Regeneration of abandoned buildings in the peri-urban areas of Piacenza by creating spaces for activities that attract younger age groups from the city center to the peri-urban.
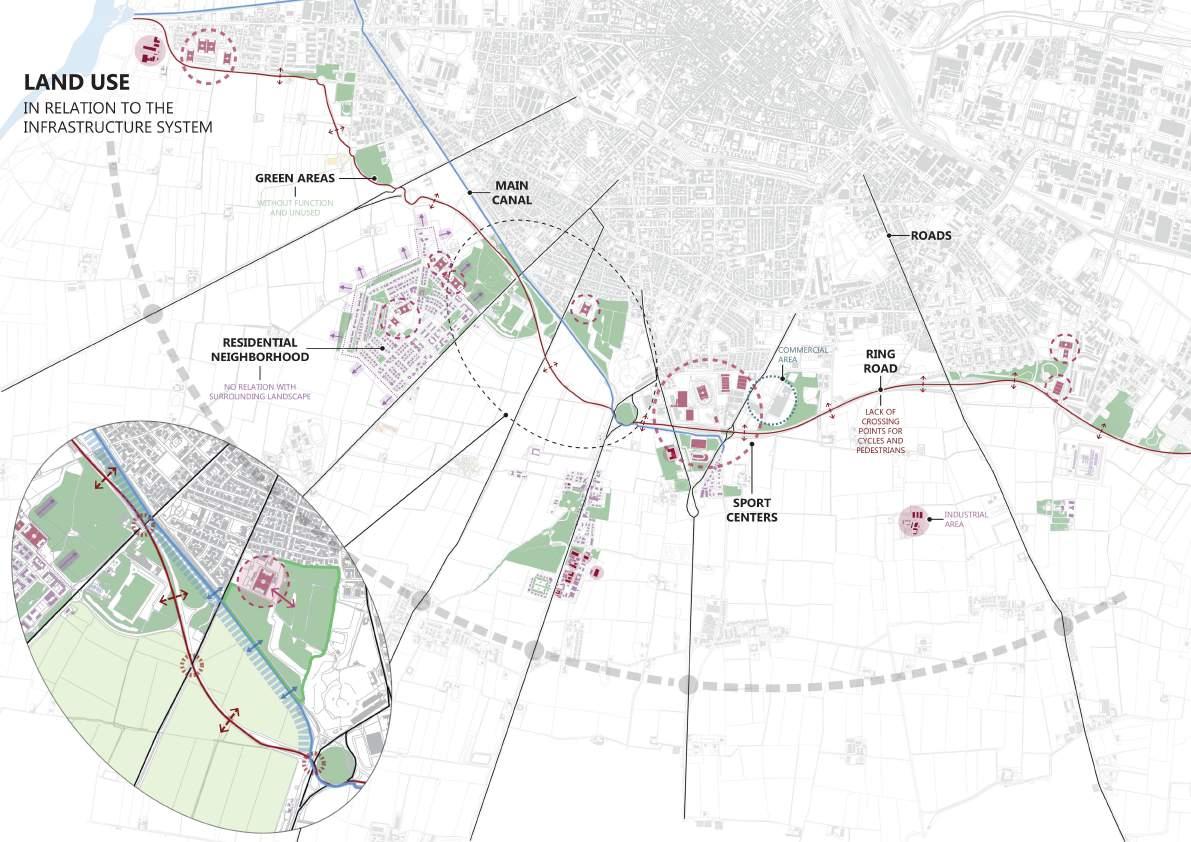
After doing the land use analysis we can conclude that :
There are many underutilized green spaces sur rounding the tangenciale which can be transformed into potential area.
There are many underutilized greenary surroun ding the residential area which can be transformed into useful spaces arround the residential area.
The main functions of the built are is residential.
There are many sport fields sprending into the analysed area
Lack of pedestrian links
Lack of cycling links
The one link between the vertical infrastructure is the tangenciale
Lack of mobility (busses , cycling,pedestrian )
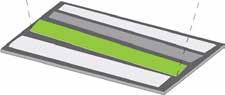
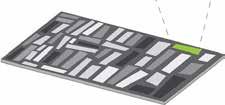
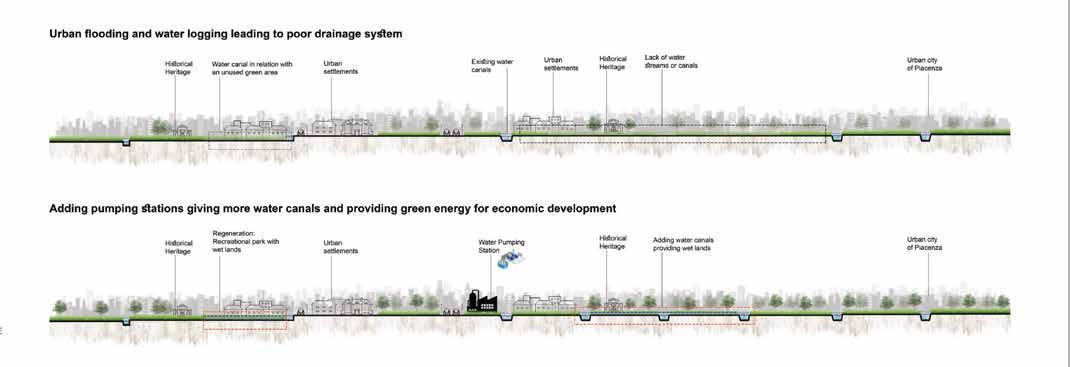
Figure 1 e.g. Concpeutal Diagram
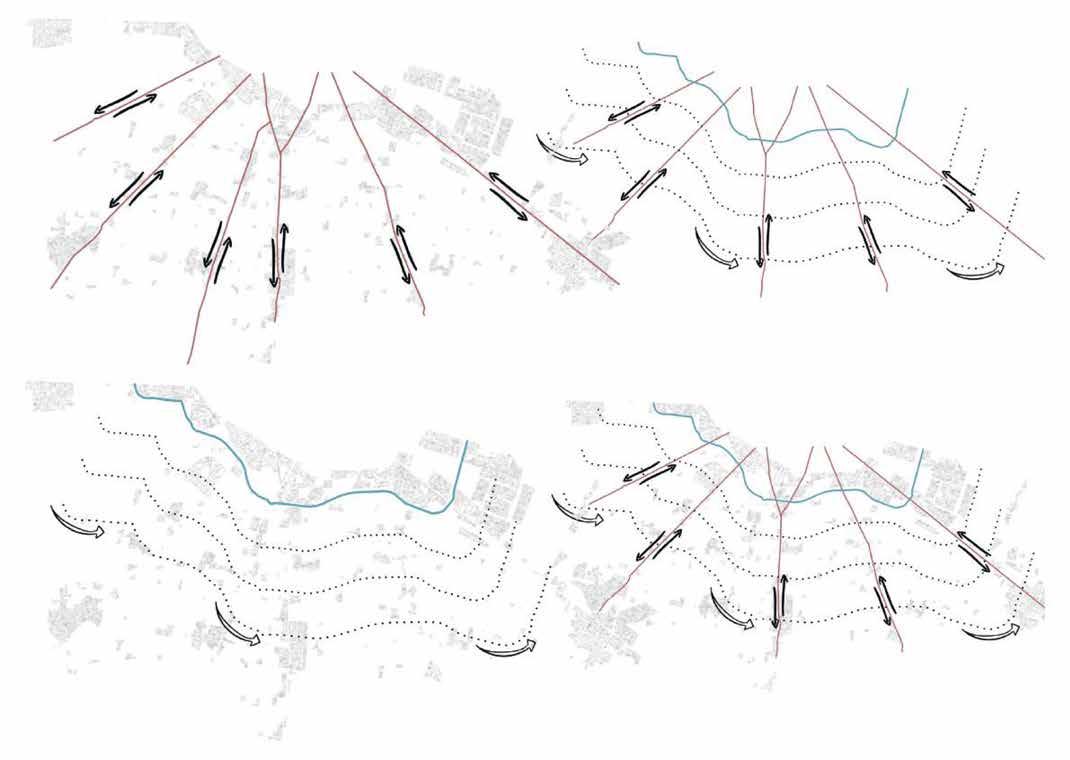
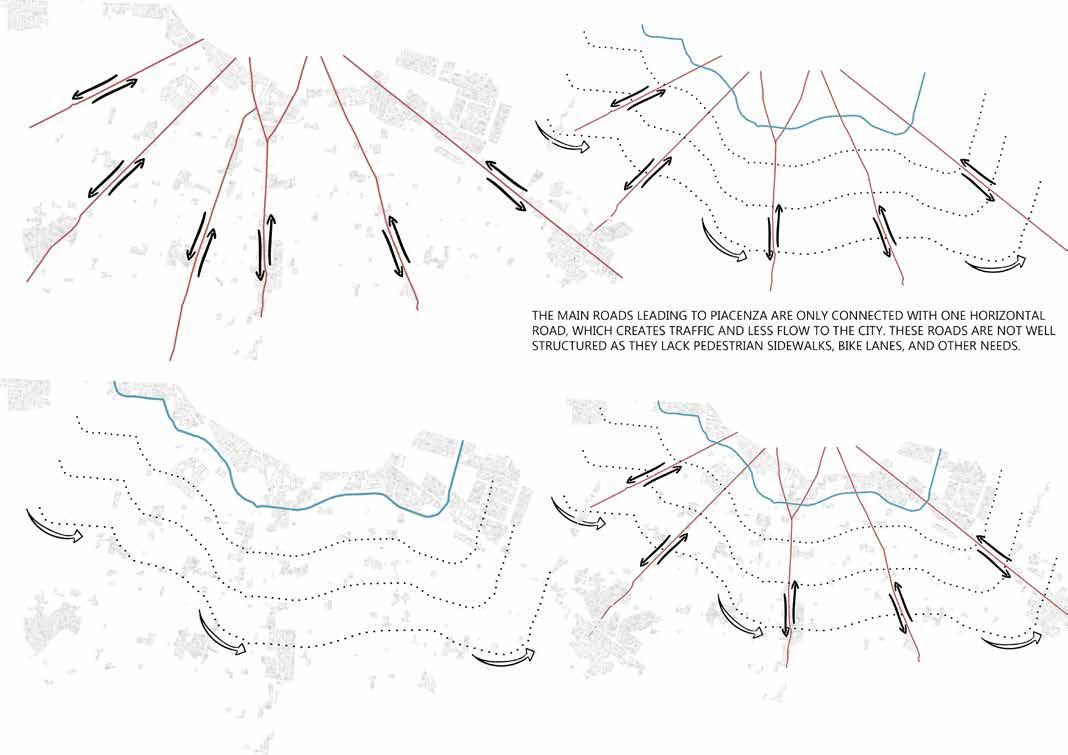
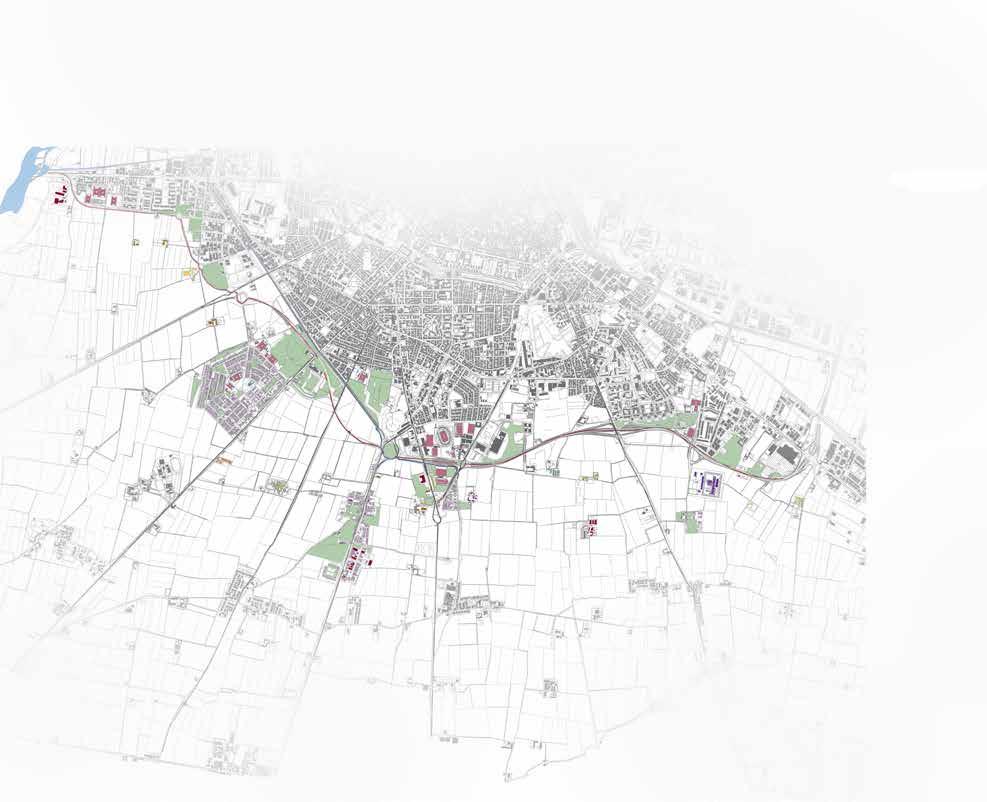
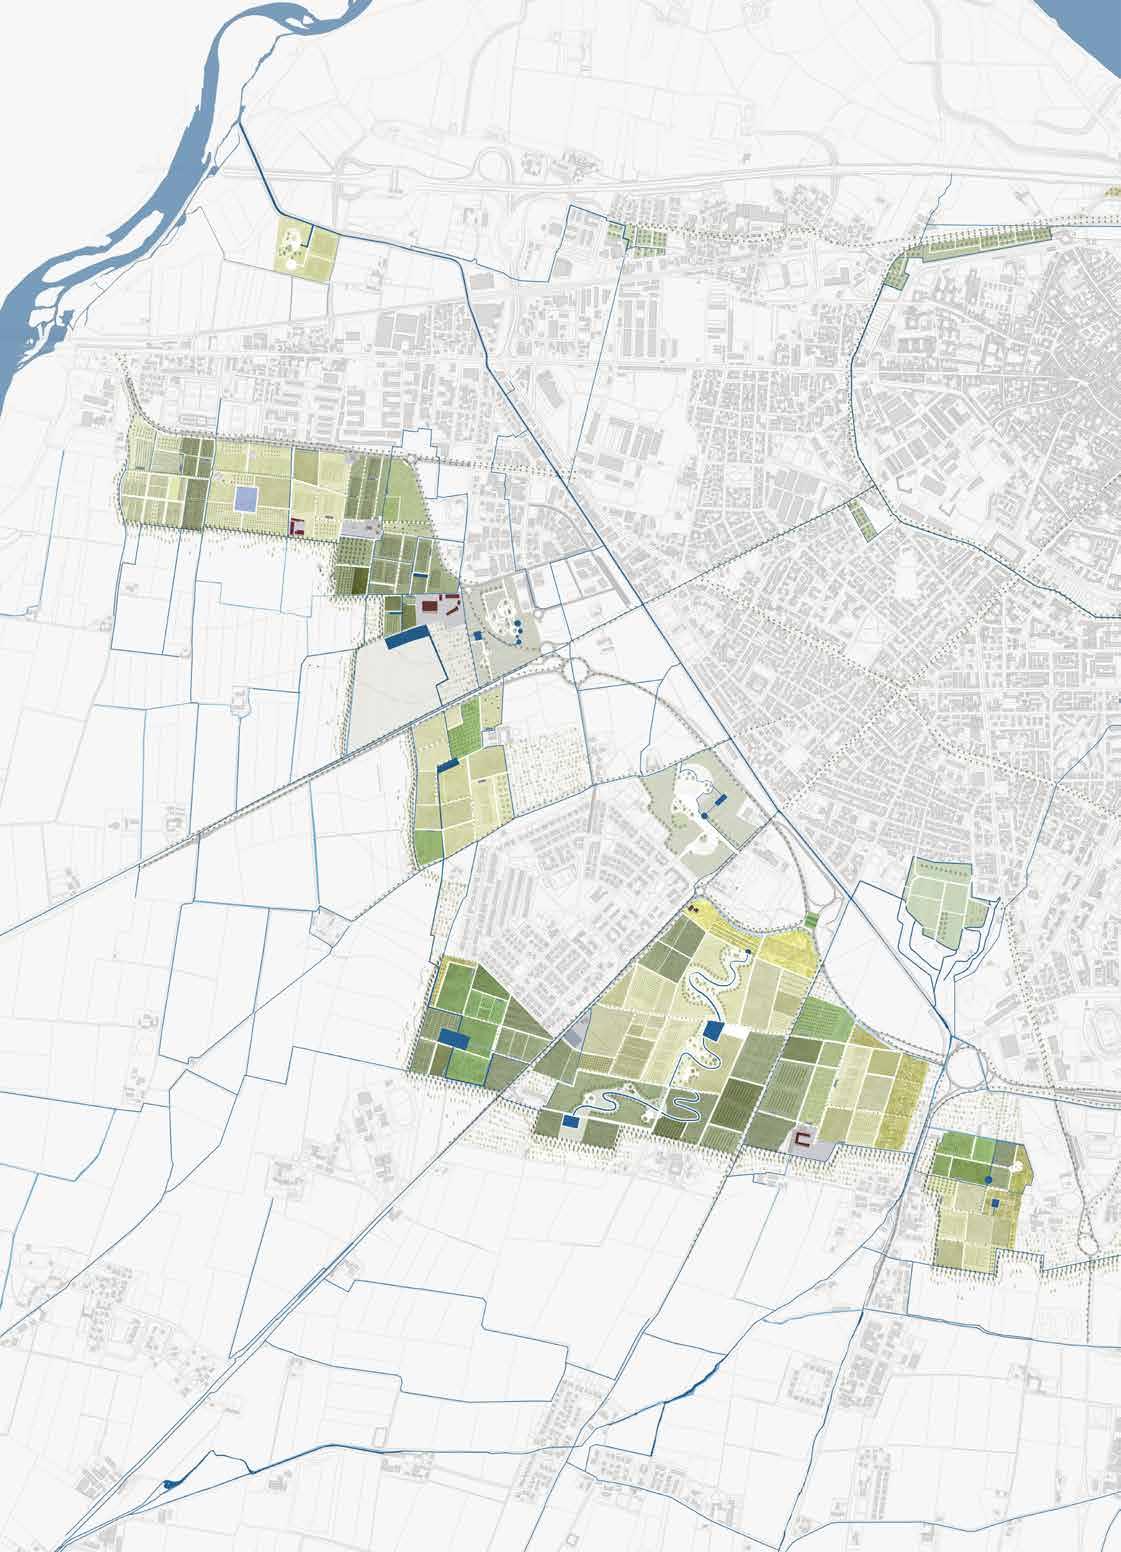
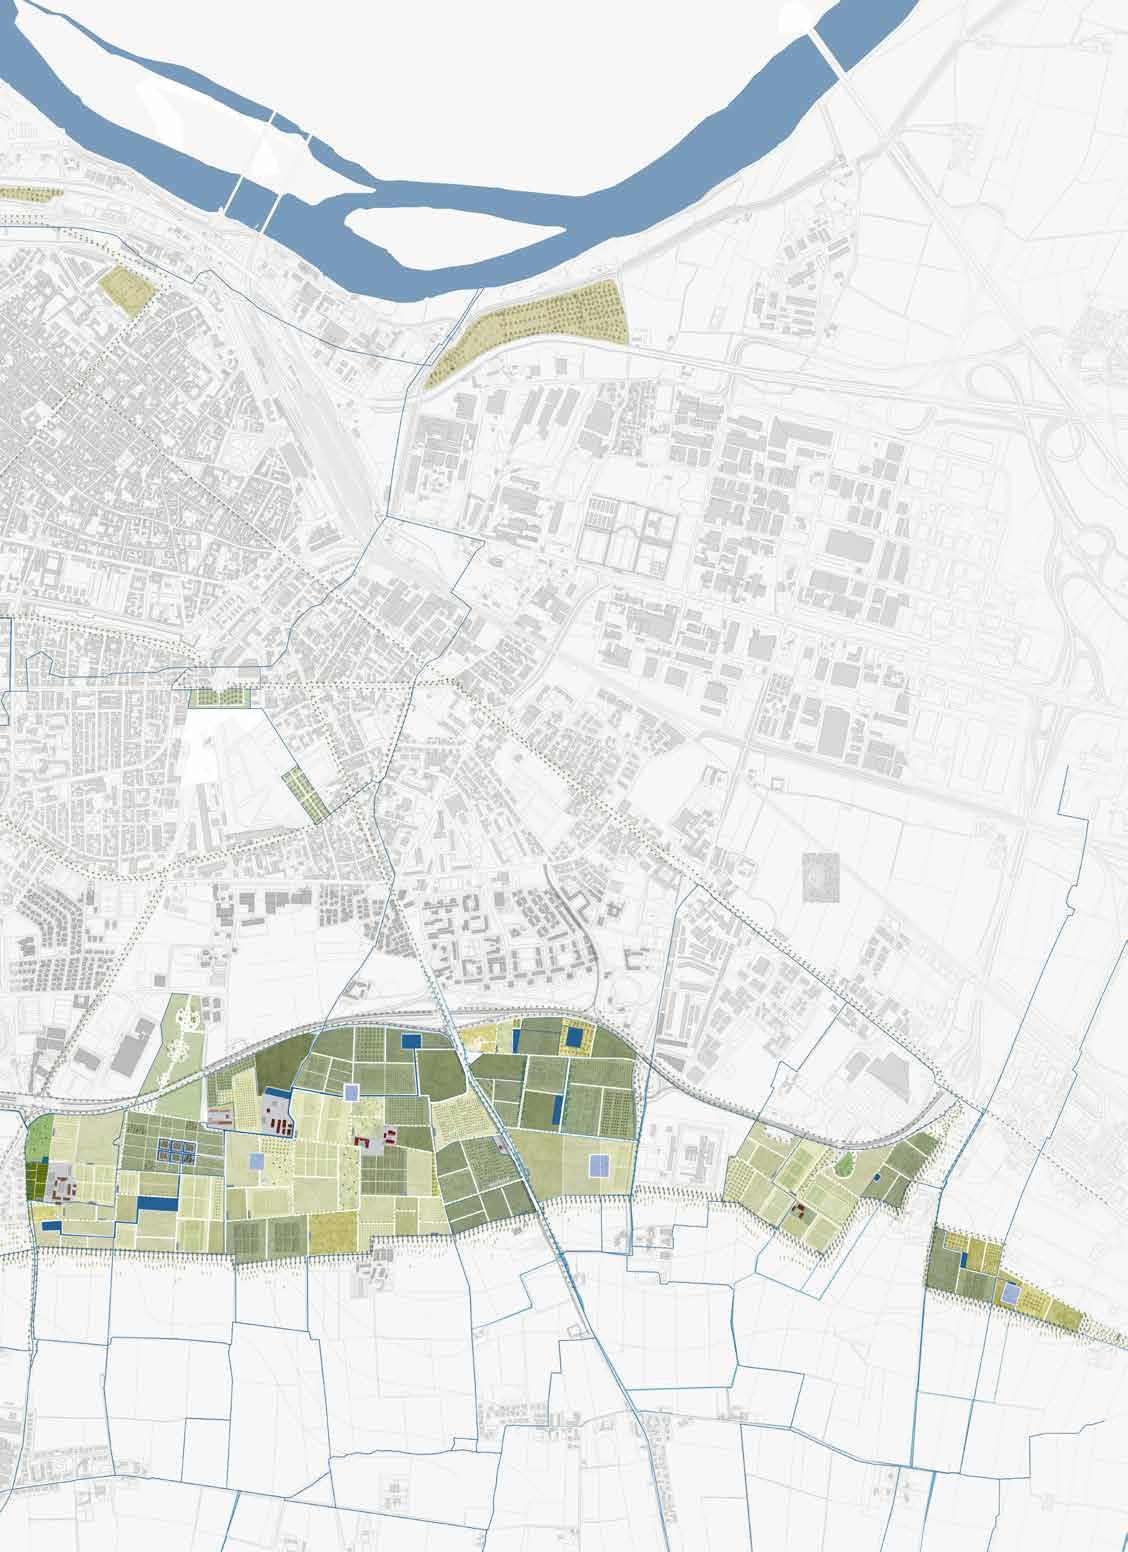
The center of piacenza is a codeensed cluster; however as we move away from the city into the rural and semi rural area the density clearly decreases with the increase of abandon and empty green spaces.
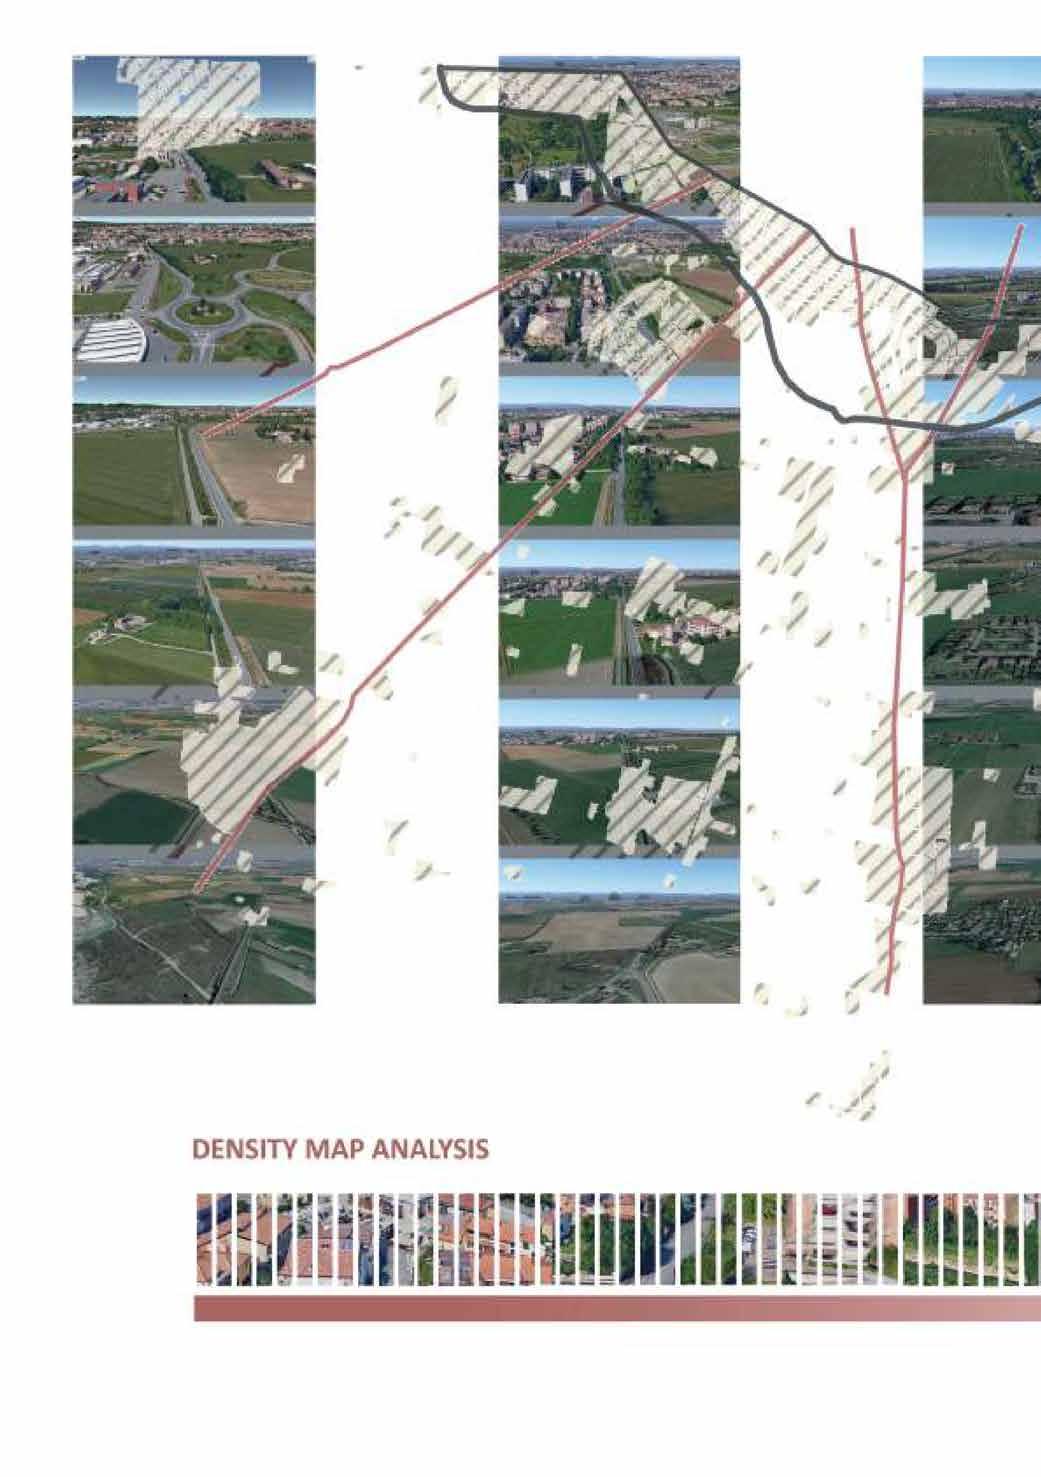
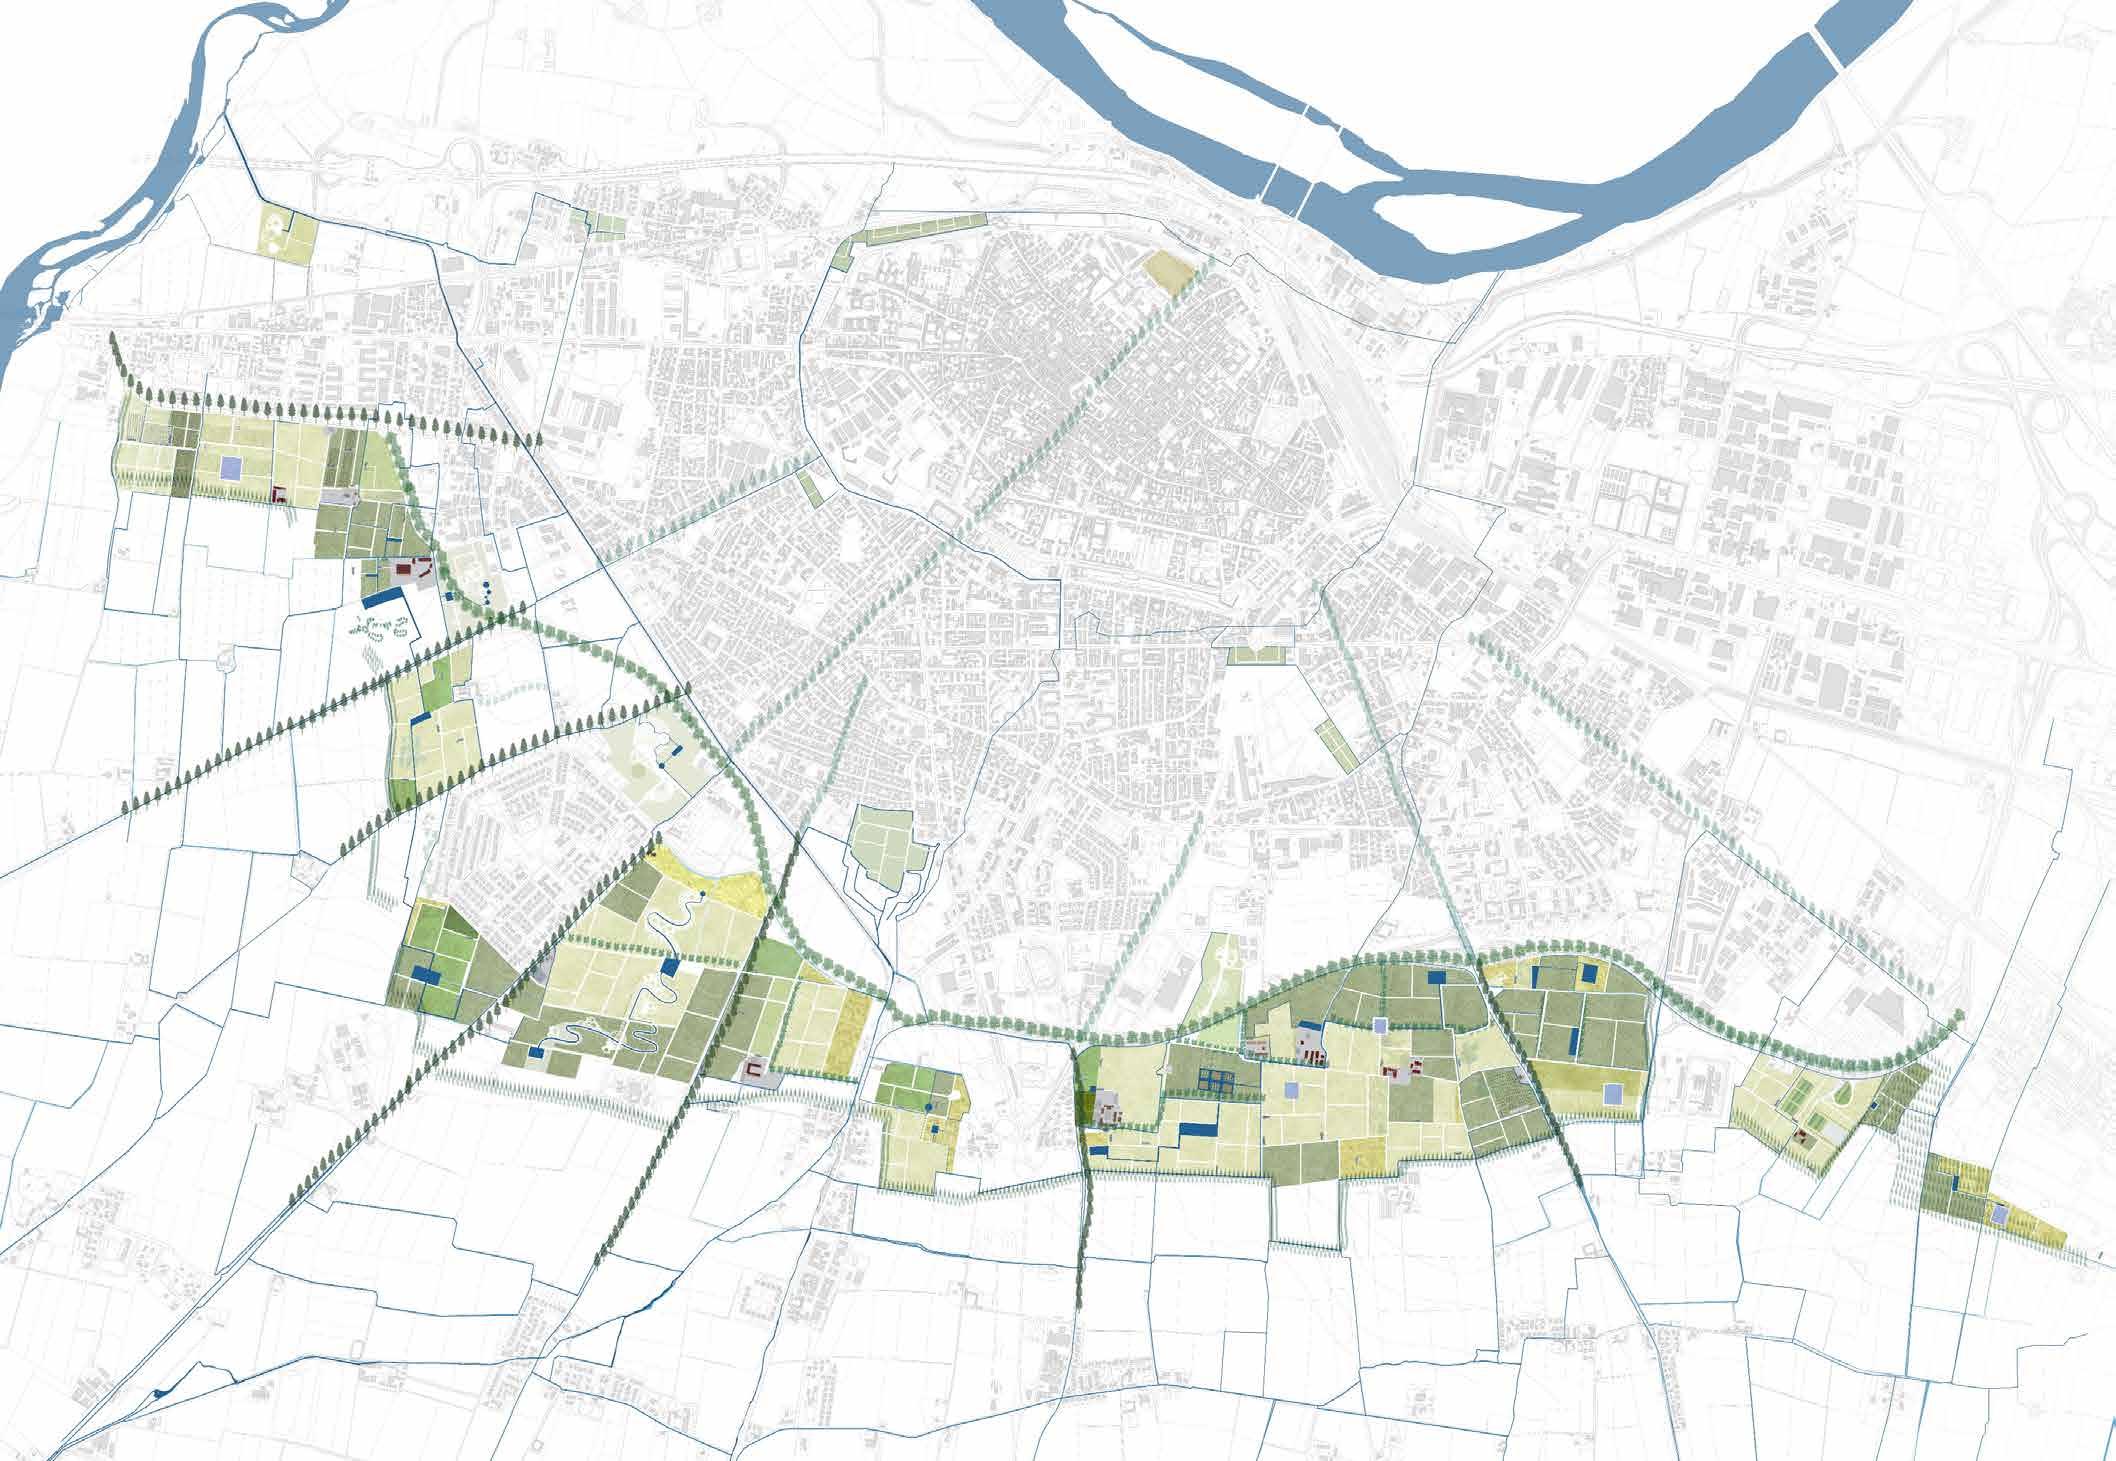
A first analysis of the Piacenza area was carried out on the existing con dition of the landscape and in par ticular we can note that it gravitates around the ring road’s massive in frastructure: to the north the historic center, the urban and semi-urban are as, while to the south the open rural landscape. The ring road represents a real barrier, not only physical, but also social, commercial and cultural. In particular, the land use of the zo nes near the ring road was classified, this showed the presence of unused green areas not exploited by urban planning and a wide range of sports centres. Industrial areas are not wi despread in this area while, on the other side, there is a particular pre sence of historical artefacts of ar chitectural/landscape interest, that make this place more interesting. Furthermore, it is possible to noti ce that small inhabited centers have no relationship with the near rural context and therefore they are clo sed on themselves, this determines the fact that these inhabited cen ters are more connected to the ur ban core of the city (through the infrastructures) rather than with the surrounding agricultural areas. The presence of the water canal is not so evident in the current territory, it does not have a predominant role in the territory and does not influence nearest areas.
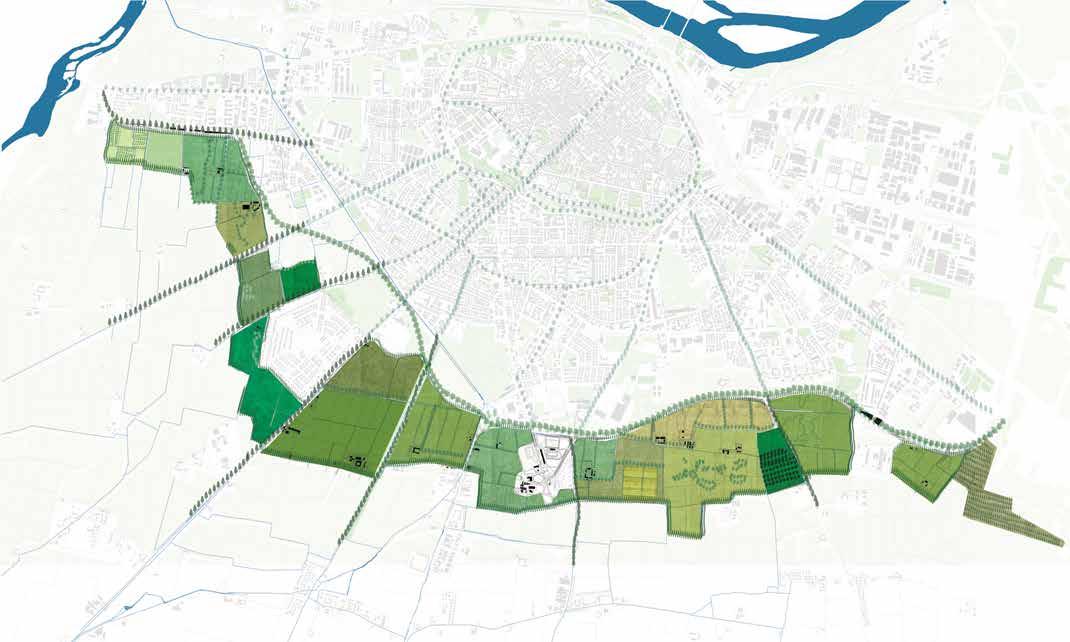
Figure 13
Map of new startegy
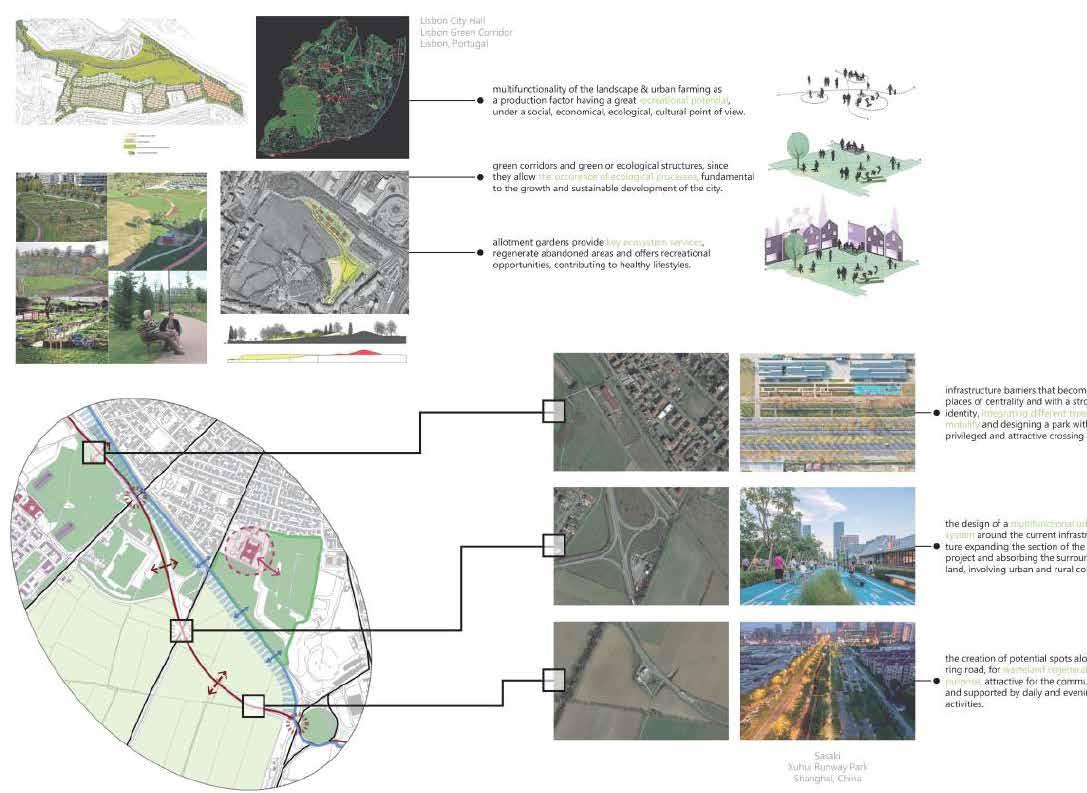
Figure 14
Linking Strategy with casestudies
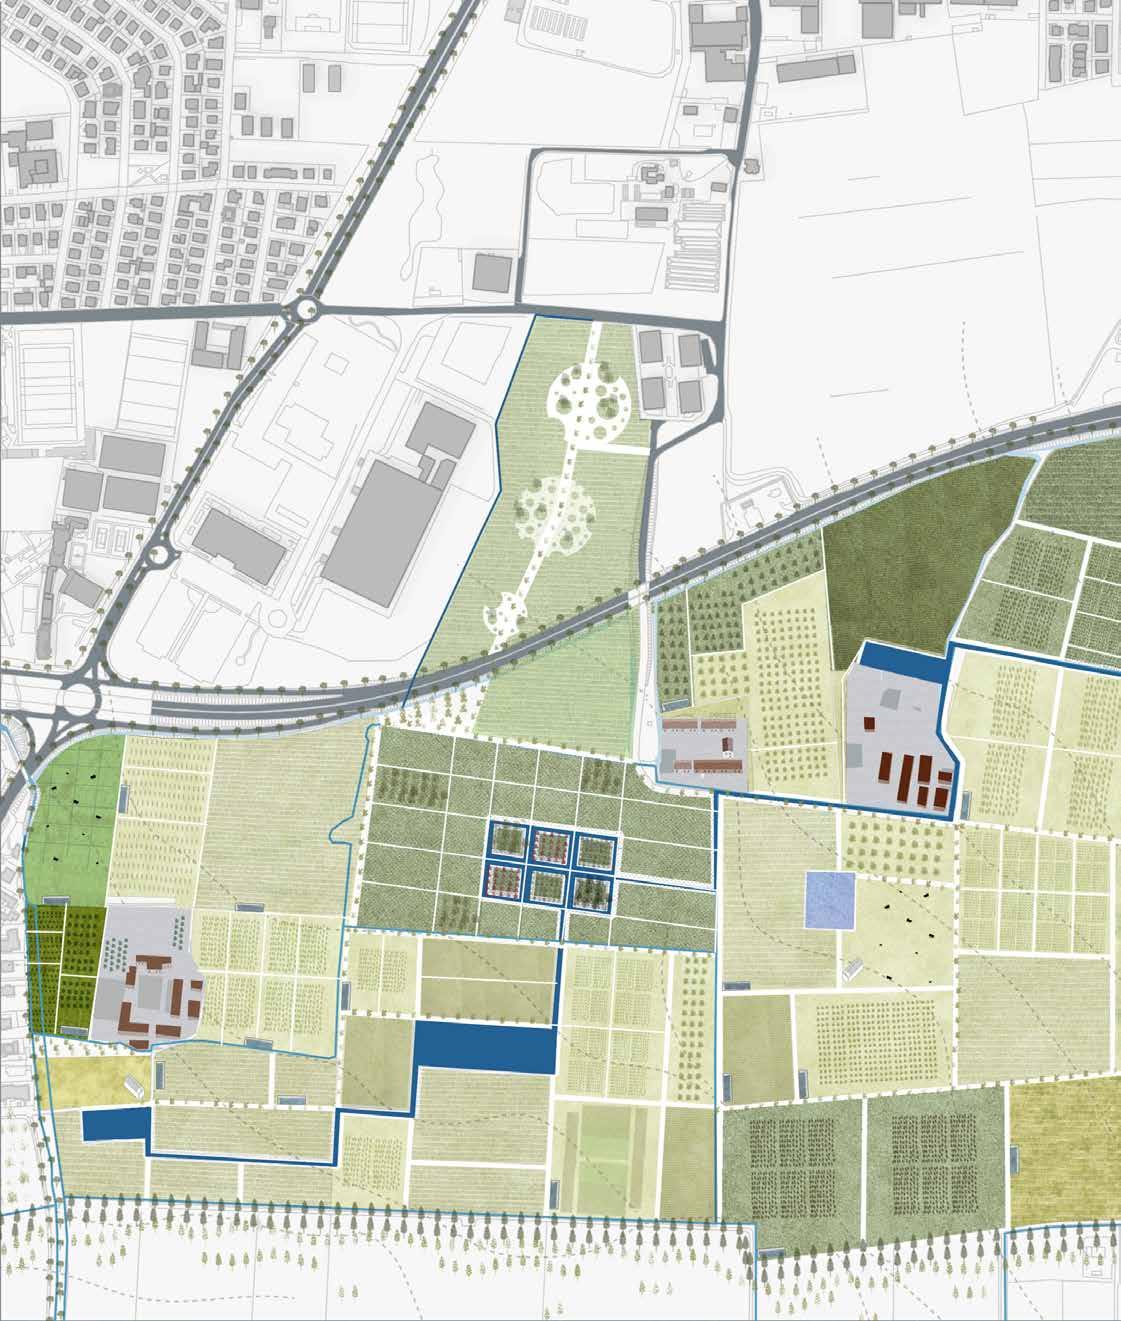
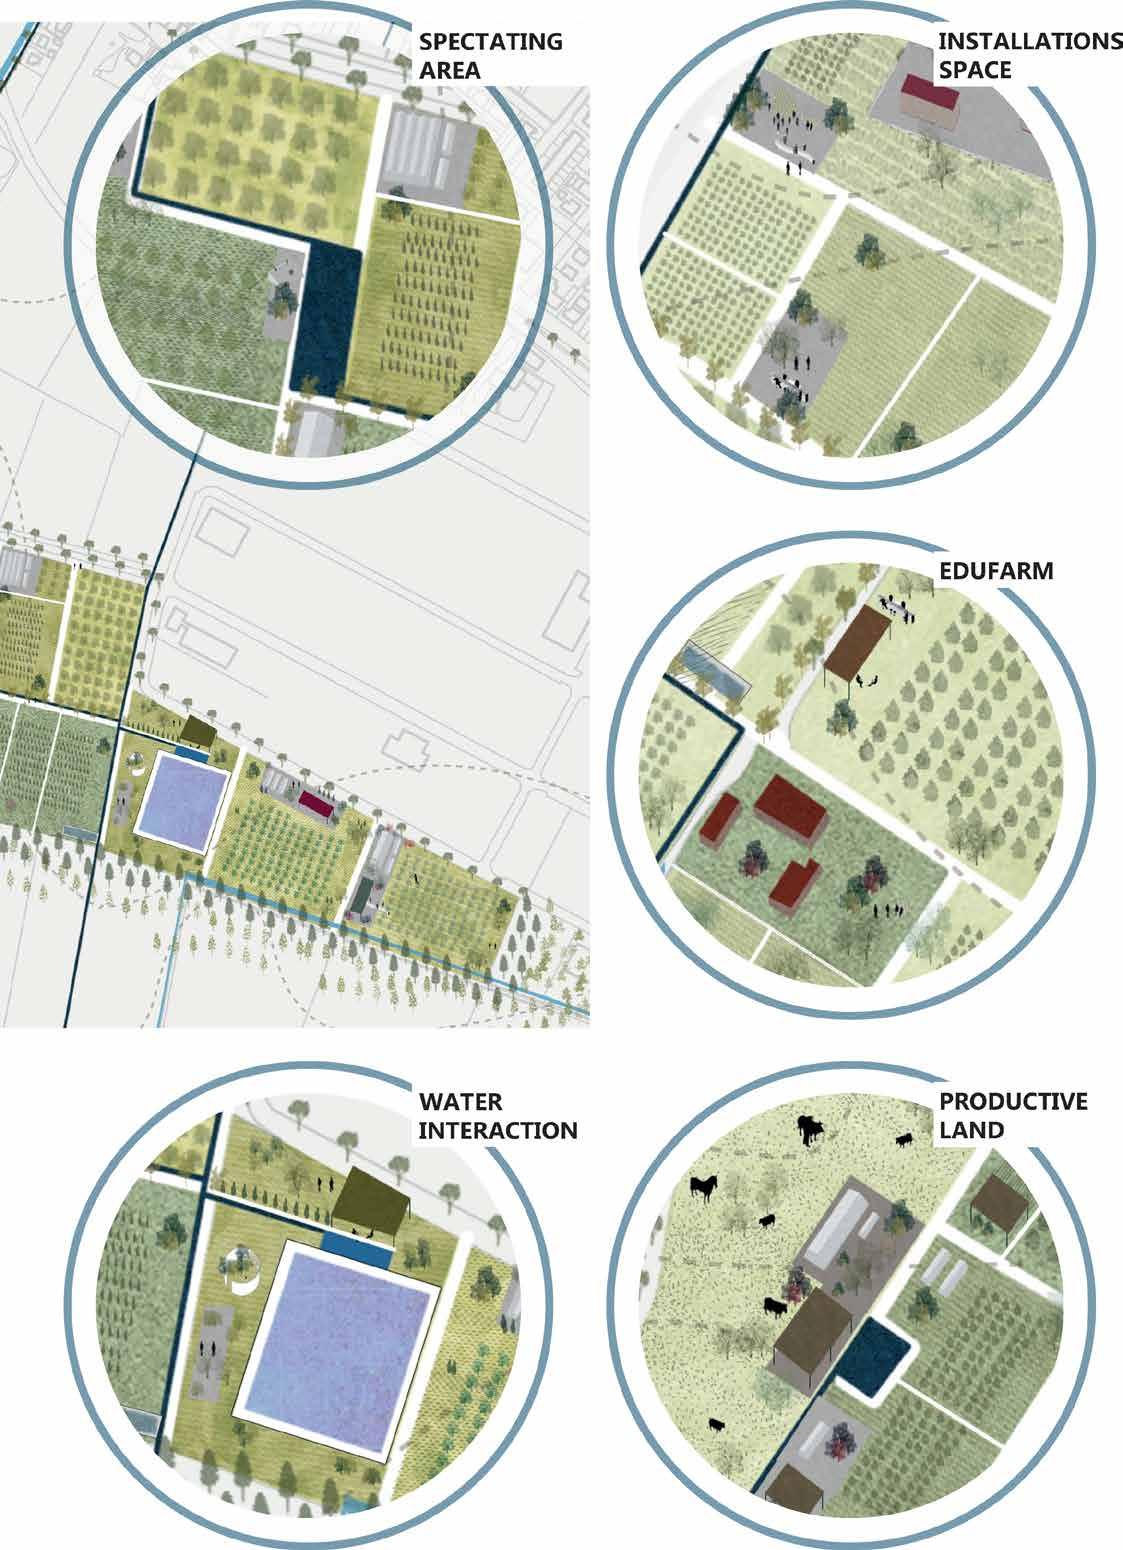
Production and Recreation. Flexible recreation spaces accommodate in dividual users as well as large groups and regional events. The park is al lowed to grow as the neighborhood needs for the site change over time. In addition, the park showcases the Peri-Urban Area of Piacenza and the habitat, as it grows and helps clean the water.
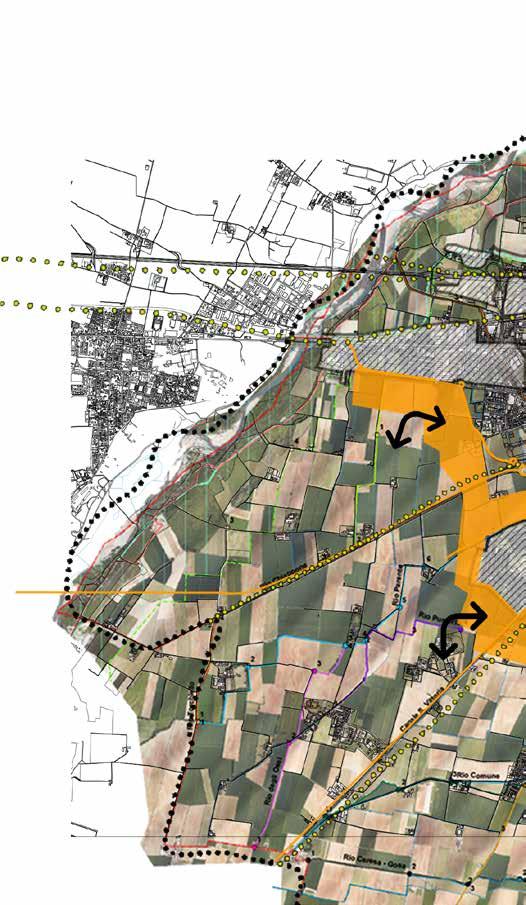
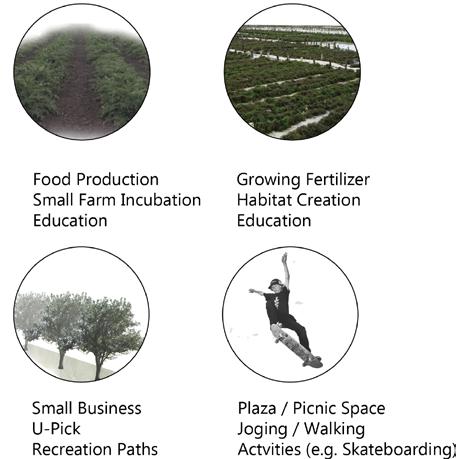
Figure 16
Map of how to “brid ge” to the new site.
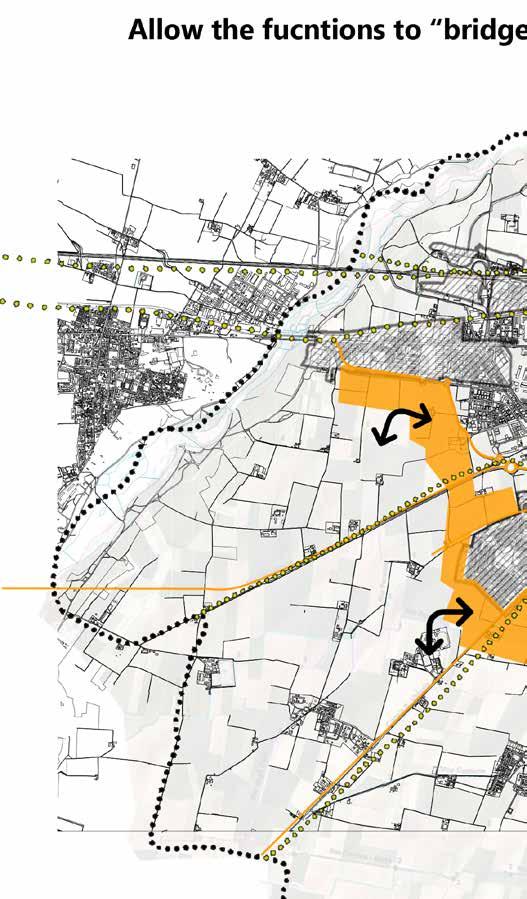
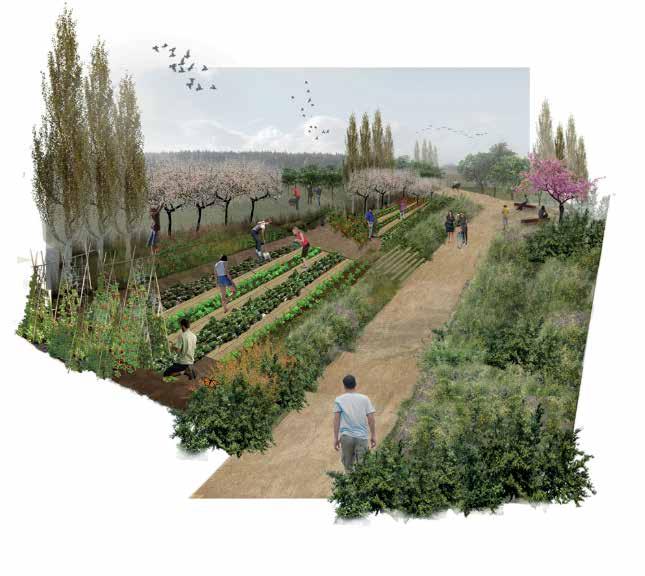
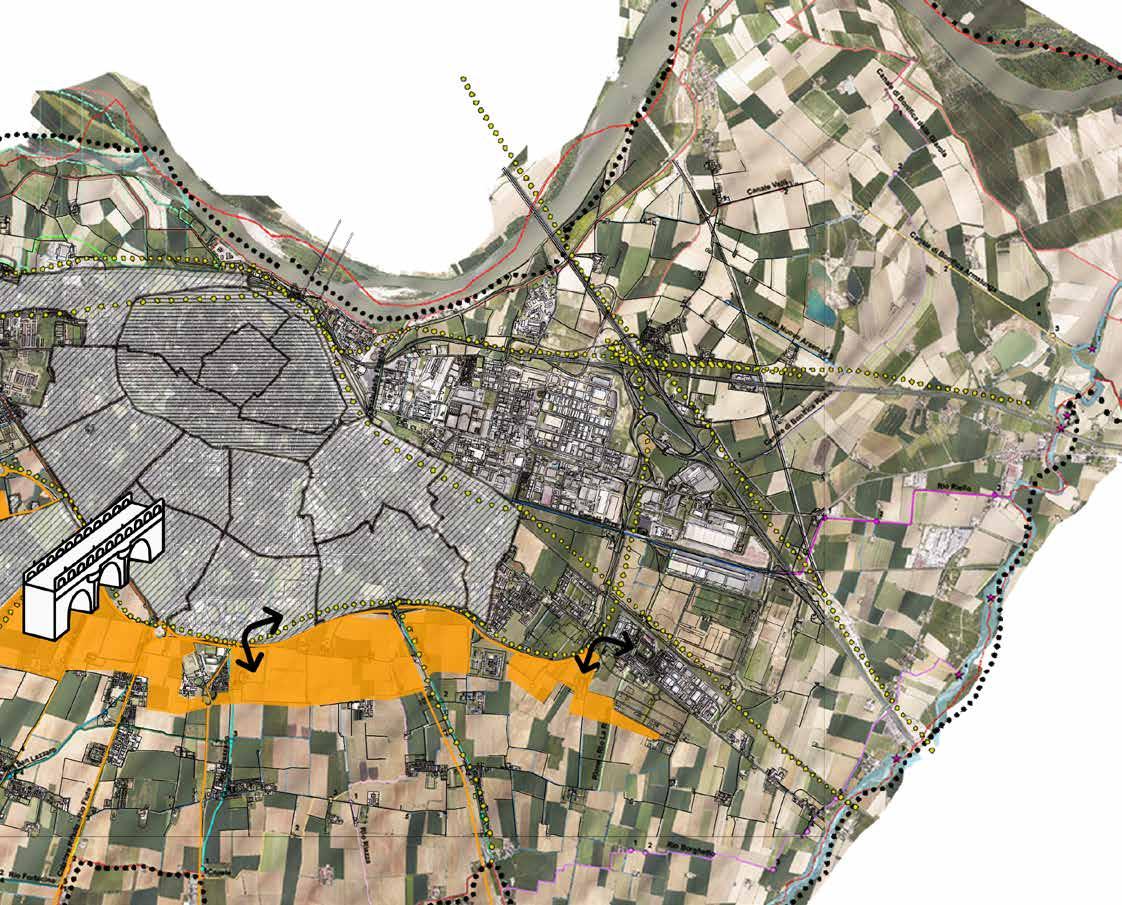 Figure 15
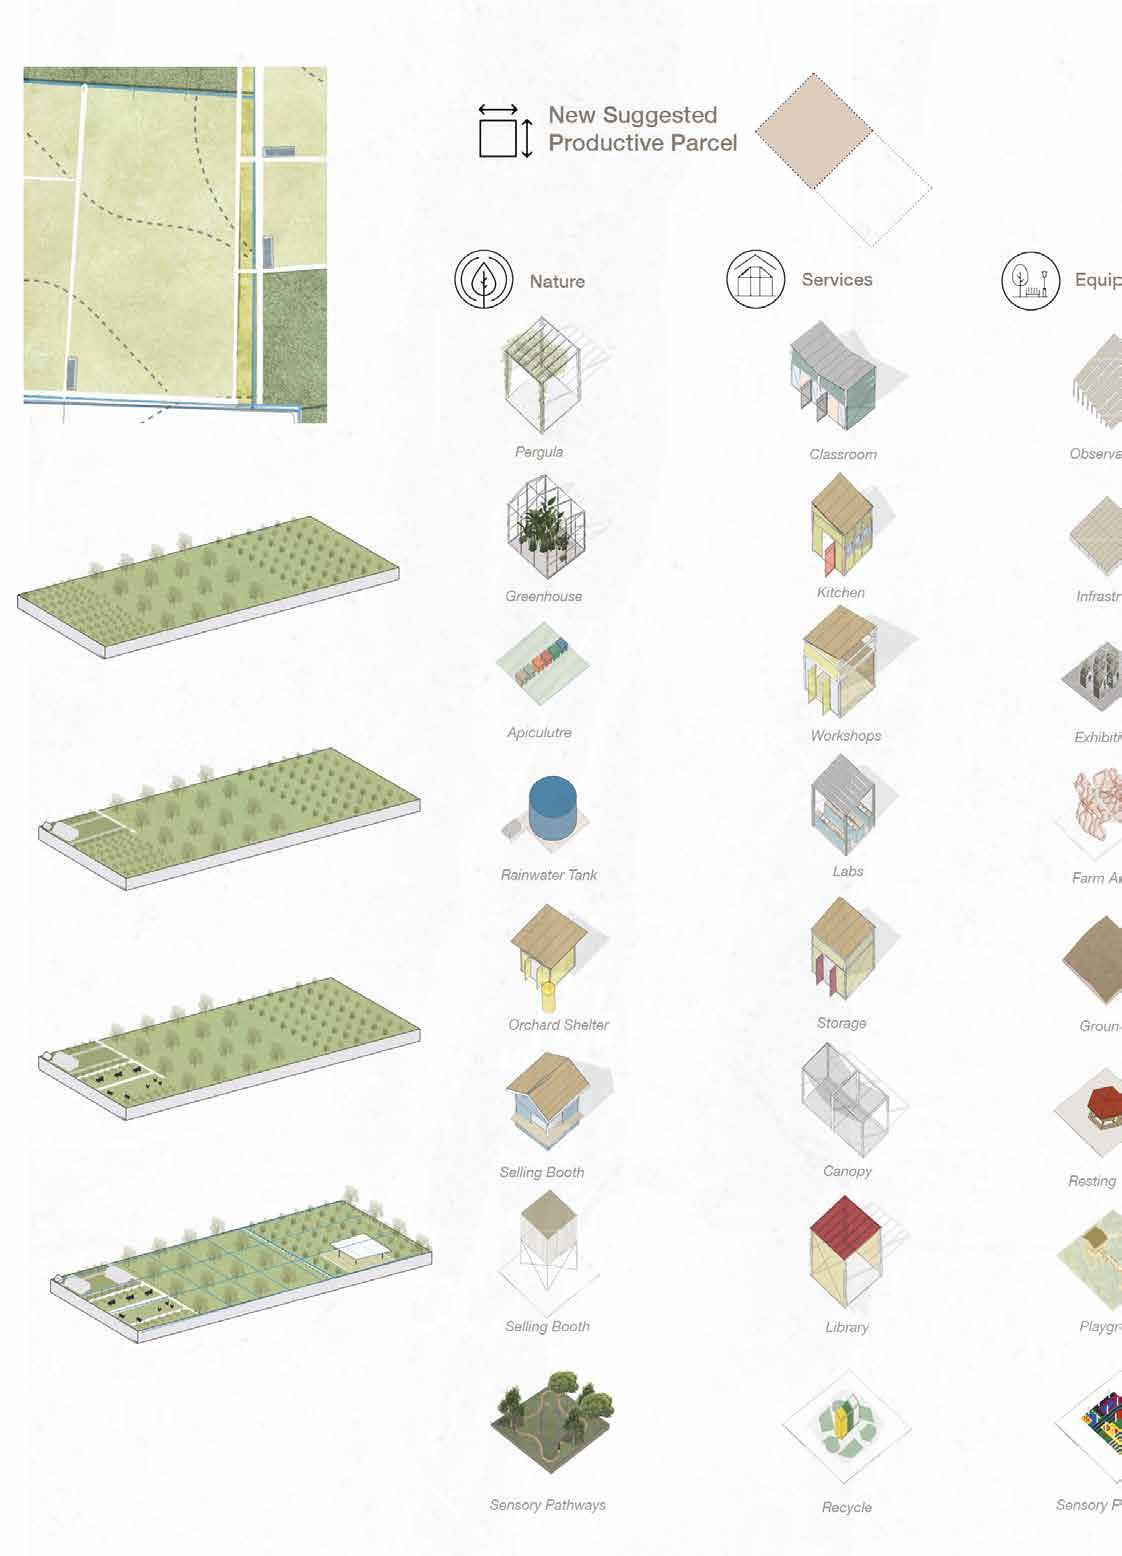
Images of new sugg sted activites
Figure 15
Images of new sugg sted activites
Balancing the recreational and social needs of the context, the landscape becomes a mechanism for incubating community, generating economic opportunities, and facilitating new relationships to the countryside of Piacenza.
The site provides opportunities for small in cubator farm businesses, which allow networked knowledge and expansion, as well as providing opportunities for a variety of different scales of operation. As such, these small businesses beco me stewards of the park, as well as providing an opportunity for visitors to engage with local food production models.
Growing and ndscape incubating economic new Piacenza small allow as variety such, of opportunity food


Suggested
Different than a community garden modelwhere individuals each farm a small land parcel in a collective space - the scale of the incubator farm model allows for increased productivity and effi ciency, as well as providing mechanisms for col lective use of tools and processing facilities.
In addition, the site accommodates multiple scales of production, allowing for expansion of businesses over time. Over time, the site acts as a catalyst for rebranding the Peri-Urban edge and its possibilities.
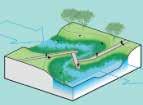
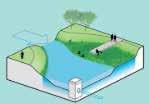
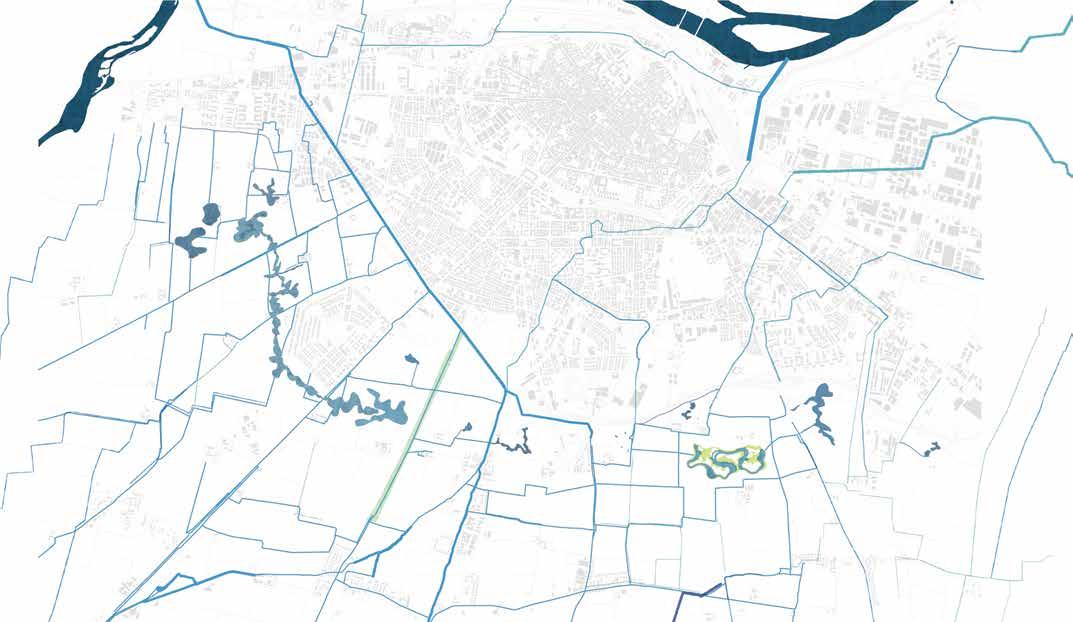
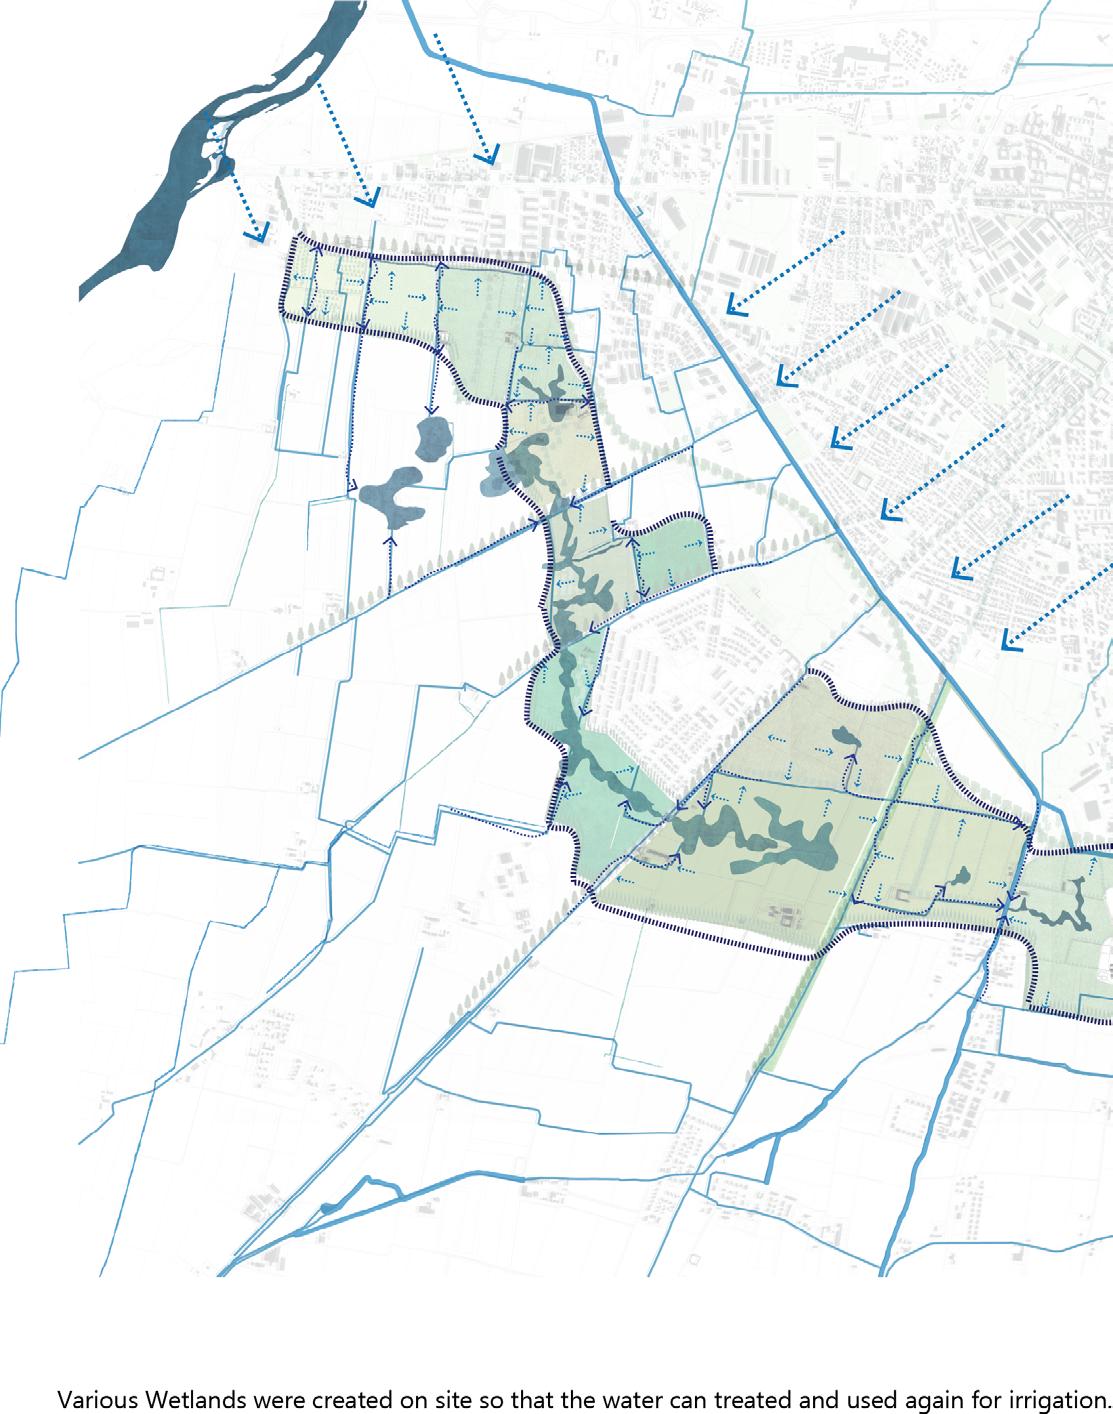
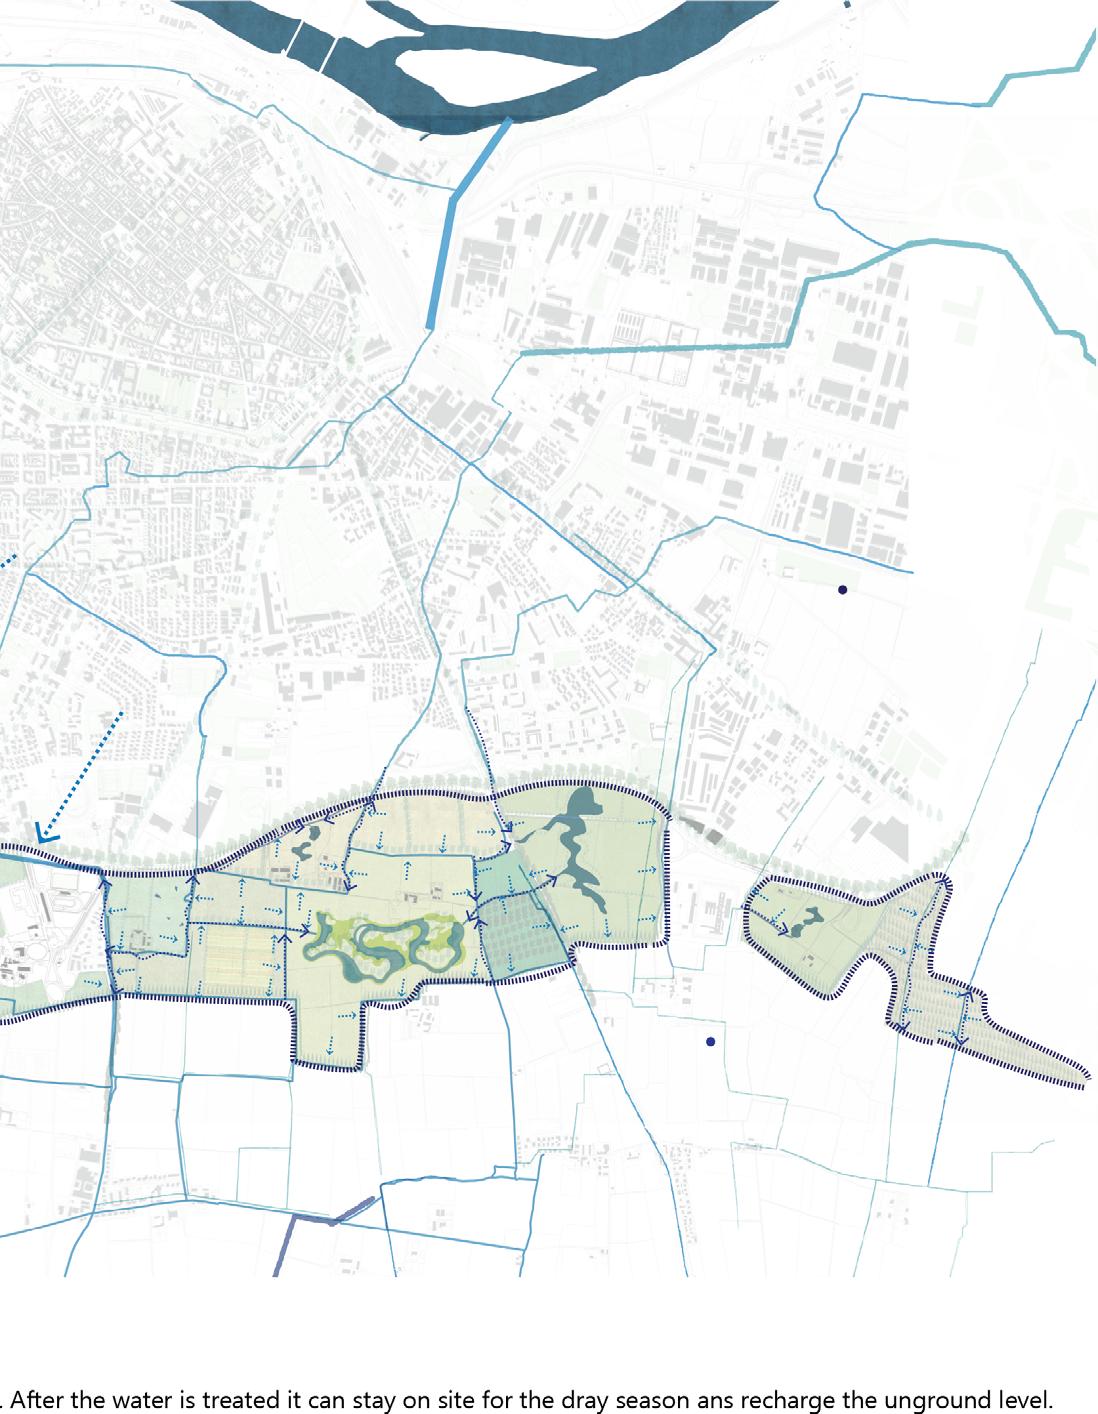
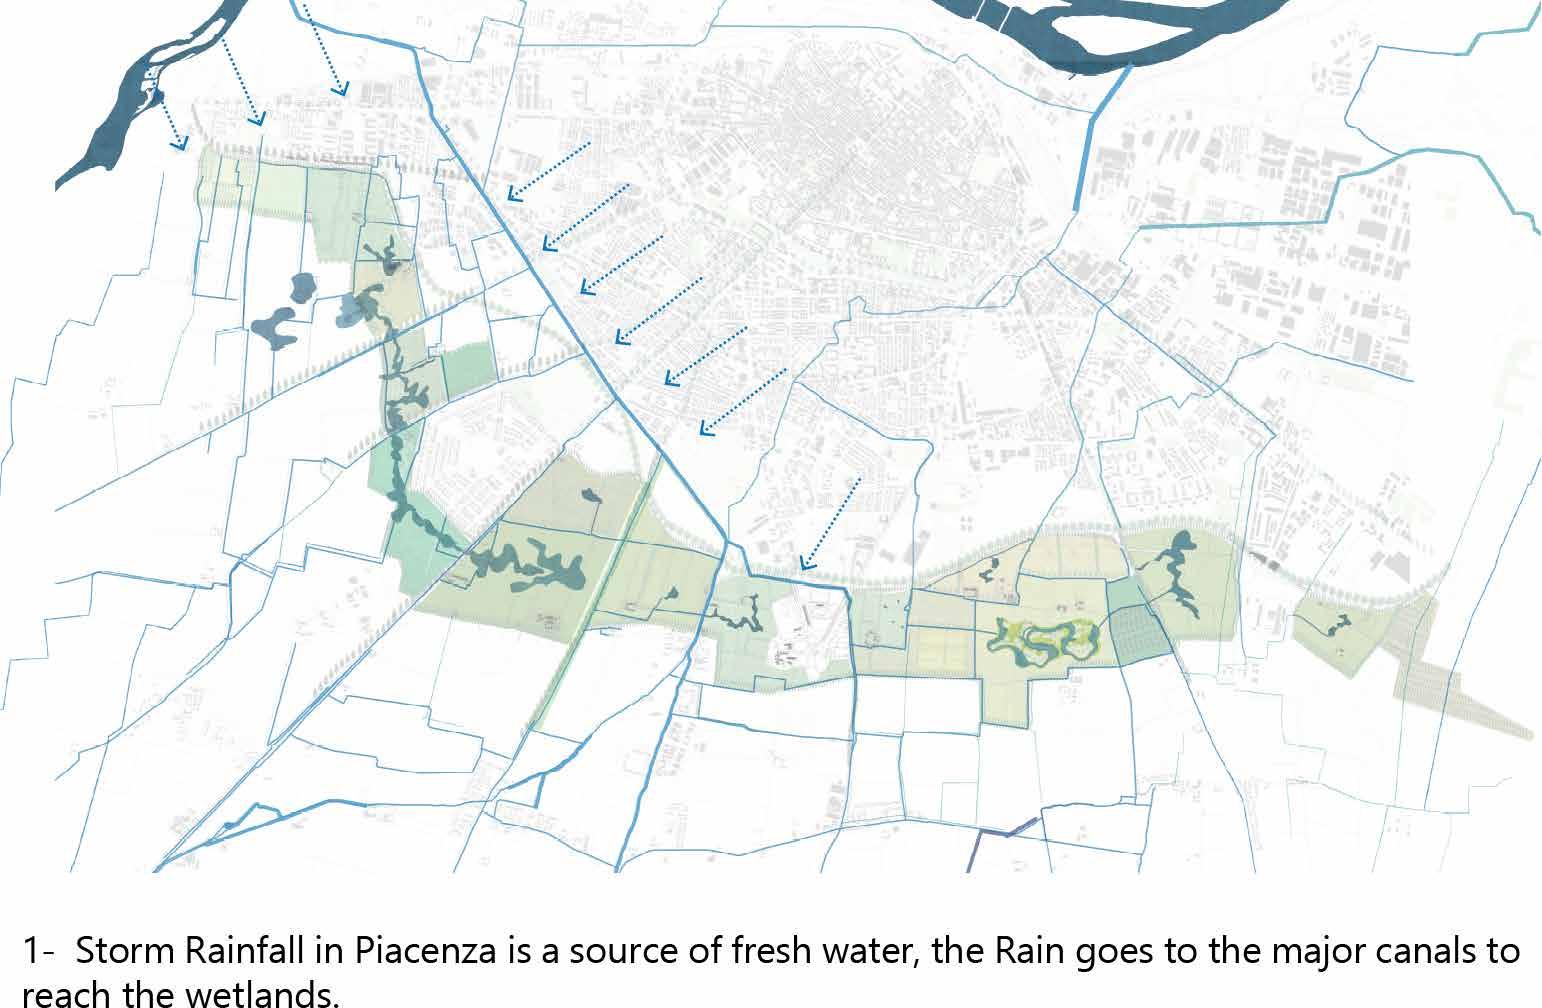
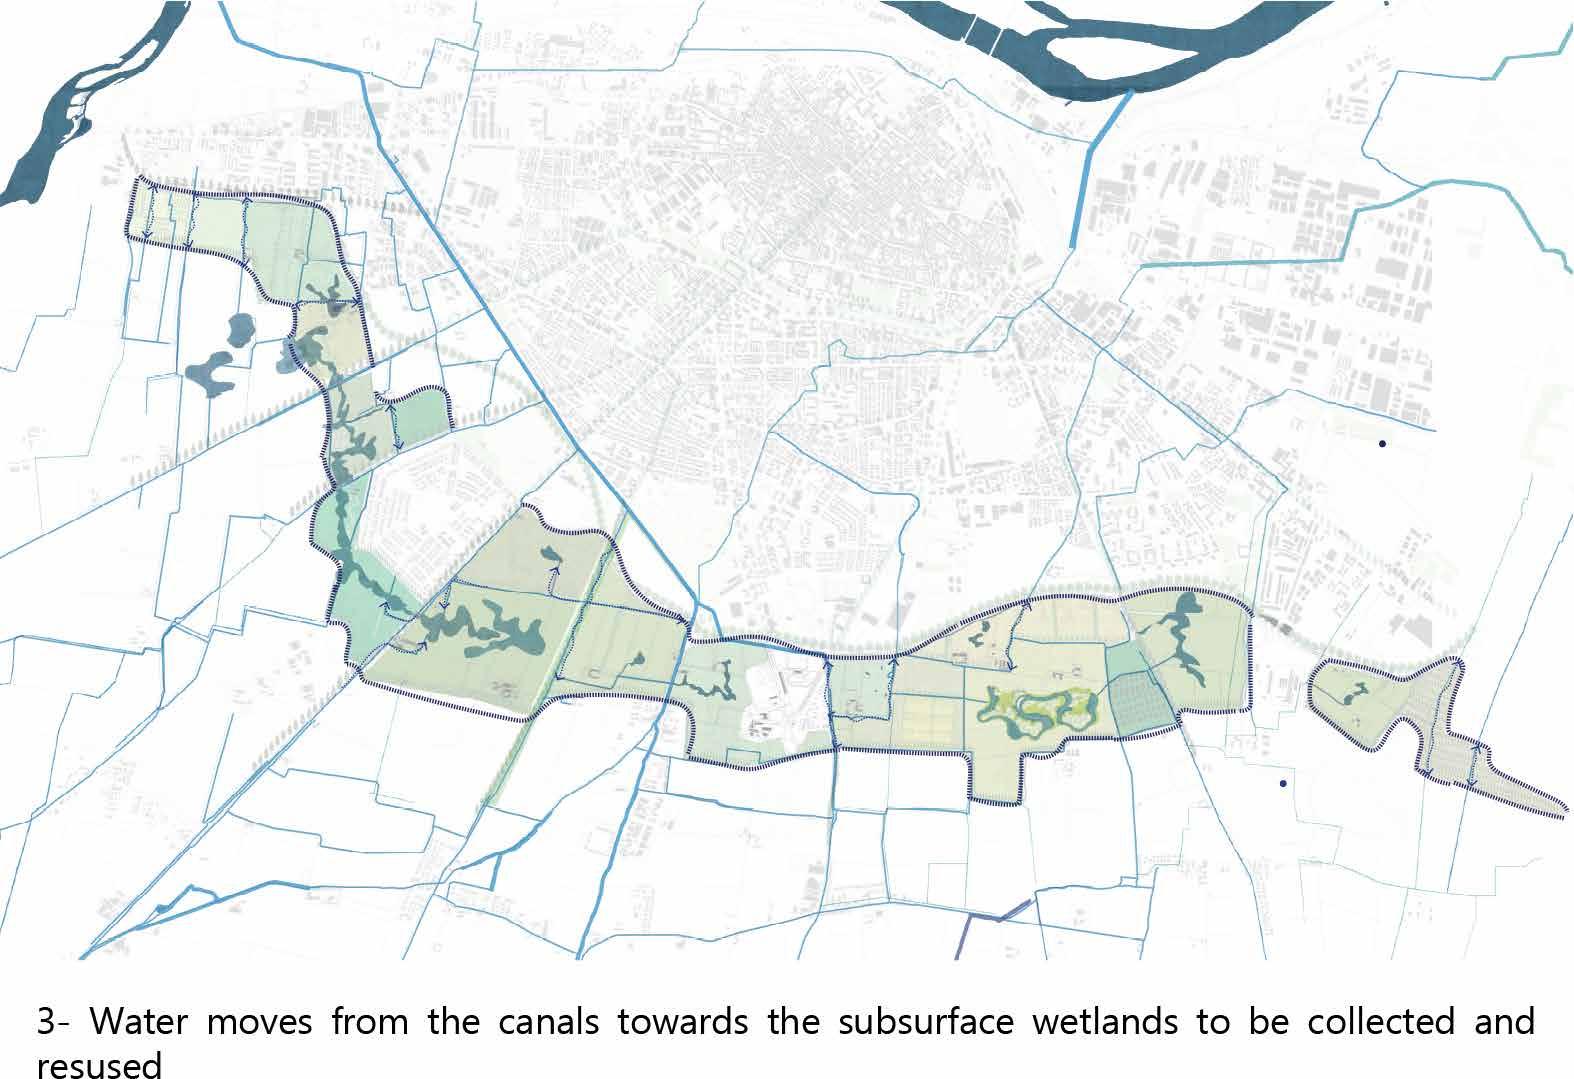
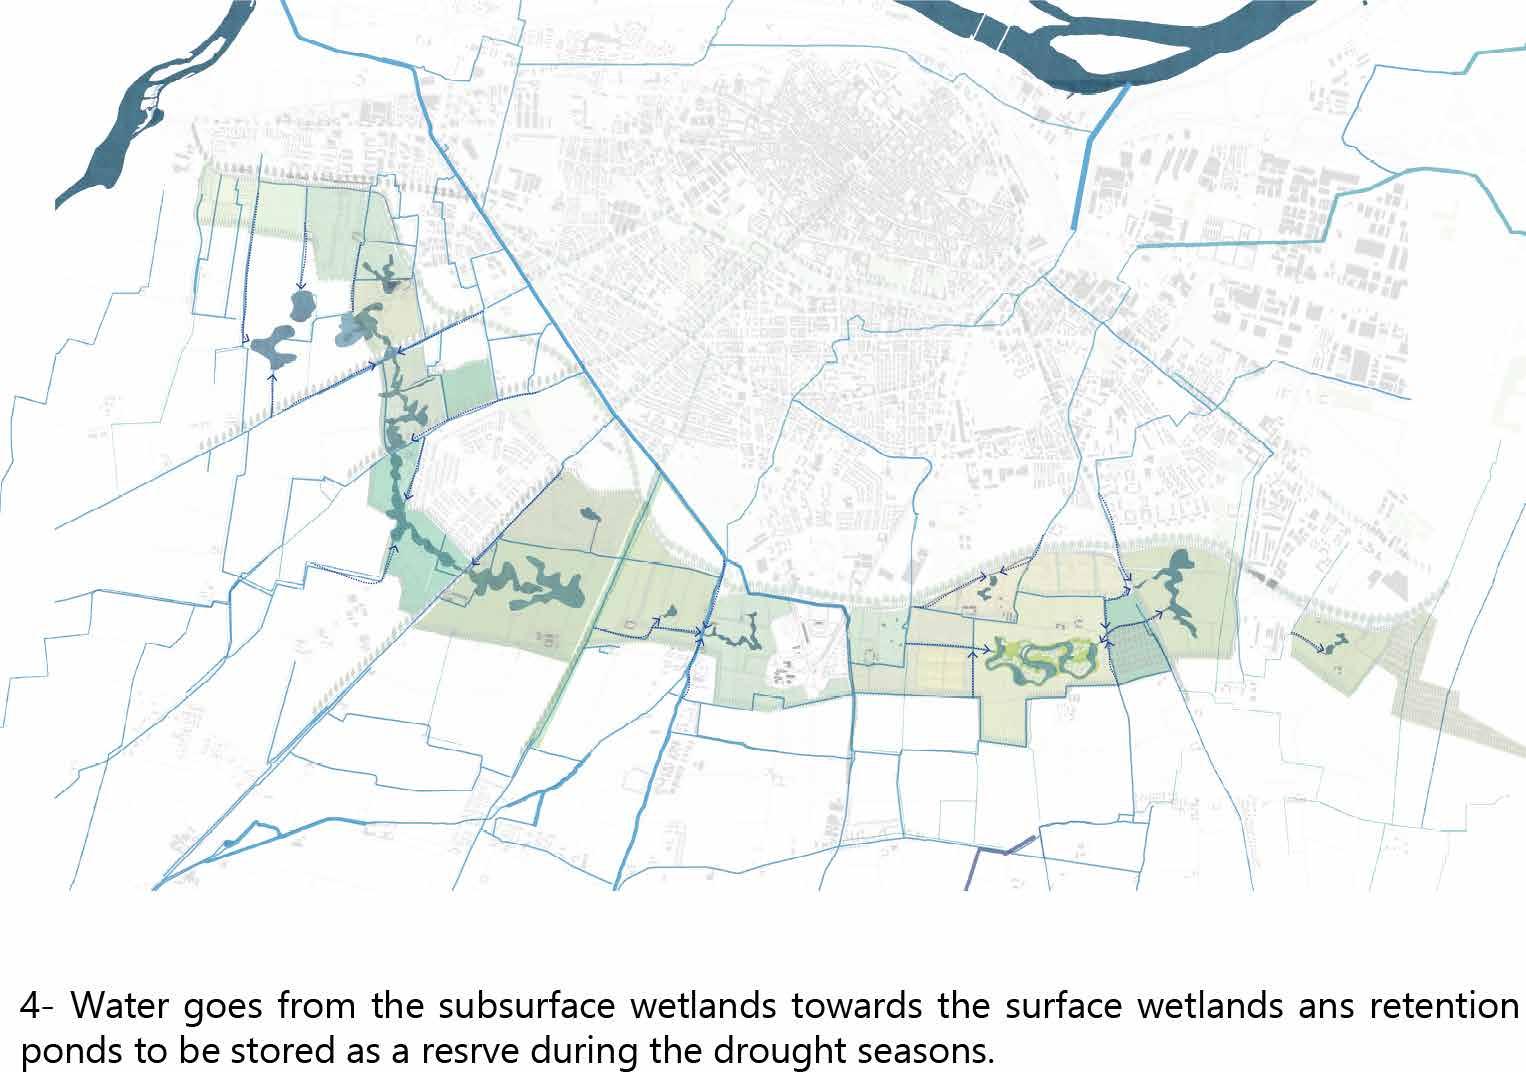
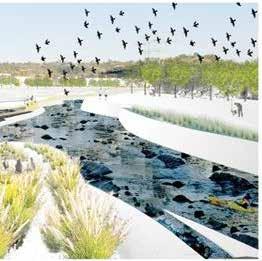
After the analysis done and the story telling, it was quite clear to us that we wanted to bring back the water and reassess how it was viewed as a cul tural heritage of the rural. The scheme includes a whole new system that integrates the water to purify, clean and bring back to the Purifying waste water for reuse where a buffer belt of constructed wetlands so that all polluted water from the drainage channels that ran throu gh the site to be treated by constructed wetlands, producing recycle water using for landscape irri gation, the aquatic playground and finally directed to replenish the natural riparian (canal) wetlands.
Figure 19
Diagram of how to reuse water on the site. “Rebirth”
the aim is to retrace the lines of the irrigation canals in the landscape, integrating the current water system in the rural area.
- WATER PUMPING
- WATER CLEANING/PURIFICATION
- WATER REFILL
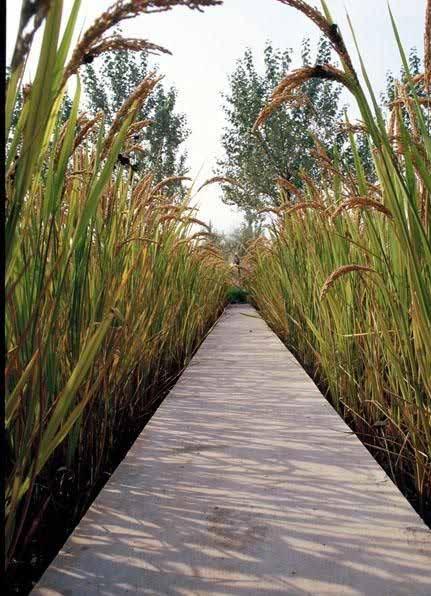
Lands Atlas Andela Nikolic
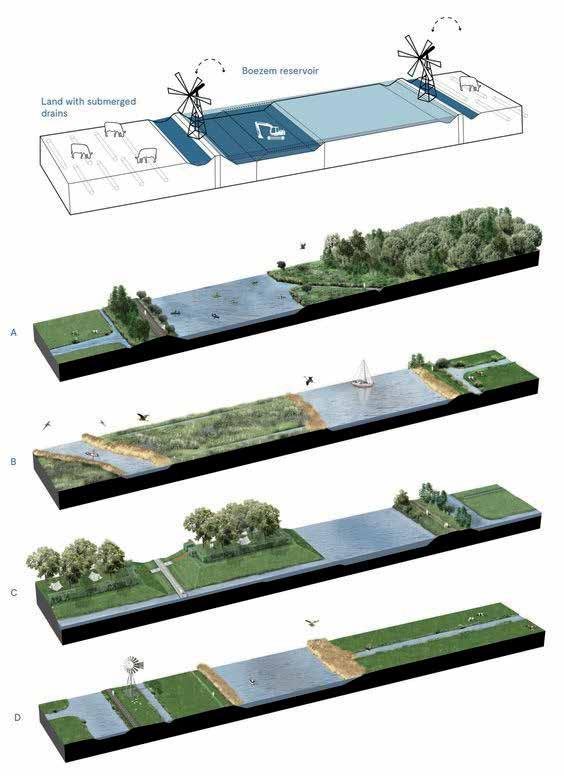
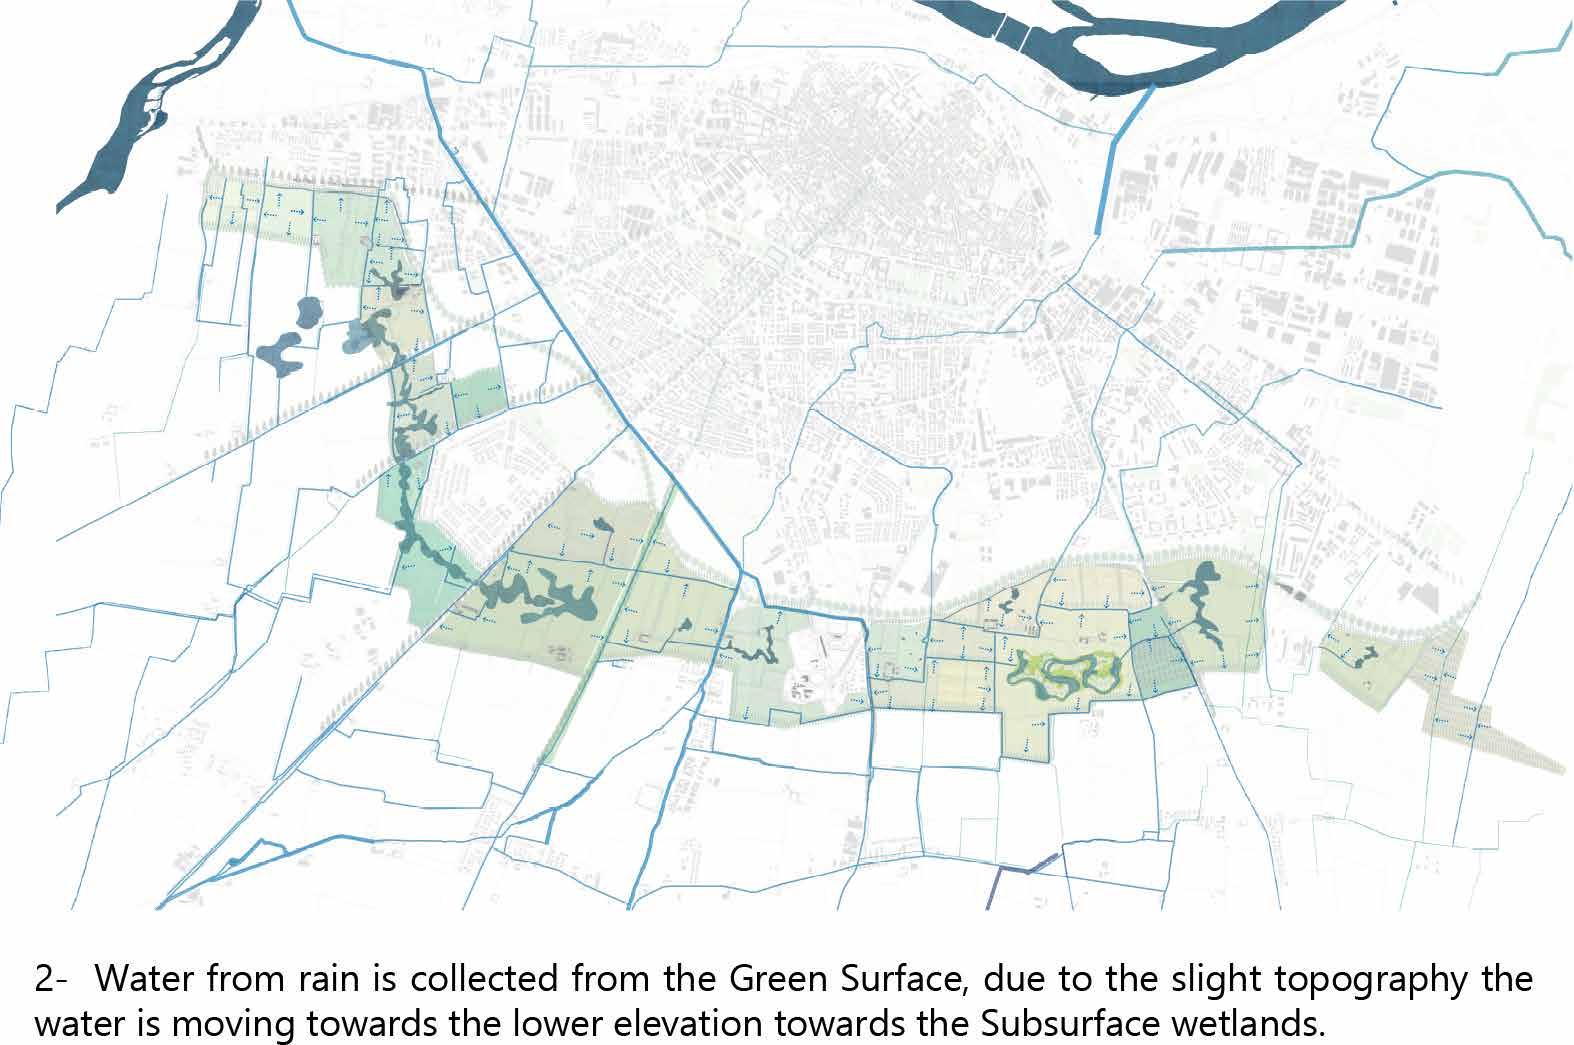
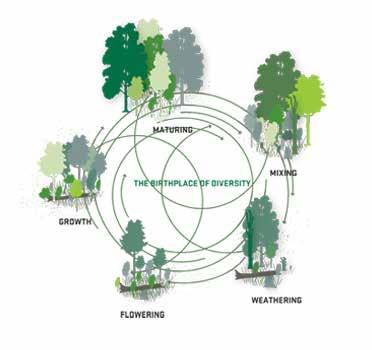
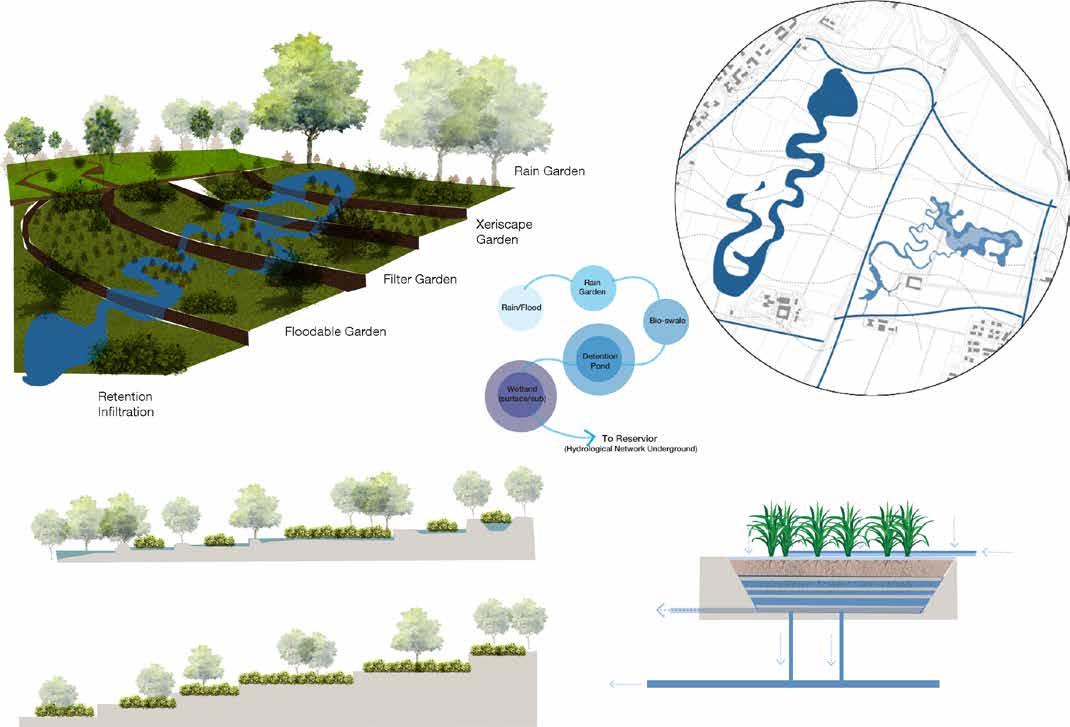
The goal is to recreate a diver se local habitat. Using existing trees and new added ponds as a foundation, the idea is to apply minor earth shaping and careful replanting of lo cal trees, shrubs and aquatic plants to restore shelters and habitats for aquatic life, am phibians and birds. In order to restore the resilience of flood retention and utilize riparian spaces, an adaptive landscape is suggested based on the exi
sting topography and recrea ted ones: the lowest areas to be floodable natural wetlands, areas of lower flood risk were used for constructed wetlands and the highest areas on site for recreational, educational, production and leisure spaces.
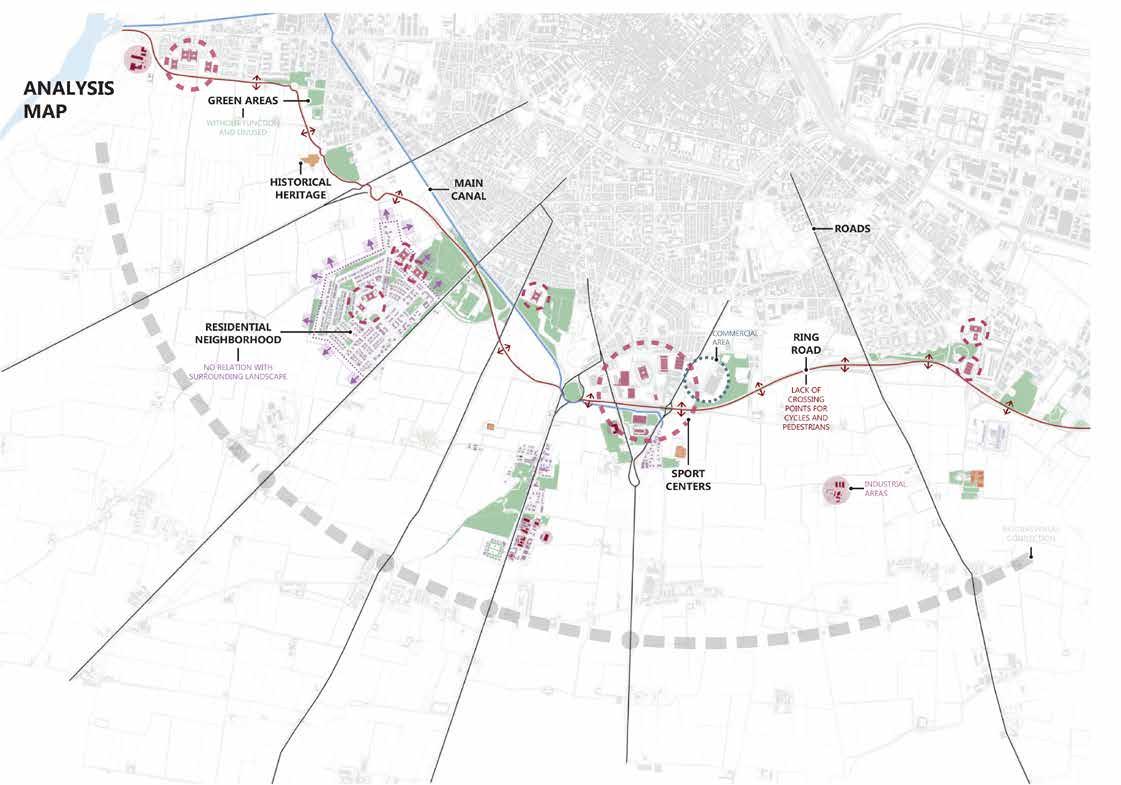 Figure 20 Map of the potential areas on site, Landu se.
Although the water system is overshadowed, it is impor tant to underline that it con sists in a valued presence for the history of this territory. In fact, the whole Piacenza south area during centuries has been characterised mainly by agri cultural activity, that owes its constitution to a dense system of canals and waterways that determine the active functio nality of these rural landscape.
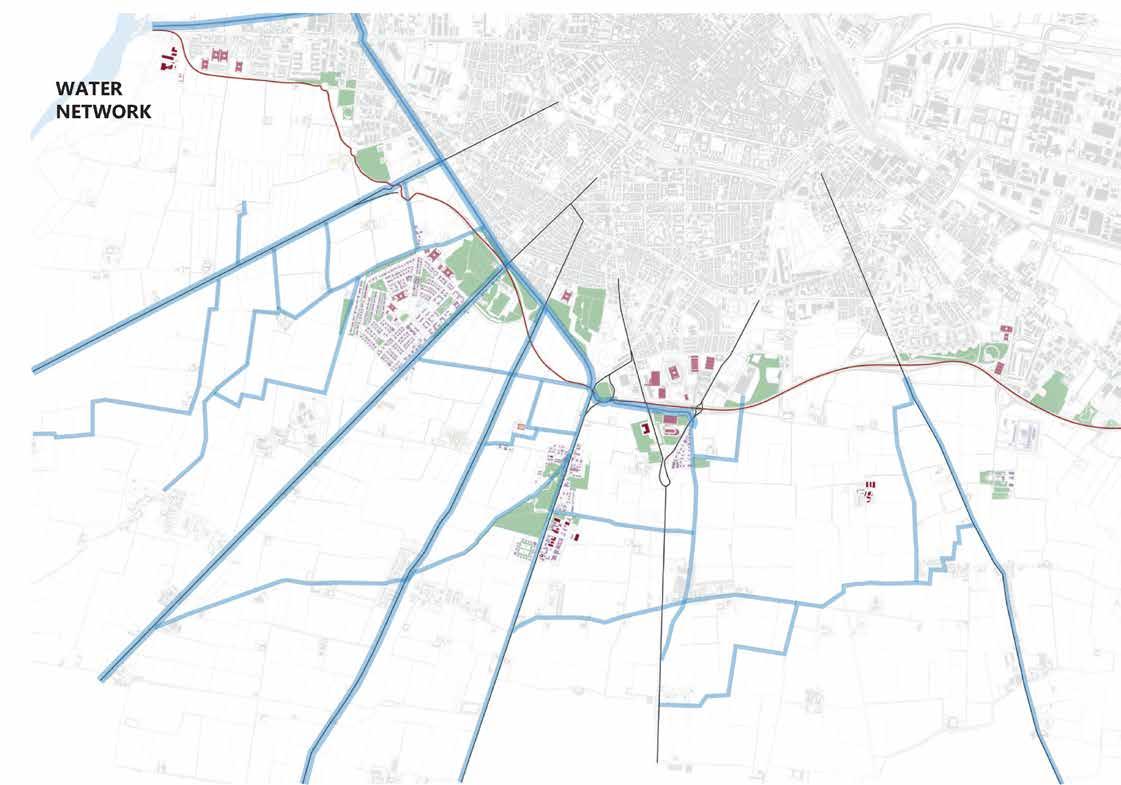 Figure 21
Map of water and canal network in Pia cenza.
Figure 21
Map of water and canal network in Pia cenza.
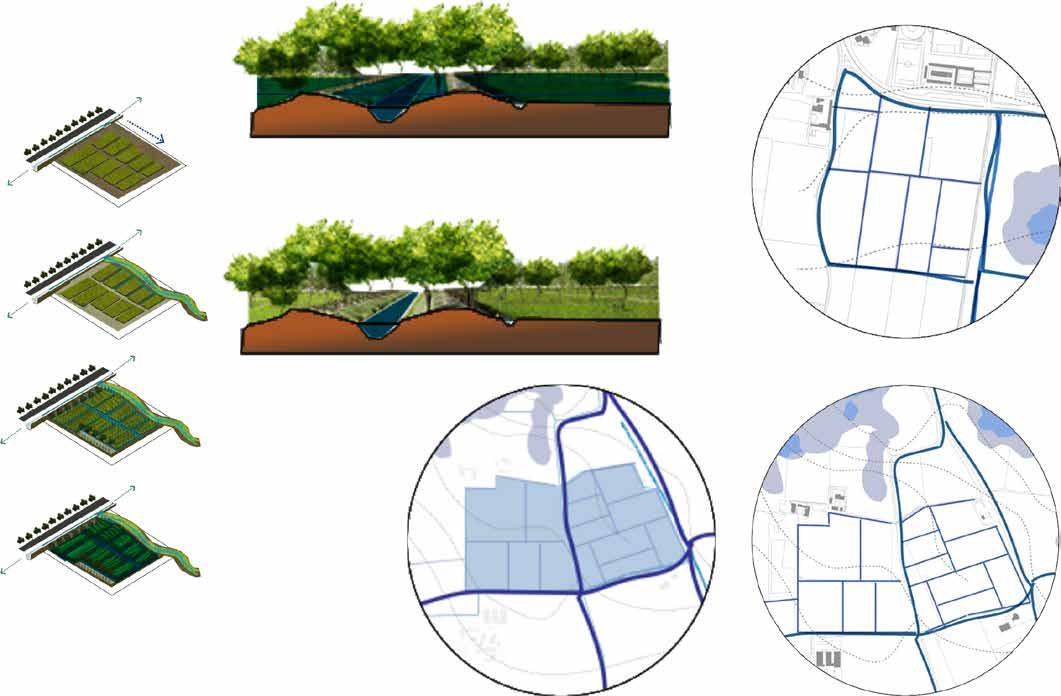
A new Meandring Waterbody to imporve the Hydrolog ical Function Opportunity.
Hydrology filter layer: Replacing the existing system of de ad-end and disconnected canals is a series of free-flowing rivulets, streams, ponds and marshland that will support the re-establishment of the indigenous ecology.
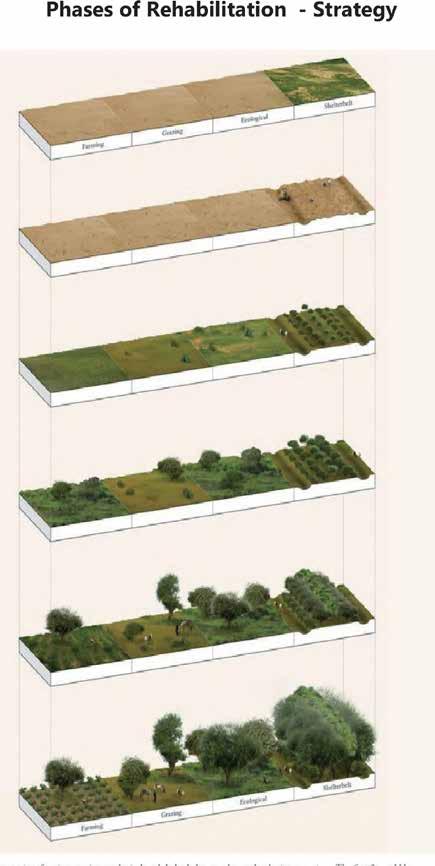
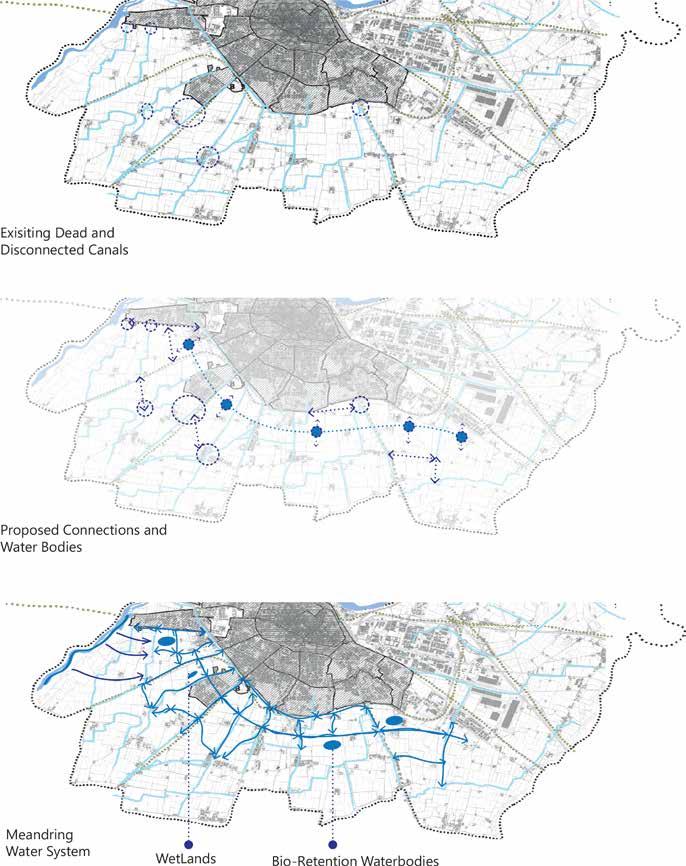
Figure 22
Map of the Hydrolo gy system proposal
Diagram of replan ting strategy
Figure 23Green Corridors that are productive and ecolog ical. A multifunctional Network of open spaces along the canals where a system of retention res ervoirs for excess water during flood season for water purification and a productive public park landscape. The aim is to create a productive land scape fir work, leisure and technical landscape for purifying water using the rural identity of Piacen za.
Balancing point between culture and nature. Solution is an embodiment of cultural rep resentation and technology of water man agement in order to achieve ecological and social resilience. With potential for spontaneous use and dy namic programing, the site can transform into a sustainable infrastructure with a cul tural identity that provides active experi ence.
It reroutes and collects water and serves as a buffer between the Coutnry Side and the Urban. The plan provides a refuge for wet land plant and animal species. It also creates a platform for water related recreational actives. In this way, people have the oppor tunity to change their perspective about the irrigation canals where they have a new cul tural Identity
 Figure
Water reclaimation process
Figure
Water reclaimation process
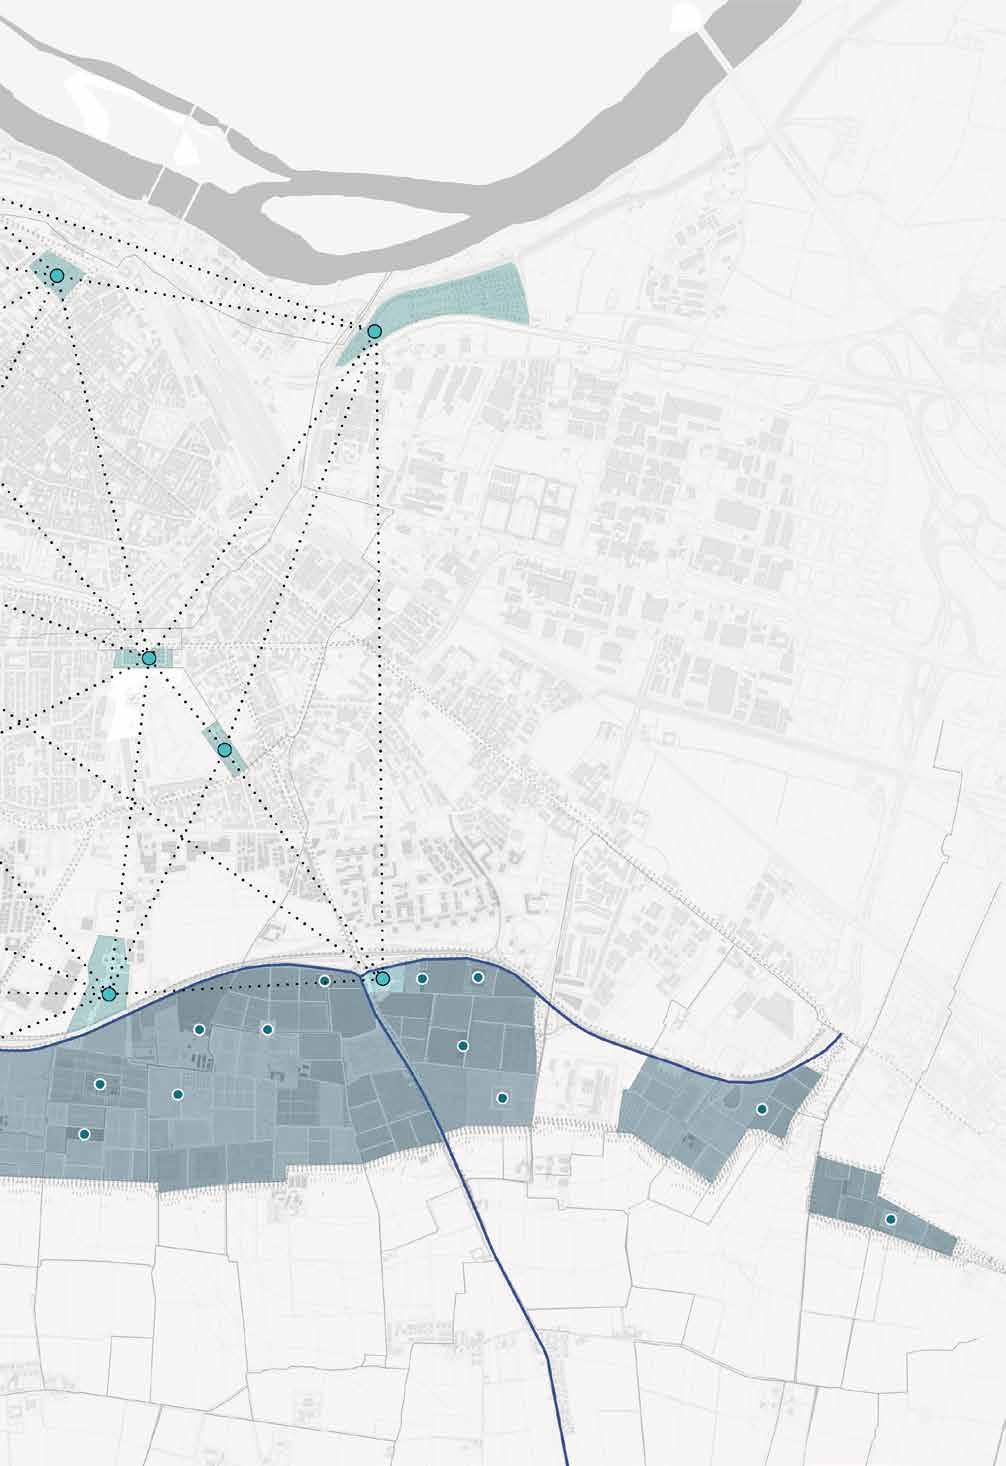
Since we are working eith an erea between ur ban zone and pure rural zone we decided to have a transitional belt that link both functions rural and urban
The belt is a primary link between the fields other that the tangenciale which is a grey in frastructure however the transitional will be a green and blue infrastructure
The belt will contain the underutilized greenary as if it is a functional part of the belt. The un derutilized greenary will be transformed into different needed functions in the project
The blue corridor is a part of the belt spread ing into the field and decreasing the flood risks
The green and blur infrastructure defines the beltand its fonctions either :
. Agricultural fjelds
. Workshops regarding agriculture and water system
. Hosteld or rooms with light infrastructure for people who whould like to volunteer for work
. Markets that contain products well known that exist next to our site
. Food expo / restaurants
Figure 25 Belt Sketch Figure 26 New Typologies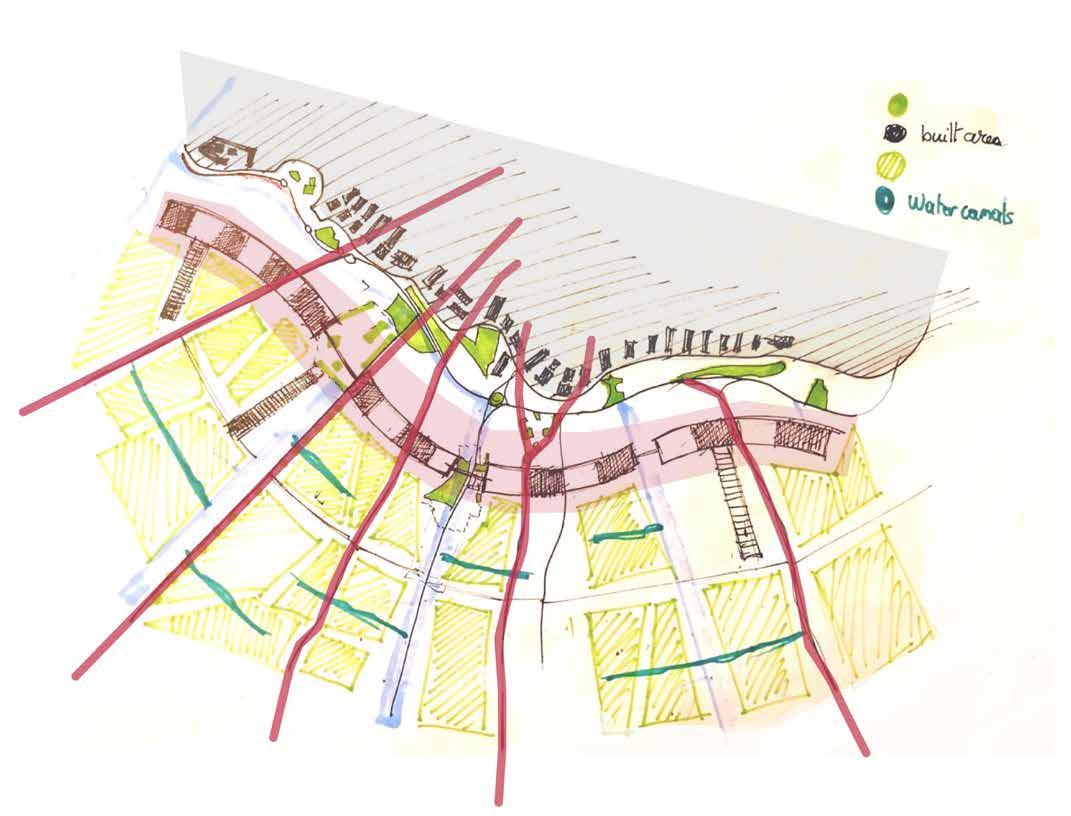
Public infrastructure of water systems that brings ecological de velopments and cultural activities together.
Programs along the river, providing habitat for endangered spe cies and making the water system visible to the public. People will have the opportunity to celebrate water and culture.
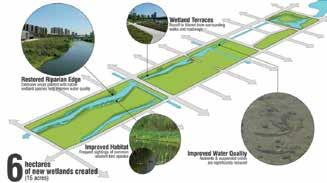
The ecological framework will adapt to the site condition over time. Bringing back wetlands that clean and improve overall water quality.
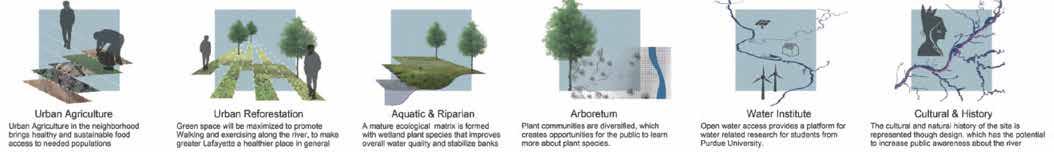
Promoting Urban Agriculture in the neighborhood will es tablish healthy and sustainable food access and add an economical dimension
Figure 27 Land expansion Dia gramLeniar Open spaces collect and water into the parks
Open Grass areas that allow the inflitration of whater for graoundwater recharge
Planting Filter and clean water (Rain or Flood) - to be used by both irriga tion and Humans.
Recycled water for cylced back to parks and lands for landacape irrigation

The Strategy is based on the mixture of uses, where they all support each other to create a harmonious space. We want to move away from the separation of the landscape and envision a combination of all uses not only in the city, but also on the outskirts. That re duces distances and makes a stronger character of the space. The cut of transport costs between research, production, processing and retail helps to build a bet ter local economy.
Productive Landscape is breaking the barriers and fu thermore emphasizing the existing potentials in the spa ce. From problems of the urban sprawl, we want to create a landscape that will integrate the local people, therefore increase interest agriculture and bring social welfare to the society.
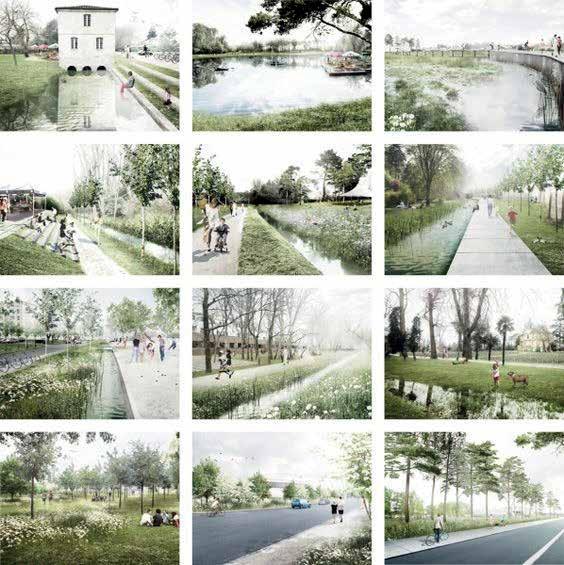
Figure 28
Visions of Land / Infra structure interaction with the Blue
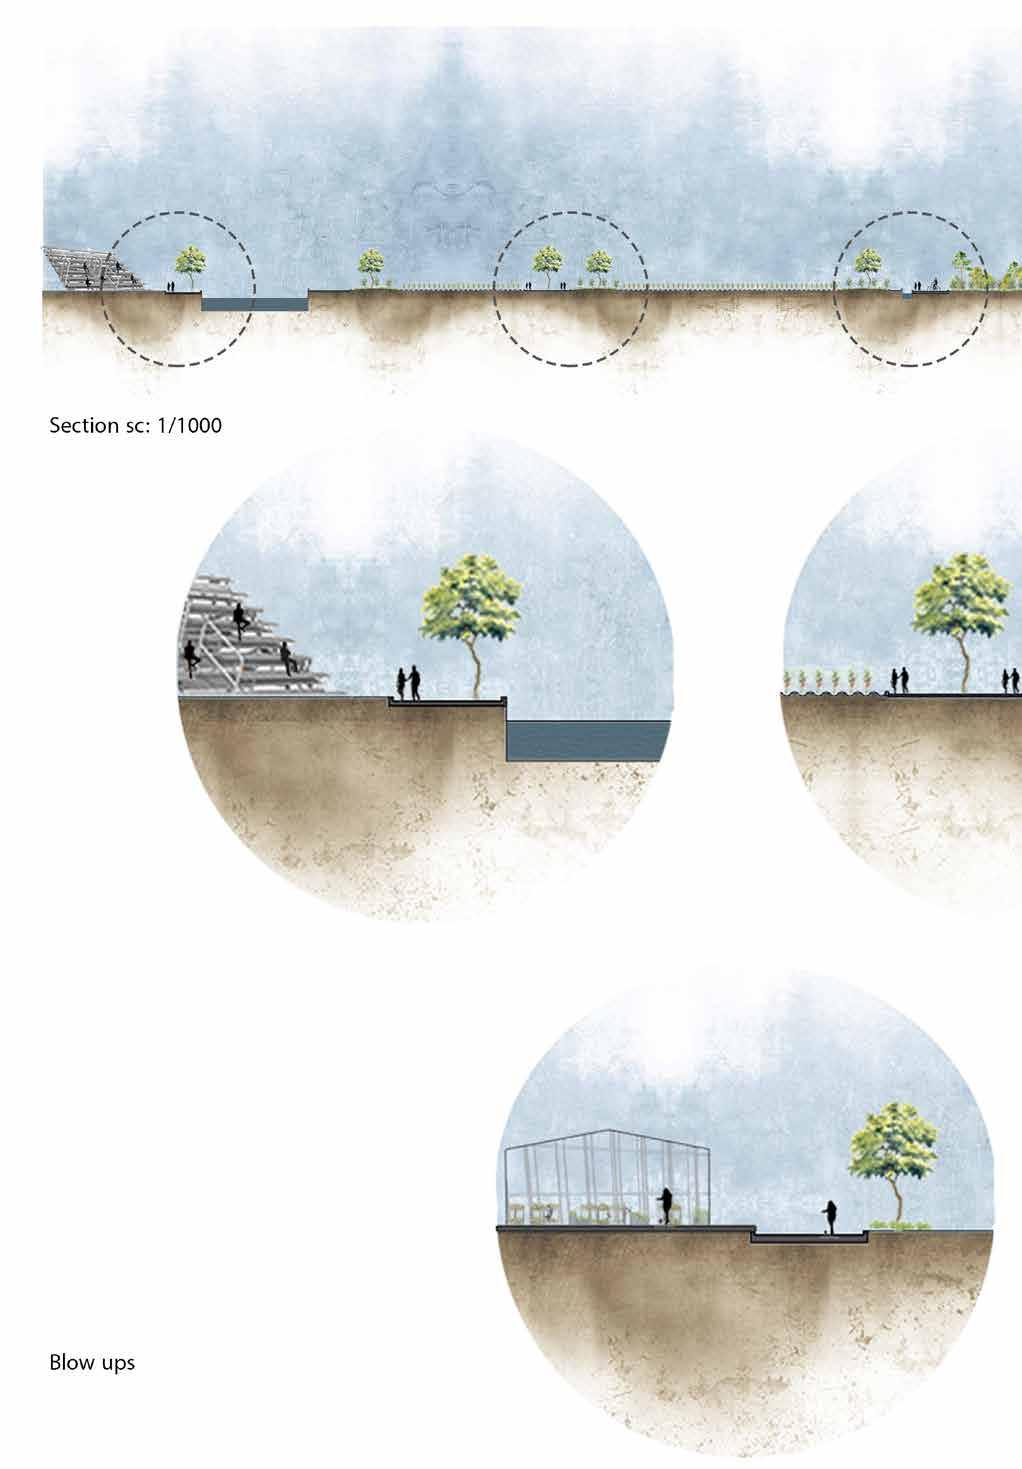
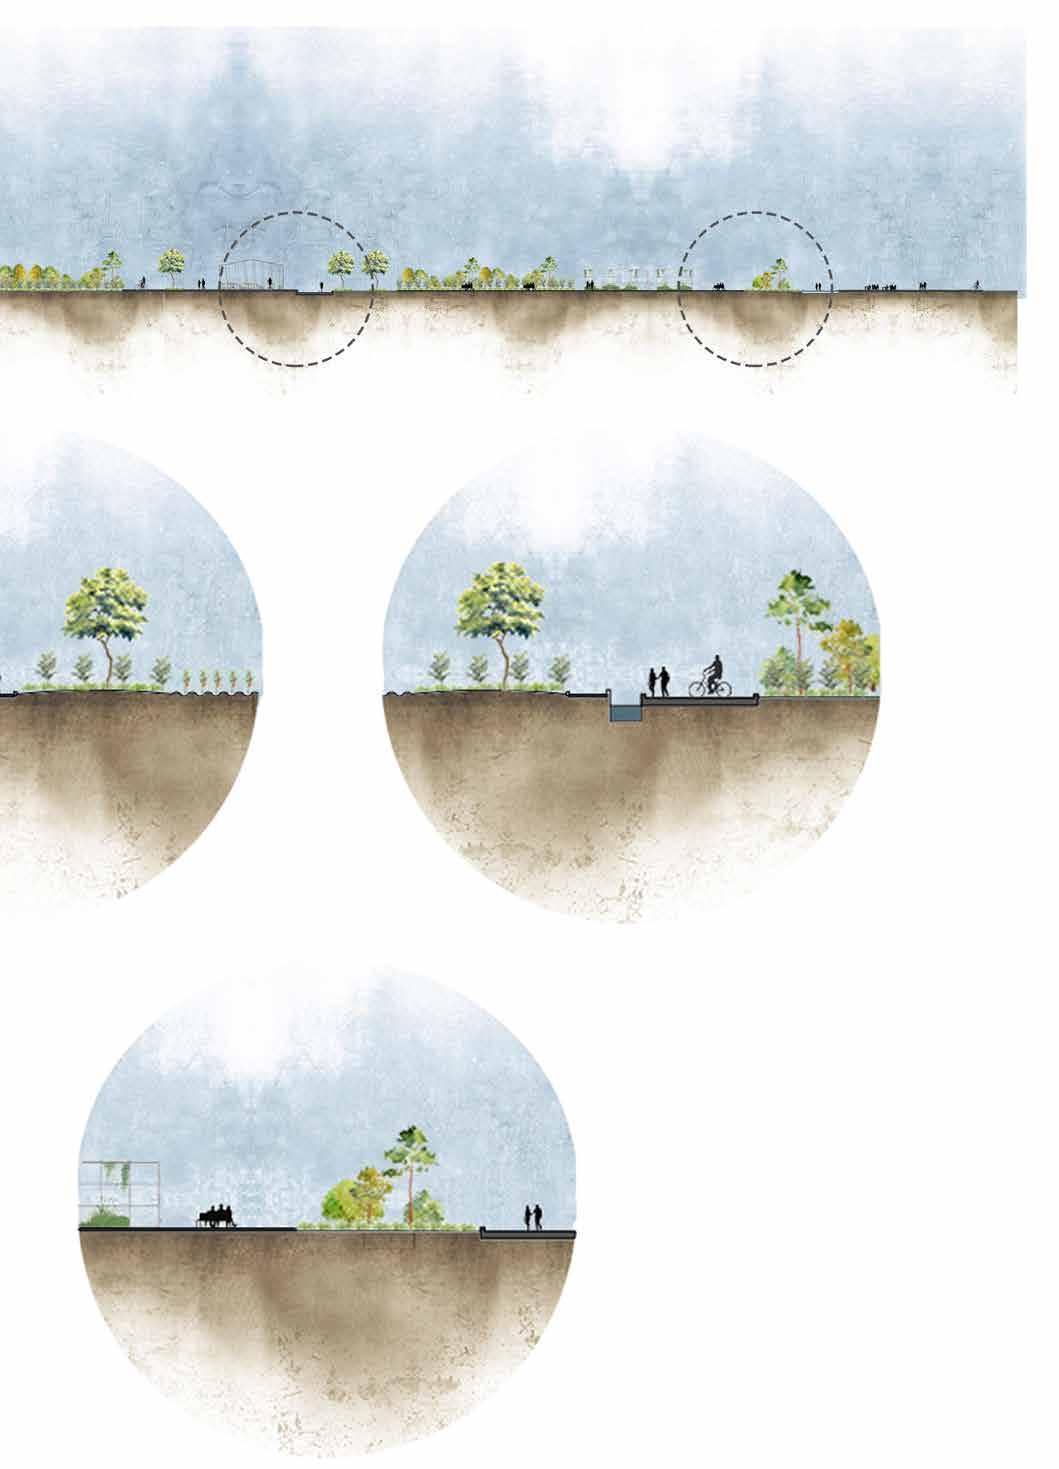
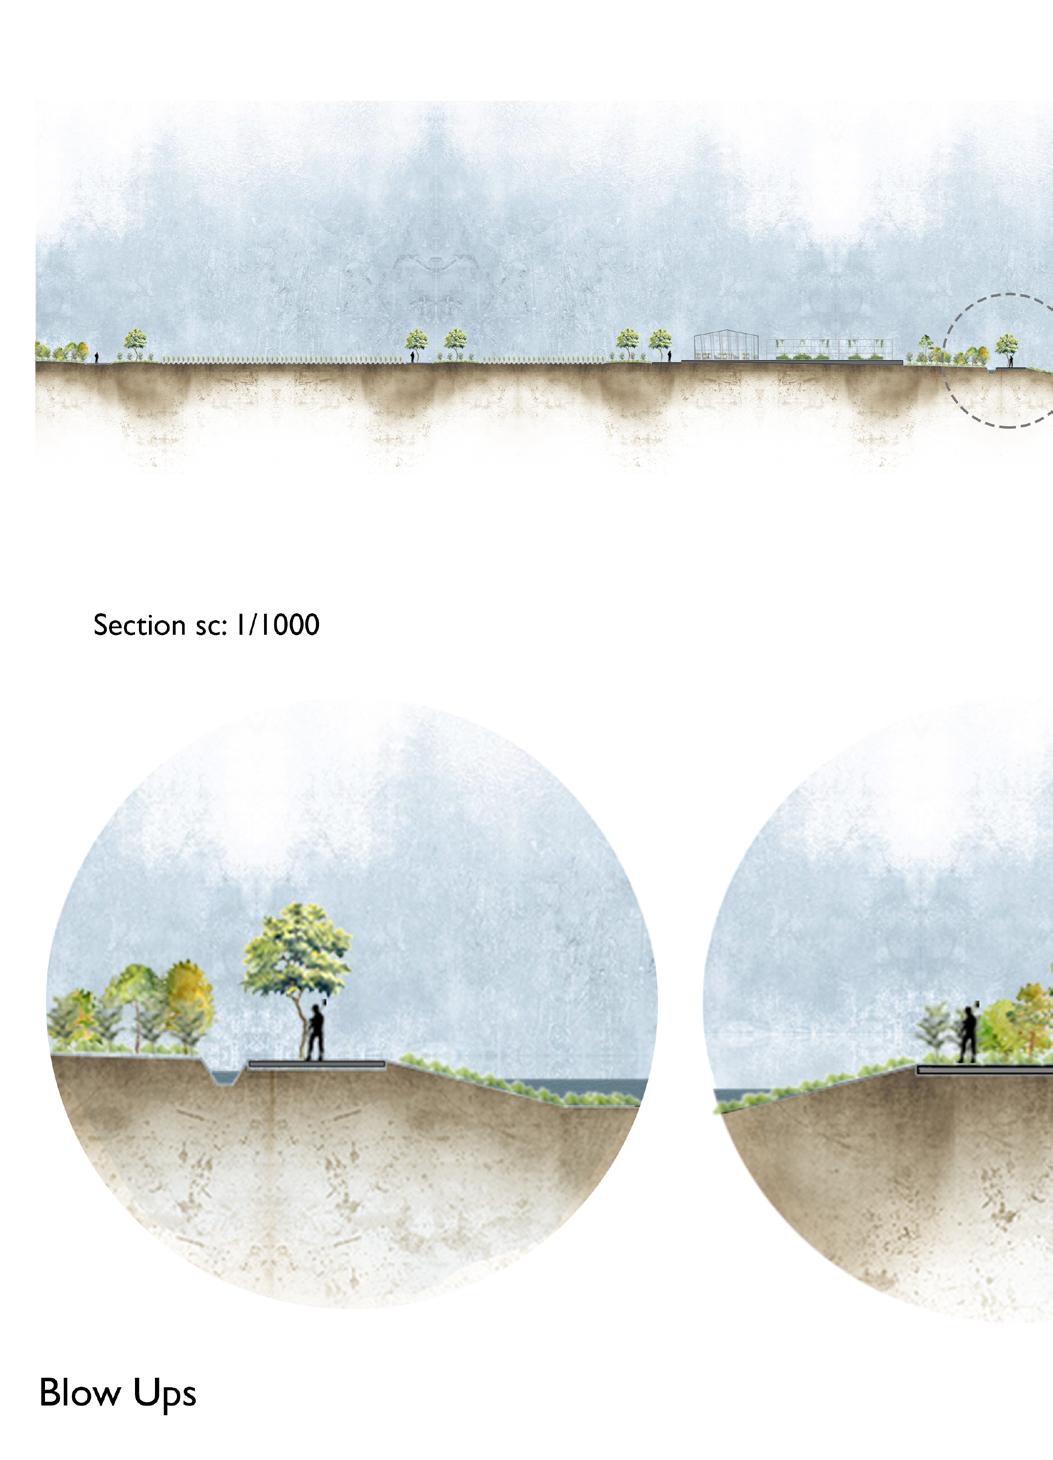
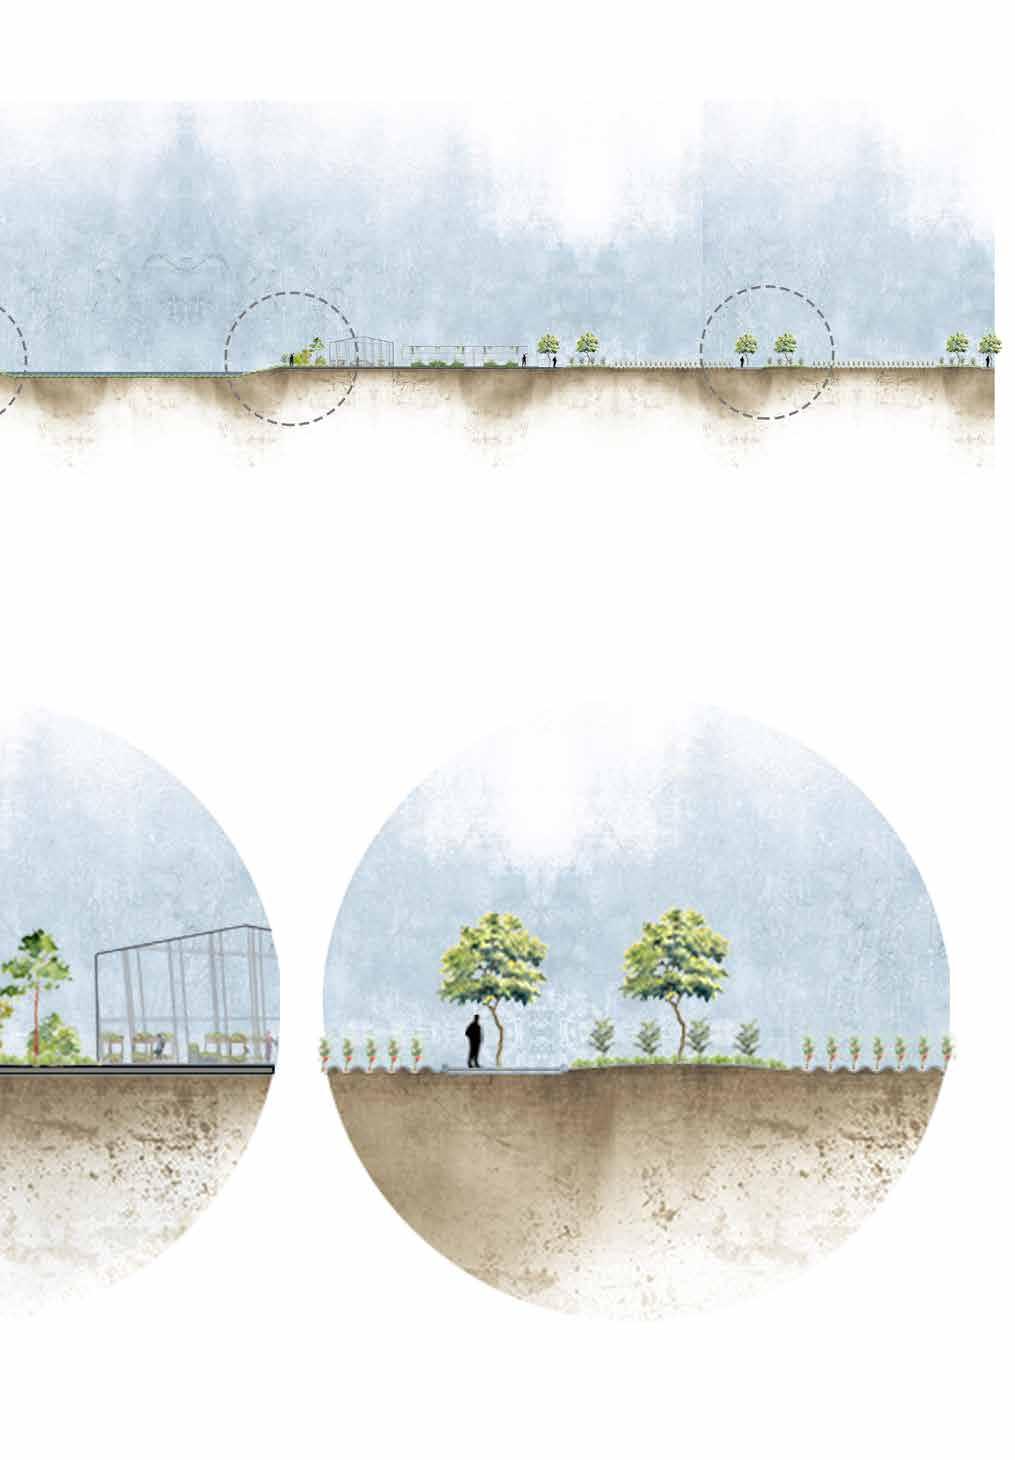
Sections showing new land dynamics
Figure 30 Figure 29 New Land Functions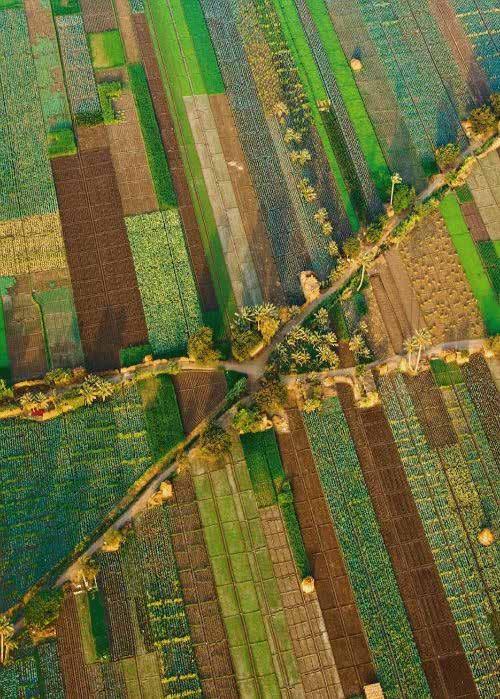
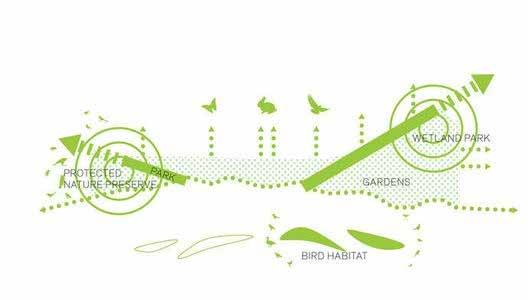
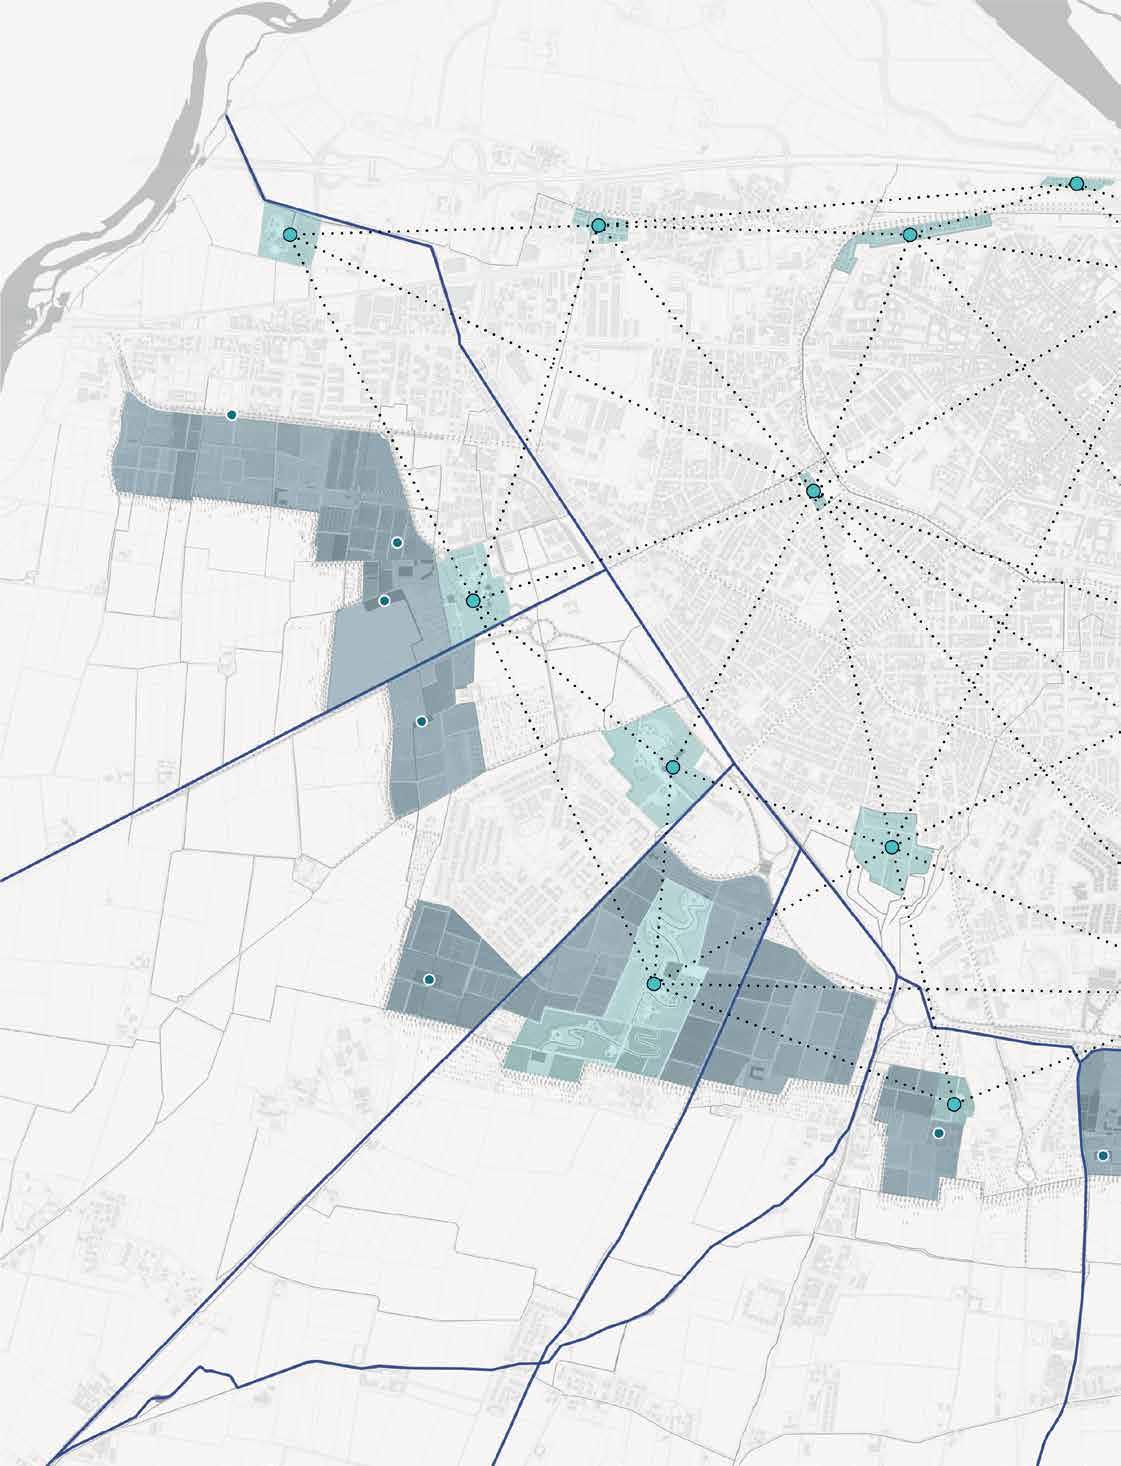
The existing canals and the land adjacent to it form the backbone of an ecological landscape infrastructure that serves as a flood mitigation and natural corridor creating connections from the rural to the city center. We look at the unbuilt as potentially an event of equal intensity to the built where the built is an indicati ve of cultural intensity and the unbuilt as an ecological inten sity.
In the edges of the site, a re forestation strategy would be implemented to serve as a car bon sequestration and the re storation of habitats. There are a series of open spaces that en gage with the city through the ring road. This open network creates numerous recreatio nal benefits and enhances the inhabitants to engage with the two most dominant landscape elements in the site, the rural lands and the canals.
The variety of experiences that occur along the corridors will provide opportunities to view the abandoned land dif ferently. The canals will form the main east west ecological corridor where it will provide unique habitats for native spe cies and animals in the new suggested wetlands which serve to capture the water and store it.
Figure 31
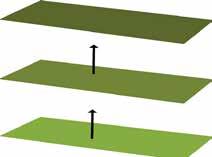
Green Layer of the Con cept Map
Figure 1
e.g. Concpeutal Diagram
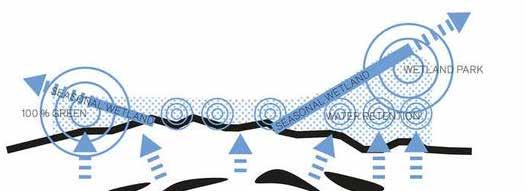
Focusing on recharging the water canals emphasizes the site as a seeding process for the natural systems, as well as environmental education, eco-tourism and cultural su stainability
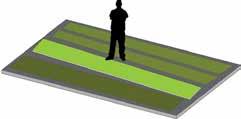
Figure 32
Blue Layer of the Con cept Map

 Conservation Zone
Buffer Recretarional Zone
Environmental Educational Zone Production Zone
Wildlife Reserve Buffer and Eco-Experince Zone
Leisure & Eco-Tourism Zone
Creative Environments Zone
Tree Nursery
Playground WoodLand Agricultural LandEco-Experince Zone
Agro-Factory Production
Conservation Zone
Buffer Recretarional Zone
Environmental Educational Zone Production Zone
Wildlife Reserve Buffer and Eco-Experince Zone
Leisure & Eco-Tourism Zone
Creative Environments Zone
Tree Nursery
Playground WoodLand Agricultural LandEco-Experince Zone
Agro-Factory Production


Through planting the native species, we are re toring the habitat and reforesting the boundries of the selected site where we can have wind breakers and buffer zones.
The coridor is crafted to have some hills thour gh filling of land in order to provide vistas and views for the visitors. The water canals after tre atment will allow for a healthy habitat to grow.
Through altering the micro-topography, and uses the native species to recover the afforesta tion area gradually. The planting strategies in clude ecological replanting, buffering replanting, wind-breaking replanting, and historical-replan ting strategies.
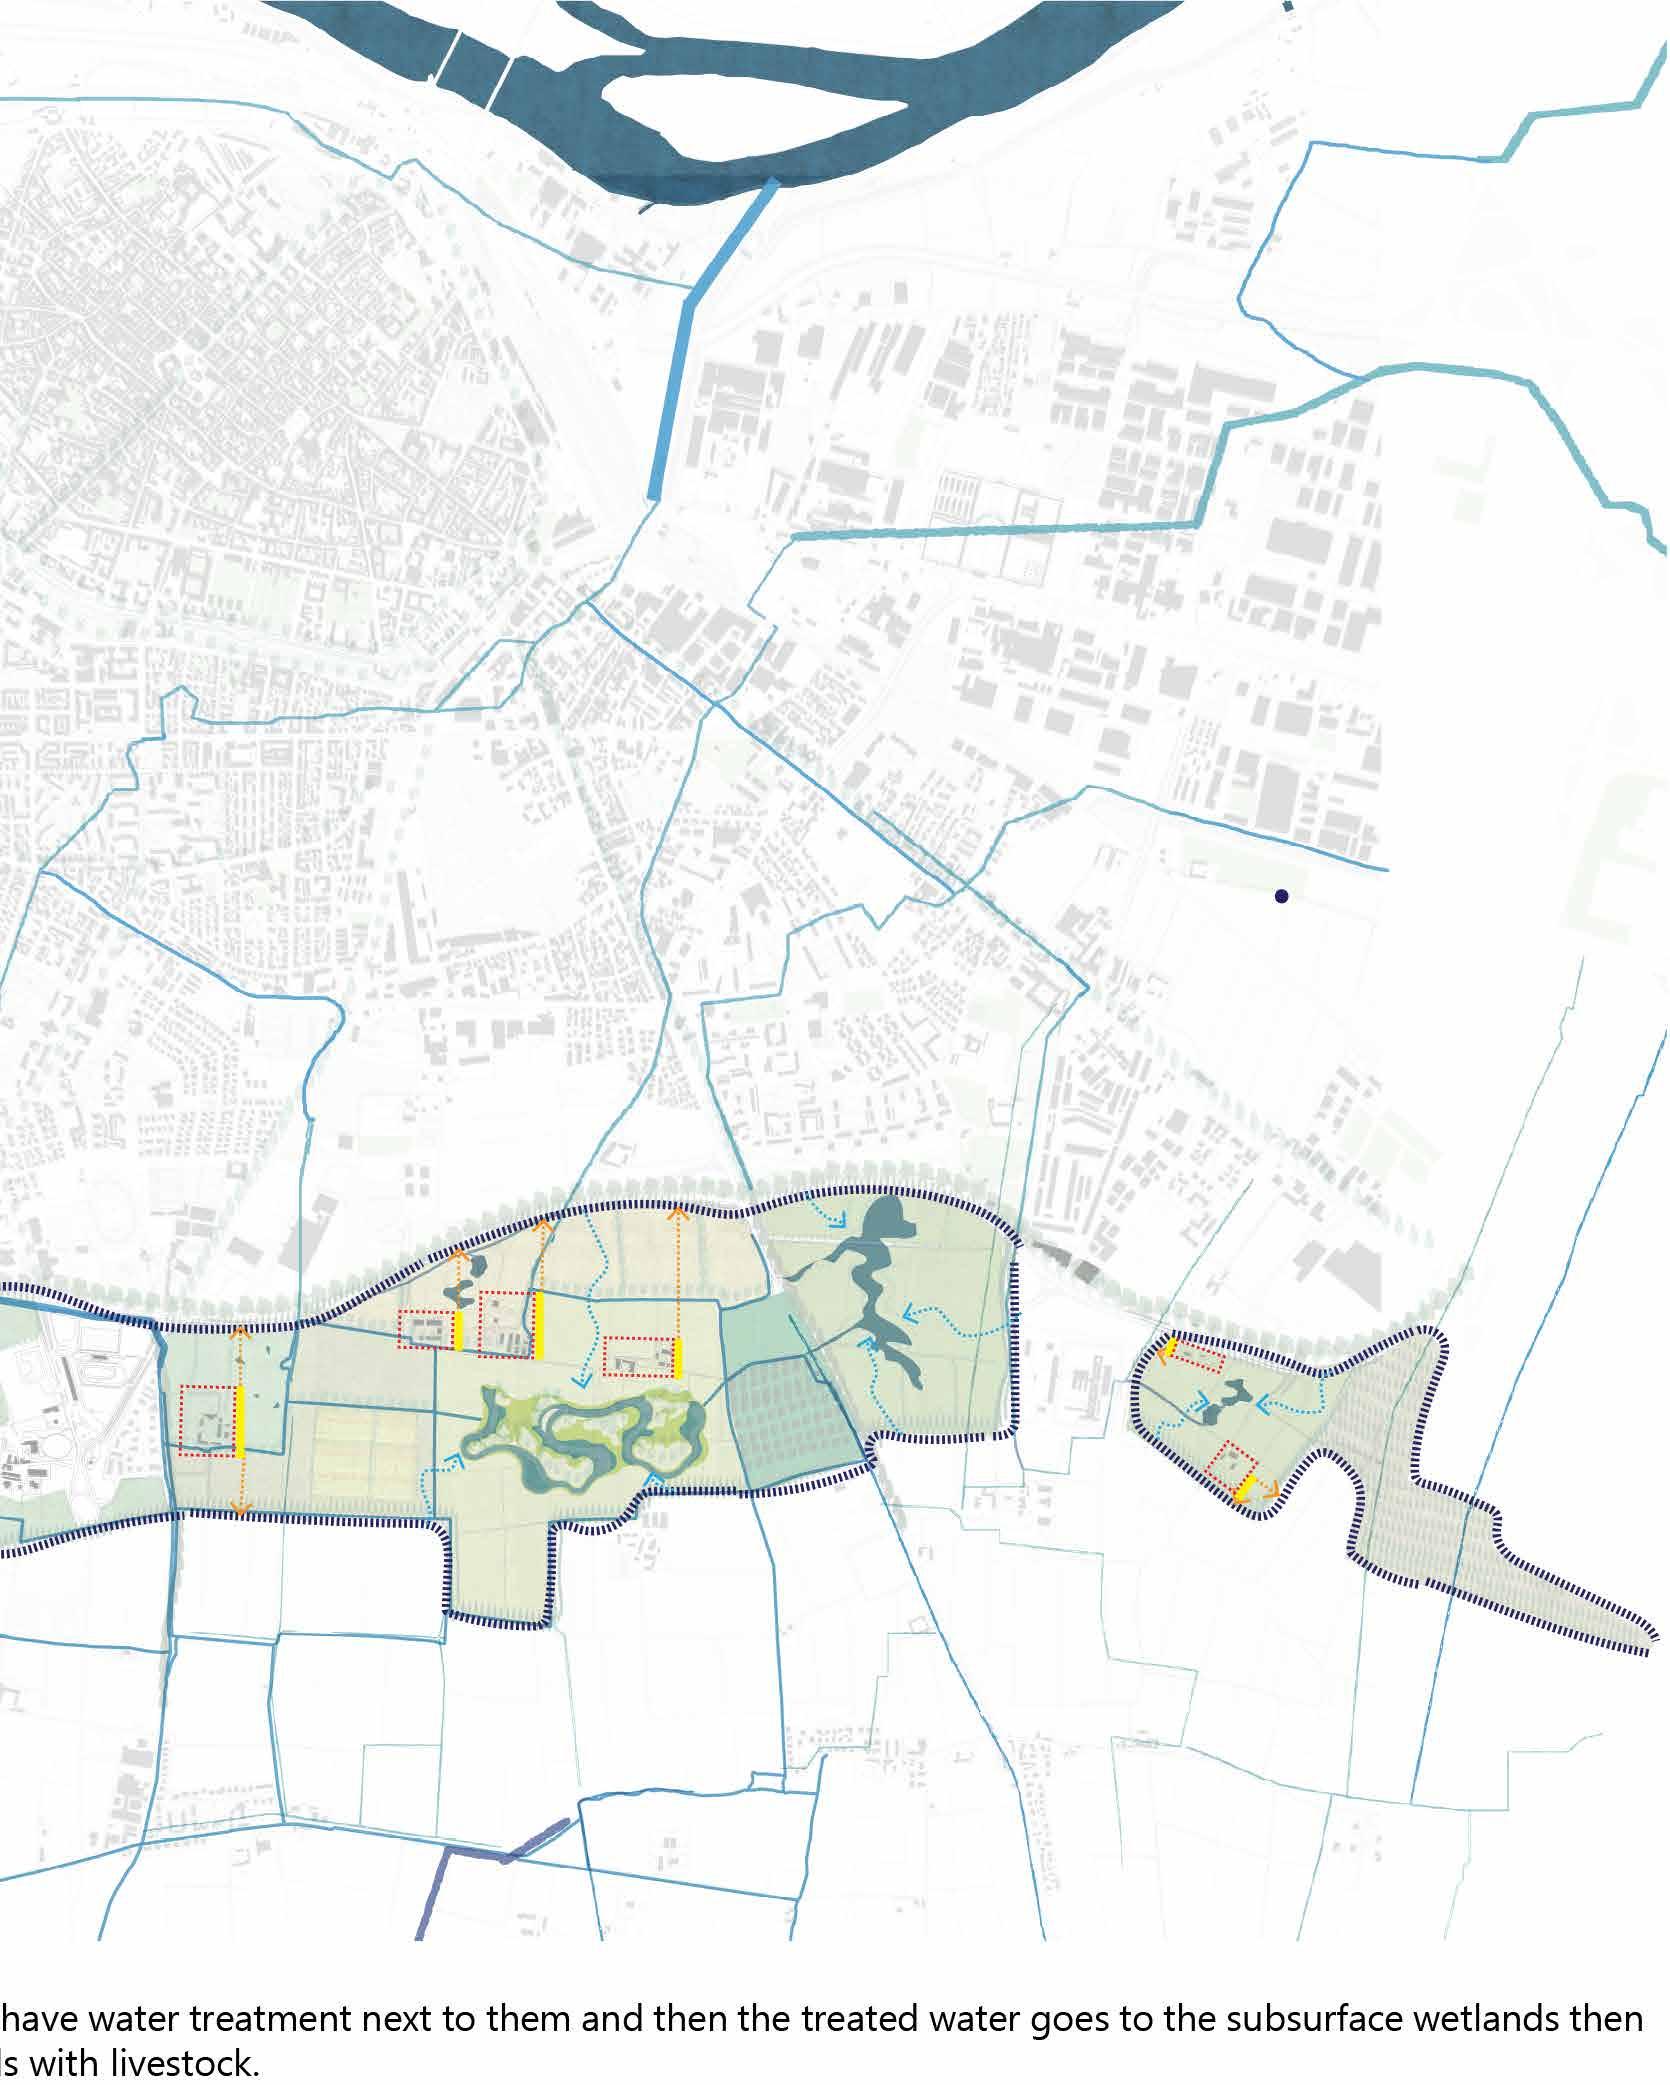
The Highlighted Items are the buildin gs on site that are sources of waste wa ter, it is suggested to have water treat ment next to them and then the treated water goes to the subsurface wetlands then into the surface wetlands for sto rage. Other areas are also the meadows and the agricultural lands with livestock.
Figure 34
Section showing the subsurface wetlands
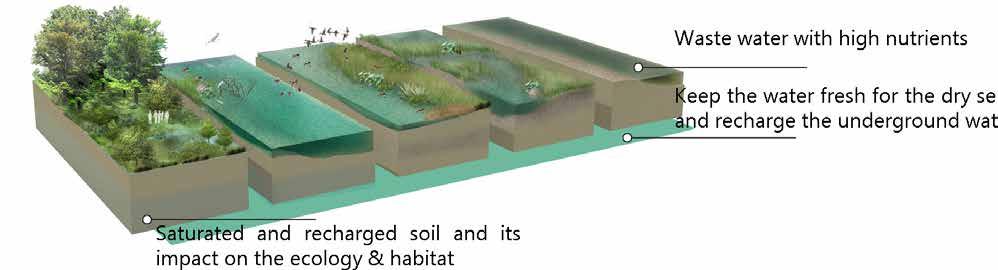
Figure 35
Views to show the pro cess of how to regain native habitat
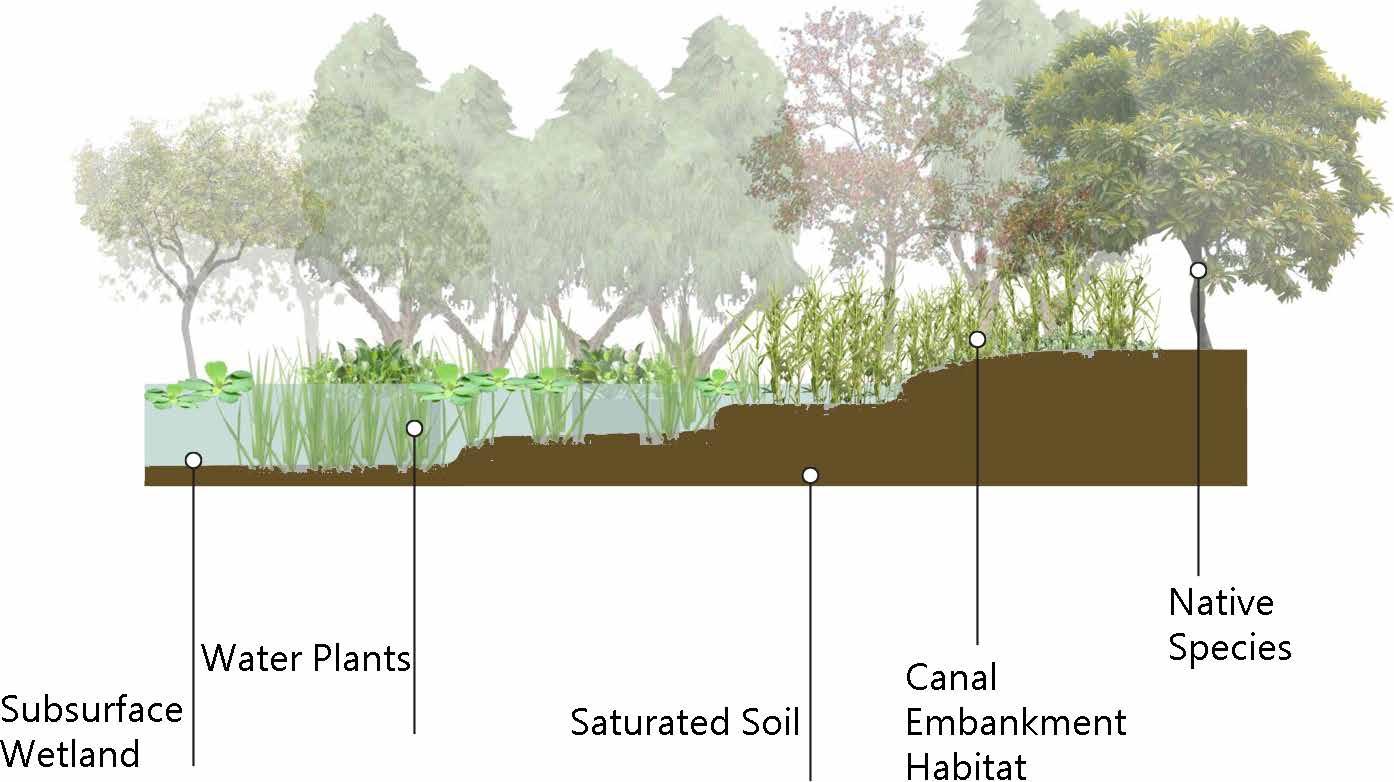
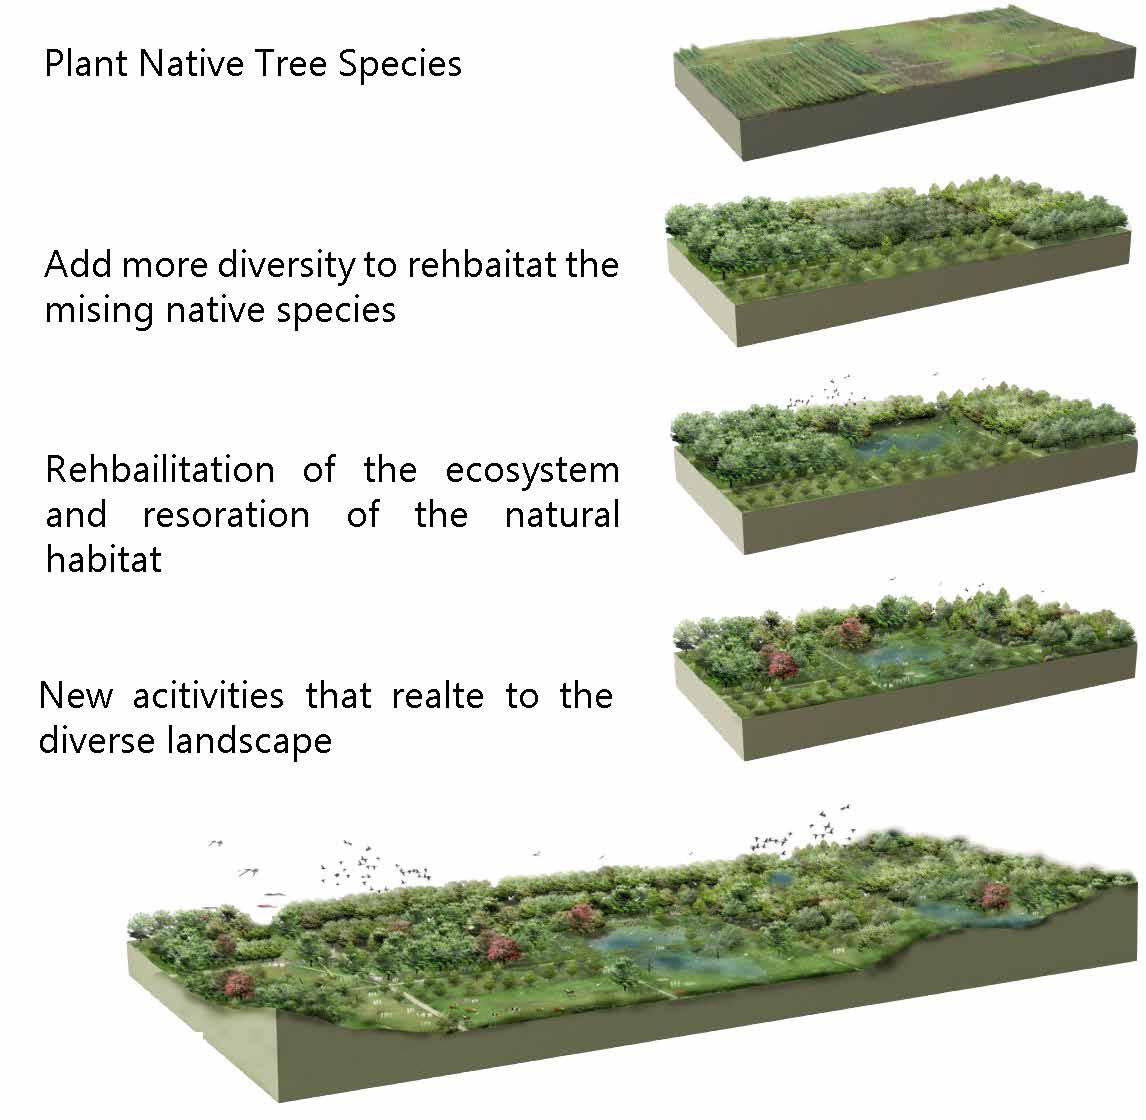
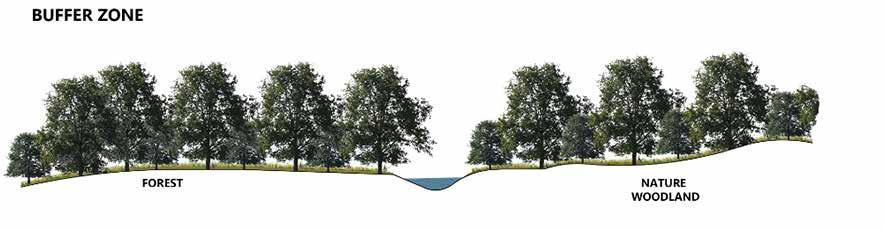
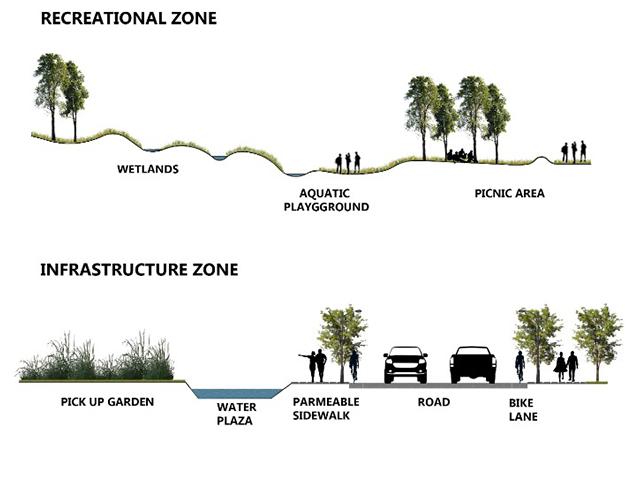
Figure 36
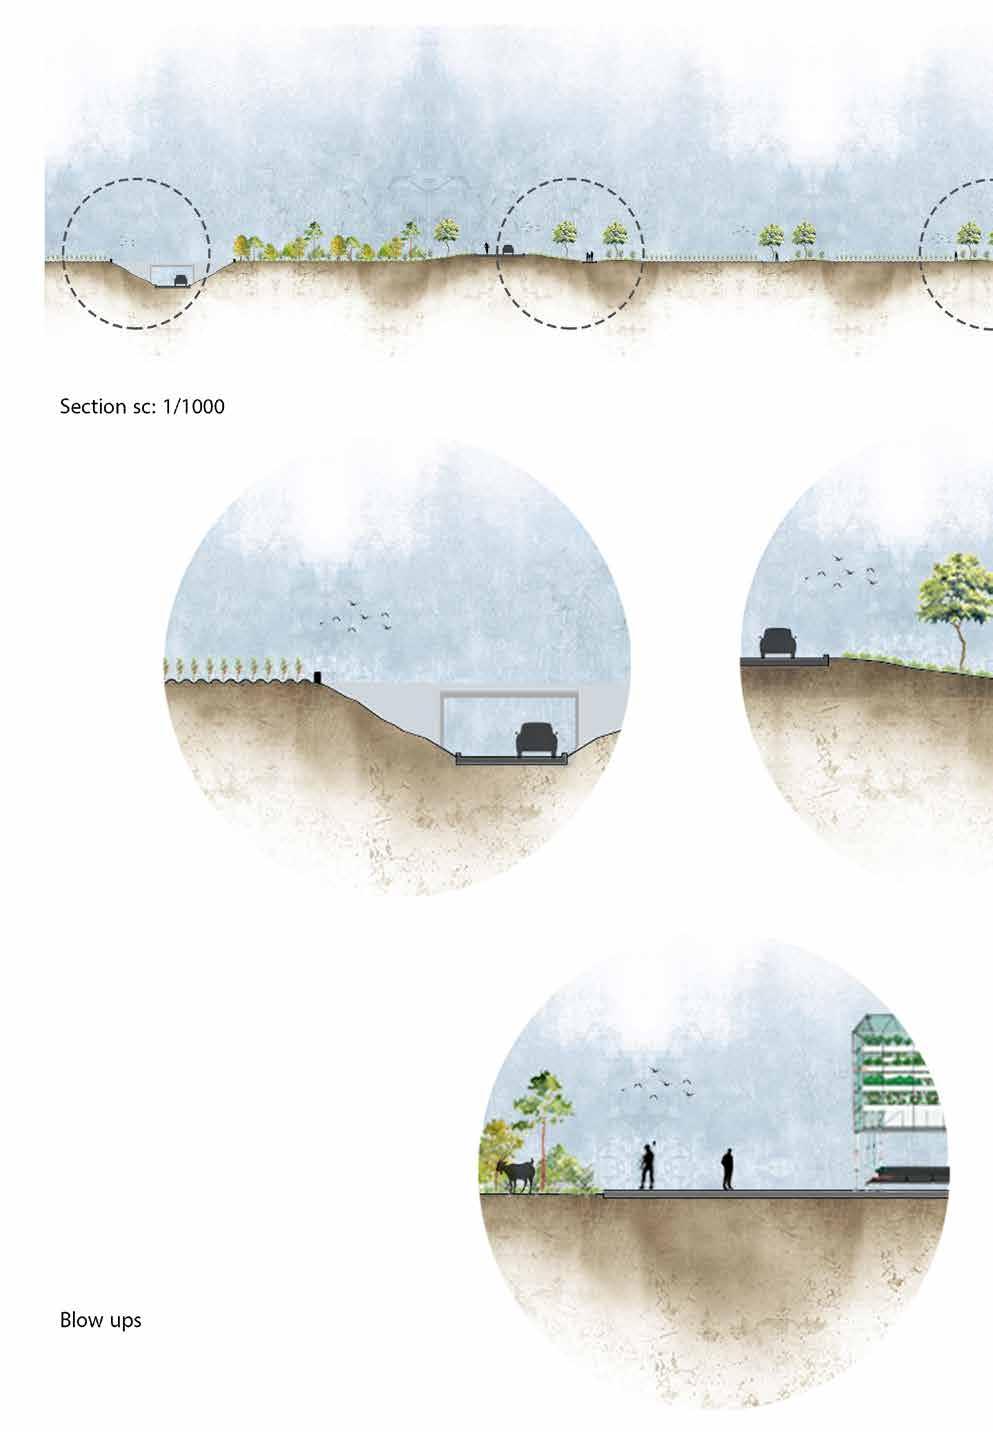
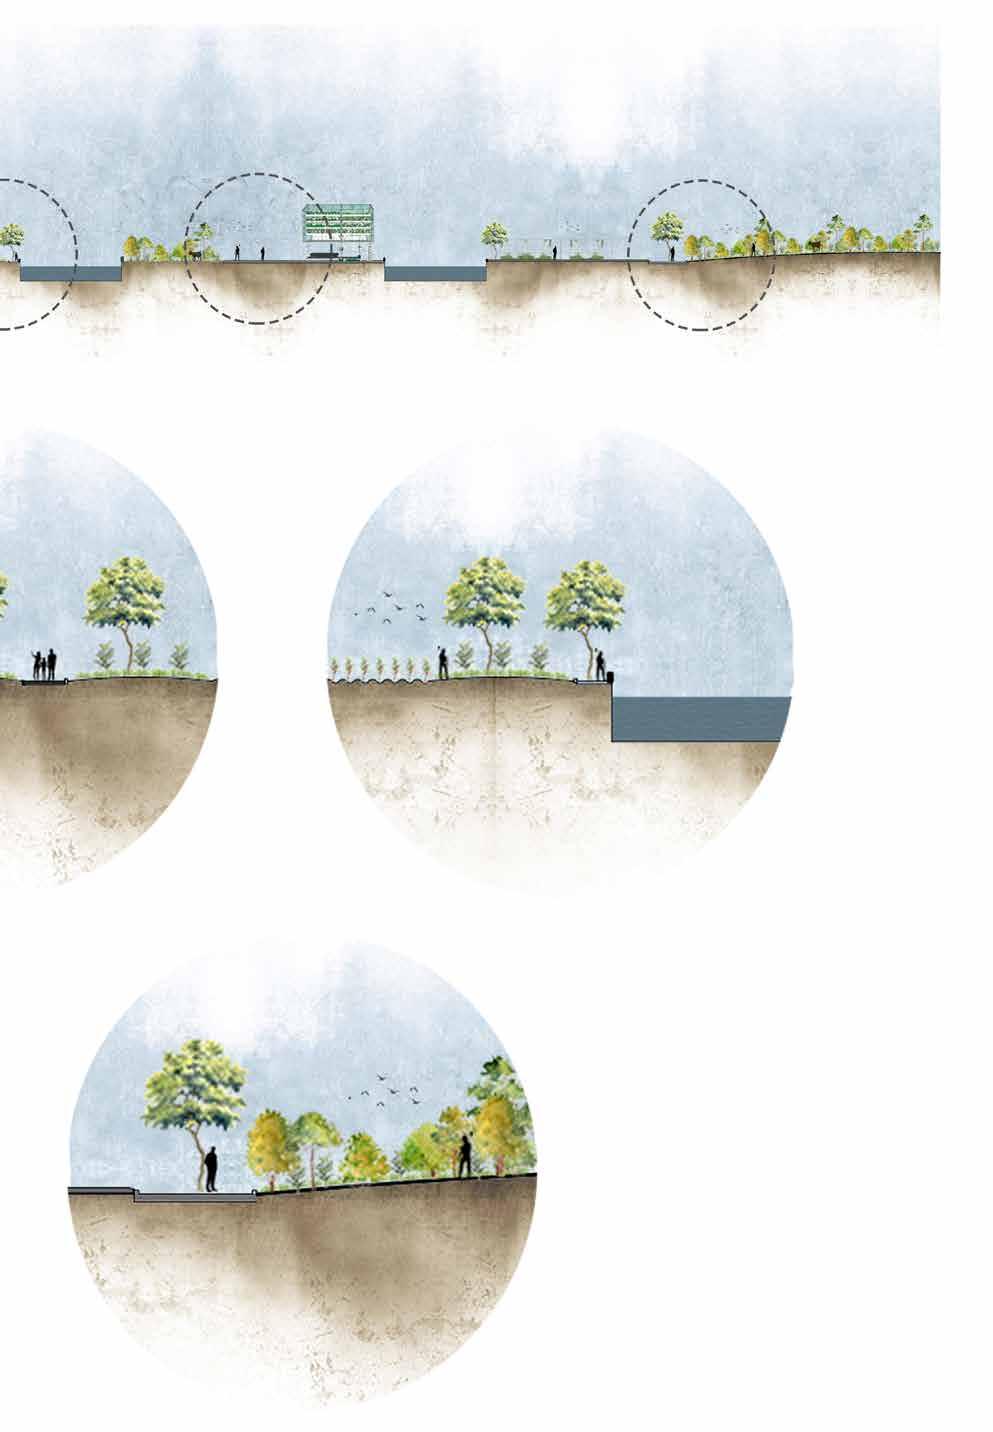
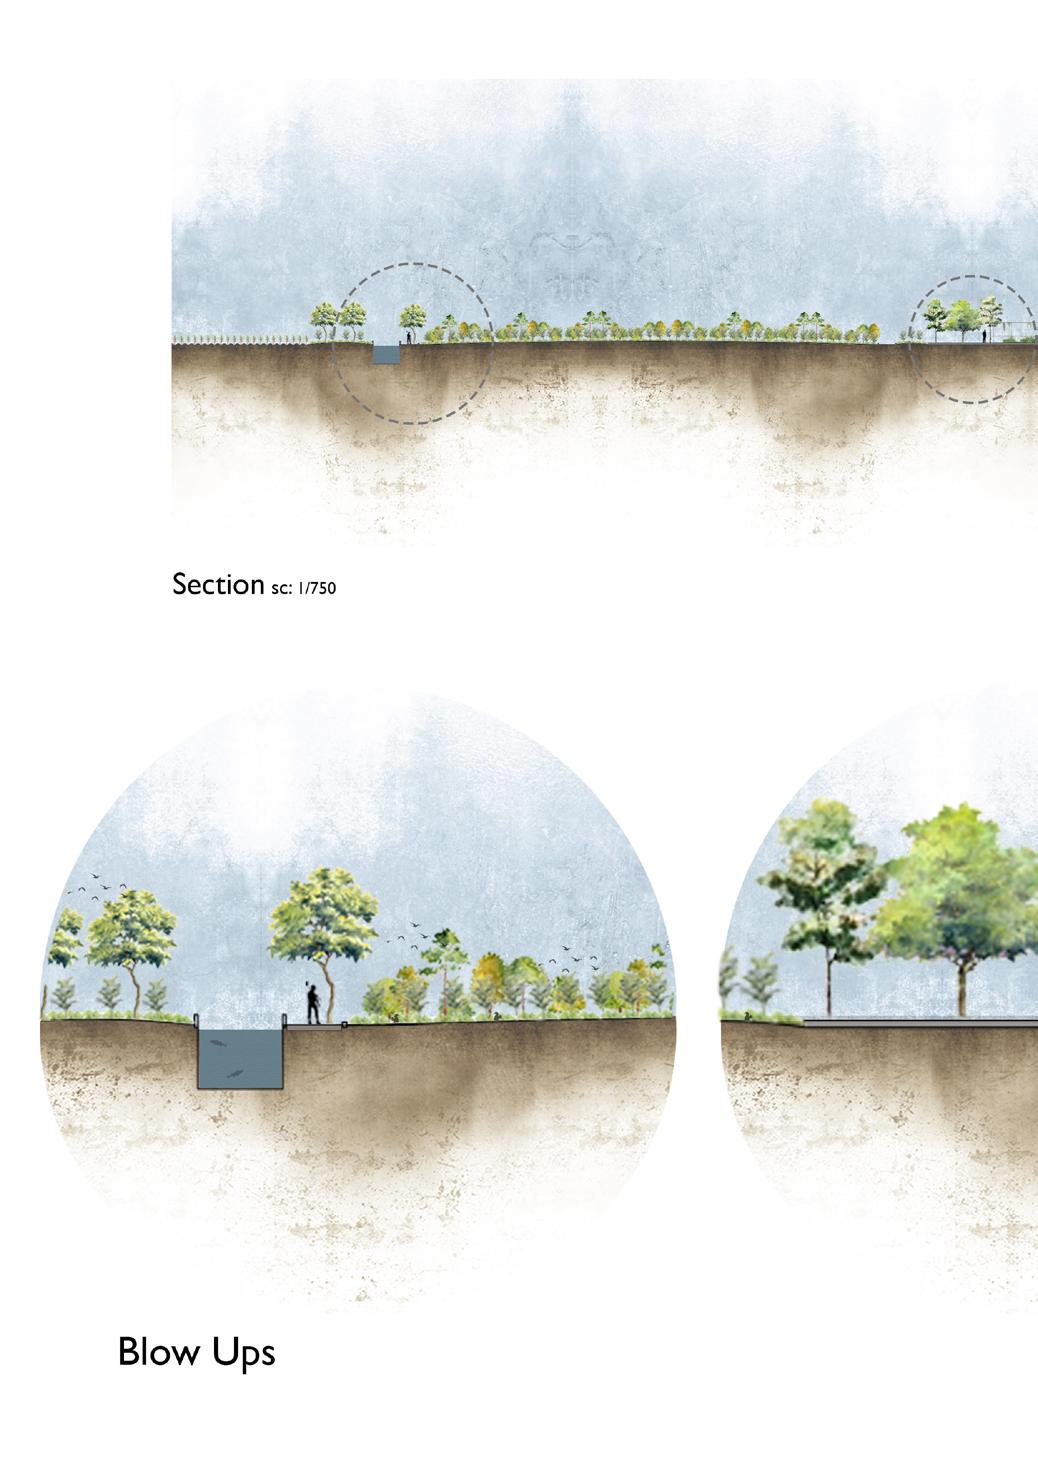
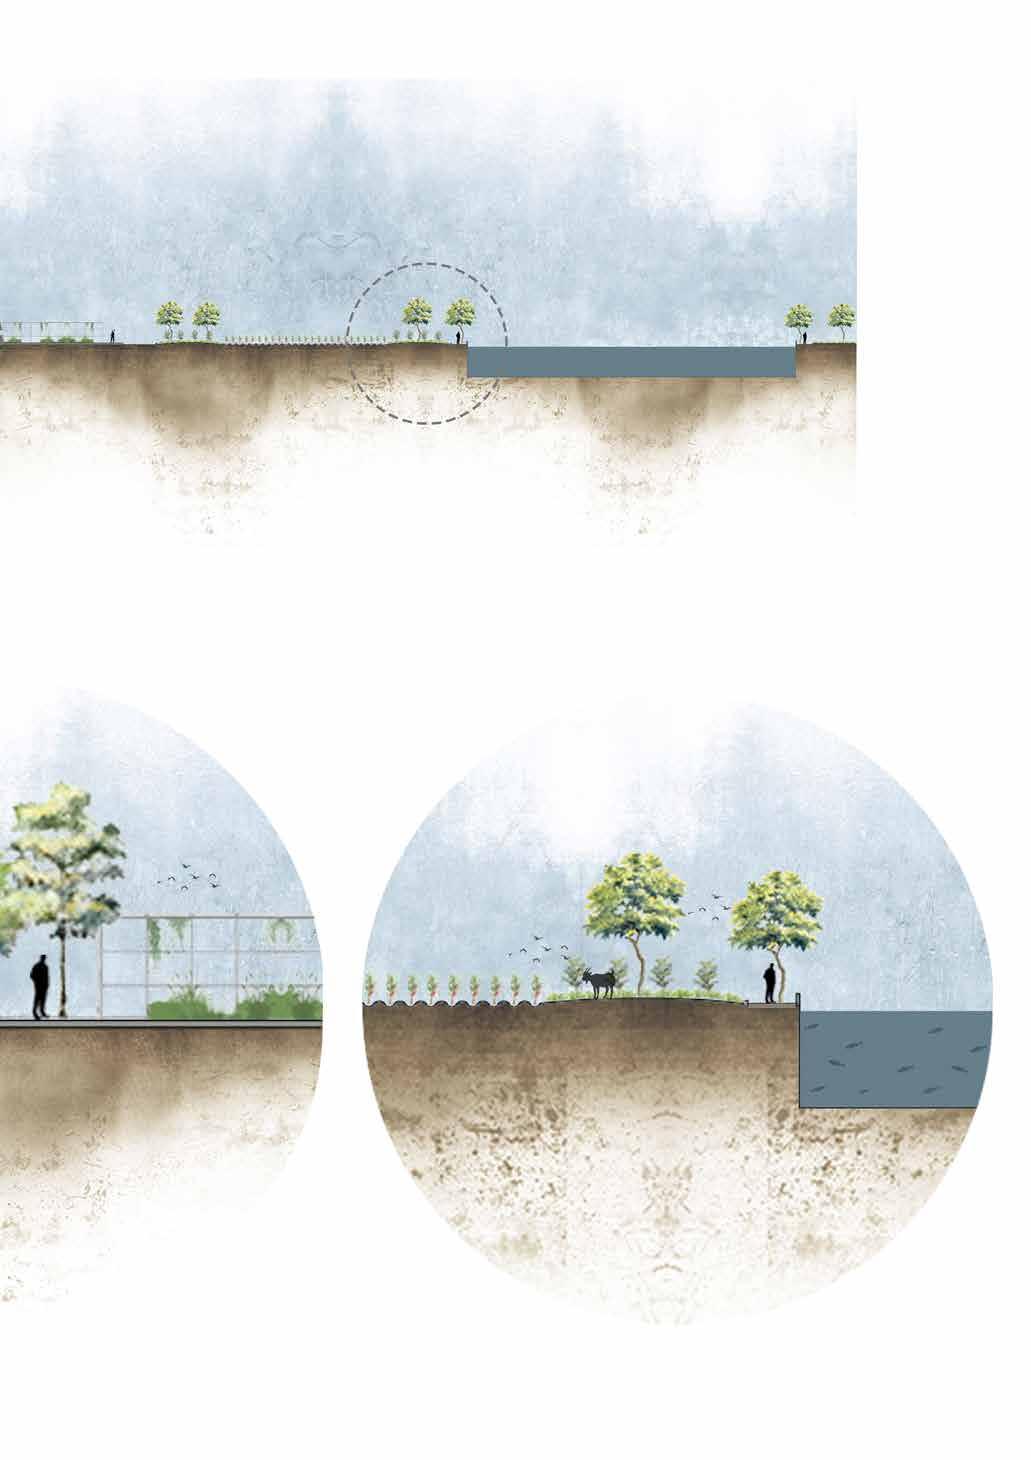
Sections to show the dif ferent landscape expe rinces
Figure 37
Sections to show the dif ferent landscape expe rinces
Figure 38
Sections to show the dif ferent landscape expe rinces
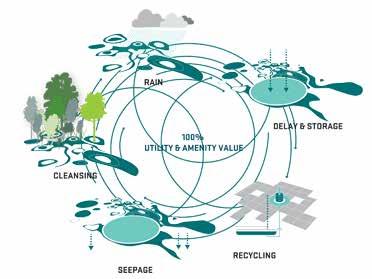
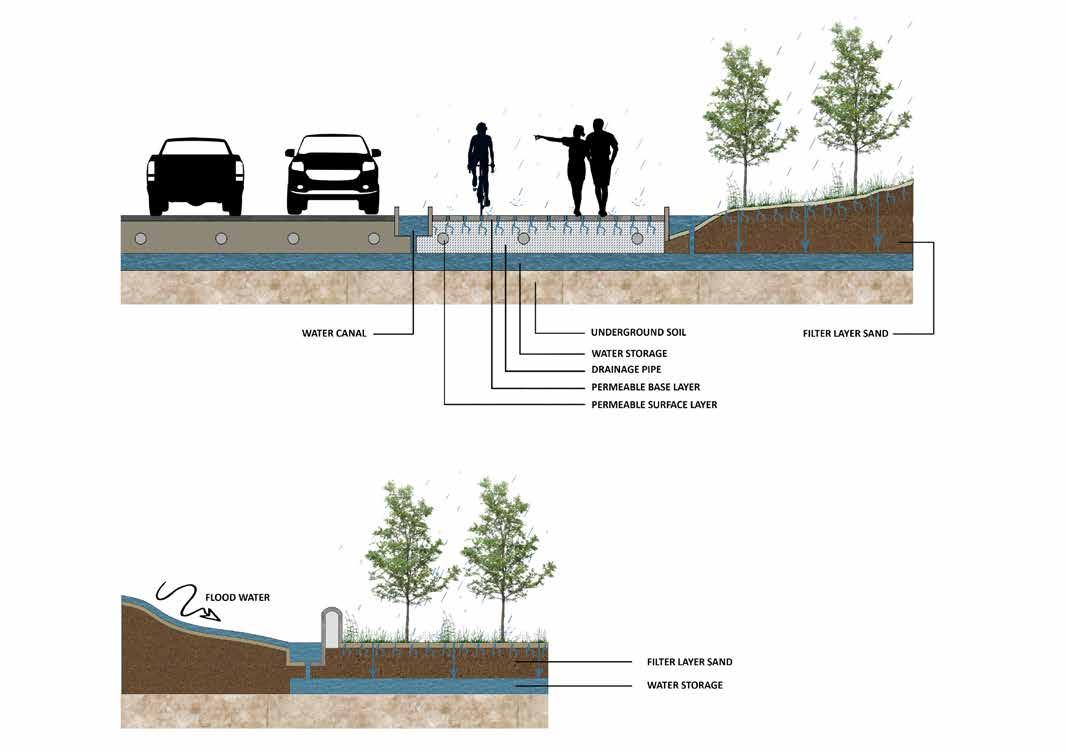
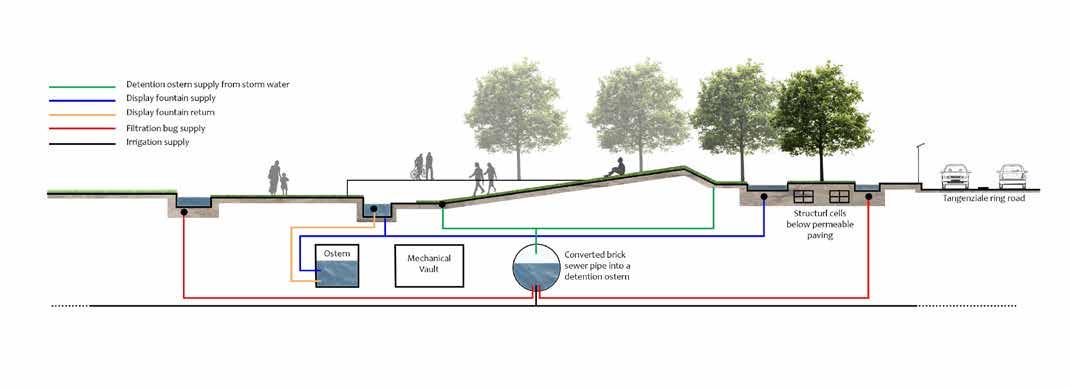
The water plazas and soft pavements are designed to soak the water from the rain and take it underground to create envi ronmental sustainability and water recir culation and reuse in the area. By using permeable pavements in order to recycle the water from the rain, also there will be channels next to the infrastructure that links to the wetlands to store the water.
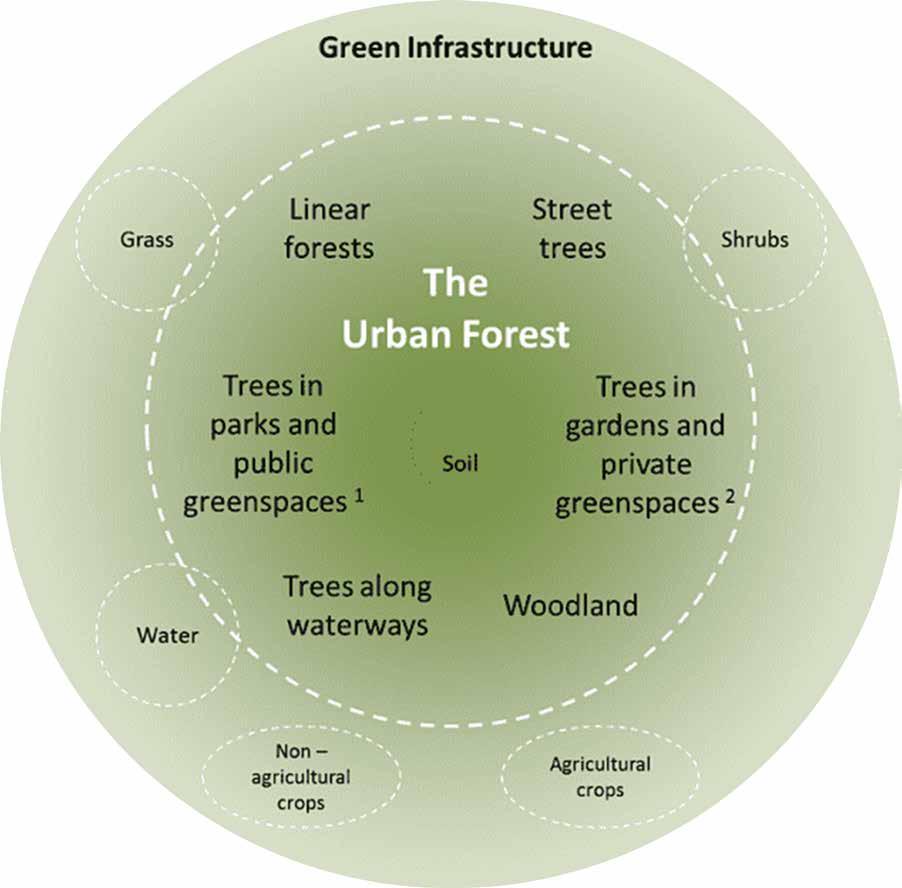
In order to restore and reconstruct the local ecosystem, a proposal was develo ped to create a piece of urban Green In frastructure through strategies including adaptive flood control, stormwater mana gement, water quality improvement, waste water reuse and biodiversity restoration.
The main concept of the conservation is to restore and re-populate various types of habitats to recreate various eco-systems that existed here historically.
A flood-detention pond is proposed which is capable of storing storm rainfall runoff. Domestic discharges and farm disposals are collected through drainage ditches, purified through a set of constructed wetlands, and stored in the de tention pond during the dry season. This will play the most important role in keeping the proposal green and viable.
Figure 39
Sections to showing the Regenration activites
Figure 40
Sections to showing the water mechanisms
It is capable of reducing pollution, providing opportu nity for urban land develop ment, and serving ecological functions. While Integrating the Blue Green Functions, we redefine the street typology, the land uses and the use and preception of water. By integr taing the historical permiances on site we start to look at an intgrated infrastructure that only serves Piacenza.
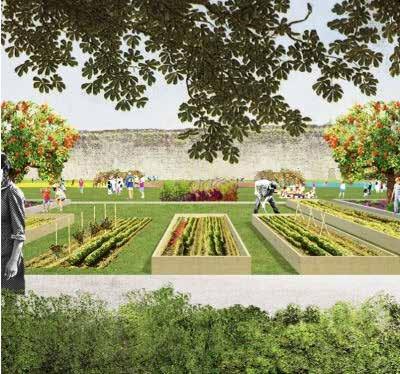
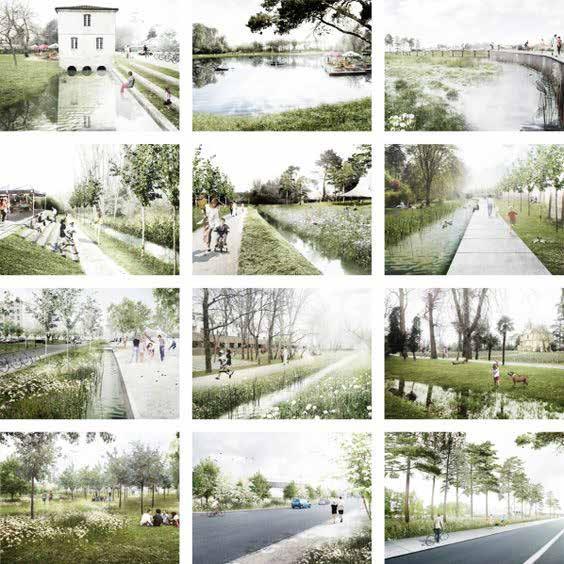 Figure 41 New suggested Land Typologies
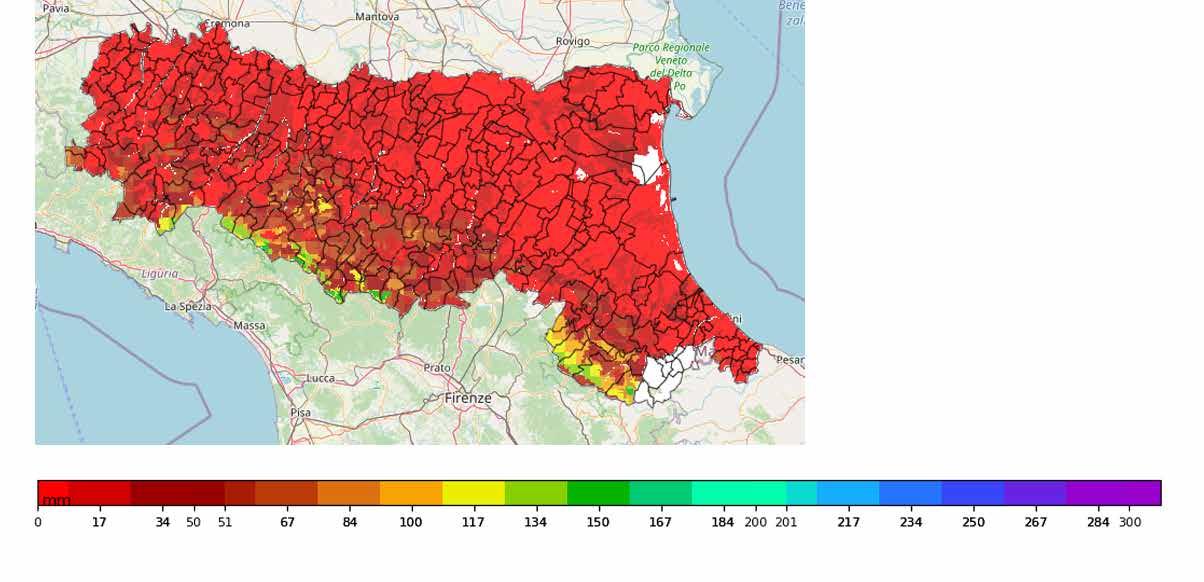
In order to understand what our selected site requires we had to start by looking at the soil conditons and the soil re quirments in order to assure ecological restoration. From the Drough Map we were able to know where does Piacenza and our site stand with regards to the drought indicators. Agricultural drou ght is characterized by the lack of sufficient moisture in the surface soil layers to sup port crop and forage growth (Vergni 2004) . Indicators of agricultural drought often are precipitation, temperature and soil moisture to measure crop yield
By looking at the drought in dicators in our project site, we were able to gather the water levels in PC especailly in our site. Farmers are most concerned with agricultural drought when available water supplies are not able to meet crop water demands. Agricul tural droughts can occur for a variety of reasons, including low precipitation, the timing of water availability, or decre ased access to water supplies. which is why the next step was to look at the water sources, rainfall and the floding even ts to understand better how much water we have versus how much water we need.
Figure 42
Map of Drought in Emilia Romagna
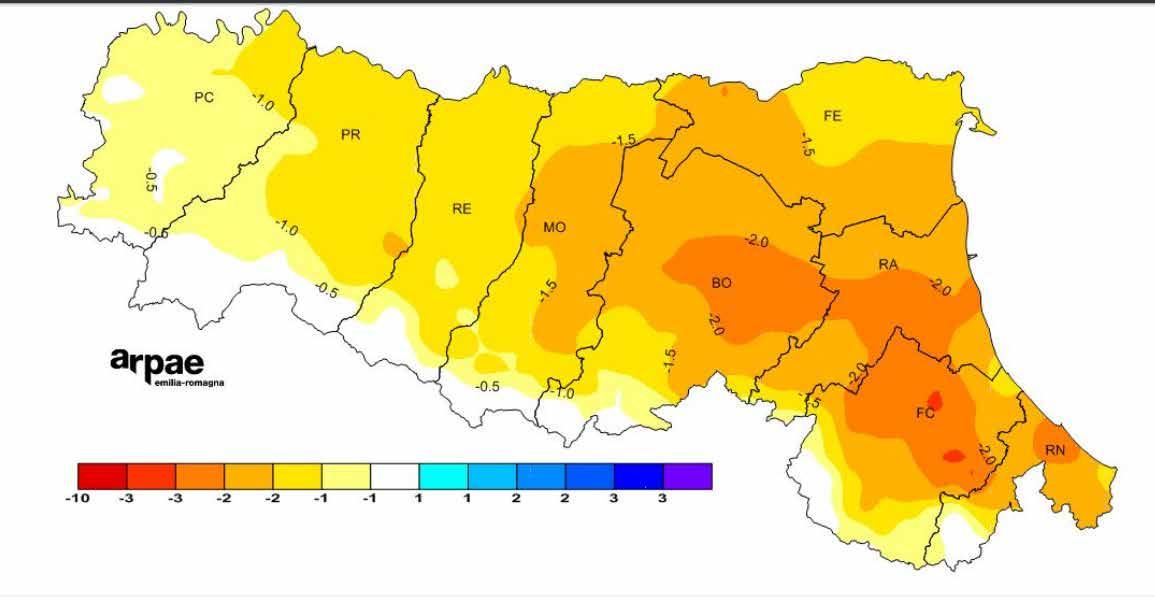
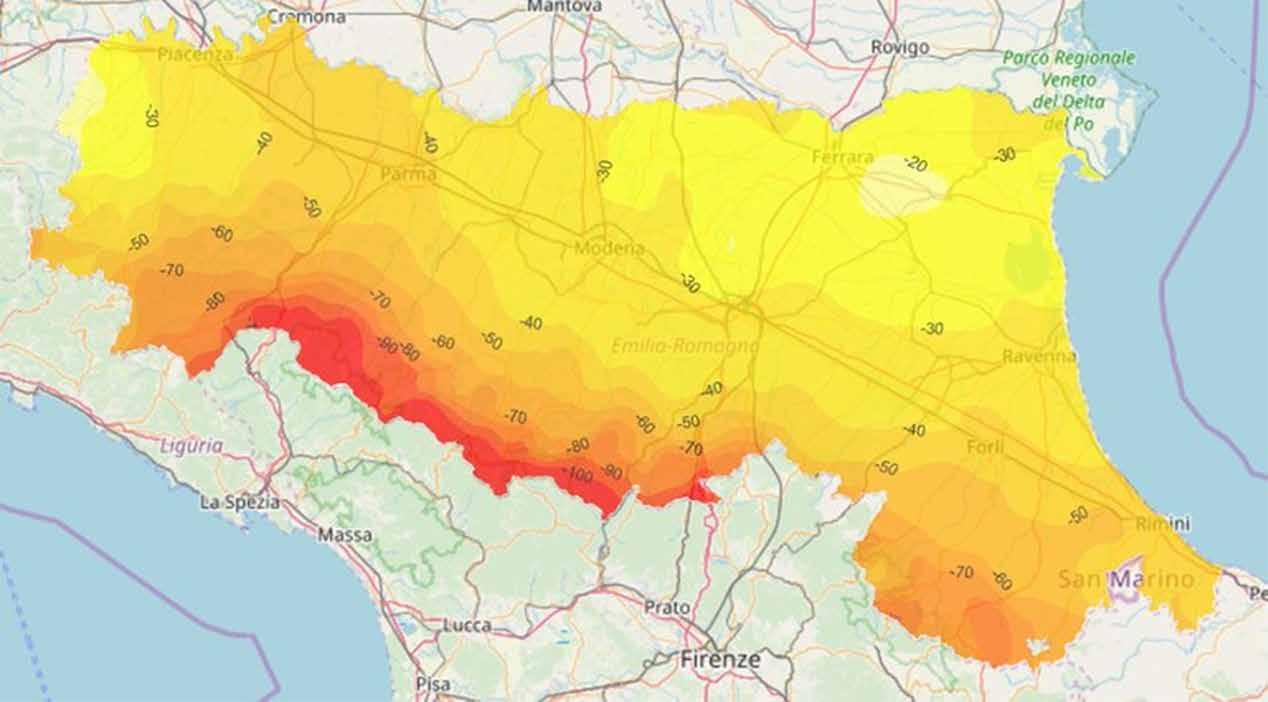
Figure 43
Map of Drought in PC
The SPI index quantifies the precipitation deficit for diffe rent time scales; each of the se scales reflects the impact of drought on the availability of different water resources. Soil moisture responds to precipi tation anomalies on short time scales, while underground wa ter, rivers and reservoirs tend to respond on objectively lon ger scales. In the first case, therefore, the index provides indications about agricultural
drought, while in the second case we have information con cerning hydrological drought..
Figure 44
Map of SPEI (Standar dized Evapotranspira tion Precipitation
Compared to the SPI, the evapotranspiration loss is in troduced into the calculation, therefore the hydroclimatic balance deficit (difference between precipitation and evapotranspiration potential reference) is quantified on different time scales. Com pared to the SPI, the SPEI in dex captures the impact of temperatures in atmospheric water demand, and therefo re allows to discriminate the
drought events characterized by conditions of strong ther mal anomaly. This element makes it particularly suitable in describing the variability of drought events in the context of global warming.
Figure 45
Map of SPI (Standardi zed Precipitation Index
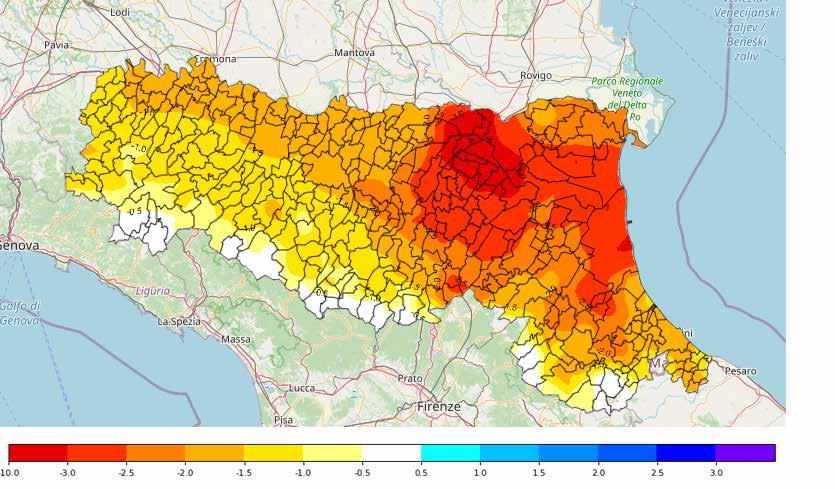
It is the available (maximum) water of a land is the diffe rence between its Field Water Capacity (CIC) and the humi dity at the matrix potential of -1.5 MPa (often referred to as the Withering Point Perma nent, PAP). In the calculations produced with Criteria, for AD (Available Water) we mean, at the date of the simulation, all the fraction of water actually available for crops above the aforementioned PAP. The va
lue is expressed in mm and is calculated considering the soil layer explored by the ro ots of the reference crop, whi ch in the simulation is fixed at 120 cm. It is the fraction of water in the soil which is re tained by capillarity and can be removed only with radical absorption and direct evapo ration from the surface
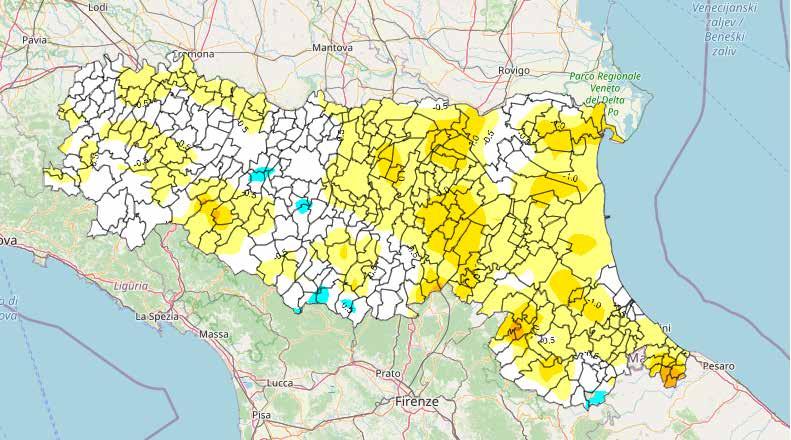
Figure 46 Map of Available groundwater
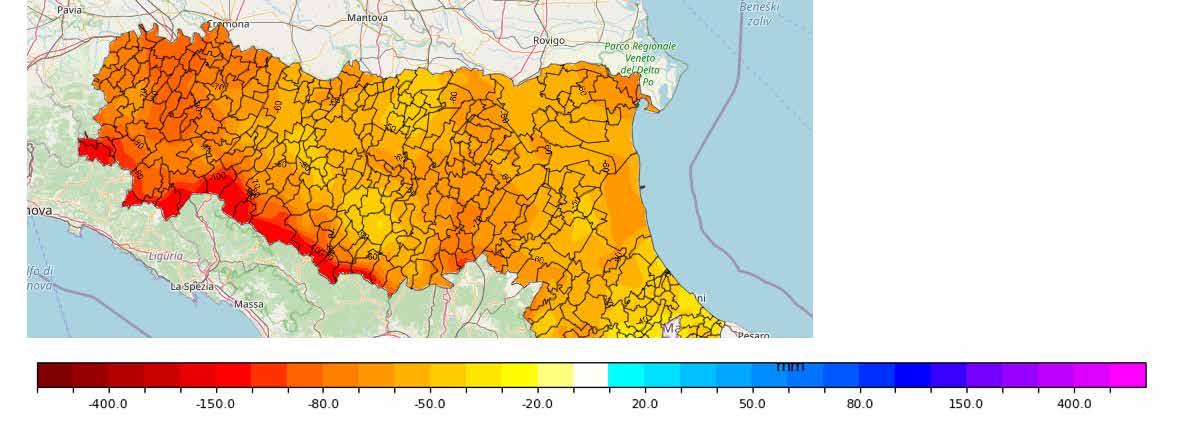
The Hydroclimatic Balance (BIC) represents the diffe rence between rainfall (P) and potential evapotran spiration (ETP) expressed in millimeters (mm). Evapo transpiration is the pheno menon by which water, in the form of steam, passes from the soil to the atmo sphere, directly (evapora tion) and through plants (perspiration). The extent of
the phenomenon depends on meteorological (tempe rature, humidity, wind and radiation), pedological (wa ter potential of the soil) and crop (LAI, stomatic characte ristics, etc.) factors
Figure 47
Map of abnormality of the hydro-climatic balance
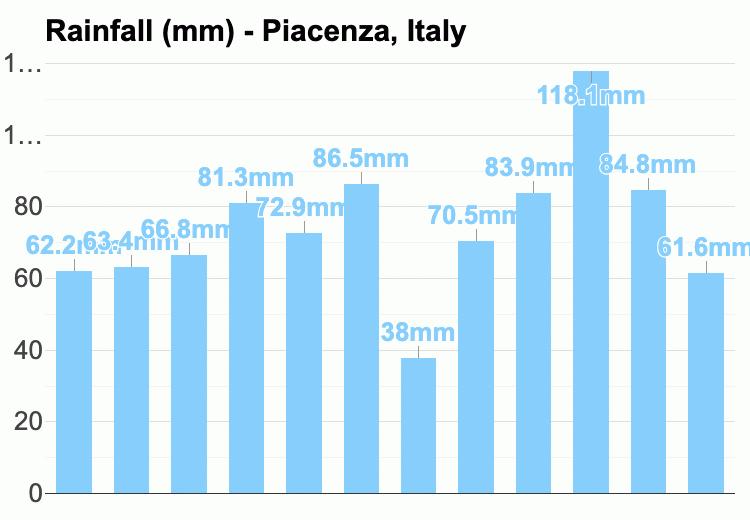
By understanding the rainfall level in Piacenza, we are able to antcipate the amount of water in the best and wors case sce narios. When thinking of how to harvest this water to make sure it is not gone to waste, we had to understand exactly the difference in levels in mm to understand the capacity of the suggested water bodies. In October is the highest sea son due to the heavy rain fall which results in the flooding season in Piacenza.
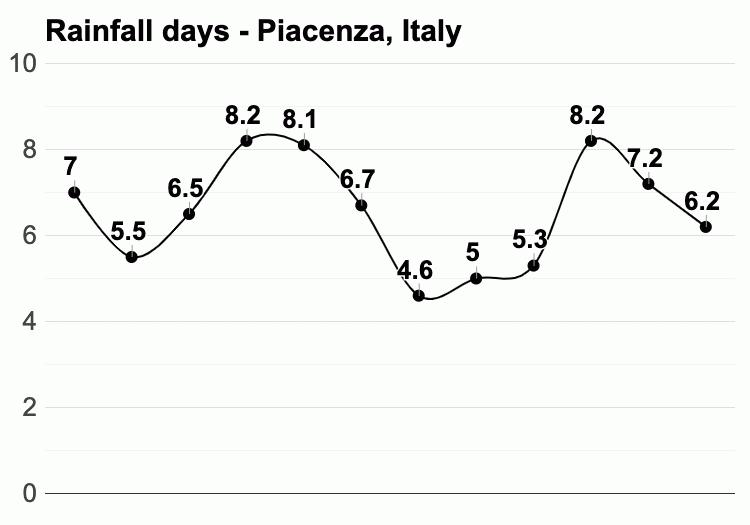
After that we proceeded to understand the number of days of rainfall in Piacenza to know the maximum natural reserviors in Piacenza and in knowing so, we can start lo cating the added reserviors to save the runoff water.
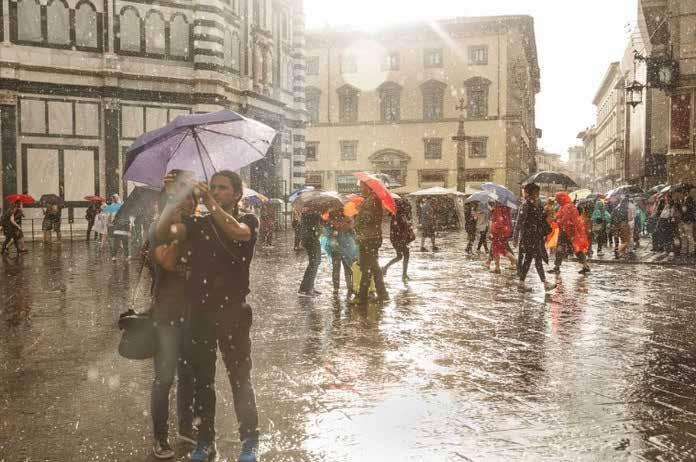
Figure 48
Table of the levels of Rain in Piacenza Figure 49
Table of the average number of rainy days in Piacenza
The diagram shows the cur rent , past and future projects of the water levels caused by rainfall. From the diagram we can underdtand that the wa ter levels will increase and that will add a strain on the natural reservoirs of Piacenza which in turn will result in flooding oc casions.
The purpose is to antcipate the events and take advantage of them.
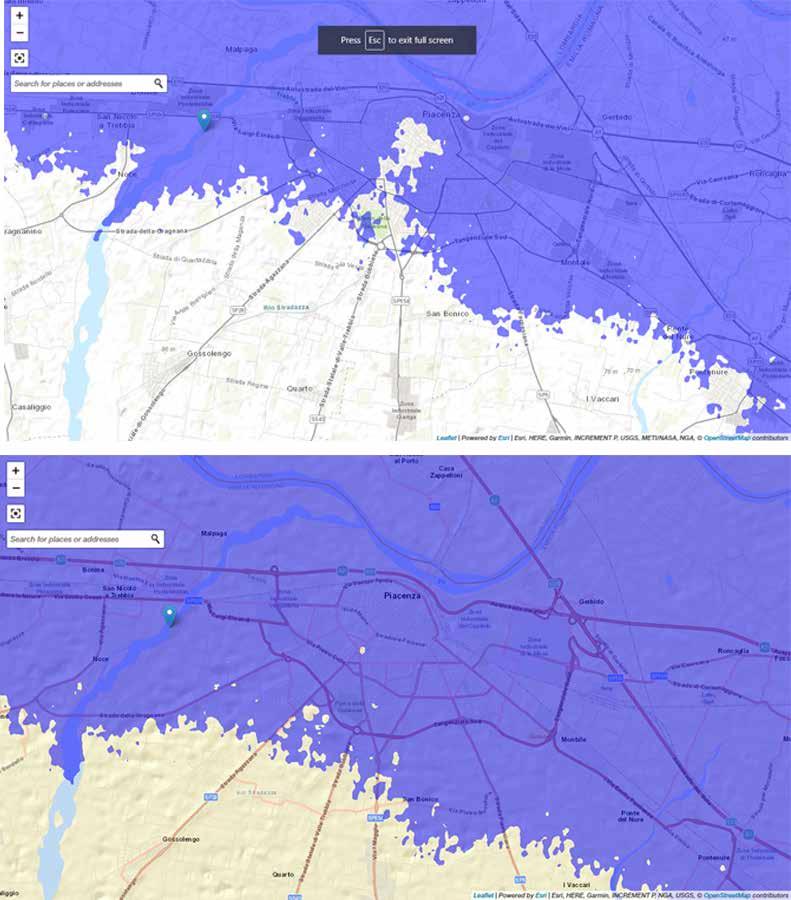
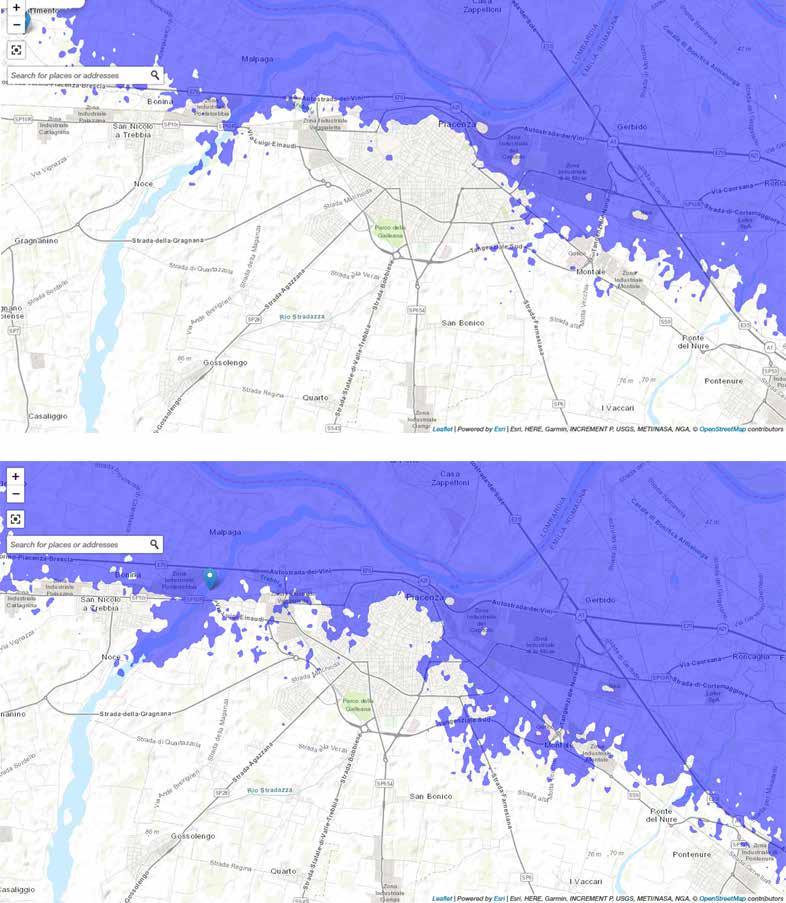
We observed a simulation of the rainfall and pointed out the locations that get flooded first in case of a highlevel flo od, and an increase in the rain water levels.
The top of the diagram get flooded first due to the topo grpahy of Piacenza.
Figure 50
Projection of Rainfall in Piacenza
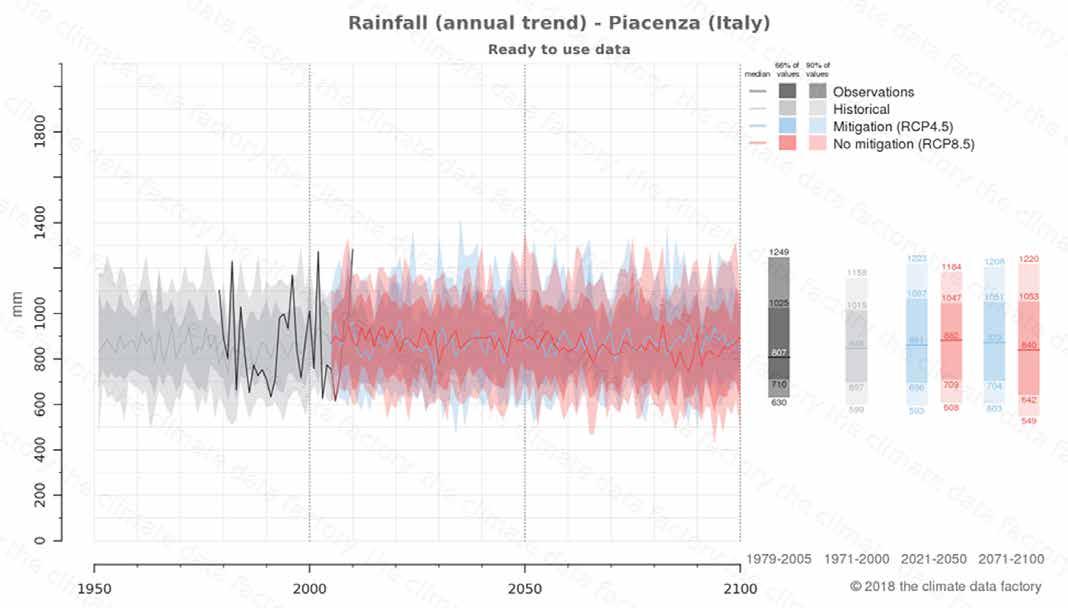
Figure 51
Diagrams of the rain fall levels in Piacenza


 Figure
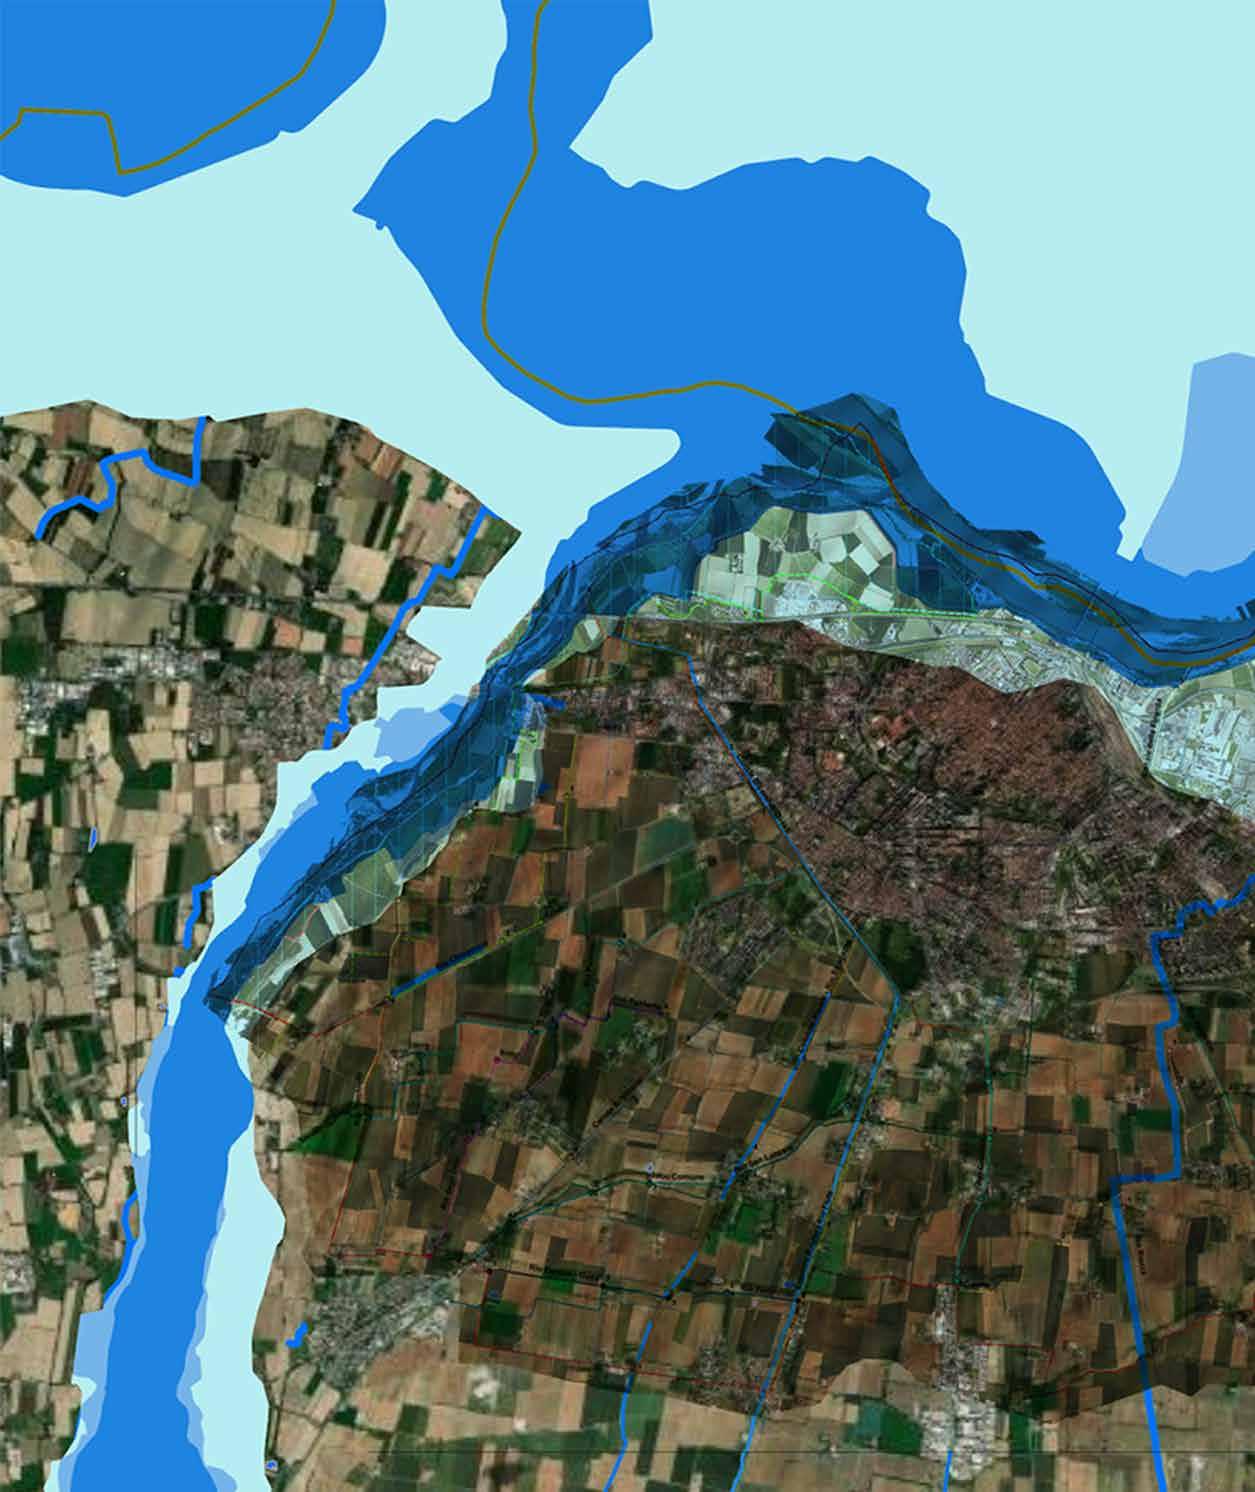
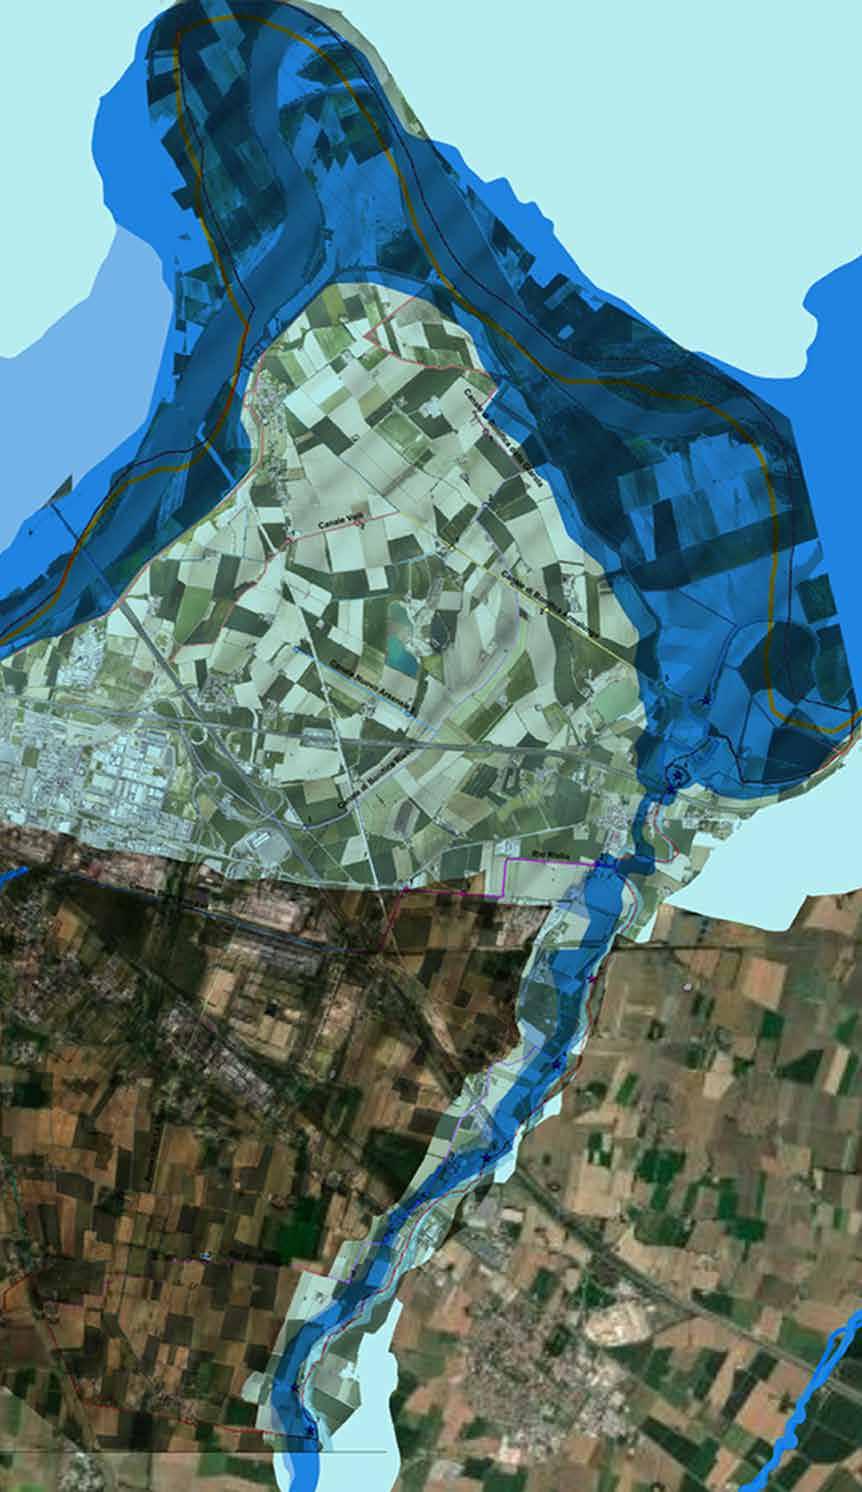
Map of Flood Levels
Figure
Map of Flood Levels
The Map points out clearly the canals that get flooded and impacted by the heavy rainfal ll, also it highlghts the risk le vels of the floodlines. by understanding where and how the flooding event will affect Piacenza, we were able to add these observations to gether and understood how to approach the site. Due to the levels the force of the flo od is coming from the above and then finds its way down towards the Po River.
Figure 53
Image of flood event near Po River
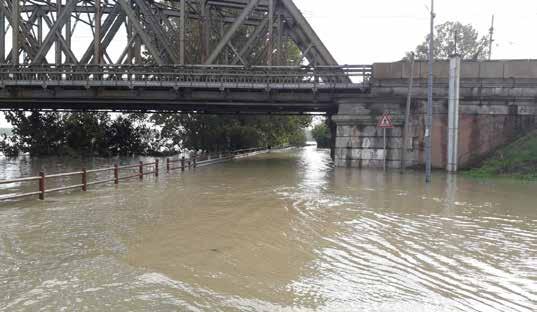
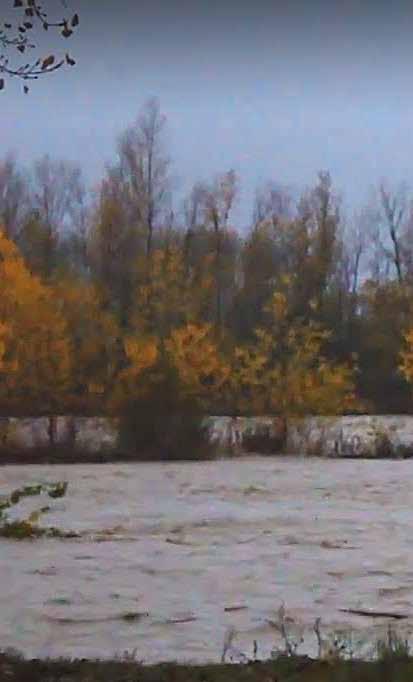
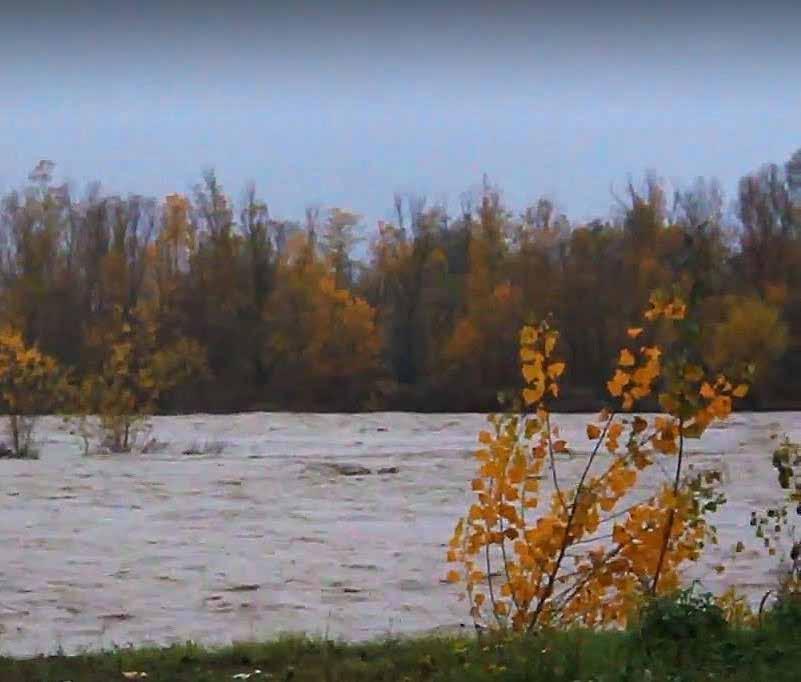 Figure 54
Image of flood event in Val Terbbia
Figure 54
Image of flood event in Val Terbbia
A liquid shouldn’t be contained with a rational geometry but following the “continuity” of its movement Charles Willard Moore
Productive landscape (Big Foot) such as agricultural fields is more “beautiful” than the “useless” decorative landscape in gardens (Small Foot) Kongjian Yu

The idea took place as to how make use of the flood froce and how we can make it en ter the site without having be destructive to the surruondin gs and we allow this event to transform the landscape to be come a productive landscape that can interactive and ener gizing to the surroundings.
The project vision is to recon nect the site and the residents to their biosphere (land, water, and the air).
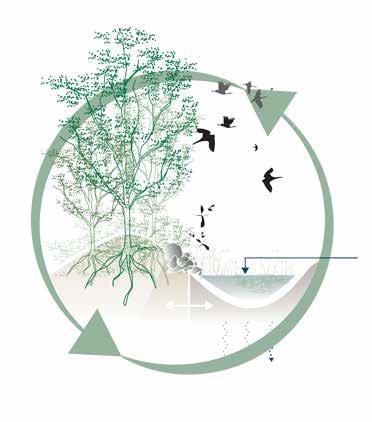
Eventually this integrated sy stem will enhance a synergic relationship between residents and their biosphere. Where it is the connection to Enhance Capacity of Ecosy stem and to Enhance Wel lbeing
Diagram of the Eco logical Corridor
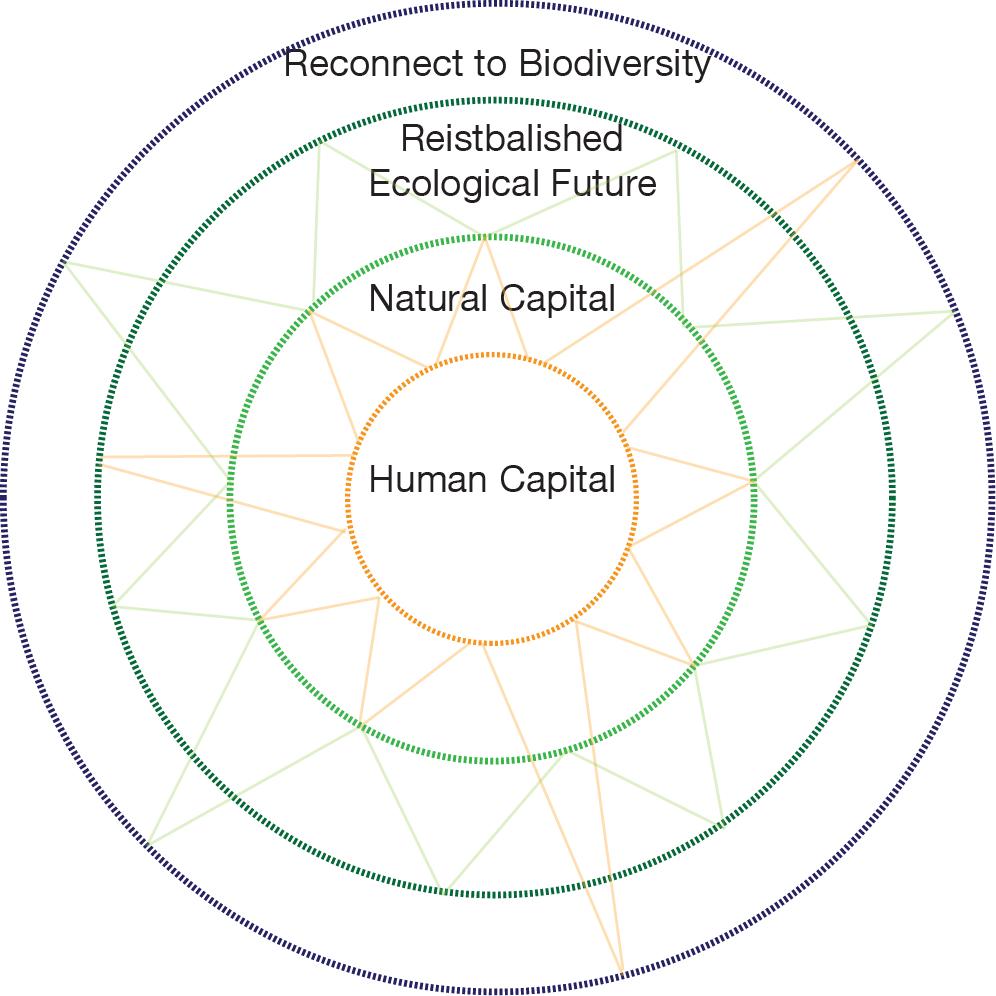 Figure 55
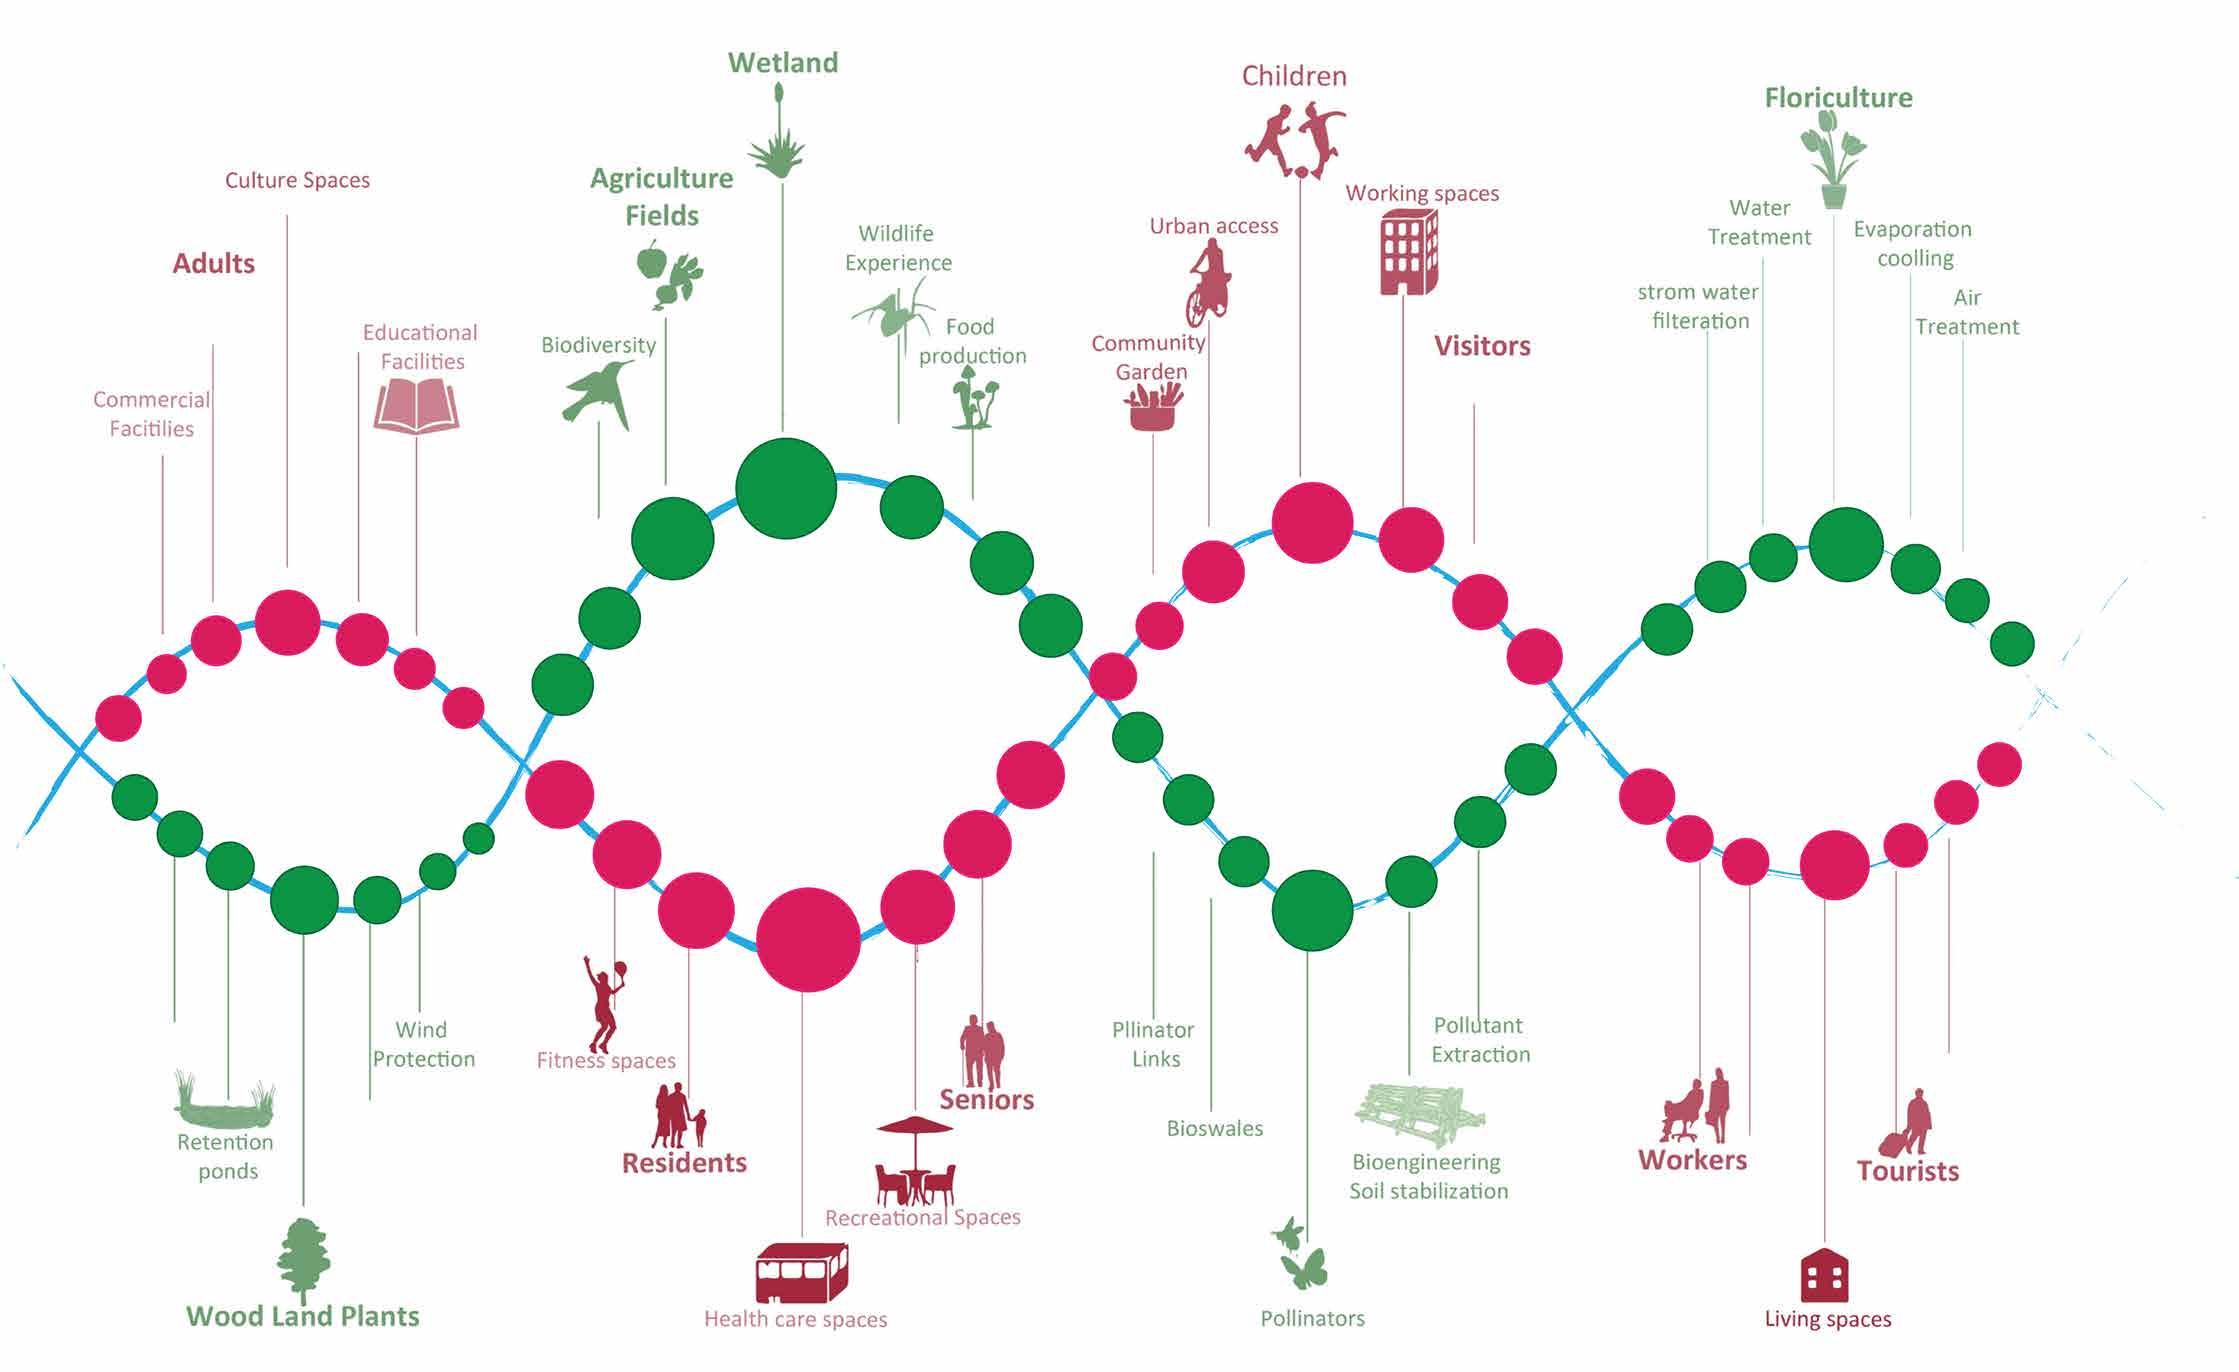 Figure 56 Diagram of the Ecological Corridor synergy
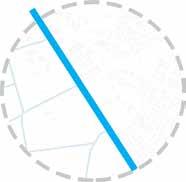
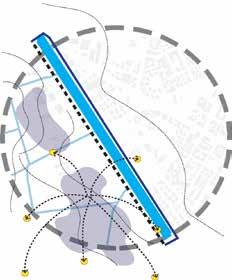
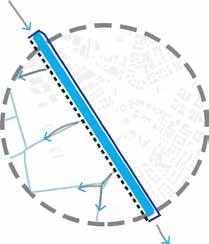
Synergized Water-infra structures aims to radically shift the perception of the ca nals by making them the front line infrastructure rather than the currently neglected one in the rural landscape.
Through the lens of water and stewardship, our propo sal seeks to look at the water system and adapt the system to a change of governance, to fit modern environmental and social conditions. The water system is comprised of inter connected lines with various branching hierarchies and their respective land that they pass through.
By focusing on these ca nals, Synergized Water-infra structures aims to strengthen the social and physical structu re at an urban scale in order to have an impact on the system as a whole locally and maybe regionally.
Through Synergized Water-in frastructures, we will be able to develop a new water archi tecture which express the es sence of temporality in mate riality and stimulate the “living heritage” through community engagement. In the context of growing cultural tourism, wa ter heritage becomes a uni que topic for its inherently multi-scale cultural, social and environmental aspects; and its potential to become a “living heritage” by incorporating local participation in a com prehensive development.
Figure 57
Map of the exisiting water system
Figure 58
Map of the irrigation Canals
A crucial component to Sy nergized Water-infrastructu res is a replicable strategy that would be applied to other landscapes Po River or Terrbia Valley that are currently or will someday experience the pres sures of urbanization.

Through the process of:
1. Identifying Existing Conditions,
2. Establishing An Identi ty,
3. Activating Public Space And
4. Adapting The Canal For Modern Environmental Condi tions.
Water Urbanism also implies a set of design practices that engage people with policy and to continuously manage the urban eco-system to promote resilient communities and par ticipatory practices.
Gathering stewards in the form of local institutions, and community or civic groups, an adapted system of governance is introduced to maintain and manage the land and water in frastructure. These groups will also be held accountable for the caretaking for this vital re source while also being able to use it for their benefit.
1. Identify 2. Establishing 3. Activating 4. Adapting
A. Identify the type of canals, (Major Canal, Minor Hydrographic Networks, Above ground or Below)
Figure 59 Diagram of Methdo logy .
1. Identify 2. Establishing
3. Activating
4. Adapting
A. Identify the type of canals, (Major Canal, Minor Hydrographic Networks, Above ground or Below)
1. Identify 2. Establishing 3. Activating
4. Adapting
B. Locate the hard edge and the soft edge of Canal.
1. Identify 2. Establishing
3. Activating
4. Adapting
C. Understand the water flow. Identify the inlets and outlets of the Canal.
1. Identify 2. Establishing 3. Activating
4. Adapting
D. Take an inventory of the surrounding land use and context, such as institutions, community groups, local markets, civic organizations, agricultural land, small scale residential and large developments.
D.1 Identify potential stewards that will be responsible for taking care of the Green + Blue and will benefit by utilizing areas around the Canal for their own specific program.
1. Identify 2. Establishing
3. Activating
4. Adapting
A. Understand the boundary of the Canal , specifically the undefined boundary (soft edge) and what the highest capacity is (for future rainfall events).
B. Make new edge visually identifiable for each Area to create an identity.
C. Create a productive landscape buffer.
1. Identify 2. Establishing 3. Activating 4. Adapting
A. Determine strategic points for public access into the tank based on surrounding land uses. Provide public spaces along with all edges of the area.
B. Activate the edges by incorporating pedestrian paths and public spaces. Create extensions of existing land uses by using different widths of the path and connecting to the surrounding context. The path will also extend into the Green+Blue defined space at various locations to provide direct relationships and interactions with the water.
1. Identify
2. Establishing
3. Activating
4. Adapting
A. Establish a series activity stations. They will be programmed to reflect adjacent land uses and stewards. They will also be a visually connecting element that will help pull people into the site and view the entire space from a higher perspective.
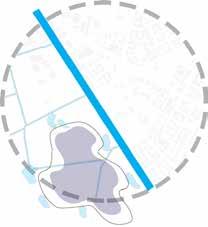
Figure 21 Conceptual Diagram of the water pathway.
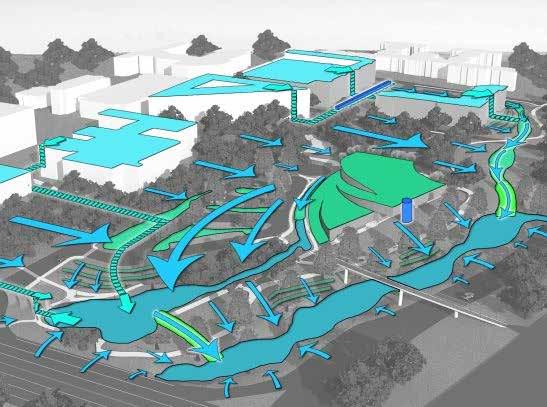
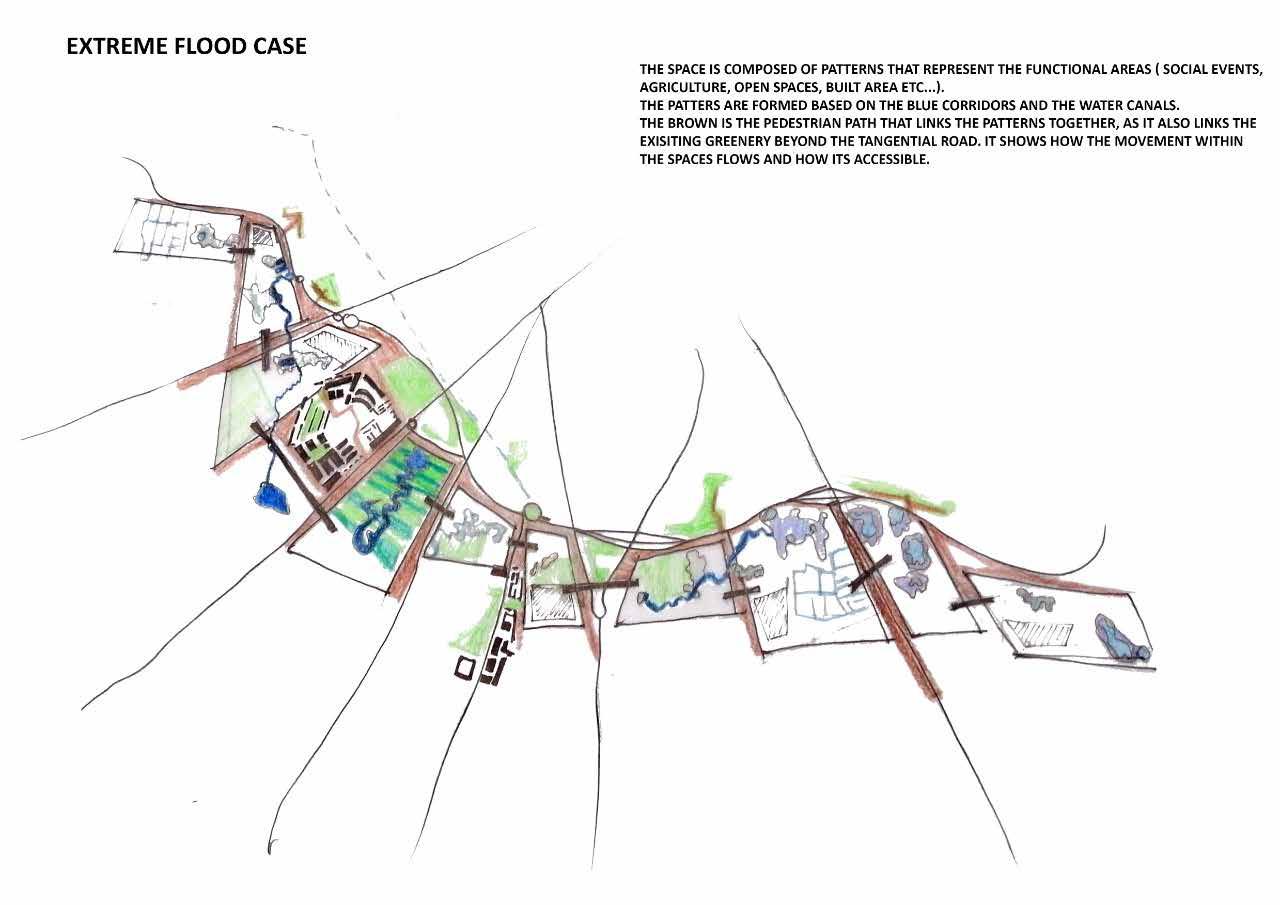
After we have established a methdology, we proceeded with how to apply the flo od network where it can be a defense system that diver ts the water coming from up the mountains and becomes the activating agent and by enhancing the exiting canals that is connected to mutliple backup systems made of ba sins and hydrological networ ks. First we stbalished the lo cation of the defence network and its connection to the irri gation canals. So the idea is to make sure that during the flooding season the water does not leave our belt unless it is via a controlled command not due to the de structive force of the flood. So this network diverts the water inside the site and then it goes around the site based on the gravity force to the wetlands, ponds and canals that will transform the landscape and create new activites.
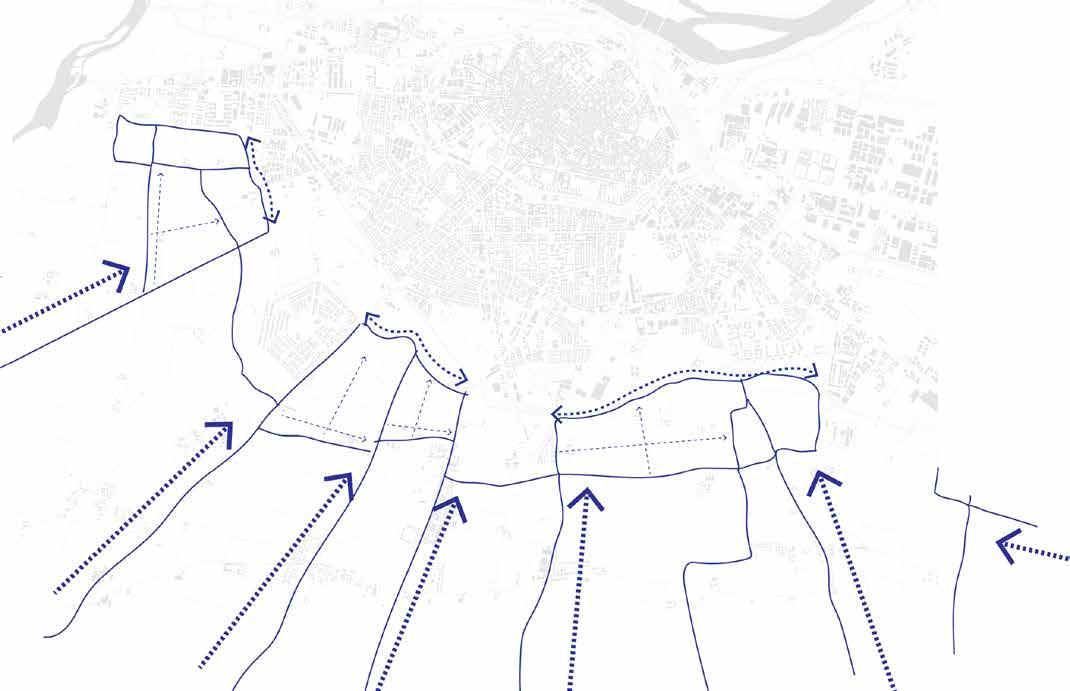
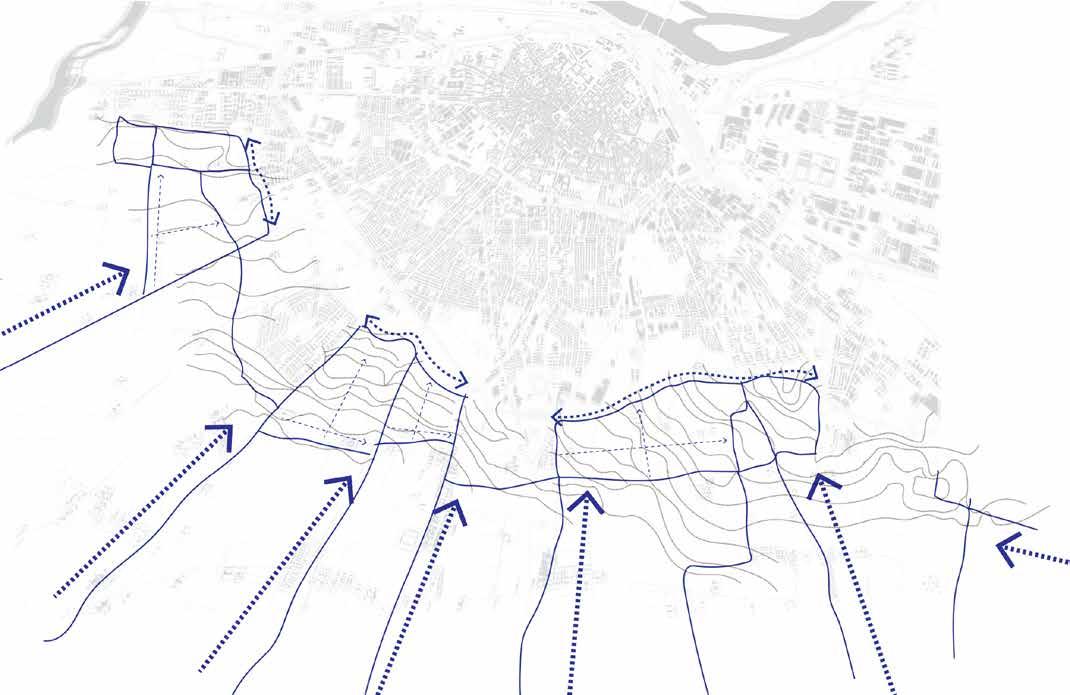
Using the infrastructutre to redesign the path of the wa ter gave us new spaces that we can redfine during the flo oding season, where harnes sing in the power of the flood to change from a distrcutve event to a productive event.
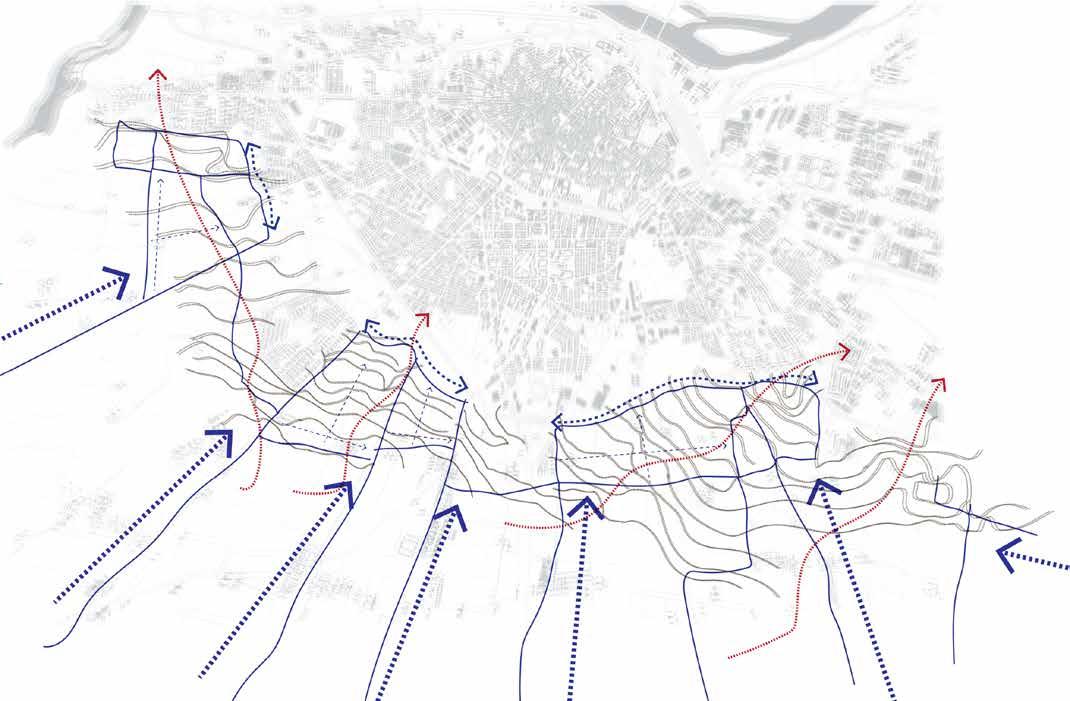
The conceptual mapping of the water pathway allowed us to understand the relocation of new activities and of new in teraction with nature. We ob served the changes from dry season to the flooding events to make sure the new spaves can take in the water capaci ty. By observing the levels, we have identifed the location of the reservoir that will take the excess water and store it in the underground network, where by gravity and solr panels will push the water up during the drought seasons.
Figure 60
Water in Summer
Figure 61
Water in with light rain
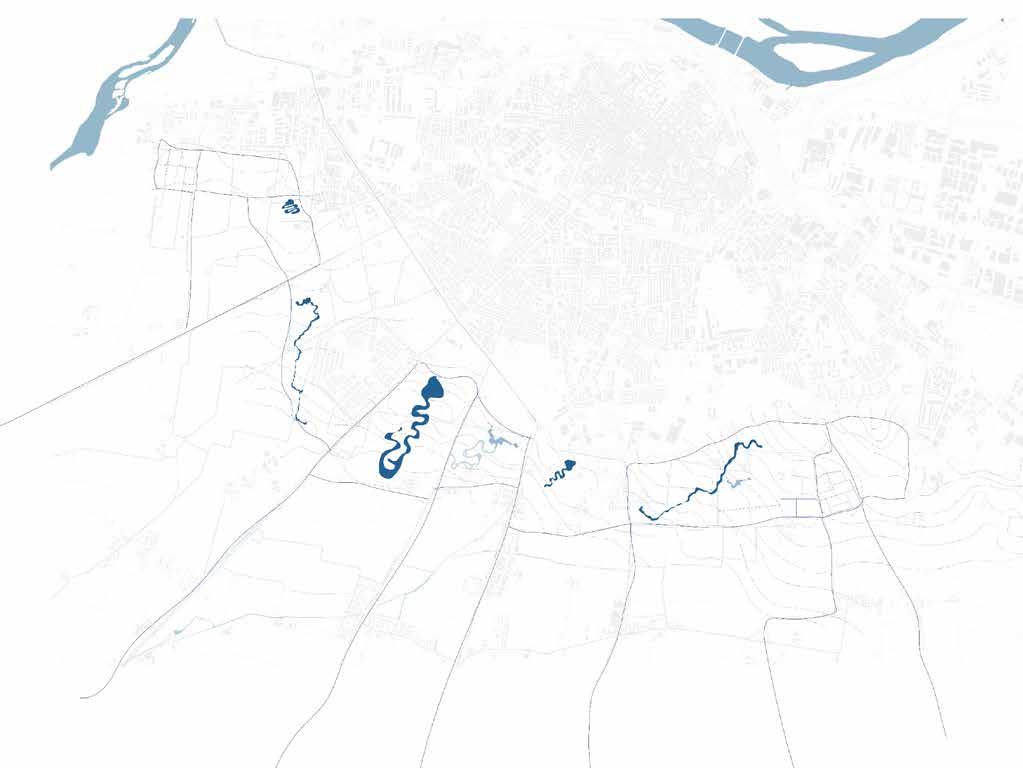
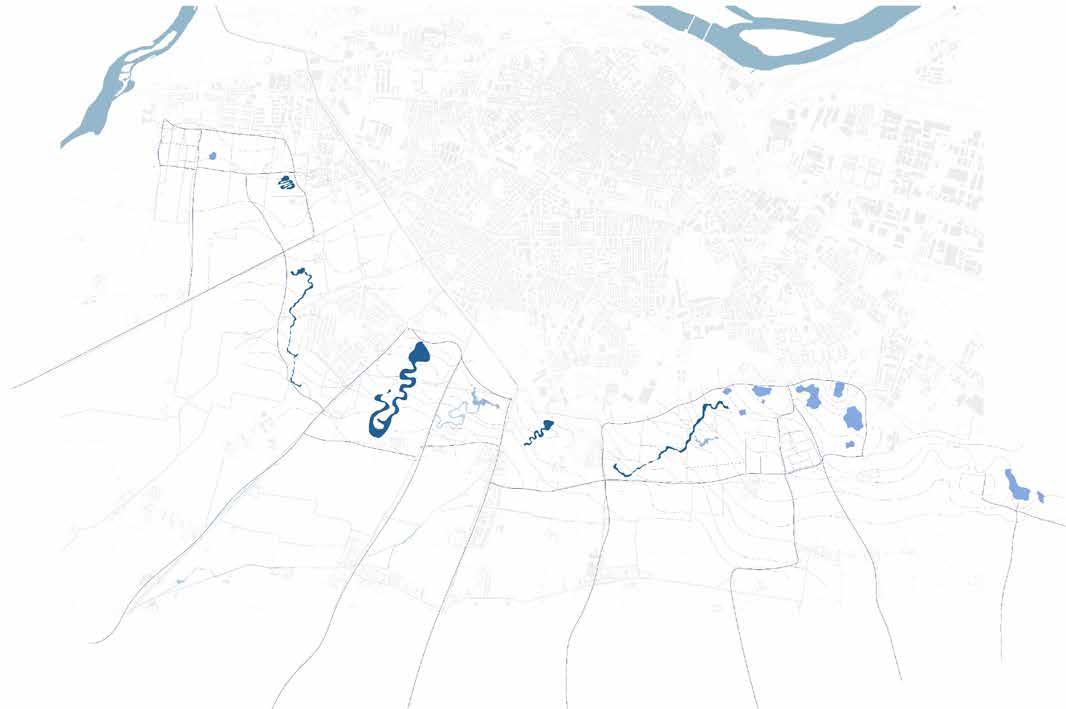
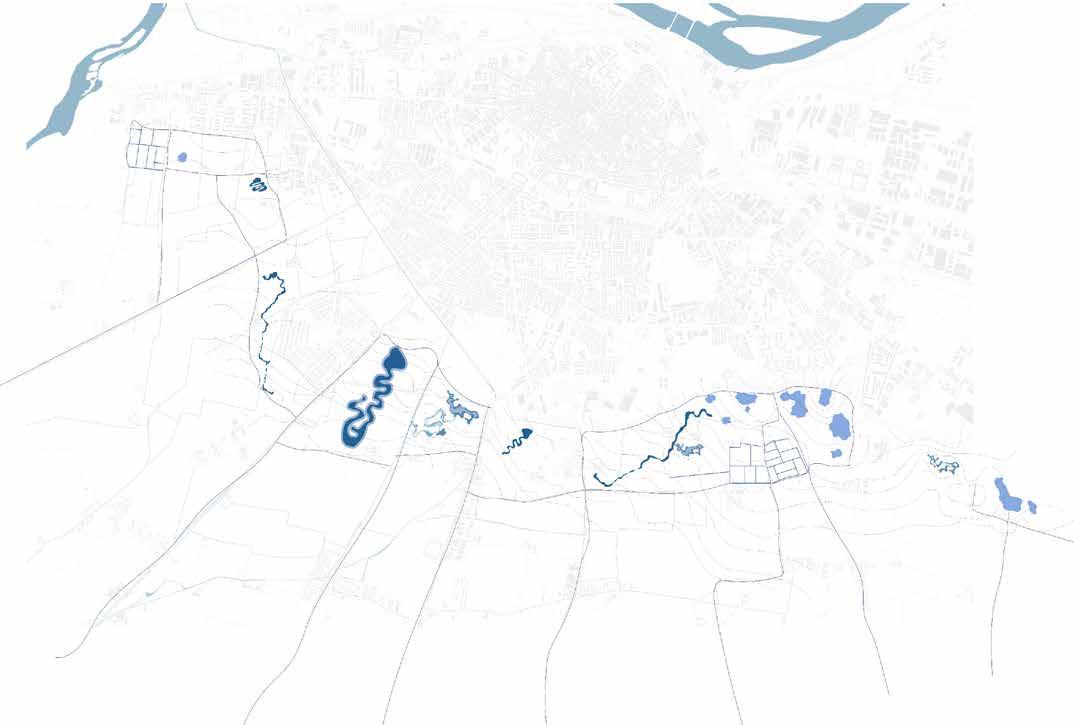
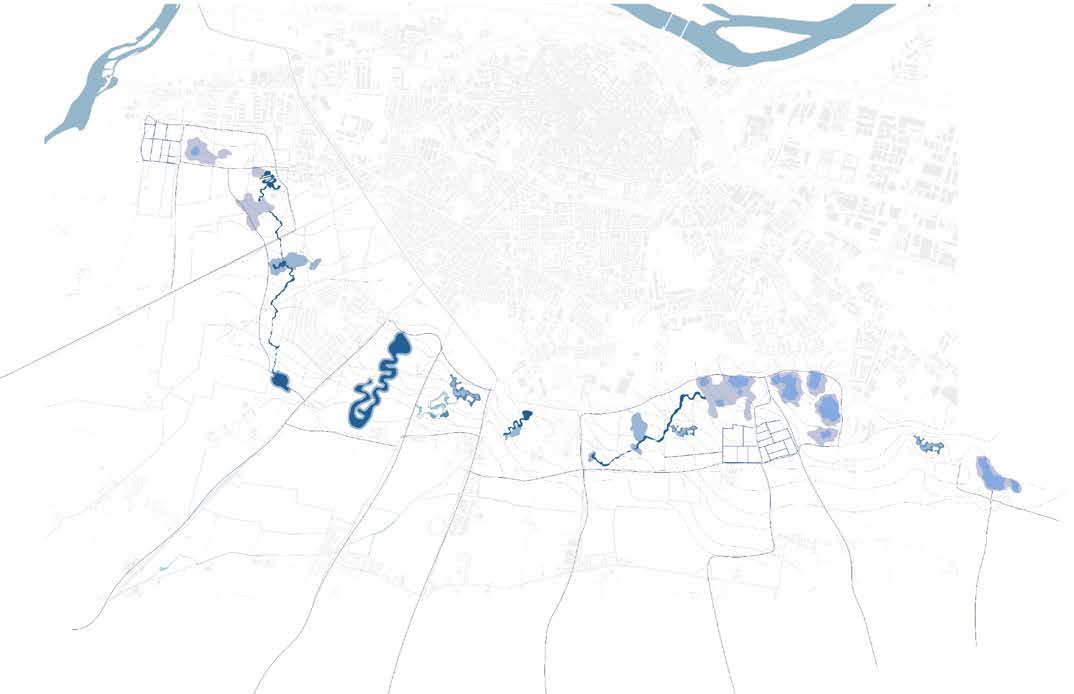
Figure 62
Water in with Heavy Rain
Figure 63
Water in with Floo ding - Low risk
We have established a ourfi ctaion system of the water pa thway, where from the highest point of the site to the lowest levels the water passes throu gh different areas for the pur pose of purfication by the time it reaches the detention pond the water is clean and ready to be stored.
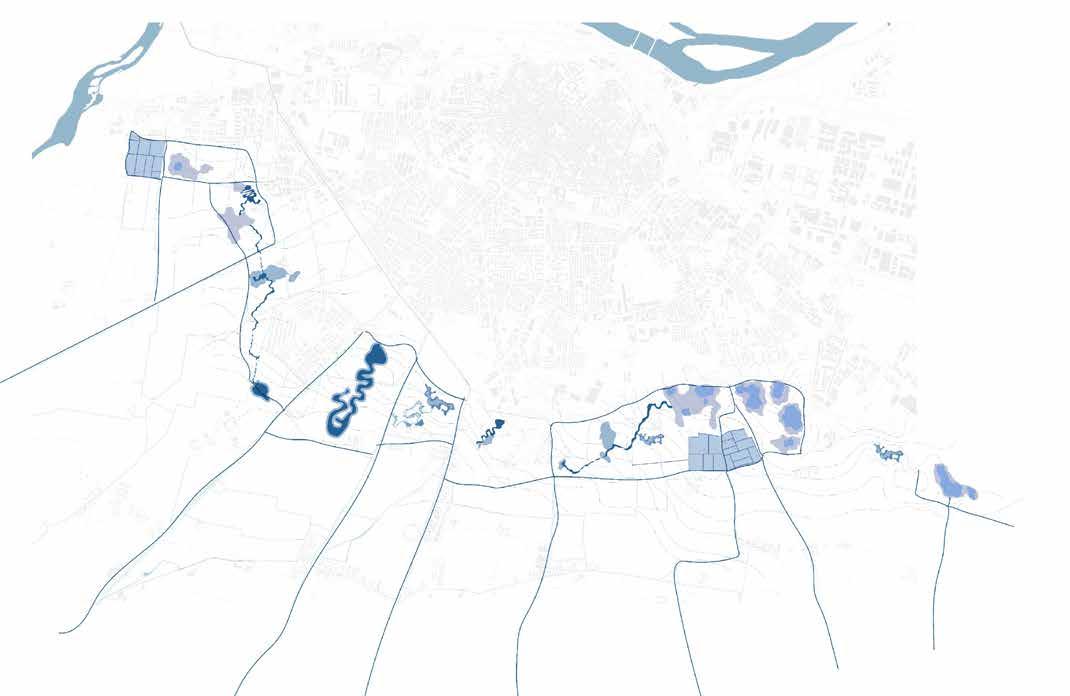 Figure 64
Water in with Floo ding - High risk
Figure 64
Water in with Floo ding - High risk
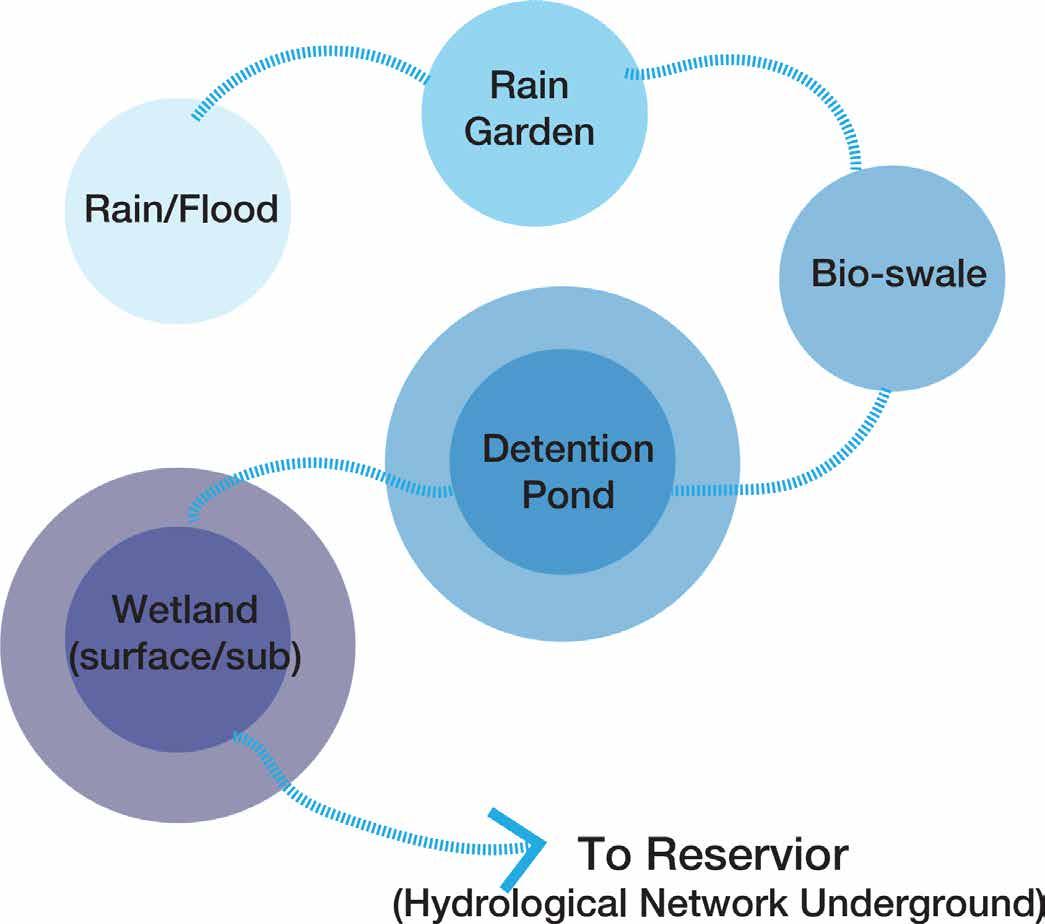 Figure 65
Water purfication system
Figure 65
Water purfication system
Addressing existing degraded environmental conditions by introducing treatment wet lands and reorganizing a hi storic canal network that will allow residents and visitors to directly engage with the water. This spaces is going to be the recreational spaces that will exhibt the prufication process by taking advantage of the natural tpopgraphy.
The Diagrams show the sche me to take in the excess flood water into the land by using the canal, exisiting and negle gted to ractivate the defense system where these spaces get flooded and become producti ve. We put into considiration the street netwrok and hwo it can intgrate the the water har vesting system and be a uni fied netwrok that can expand to the city center in the future.
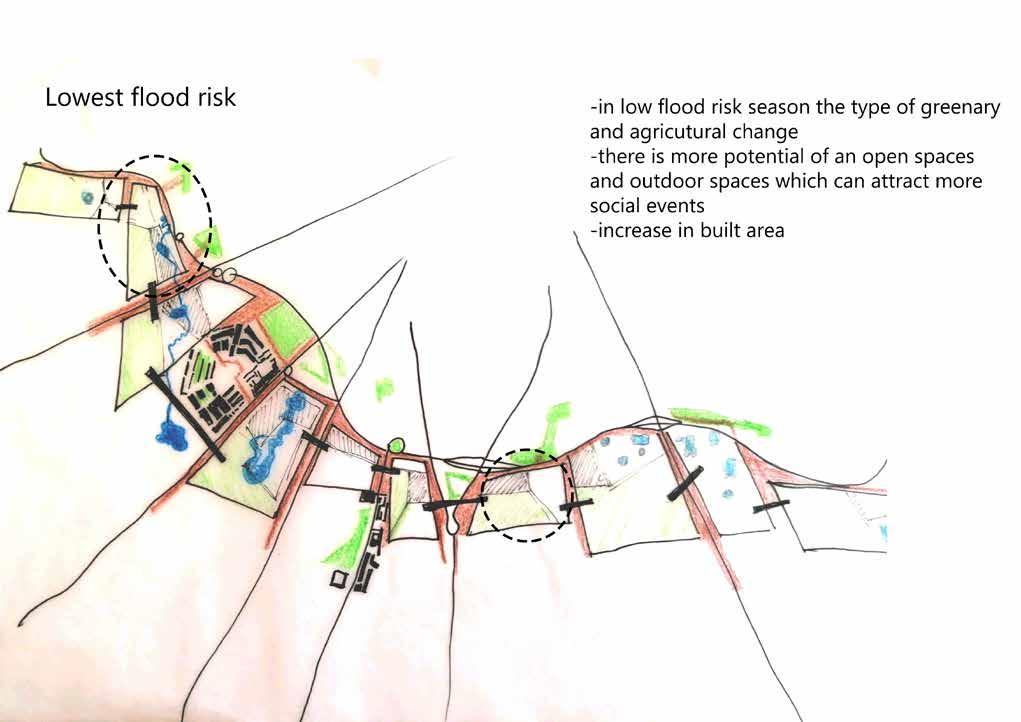
The diagram on the left elabo rates the location of each crop, and the spaces left unused were tranformed into recria tional spaces that are used ac cording the season in order to create an attractive landscape.
the diagram on the right is after we reoragnized the spa ces and added access pa thways reconfidured the natu ral wetlands into water basins. Every land has its own basin to collect the water and to irri gate the land and save its own water.
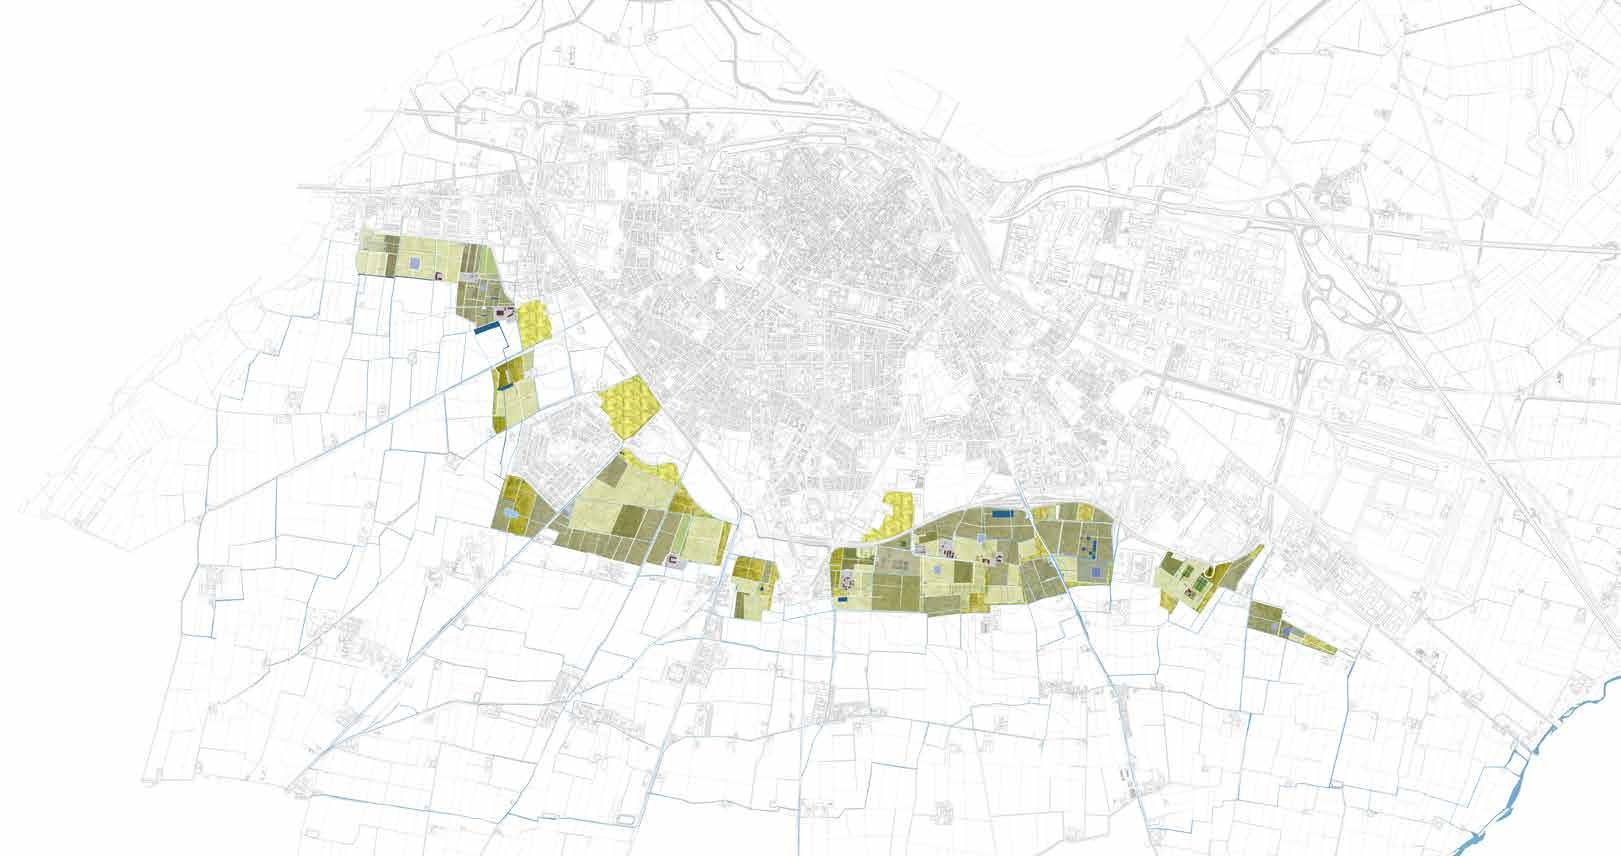 Figure 66 Diagram of crop division before the intervention
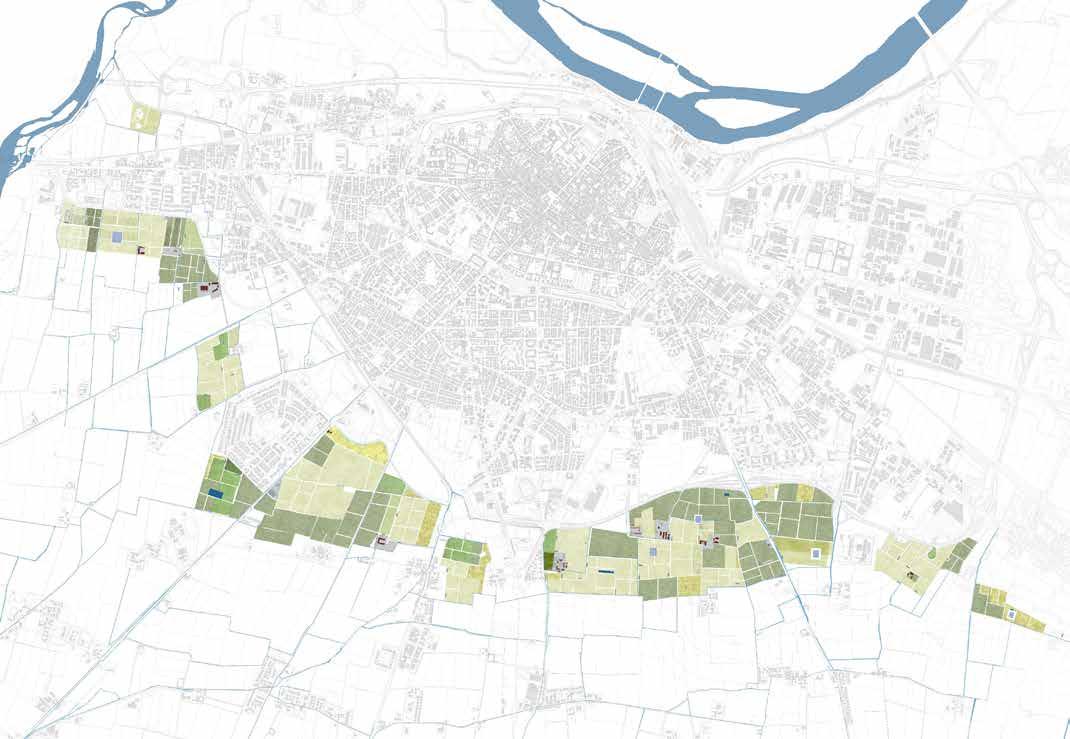 Figure 67
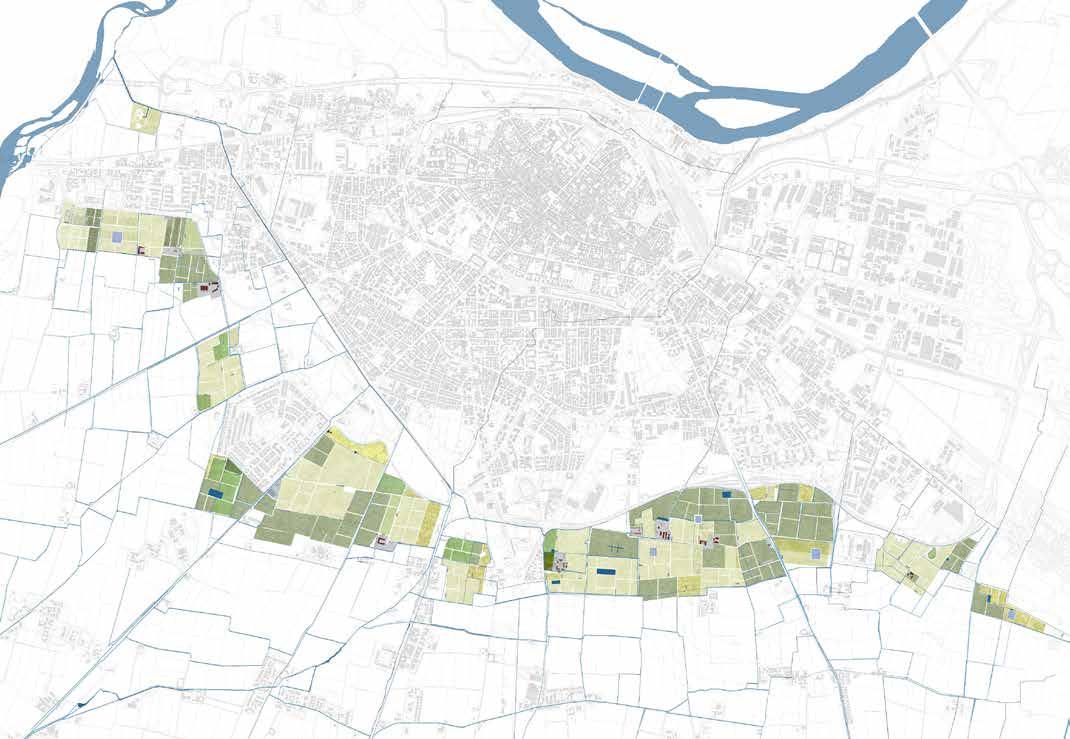
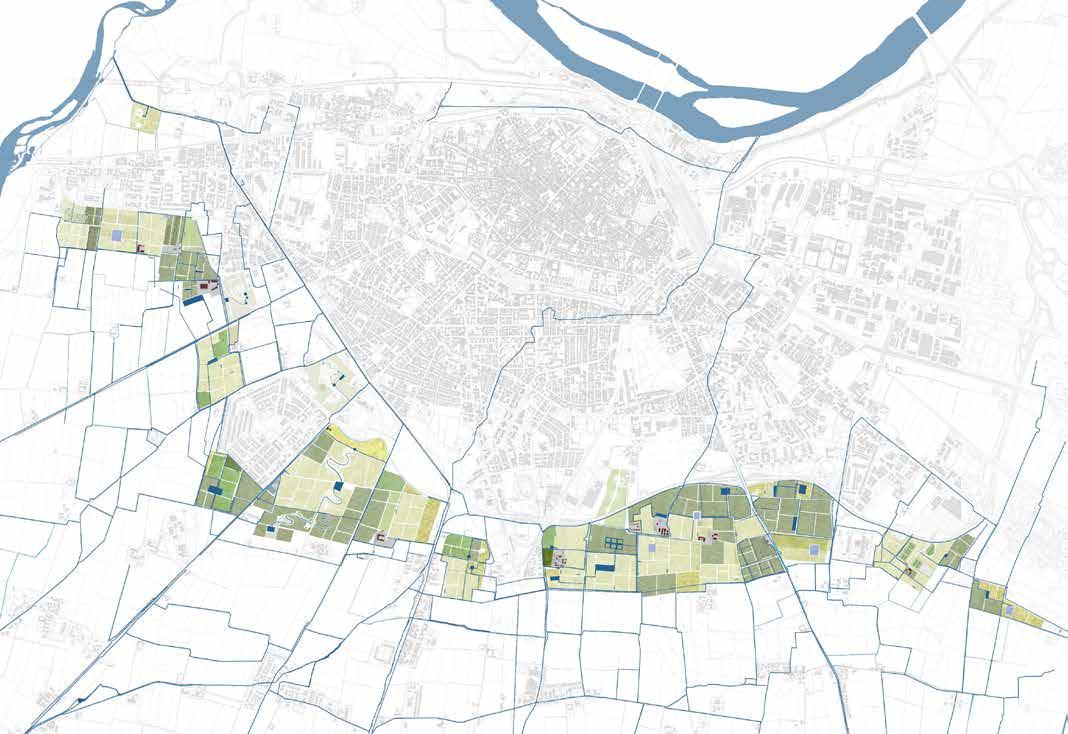
Figure 68
Canals during sum mer season
Figure 69
Canals during the flood season
Figure 70
New Canals layout
Figure 71
Flood Defense Sy stem
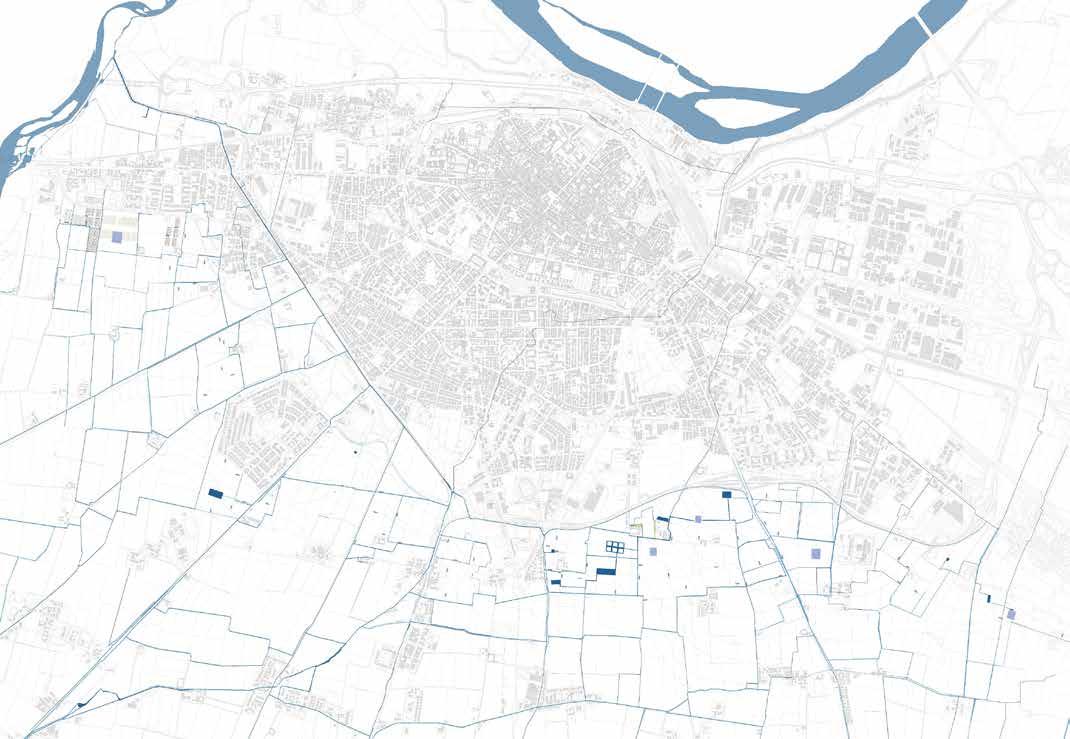
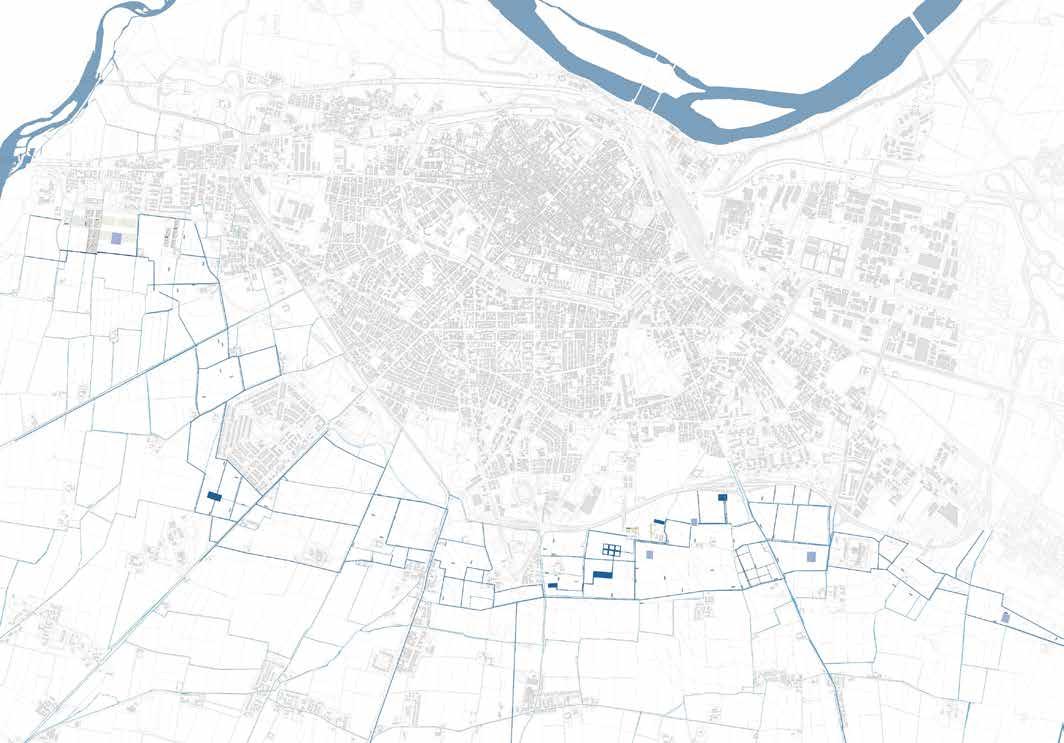
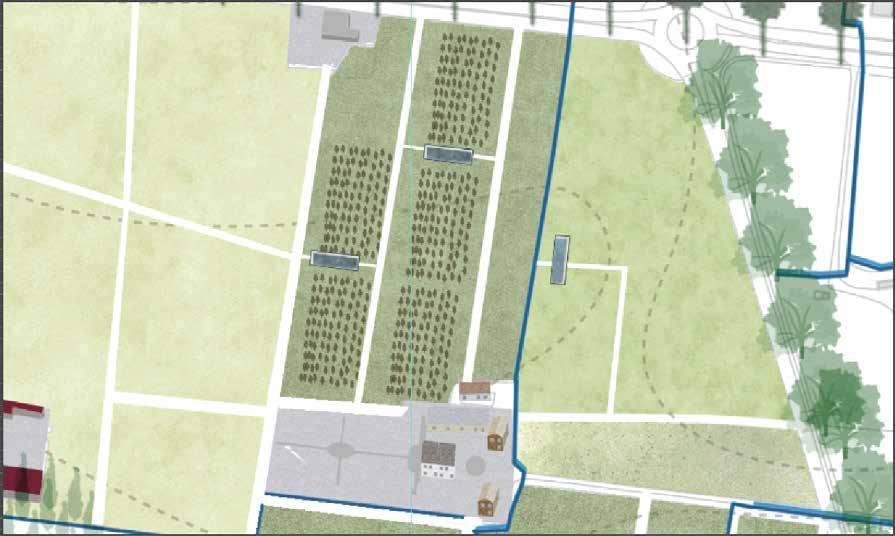
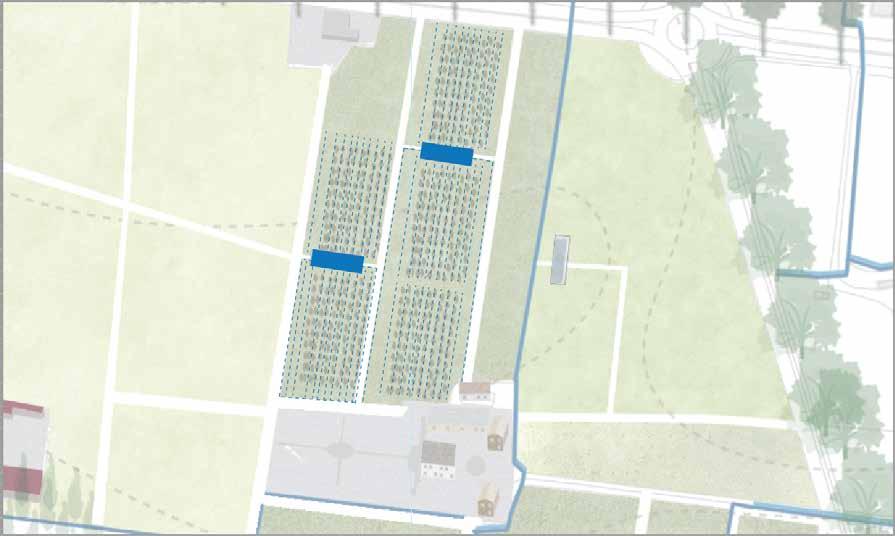 Figure 72
Drip Irrigation Sy stem
Figure 72
Drip Irrigation Sy stem
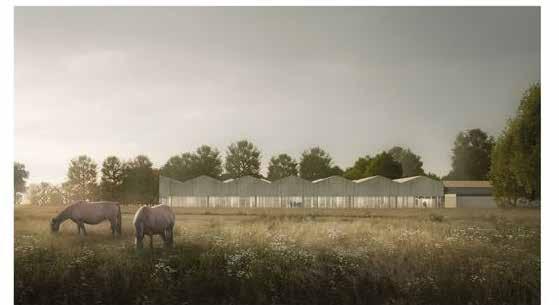
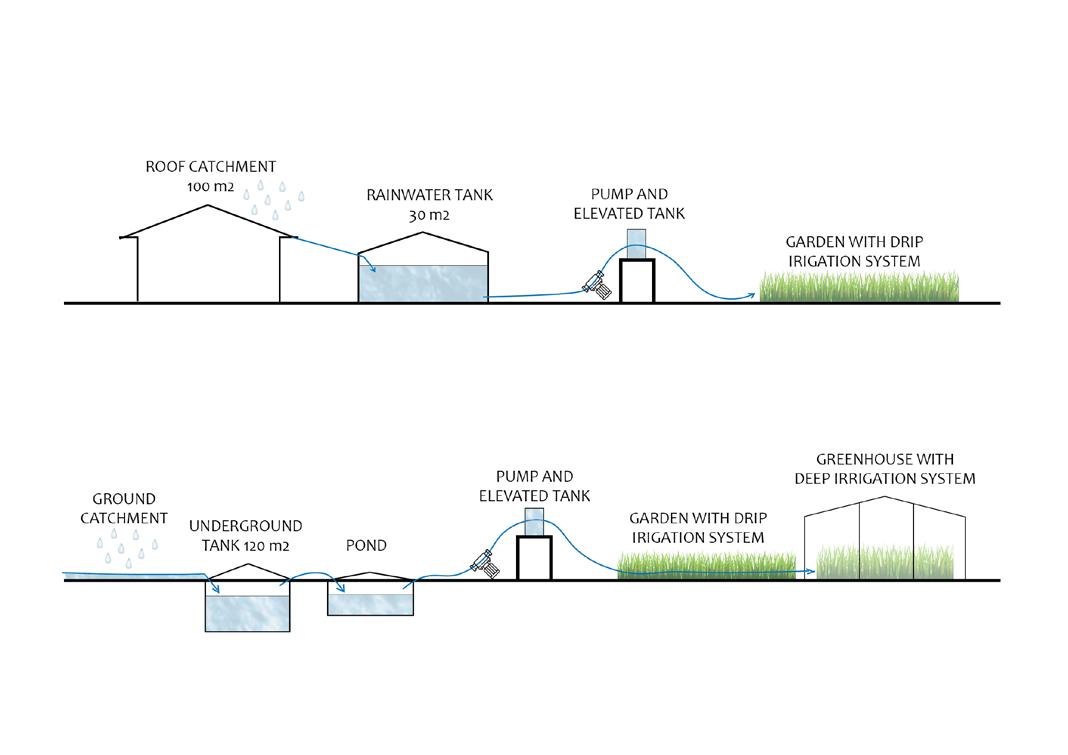 Figure 73 Water Harvesting System
 Figure
View of the master plan
Figure
View of the master plan
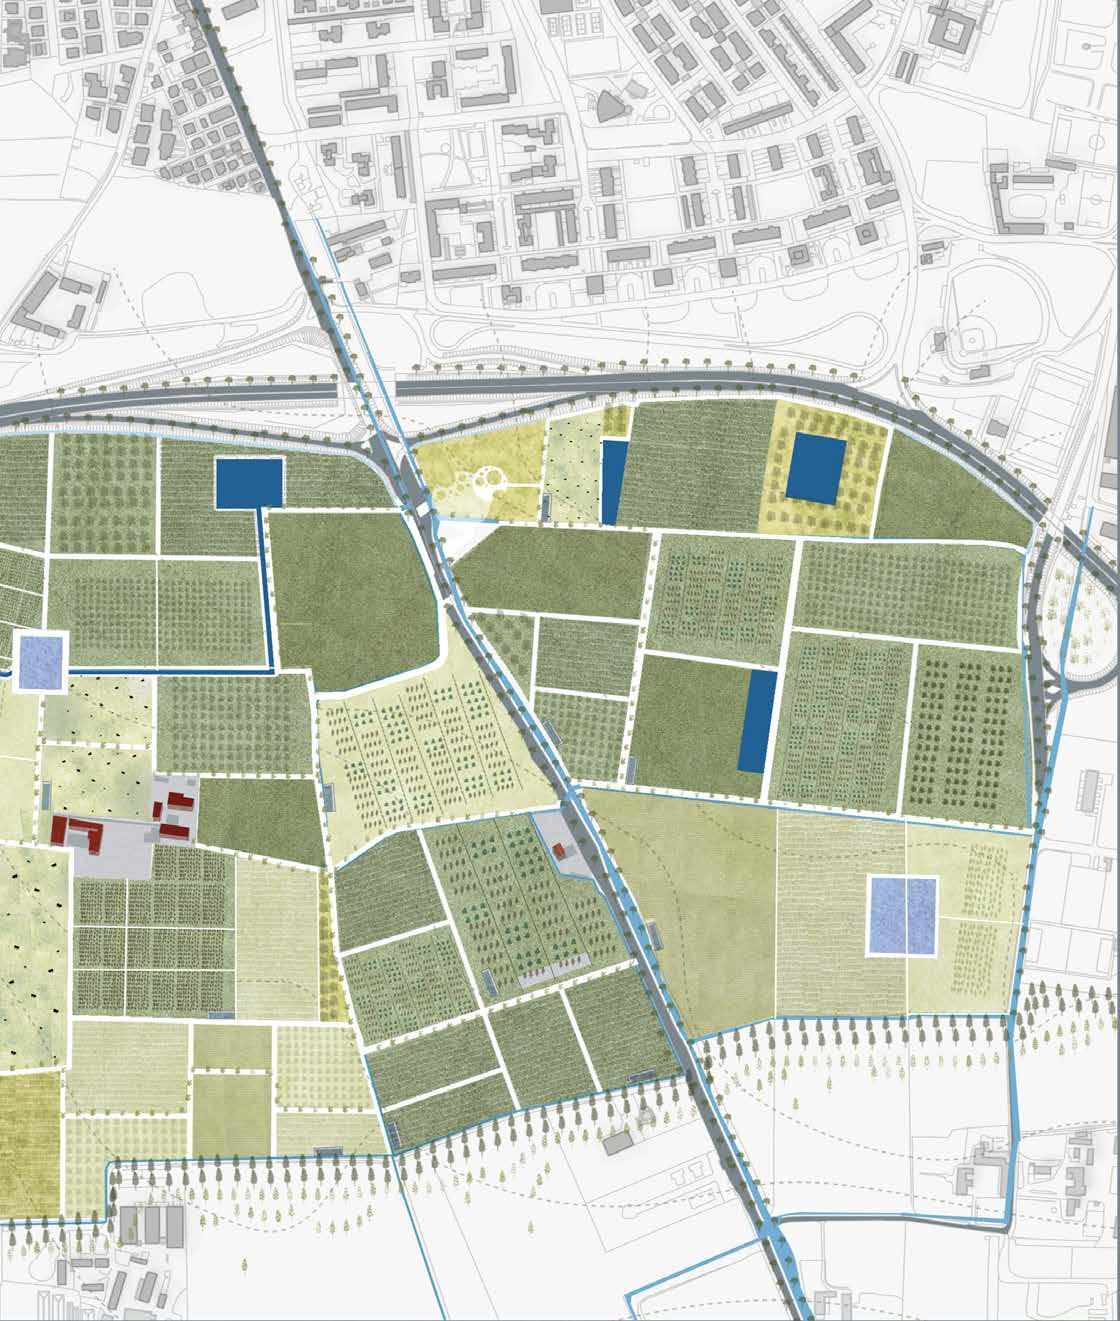
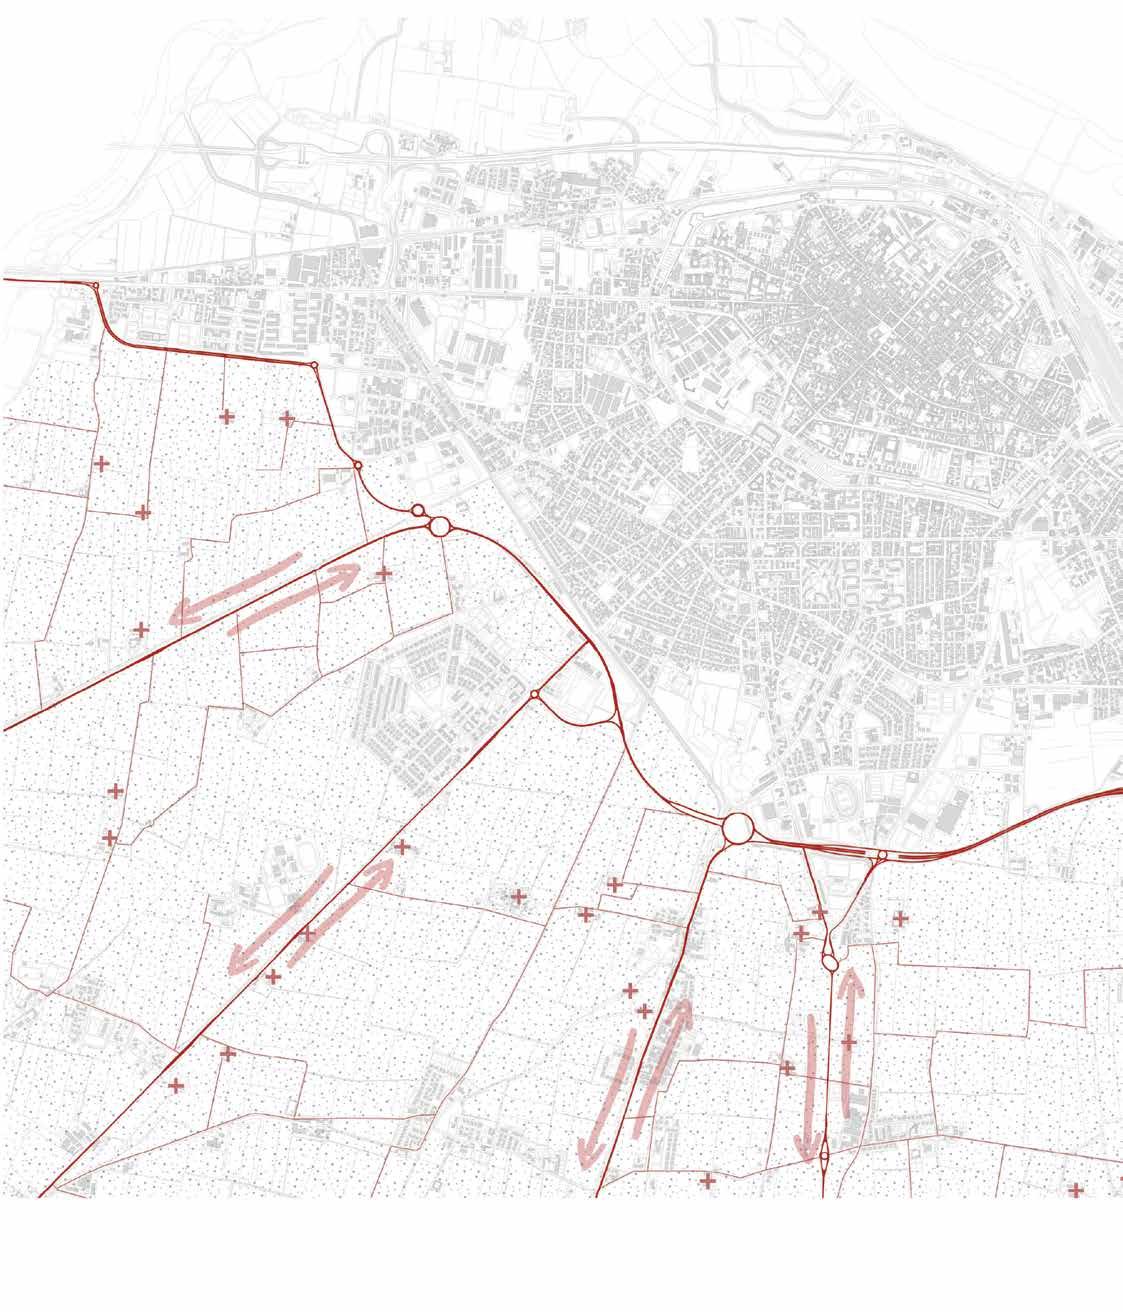
Figure 75
Map of the city dyna mics
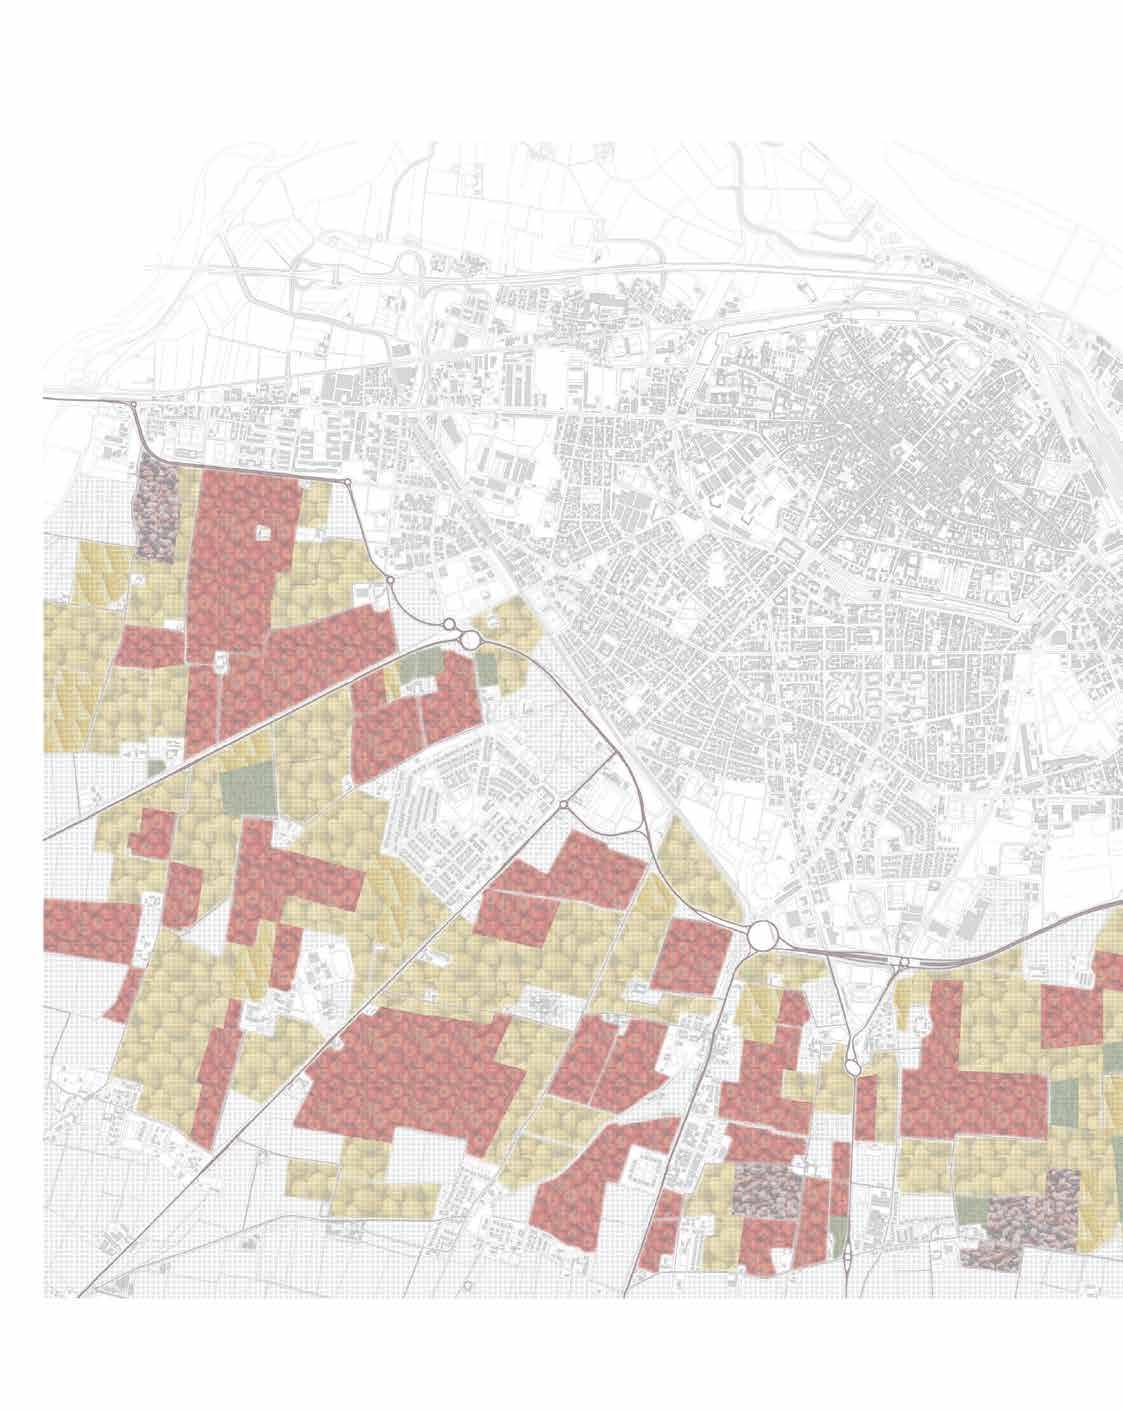
Figure 76
Map of the seasonal crops
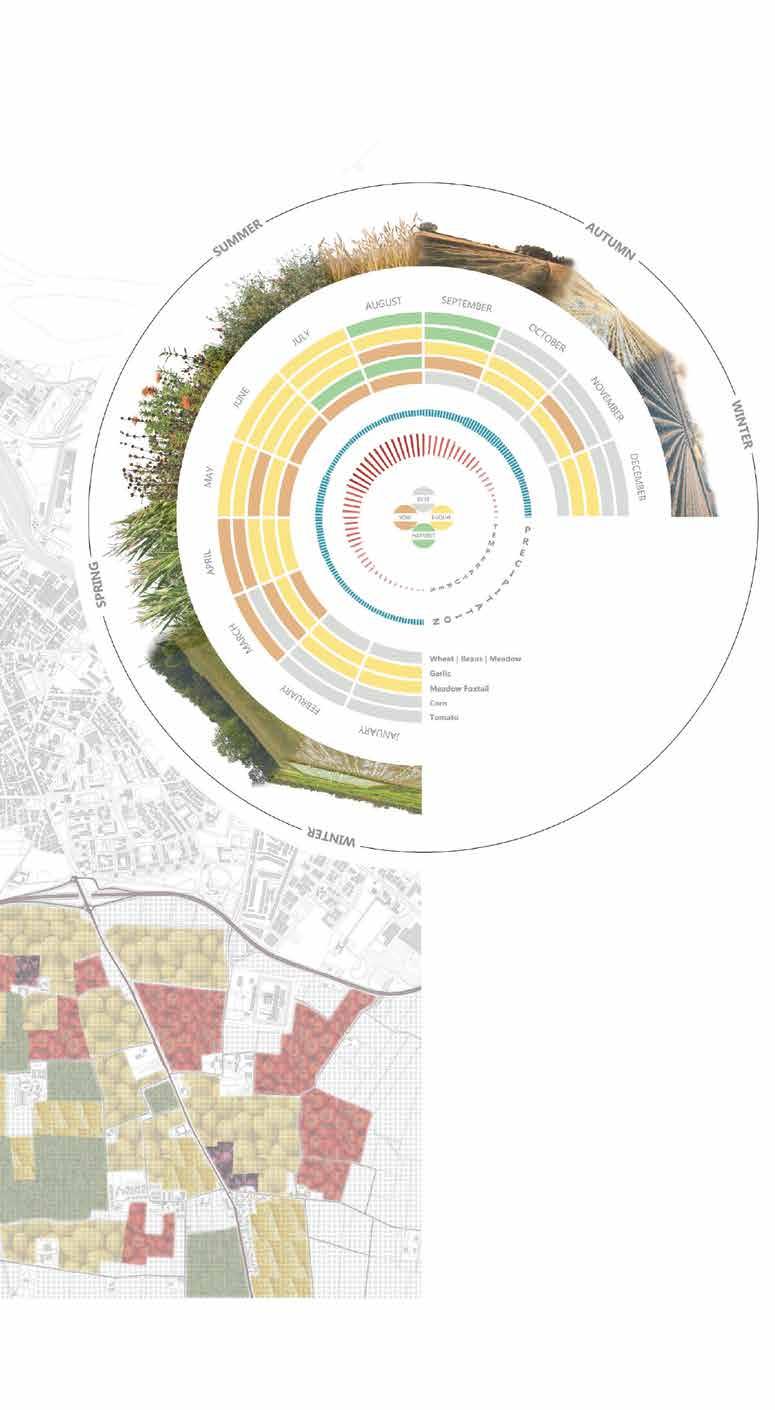
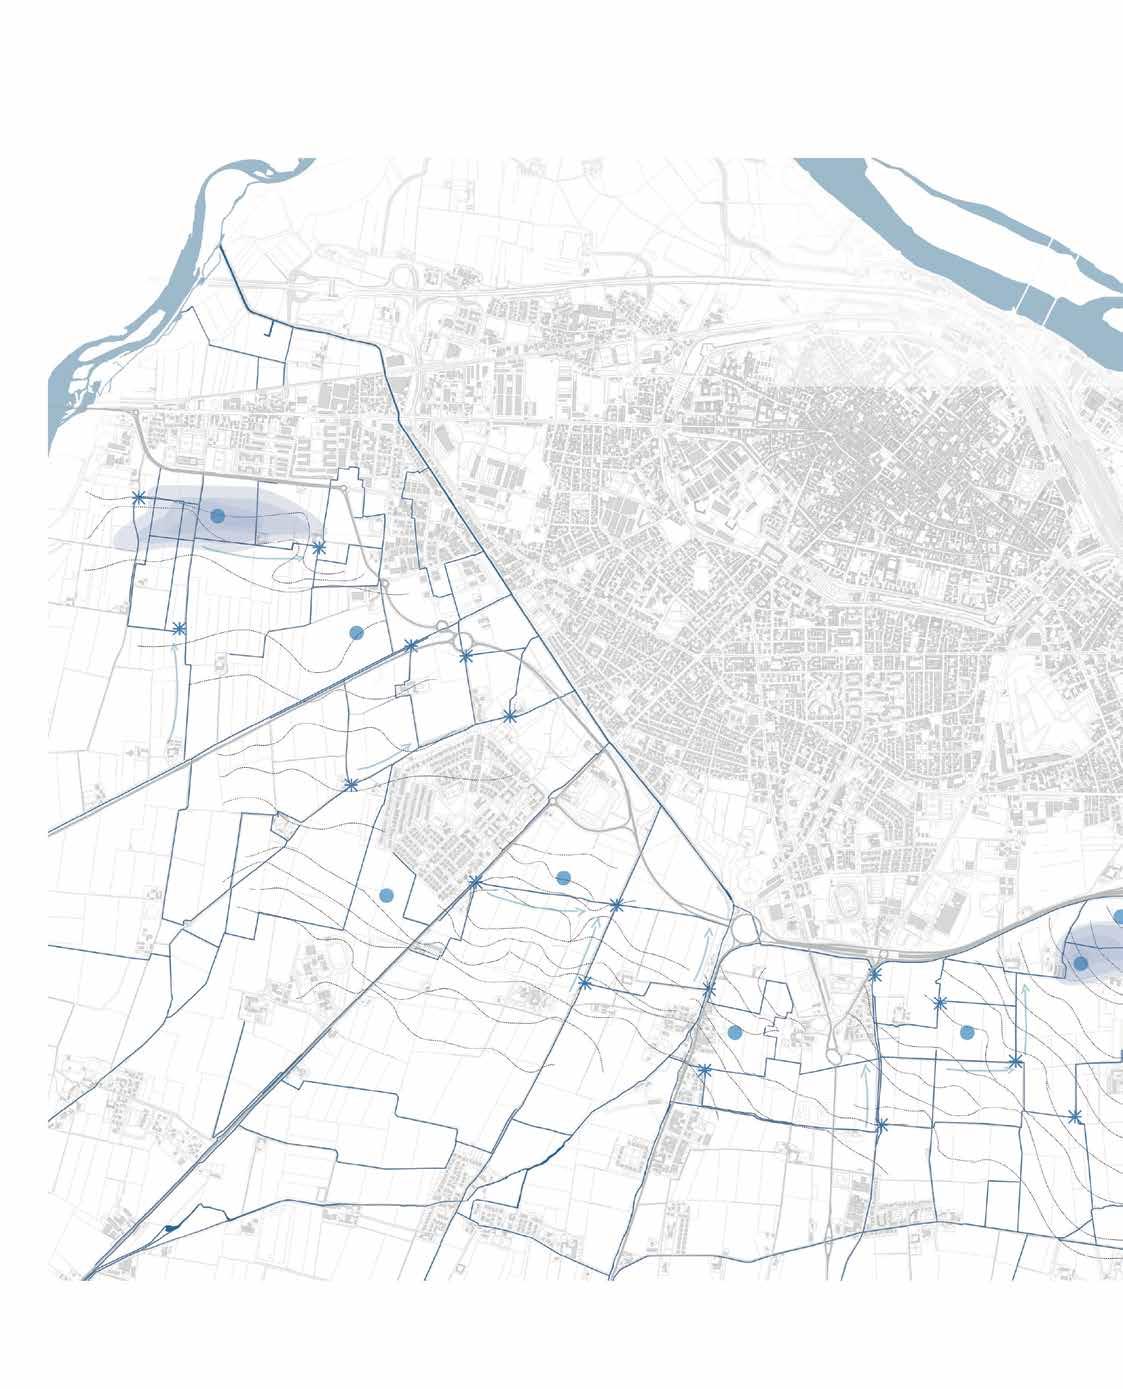
Figure 77
Map of the Water sy stem and connection
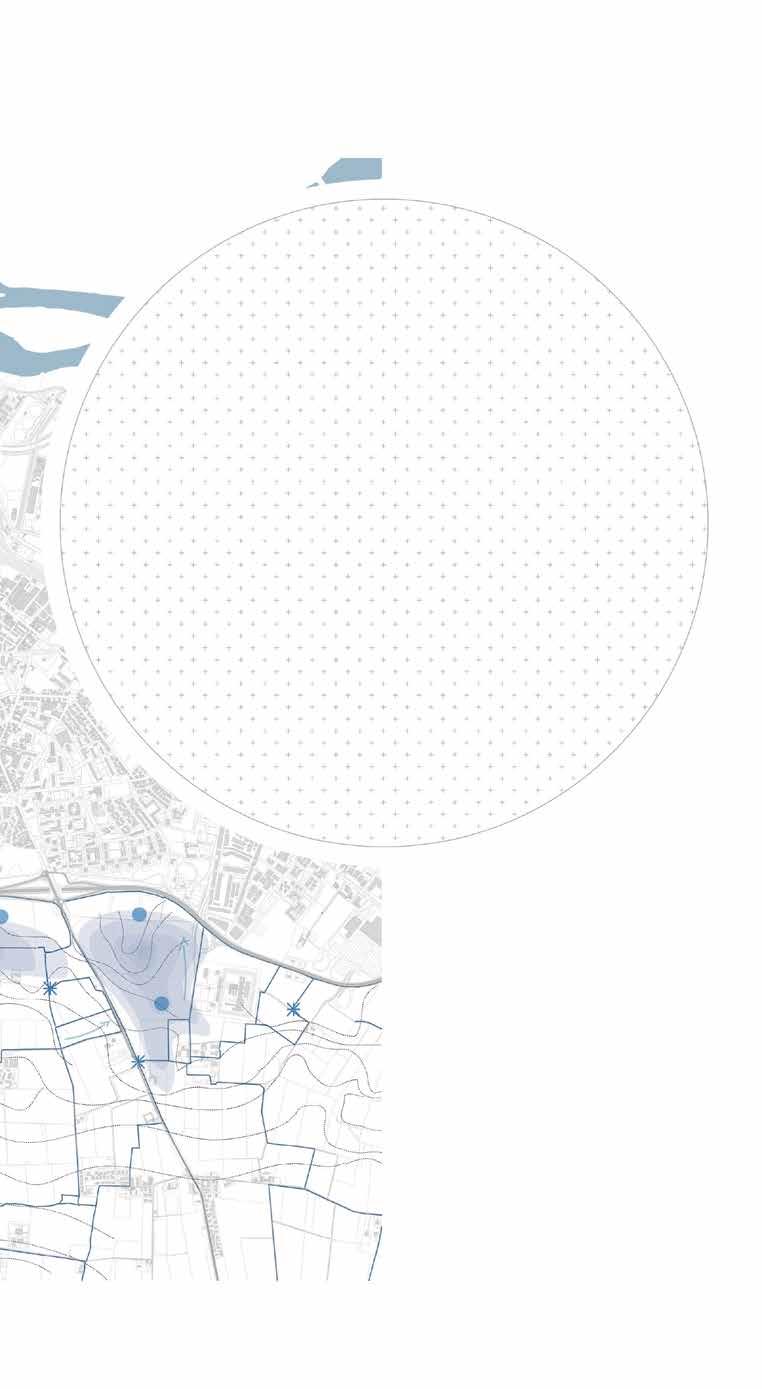
Figure 78
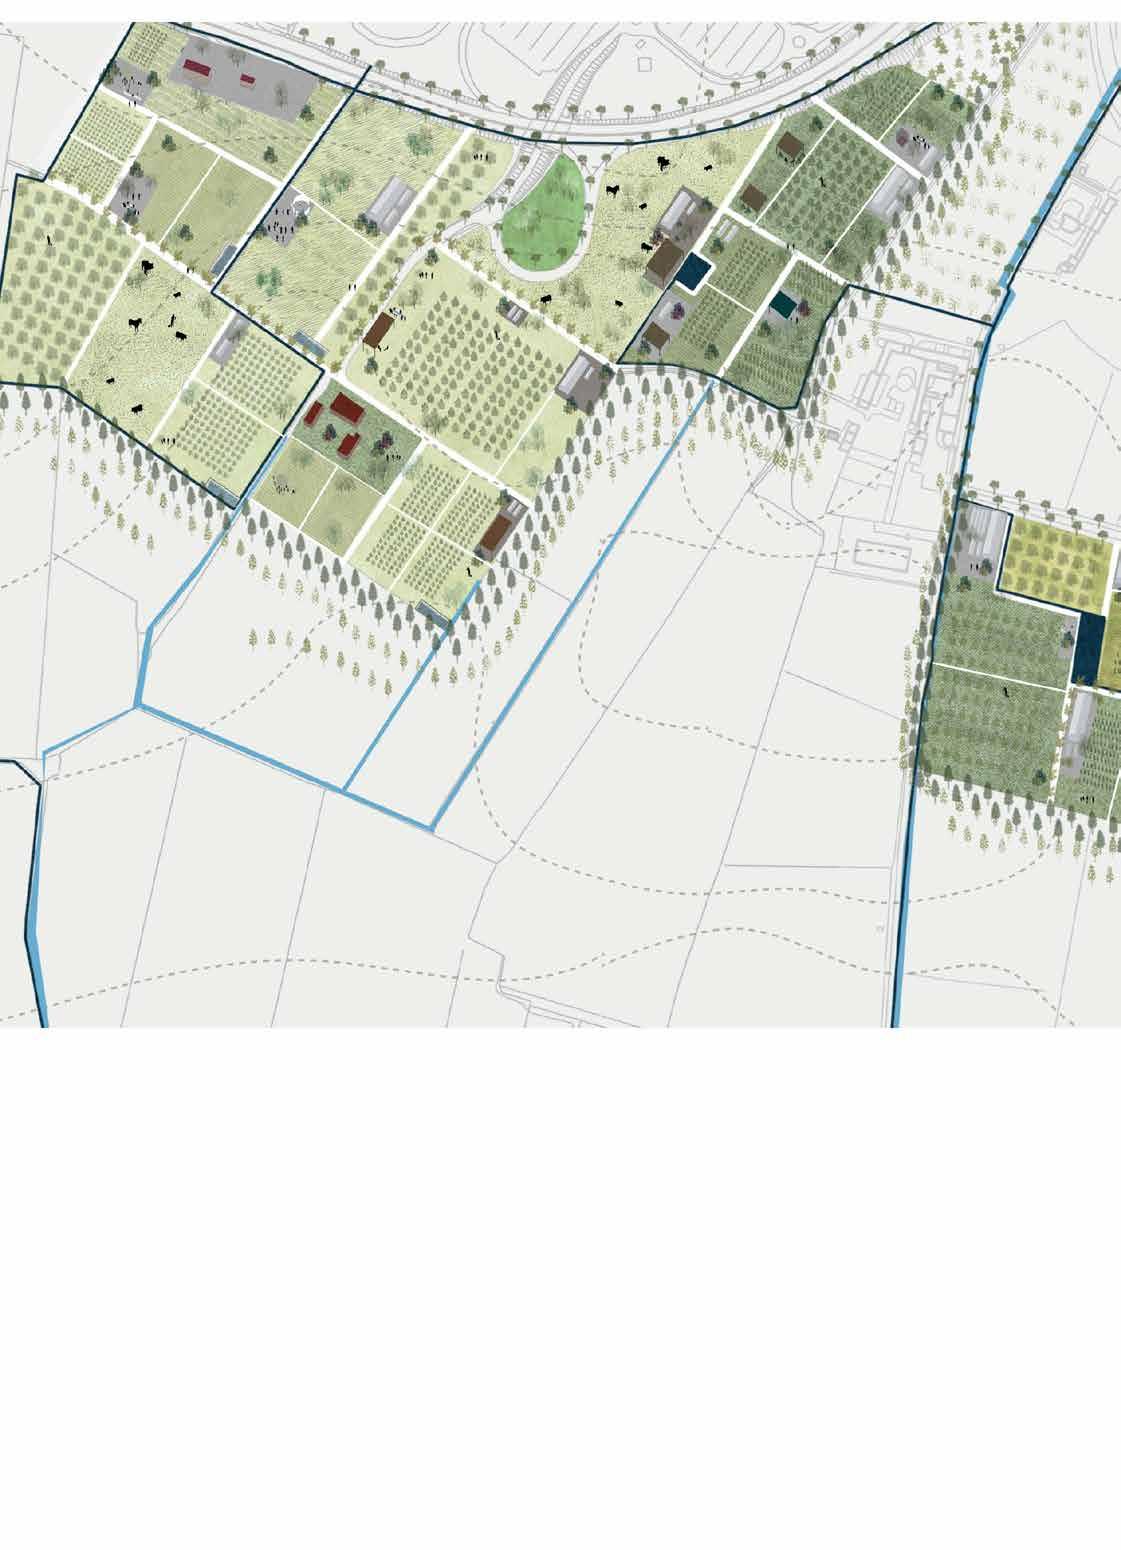
Suggested spaces by the intervention
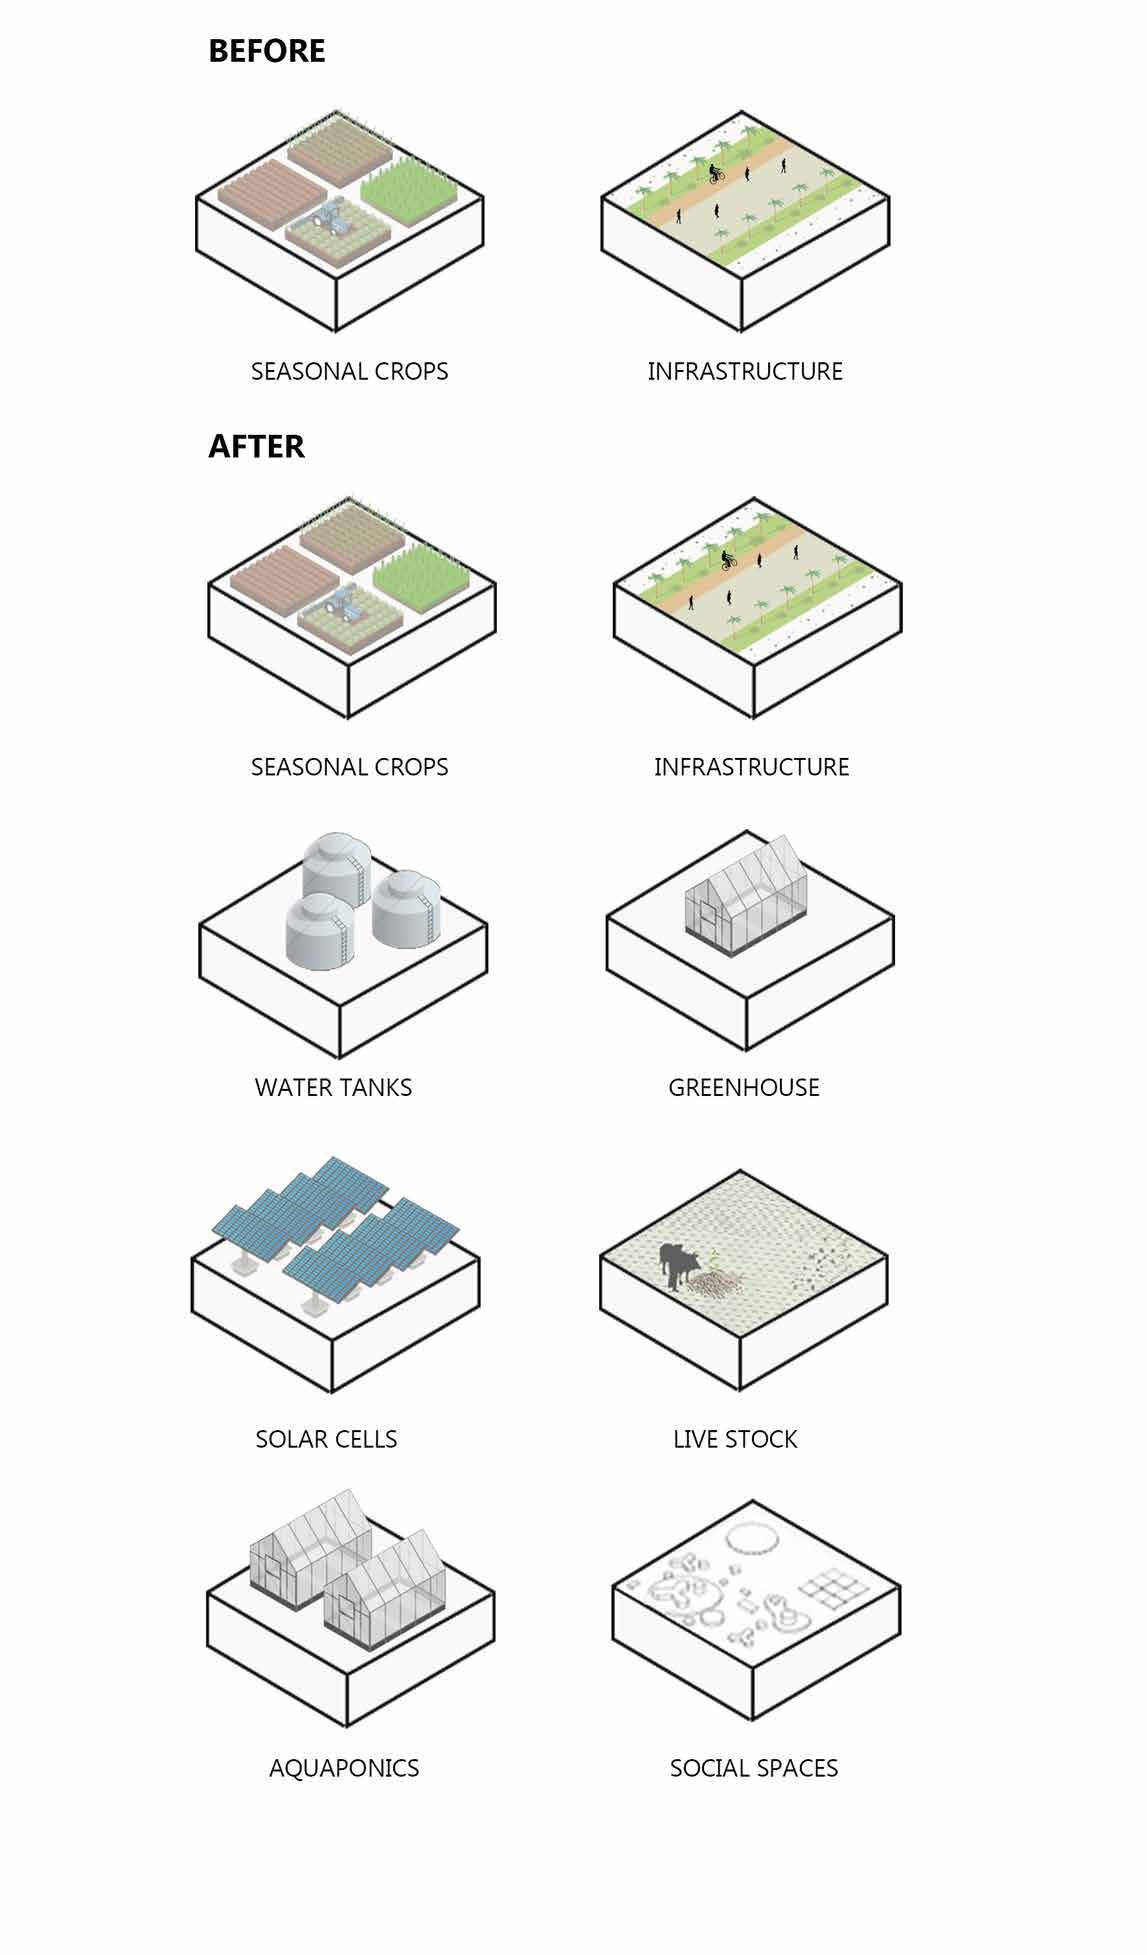
and Aquaponics addition
In order to insure that the project is intgrated with the community and is taking ad vantage of the surrounding resources, we have proposed a scheme that insures sustai nability within the agricultural community.
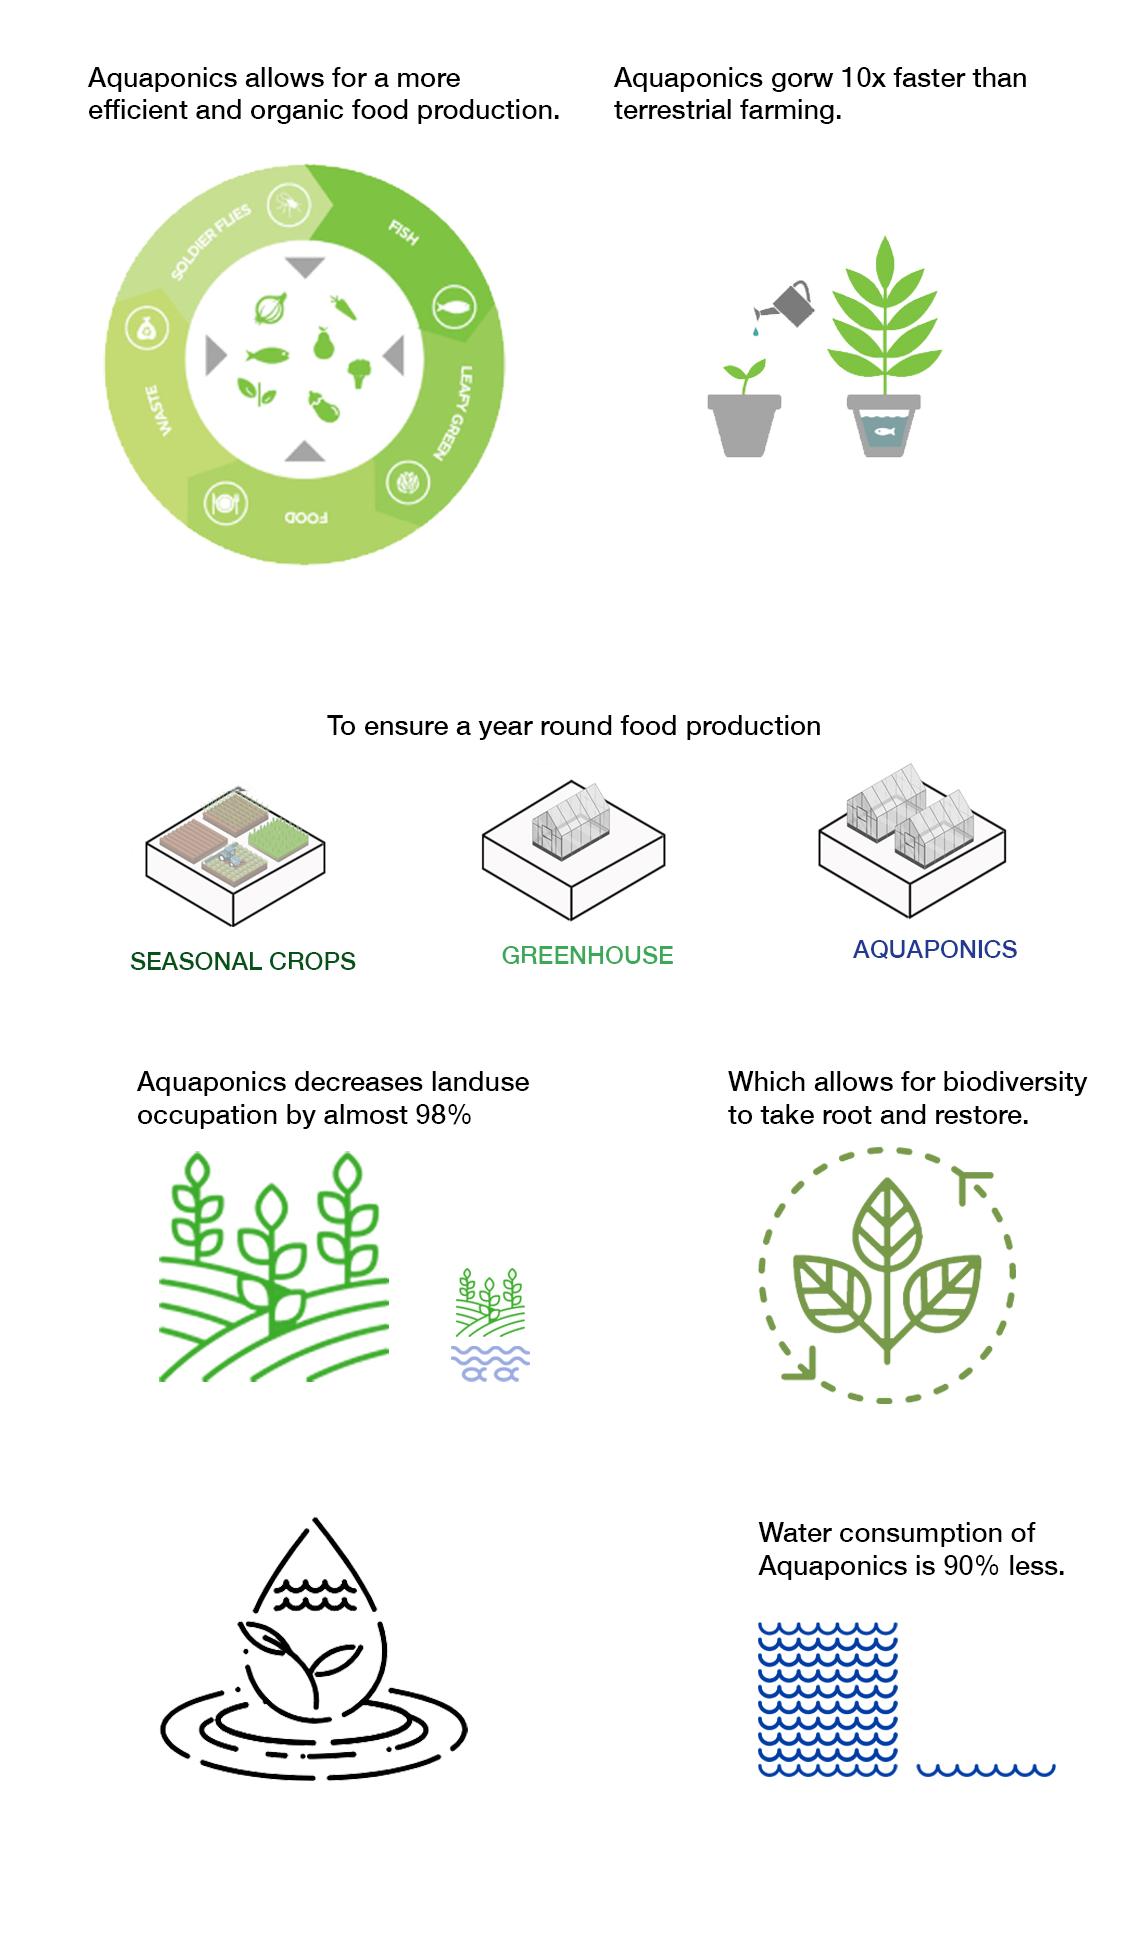
They system proposed using aquaponics and greenhouses along with the addition of li vestock in the lands as a way to insure all year productivity. The scheme includes the tou rist, the farmer and the stu dent ( of all ages).
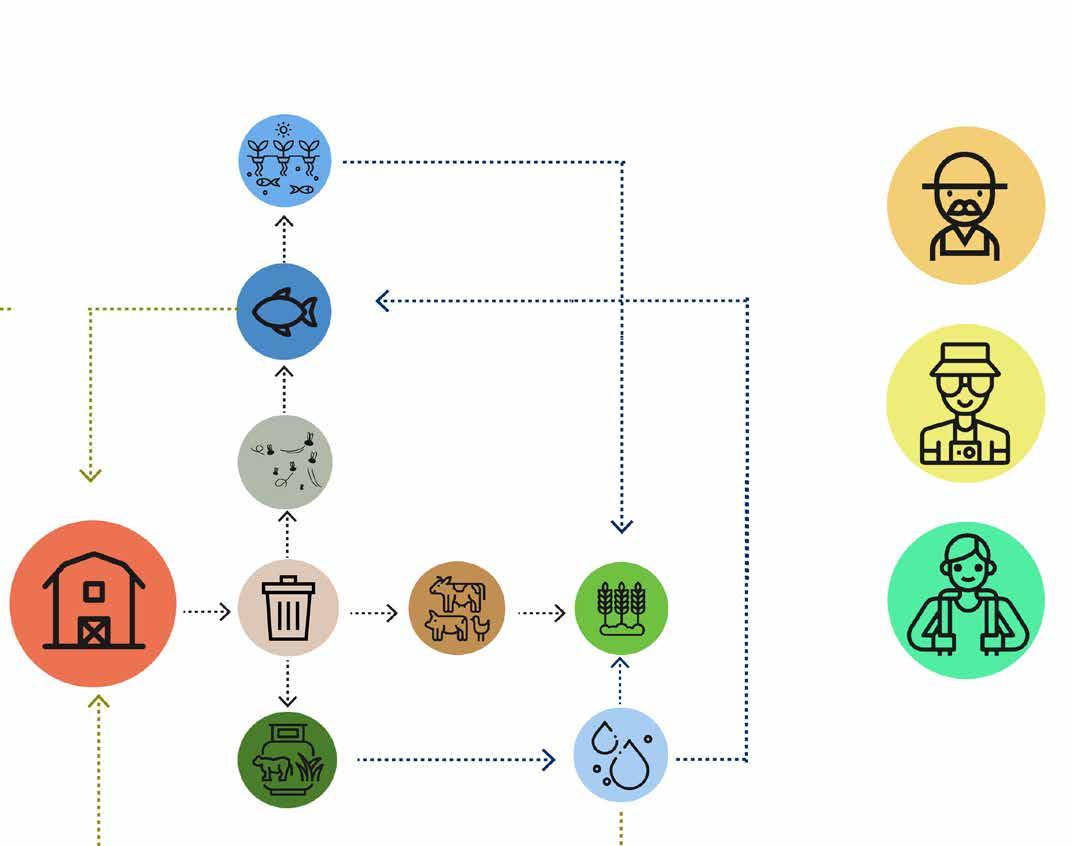
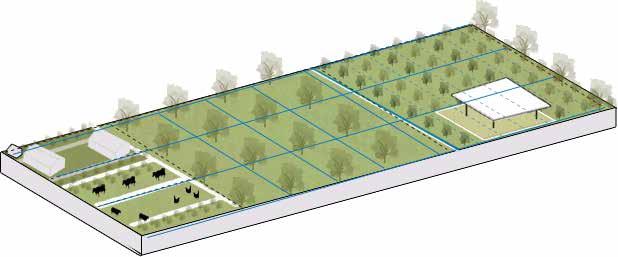
Figure 80 Diagram of circular economyFigure 81

Demonstration of the circular economy on one land


 FLIES FROM WASTE FOR FISH TO FEED
FARMHOUSE
SOCIAL SPACEADDED PARCEL
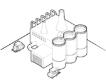
WATER TANK
AQUAPONICS
LIVESTOCK
FISH POND
SEASONAL CROPS
WASTE
BIO-MASS & BIO-GAS PROCESSING
ACTIVATED IRRIGATION CANALS
FLIES FROM WASTE FOR FISH TO FEED
FARMHOUSE
SOCIAL SPACEADDED PARCEL
WATER TANK
AQUAPONICS
LIVESTOCK
FISH POND
SEASONAL CROPS
WASTE
BIO-MASS & BIO-GAS PROCESSING
ACTIVATED IRRIGATION CANALS

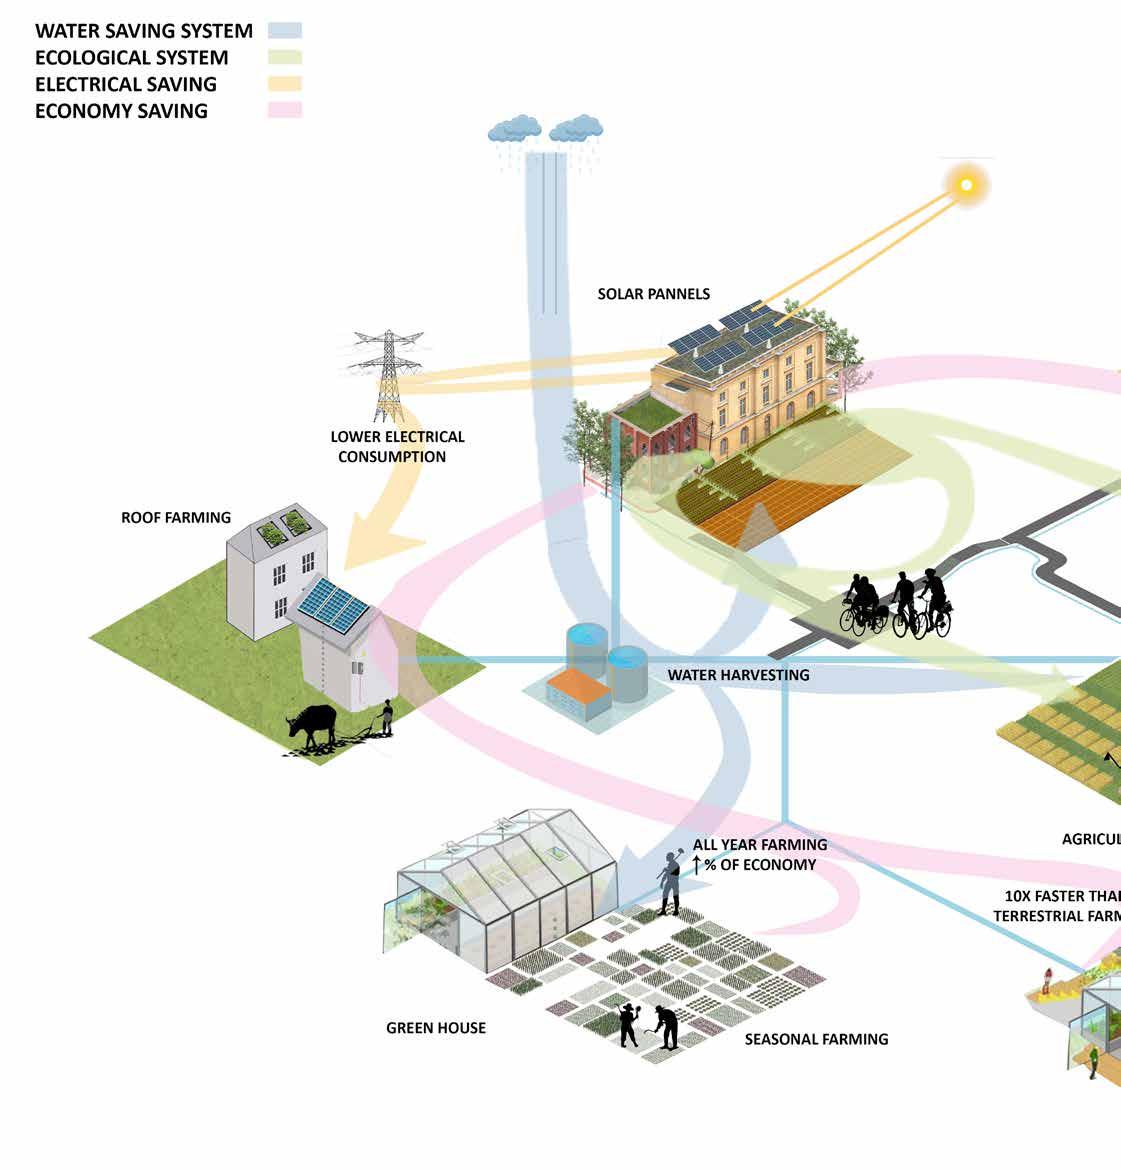

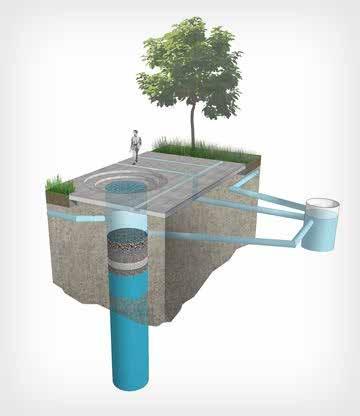
The project consists of systems that work together to form a better ecological living. This diagram Represents how the systems are connected. The Rainwater is harvested in whi ch the rain drops are collected and stored for the future use, rather than allowing them to run off. Underground channel exist to transport water from an aquifer or water well to surface for irrigation and drinking, acting as an under ground aqueduct. The water will feed the farmlands and all the green spaces as it is also connected to the river.
The solar panels work to pro duce Solar energy. The ener gy, the earth receives from the sun, primarily as visible light and other forms of electro magnetic radiation, as this will lead to lower electrical consu mption. Working with the Gre enhouse and the aquaponics, this increases the economical income as its faster to grow the plants. As also the community planting and the public servi ces provided will also increase the production and income
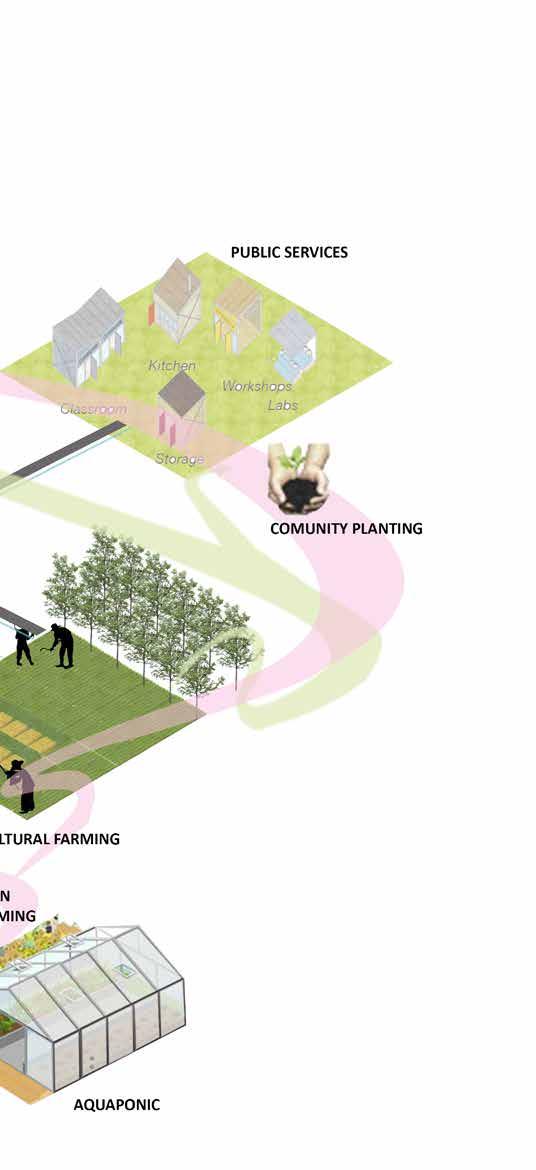 Figure 82 Diagram of Scheme
Scheme of no rain
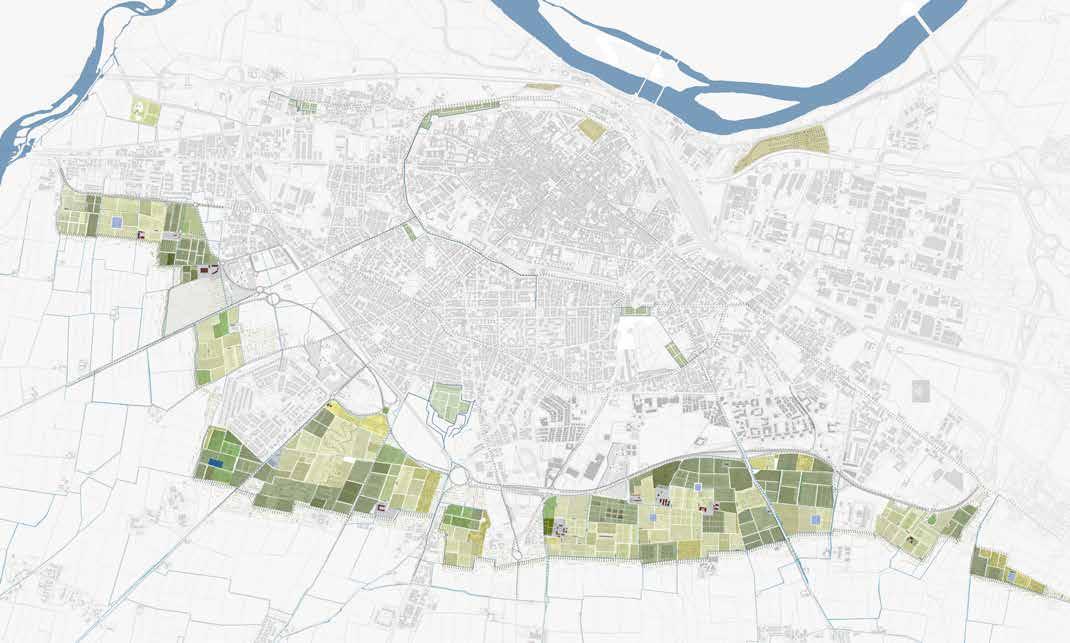
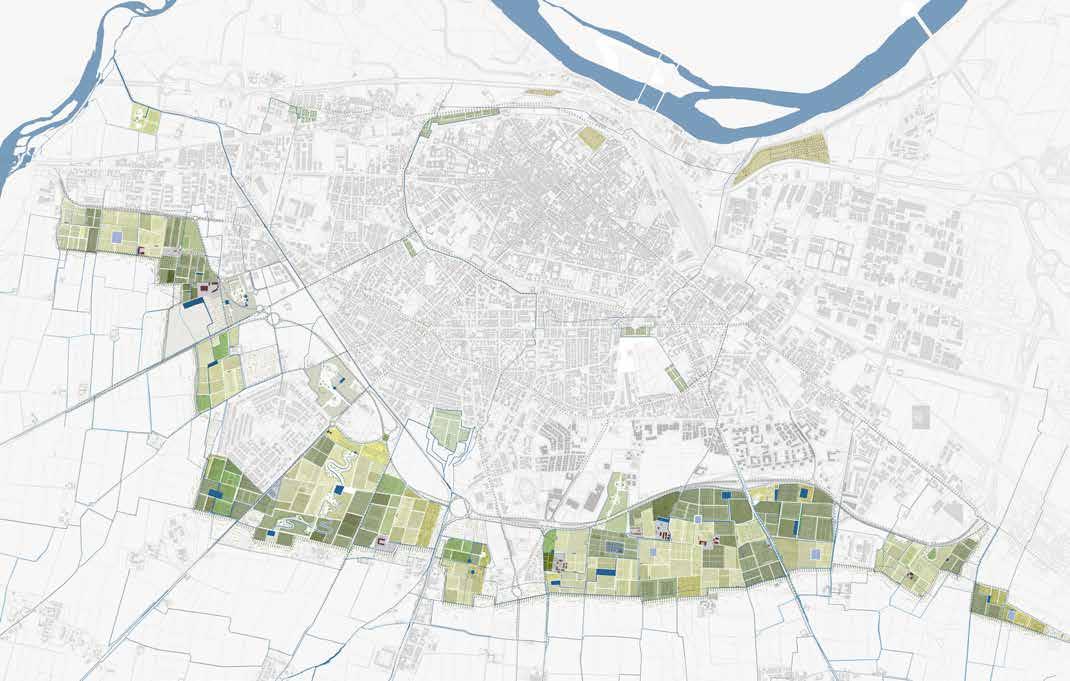
Figure 85
Scheme of light rain
Figure 84Figure 87
Scheme of High Risk Flood
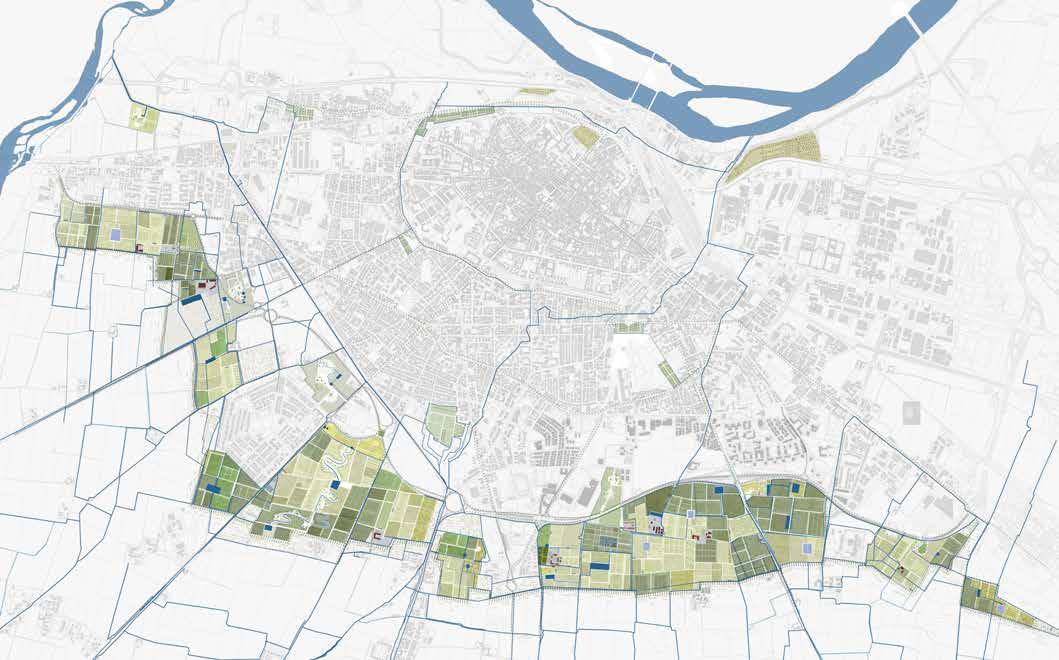
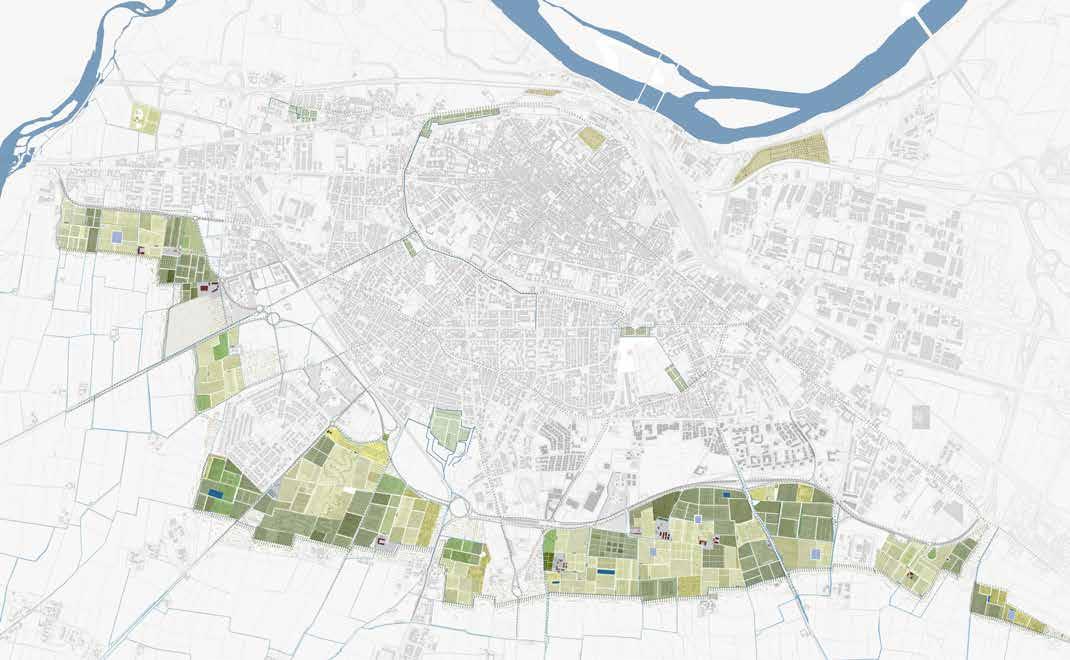 Figure 86
Scheme of Low Risk Flood
Figure 86
Scheme of Low Risk Flood
 Map of Flow System
The new system suggests that in order to attarct more users all year long the land could be supplied with infrastructu re that is for access, for space and for investment. The first is pathways that connect all spa ces together, then livestock for fertilizer and ecnomical pro duction, third is a space for so cial purposes and we have cre ated proposals of what kind of space to be there.
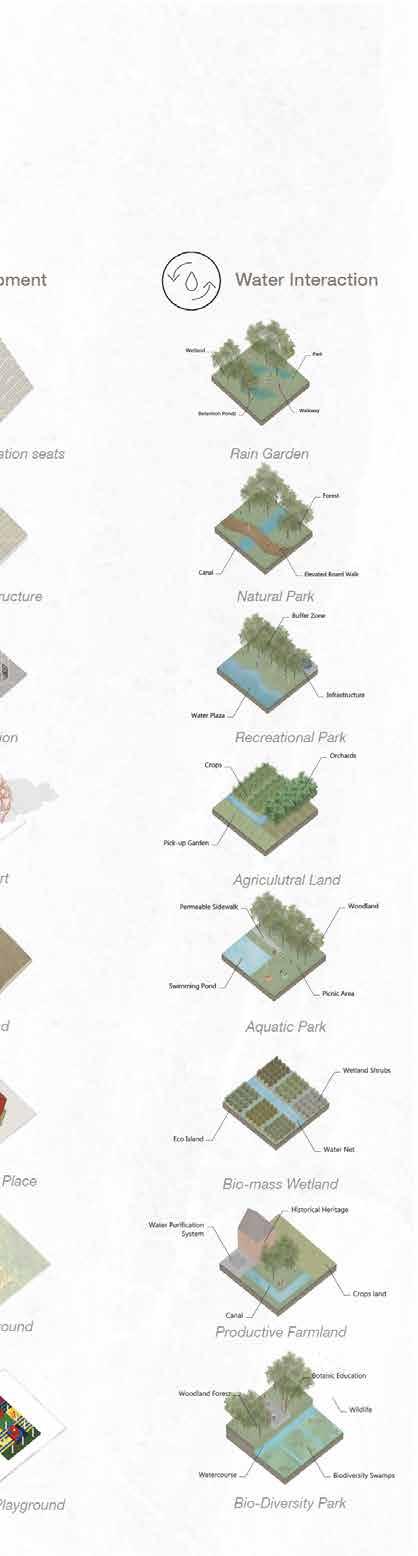 Figure 89
Axoenometric view of the new Parcels
Figure 89
Axoenometric view of the new Parcels
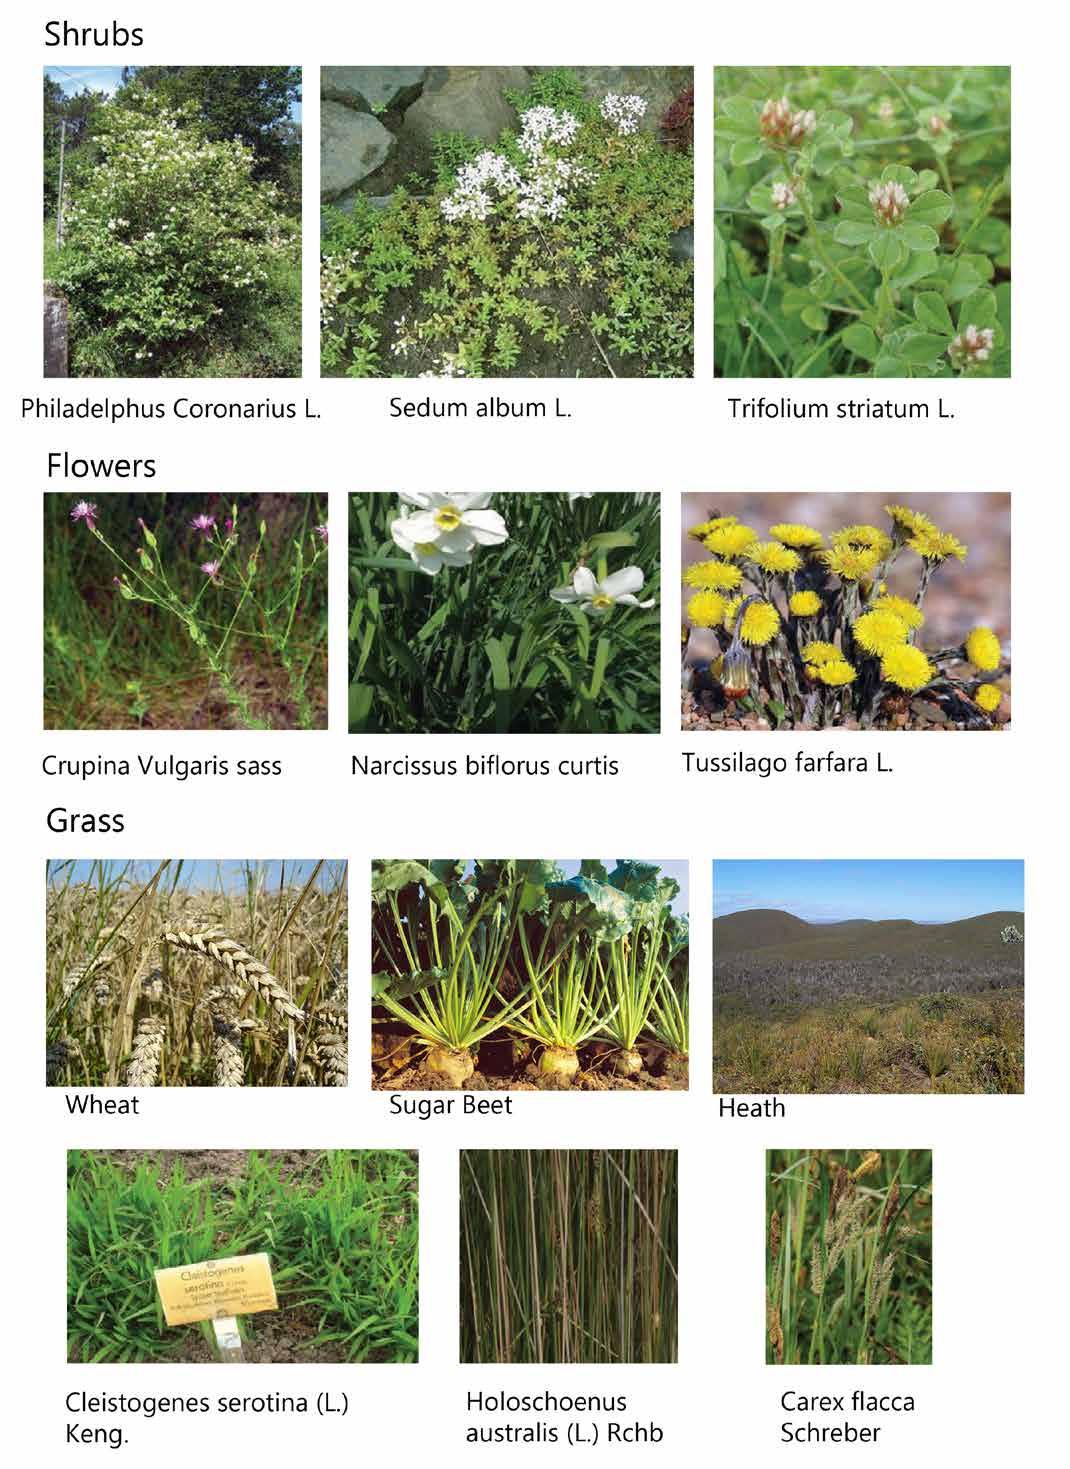
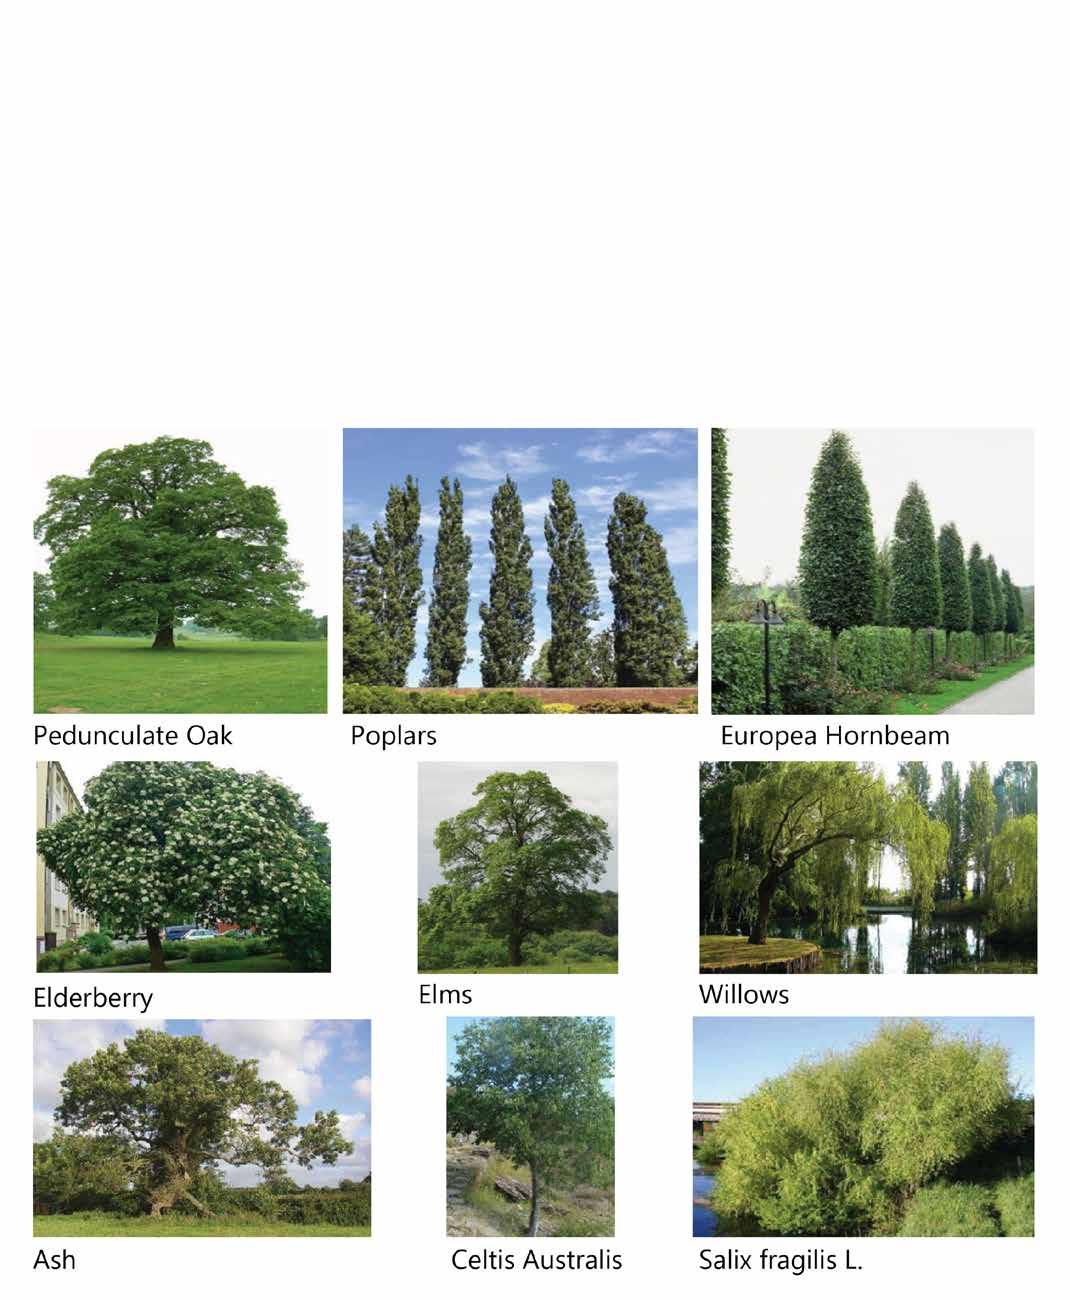
Conserving the ecology on our site, we used the native plants considering their uses as for it’s mostly agricultural that helps in our production process. Putting into conside ration also the seasonal crops and their water consumption throughout the different se asons of the year, the plants’ maintenance schedules as well as their size and the shape as for the recreational parks.
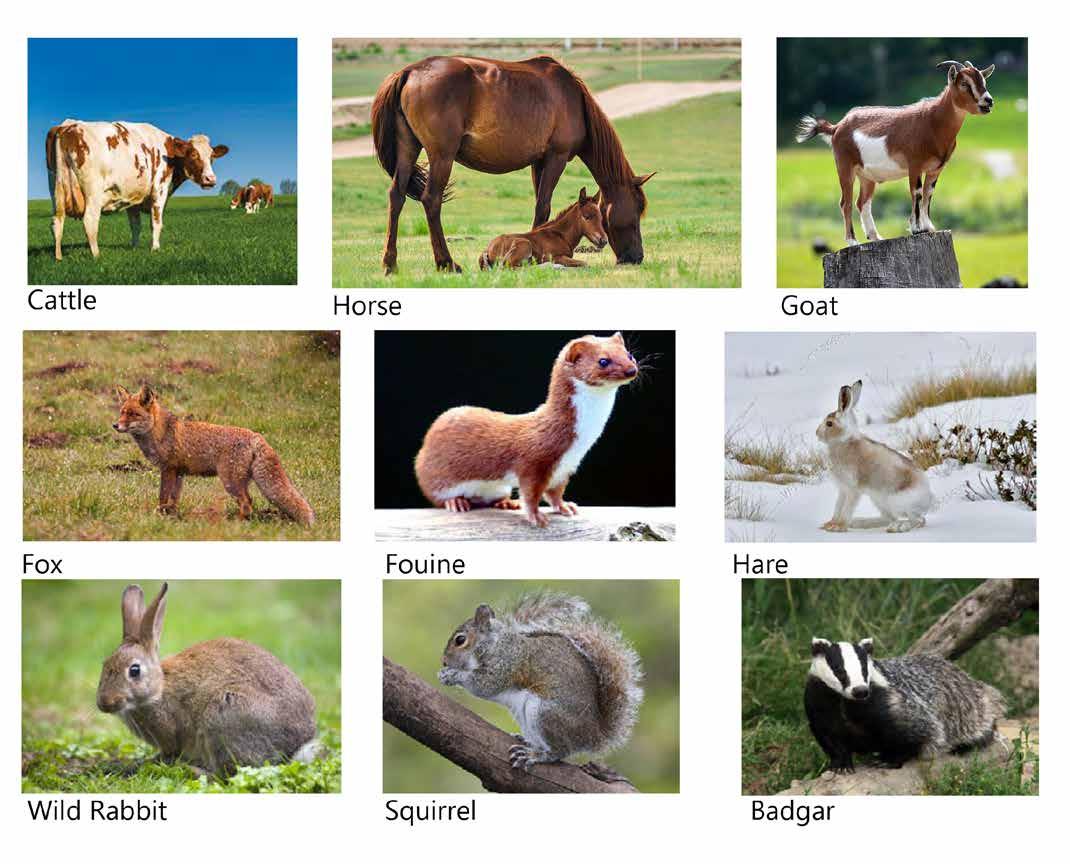
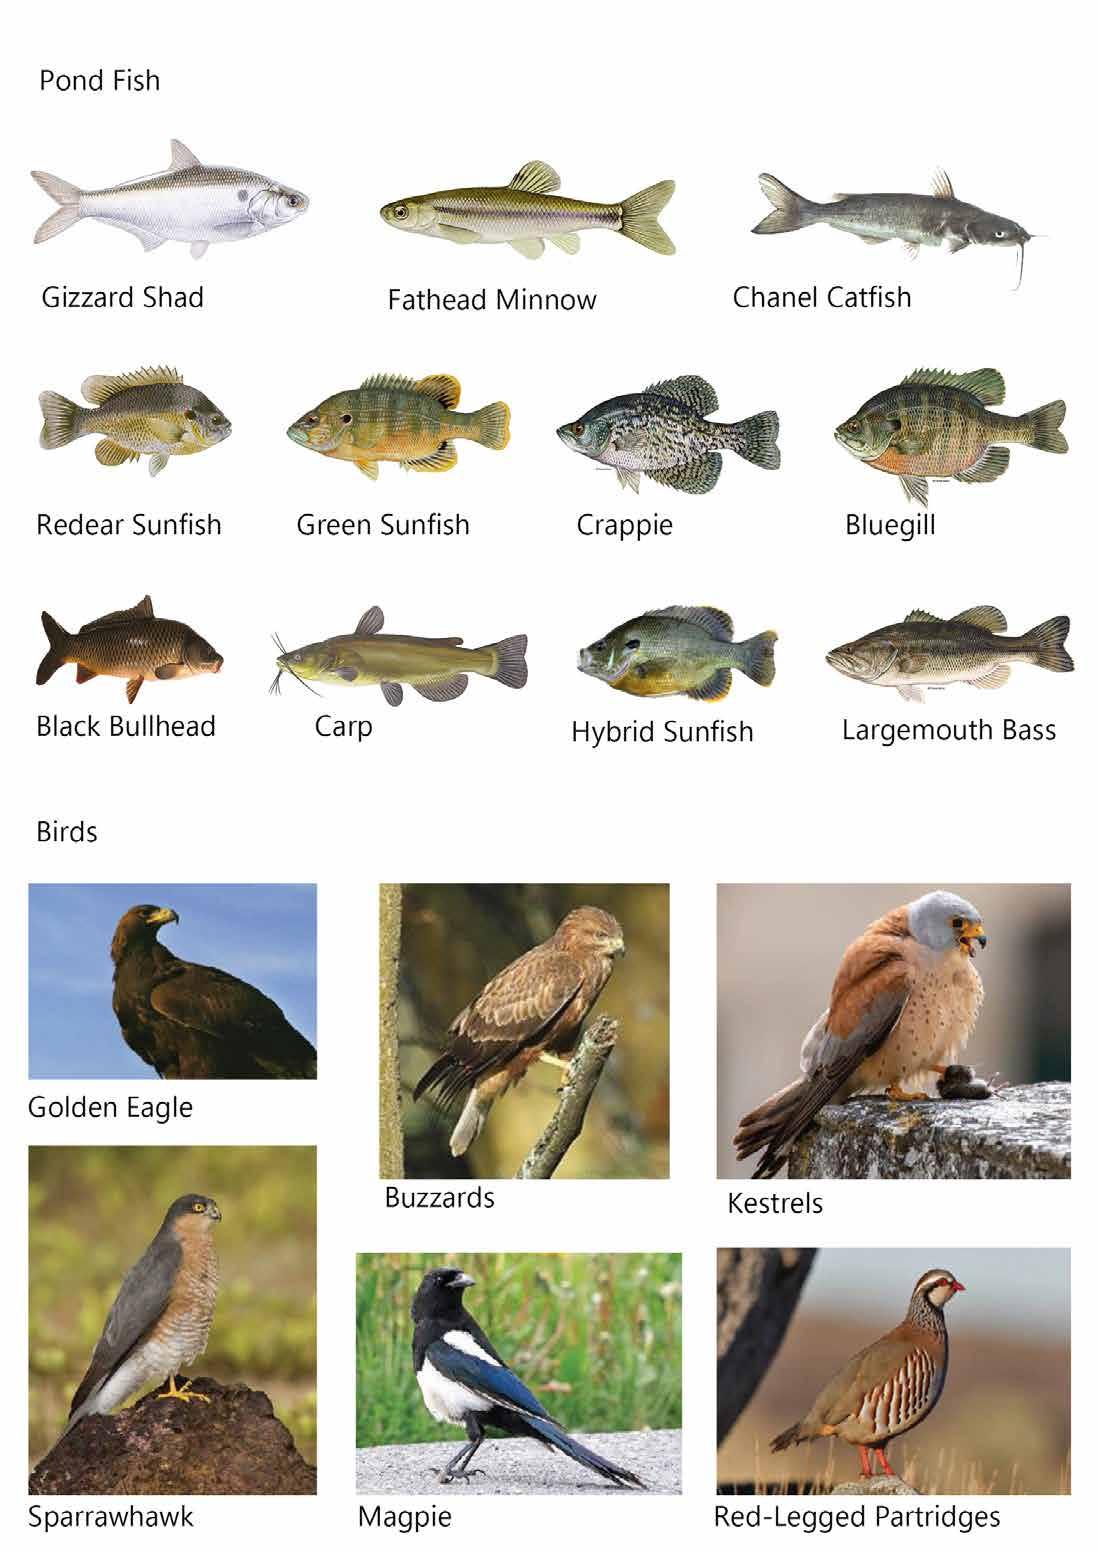
Mammals are picked accor ding to their participation for our production process, as well as, their native existence that is respected for conser ving the ecological features of Piacenza on our site. Birds and fish chosen are to integrate in the ecological system of the ponds that form the fish far ms..
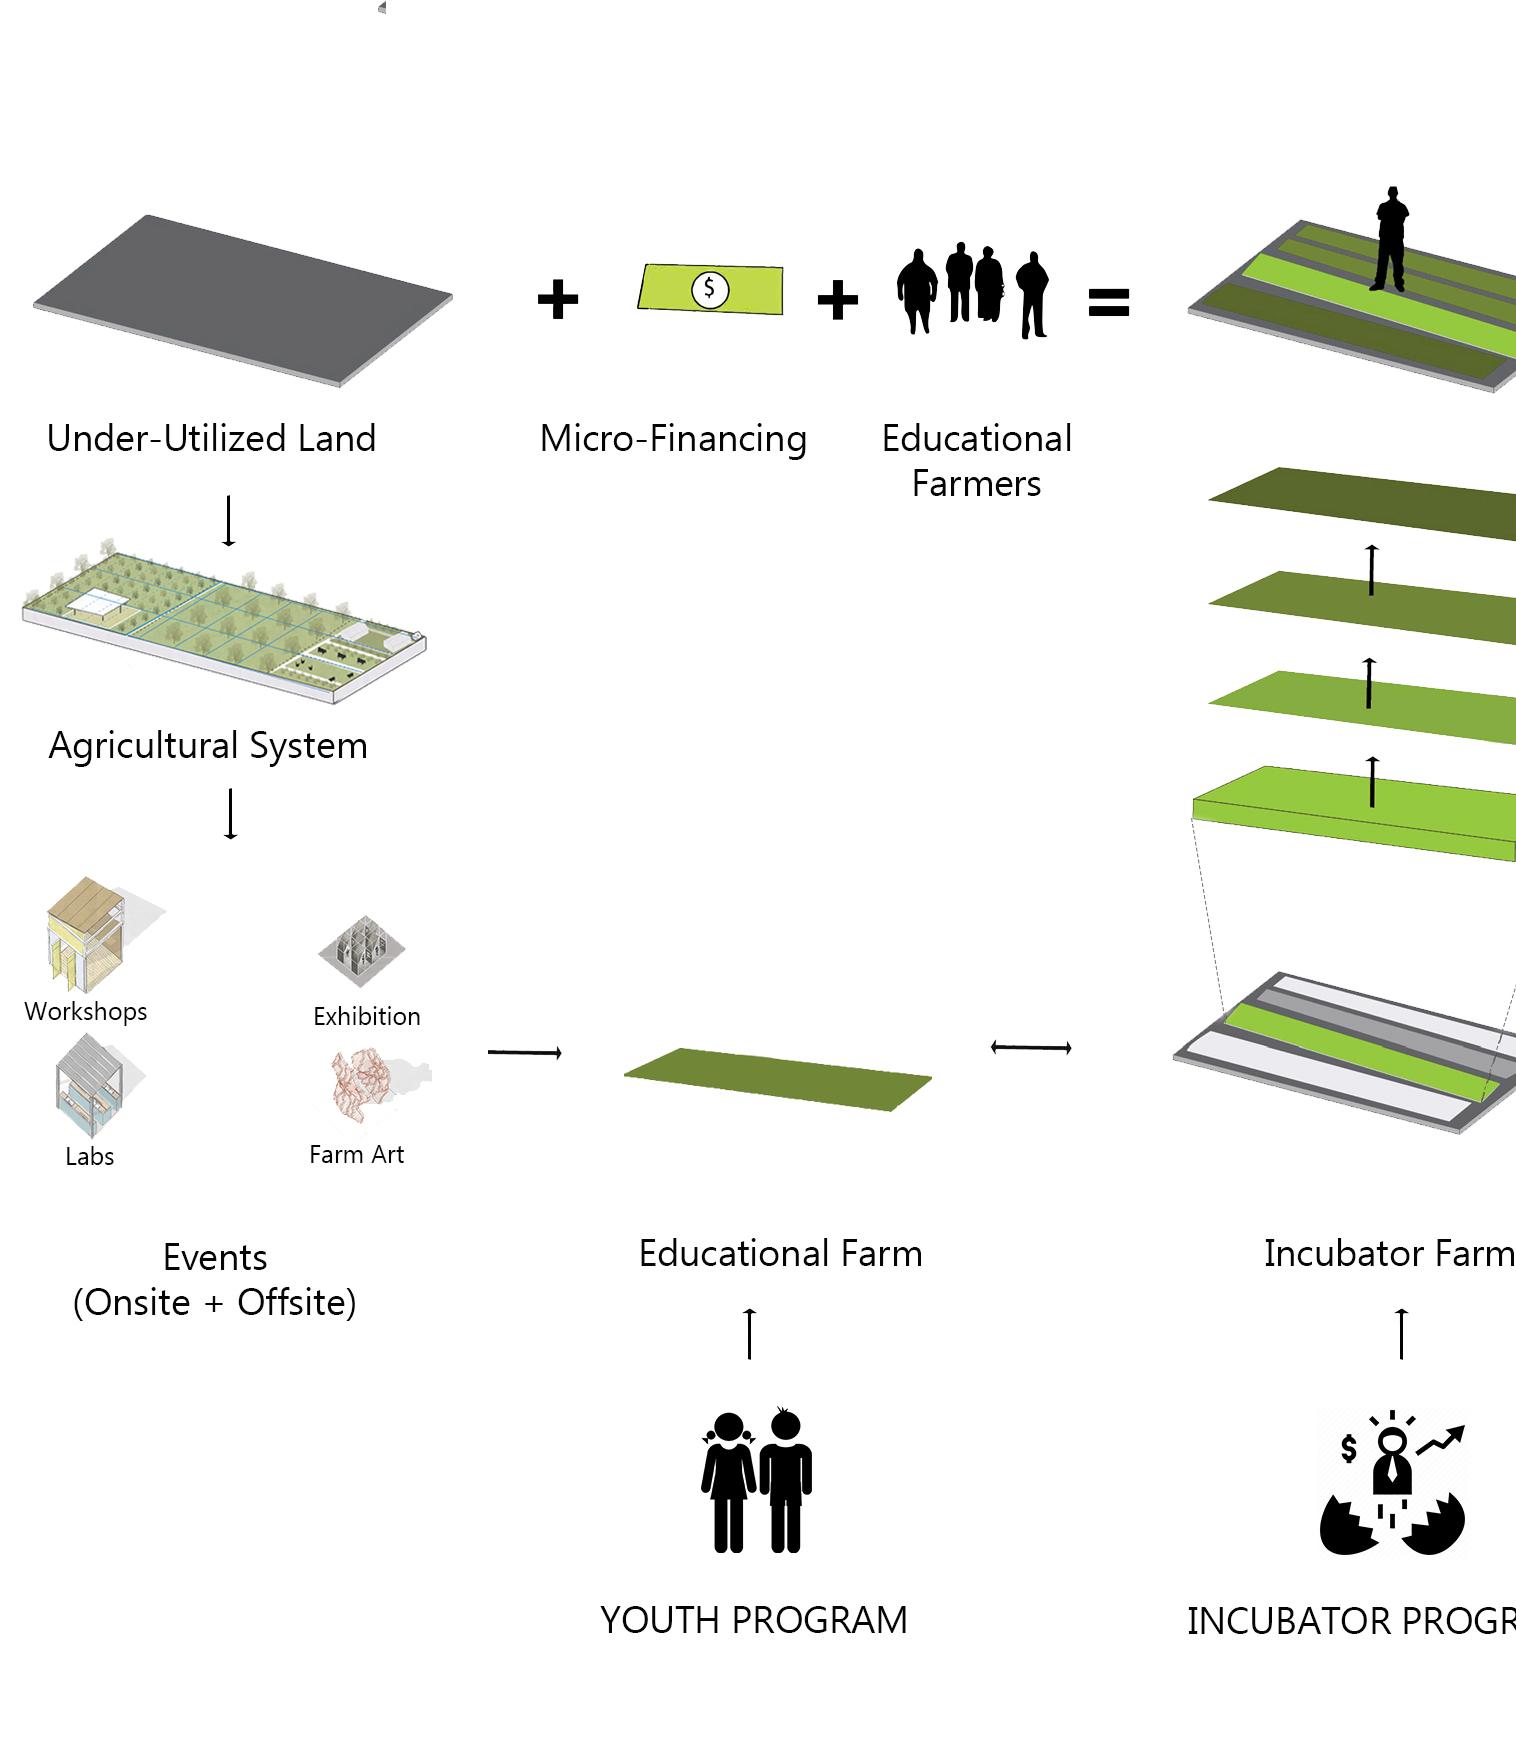
Growing opportunity balan cing the recreational and so cial needs of the context, the landscape becomes a mechanism for incubating community generating eco nomic opportunities, and fa cilitating new relationships to the countryside of Piacenza. This site provides opportunities for small incubator farm busi nesses which allow network knowledge and expansion, as well as providing opportuni ties for a variety of different scales of operation as such the small businesses becomes the words of the park as well as providing an opportunity for visitors to engage with lo cal food production models. Different than a community garden model where indivi duals each form a small land parcel in a collective space the scale of the incubator for model allows for increased productivity and efficiency, as well as providing mechanisms for collective use of tools and processing facilities. In addi tion, the site accommodates multiple scales of production, allowing for expansion of bu sinesses overtime. Overti me the site acts as a catalyst for rebranding the peri-ur ban edge and its possibilities. The agricultural cycle in recre ational spaces includes events on site and off site in nearby
chosen lands like farm exhi bitions, farm arts, labs, clas srooms, etc. It also maximizes the integration between the farmers and the public by gi ving them the interaction op portunity through the educa tional programs in our cycle. It consists of three systems, youth program, incubator pro gram and allotment gardens. Where youth program is ma naged for school children that come to learn in educational farms, incubator programs for university students, post gra duate students and fresh wor kers that come to learn in the incubator farms and allotment gardens where people who le arn from our agricultural cycle can then apply this education in our community gardens
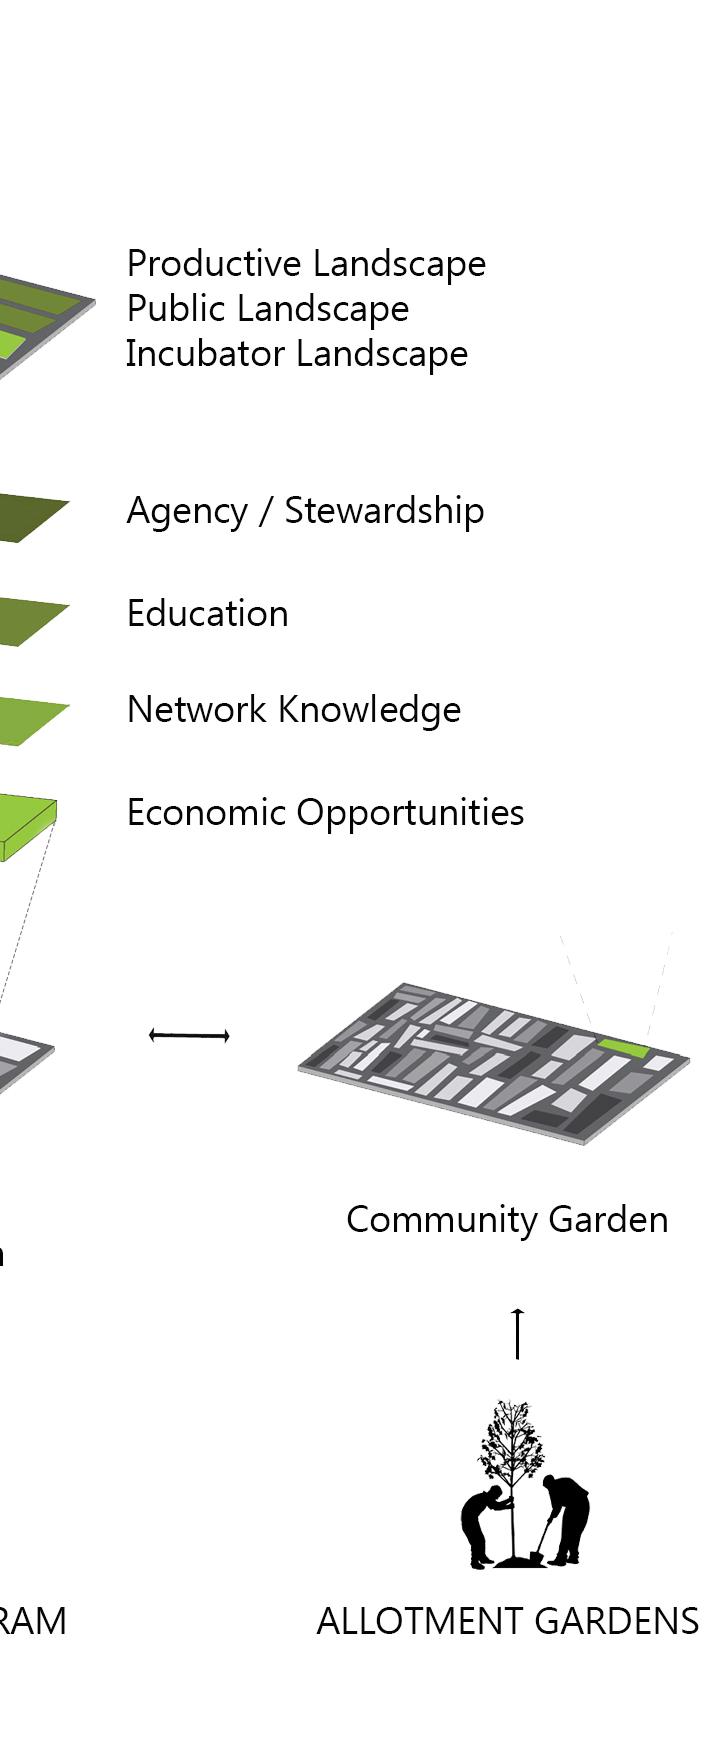
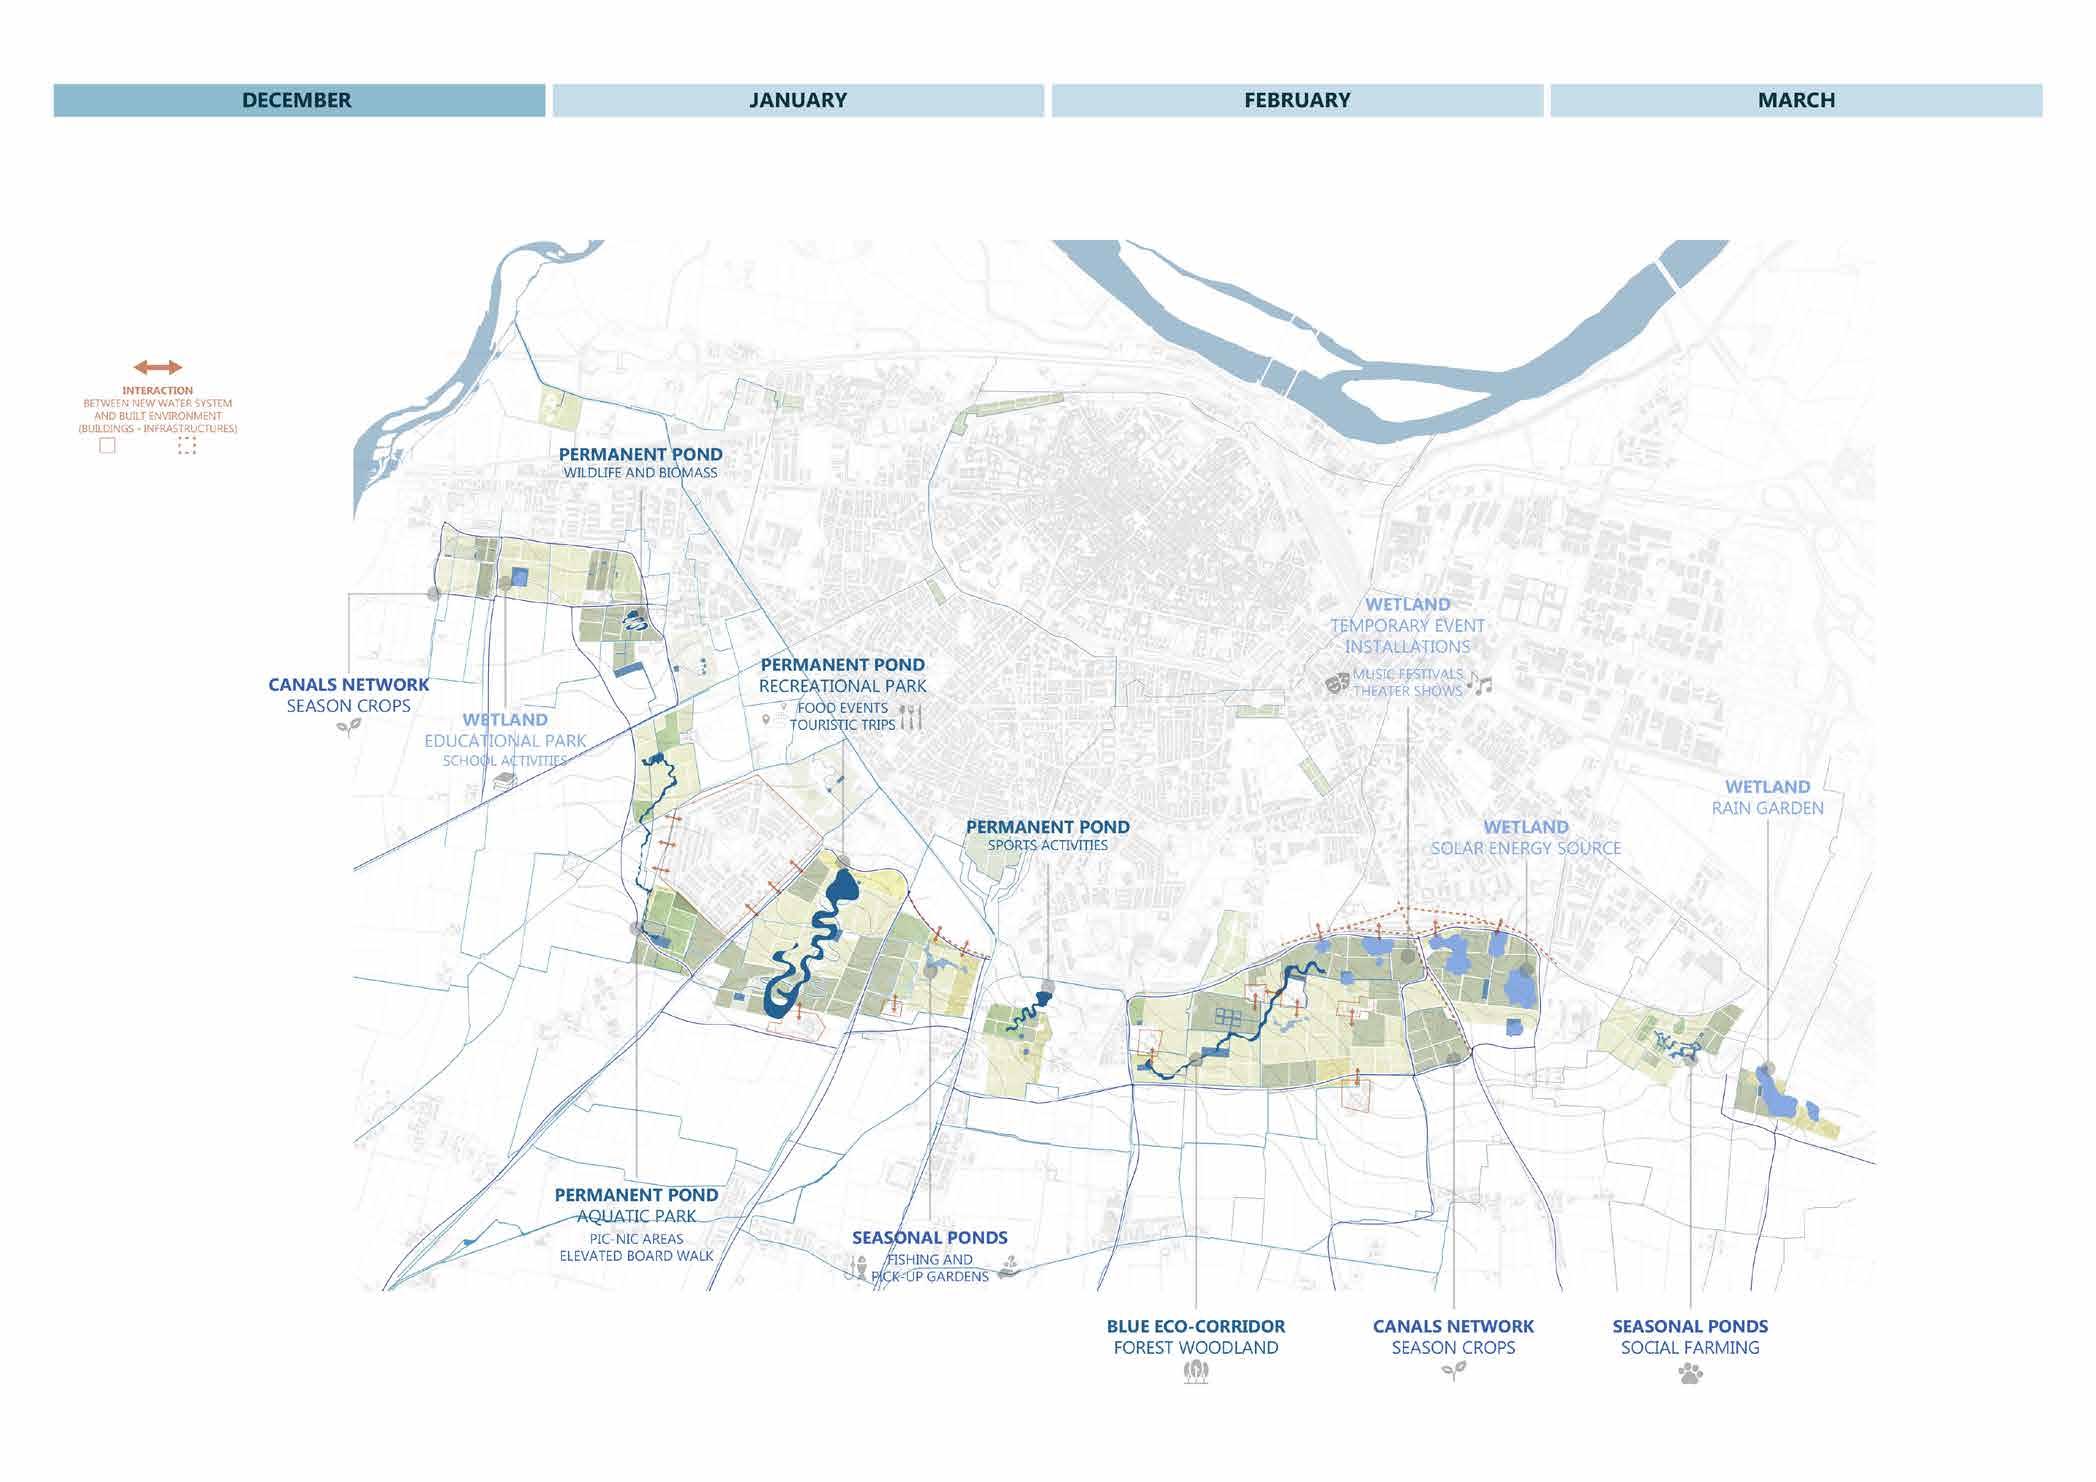
Figure 90
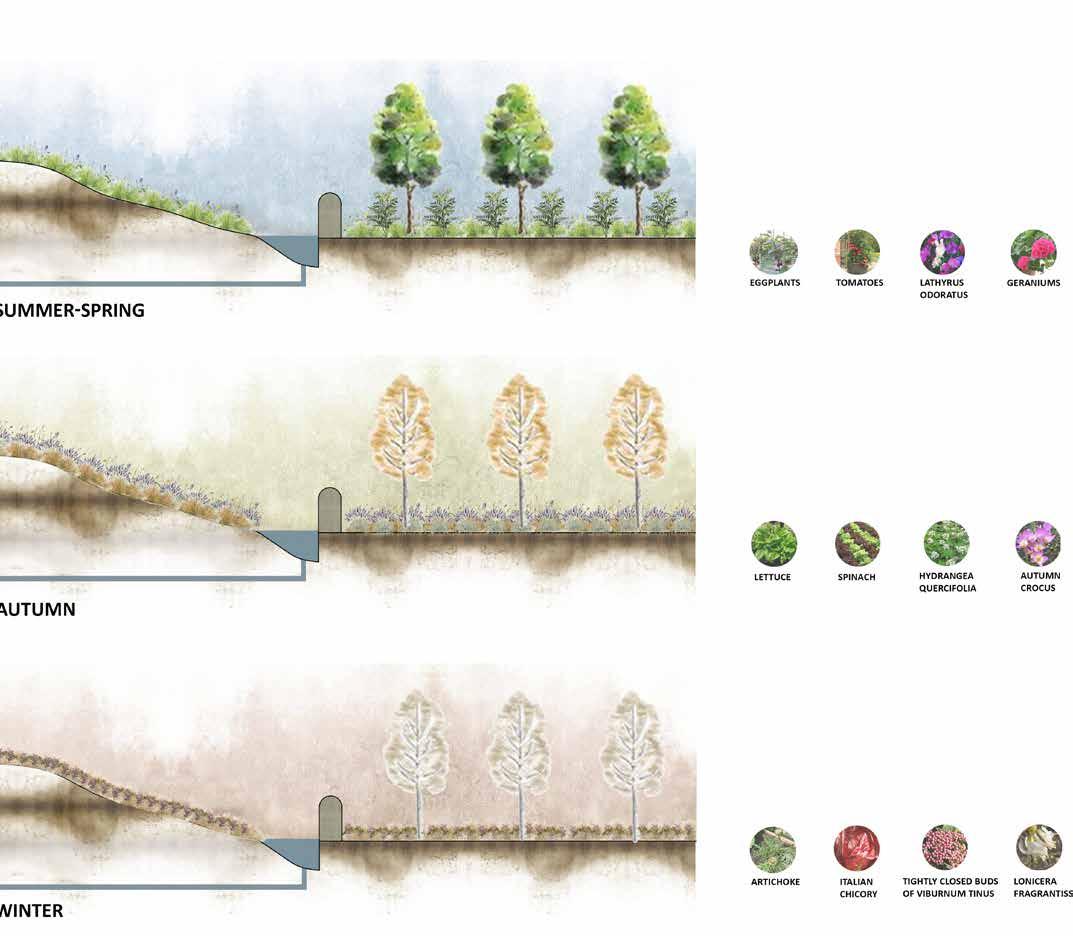
New acitivies during winter season
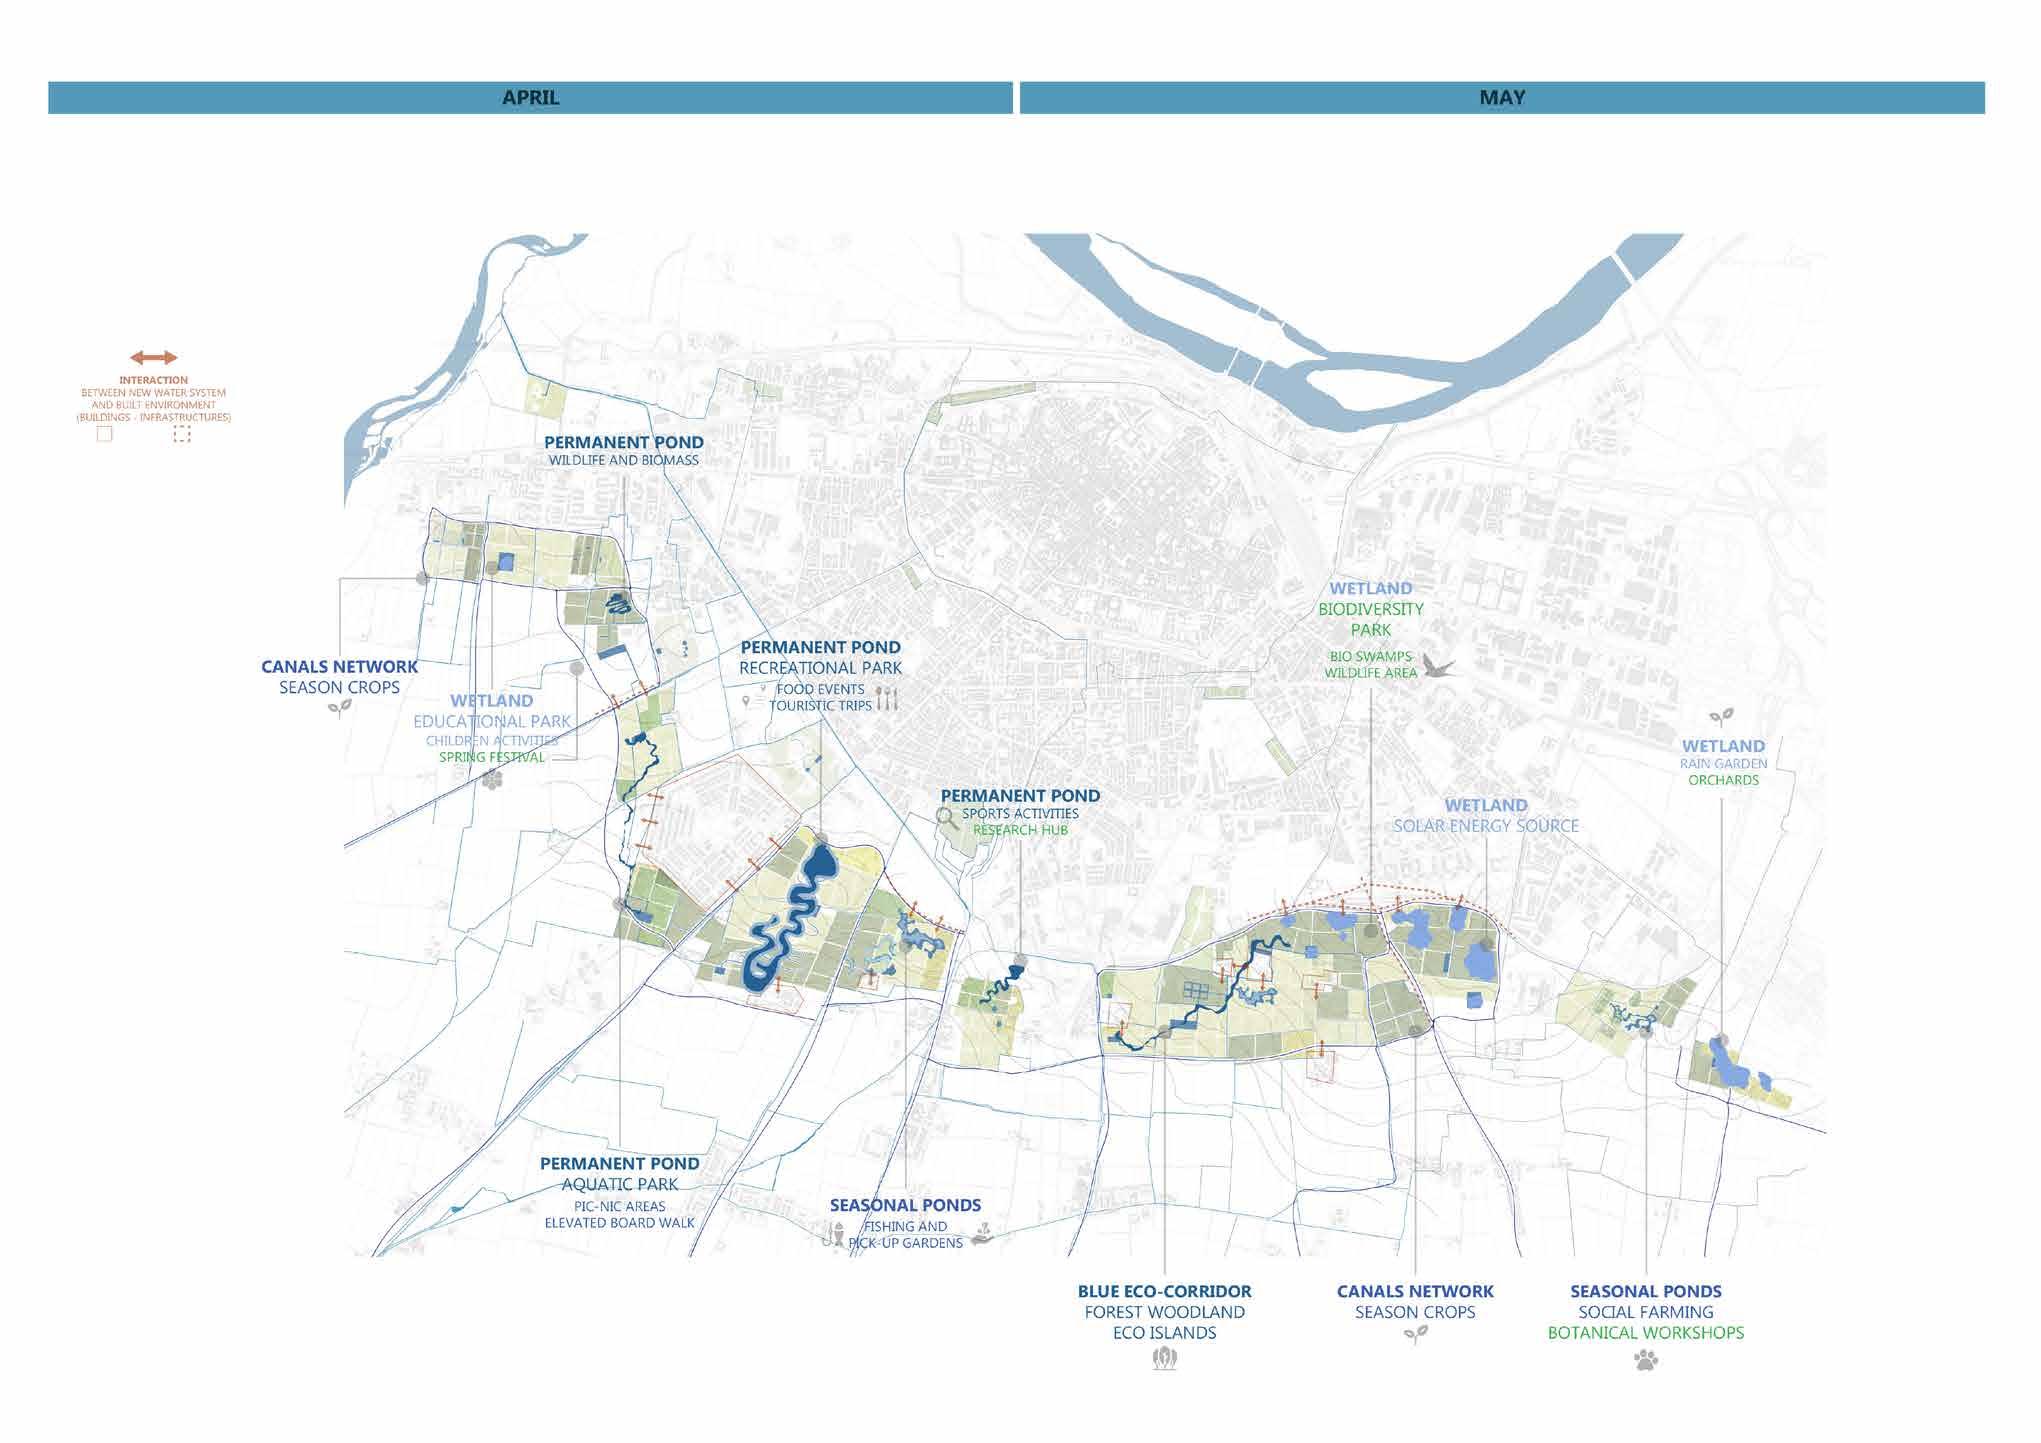
Figure 91 new acitivies during Spring
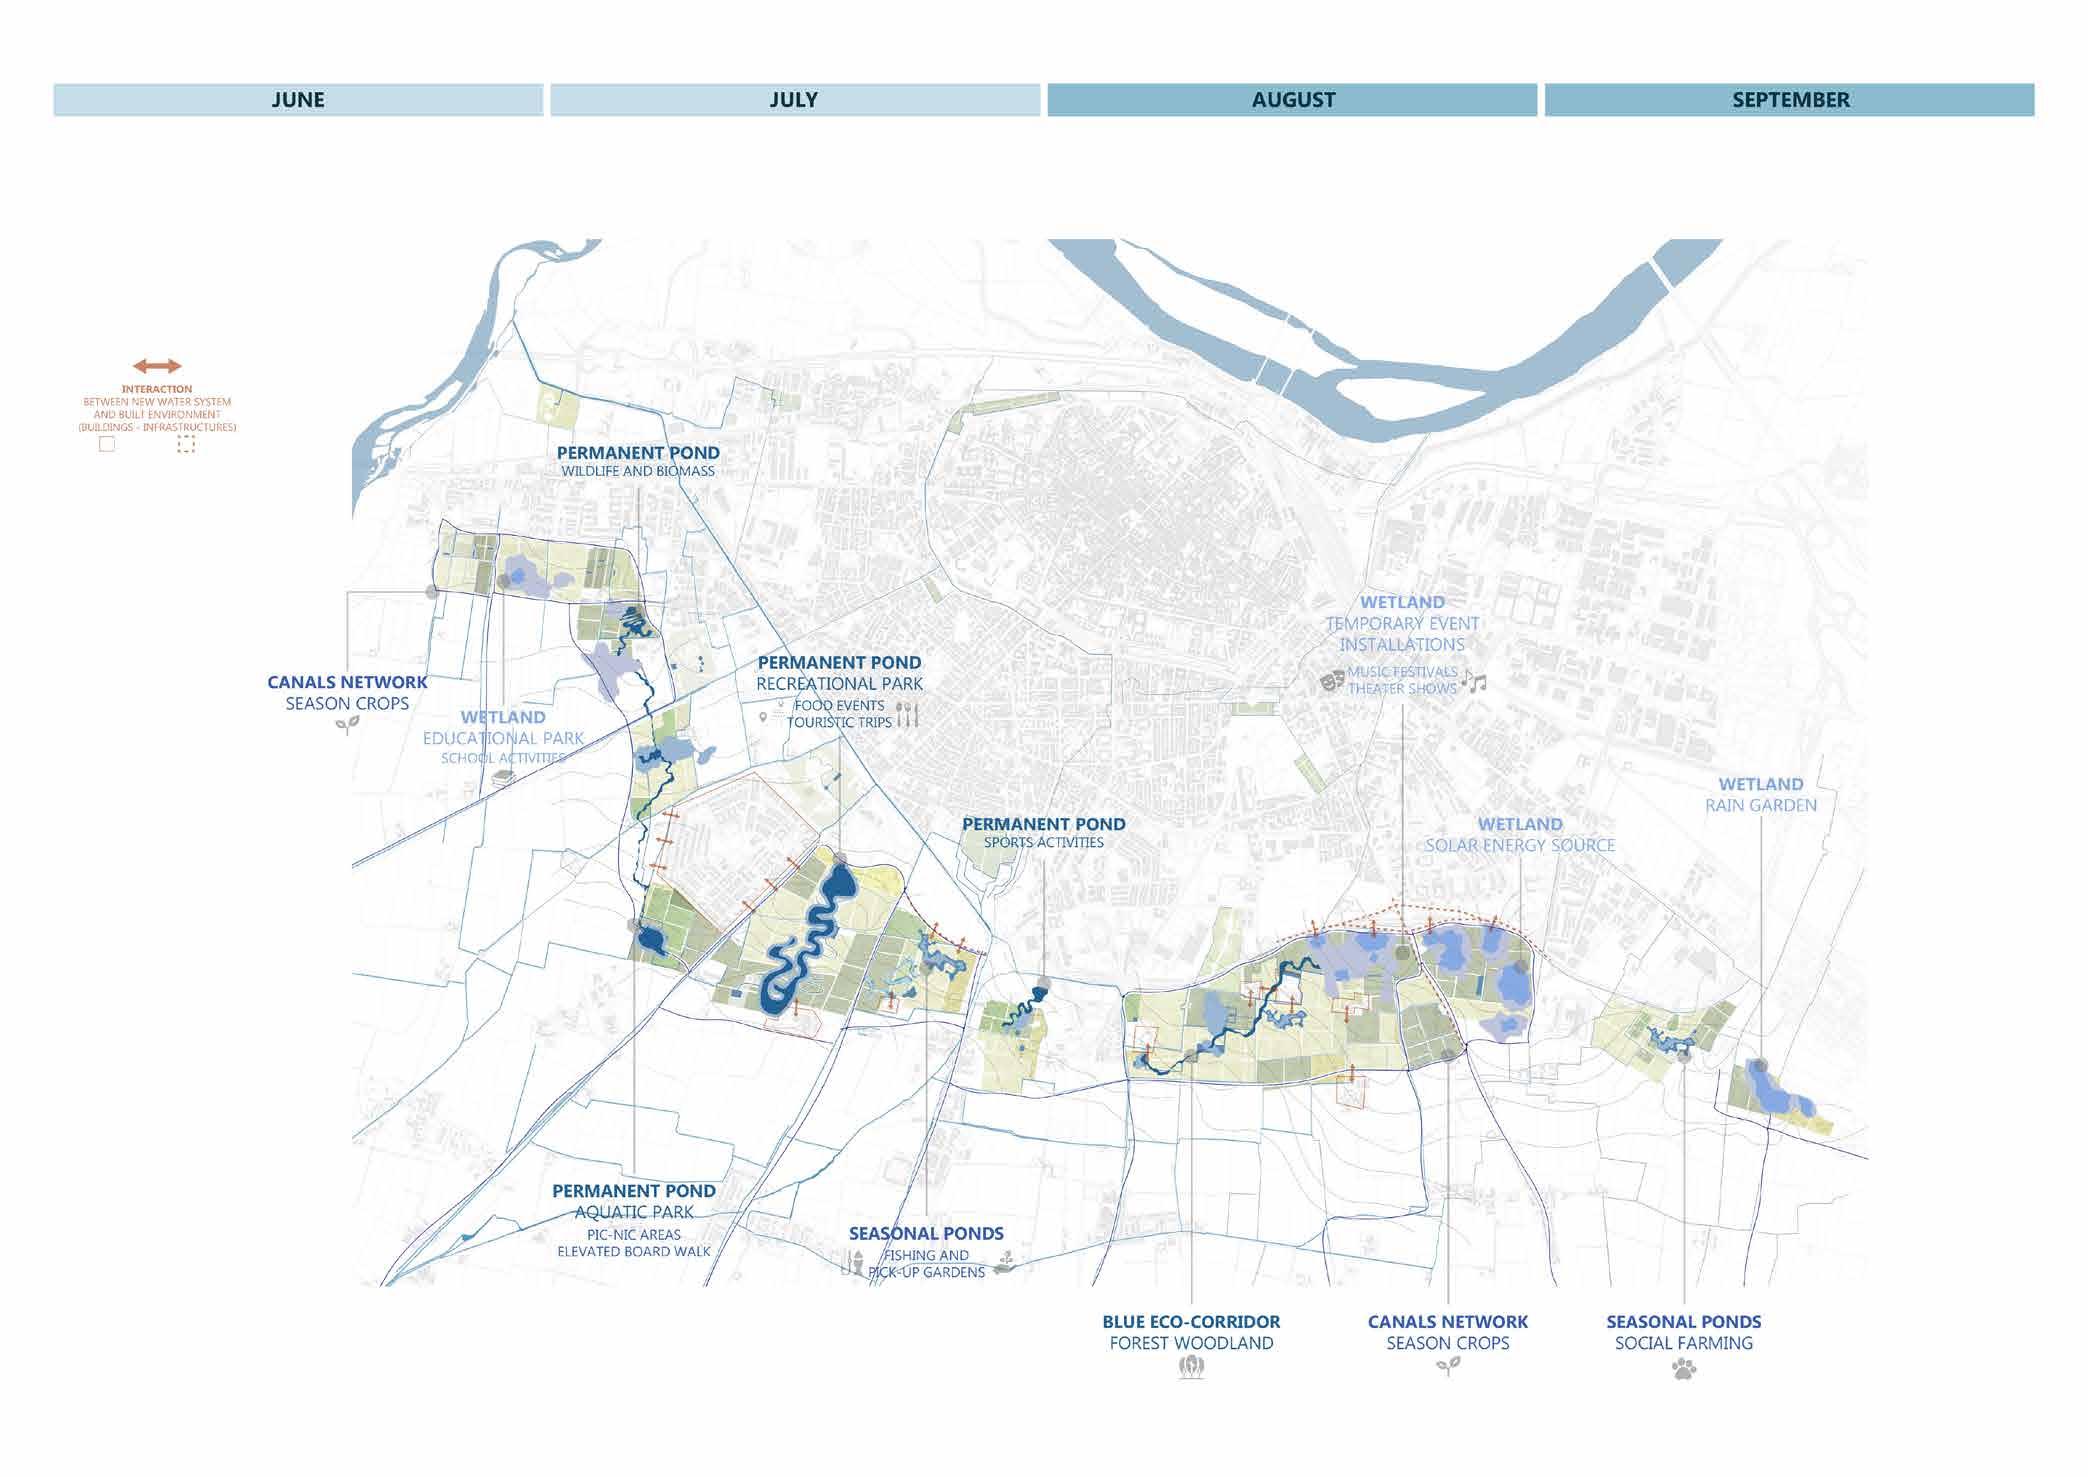
Figure 92
New activities during Summer
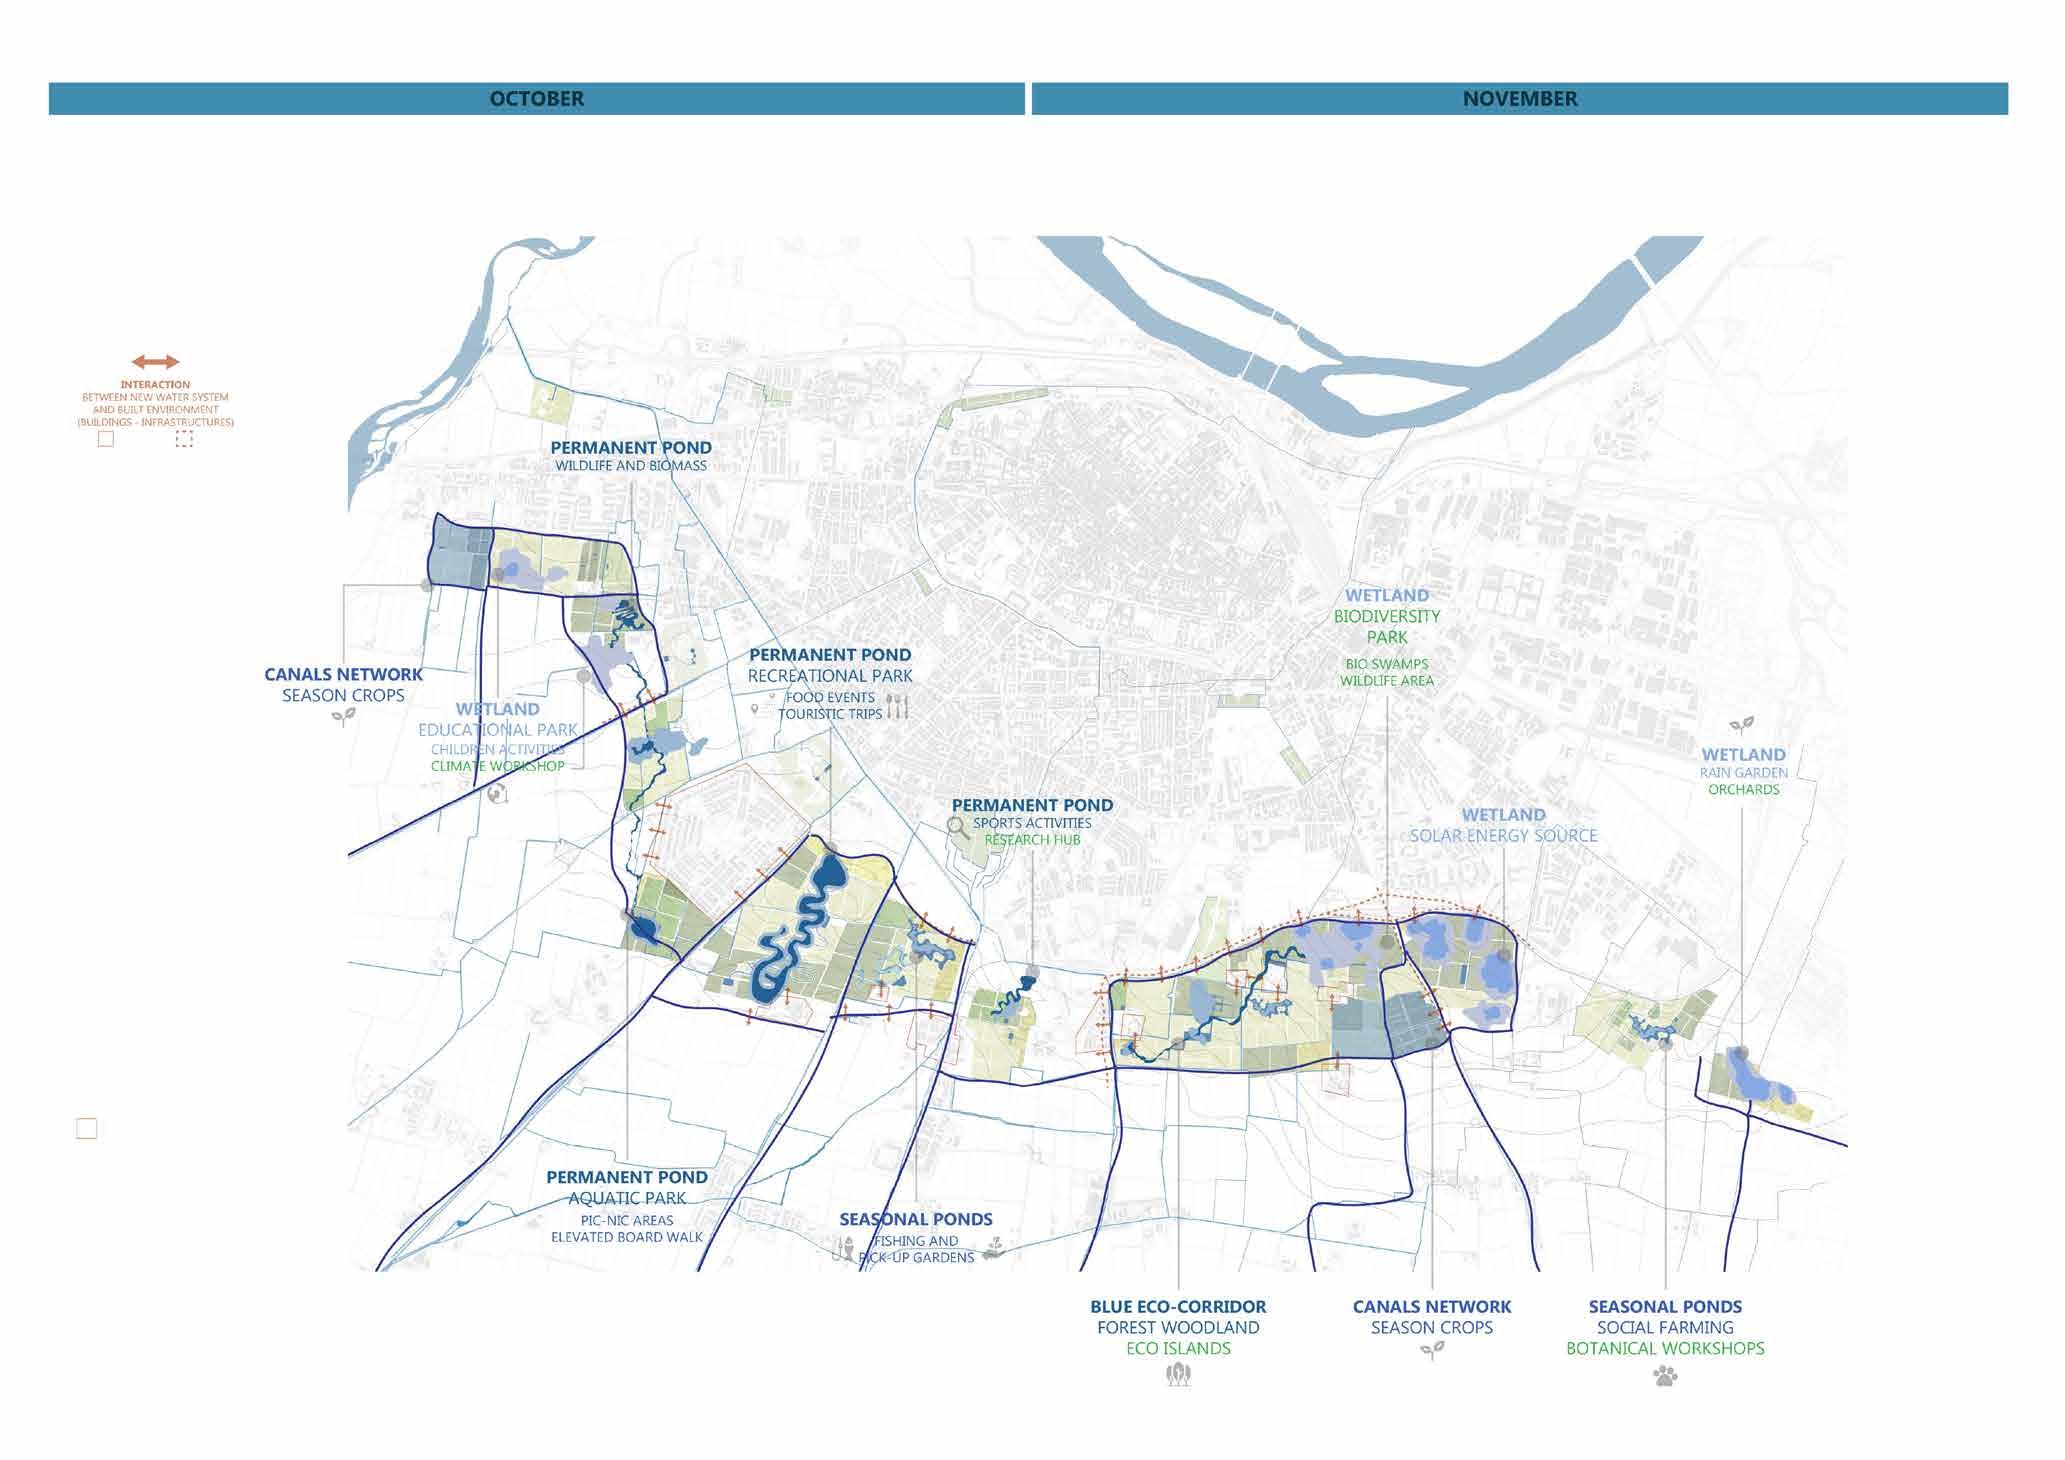
New activities during Autumn
Figure 93

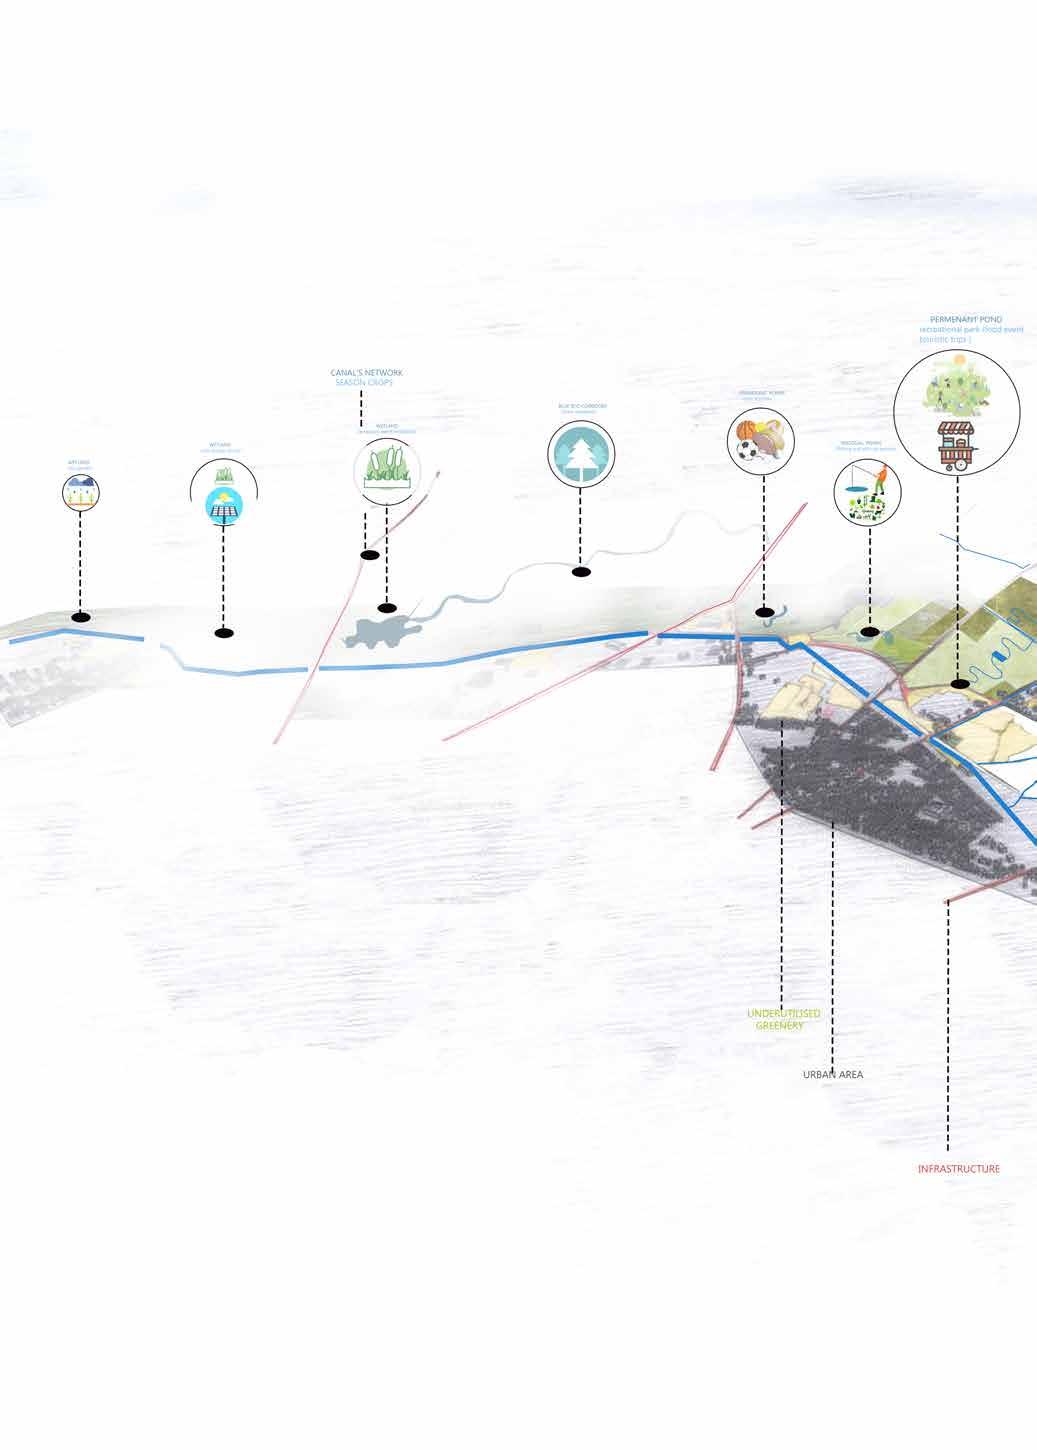
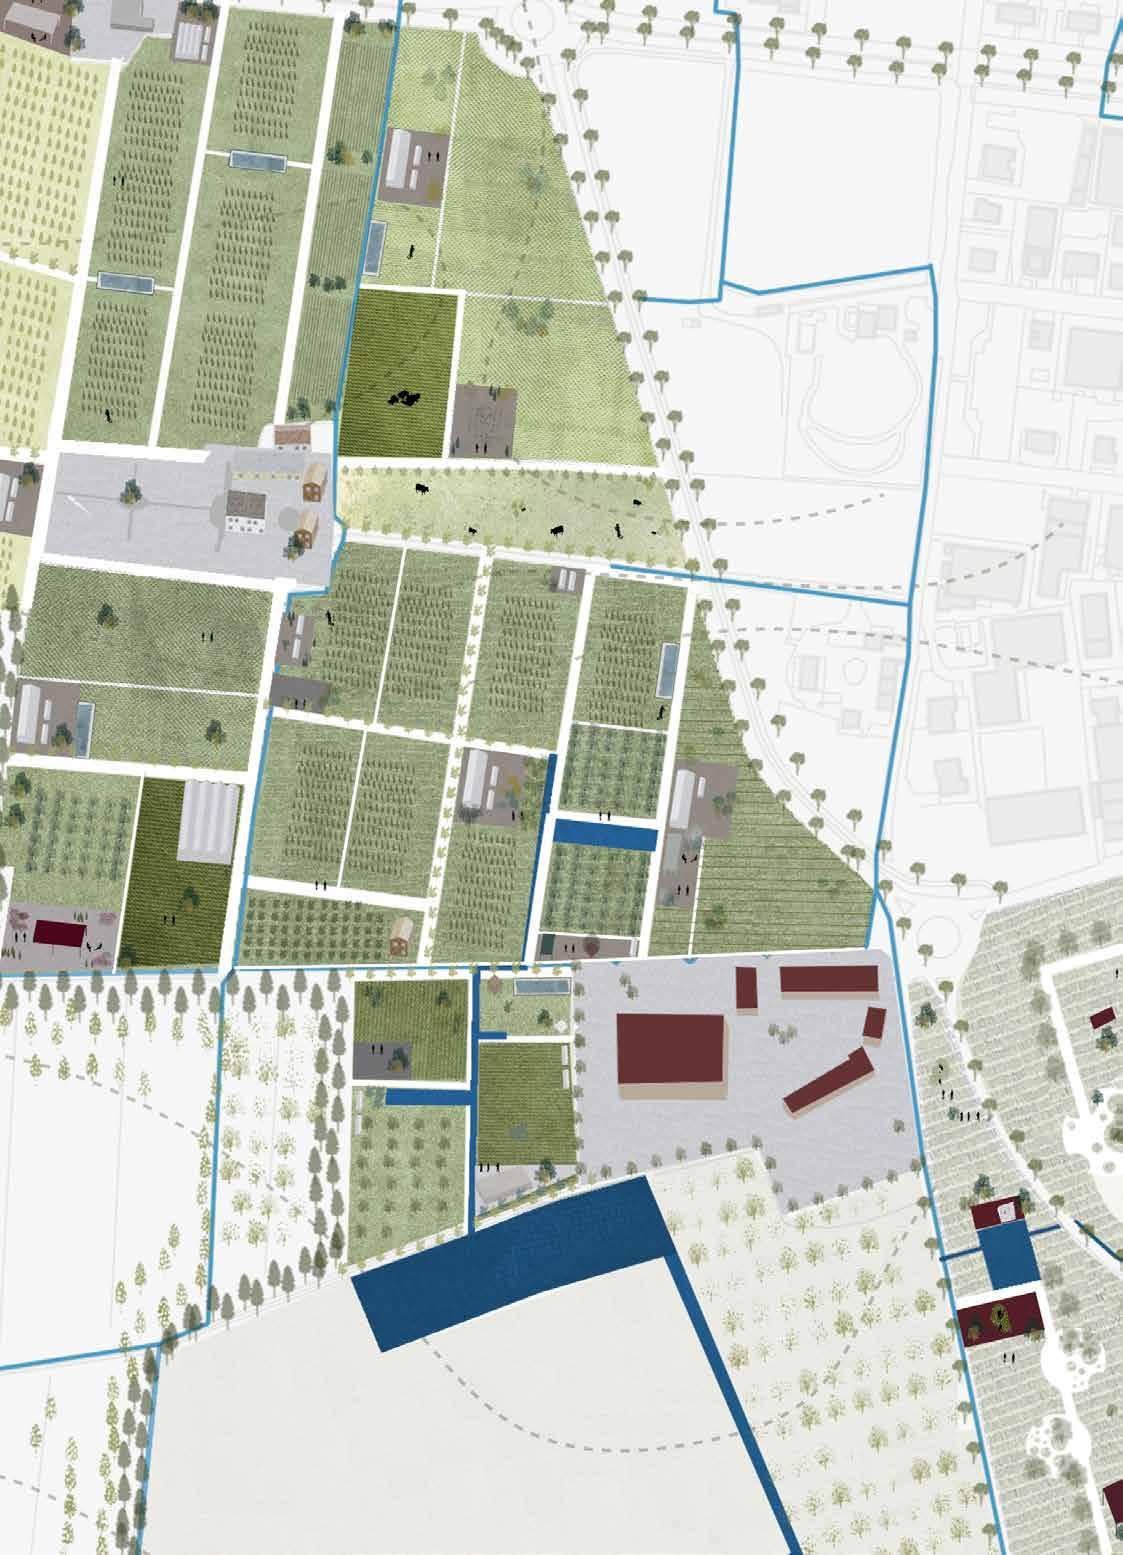
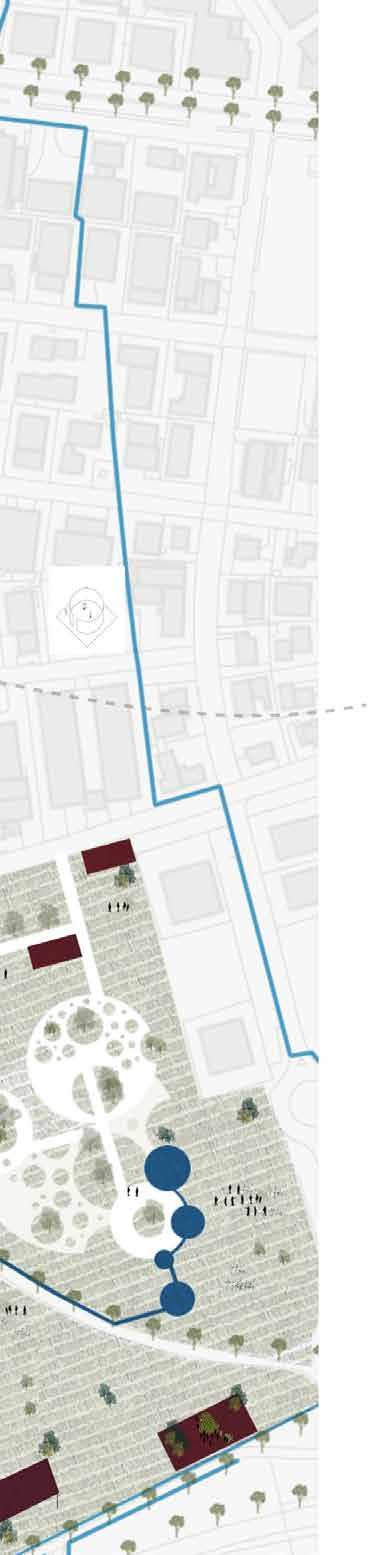
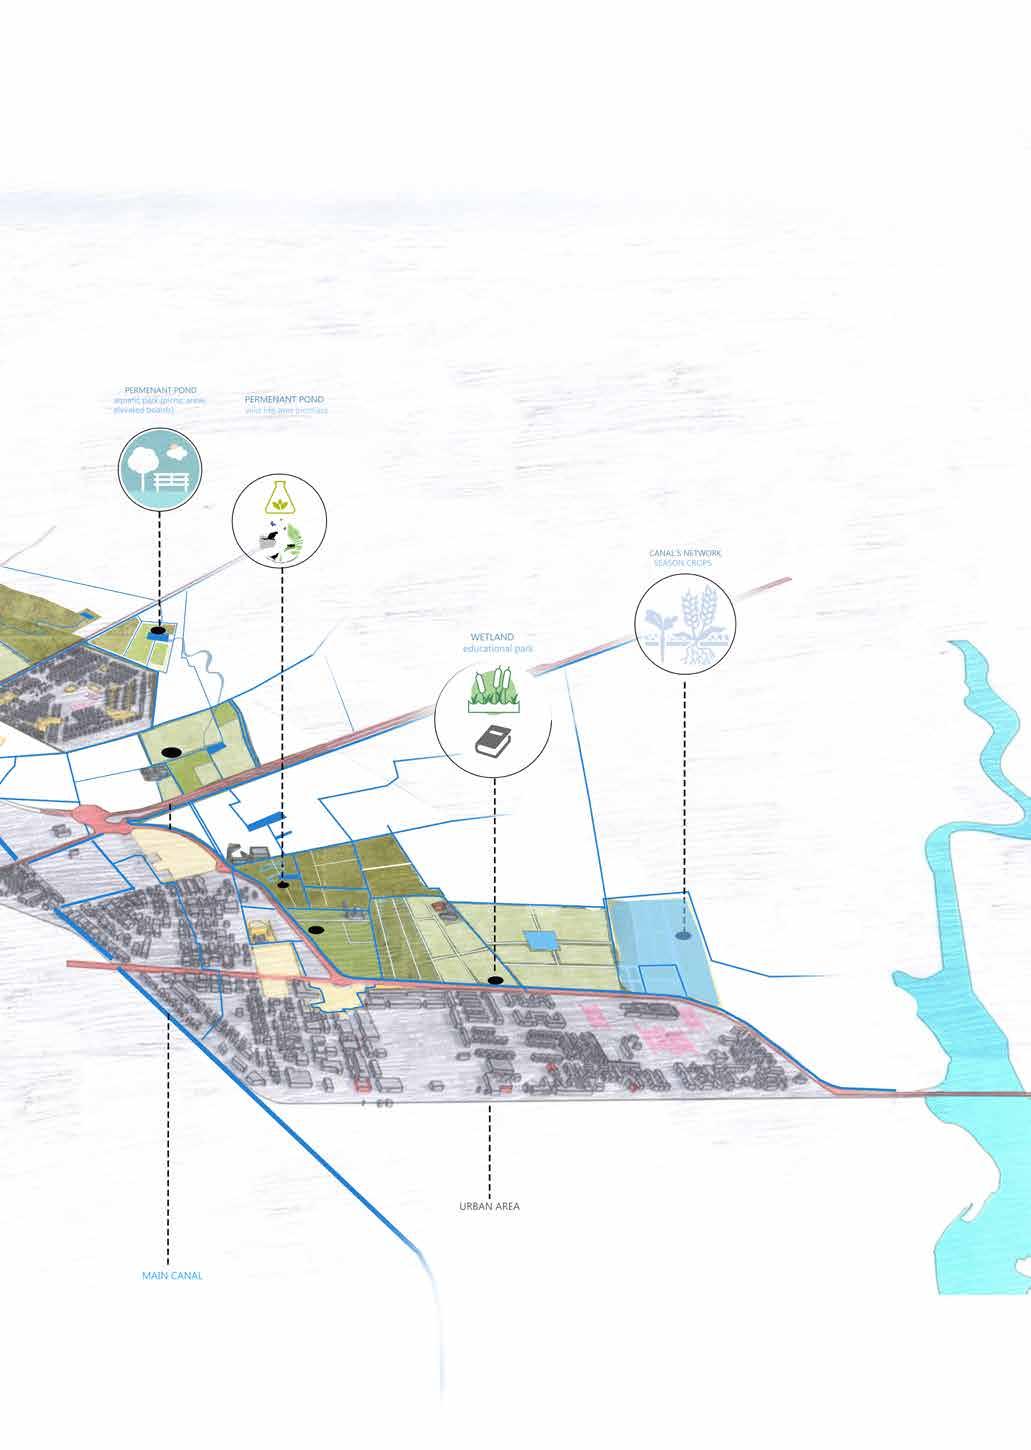 Figure 94 masterplan with functions
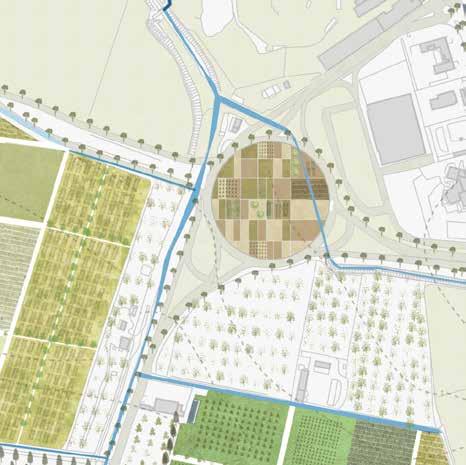
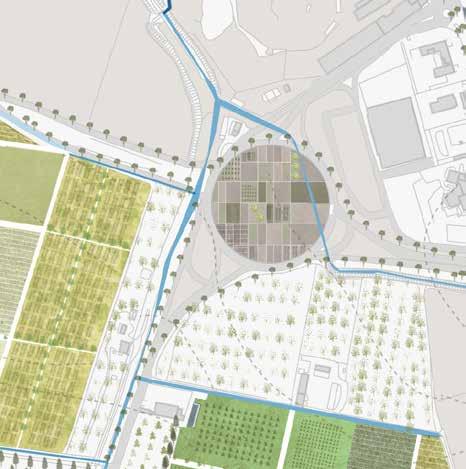
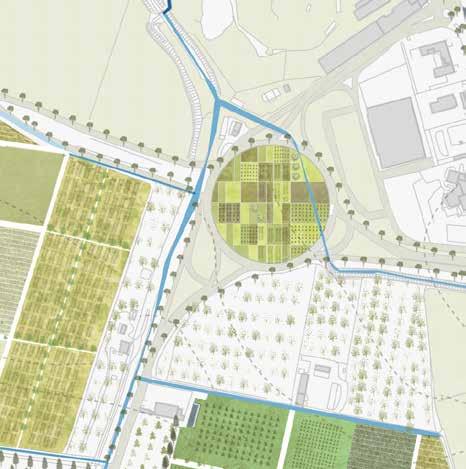
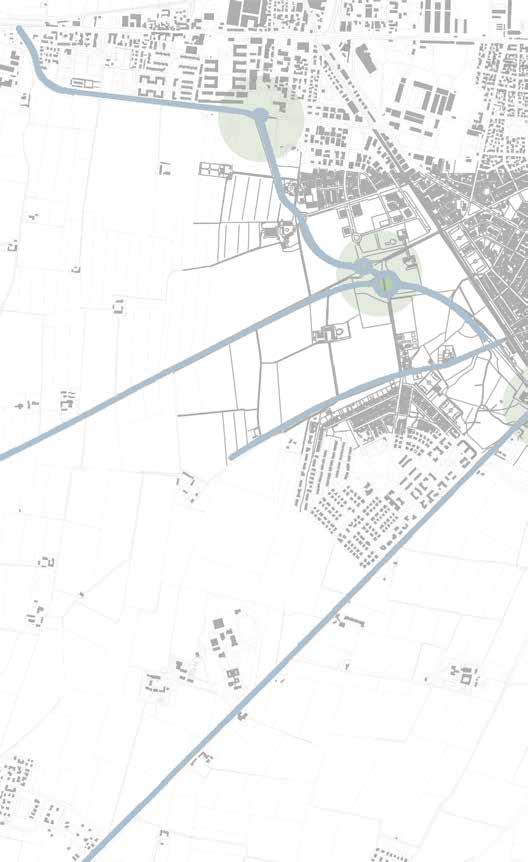 Figure 95
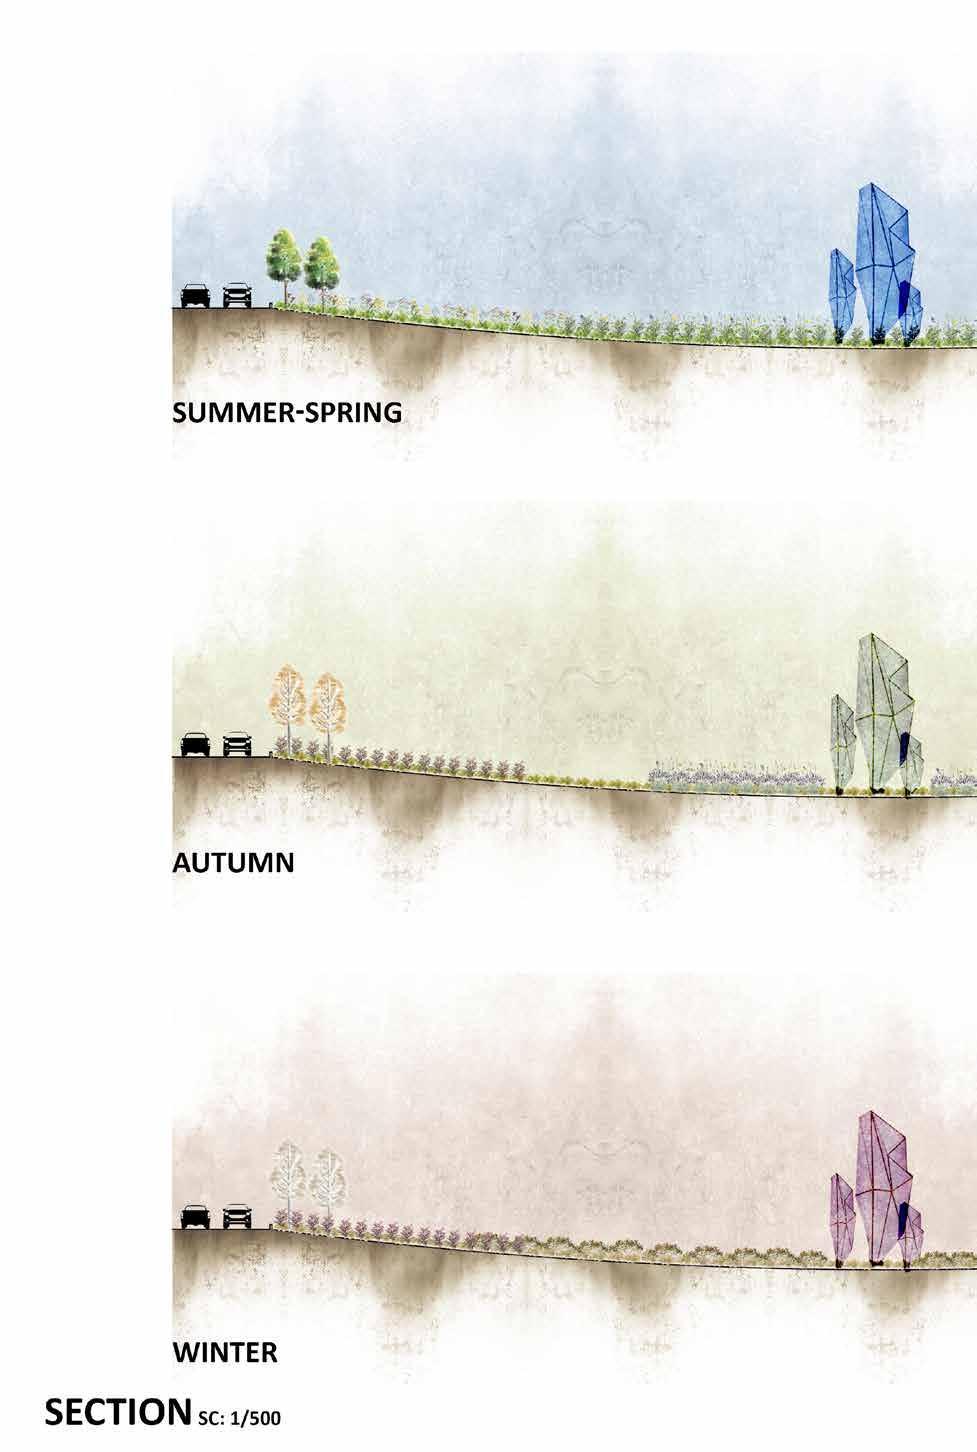
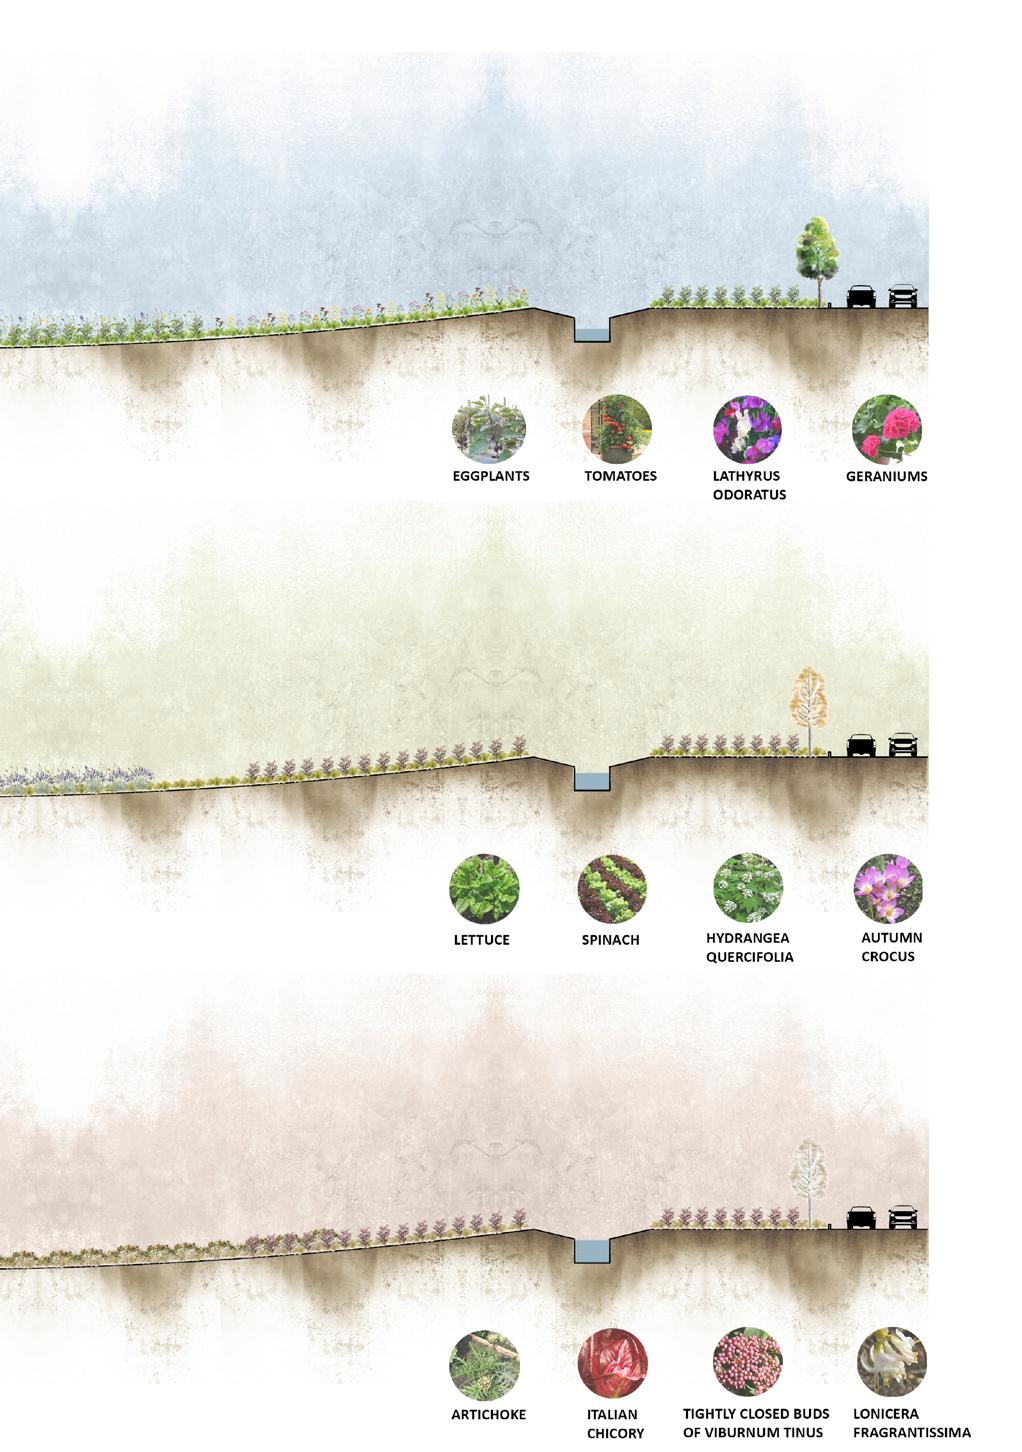
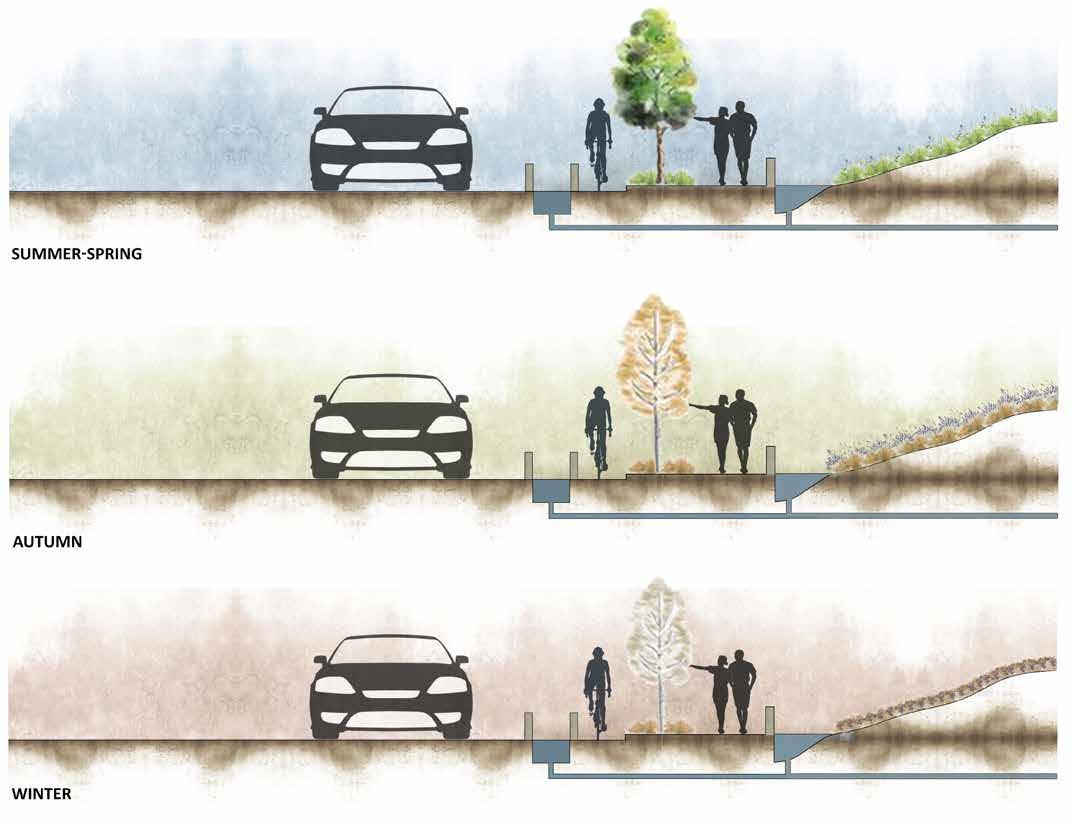
As the tangenciale is the Gate to the project, it is only impor tant to start reflecting from there. The roundabouts carry the seasonal vegetation were every season gives a new sensation and gives out a new mood for passengers that are coming by. The roundabout includes vegetations and plan ts that change through out the whole year.
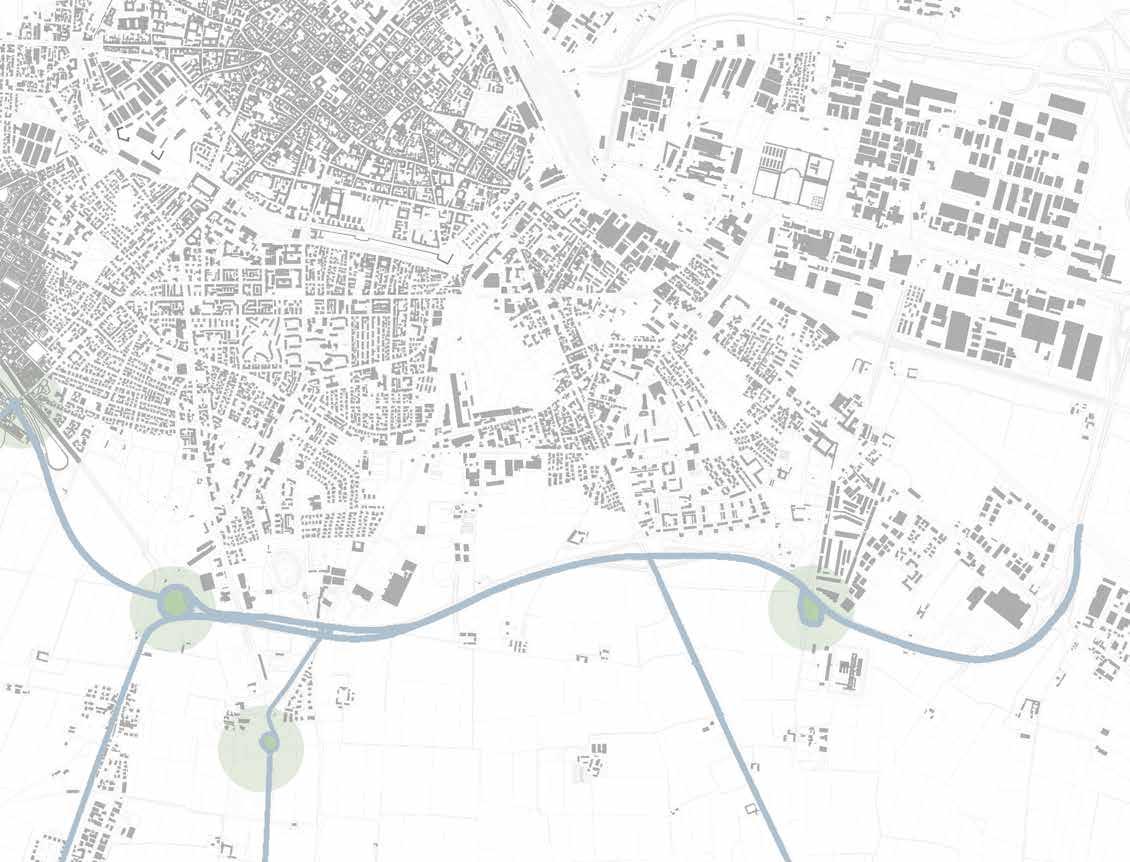 Figure 96 Map of selected roundabouts
The water canals are designed to soak the water from rain and take it to underground to create environmental sustai nability and water clog pro blems in the urban area.
The pedestrian design increa ses walkability and soft circu lation in the street. The design also includes buffer between soft and hard circulation by using trees which also helps to create shading area in the streetscape for the users. Mo reover, by using the water ca nals to provide safety between the cars and the bicycle lane.
Allotment gardens on our site are designed as for communi ty gardens divided into educa tional and business farms that are used in maximizing the in teraction of the public with the farmers and the agricultural cycle and activities available on site, raising the awareness of the public for the agricultu ral history of Piacenza as well as providing them with know ledge and skills in the agricul tural field. It also adds to the economy on the site as the gardens are rent to the public
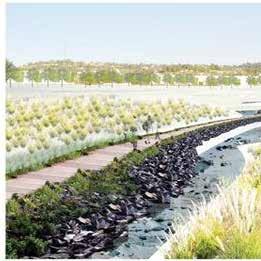
Ponds on our site are located for different activities, it’s con sidered for bioswales that in clude water plants such as wa ter lilies that purify the water, it’s also considered for rainwa ter collecting basins that con serve the water for irrigation use in dry seasons, as well as marcita systems ponds. Ad ding also the huge role of the ponds in increasing the ecolo gical interaction on site as for it includes fish farms and at tracts fauna as well as the nati ve aquatic plants.
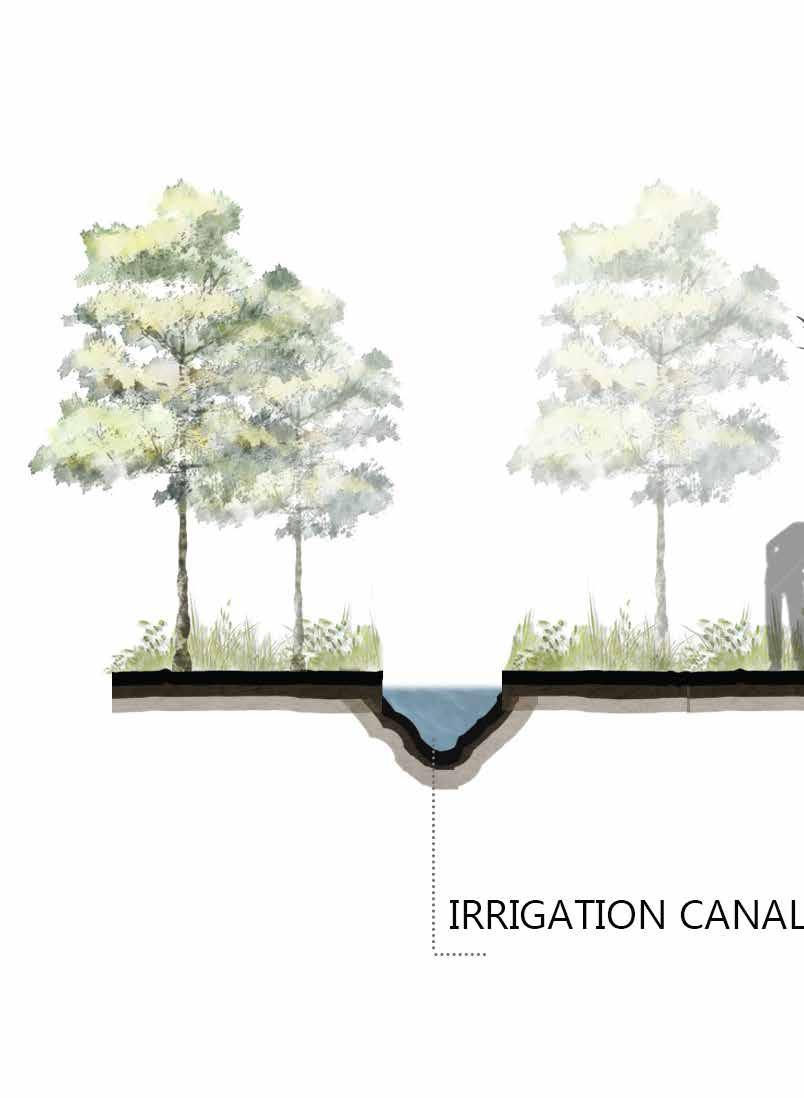
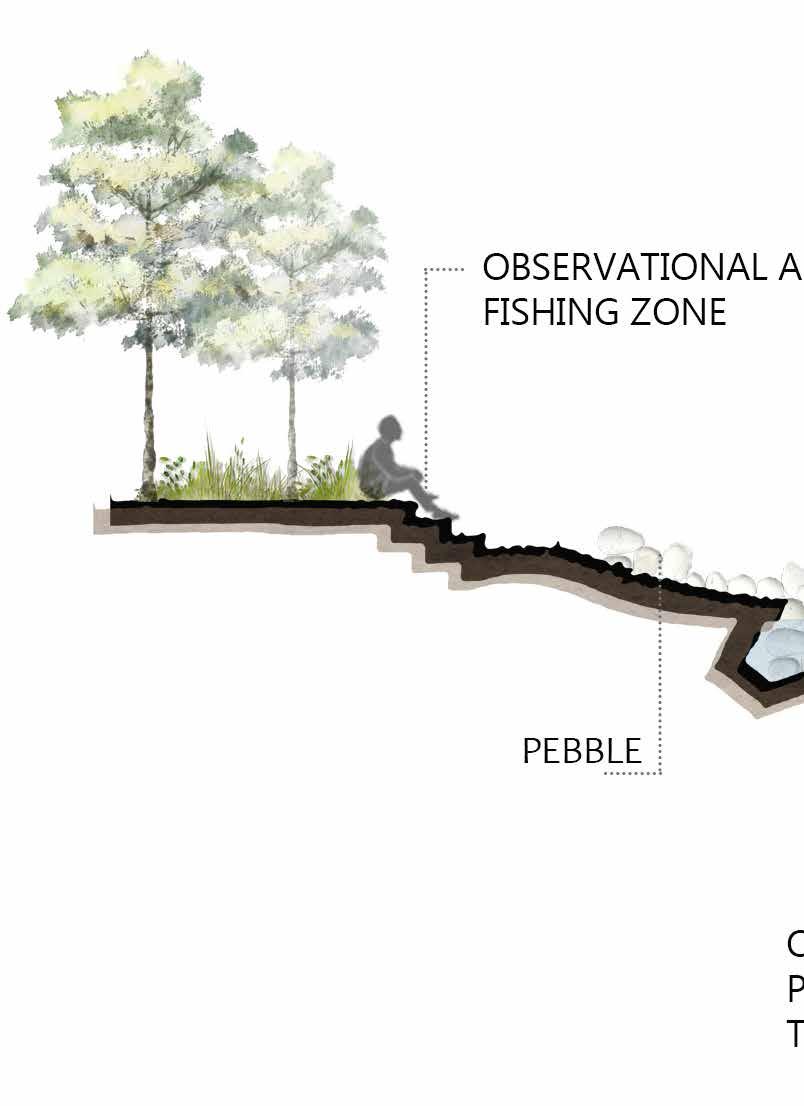
Figure 98
Activies around the canal - Biodiversity
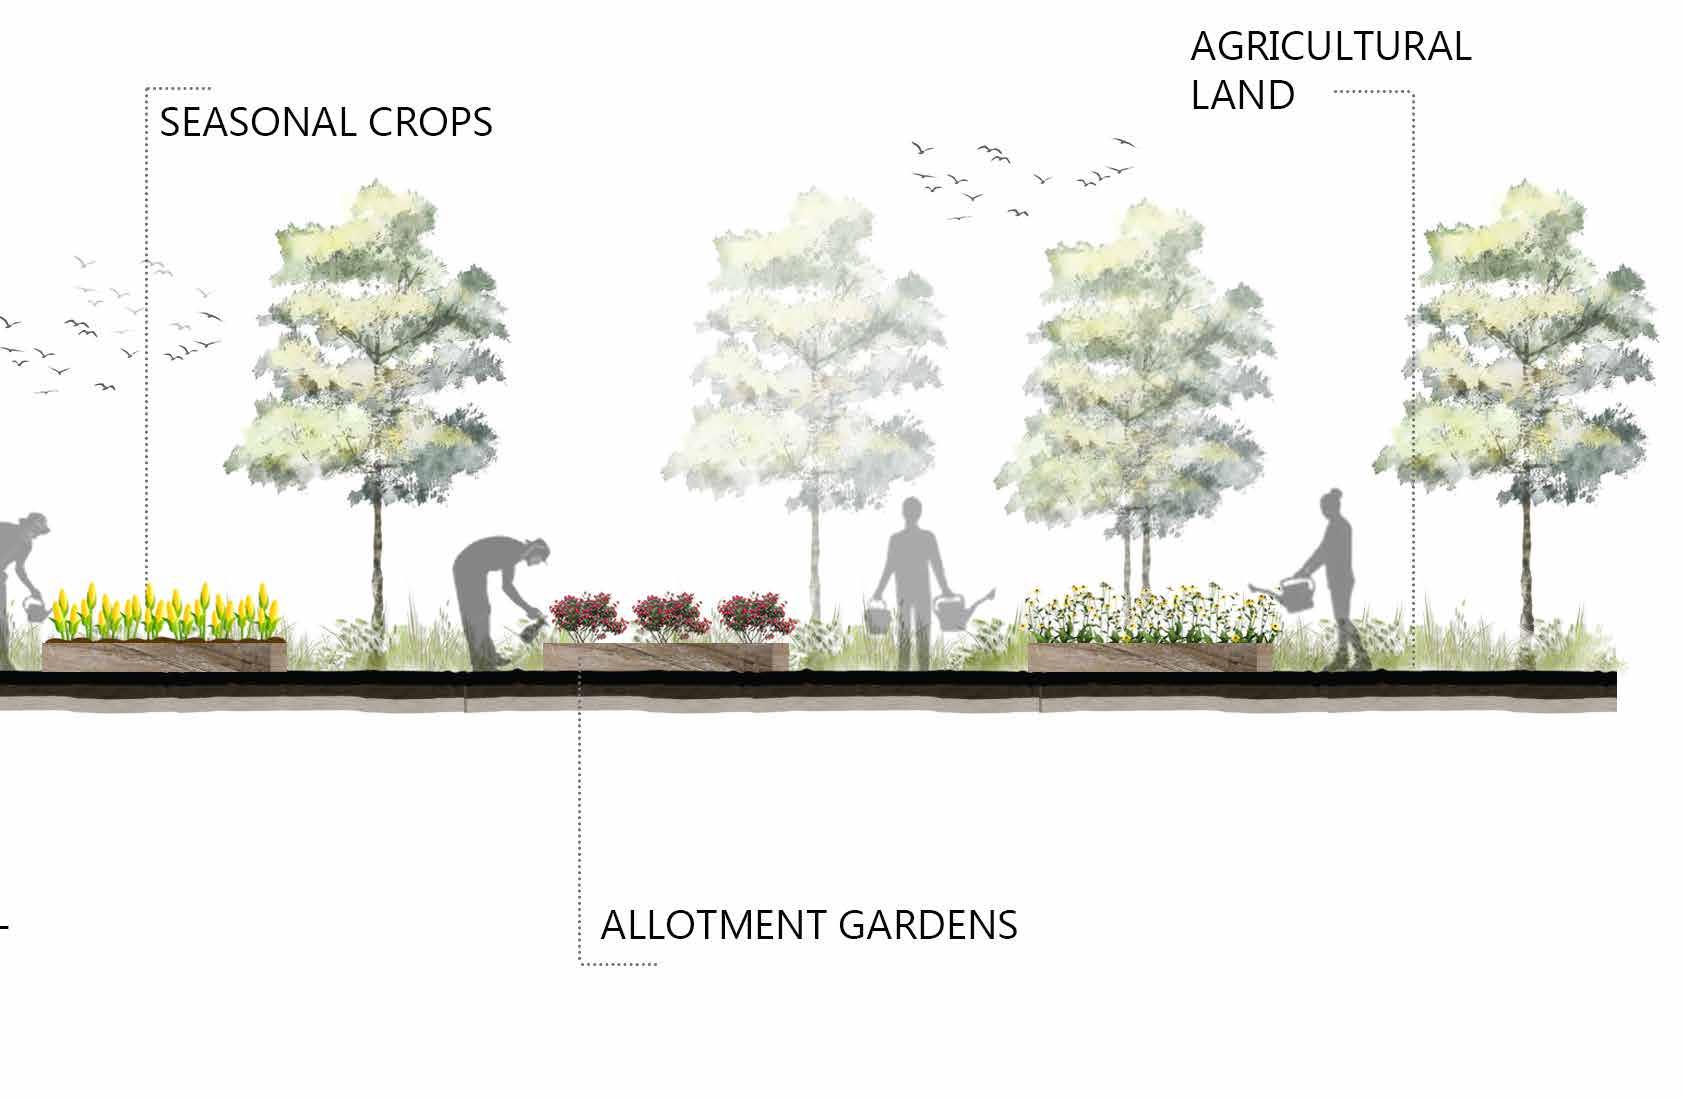
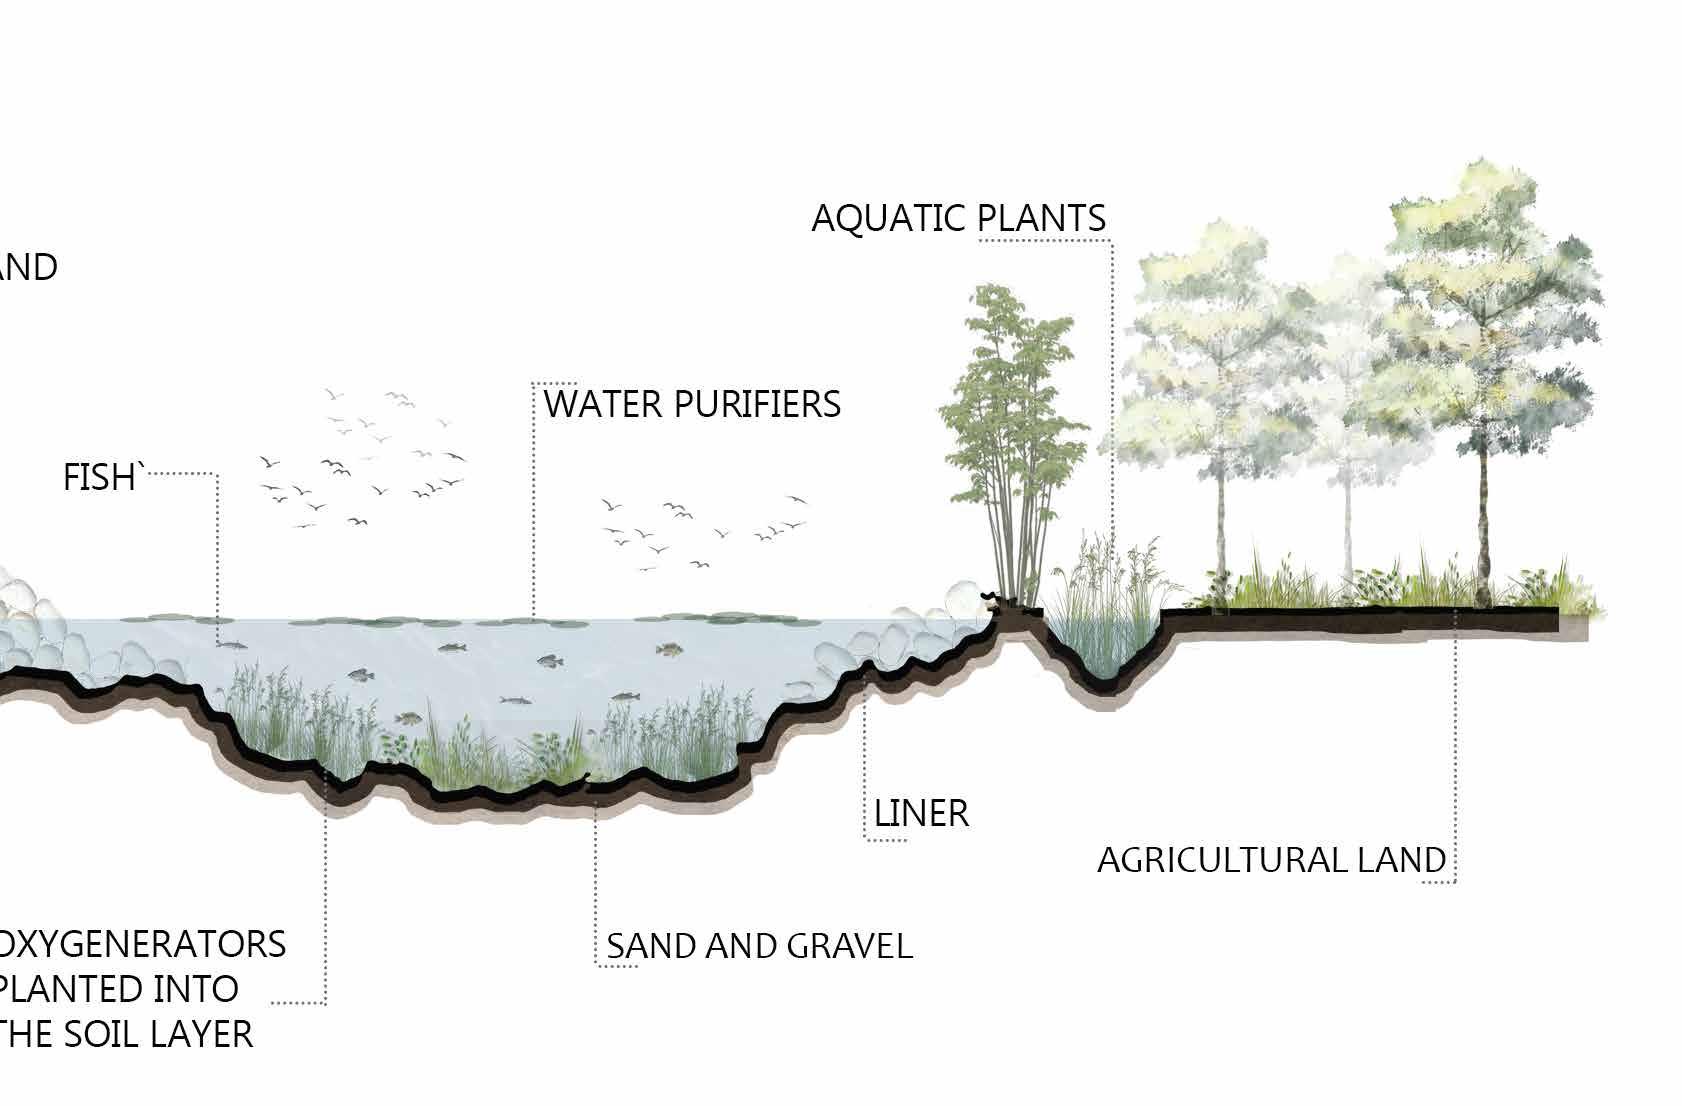 Figure 97 Allotment Gradens
 Figure
Axonometric - Upper section
Figure
Axonometric - Upper section
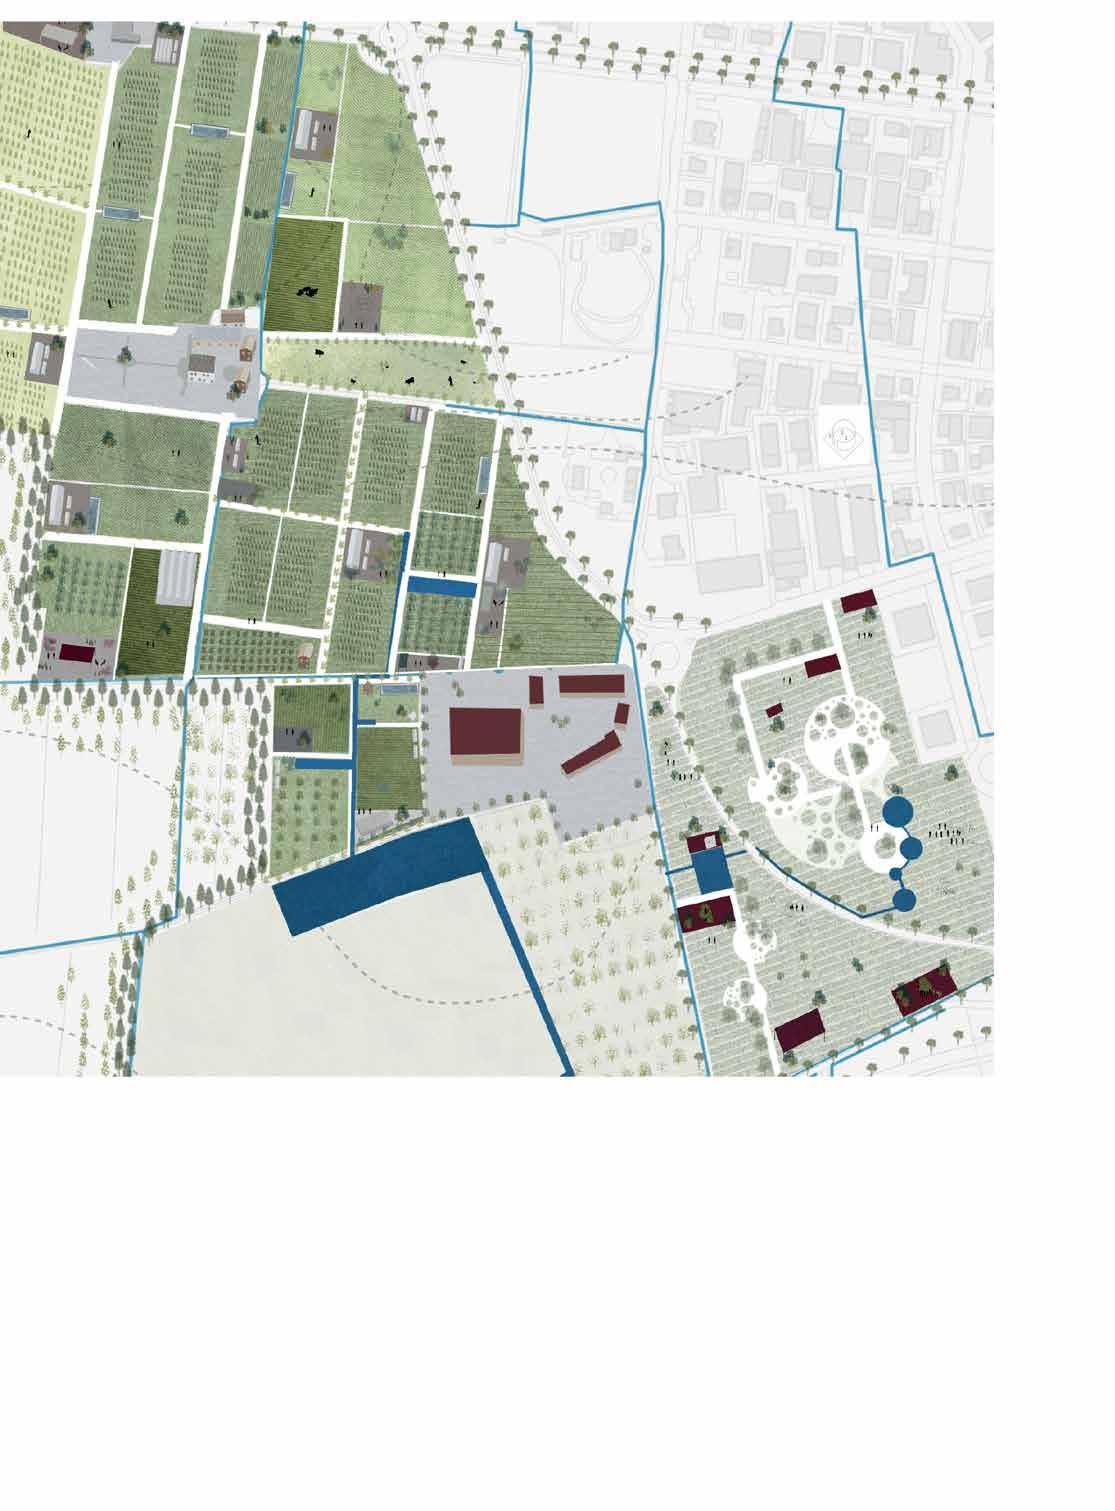
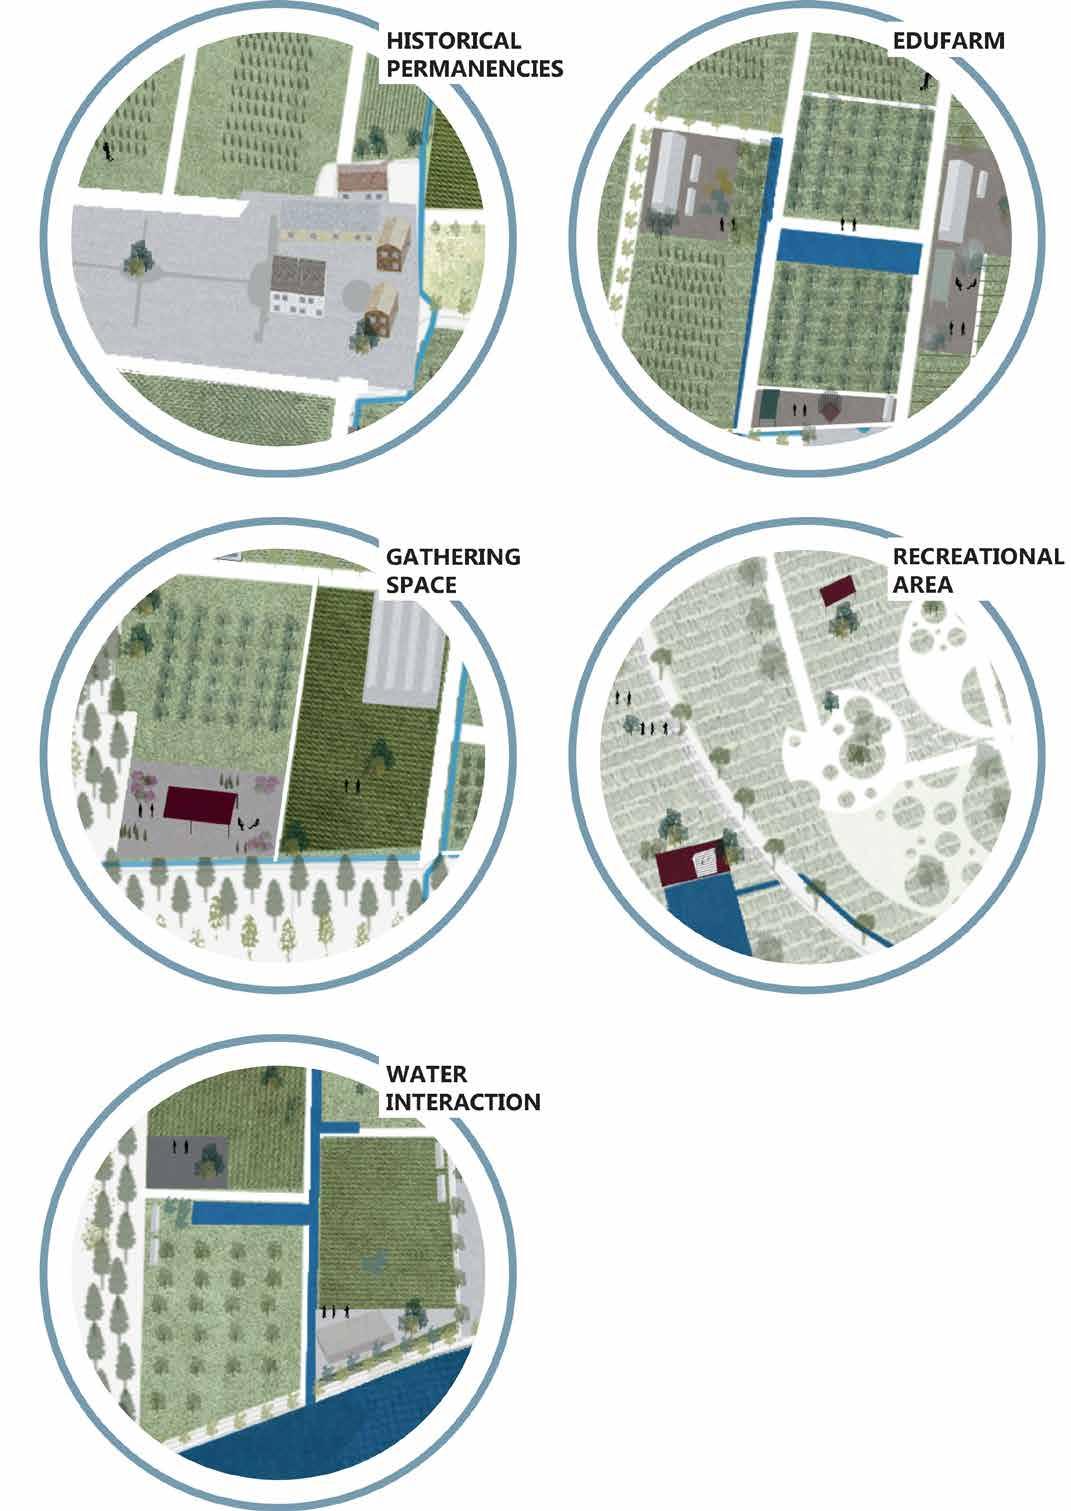
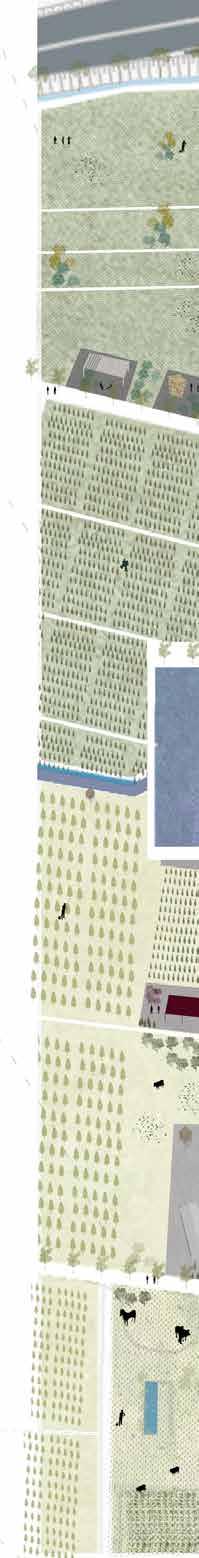
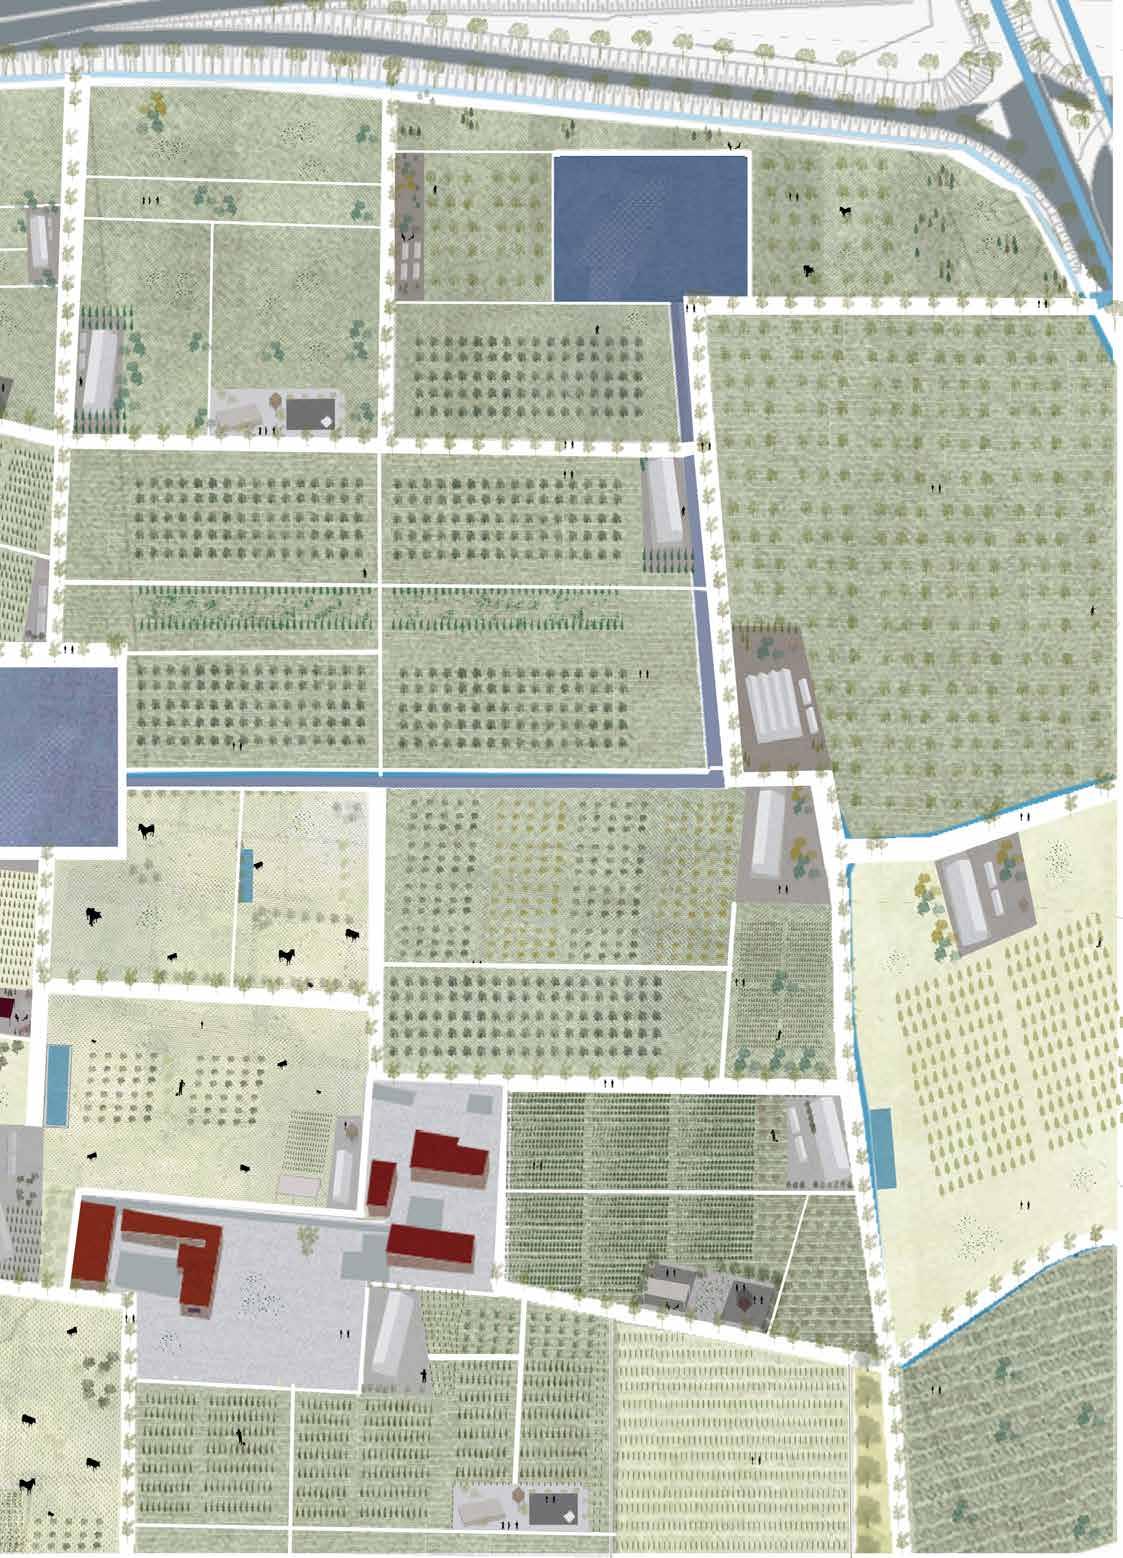
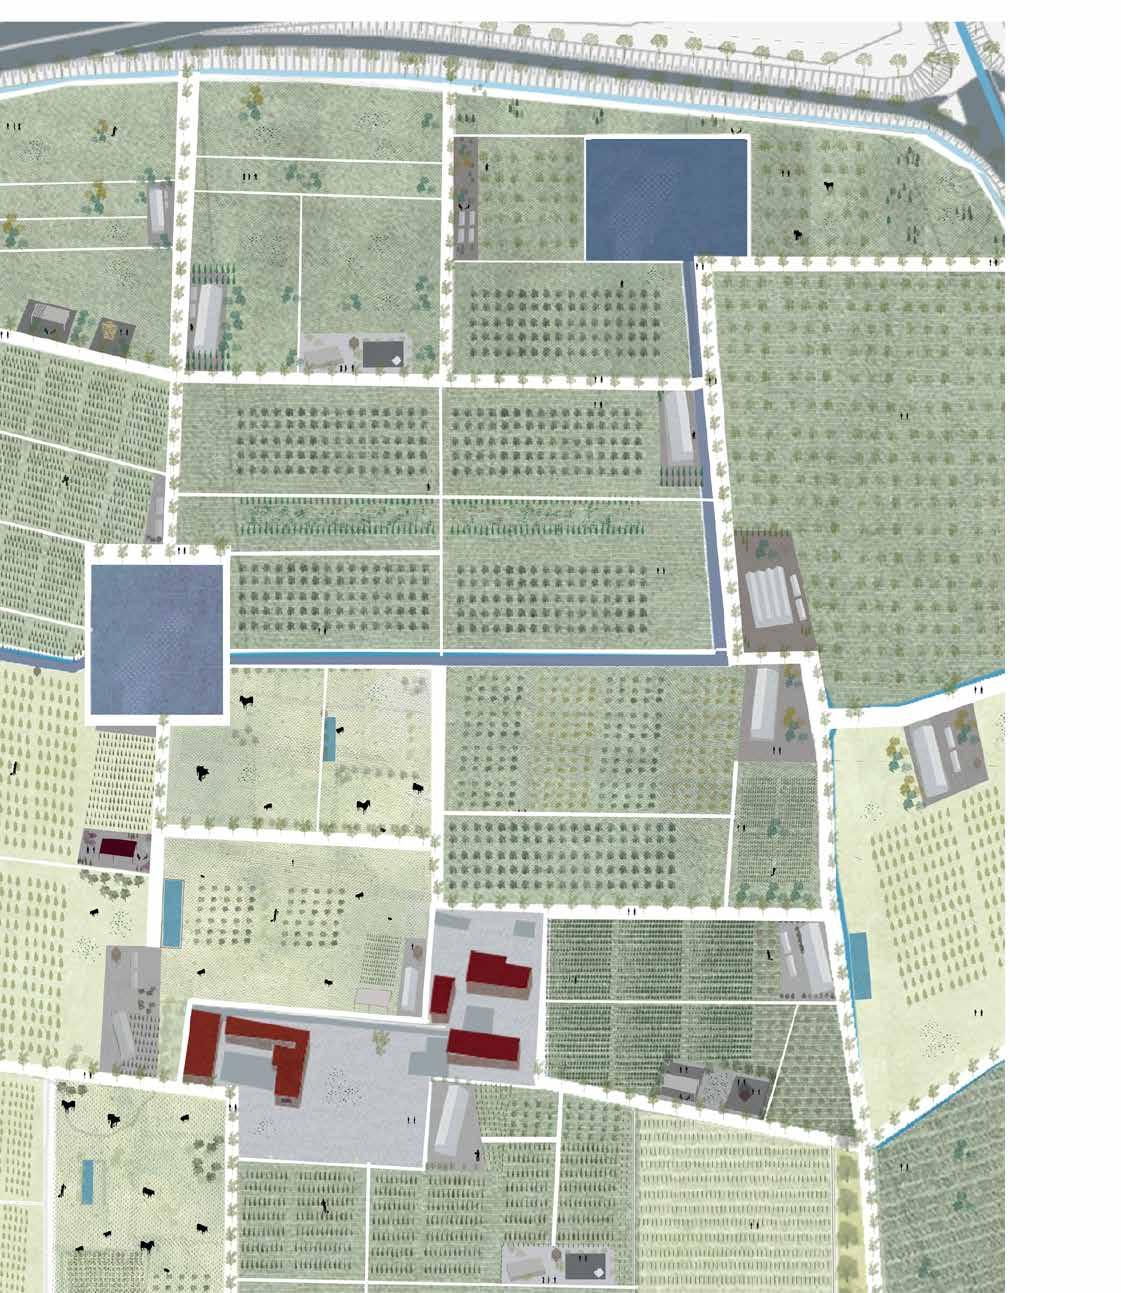
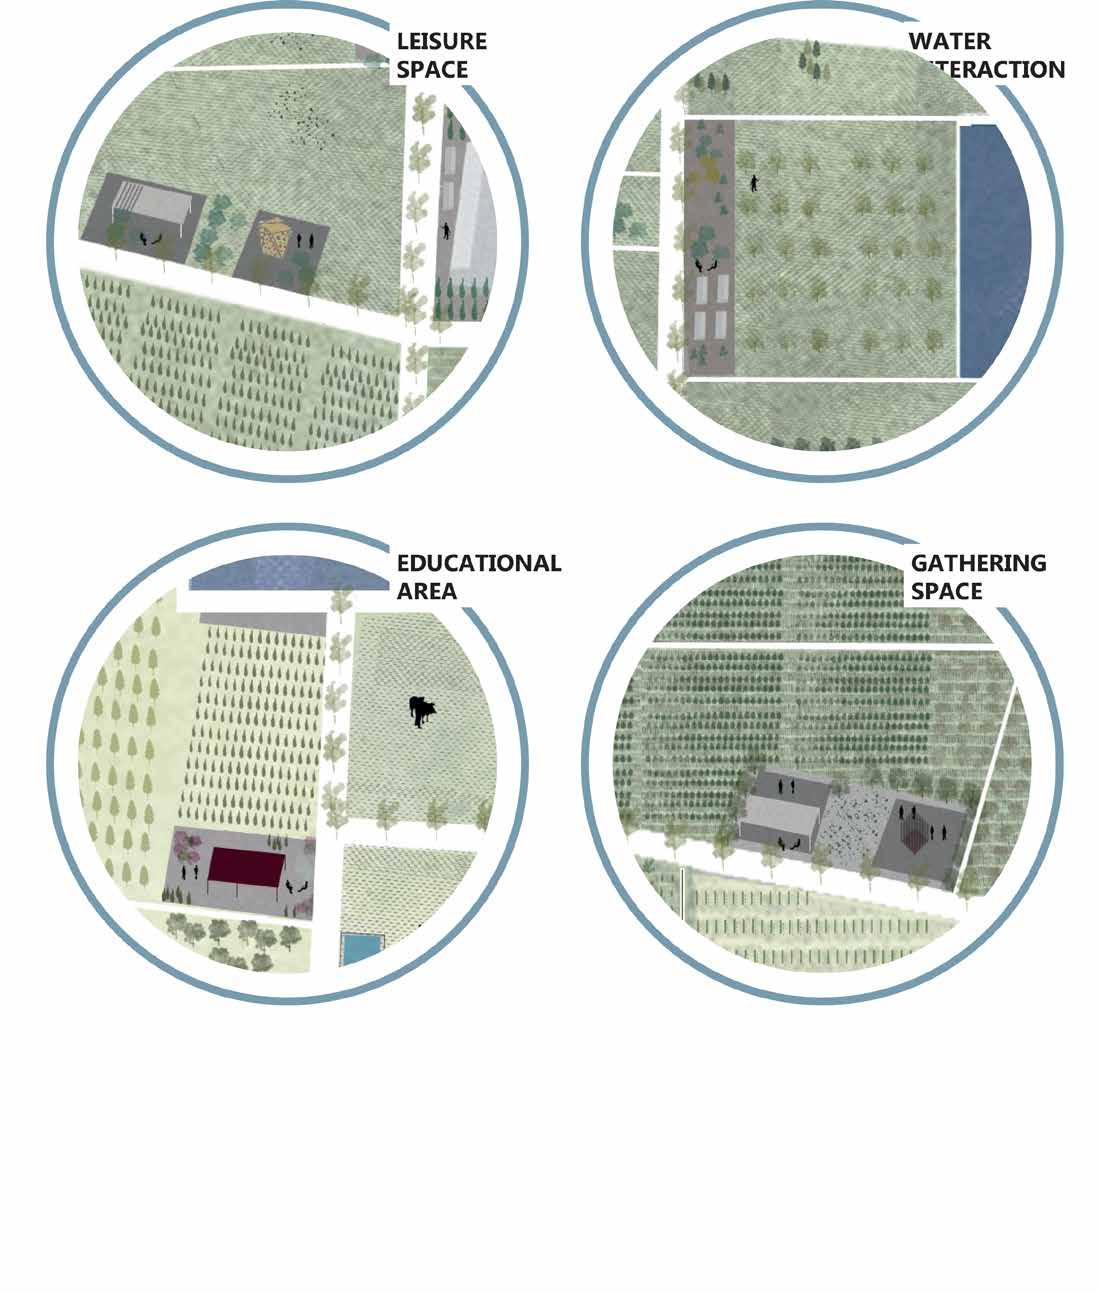
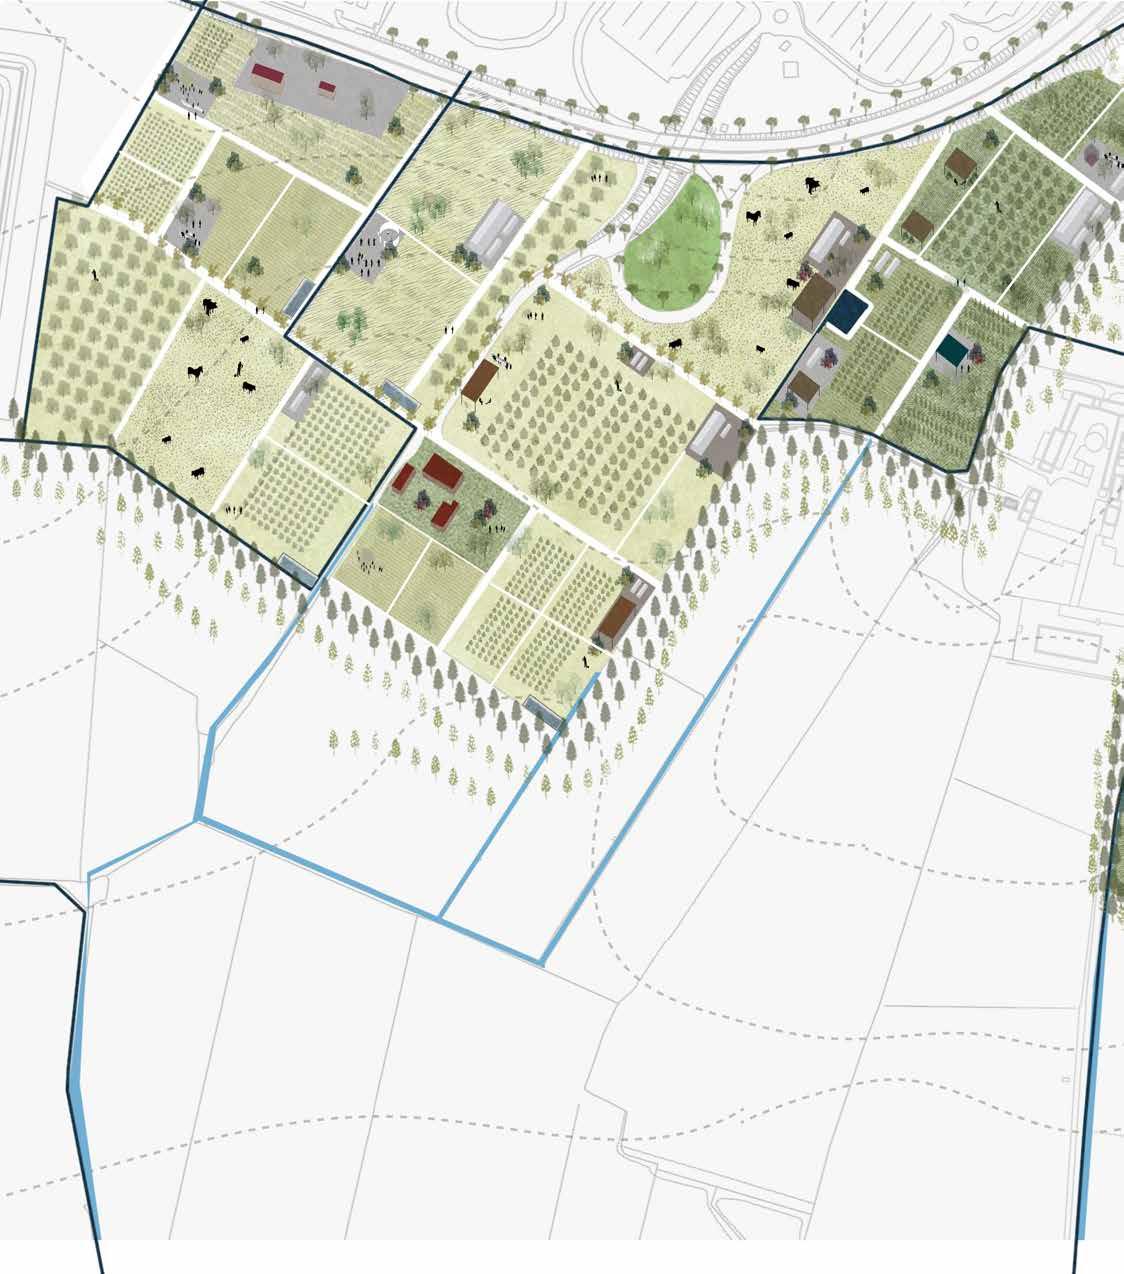
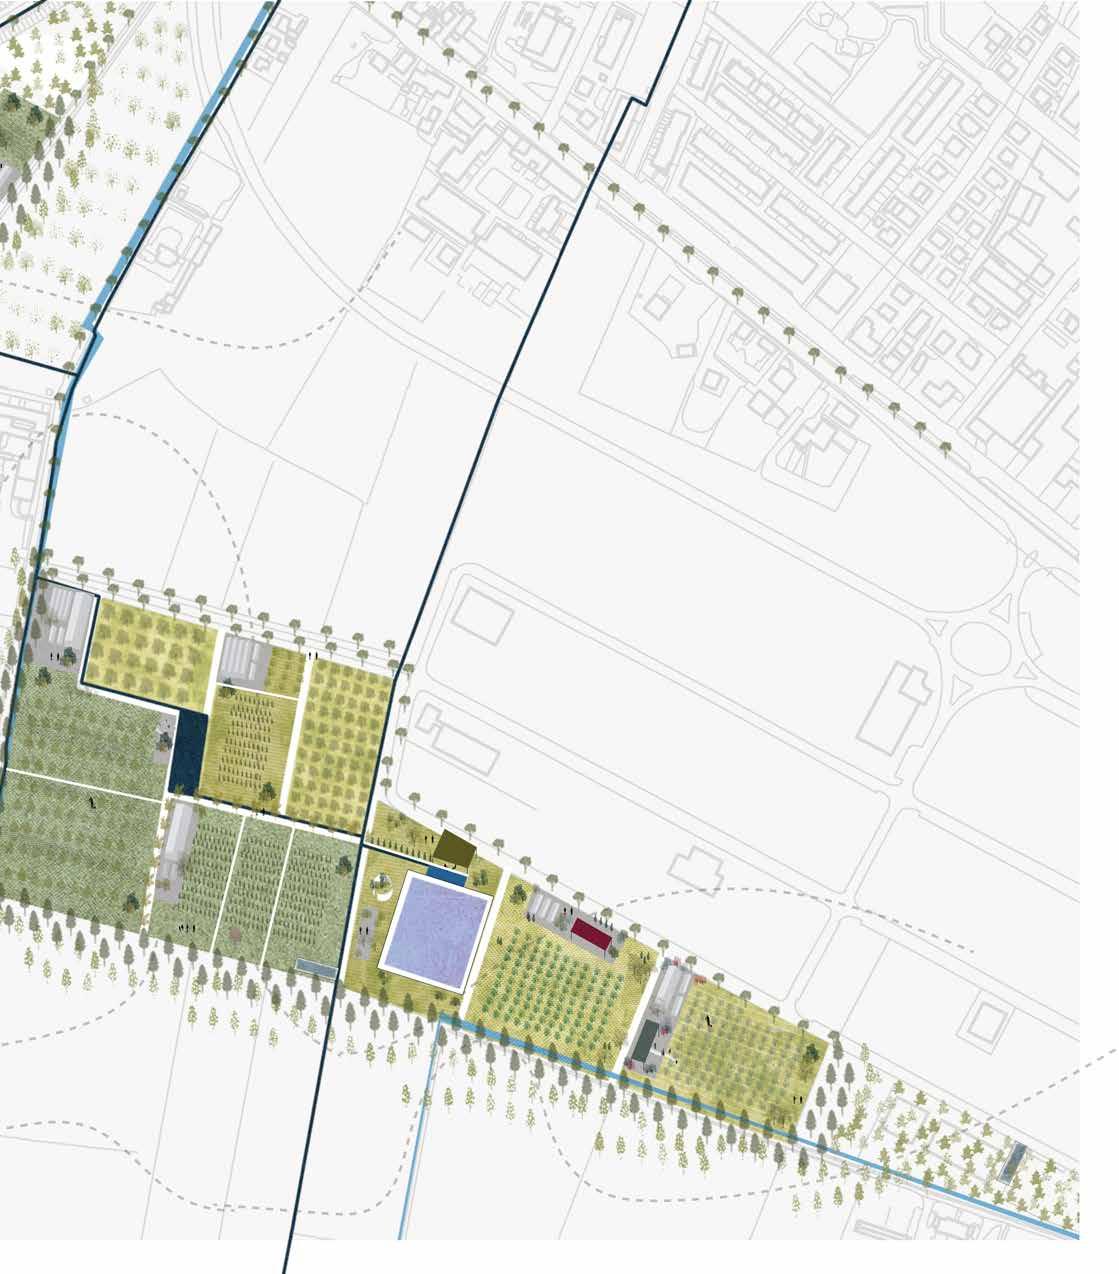 Figure 102
Axonometric - lower section
Figure 102
Axonometric - lower section
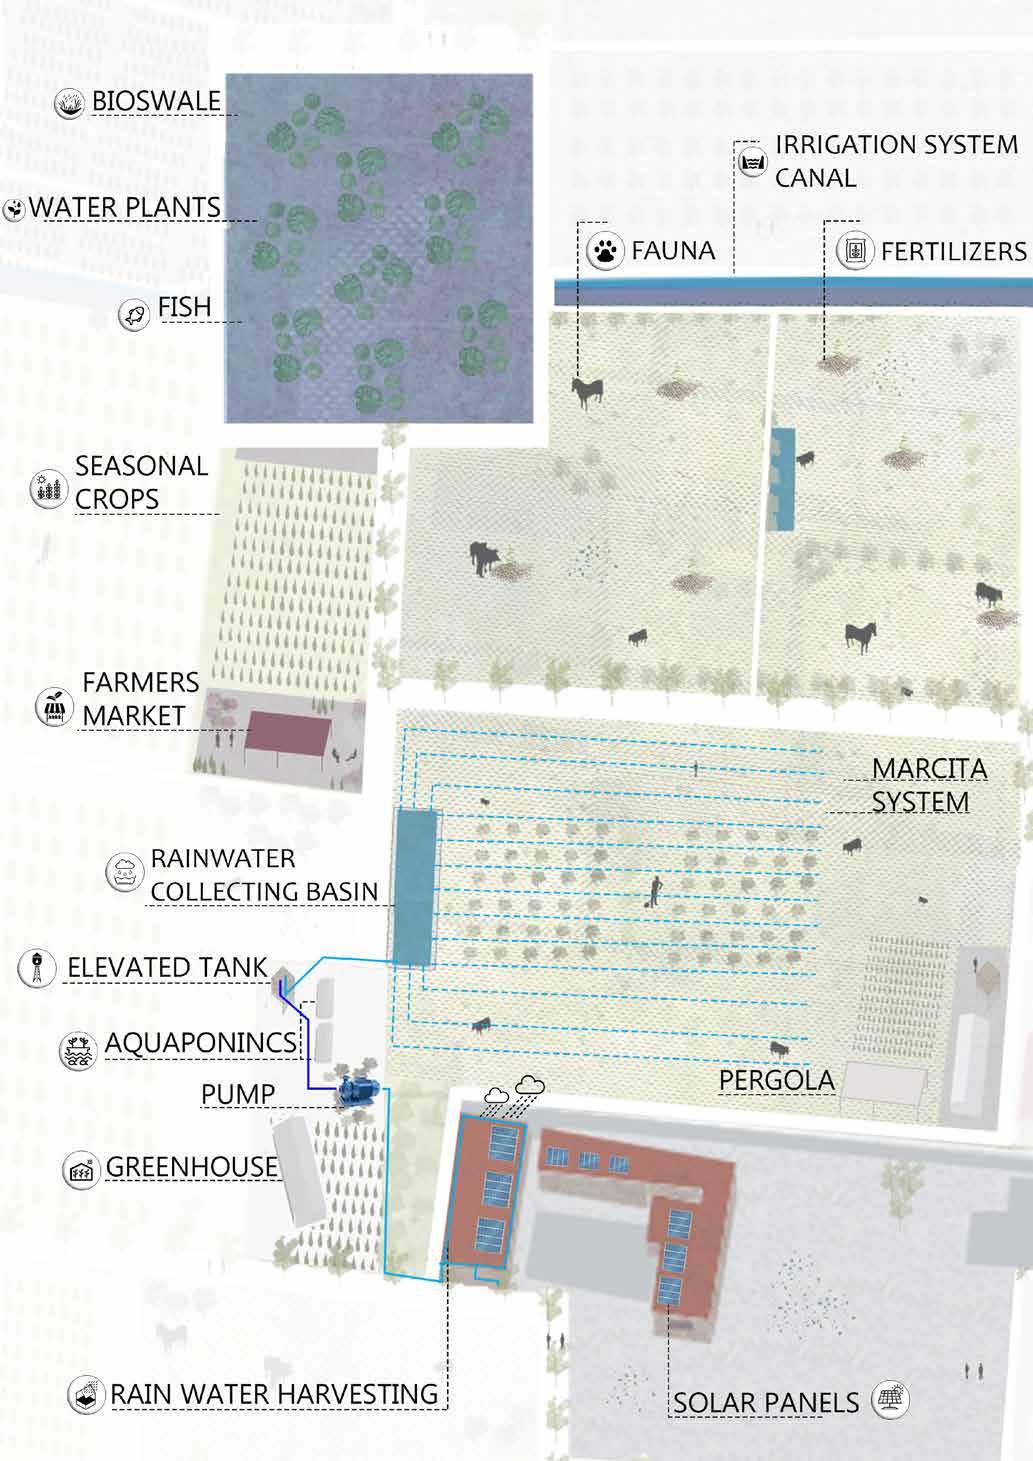
Rain water Harvesting system is dependent on the catchment of rainwater falling on the buil dings roofs and ground that is collected in the underground and elevated tanks, followed by pumping it towards our ca nals, greenhouses, aquaponi cs, drip irrigation system and all our buildings uses to les sen the demand on municipal systems. Adding that it helps in water management throu ghout the year that supply agricultural lands and buildin gs for use in dry seasons..
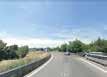
Figure 104
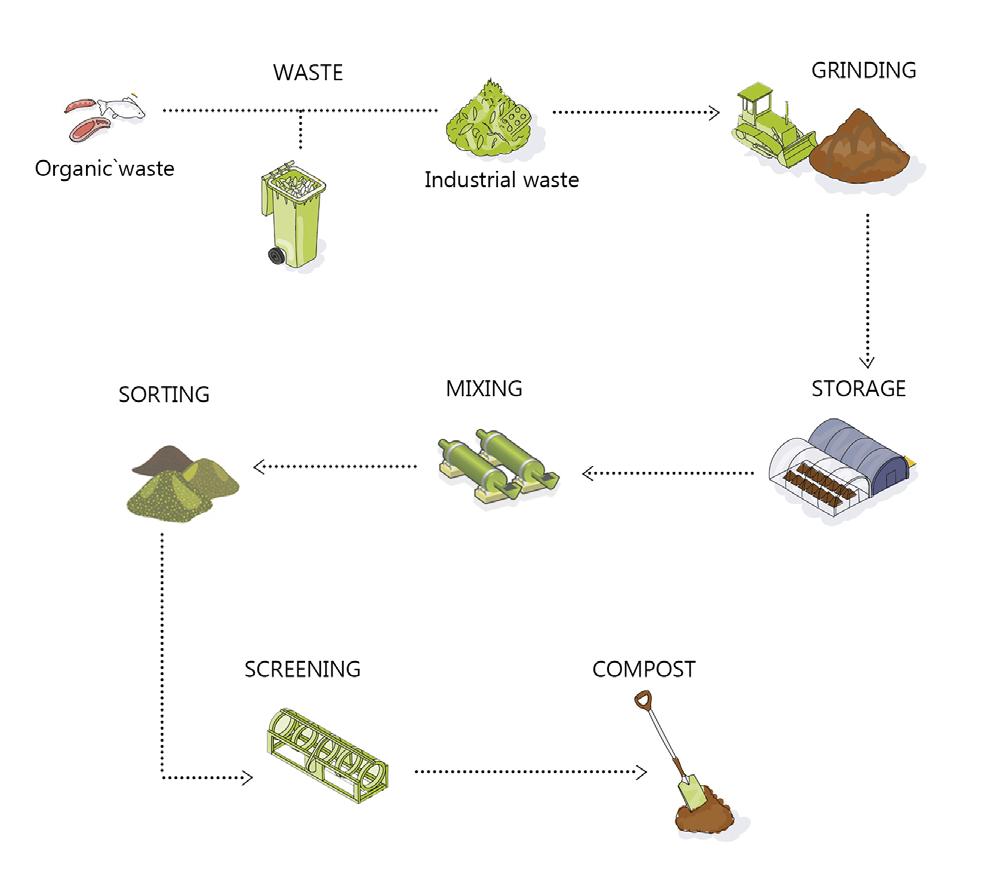
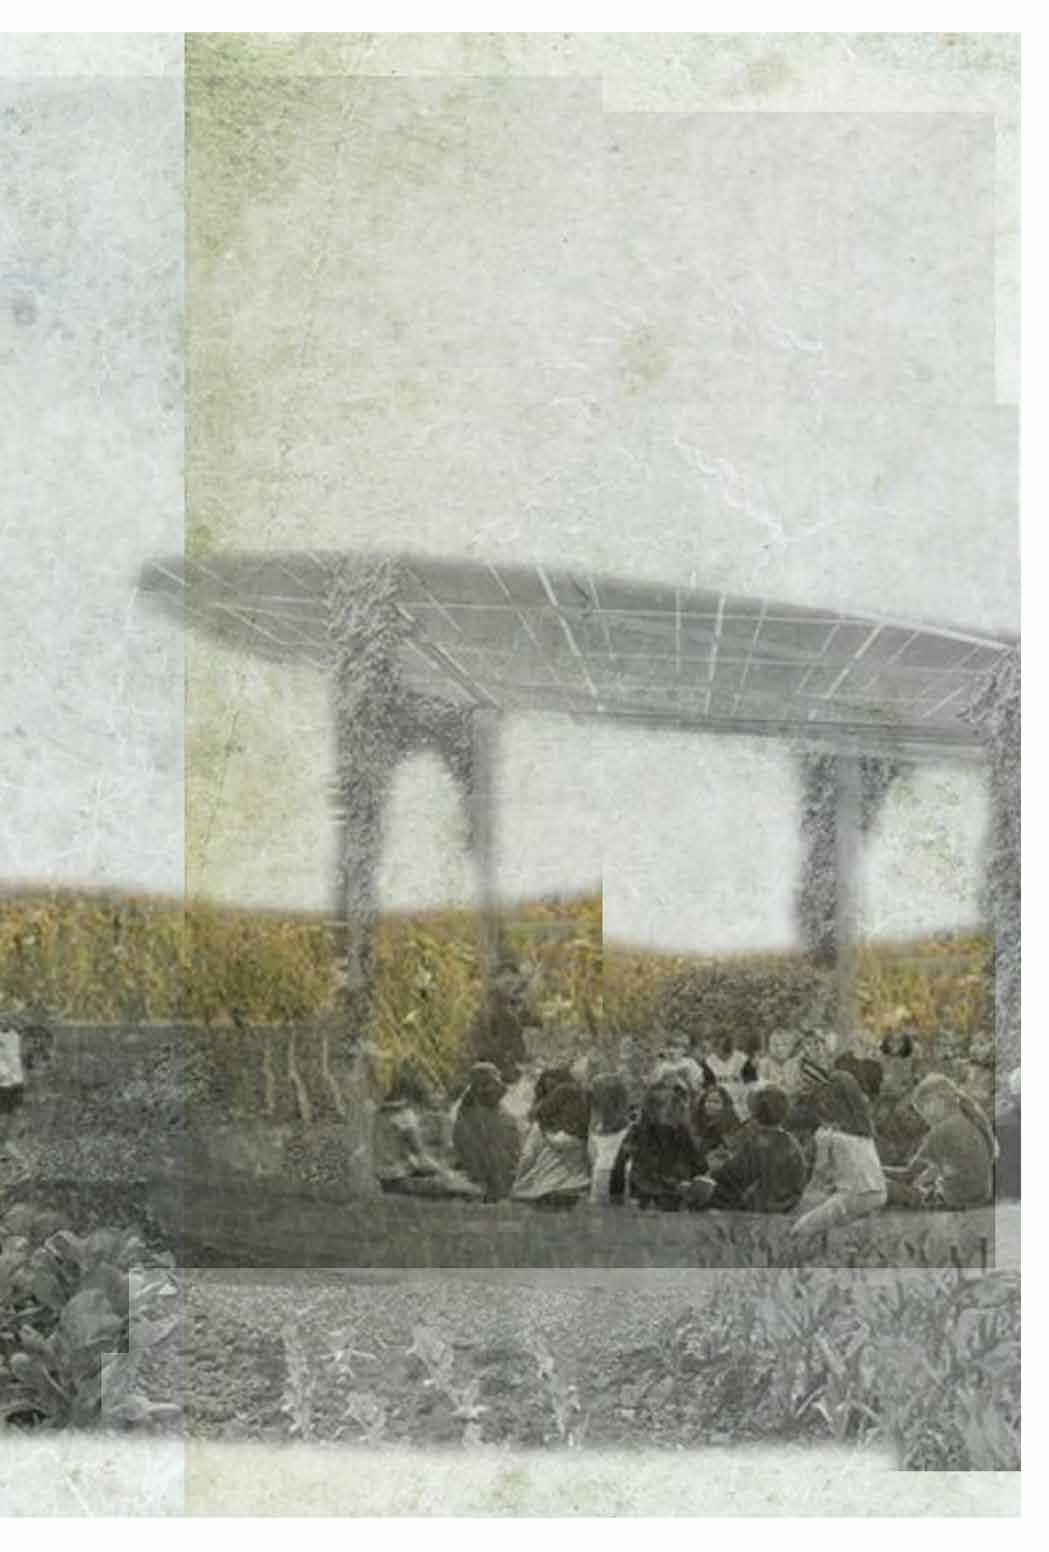
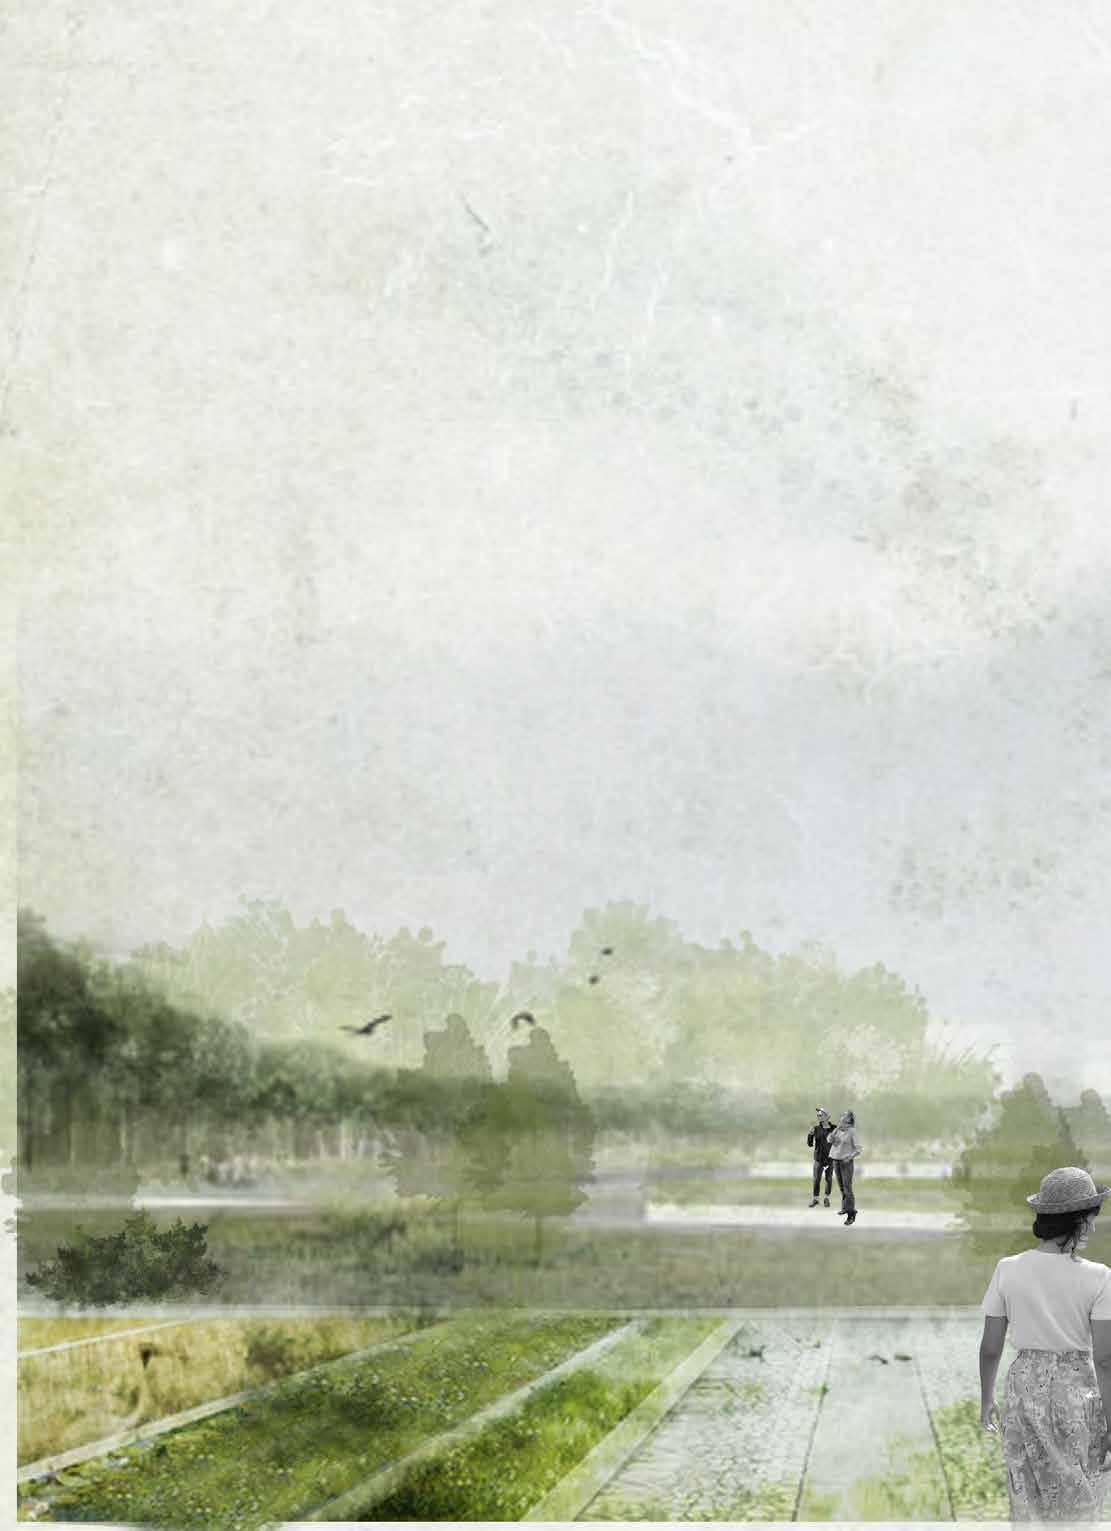
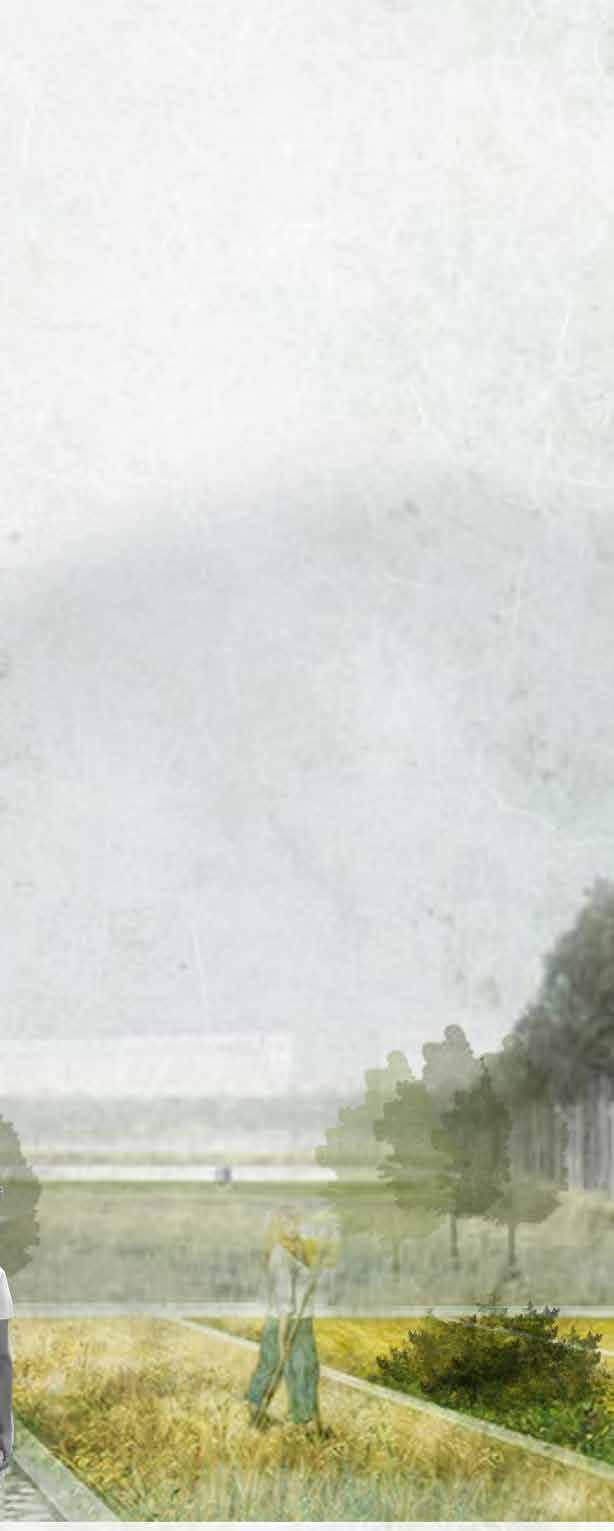
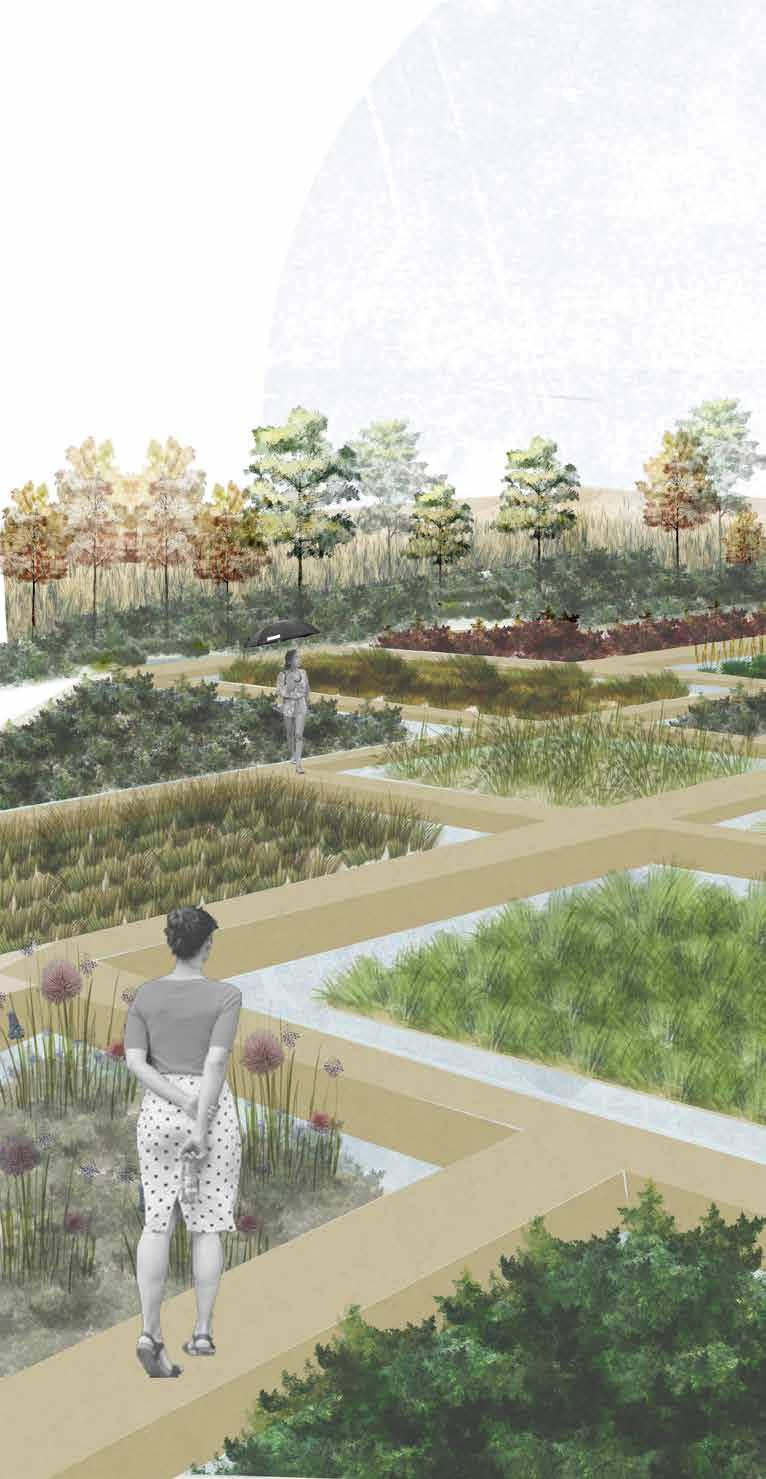
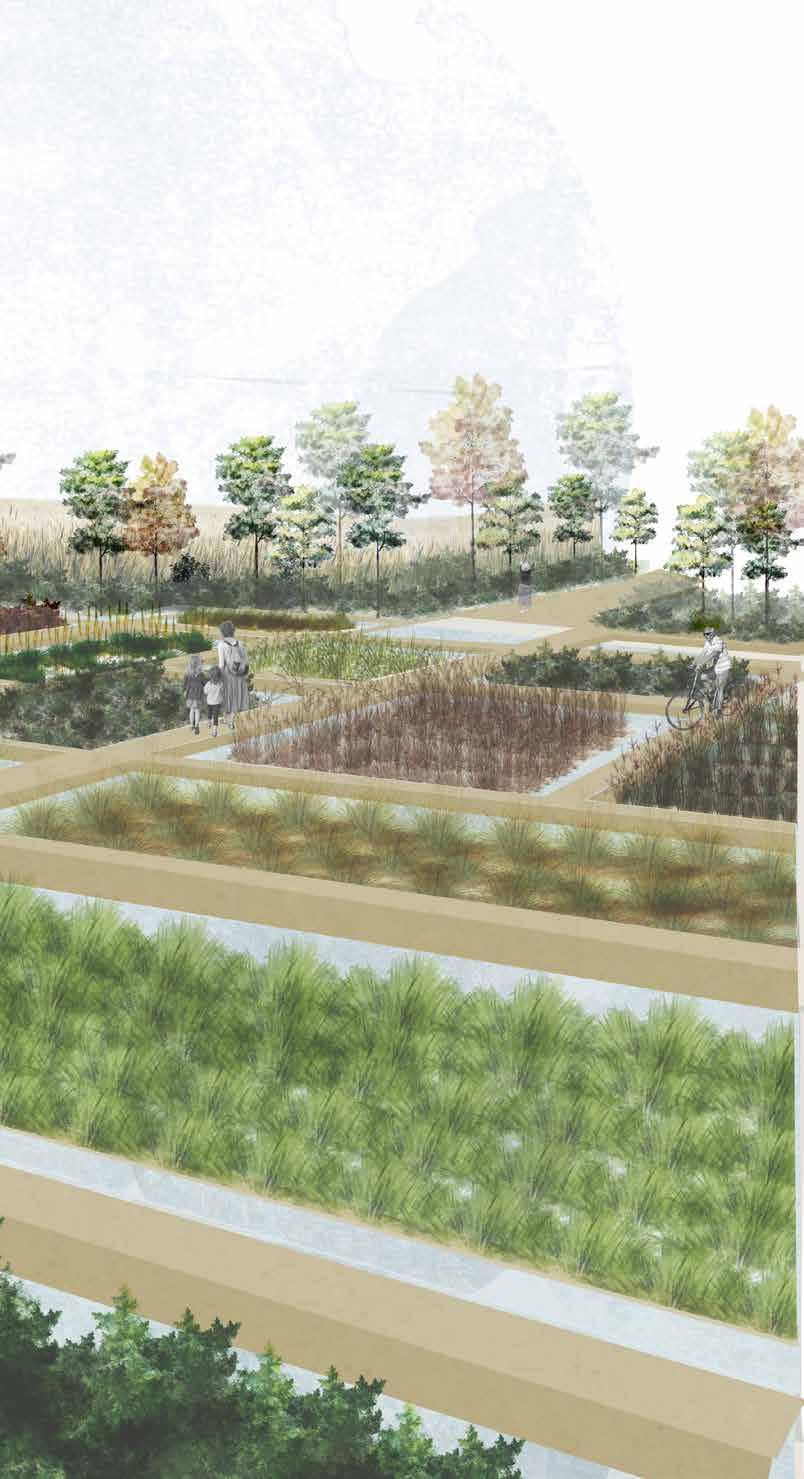
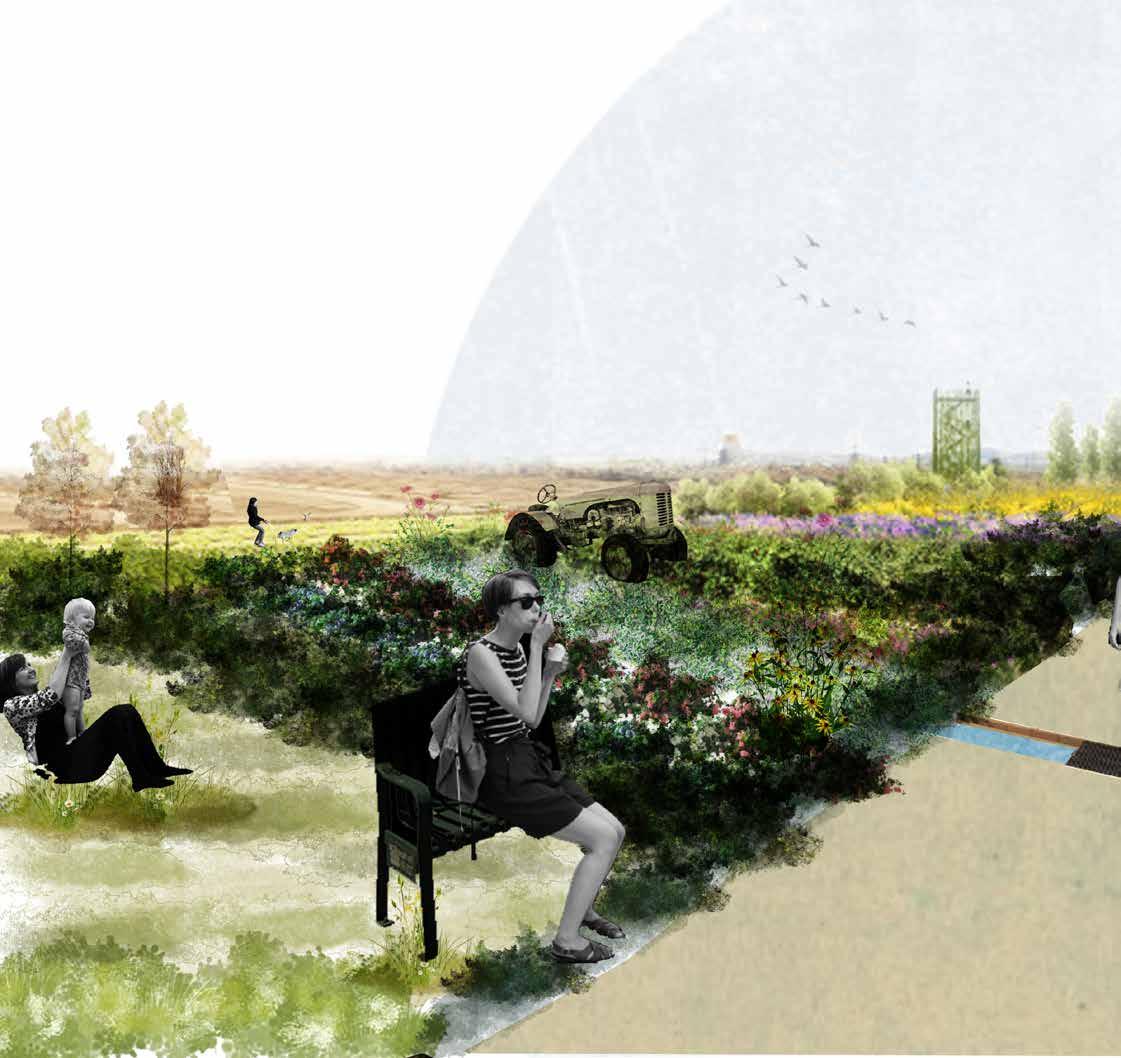
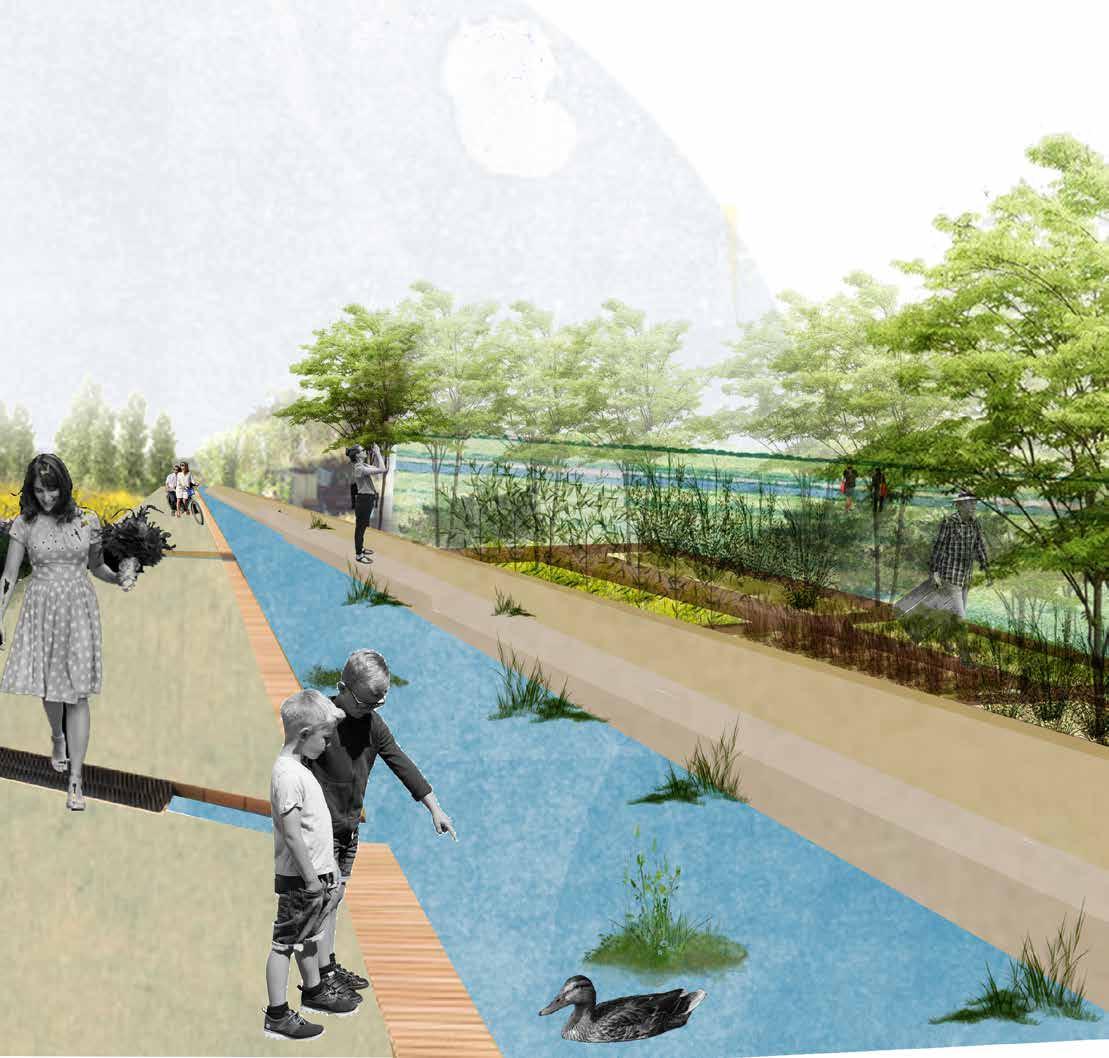
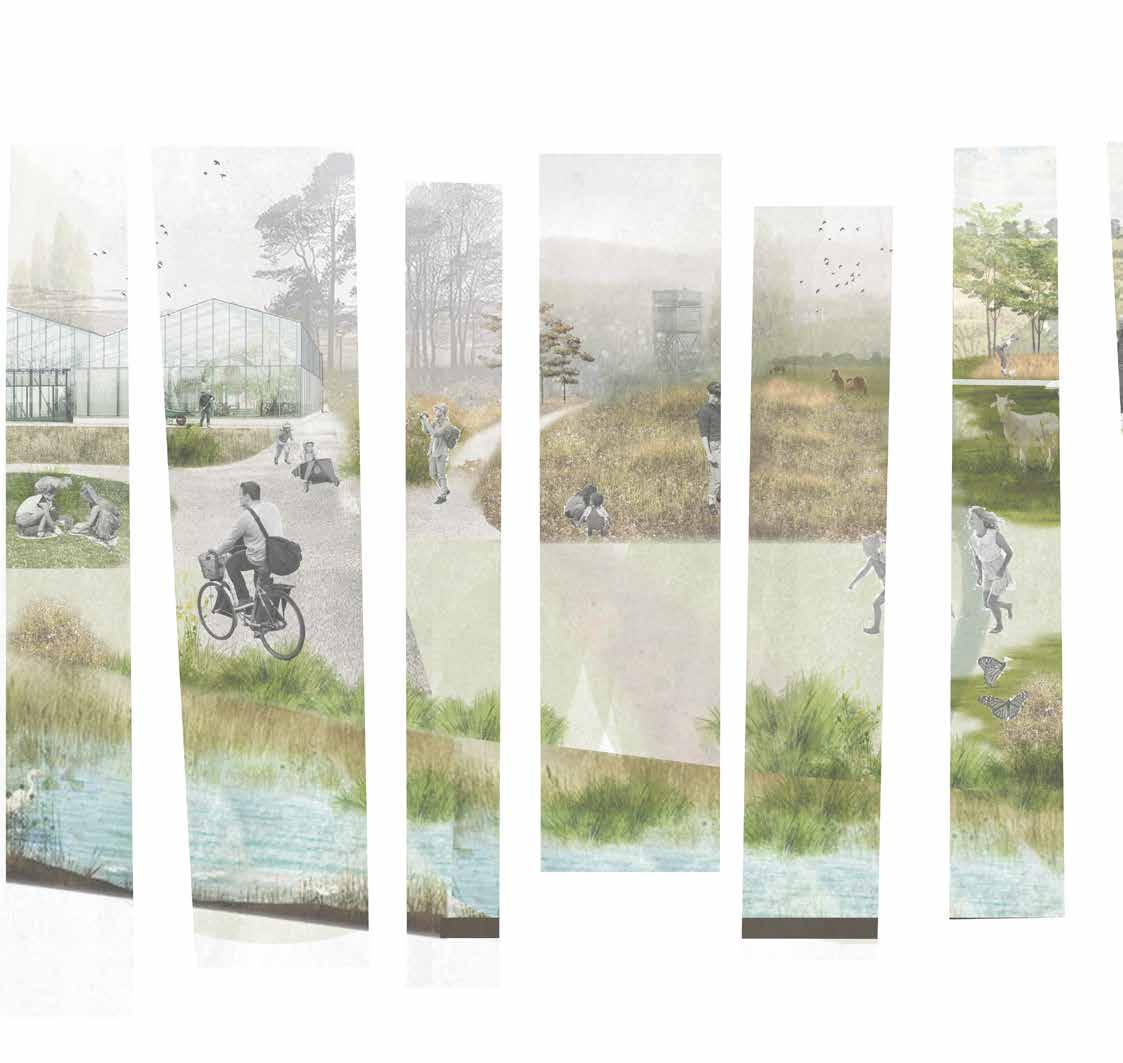
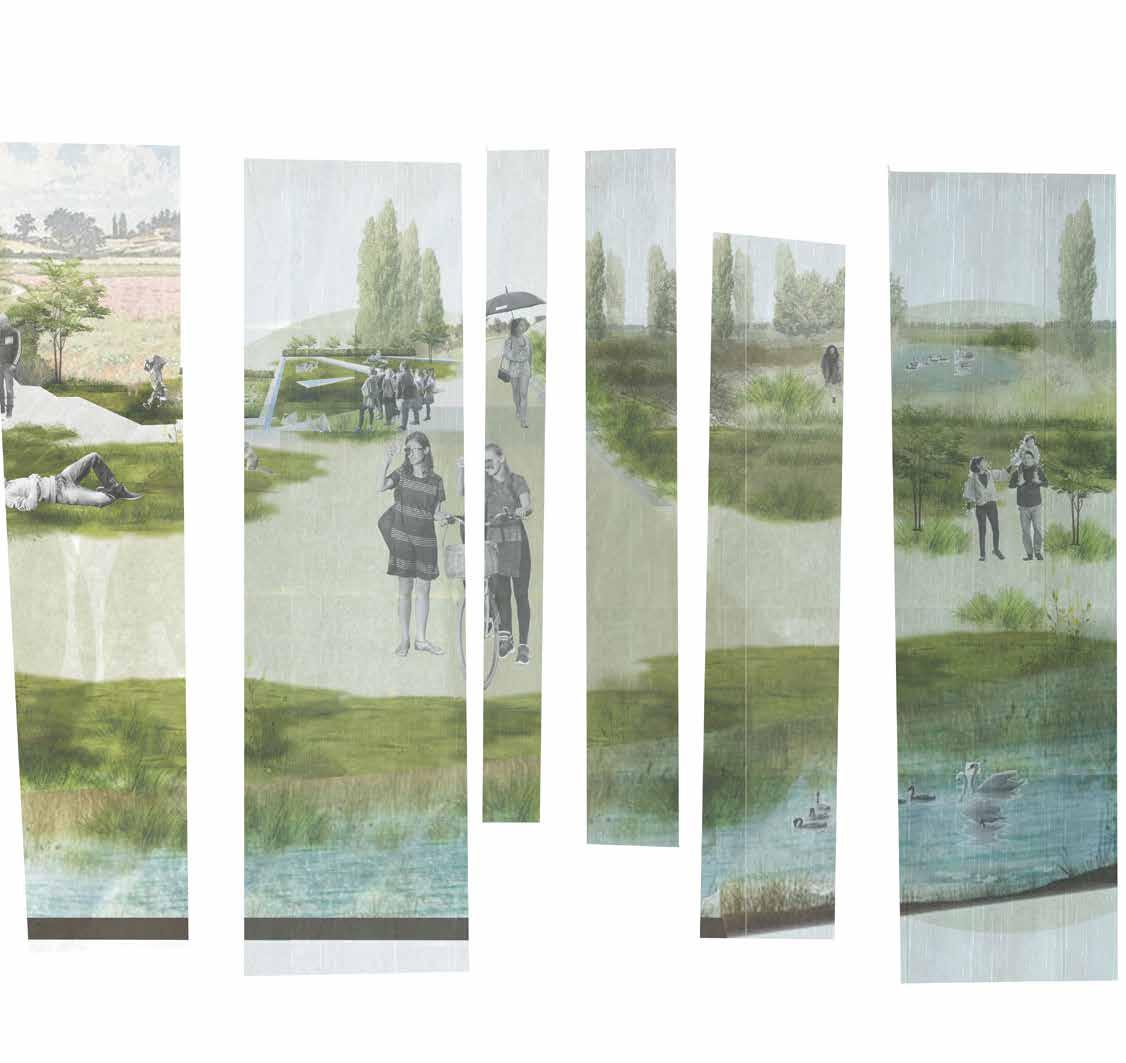
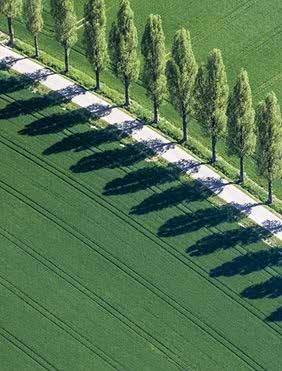
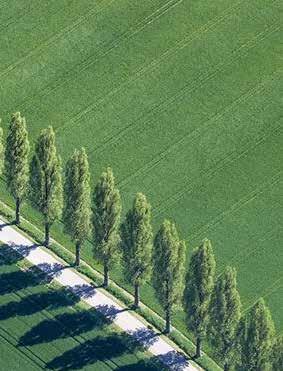
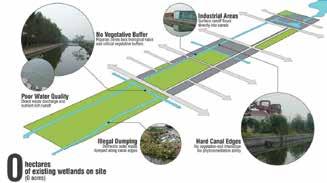
Image 1 Rural Infrastructure
Figure 2 Map of the Canal network in Paicenza
Figure 3 Map of Secondary roads in the rural areas of Piacenza
Figure 4 Map fo the vegetative elements selected.
Figure 5 Map of the Flood lines and protected Areas
Figure 6 Map of the crop distirbution in Piacenza
Figure 7 Map of the selected study area.
Figure 8 Diagram of the path of storytelling in Rural Piacenza
Figure 9 Diagram of the path of storytelling in Rural Piacenza
Figure 10 Diagram of the path of storytelling in City Center
Figure 11 Map of exisiting and proposed mobility.
Figure 12 Map of linking the missing mobility connections.
Figure 13Map of new startegy
Figure 14 Linking Strategy with casestudies
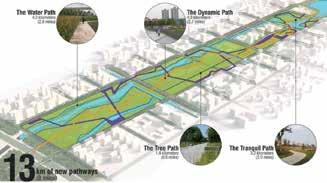
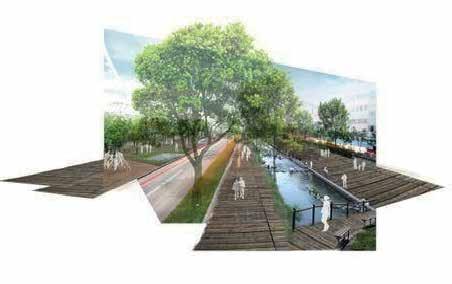
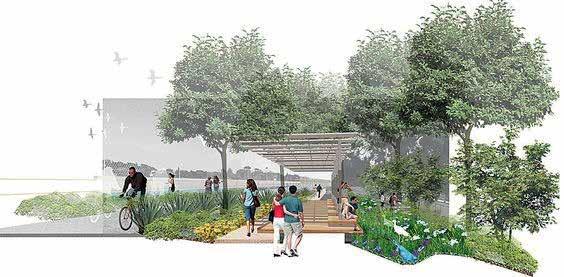
Figure 15 Images of new suggsted activites
Figure 16 Map of how to “bridge” to the new site.
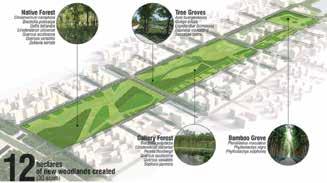
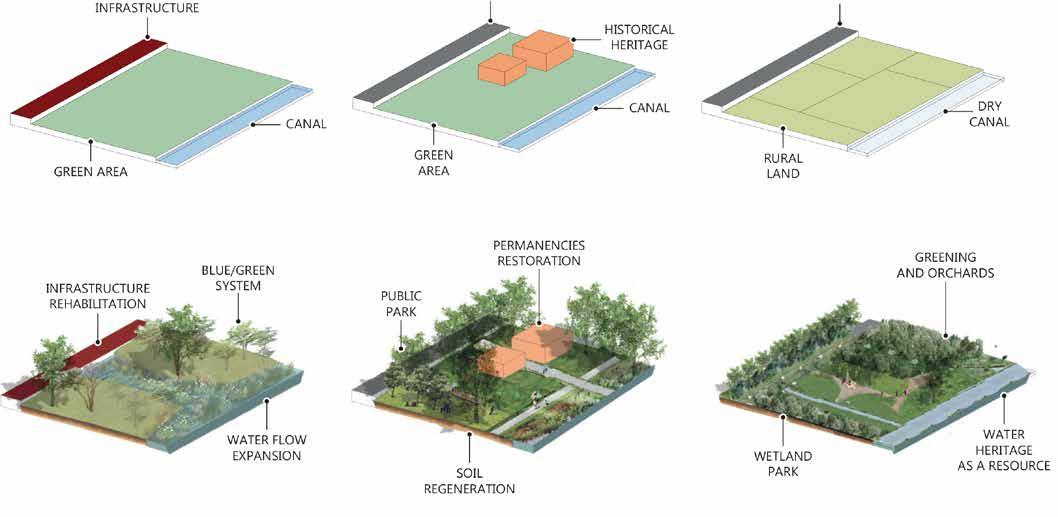
Figure 17 Diagram of Green Infrastructure
Figure 18 Suggested new typology of productive landscape
Figure 19 Diagram of how to reuse water on the site.
Figure 20 Map of the potential areas on site, Landuse.
Figure 21 Map of water and canal network in Piacenza.
Figure 22 Map of the Hydrology system proposal
Figure 23 Diagram of replanting strategy
Figure 24 Water reclaimation process
Figure 25 Belt Sketch
Figure 26 New Typologies
Figure 27 Land expansion Diagram
Figure 28 Visions of Land / Infrastructure interaction with the Blue
Figure 29 New Land Functions
Figure 30 Sections showing new land dynamics
Figure 31 Green Layer of the Concept Map
Figure 32 Blue Layer of the Concept Map
Figure 33 New Water Green Concept
Figure 34 Section showing the subsurface wetlands
Figure 35 Views to show the process of how to regain native habitat
Figure 36 Sections to show the different landscape experinces
Figure 37 Sections to show the different landscape experinces
Figure 38 Sections to show the different landscape experinces
Figure 39 Sections to showing the Regenration activites
Figure 40 Sections to showing the water mechanisms
Figure 41 New suggested Land Typologies
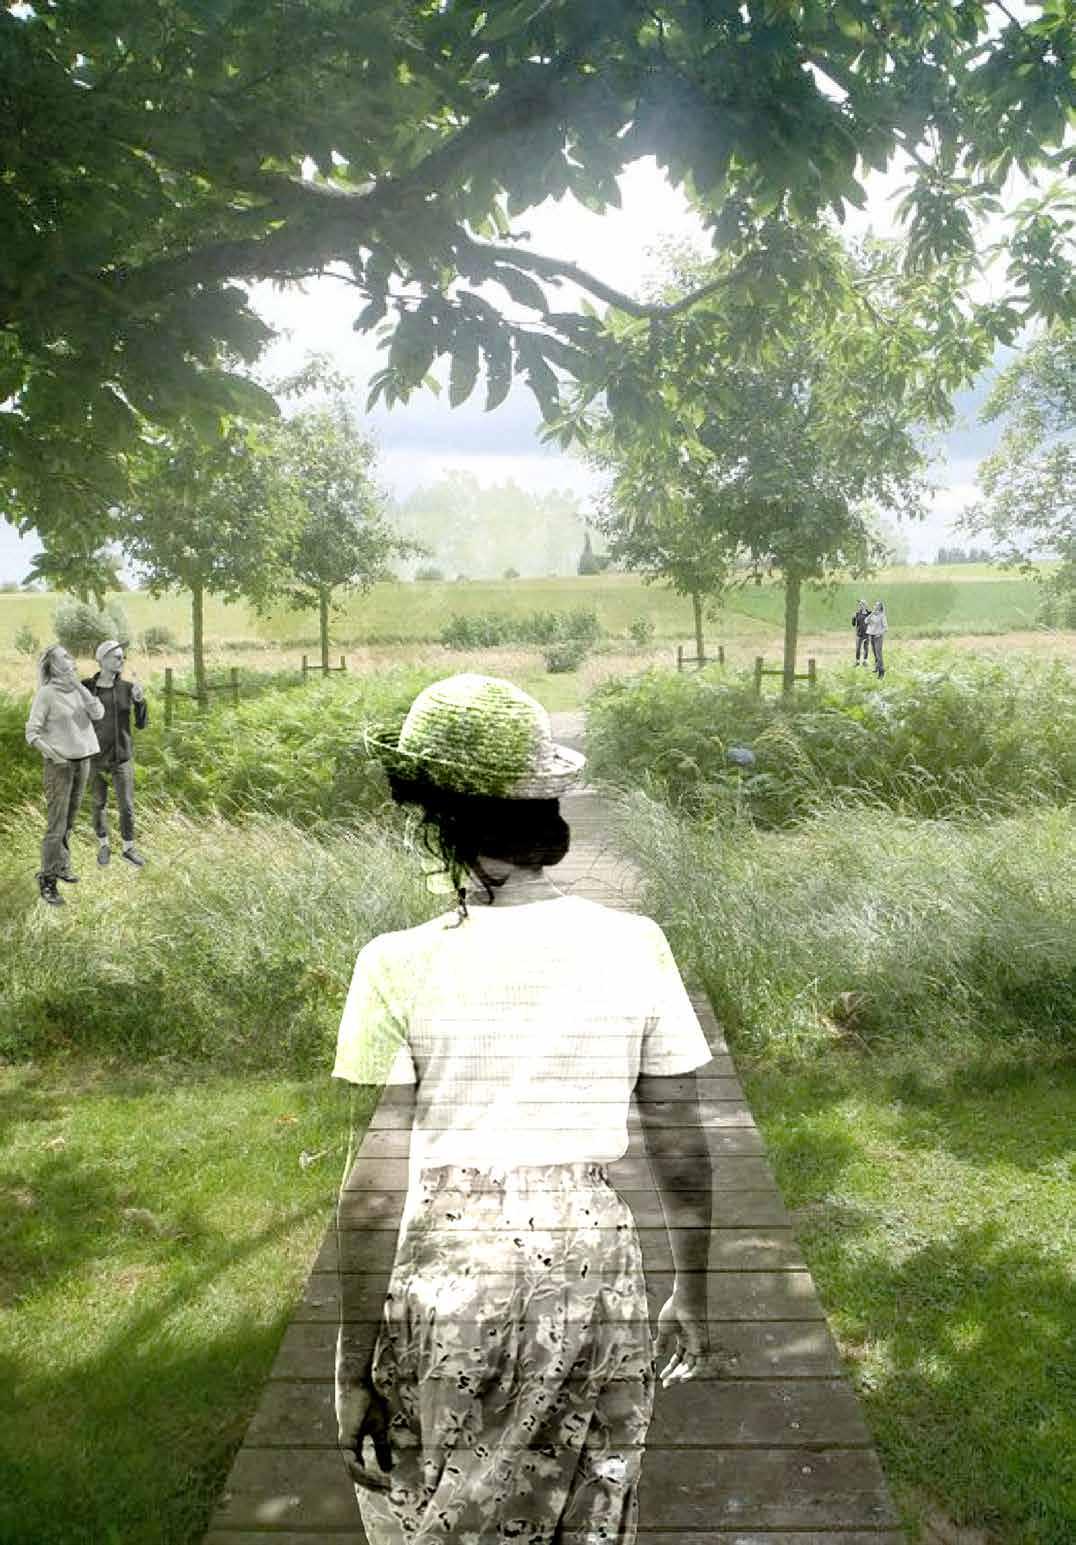
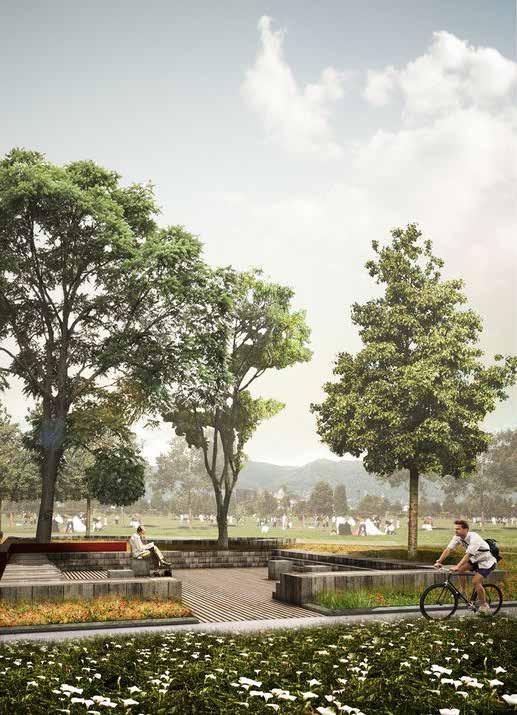
Figure 42 Map of Drought in Emilia Romagna
Figure 43 Map of Drought in PC
Figure 44 Map of SPEI (Standardized Evapotranspiration Precipitation
Figure 45 Map of SPI (Standardized Precipitation Index
Figure 46 Map of Available groundwater
Figure 47 Map of abnormality of the hydro-climatic balance
Figure 48 Table of the levels of Rain in Piacenza
Figure 49 Table of the average number of rainy days in Piacenza
Figure 50 Projection of Rainfall in Piacenza
Figure 51 Diagrams of the rainfall levels in Piacenza
Figure 52 Map of Flood Levels
Figure 53 Image of flood event near Po River
Figure 54 Image of flood event in Val Terbbia
Figure 55 Diagram of the Ecological Corridor
Figure 56 Diagram of the Ecological Corridor synergy
Figure 57 Map of the exisiting water system
Figure 58 Map of the irrigation Canals
Figure 59 Diagram of Methdology .
Figure 60 Water in Summer
Figure 61 Water in with light rain
Figure 62 Water in with Heavy Rain
Figure 63 Water in with Flooding - Low risk
Figure 64 Water in with Flooding - High risk
Figure 65 Water purfication system
Figure 66 Diagram of crop division before the intervention
Figure 67 Crop division after intervention
Figure 68 Canals during summer season
Figure 69 Canals during the flood season
Figure 70 New Canals layout
Figure 71 Flood Defense System
Figure 72 Drip Irrigation System
Figure 73 Water Harvesting System
Figure 74 View of the masterplan
Figure 75 Map of the city dynamics
Figure 76 Map of the seasonal crops
Figure 77 Map of the Water system and connection
Figure 78 Suggested spaces by the intervention
Figure 79 Greenhouse and Aquaponics addition
Figure 80 Diagram of circular economy
Figure 81 Demonstration of the circular economy on one land
Figure 82 Diagram of Scheme
Figure 84 Scheme of no rain
Figure 85 Scheme of light rain
Figure 86 Scheme of Low Risk Flood
Figure 87 Scheme of High Risk Flood
Figure 88 Map of Flow System
Figure 89 Axoenometric view of the new Parcels
Figure 90 New acitivies during winter season
Figure 91 New acitivies during Spring
Figure 92 New activities during Summer
Figure 93 New activities during Autumn
Figure 94 the masterplan with functions
Figure 95 Round abouts during different seasons
Figure 96 Map of selected roundabouts
Figure 97 Allotment Gradens
Figure 98 Activies around the canal – Biodiversity
Figure 99 Axonometric - Upper section
Figure 100 Axonometric Zoom-in
Figure 101 Axonometric – Middle Section
Figure 102 Axonometric - lower section
Figure 103 Axonometric Zoom-in
Figure 104 Water systems used
Figure 105 Process of composting