NCLR
Nebraska
NATIONAL COUNCIL OF LA RAZA www.nclr.org
State Fact Sheet
As the data below show, Hispanics✝ are quickly becoming a population with a national presence. The most dramatic Latino population growth has occurred in "nontraditional" states, and Hispanics are now the largest minority in the country. Given that almost half of Hispanics are under 25 years old, they will constitute a large segment of the future U.S. population, workforce, and electorate.
Nebraska Compared to the Nation ▼ ▼
▼
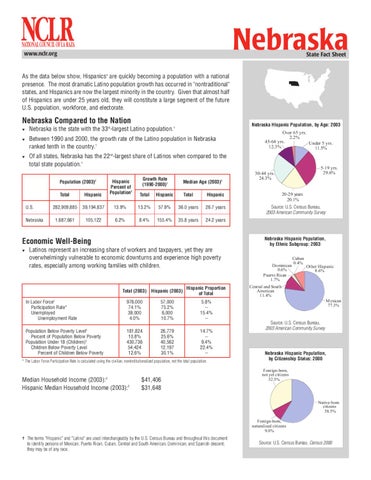
Nebraska Hispanic Population, by Age: 2003
Nebraska is the state with the 33rd-largest Latino population.1 Between 1990 and 2000, the growth rate of the Latino population in Nebraska ranked tenth in the country.1 Of all states, Nebraska has the 22nd-largest share of Latinos when compared to the total state population.1
U.S. Nebraska
Growth Rate (1990-2000)1
Total
Hispanic
Hispanic Percent of Population2
282,909,885
39,194,837
13.9%
13.2%
57.9%
36.0 years
26.7 years
1,687,661
105,122
6.2%
8.4%
155.4%
35.8 years
24.2 years
Population (2003)2
Median Age (2003)2
Total
Hispanic
Total
Hispanic
5-19 yrs. 29.6%
30-44 yrs. 24.3% 20-29 years 20.1%
Source: U.S. Census Bureau, 2003 American Community Survey
Nebraska Hispanic Population, by Ethnic Subgroup: 2003
Economic Well-Being ▼
Over 65 yrs. 2.2% 45-64 yrs. Under 5 yrs. 12.3% 11.5%
Latinos represent an increasing share of workers and taxpayers, yet they are overwhelmingly vulnerable to economic downturns and experience high poverty rates, especially among working families with children.
Total (2003) Hispanic (2003) In Labor Force3 Participation Rate* Unemployed Unemployment Rate Population Below Poverty Level Percent of Population Below Poverty Population Under 18 (Children)2 Children Below Poverty Level Percent of Children Below Poverty 2
Hispanic Proportion of Total
976,000 74.1% 39,000 4.0%
57,000 75.2% 6,000 10.7%
5.8% -15.4% --
181,824 10.8% 430,736 54,424 12.6%
26,779 25.6% 40,562 12,197 30.1%
14.7% -9.4% 22.4% --
* The Labor Force Participation Rate is calculated using the civilian, noninstitutionalized population, not the total population.
2
Median Household Income (2003): Hispanic Median Household Income (2003):2
$41,406 $31,648
Dominican 0.6% Puerto Rican 1.7%
Cuban 0.4%
Other Hispanic 8.6%
Central and South American 11.4% M exican 77.3%
Source: U.S. Census Bureau, 2003 American Community Survey
Nebraska Hispanic Population, by Citizenship Status: 2000 Foreign-born, not yet citizens 32.5%
Native-born citizens 58.5% Foreign-born, naturalized citizens 9.0%
✝ The terms "Hispanic" and "Latino" are used interchangeably by the U.S. Census Bureau and throughout this document to identify persons of Mexican, Puerto Rican, Cuban, Central and South American, Dominican, and Spanish descent; they may be of any race.
Source: U.S. Census Bureau, Census 2000