1 minute read
for the Dairy Industry TRENDS Search Engine


Part of developing a comprehensive digital marketing campaign is understanding how customers and potential customers are using the Internet to find your products and your website. The graphs and information below all come from Google Trends, which analyzes the popularity of queries in Google Search across various regions and languages. The graphs scale “Interest Over Time,” which represent search interest relative to the highest point in the chart for the given region and time-period. So, a value of 100 is the peak popularity for the term.
Another alternative is Google Keyword Planner. To use this tool, you must have a Google Ads account. The Keyword
Advertisement
Eggs
Planner lets you search keywords and suggests other words or phrases related to your products and services. It lets you research the trend information for how often certain words are searched and how those searches have changed over time and also gives you suggested bid estimates for each keyword, so you can determine your advertising budget.
In today’s digital environment, we strongly encourage members to capitalize on this growing trend and ensure that your company is visible in the place where people search the most.

Average Search Volume has decreased 5.5% YoY
Average Search Volume has increased 23.8% over the past five years
RELATED SEARCH QUERIES
1. Cream cheese
2. Cottage cheese
3. Cheese dip
4. Cheddar cheese
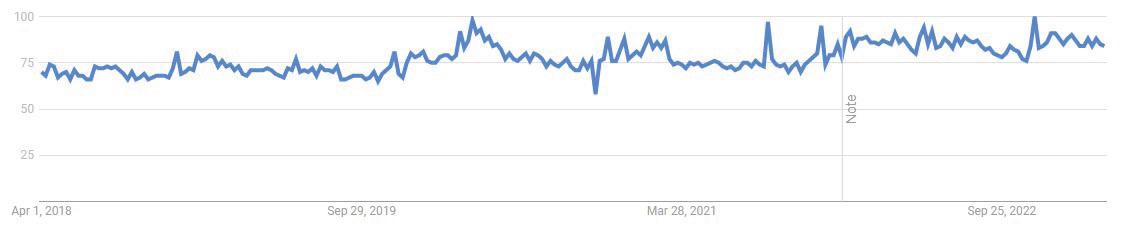
Average Search Volume has decreased 7.7% YoY
Average Search Volume has increased 20% over the past five years
Employee Retention
RELATED SEARCH QUERIES
1. Protein milk
2. Whole milk
3. Milk near me
4. Milk powder
Average Search Volume has increased 110.7% YoY
Average Search Volume has increased 662.5% over the past five years
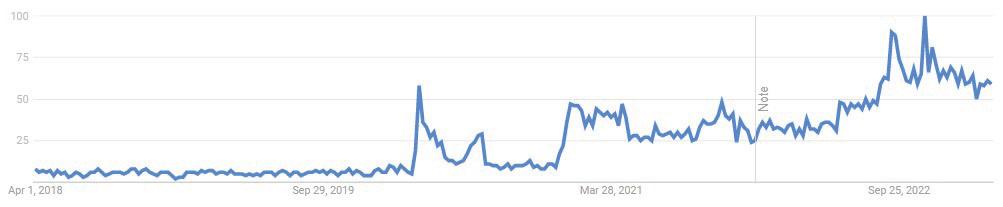
RELATED SEARCH QUERIES
1. Retention credit
2. What is employee retention
3. What is retention
4. Employee retention rate


