
RE:SETTLEMASTER IN ADVANCED COMPUTATION FOR ARCHITECTURE AND DESIGN NEIL JOHN J. BERSABE THESIS 2022


ARCHITECTUREMASTERRE:SETTLEINADVANCEDCOMPUTATIONFORANDDESIGN STUDENT NEIL JOHN J. BERSABE FACULTY ANGELOS CHRONIS THESIS STUDIO 2022 RETHINKING RESETTLEMENT STRATEGIES FOR URBAN HOUSING AND FLOOD MITIGATION


3.01 Typology Mapping 3.02 Community Ecosystem 3.03 Synthesis: Key Performance Indicators 353331
4.01 Connection Rules 4.02 Rules Grammar 4.03 Field Rules 4.04 Community Aggregation 4.05 Neighborhood Clustering 4.06 GH Definition 575553494745 02 2.032.022.01ResearchGoals&ObjectivesProjectPrecedentsMethodology 271917

CONTENTS 01 The Problem 1.01 Flooding 1.02 Environment 1.03 Housing 1.04 Community Behavior 11090703
04
03 Data & Analysis
Parametric Model
06 Conclusions 77 07 References 05 AI: Machine Learning& Web Deployment 5.01 Data Set 5.02 Feature Selection 5.03 Supervised Machine Learning: Regression 5.04 Web Deployment 71696361 81


ABSTRACT

The rapid population growth of cities affects the acquisition of land ten ure, land security, and production of good quality housing. The constant pressure of living in highly urbanized cities forced the work ing class to live in lower-quality housing. In return, these people have reverted to living in areas within the poorer residential districts of the city.
So the question is:
current housing designs can be a platform for design ers and planners to provide new innovative solutions. Understand ing the current housing conditions can be used as a learning tool to achieve the effectiveness and efficiency of new housing design strategies.
The project aims to create a tool to analyze housing strategies by employing machine learning to predict the performances of different housing iterations and democratizes the design process by deploying the parametric model to the web. The participatory approach to design would hopefully empower the users and planners with the ability to infer, analyze, and improve on different possible solutions interactively.
PhilippinesCityDavao
Due to the low enforcement of zoning laws in some cities, people living in such conditions tend to build housing settlements in no-build or high-risk flood zones to survive, making the community vulnerable to disasters.
Is there a need to rethink these communities' current housing development Rethinkingstrategies?
01 THE PROBLEM 1.01 Flooding 1.02 Environment 1.03 Housing 1.04 Community Behavior
Image1.1 PhotoshowingfloodingatdowntownDavaoCity

1CHAPTER 3 FLOODING:PROBLEMTHE
The disruption caused by flooding poses an immeasurable setback to the progress and economic growth of the community.
1.01
SETTLERE:
FLOODING
Urban Flooding is one of the perennial problems that affect the city. The cause is the lack of drainage systems, constriction of waterways, and encroachment of natural drainage paths.
Davao City is densely populated, with approximately 800 people per square kilometer. The city is rapidly progressing with developments already However,underway.despitethe census, Davao City is prone to heavy flooding because it sits atop an alluvial flood plain. Unfortunately, these devel opments produce some adverse issues.
The inundation extends in the area if the actual amount of rain exceeds that of a 100-year-rain return period. There is a 1/100 (1%) probability of a flood with 100 year return period occurring in a single year.
-1.0-0.50.00.51.01.52.02.53.0
2022THESISMACAD BersabeJ.JohnNeil 4
Flood Hazard Map
The inundation extends in the area if the actual amount of rain exceeds that of a 25-year-rain return period. There is a 1/25 (4%) probability of a flood with 25 year return period occurring in a single year. The Rainfall Intensity Duration Frequency is 165.500mm.
1.1.1 ImageImageImage1.1.1a5YearsFloodHazardMap1.1.1b25YearsFloodHazardMap1.1.1c100YearsFloorHazardMap


The inundation extends in the area if the actual amount if rain exceeds that of a 5-year-rain return period. There is a 1/5 (20%) probability of a flood with 5 year return period occurring in a single year. The Rainfall Intensity Duration Frequency is 121.100mm.

SETTLERE: 1CHAPTER 5 FLOODINGPROBLEM:THE andtemperatures,year.evendistributionTheAirtemperaturechartshowstheofatropicalclimatehavingdistributionofheatthroughtheWithclimatechangeandrisingDaysaregettinghotterwithhighhumiditycausesheavyrainsduringnighttime. Geographic Cause of Flooding 1.1.2 ImageImage1.1.2a5AirTemperatureChart1.1.2b5RelativeHumidityChart Image1.1.2c(Left)IsometricSolarDiagram,(Right)SolarChart


2022THESISMACAD BersabeJ.JohnNeil 6 Displacement and Homelessness Economic Vulnerability Deterioration of Housing Quality
The economic setbacks hinder progress for communities. The proliferation of the settlements in hazardous zones of the city causes adverse sustainability impacts on its residents.
1.1.3 Image1.1.2dFloodMap,DavaoCity(

Adverse effects caused by flooding Coordinates:125.603757,7.062182)
The immediate impact of flooding includes displacement and homelessness. Similarly, the damage to livelihood and infrastructure can cause long-term disruptions that can lead to economic vulnerability and deterioration of housing quality.
Ma-aRoadMATINASETTLERE: 1CHAPTER 7 ENVIRONMENTPROBLEM:THE 30 hectares Total Site Area 1.02 ENVIRONMENTApartmentChurchCommercialHospitalHotelHousePublicResidentialRetailCoveredCourtSchoolServiceUntagged6252042113512815321268 ZoningImage1.2aZoningmapbasedontheComprehensiveOrdinanceofDavaoCityFig.1.2aDatacollected from OSMNX with the origin pointinthemiddleofSIRSitethewithintypologiesBuilding ElementaryCommercialUniversitySchoolDavaoRiverGreenSpace

MacArthur Highway

MountApoSt. LopezJaenaSt.
76-A BUCANA POBLACION
MitigationFloodwayGreenCommercialInstitutionalSpace
Lack of DiscretionEnforcement
in-davao-city-classified-high-risk-for-covid-19-article/1938651/davao/local-news/4-barangays-ImageImageImage1.2bland-usezoningofthearea1.2cActualaerialphotoofthesite,Source:https://www.sunstar.com.ph/active-cases-at-643
Hospital UniversityHotel
DavaoRiver reviDavaoR
QuimpoBlvd
MacArthur Highway AcaciaStreet
FatherSelgaSt
The site was selected because the location was originally a flood mit igation area. However, the govern ment selected and established the area as a relocation site for the slum community. The lack of proper easements and planning acceler ated the uncontrolled densification of the community thus making it highly susceptible to problems and heavy flooding.
EasementResidential
EQuirinoAveA.MabiniSt.V.MapaSt.
UncontrolledSettlements = +
C.M.RectoAve.CayetanoBangoySt.
2022THESISMACAD BersabeJ.JohnNeil 8
The map shows the current land use of the area which doesnt con form with the zoning laws imposed by the city. Uncontrolled sprawl of informal settlements have occupied zones that should have been used for flood mitigation and easements from the river

APichonSt
ManuelL.QuezonBlvd
GuillermoETorresSt.
Santa Ana Ave. Santa Ana Ave.
L.M.GuerreroSt.
DavaoRiver DavaoRiver
1.3.1
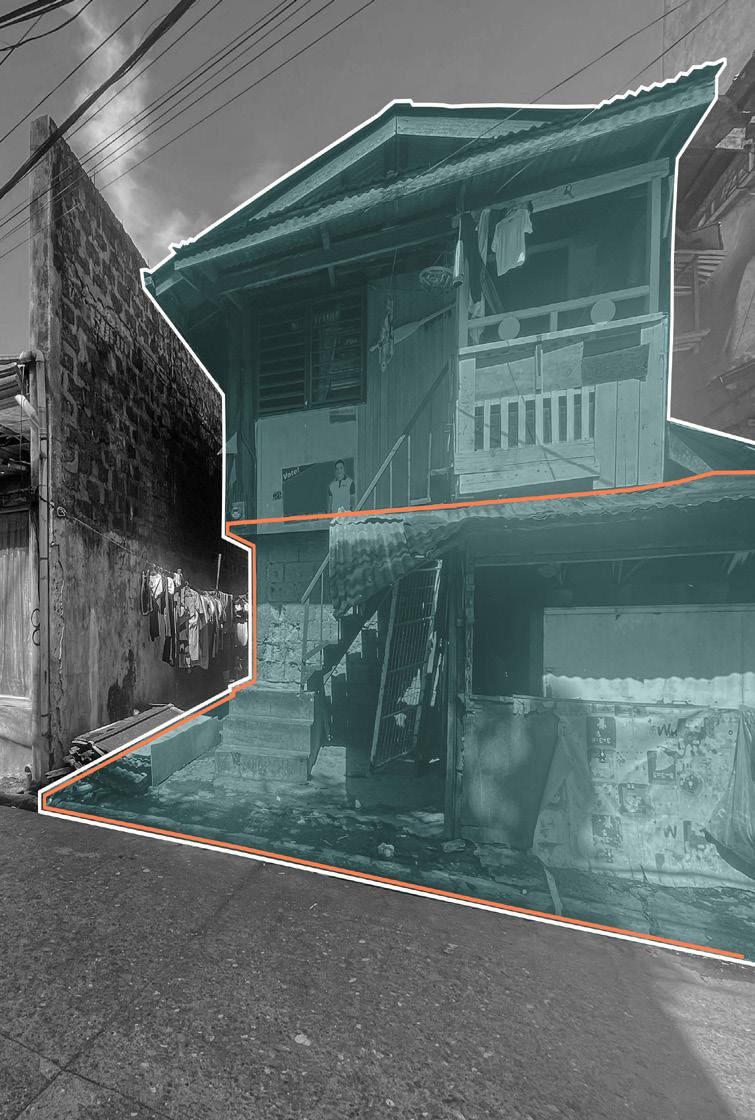
In-situ mapping of the existing house typologies identified a predominance of single-de tached dwellings that the residents slowly upgrade to attached housing. Houses onsite are Single detached Houses, duplexes, and Rowhouses. The housing typologies are di verse because most houses have different configurations integrated into the structure. Some integrations include storefronts, small wet markets, mini-marts, food stalls, mas sage parlors, and salons. Housing conditions vary as some are in good condition while others are dilapidated.
Existing Typologies of Housing on Site
Mid-highVariableSingle-detached60Families/Hectare120Families/Hectare-OnlywaytoaccommodatedenserpopulationsRow-houseDensityHousing
The linkages between poverty and environmental factors led to the emer gent need for housing. The lack of adequate dwellings urged the proliferation of the slum community that developed into factions of illegal and unplanned settlements.
SETTLERE:
Although the slum community may have created temporary dwellings, the poor living environ ment exposes it to harsh environments such as heavy rains and floods, posing a threat to the security of their shelters. These communities pose a threat to the housing economy, but taking a step back to rethink design strategies for these communities might be the only solution.
HOUSING
1CHAPTER 9 HOUSINGPROBLEM:THE 1.03
Meanwhile, communities situated in coastal areas use stilt design as a protective barrier from unpredictable flood influx.
Houses in flood-prone areas usually consist of a sacrificial floor as a flood risk design strategy. The raised design uses the lower ground as a storage space or ga rage. In the event of flooding, the lower floor serves as the flood containment facility that protects the owners from water damage.
0301 0402
Image1.3.2a(Left)Showingdilapidatedgroundfloor,(Right)ShowinghouseswithmultiplestoreysImage1.3.2b(1)Singlestoreyhouses,(2)Housesduringfloodingevent,(3)Build-up,(4)Thelowerlevelbecomesasacrificiallayerduringfloods
2022THESISMACAD BersabeJ.JohnNeil 10 Built-up Houses 1.3.2

The majority of the slum community is often generalized as poor. On the contrary, the slum community comprises diverse cultures and characters. The people are compelled to build make-shift houses, creating a space based on personal specifications and needs.
aroundImage1.4Diagramshowingthesprawloflow-costhousingadevelopingcitycenter
SETTLERE:
11 BEHAVIORCOMMUNITYPROBLEM:THE1CHAPTER 1.04
The lack of rules encouraged personalization, enhanced creativity, and vibrancy as a form of artistic expression. The slum resides in the voids within the city because of urban densification and displacement. The majority of the slum community is often generalized as.
BEHAVIORCOMMUNITY

Slum Upgrading 1.4.1 Urban Sprawl 1.4.2Image1.4.1Diagramshowingthesprawloflow-costhousingaroundadevelopingcitycenter
It results from urban development and is a by-product of social, economic, and cultural factors. Unfortunately, urban sprawls have adverse effects on the environment and community. Urban sprawl negatively contributes to higher water pollution, air pollution, water runoff, flooding, and open space.
2022THESISMACAD BersabeJ.JohnNeil 12
Slum upgrading is a proactive process between the residents, community, and local government wherein provi sion for basic needs, adequate living conditions, and security of tenure are openly discussed to give better solu
Urban sprawl is residential and commercial development on undeveloped land not designated for a specific plan by zoning.
Thetions.concept of slum upgrading is a progressive way to promote new re settlement strategies to provide inno vative solutions to slum communities.
COMMUNITYENVIRONMENTFLOODINGHOUSINGBEHAVIOR
STRATEGIESDESIGNNEWPROBLEM:THE

SETTLERE: 1CHAPTER
These are the four main factors consid ered in the study. The lack of proper plan ning severely impacted the course of the natural environment, urbanization, densi fication, and quality of life.
13
The focus of the study is to create new design strategies that elevate the way of living. The current housing and resettle ment design strategies require a series of metamorphoses and are precursors to understanding the social dynamics and housing structures that are impactful to innovation.
RE: THINK RE: CREATE RE: SETTLE
2022THESISMACAD BersabeJ.JohnNeil 14
02 RESEARCH 2.01 Goals & Objectives 2.02 Project Precedents 2.03 Methodology
Housing Quality
SETTLERE: 2CHAPTER 17 OBJECTIVESRESEARCH: 2.01
2.1.1 2.1.2
OBJECTIVES&FloodRiskMitigation
Understanding different environmental, societal and economic problems surrounding housing typologies is essential. The goal is to propose new resettlement strategies by addressing rele vant issues categorized by the four main objectives and creating a parametric model driven by performance metrics.
GOALS
Environmental Quality Adaptability
2.1.3 2.1.4
2022THESISMACAD BersabeJ.JohnNeil 18
In the early 2000s, there were studies probing the effectiveness of socialized housing and critiquing the low living standards in government-supported housing. The Quinta Monroy was designed and built by Elemental in partnership with the government to develop housing strategies and improvements for low-income families and informal settlers in Chile. The designers wanted to create a concept that innovates the approach toward current socialized housing design.
SETTLERE: 2CHAPTER 19 PRECEDENTSPROJECTRESEARCH: "ADAPTABILITY" Case Study No. 1 PhotographyArchitectsAreaYearLocation Alejandro Aravena, ELEMENTAL Iquique,20035000m² Palma,CristobalChilePalma/EstudioTadeuzJalocha yardRear Informal Formal36m2 Formal18m2 formalSemi- formalformalSemi-Semi- formalSemiInformal9m2 GroundInformal9m2floor Upper floors Informal9m2 Informal9m2Informal18m2courtyardShared layoutImage2.2.1aPlanshowingadaptabilityofandoptionsforexpansion Quinta Monroy 2.2.1 2.02 PROJECT PRECEDENTS
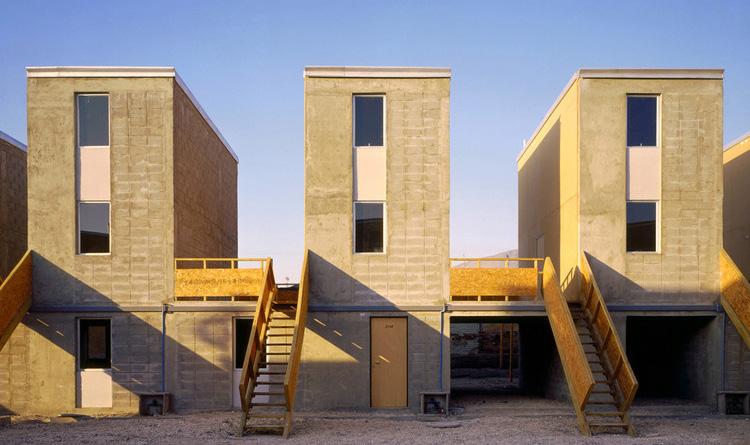
2022THESISMACAD BersabeJ.JohnNeil 20 Monroy'sAbove:ShowstheadaptabilityofQuintaabilityforexpansion 030102 0405
The concept of Quinta Monroy gave the user the ability to build additions. On the contrary, the us ers can customize their house when the resources became available. With its customization, the us ers could avoid having to settle to small, cramped spaces or overly large spaces.
The goal was to give certainty to unpredictability by creating adaptable incremental units and improv ing the quality of housing settlements. The concept allows the users to add or remove self- built ex tensions and modifications to their specifications and timeline.

The Inverted Skyline, designed by WOHA Architects, proposed a project concept of a city with layers. The designers wanted to inno vate the traditional building typology to achieve a long-term solu tion on the densification crisis. The idea was to create a new land on the existing land by layering above and below the ground level.

2.2.2
2CHAPTER Case21
ArchitectsArea WOHA Architects 730 hectares
Study No. 2
Inverted Skyline
DiagramLeft:The"InvertedSkyline"byWOHAArchitects
PRECEDENTSPROJECTRESEARCH:
Densification is one of the leading problems of Urbanization. In progres sive cities, densification permits access to basic and public services that enhance productivity output. However, the demands can not keep up with the rapid increase in city growth. With cities growing exponentially, crises concerning economic and environmental aspects are inevitable.
SETTLERE:
BersabeJ.JohnNeil
levelRight:Left:Traditionalbuildingtypology,InvertedSkyline,freeingupgroundforpublicactivityandopenspaces
22
The project has a three (3) dimensional layer with resi dential, civic & community areas designed strategically to create vertical mixed-use cities within a city. The project aims to create a humane and resilient community adapt able to long-term solutions by re-planning and restoring the biodiversity in the city thus establishing the natural balance between ecosystem and its habitants.


"DENSIFICATION"
2022THESISMACAD
The geometric configuration created a zigzag pattern as the base of the Project. The pattern created a base symmetry that established stability and rigidity in the building core. The design entailed an organized configuration of three (3) elevator cores, six (6)elevators within the vicinity, and Seven (7) staircases as vertical circulation.
Case Study No. 3
The factor to successful building circulation is the organization of the core layout. Although no specific or exact typology of building circulation exists, the exploration of geometric patterna tion and spatial configuration are viable factors in achieving visual accessibility and wayfinding.
ArchitectsYear
SETTLERE: CHAPTERi 23 PRECEDENTSPROJECTRESEARCH:
Meanwhile, the horizontal circulation was designed to accommodate the assumed perceived needs of man for natural ventilation, interaction, and a sense of community through walkways, terraces, and streets.
"CIRCULATION" Habitat 67 2.2.3
Moshe Safdie 1967
Habitat 67 was designed by Architect Moshe Saf die as an experimental solution to high-quality housing. The concept was to stack concrete box es in variant geometric configurations that re sulted in Sixteen (16) uniquely configured spaces.


Image2.2.3aShowstherelationshipbetweenprivateandpublicelements
Image2.2.3bIsometricviewofapart
2022THESISMACAD BersabeJ.JohnNeil 24
Image2.2.3dPlanandsectionviewshowingcommoncirculationwithinthehabitatPLANSECTIONImage2.2.3cHowlightismanipulatedinthehabitat.Eachapartmentgetsatleast3hoursofsunlighteveryday
The strategic planning of Habitat 67 took into consideration of geometry in designing the horizontal and vertical circulation that can assist in the optimization of the building use and flow of people.

SETTLERE:
2CHAPTER 25 PRECEDENTSPROJECTRESEARCH:
Housing issues have been around for the past few decades. In late 2021, there had been reports that suggest a shortage in creating affordable and quality housing. Although materials are available, the real issue poses great concern towards building homes in a more accessible and flexible Archigramway.
understood the lack of adequate housing and wanted to provide solutions for economic, environmental, and social sustainability thus cre ating a thought-provoking project that materialized through the concep tion of the Plug-in City in the 1960’s.
YearArchitectsAreaProposed 19645000m²Archigram Case Study No. 4 The Plug-in City 2.2.4


2022THESISMACAD BersabeJ.JohnNeil 26
The modularity of the project gives the users a choice between personalization and flexibility. It is geared towards understanding the present and future needs of the users through additive and sub tractive Archigrammethods.challenged
The project suggests a hypothetical city containing modular units plugged into a central infrastructural mega-machine. Although, it is not a city but rather a constantly evolving megastructure that integrates residences, civic spaces, networks, and other essential services.
"MODULARITY"
traditional design by creating stability through impermanence which is predict ed to be liberating for the users.
oftheBuild
Parametric
Build Zones
SETTLERE: 2CHAPTER 27 METHODOLOGYRESEARCH: 2.03
01 02 03 04
Identify build zones and define the field where the proposed community is able to grow
Analyze and overlay inundation maps to identify areas of risk.
Map and catalogue different building types to synthesize a standard module for each category.
METHODOLOGYFloodGridMappingBuildingTypologies
04 05 06
Develop KPIs that score each iteration for performance and train an AI model to predict these parameters.
fieldableBuild
Parametric Model
the parametric logic that caters to the different constraints and sensibilities of the community.
Deploy the model to the web to allow users to play and interactively partici pate in the design process.
0 2 3 4 84 128 32 36 41 63 32 54 16 14 22 46 21 21 40 10 54 71 100 96 A B C D 54+ 90+ 30+ 50 15 80 25 50 40 20 APP 2022THESISMACAD BersabeJ.JohnNeil 28
Web Deployment
Performative Analysis & Machine Learning
03 DATA ANALYSIS& 3.01 Typology Mapping 3.02 Community Ecosystem 3.03 Synthesis: Key Performance Indicators
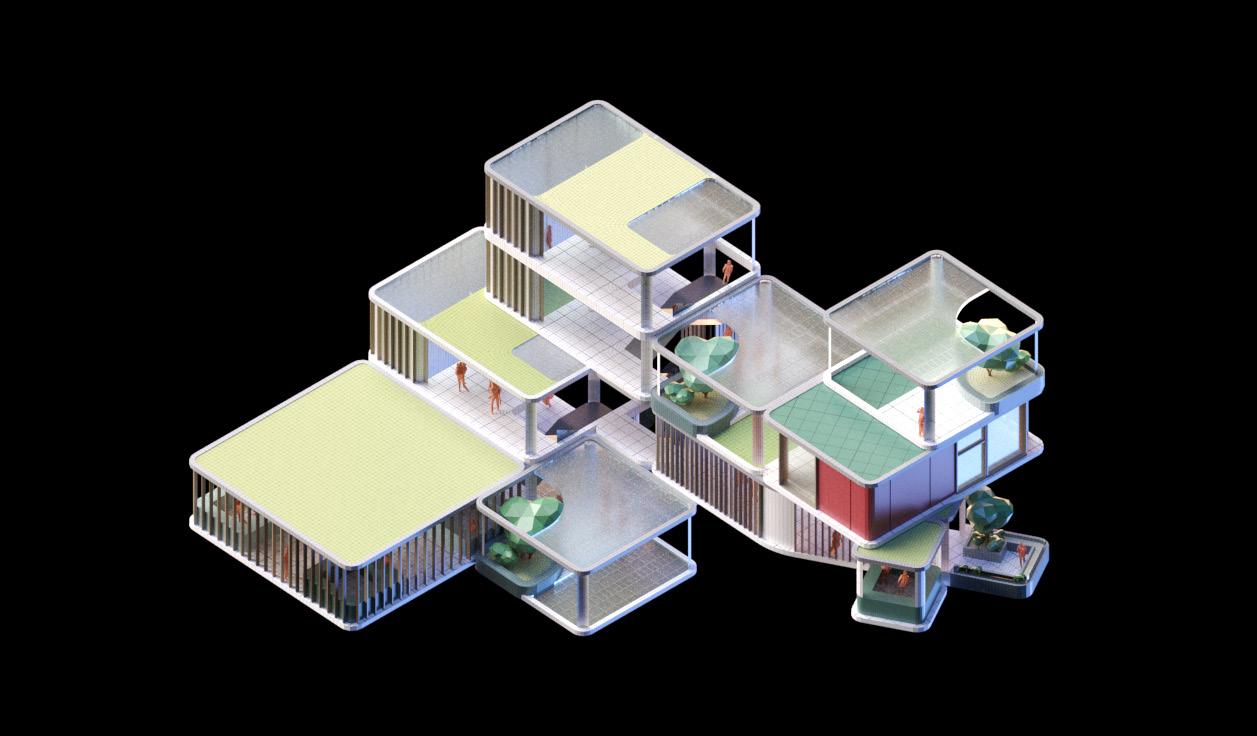
Existing building typologies in the community were identified and mapped using OSMNX. Syn thesizing them into key categories, we are able to create different modules for the proposed community aggregation.


TYPOLOGY MAPPING

SETTLERE: 31 MAPPINGTYPOLOGYANALYSIS:&DATA3CHAPTER 3.01
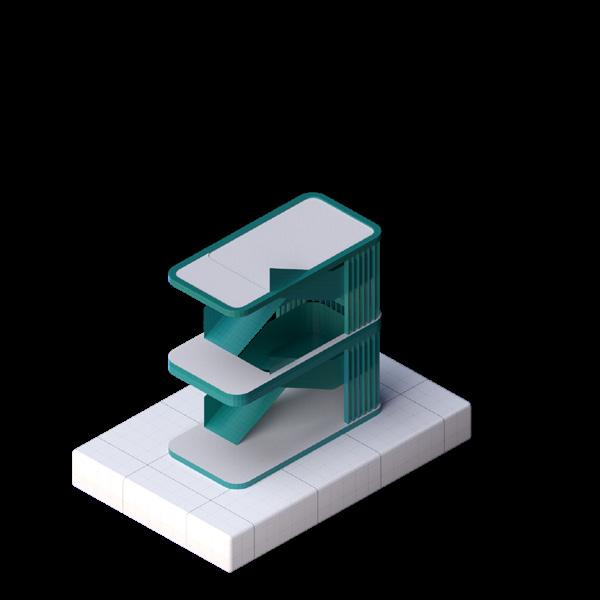
The proponent used the base unit of a 3m x 3m x 3m cube grid as the base building block to design the different modules to define a modular system of construction.

Park ParkletHousing 02Housing 01 Base Unit 03 04 01 02 CIVILHOUSINGSTRUCTURES & GREEN SPACE CIVIL STRUCTURES & GREEN SPACE HOUSING

2022THESISMACAD BersabeJ.JohnNeil 32 MarketplaceCoreBridgeStoreBalconyStairs (ShortBridge Bend)(LongBridgeBend) 07 1009 0812060511 COMMERCIAL SPACE COMMERCIAL SPACE CIRCULATION CIRCULATIONCIRCULATION CIRCULATIONCIRCULATION CIVIL STRUCTURES & GREEN SPACE


SETTLERE: 33 3CHAPTER 3.02 COMMUNITY CivicECOSYSTEMStructures SchoolWork LocalHousingStore FarmingPark ECOSYSTEMCOMMUNITYANALYSIS:&DATA
Community MarketBase Unit: Housing


2022THESISMACAD BersabeJ.JohnNeil 34
The base housing unit is designed in accordance to current design laws for socialized housing in the Philippines. Though only 54sqm and 36sqm in size due to budget constraints, the integration of parks and proximity to open spaces in the aggregation allows individ ual expansion
3.2.1
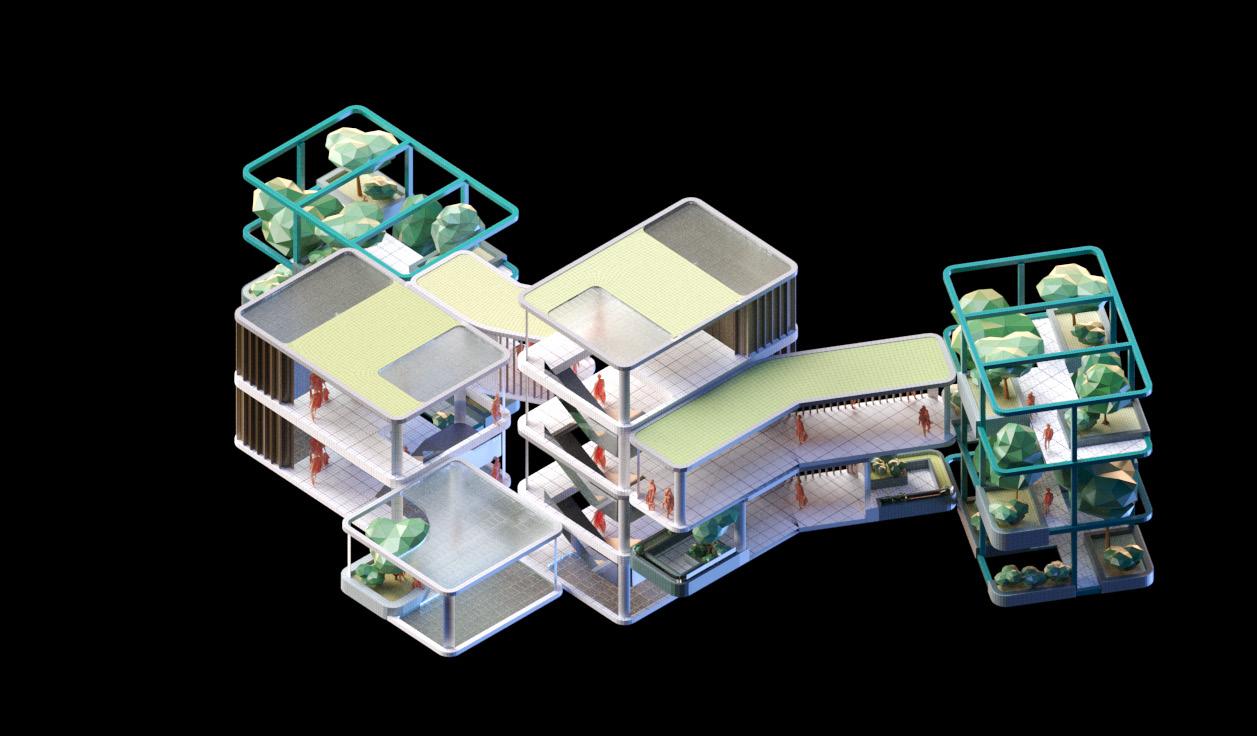
The community ecosystem presented is mapped by understanding the com munity's lifestyle and way of living. The structure of the ecosystem encapsulates the social and physical environment, and understanding this, encourages familiarity and good circulation between people, modules, and the natural environment. Additionally, the proposed ecosystem allows the community to strive independently as different modules complement each function and promote sustainability.
Green Plot Ratio Quality
Accessibility
Accessibility to Accessibility ro Nearest to
The five key indicators are identified to describe the current problem of the community adequately in terms of liveability, community, environ ment, accessibility, and risk for disasters.
A good assessment of building performance will heavily an chor the proposal's success. Thus, five key performance indi cators were used to score the data from the building design.
INDICATORSKEYSYNTHESIS:PERFORMANCEEnvironmentalQuality
Surrounding
Nearest INDICATORSPERFORMANCEKEYANALYSIS:&DATA
AccessibilityIndex
CommunityIndex
SETTLERE: 35 3CHAPTER 3.03
Community Plot Ratio Zoning Ratio Civic Generosity Index
Existing Score New Score
to Nearest Exit Nearest Green Space Nearest Amenity Module Elevation Location Flood Risk Rate Residential Density Population Density
FloodIndexMitigation
AccessibilityEnvironmentalQualityIndex
2022THESISMACAD BersabeJ.JohnNeil 36
Community Index
Flood MitigationRisk
DensityIndex
AccessibilityIndex
DensityIndex
The Radar chart will be the core metric for defining the resultant aggregation's performance indi ces. The orange graph will show the scoring for the existing com munity, and the teal graph will show the proposed structure thefromscore.Thechartdomainisscored0to1,with1beinggoodandoppositeforzero.
1 Parklet module: 3 Housing modules
Community Plot Ratio refers to the amount of community space within the development compared to the number of hous ing
SETTLERE:
Since the main goal for this study is to create a resi dential community, standards for scoring were set in favor for the residential function.
This is used to assess if the building can sustain its own com munity ecosystem by the fulfillment of the ideal communal space to residential areas ratio. The goal aims to have a ratio value of more than or equal to the set standards.
AB INDICATORSPERFORMANCEKEYANALYSIS:&DATA3CHAPTER
Standards for ideal ratio of the spaces were set as follows:
1 Market module: 20 Housing modules
Community Index
1 Balcony module: 2 Housing modules
1 Store module: 5 Housing modules
This not only affects the type of districts within a sin gle aggregation, but also the overall main function of a building. This can give opportunities to create a big ger community ecosystem involving multiple build ings within the site.
Standards for ideal ratio of the spaces were set as follows:Housing Modules ≥ 50% Circulation Modules ≥ 30% Green Space Modules ≥ 30% Commercial Modules ≥15%
Zoning Ratio
37
Thismodules.measurement
3.3.1The
The Zoning Ratio refers to the proportion of each zone to the total gross floor area of the aggregation.
Community Index measures how much the building gives not only to its own, but to the surrounding communities as Thiswell.includes the Community Plot Ratio, Civic Generosity Index, and Zoning Ratio. The overall score was quantified by getting the average of the 3 factors.
includes all spaces with a socially active na ture such as Parks, Parklets, Balconies, Stores, and Markets.
Community Plot Ratio
1 Park module: 6 Housing modules
The Civic Generosity Index quantifies how accessible the development’s common spaces are to the Usingpublic.Graphs
2022THESISMACAD BersabeJ.JohnNeil 38
vA = Base Point vB = Civic Modules

as a means to explain connectivity between building modules, we are able to identify distances between modules and create measurements for accessibility from point a to point b.
G(vA + vB)=
The standard for the ideal walking distance was set to ≥ 60m.
This is measured by running the A* Algorithm through Shortest Walk to identify the shortest routes between common spaces to the Ground Floor. The more accessible communal spaces, the better the score.
GenerosityCivicIndex
Civic Generosity IndexC Usinggraphstodefineconnectivity
The value determines the number of open spac es the that the building leaves unoccupied on the site as opportunities for vegetation or green spac es. This was quantified by dividing the aggregation boundary area by the total site area. The lesser the value means more opportunities for green spaces.
3.3.2Green
39
Environmentalspaces.
Quality calculates the amount of green spaces/ vegetation on and around the building compared to the total area of the aggregation boundary.
Environmental Quality
INDICATORSPERFORMANCEKEYANALYSIS:&DATA3CHAPTER
Plot Ratio refers to the total amount of verti cal or horizontal vegetation within the building.
The value determines how much of the aggregation bounding area was the structure able to give back as green space. This was quantified by dividing the total green space areas by the aggregation bound ary area. The higher the value means more green
The goal aims to create more opportunities for vegetation as well as to give back the area occupied by the structure. Success is determined in comparison to the total vegetation within the site: the more green areas made, the better score. Involving 2 factors, overall result was quantified by setting a 60/40 weighted average, favoring Green Plot Ratio as heavier than Surrounding Quality.
SETTLERE:
Surrounding Quality = 1 - x
x= Aggregation Boundary Area Total Site Area


Surrounding Quality refers to the total area of the aggregation boundary in comparison to the site’s total area.
Green Plot RatioA
Total Green Space Zone Area Aggregation Boundary Area =
Surrounding QualityB GreenRatioPlot
Start
to Exit quantifies whether the average distance of the Housing modules to the Core and Stair modules is within walking distance. The standard for the ideal walking distance was set to ≥ 45m.
Access to ExitA
Access to Green SpaceB
F = g + h
Access to Green Space quantifies whether the average distance of the Housing modules to the Park. Parklet and Balcony modules is within walking distance. The standard for the ideal walking distance was set to ≥ 200m.
A searching algorithm that searches for the short est path between a start and end points.

Accessibility Index quantifies the ease of accessibility of the housing modules to the Amenities, Green Spaces and Exit points.
Accessibility Index
3.3.3Access
vB =
The algorithm searches for the smallest F-valued cell and moves to that cell until it reaches the goal cell
A* Algorithm
Start EndEnd
A building’s livability is greatly affected by the occupant’s access to its faculties. This is measured by running the A* Algorithm through Shortest Walk to identify if the exits, green spaces, and other ame nities are within a set walking distance to the Housing modules. The more Housing Modules are within range, the higher the score.
2022THESISMACAD BersabeJ.JohnNeil 40
Access to Amenities Housing Modules Exit,Green Space, Amenities
Access to Amenities quantifies whether the average distance of the Housing modules to the Market and Store modules is within walk ing distance. The standard for the ideal walk ing distance was set to ≥ 150m.
Each cell is given an F-value with the equation:
The overall score was quantified by getting the average of the 3 factors.
C =UsinggraphstodefineconnectivityG(vA+vB)AccessibilityIndex vA =
Cost of moving from initial celltothecurrentcell
Heuristic value estimated cost of moving from current celltothefinalcell
Using Graphs as a means to explain connectivity between building modules, we are able to identify distances between modules and create measurements for accessibility from point a to point b.
Standards for ideal percentage of each flood map areas within the total Build Area were set as follows:
Thismitigation.isquantified
by getting the percent age of the high-risk areas, medium-risk areas and safe/ low-risk areas within the total Build Area. The less high and medi um risk areas within the build area, the more desirable it is.
High LowMediumRiskRiskRisk
Height Height
Housing Modules ≥ 9m Circulation Modules ≥ 10m Green Space Modules ≥ 12m Market Modules ≤ 10m Store Modules ≥ 10m
Safe/ Low Risk Areas ≥ 50% Medium Risk Areas ≥ 35% High Risk Areas ≥ 15%
Elevation refers to the correlation of the height per module from the ground and the site’s Flood Map.
Module ElevationA
Flood Mitigation Index3.3.4Module


41
INDICATORSPERFORMANCEKEYANALYSIS:&DATA3CHAPTER
Flood Mitigation Index measures how well the aggregation does in relation to the site’s flood map. The site has 3 identified zones defined by the level of flood risk. This index quantifies 2 factors involving the elevation standards of each module type from the ground as well as the percentage of each risk levels within the Build Area. The more percentage involved within the safe or low-risk range, the better the performance.
Standards for ideal elevation of modules from the ground were set as follows:
SETTLERE:
Location Flood Risk Rate measures how good your chosen area is for flood risk
This was quantified by setting preferred ele vation height levels per module type based on its function in the building’s Flood Mitigation strategy and the identified flood level height.
Location Flood Risk RateB
Population Density refers to the density of the number of residential modules per ha² of the aggregation boundary area. This was quanti fied by dividing the total number of residential modules to the total area of the aggregation boundary.
2022THESISMACAD BersabeJ.JohnNeil 42
Density Index is the ratio of residential population to the total area of the aggregation boundary pro jected to the ground surface. The measurement includes 2 factors: the total residential area and the total number of residential modules in an aggregation.
Number of Dwelling Units Aggregation Boundary Area
number of people ha² Density
(Number of Dwelling Units)(Occupancy Rate) Aggregation Boundary Area
The design field constraint’s verticality aims to increase the density of residential units per area to create more opportunities for vegetation and public spaces as well as decrease building footprint. The performance is determined by the total density of the aggregation compared to the site’s current situation.
Density Index3.3.5Residential
== = ResidentialDensityPopulationDensity = Residential
Population DensityB
A

Density refers to the density of the residential area per ha² of the aggregation boundary area. This was quantified by dividing the total area of residential modules to the to tal area of the aggregation boundary.

04 MODELPARAMETRIC 4.01 Connection Rules 4.02 Rules Grammar 4.03 Field Rules 4.04 Community Aggregation 4.05 Neighborhood Clustering 4.06 GH Definition
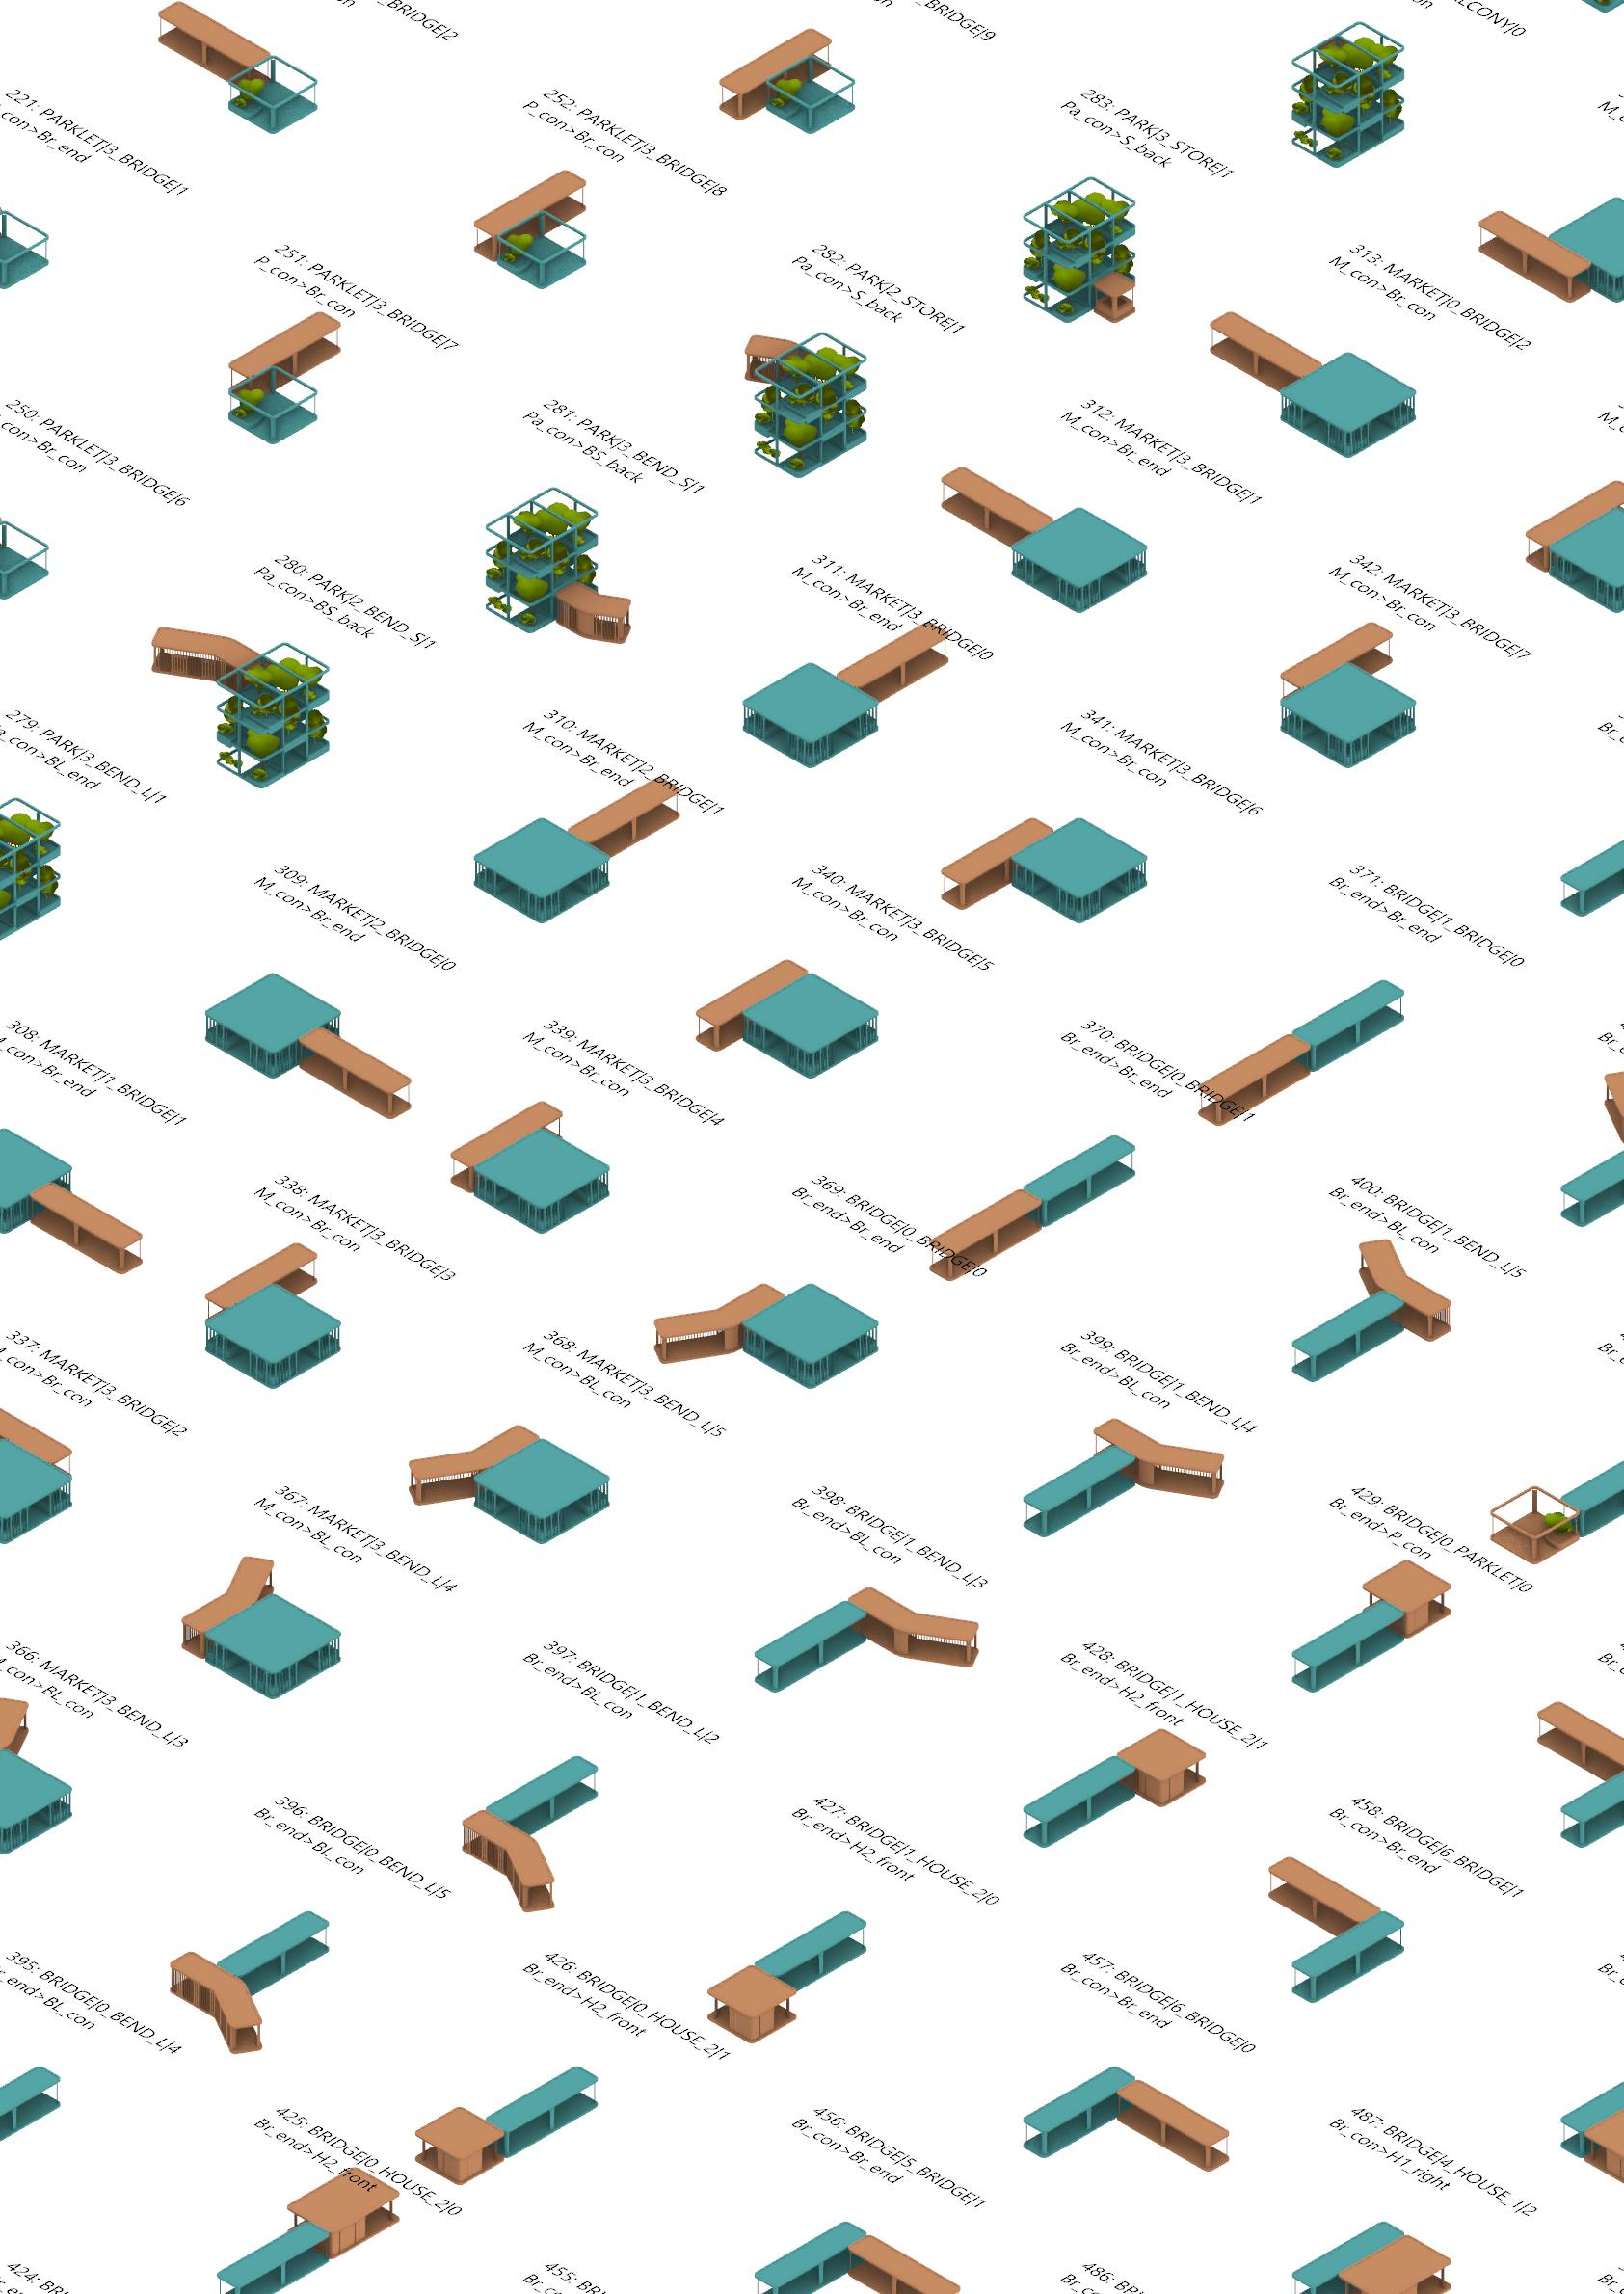
Eachmodule.module has its own connectors and assigned IDs to be able to map connection rules to it.
Logic from the WASP plugin by Andrea Rossi is used to define the con nection methods of each
SETTLERE: 45 RULESCONNECTIONMODEL:PARAMETRIC4CHAPTER 4.01 CONNECTION RULES HOUSING 01 01HOUSING STAIR STAIR CORE CORE BRIDGE BRIDGE (SHORTBRIDGEBEND) BRIDGE BEND)(SHORT (LONGBRIDGEBEND) BRIDGE BEND)(LONG PARK PARK STAIR STAIR MARKET MARKET PARKLET PARKLET HOUSING 02 02HOUSING BALCONY BALCONY
2022THESISMACAD BersabeJ.JohnNeil 46 Park ParkletBridge Core MarketplaceBridgeBalcony(Long Bend) Housing 02 Store BridgeStairs (Short Bend) Housing 0104010710 05020811 06030912


Pa_con>BS_backconnectors. M_con>BL_con Br_end>H2_front


SETTLERE: 47 4CHAPTER 4.02
RULES GRAMMAR
GRAMMARRULESMODEL:PARAMETRIC
The Rules Grammar is determined by these syntaxes ModuleConnection_Part1>ModuleConnection_Part2.Theserulesareguidesforallowableconnections be tween module P_con>S_backP_con>BS_backP_con>BL_endP_con>Br_conP_con>Br_endH2_bot>H1_topH2_bot>H2_topH2_top>H1_botH2_top>H2_botH2_left>BL_conH2_left>Br_conH2_left>H2_rightH2_back>B_conH2_right>BL_conH2_right>Br_conH2_right>H2_leftH2_front>BL_conH2_front>BL_endH2_front>Br_conH2_front>Br_endH1_bot>H2_topH1_bot>H1_topH1_top>H2_botH1_top>H1_botH1_left>BL_conH1_left>Br_conH1_left>H1_rightH1_back>B_conH1_right>BL_conH1_right>Br_conH1_right>H1_leftH1_front>BL_conH1_front>BL_endH1_front>Br_conH1_front>Br_end Br_con>H1_rightBr_con>H1_frontBr_con>Br_endBr_end>M_conBr_end>Pa_conBr_end>P_conBr_end>H2_frontBr_end>H1_frontBr_end>C_sConBr_end>C_eConBr_end>BS_frontBr_end>B_conBr_end>Str_conBotfrontBr_end>Str_conBotBr_end>Str_conTopfrontBr_end>Str_conTopBr_end>BL_conBr_end>BL_endBr_end>Br_conBr_end>Br_endM_con>BL_conM_con>BL_endM_con>Br_conM_con>Br_endS_back>BS_backS_back>Pa_conS_back>P_conS_front>BL_conS_front>Br_conPa_con>B_conPa_con>S_backPa_con>BS_backPa_con>BL_endPa_con>Br_endPa_front>Str_conBotfront BS_back>S_backBS_front>BL_endBS_front>Br_endBS_front>BS_frontBL_con>M_conBL_con>S_frontBL_con>H2_leftBL_con>H2_rightBL_con>H2_frontBL_con>H1_leftBL_con>H1_frontBL_con>H1_rightBL_con>Br_endBL_end>C_sConBL_end>C_eConBL_end>BS_frontBL_end>M_conBL_end>Pa_conBL_end>P_conBL_end>H2_frontBL_end>H1_frontBL_end>B_conBL_end>Str_conBotfrontBL_end>Str_conBotBL_end>Str_conTopfrontBL_end>Str_conTopBL_end>Br_endBL_end>BL_endBr_con>M_conBr_con>S_frontBr_con>P_conBr_con>H2_leftBr_con>H2_rightBr_con>H2_frontBr_con>H1_left C_sCon>B_conC_sCon>BL_endC_sCon>Br_endC_sBot>Str_topC_sBot>C_sTopC_sTop>Str_botC_sTop>C_sBotC_eCon>BL_endC_eCon>Br_endC_eBot>C_eTopC_eTop>C_eBotB_con>C_sConB_con>BS_backB_con>BL_endB_con>Br_endB_con>Pa_conB_con>H2_backB_con>H1_backStr_bot>C_sTopStr_bot>Str_topStr_top>C_sBotStr_top>Str_botStr_conBotfront>Pa_frontStr_conBotfront>BL_endStr_conBotfront>Br_endStr_conBot>BL_endStr_conBot>Br_endStr_conTopfront>BL_endStr_conTopfront>Br_endStr_conTop>BL_endStr_conTop>Br_endBS_back>P_conBS_back>Pa_conBS_back>B_con

The Volumetric Mesh is derived from the intersection of 2 Field according to the Site Zoning and Field accord ing to the Flood Map. The Site Zoning Field was created by extruding one of the cells within the built zone upwards, creating a polysurface. This was then intersected by an other polysurface created by the Flood Map via setting ex trusion values on grid cells based on the Flood Map of the site (See pages 13-14). The resultant geometry was then extracted as the Volumetric Field for the aggregation.

Site 01 02 03 04 4.03 FIELD RULES
fields:

CREATING BUILD ZONES FLOOD GRID MAPPING SETTLERE: 4CHAPTER 49 RULESFIELDMODEL:PARAMETRIC FLOODHighMAPPINGRisk High Risk - 5 storeysMedium Risk Medium Risk - 10 storeysLowRisk Low Risk - 15 storeys GRID EXTRUSION The Site INVERTING THE MODEL


2022THESISMACAD BersabeJ.JohnNeil 50 Dividing site area into smaller buildable zones Identifying Build Zones Cell Selection Solid Intersection of Inverted Flood Grid Extrusion and Selected Cell Extrusion Field where aggregation is safe to grow Paved Spaces Parks02X 03 04


52
2022THESISMACAD
BersabeJ.JohnNeil

SETTLERE: 53 4CHAPTER 4.04 COMMUNITY AGGREGATIONAGGREGATIONCOMMUNITYMODEL:PARAMETRIC


2022THESISMACAD BersabeJ.JohnNeil 54

Occ. Rate: 55 MOD 11
Park: 0 Parklet: 2 Marketplace: 1 Store: 1 Bridge (S): 0 Bridge (L): 1
MOD 10
Park: 2 Parklet: 1 Marketplace: 0 Store: 0 Bridge (S): 2 Bridge (L): 1
Bridge: 0 Core: 0 Stair: 0 Balcony: 2 Housing 01: 1 Housing 02: 0
Occ. Rate: 36
MOD 11
SETTLERE: 55 CLUSTERINGNEIGHBORHOODMODEL:PARAMETRIC4CHAPTER 4.05


Park: 0 Parklet: 1 Marketplace: 1 Store: 2 Bridge (S): 1 Bridge (L): 1
CLUSTERINGNEIGHBORHOOD010509
Occ. Rate: 57
MOD 11
Bridge: 0 Core: 1 Stair: 0 Balcony: 2 Housing 01: 1 Housing 02: 1
Bridge: 0 Core: 2 Stair: 1 Balcony: 1 Housing 01: 1 Housing 02: 0
Occ. Rate: 38
MOD 11
Bridge: 0 Core: 3 Stair: 0 Balcony: 2 Housing 01: 0 Housing 02: 0
Park: 2 Parklet: 0 Marketplace: 1 Store: 2 Bridge (S): 1 Bridge (L): 1
Park: 0 Parklet: 1 Marketplace: 0 Store: 3 Bridge (S): 0 Bridge (L): 2
MOD 10
Park: 2 Parklet: 1 Marketplace: 1 Store: 2 Bridge (S): 1 Bridge (L): 0 Bridge: 1 Core: 1 Stair: 0 Balcony: 1 Housing 01: 1 Housing 02: 0

Occ. Rate: 49
020610
Occ. Rate: 32
The function of each neighborhood is defined by its dominating neighborhood types shall be identified: farming, commercial, instances occur where there is more than one dominating fied as a mixed-use neighborhood with the main functions ules.
Bridge: 1 Core: 1 Stair: 0 Balcony: 3 Housing 01: 0 Housing 02: 0
Occ. Rate: 60
040812
Park: 2 Parklet: 1 Marketplace: 1 Store: 4 Bridge (S): 0 Bridge (L): 1
Occ. Rate: 52
MOD 11
Occ. Rate: 61
Park: 1 Parklet: 1 Marketplace: 1 Store: 1 Bridge (S): 2 Bridge (L): 0
Bridge: 1 Core: 1 Stair: 0 Balcony: 2 Housing 01: 1 Housing 02: 0
MOD 11
Bridge: 1 Core: 1 Stair: 0 Balcony: 0 Housing 01: 0 Housing 02: 0
2022THESISMACAD BersabeJ.JohnNeil 56 030711
Park: 2 Parklet: 0 Marketplace: 1 Store: 2 Bridge (S): 0 Bridge (L): 0
Occ. Rate: 60
Park: 2 Parklet: 0 Marketplace: 1 Store: 0 Bridge (S): 2 Bridge (L): 1
Bridge: 0 Core: 4 Stair: 2 Balcony: 1 Housing 01: 0 Housing 02: 0
Occ. Rate: 43
dominating module. Hence, three commercial, and residential. If such dominating module, it will be classi functions of the dominating mod


Park: 2 Parklet: 0 Marketplace: 1 Store: 0 Bridge (S): 1 Bridge (L): 0
Bridge: 0 Core: 3 Stair: 0 Balcony: 2 Housing 01: 0 Housing 02: 0
Occ. Rate: 60
MOD 11
MOD 11
MOD 11
Bridge: 0 Core: 3 Stair: 1 Balcony: 0 Housing 01: 2 Housing 02: 1
Park: 3 Parklet: 1 Marketplace: 1 Store: 2 Bridge (S): 1 Bridge (L): 0
MOD 11
Bridge: 0 Core: 0 Stair: 1 Balcony: 1 Housing 01: 1 Housing 02: 0
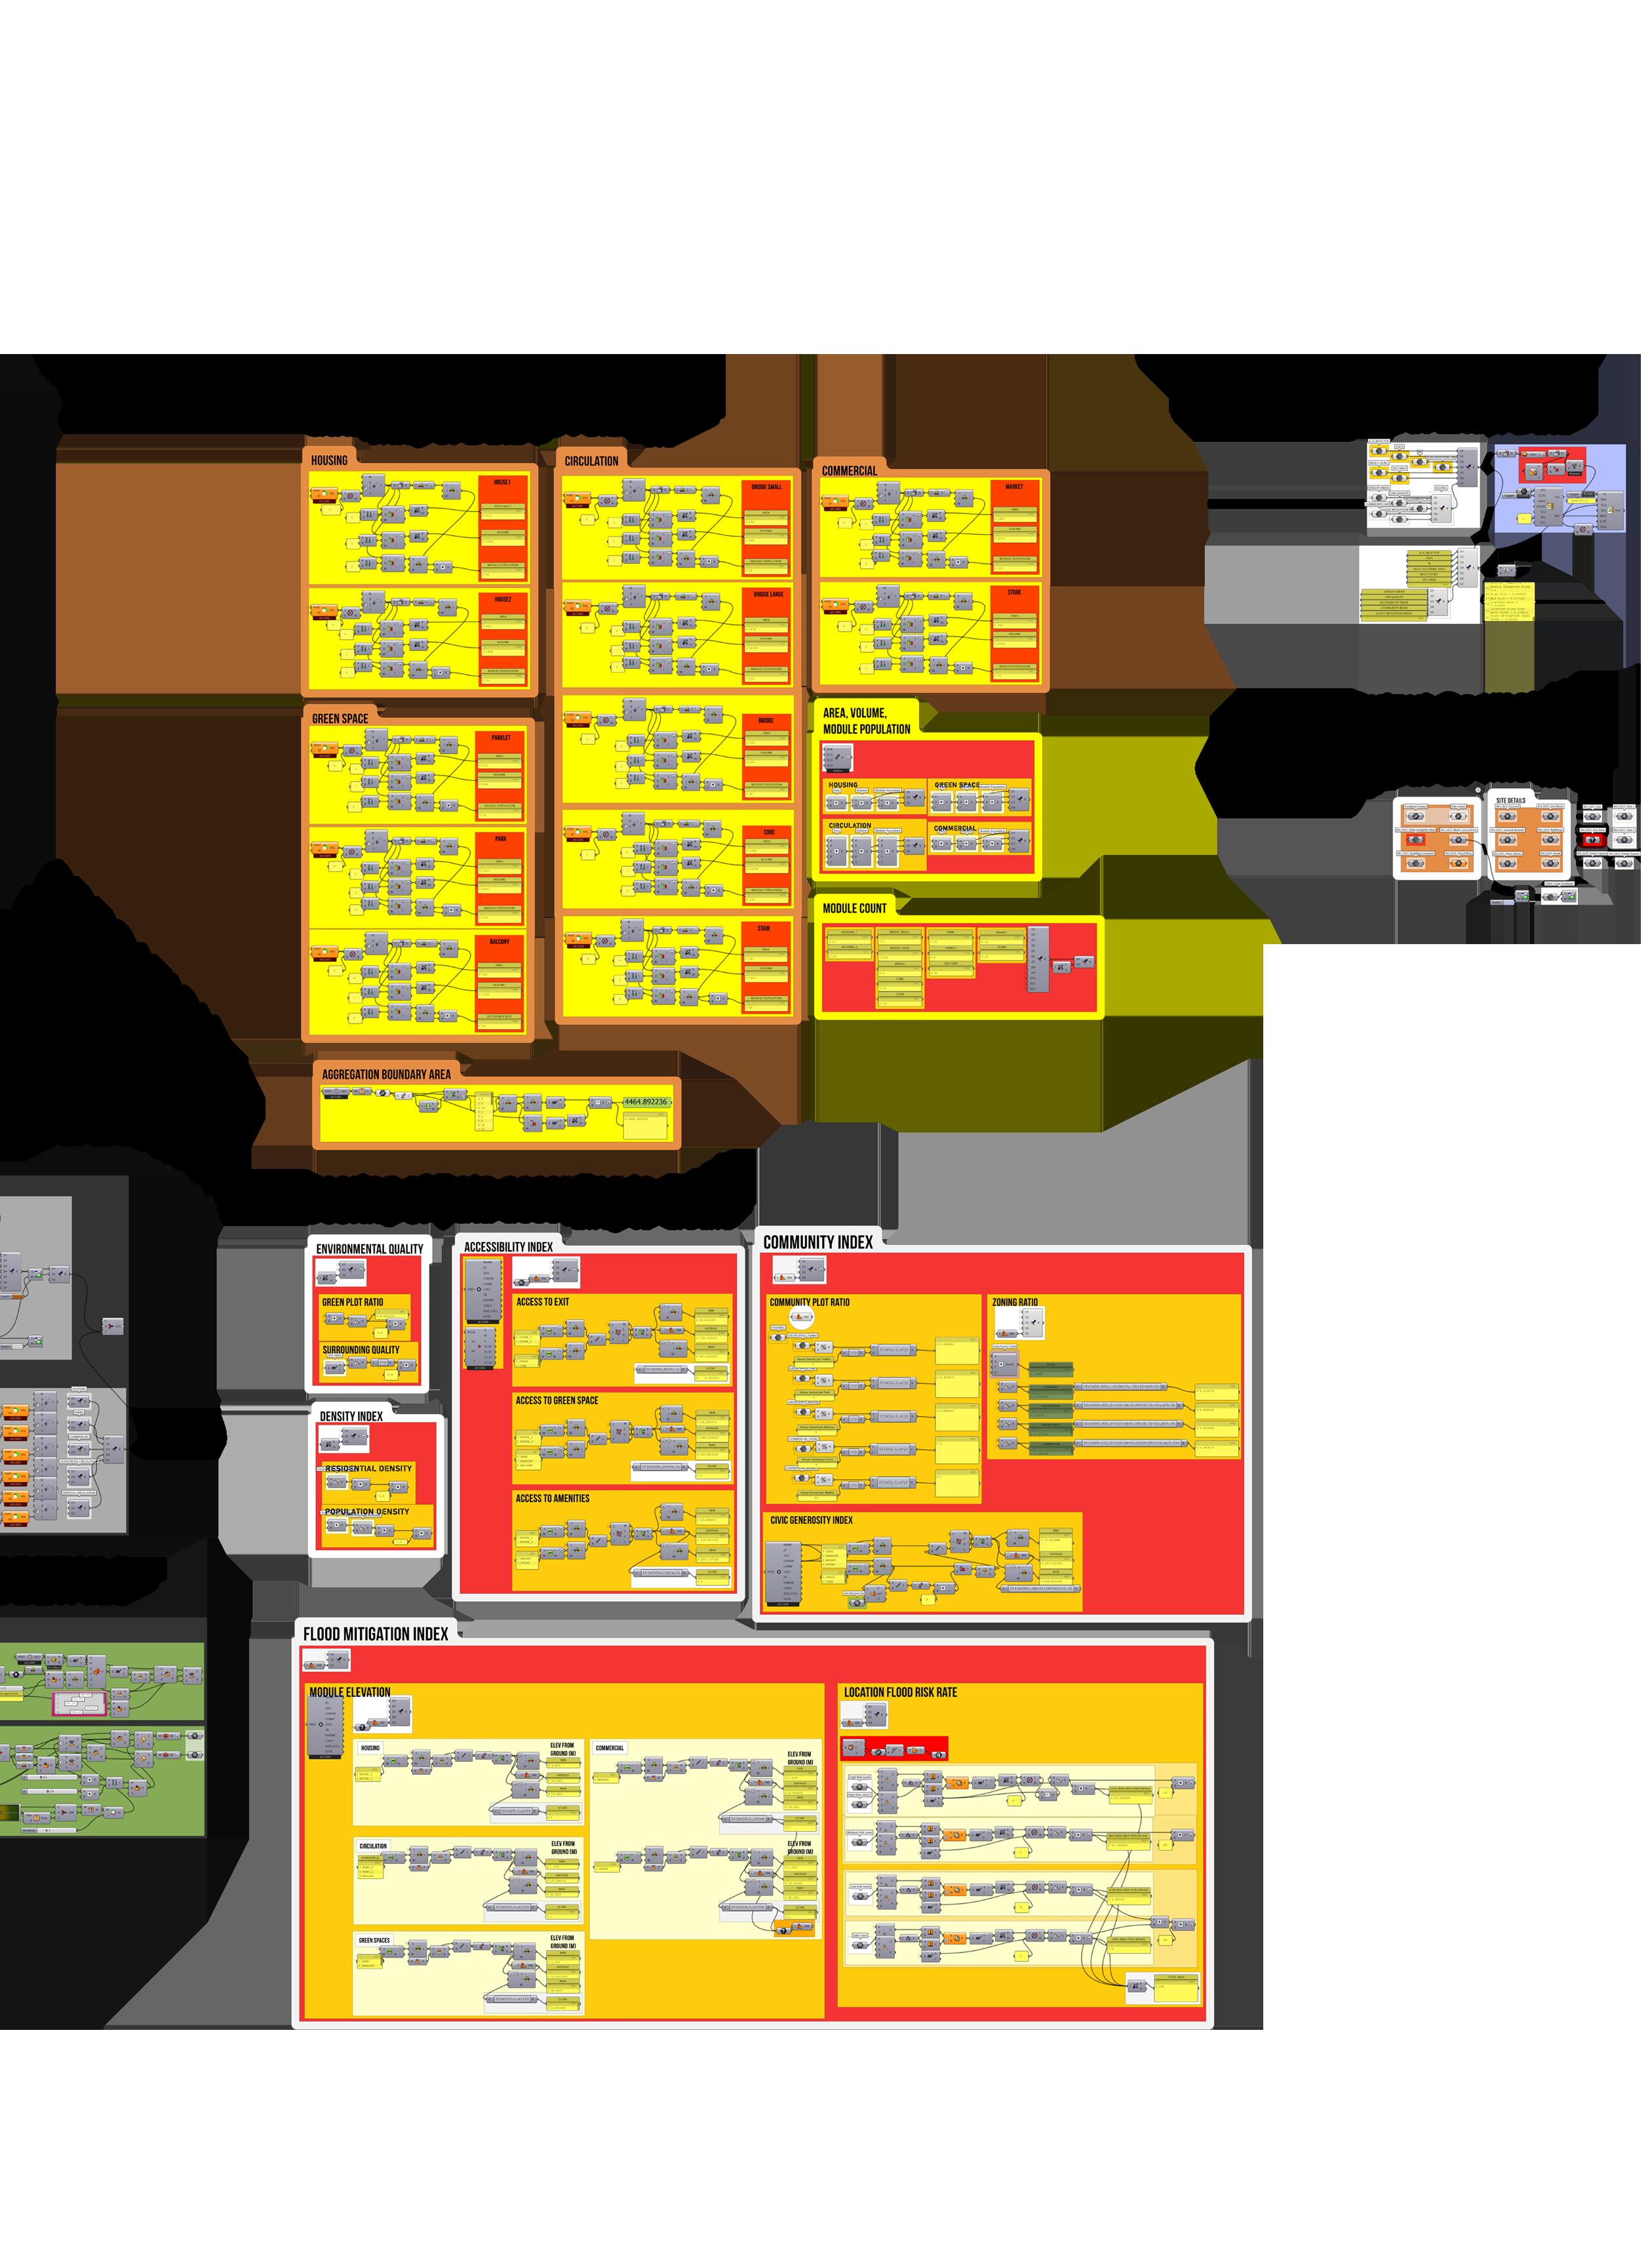
SETTLERE: 57 4CHAPTER DEFINITIONGH 4.06 01 0302 04 05 06 DEFINITIONGHMODEL:PARAMETRIC

2022THESISMACAD BersabeJ.JohnNeil 58 07 08
05 AI: DEPLOYMENTWEBLEARNINGMACHINE& 5.01 Data Set 5.02 Feature Selection 5.03 Supervised Machine Learning: Regression 5.04 Web Deployment
DATASET SHAPE: (6718 , 57)
Input Features SET
H_Area H_VolumeH_ModPopCir_Area Cir_VolumeCir_ModPopG_Area G_VolumeG_ModPopCom_AreaCom_VolumeCom_ModPopTOTALAGGFLOORAREAAGGPARTCOUNTAGGBOUNDARYAREAModCount_Housing1ModCount_Housing2ModCount_BridgeSModCount_BridgeLModCount_BridgeModCount_CoreModCount_StairModCount_ParkModCount_ParkletModCount_BalconyModCount_MarketModCount_StoreTOTALMODULECOUNTSITEAREA ResDensityPopDensityGreenPlotRatioSurroundingQAccess 111633489898222946510364311129334262952885628618201594750010165611122252618207514202595316889.71488.042130.70.2910.3910.25610.8 6842052594792143874822205661521113864158124906724924104131847151416113351064250316889.72837.999244.80.4710.3970.481110.8310.641 972291685697520950712344710341323192657781751332036739758152575191924177491397368316889.72445.373213.80.4540.3950.333110.8490.4 9722916857523225917563699110973452106631819214300394430081527762222251895114108395316889.72260.244197.70.4520.3950.321110.8640. 57617284937331119737311253375115121536451086649195182121317321311145323954196316889.73162.95269.10.3020.3980.589110.7470.8120.0 79223766960901828660723497047233170151031531093230931226132260171822115431281310316889.72537.0362210.3770.3960.425110.8350.5420 41412423527848345280549164759936280883468314214331101421128112313741143316889.72888.584244.20.1810.3980.659110.66910.0970.5790. 13143942115120733617913304887146615233825114753832209981810107112093146222627173111314299819316889.71300.106113.80.230.3870.146 12243672107120143600313225049151475353825114753832211281510099101992145222627183111314299816316889.71212.0021060.240.3870.1410. 11523456101101763052110844437133114443105931530318870632822110176211722252618228114219633316889.71401.273122.90.2710.390.1610.7 378113432230869132413781134458192457733883125129819141712 681312637126 316889.72911.669246.50.1250.3980.677110.64410.1080.5790.3240.9280.485 1314394211511586347311273469814094491362710881361212257669692112084141222527172910014277767316889.71355.707118.70.2350.3880.149 1224367210711548346161268486914607505363610908362212777829704101984140222527182910114278767316889.71261.292110.30.2450.3880.143 11163348989308279359664113123393972709812725917246536646210164610322252618176514175537316889.71726.949151.60.3280.3920.25610.90 122436721071089932680118046621398647934291028733920214769921010197312922252718259414255711316889.71328.952116.20.2490.3880.1430 11163348989329279969694122123663992727818126117294540651210164710322252618176614177541316889.71713.779150.50.3250.3920.25610.90 12243672107120353606413255103153095423834115023842219682010126101993145222627183211514300821316889.71208.714105.70.2410.3870.1410.5530.4090.9790.2180.0580.6540.7660.9730.6131110.50.80.1410.02100.054 12243672107120353606413255139154175453825114753832222394610139101993145222627183311514299821316889.71207.269105.50.2430.3870.1410.550.4090.9850.2180.0580.6550.7710.9740.6151110.50.80.1410.02100.054 97229168566772005168232769828309191757511741284235838198152570191824167481396359316889.72545.075222.60.4470.3950.334110.8490.47 16745022148142144262513936894206826644140124203912692280010174172176135274740322011023253801316889.71645.296145.50.3480.3870.2340.990.8210.8810.2830.0660.6740.8540.9960.6471110.50.80.1410.02100.054 4141242353287985932856717016310713213955339161165311015281210112315847162316889.72504.466211.70.1570.3980.657110.6910.9520.0840 12063618106885726588905381611448370250275062361638149355451117399522252617146214152494316889.72174.994191.20.3530.3930.25810.90 1116334898864225945876395111853376243072902281613947452451016369122252618145914144475316889.72127.893186.90.3910.3930.25610.868 4501350383325997433358517556710713213955431165170811115291210112317847166316889.72634.603222.50.1520.3980.623110.6890.9520.090. 120636181069262278069593933117993812664799225417065527630911174210422252617176314170528316889.71911.4751680.320.3920.25810.9140 11163348989224276919544095122853932655796525317090524630010164210322252618176314169525316889.71771.355155.50.3360.3920.25610.89
SETTLERE: 5CHAPTER 61 SETDATADEPLOYMENT:WEB&LEARNINGMACHINEAI, 5.01 DATA
The dataset is comprised of numerical data gathered from the grasshopper definition getting the input data, semantic features, and output. The current dataset has around 6700 samples with 57 columns.
AccessQualitytoExitAccesstoGreenSpaceAccesstoAmenitiesCommunityPlotRatioCivicGenerosityIndexHousingZoneRatioCirculationZoneRatioGreenSpaceZoneRatioCommercialZoneRatioZoningRatioScoreModElev_HousingModElev_CirculationModElev_GreenSpaceModElev_CommercialMODULEELEVATIONSCOREHighRiskMedRiskLow/SafeRiskLOCATIONFLOORRISKRATEDENSITYINDEX ENVIRONMENTALQUALITY ACCESSIBILITYINDEX COMMUNITYINDEX FLOODMITIGATIONINDEX 111633489898222946510364311129334262952885628618201594750010165611122252618207514202595316889.71488.042130.70.2910.3910.25610.8930.9220.2460.0650.6580.790.9860.6251110.50.80.1410.02100.054 809.3561010.681421 0.716288 0.597784 0.427033 6842052594792143874822205661521113864158124906724924104131847151416113351064250316889.72837.999244.80.4710.3970.481110.8310.641 0.0820.6740.8110.9970.6411110.50.80.1410.02100.054 1541.3987070.867468 0.826945 0.704179 0.427033 972291685697520950712344710341323192657781751332036739758152575191924177491397368316889.72445.373213.80.4540.3950.333110.8490.4690.0790.6810.8630.9640.6461110.50.80.1410.02100.054 1329.6084830.848735 0.777817 0.655037 0.427033 9722916857523225917563699110973452106631819214300394430081527762222251895114108395316889.72260.244197.70.4520.3950.321110.8640.4250.0730.6770.8620.9820.6491110.50.80.1410.02100.054 1228.9496670.846621 0.773511 0.645668 0.427033 57617284937331119737311253375115121536451086649195182121317321311145323954196316889.73162.95269.10.3020.3980.589110.7470.8120.0950.6270.5640.9610.5621110.50.80.1410.02100.054 1716.0099830.700158 0.863109 0.706914 0.427033 79223766960901828660723497047233170151031531093230931226132260171822115431281310316889.72537.0362210.3770.3960.425110.8350.5420.0780.6330.7160.9930.6051110.50.80.1410.02100.054 1379.0329710.773155 0.808244 0.66052 0.427033 41412423527848345280549164759936280883468314214331101421128112313741143316889.72888.584244.20.1810.3980.659110.66910.0970.5790.3910.9410.5021110.50.80.1410.02100.054 1566.3940450.579041 0.886272 0.723555 0.427033 0.570.4130.9390.2180.0630.6480.7370.9730.6051110.50.80.1410.02100.054 706.9448260.616987 0.376325 0.587375 0.427033 12243672107120143600313225049151475353825114753832211281510099101992145222627183111314299816316889.71212.0021060.240.3870.1410.5620.4090.9740.2180.0590.6520.7610.9730.6111110.50.80.1410.02100.054 658.976830.626801 0.370594 0.600985 0.427033 11523456101101763052110844437133114443105931530318870632822110176211722252618228114219633316889.71401.273122.90.2710.390.1610.7320.5650.9310.2290.0650.6580.7840.9830.6221110.50.80.1410.02100.054 762.0638520.660244 0.486081 0.594191 0.427033 316889.72911.669246.50.1250.3980.677110.64410.1080.5790.3240.9280.485 11111 0.1410.02100.054 1579.079980.523147 0.892252 0.709593 0.527033 0.6230.4390.9290.2180.0660.6490.7380.9750.6071110.50.80.1410.02100.054 737.1783350.622879 0.403625 0.584705 0.427033 0.6080.4330.9630.2190.0610.6530.7630.9750.6131110.50.80.1410.02100.054 685.7760890.63259 0.394882 0.598119 0.427033 11163348989308279359664113123393972709812725917246536646210164610322252618176514175537316889.71726.949151.60.3280.3920.25610.9010.9040.280.0690.6580.7950.9920.6281110.50.80.1410.02100.054 939.2993870.719406 0.719092 0.604149 0.427033 122436721071089932680118046621398647934291028733920214769921010197312922252718259414255711316889.71328.952116.20.2490.3880.1430.6520.4640.940.2180.0640.6580.7690.9770.6171110.50.80.1410.02100.054 722.5633820.636966 0.419718 0.591779 0.427033 11163348989329279969694122123663992727818126117294540651210164710322252618176614177541316889.71713.779150.50.3250.3920.25610.9020.9040.2780.0690.6580.7940.9910.6281110.50.80.1410.02100.054 932.1360610.716845 0.719484 0.603245 0.427033 10.5530.4090.9790.2180.0580.6540.7660.9730.6131110.50.80.1410.02100.054 657.1891240.62825 0.367463 0.603577 0.427033 10.550.4090.9850.2180.0580.6550.7710.9740.6151110.50.80.1410.02100.054 656.4031030.630076 0.366757 0.605749 0.427033 97229168566772005168232769828309191757511741284235838198152570191824167481396359316889.72545.075222.60.4470.3950.334110.8490.4740.0820.6860.850.9950.6531110.50.80.1410.02100.054 1383.8193240.841981 0.777859 0.658848 0.427033 40.990.8210.8810.2830.0660.6740.8540.9960.6471110.50.80.1410.02100.054 895.3793450.735323 0.682043 0.603862 0.427033 4141242353287985932856717016310713213955339161165311015281210112315847162316889.72504.466211.70.1570.3980.657110.6910.9520.0840.5490.3540.940.4821110.50.80.1410.02100.054 1358.0980610.554715 0.885678 0.708567 0.427033 12063618106885726588905381611448370250275062361638149355451117399522252617146214152494316889.72174.994191.20.3530.3930.25810.90.8720.3210.0790.6560.7770.9970.6271110.50.80.1410.02100.054 1183.0811710.745545 0.719026 0.606679 0.427033 1116334898864225945876395111853376243072902281613947452451016369122252618145914144475316889.72127.893186.90.3910.3930.25610.868 0.8860.3370.0740.6640.8160.9990.6381110.50.80.1410.02100.054 1157.3755740.784638 0.707975 0.620386 0.427033 4501350383325997433358517556710713213955431165170811115291210112317847166316889.72634.603222.50.1520.3980.623110.6890.9520.090.5540.3590.9440.4871110.50.80.1410.02100.054 1428.5404270.549597 0.874256 0.709601 0.427033 120636181069262278069593933117993812664799225417065527630911174210422252617176314170528316889.71911.4751680.320.3920.25810.9140.8890.2860.0760.6530.7680.9930.6231110.50.80.1410.02100.054 1039.7410440.712137 0.723921 0.599235 0.427033 11163348989224276919544095122853932655796525317090524630010164210322252618176314169525316889.71771.355155.50.3360.3920.25610.8970.9040.2880.070.6580.7990.9940.631110.50.80.1410.02100.054 963.4517980.728033 0.717838 0.60733 0.427033 Predicted ScoreSemantic Features 2022THESISMACAD BersabeJ.JohnNeil 62 EnvironmentalQuality AccessibilityIndex FloodIndexMitigation DensityIndex CommunityIndex Existing Score New Score Community Index Flood MitigationRisk AccessibilityEnvironmentalQualityIndexDensityIndex INPUT OUTPUT 0 TOTAL AGG FLOOR AREA 1 AGG PART COUNT 2 AGG BOUNDARY AREA 3 TOTAL MODULE COUNT 4 RES DENSITY 5 POP DENSITY 6 GREEN PLOT RATIO 7 SURROUNDING QUALITY 8 ACCESS TO EXIT 9 ACCESS TO GREEN SPACE 10 ACCESS TO AMENITIES 11 COMMUNITY PLOT RATIO 12 CIVIC GENEROSITY INDEX 13 HOUSING ZONE RATIO 14 CIRCULATION ZONE RATIO 15 GREEN SPACE ZONE RATIO 16 COMMERCIAL ZONE RATIO 17 ZONING RATIO SCORE 18 MODELEV_HOUSING 19 MODELEV_CIRCULATION 20 MODELEV_GREEN SPACE 21 MODELEV_COMMERCIAL 22 MODULE ELEVATION SCORE 23 HIGH RISK 24 MED RISK 25 LOW/SAFE RISK 26 LOCATION FLOOR RISK RATE
SELECTIONFEATURE
The dataset currently has a variety of in put features. For feature selection, a bet ter understanding of each feature must be visualized and understood to reduce the dimensionality and drop unneces sary features. This step ensures a con cise model that minimizes the chances of overfitting. Finding correlations through plots and reducing dimensionality with PCA (Principal Component Analysis) will be used to identify and drop correlated
Correlation Heatmap 5.2.1SETTLERE: 5CHAPTER 63 SELECTIONFEATUREDEPLOYMENT:WEB&LEARNINGMACHINEAI, 5.02

features.Thecorrelation
heatmap shows which attributes are related either proportion ally or inversely. This plot shows the lighter-colored cells have little correla tion between them and gives an insight into which features linearly influence the features we want to predict.
2022THESISMACAD

BersabeJ.JohnNeil
64
5CHAPTER 65 SELECTIONFEATUREDEPLOYMENT:WEB&LEARNINGMACHINEAI,
SETTLERE:
5.2.2
The Pairplots, also known as a scatterplot ma trix, show the distribution of data and also show the correlation between two variables in the matrix. This gives a broader understanding of the data distribution within the dataset.
Bivariate Distributions Pairplots

2022THESISMACAD BersabeJ.JohnNeil 66

The Heatmap plots the different features against the PCAs and show the positive cor relation in teal and negative correlation in orange while showing little to now correlation in light grey to deter mine which features have the least impact theothers


SETTLERE: 5CHAPTER 67
5.2.3
SELECTIONFEATUREDEPLOYMENT:WEB&LEARNINGMACHINEAI,
PCA Heatmap
datasetthethesuffice9thatFromthescreeplotsforthePCAs,itwasclearretainingaround6-inputfeatureswouldindescribingproblemclearly,soitispossibletoreducedimensionallyofthebyreducingthefeatures.
Principal Component Analysis (PCA)
PCA Scree Plot
The PCA biplot projects a high-dimensional set of data into a two-dimensional one to see which features could be removed by showing highly correlatedvectors.
0 PC0 Agg Boundary Area 1 PC1 Zoning Ratio Score 2 PC2 Low/Safe Risk 3 PC3 Med Risk 4 PC4 Commercial Zone Ratio 5 PC5 Module Elevation Score 6 PC6 ModElev_Green Space 7 PC7 ModElev_Commercial 8 PC8 ModElev_Commercial 9 PC9 Civic Generosity Index 10 PC10 Location Flood Risk Rate 11 PC11 Med Risk 12 PC12 Commercial Zone Ratio 13 PC13 Access to Green Space 14 PC14 Civic Generosity Index 15 PC15 Access to Exit 16 PC16 Community Plot Ratio 17 PC17 High Risk 18 PC18 Agg Part Count 19 PC19 Housing Zone Ratio 20 PC20 Total Agg Floor Area 21 PC21 Total Module Count 22 PC22 Res Density 23 PC23 Agg Boundary Area 24 PC24 Zoning Ratio Score 25 PC25 ModElev_Housing 26 PC26 ModElev_Circulation 0 1 0 1 PCA Biplot
2022THESISMACAD BersabeJ.JohnNeil 68
VALIDATIONEPOCHSLOSSOPTIMIZERDATASHAPE SPLIT
Loss Function
RELU
LAYER (TYPE) OUTPUT SHAPE PARAM #
DENSE_14 (DENSE) (NONE, 10) 250
Model Architecture Summary RELU
Training 1.0
LEARNINGMACHINESUPERVISEDDEPLOYMENT:WEB&LEARNINGMACHINEAI,
Model Architecture Summary
The first training model architecture results turn out to be slightly over fitting. This might be due to the fact that there are too many parameters in the architecture even with the ap plication of a dropout layer. For the next iterations, some options for op timizing this loss function could be increasing the dropout percentage or reducing the number of parameters in the model architecture
DENSE_12 (DENSE) (NONE, 64) 1792
69 SETTLERE: 5CHAPTER
REGRESSIONMACHINESUPERVISEDLEARNING:
MODEL: "SEQUENTIAL_4"
ACTIVATIONRELURELUSIGMOID
The second training model improved slightly better with the reduction of the loss value. Succeeding iterations would play around the reduction of the parameters more and tweaking the model architecture.
Training 2.0
NONTRAINABLETOTAL=================================================================55PARAMS:3,657PARAMS:3,657TRAINABLEPARAMS:0
MODEL: "SEQUENTIAL_3"
Loss Function


5.03
NONTRAINABLETOTAL==================================================================================================================================#DENSE_14(DENSE)(NONE,96)2688DENSE_15(DENSE)(NONE,48)4656DENSE_16(DENSE)(NONE,22)1078DROPOUT(DROPOUT)(NONE,22)0DENSE_17(DENSE)(NONE,10)230DENSE_18(DENSE)(NONE,5)55PARAMS:8,707PARAMS:8,707TRAINABLEPARAMS:0
DENSE_15 (DENSE) (NONE, 5)
From the dataset, we have 6718 rows of samples. Using feature reduction strategies like Principal Component Analysis, We have also managed to reduce the number of feature columns from 51 to 9 entries.
LAYER (TYPE) OUTPUT SHAPE PARAM
Since we're predicting numerical values pertaining to scoring each KPI from known numerical inputs and outputs, supervised machine learning: linear regression will be used as our machine learning model.
DENSE_13 (DENSE) (NONE, 24) 1560
ACTIVATIONRELURELUSIGMOIDRELU
Ground Truth x PredictionPrediction Error
LOSS: 0.00286

MeanADAMSquare
(6718, 57)


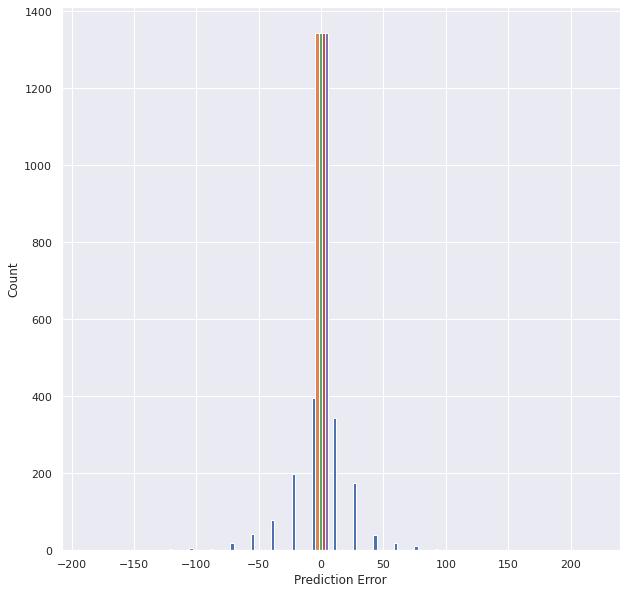

Ground Truth x PredictionPrediction Error
Error 0.2200
LOSS: 0.00295
2022THESISMACAD BersabeJ.JohnNeil 70

SETTLERE: 5CHAPTER 71
The website comprises the following features: The Concept, Flood Map, Module Typologies, and Interactive App

04030201 DEPLOYMENTWEBDEPLOYMENT:WEB&LEARNINGMACHINEAI,

The website RE: SETTLE uses a Graphic user interface. It is an in teractive website containing carefully selected topics to educate the users regarding the Study's creation, formation, and end prod uct using multiple software and applications.
WEB DEPLOYMENT
5.04
2022THESISMACAD BersabeJ.JohnNeil 72 The Module Typol ogies button leads the users to an in teractive explana tion of the different theofentoverlayhoststandingmayStudy.modulesusedintheTheusersrotatethevariousmodulestounderstandthespace,volume,andarea.Theconceptbuttonleadstheusertofindthedifferentstepsinunderthestudyflowthroughasequentialprocess.ThepagealsoconsistsofTwo(2)Additionalclickable-buttons:BlogpostandBook.IncludingbothfeaturesallowstheuserstoexploreotheronlineplatformsthattheStudyTheFloodMapbuttonleadstheuserstoaninteractivemapshowinganofdifferhousingtypesandtheprojectedinundationmapsDavaoCity,Philippines.ThisfloodmapgivestheusersinsightintotheSiteSelectioncriteriaofStudy. The Concept01 Flood ModuleMapTypologies0302


04 DEPLOYMENTWEBDEPLOYMENT:WEB&LEARNINGMACHINEAI, DiagramshowingRhino.Computeprocess
SETTLERE:
Interactive App button leads the users to the main application that uses Rhino.compute to serve the parametric model on the Web. The website allows the user to interactively play around with different pa rameters to gain context and understanding of the various performanc es of each design iteration.
Interactive App

5CHAPTER The73

2022THESISMACAD BersabeJ.JohnNeil 74
FloodShowingLayer
Enabling the <Show Flood Map> Options adds the flooding layer int the viewport. This givestheabilitytocheckifthebuildzoneorthestartoftheaggregationisinsidetheriskmap


ShowGeometryDetailed
oftheThistailedEnablingthe<ShowDeBuildings>allowstheusertoseethefulldetailofeachmodule.optionmighttakesometimetoloadbutabilitytoshowthesedetailesgivesamoreindepthunderstandingtheaggregationlayout.
To modis di des do luptatio corum, il es mod et odis ad ea do lut estiatem eumquam diossequati optiorro quo omnisit atistius, alibeatium is quatecta tium estota dolupta si volore di berum ressini enimenimus sunt deli quae pratibus dolo mo lupti uscilles nusae por apicaborem. Poruptam
Perform Iterations


06 CONCLUSIONS
SETTLERE:
6CHAPTER 79 CONCLUSION
Next Steps
However,eration.
some iterations are impractical and deemed improbable to implement on-site due to a lack of structural feasibility and other environmental performances. But, in the long run, the metrics pro vided are suitable for future studies and implemen tation indicators.
Conclusions
The resettlement strategies presented throughout the study were methods used to prove the validity, effectiveness, and adaptability of machine learning in Architecture and Design.

The project could be taken further by improving on the different KPIs presented and adding more com plex layers to understand the problem better. Addi tionally, Using the app proved that the trained model performed well in predicting the scoring of each it
Understanding the problems caused by Flooding, Housing, Environment, and Human Behavior paved the way to reconfiguring current housing strategies. The project achieved a flexible design strategy that caters to the issues presented.
Nowadays, it is possible to materialize design com plexities and gain a better understanding of them because of the potentials of Machine Learning. It broadens the perspective of finding better design solutions by providing the ability to predict solutions identical to the regression model in the study. The power of AI, coupled with the ability to deploy geom etries on the web as a service, brings in a new way of defining a participatory approach to design. This technological advancement redefines the role of ar chitects in the design process, from being a designer to an integrator.
80
2022THESISMACAD
BersabeJ.JohnNeil

07

REFERENCES

Geoadmin.(2017, July 12).City of Davao, Davao Del Sur 100 Year Flood Hazard Map. LiDarPortalforArchivingandDistribution.https://lipad-fmc.dream.upd.edu.ph/layers/geonode%3Adavao_fh100yr_10m
Carrasco,S & O'Brien, D. (2020, September 22).Beyond the Freedom to Build: Longterm outcomes of Elemental's incremental housing in Quinta roybuild_Long-term_outcomes_of_Elemental's_incremental_housing_in_Quinta_Monhttps://www.researchgate.net/publication/351640148_Beyond_the_freedom_to_Monroy.Researchgate
Baker, J. et al.(undated). Philippines Urbanization Review. VISEDdocuments1.worldbank.org/curated/en/963061495807736752/pdf/114088-REWorldBankGroup.https://PUBLICPhilippines-Urbanization-Review-Full-Report.pdf
2022THESISMACAD BersabeJ.JohnNeil 82

Tsigkouni, S. (2012-2013).Plug-in City, Archigram 1964. Sheffield School of Archi tecture.https://www.academia.edu/6048928/PLUG_IN_CITY_Archigram

Wong, S.W, et al. (2016). Garden City, Megacity: Rethinking Cities for the Age of Glob al Warming. CTBUH Research essay-sustainability-and-urban-density.pdfhttps://www.clc.gov.sg/docs/default-source/urban-solutions/urb-sol-iss-9-pdfs/warming.pdfdownload/3010-garden-city-megacity-rethinking-cities-for-the-age-of-global-Paper.https://global.ctbuh.org/resources/papers/ Wong, S.W & Hassell, R. (undated). Sustainability and Urban Density Grden City Mega City. Essay. urb-sol-iss-9-pdfs/essay-sustainability-and-urban-density.pdfhttps://www.clc.gov.sg/docs/default-source/urban-solutions/
Marife,B.M. (2010), linking Poverty and the Environment: Evidence from Slums in Philippine Cities, ECONSTOR. https://www.econstor.eu/bistream/10419/126823/1/ pidsdps1033.pdf
Galang, V.M. (2019, June 18).Why co-living spaces are on the rise in the metro. Busi nessWorld.https://www.bworldonline.com/editors-picks/2019/06/18/236827/why-co-living-spaces-are-on-the-rise-in-the-metro/
Natapov, A. Et Al (2019, October 21). Linking Building- circulation typology and way finding:design, spatial analysis and anticipated wayfinding difficulty of circulation types. Architectural Science patedwayfindingdifficultyofcirculationtypespdflinkingbuildingcirculationtypologyandwayfindingdesignspatialanalysisandanticiReview.https://www.slideshare.net/JenniferPaul43/
Geoadmin.(2017, July 12).City of Davao, Davao Del Sur 25 Year Flood Hazard Map. LiDarPortalforArchivingandDistribution.https://lipad-fmc.dream.upd.edu.ph/layers/geonode%3Aph112402000_fh25yr_30m_10mlayers/geonode%3Aph112402000_fh5yr_30m_10
Pradhan, P.K. (2004). Population Growth, Migration and Urbanisation. Environmental Consequences in Kathmandu Valley, Nepal. In: Unruh, J.D., Krol, M.S., Kliot, N. (eds) Environmental Change and its Implications for Population Migration. Advances in Global Change Research, vol20.Springer,Dor drecht.https://doi.org/10.1007/978-1-4020-2877-9_9 Acioly, C. & Payot, J. (undated). Process Mapping. Davao:buildingchannelsofparticipationandthe landquestionFinal.https://www.cordaid.org/nl/wp-content/uploads/sites/2/2014/08/PM_Davao_Philippines_1.pdf Everything Connects: Urban Sprawl. (2014).Retrieved from https://www.everythingconnects.org/ urban-sprawl.html Brody,S.(2014). The Characteristics, Causes and Consequences of Sprawling Development Patterns in the United States. es-of-sprawling-103014747/https://www.nature.com/scitable/knowledge/library/the-characteristics-causes-and-consequencConservationandResortation. Flooding in Urban Areas.(2008). Retrieved from student/thingstoknow/hydrology/urbanfloods.htmlhttps://www.floodsite.net/juniorfloodsite/html/en/ Alvarez-Diaz, R. & Villalon, C. (undated). 5 Reasons Affordable Housing Creates a Better World. Al varez-Diaz&VillalonArchitectureInteriorDesign.https://www.alvarezdiazvillalon.com/blog/5-reasons-affordable-housing-creates-better-world Lagma,J. F(undated).Anatomy of the Nation's Housing tent/uploads/2011/07/Anatomy-of-the-nations-housing-problems.pdfProblems.https://www.philrights.org/wp-con APFM.(2013, May 19). What are the negative social impacts of flooding.AssociatedProgrammeon FloodManagement. (https://www.floodmanagement.info/what-are-the-negative-social-impacts-offlooding/ Denchak,M. (2019, April 10).Flooding and Climate Change: Everything You Need to Know. Natural ResourcesDefenceCouncil.https://www.nrdc.org/stories/flooding-and-climate-change-everything-you-need-knowMejos,A.(2014,December27).UrbanBlight.Sunstar.https://www.sunstar.com.ph/ampArticle/384991 Geoadmin.(2017, July 12).City of Davao, Davao Del Sur 5 Year Flood Hazard Map. LiDarPortalfor ArchivingandDistribution.https://lipad-fmc.dream.upd.edu.ph/layers/geonode%3Aph112402000_fh5yr_30m_10m Pedregosa et al., JMLR 12, pp. 2825-2830, 2011 https://scikit-learn.org/stable/index.html Fragachan, C. et al., (2019, January 13).Oikos.AADRL 17/19Issuu. https://issuu.com/c_tz/docs/oikos_ final_book Rossi, A.(undated). Wasp- A combinational tollkit fir discrete design.Food4Rhino. https://www.food 4rhino.com/en/app/wasp Neil John J. BersabeFacultyStudent Angelos Chronis © RE:SETTLE IS A PROJECT OF IAAC, INSTITUTE FOR ADVANCED ARCHITECTURE OF CATALONIA DEVEL OPED AT THE MASTER IN ADVANCED COMPUTA TION FOR ARCHITECTURE AND DESIGN (MACAD) IN 2021/2022 BY STUDENT: NEIL JOHN BERSABE AND FACULTY: ANGELOS CHRONIS


