

ACKNOWLEDGEMENT
Completing this Thesis to this level of detail would have been impossible without the help of an array of people and I would like to extend my sincere gratitude to each one of them.
I am extremely obliged to my guide Dr. Anil kumar PP for his timely input, endless support, guidance and willingness to listen patiently throughout the Thesis.
I would also like thank Prof. A.K. Kasthurba and Ar. Afifa Nuzhat, Course coordinators for their valuable comments and suggestions to improve and add depth to the study. I would also like to extend my gratitude to all my faculties and Department of Architecture, NIT, Calicut.
Last but not the least I would like to thank my parents and friends for their relentless support and care. I am grateful to everyone including the experts whom I’ve interviewed for this study; who have helped in different stages of my work to complete this seminar study.
TABLE OF CONTENTS 1. INTRODUCTION.................................................................................................................1 1.1. Reasons behind selecting this project................................................................................1 1.2. Aim of the project..............................................................................................................1 1.3. Objectives..........................................................................................................................1 1.4. Scope of the project...........................................................................................................1 1.5. Limitations.........................................................................................................................1 1.6. Methodology......................................................................................................................1 2. DATA ANALYSIS.................................................................................................................3 3. LITERATURE CASE-STUDIES.......................................................................................14 3.1. Hague central station.......................................................................................................14 3.2. Arnhem central transfer terminal.....................................................................................21 4. LIVE CASE-STUDIES........................................................................................................33 4.1. Secunderabad railway station...........................................................................................33 4.2. Krantivira sangoli rayana railway station.........................................................................36 5. SITE STUDY.........................................................................................................................39 5.1. Introduction.......................................................................................................................39 5.2. Climate study....................................................................................................................40 5.3. Air quality.........................................................................................................................42 5.4. Geography........................................................................................................................42 5.5. Demographics...................................................................................................................43 5.6. Politics..............................................................................................................................43 5.7. Historical significance......................................................................................................43 6. SITE CONNECTIVITY......................................................................................................45 6.1. Static features...................................................................................................................45 6.1.1. Sectoral distribution...................................................................................................46 6.1.2. Radial distribution......................................................................................................48 6.2. Dynamic features.............................................................................................................49
6.2.1. Trains movement.......................................................................................................49 6.2.2. Passenger flow...........................................................................................................50 6.2.3. Bus and auto routes....................................................................................................51 7. EXISTING SITE CONDITIONS.......................................................................................52 7.1. Acquired lands and demolished buildings.......................................................................53 7.2. SWOT analysis................................................................................................................53 8. ZONING AND ANALYSIS................................................................................................55 8.1. Grid analysis....................................................................................................................55 8.2. Site zoning.......................................................................................................................57 8.3. Site math..........................................................................................................................59 8.4. Area statement and comparative analysis........................................................................60 9. DESIGN DEVELOPMENT................................................................................................61 9.1. Access to the site..............................................................................................................61 9.1.1. Platform 1...................................................................................................................61 9.1.2. Platform 6...................................................................................................................61 9.2. Design programming........................................................................................................61 9.2.1. Types of users.............................................................................................................61 9.2.2. Circulation pattern......................................................................................................61 9.2.3. Design requirements...................................................................................................62 9.2.4. Design considerations.................................................................................................63 9.3. Concept.............................................................................................................................63 9.4. Form development............................................................................................................64 10. DESIGN DRAWINGS.......................................................................................................66 11. DETAILING.......................................................................................................................67 11.1. Vertical transportation....................................................................................................67 11.2. Building structure...........................................................................................................67 12. SPECIAL STUDY..............................................................................................................68 12.1. Indoor landscaping.........................................................................................................68
12.2. Water harvesting............................................................................................................69 12.3. Solar energy harvesting..................................................................................................69 13. DESIGN RENDERS..........................................................................................................70
1. INTRODUCTION
1.1. REASONS BEHIND SELECTING THIS PROJECT
Railway stations are always unique in terms of their role, location, services and use with millions of users every single day. Towns and cities are often developed around them. A station can give an image to the town or city and act as a civic amenity for people who want to use the station facilities even if they are just visitors as well. If a station is well designed, it results in a successful rail network which supports economy, society and environment. Also, their effective integration with other modes of transport and the surrounding area can make it more appealing.
Stations were never a priority to be developed, to be made world-class when compared to other buildings like metro stations and airports. Hence, I wish to put forth a design that could stand as a reference model for the next era of railway stations.
1.2. AIM
To redevelop Lingampally railway station into a smarter, flexible and sustainable design; addressing current and future needs of various users.
1.3. OBJECTIVES
1. To study and analyze the behavior of existing design and locality; estimating the future needs of railway station.
2. To design a smarter station in terms of lighting and ventilation, Energy behavior, Acoustics, Movement, sense of space and safety.
3. To improve the quality of accessibity to the station.
4.To provide staff and users with proper amenities and accommodation facilities.
5. To suggest necessary measures to make it sustainable.
1.4. SCOPE
Design that would serve as a reference model to the next era of railway stations.
1.5. LIMITATIONS
Structural aspects of the design are ignored.
1.6. METHODOLOGY
1

2
Fig. 1. Methodology of thesis
2. DATA ANALYSIS
STRUCTURE-GAUGE CLEARANCES

FRIEGHT YARDS

3
RAILWAY AND BUS STATIONS


4

5


6


7


8


9

10
Fig. 2. Anthropometric details and other data.

11
Tab. 2.1. Minimum essential amenities at each category of station.

12
Tab. 2.2. Norms for quantum of minimum essential amenities at various categories of stations
Tab. 2.3. Norms for recommended level of amenities at various categories of stations

13
3. LITERATURE CASE-STUDIES
3.1. HAGUE CENTRAL STATION
Architects: Benthem Crouwel Architects
Location: Netherlands
Ground floor area: 20000.0 m2
Station Area: 15840 m²
Commercial Space Area: 3816 m²
Daily footfall: 1,90,000
The Hague Central Station has been re-designed into a light-filled, capacious and user friendly building; where all public transport systems converge. Solid building structure has been replaced with glass in favour of transparency. Inside, trams whiz above the trains along an elevated track.
HIGH SPEED LINE These days some 190,000 passengers and visitors make use of this Station. The number of users is expected to be doubled in the coming years, due to its link-up with the local rapid transit network and the high-speed rail line from Amsterdam to Paris.

14
Fig.3.1.1. Bird’s eye view of Hague station
ROOFED URBAN PLAZA
The new station acts as a roofed urban plaza, a place for residents and commuters alike. Its additional entrances have strengthened physical ties between the city centre and the financial district. There are four entrances in all and this foursidedness returns in the roof, which has been designed as a diagonal pattern of lozenge-shaped panels. These present a spectacular play of light and shadow whenever there is sunshine. These lozenges are responsive to climate, act as a shade, also contributes to the acoustics and acts as smoke vents during fire break out. Eight huge and elegant columns support the station roof. The station building, which measures 120 by 96 metres and is 22 metres tall, is almost entirely of glass.
Once inside, all modes of transport (train, tram and bus) as well as retail and hospitality areas can be seen. The design provides a natural and flexible organization of traffic flows. Multiple routes are possible and in fact every user creates a route of his own. The new station has the pedestrian boulevard running diagonally through the city, and the station concourse has itself become a meaningful public space.

15
Fig.3.1.2. Interior view of Hague
3.2. ARNHEM CENTRAL TRANSFER TERMINAL
Architects: UNStudio
Location: Stationsplein, Arnhem, The Netherlands
Area: 21750.0 sqm
Daily footfall: 1,10,000
The station is the result of a 20-year project that master planned by UN Studio which is to redevelop the wide station area. Backed by the Dutch government, this transfer hub rewrites the rulebook on train stations with its most complex design structure. The station will become the new ‘front door’ of the city, embracing the spirit of travel, and is expected to establish Arnhem as an important node between Germany, Netherlands and Belgium. The new terminal has commercial areas, and a conference centre and provides links to the nearby office plaza, city centre, underground parking garage and the Park. The area around the station will become a place in of itself, with 160,000m2 of offices, shops and a cinema complex.
The 21,750m2 Transfer Terminal features a dramatic twisting structural roof geometry, which enables column-free spans of up to 60m in the transfer hall. Taking references from the continuous inside/outside surface of a Klein Bottle, UN Studio aimed to blur distinctions

21
Fig.3.2.1. Arnhem central transfer terminal
between the inside and outside of the terminal by continuing the urban landscape into the interior of the transfer hall, where ceilings, walls and floors all seamlessly transition into one another.
The structure of the roof and twisting column was made possible by abandoning traditional construction methods and materials; much lighter steel replaced concrete and was constructed using boat building techniques on a scale that was attempted never before.

22
Fig.3.2.2. Inside Arnhem central transfer terminal
4. LIVE CASE-STUDIES
4.1. SECUNDERABAD RAILWAY STATION
Secunderabad railway station is a major intercity railway station and a commuter rail hub in the Hyderabad urban area. It is located in the heart of the city of Hyderabad and falls under the South Central Railway zone of Indian Railways. Built in 1874, by the Nizam of Hyderabad State, during the British era, this station was the main station of the Nizam's Railway, until the opening of Kachiguda Railway Station in 1916. Later on, its operation was taken over by the Indian Railways in 1951, when the Nizam's Railway was nationalized.
The station is well-connected by rail to all parts of India. 229 trains arrive at, or depart from, the station, daily. Situated on the Vijayawada – Wadi (main line of SCR) and SecunderabadManmad railway lines, it is the zonal headquarters station of the South Central Railway (SCR), and also the divisional headquarters station of Secunderabad Division of the SCR. The station has also achieved the ISO-9001 Certification for quality management in ticket booking, parcel and luggage booking and train management of platform.
INTERCHANGE AND CONNECTIVITY
The Secunderabad Railway Station is a junction of tracks from 5 directions – Secunderabad to:

Kachiguda-Kurnool-Guntakal-Bangalore
Malkajgiri-Bolaram-Nizamabad-Nanded-Parbhani
Vikarabad-Wadi
Bibinagar-Kazipet-Dornakal-Vijayawada Junction
Bibinagar-Nalgonda-Guntur-Tenali-Repalle
The Vijayawada-Secunderabad line and Repalle-Secunderabad line combines at Bibinagar junction near Secunderabad Station. Of these lines the Vijayawada Junction-Wadi line is the only electrified one.
33
Station is connected to almost all the parts by the Hyderabad MMTS, buses and Hyderabad Metro rail making it convenient for passengers to commute to and from the station. It also has taxi and auto stand; parking for more than 300 vehicles on platform 1 and platform 10.


34
Fig. 4.1.1. Hierarchy of the station
FACILITIES PROVIDED
Two foot over bridges are provided with escalators and lifts. Security is taken care of with CCTV survilleance, metal detectors, handheld sensors and others. Audio and Video PA system is set for passenger information. To make design barier-free; station has cane detectable surface at the edges of platform, wheelchairs and carts. Also seperate water points and waiting areas are provided for the differently abled. Signages, pay and use toilets, rail kiosks and water taps.
On platform-1; General booking, platform and current day reservation counters, drinking water facilty, cloak room, retails stalls, catering stalls, food plaza, telephone booth, ATM, tourism counter, medical store, RPF station, parcel office, SM,TC and DSM offices, waiting halls, retiring rooms, dormitory and lounges are provided.

Waiting areas for general passengers and differently abled sum up to 900 sqm and 554 sqm respectively. Dimensions of AC waiting hall is 10 x 7m; Ladies waiting hall is 6 x 7.25m and differently abled is 8 x 4m.
Water recycling plant is installed whose water is used for washing of nearly 800 coaches, aprons and platforms that require 30,000 litres of water.
35
Fig. 4.1.2. Images of the station
4.2. KRANTIVIRA SANGOLI RAYANA RAILWAY STATION
Bangalore City railway station, officially known as Krantivira Sangolli Rayanna railway station, is the main railway station serving the city of Bengaluru in Karnataka. It is the second busiest railway station in South India after the Chennai Central in Chennai with daily footfall of 2,20,000. It is electrified and is completed in 1993. Around 88 trains run through per day of which 63 are express trains.
INTERCHANGE AND CONNECTIVITY
The railway station is served by KSR City Railway Station metro station on the Namma Metro's Purple Line, which opened on 30 April 2016. Later that year, the Bangalore Metro Rail Corporation Limited (BMRCL) constructed a foot-over-bridge from the metro station until the boundary of the railway station. The railway station is also served by Kempegowda Bus Station. Otherthan that auto and taxi stand are provided.
Platforms 1 to 7 connect to the Chennai and Salem railway lines. On platforms 8 to 10, service trains arrive via Yeshwantpur from Hubballi-Dharwad. Platforms 1 to 4 terminate at Bangalore. On platforms 5 to 10, service trains depart towards Mysuru. There are railway lines between Platforms 4 and 5 that are used as the railway yard. There are 5 railway lines passing from Bangalore City railway station - to Hyderabad via Guntakal, Chennai via Krishnarajapuram, Salem via Hosur, Mysuru, Hubballi-Dharwad via Tumkur, Birur.

36
FACILITIES PROVIDED
On Platform 9-10, 5-6, 2-3 and 4; Seating, Display, stalls, Pay and use toilets, Audio and video PA system, fuel filling points, Train water lines, Coach positioning boards, drinking water facility, Lift to subway are provided.
On Platform 5-6; Porter’s room and Police station are provided.
On Platform 7-8; Another entrance is provided and has same facilities as above. It also has 2,4 wheler parking, ATM, booking counters, Waiting area, AC waiting and janahar.
On Platform1; Booking counters, Waiting area, Enquiry counters, Current platform ticket counter, Goods loading and unloading, Pay and use toilets, Switch room, Inspector office, Chief ticket inspector office, Deputy station manager office and Emergency care are provided along with same facilities as in other platforms.

37
Fig. 4.2.1 Hierarchy of the station
Waiting halls are around 12 x 18m with a capacity of accommodating 130 members. AC waiting hall is around 8 x 15m. There are separate rooms for differently challenged and senior citizens with barrier free provisions whose dimensions are 8 x 6m. Retiring rooms and dormitories are provided in first and second floors.


38
Fig. 4.2.3. Spacial distribution of the station
Fig. 4.2.2. Hierarchy of the station
5. SITE STUDY

5.1. INTRODUCTION
Location: Serilingampally, Hyderabad, Telangana
Station code: LPI
Platforms in use: 6
Division: Secunderabad
Zone: South Central Railway zone
Lingampally railway station is one of the major station that has high footfall. Proposals are being made to improve the infrastructure of the station due to its increasing demand.
Some of the major reasons behind the proposal was development of IT corridor around this station, MMTS and metro phase II development, Increasing pressure on the existing core
39
Fig. 5.1.1. Base map of the site
stations: Secunderabad, Nampally and Kachiguda, high density of the core and hardship faced by people to access core stations.
CURRENT SCENARIO
Station earns around 6 lakhs and is found to be increasing which implies increasing footfall since past three years and expected to be doubled in upcoming years. Current footfall is almost equal to few core stations. Around 200 staff is working in this station.
5.2. CLIMATE STUDY

40
Fig. 5.1.2. Comparision of daily footfall of the current station with the major station in Hyderabad


41
Fig. 5.2.1. Windrose illustration for lingampally area
Fig. 5.2.2. Climate graph of lingampally area
TEMPERATURE Maximum temperature is 40 degC during april and minimum is 15 degC during december in this locality. Average temperature is 25.3 degC.
PRECIPITATION Highest precipitation is 170mm during july-august. Rainfalls happen from June to October months.
WIND From west flows most of the wind.

5.3. AIR QUALITY
Air quality at this locality is found to be bad due to traffic mainly in the mornings as shown. Hence it would be better to design station with more trees and plants to improve air quality.
5.4. GEOGRAPHY
The city’s soil type is mainly red sandy with areas of black cotton soil. Hyderabad is seismically least exposed to earthquakes.
42
Fig. 5.3. Air quality index of Lingam pally
The contour level falls gradually from west to east creating almost a trough near the Musi River which runs through the city. This natural feature has facilitated water supply by gravity. Elevation within the city varies between 672 m in Banjara Hills and 456 m in Old City.

5.5. DEMOGRAPHICS
As of 2011 India census, Serilingampally had a population of 153,364 composed of 32,642 households. This population contains 79,225 males and 74,139 females. As of 2001 census, Serilingampally has an average literacy rate of 42%, lower than the national average of 59.5%: male literacy is 42%, and female literacy is 41%. In Serilingampally, 11% of the population is under 6 years of age.
5.6. POLITICS
MLA of Serilingampally constituency is Arekapudi Gandhi elected in 2018 General Elections.
5.7. HISTORICAL SIGNIFICANCE
Unlike the other parts of Hyderabad city, this part is unique and does not share any cultural characteristics of other parts of the city. In fact, this is an artificial extension of the main Hyderabad city.However, it is this characteristic of Cyberabad that made it ideal for establishing the IT hub of Andhra Pradesh here. And today it plays a crucial part in the IT operations of the entire nation.
43
Fig. 5.4. Contour map of Hyderabad
The only place that shares history with the main Hyderabad city is the Durgam Cheruvu, which used to serve as local drinking and irrigation water source for the town of Golconda, during the Qutubshahis.
Until the mid nineties, this place was just covered with rocks, forests and with small villages like Madhapur, Kondapur, etc. The people of Hyderabad city didn’t had any reason to develop or at least use this place. And then the IT boom in India made Andhra Pradesh government to find a place well suitable for establishing a series of constructions, dedicated to the corporates. This led to the planning of Hi-tech city. Cyber Towers was the first of the buildings of Hi-tech city, inaugurated in 1998. Followed by other buildings later like Cyber Gateway, Cyber Pearl and several other IT parks, today Hi-tech city has offices of almost all major international IT companies.
44
6. SITE CONNECTIVITY
6.1. STATIC FEATURES
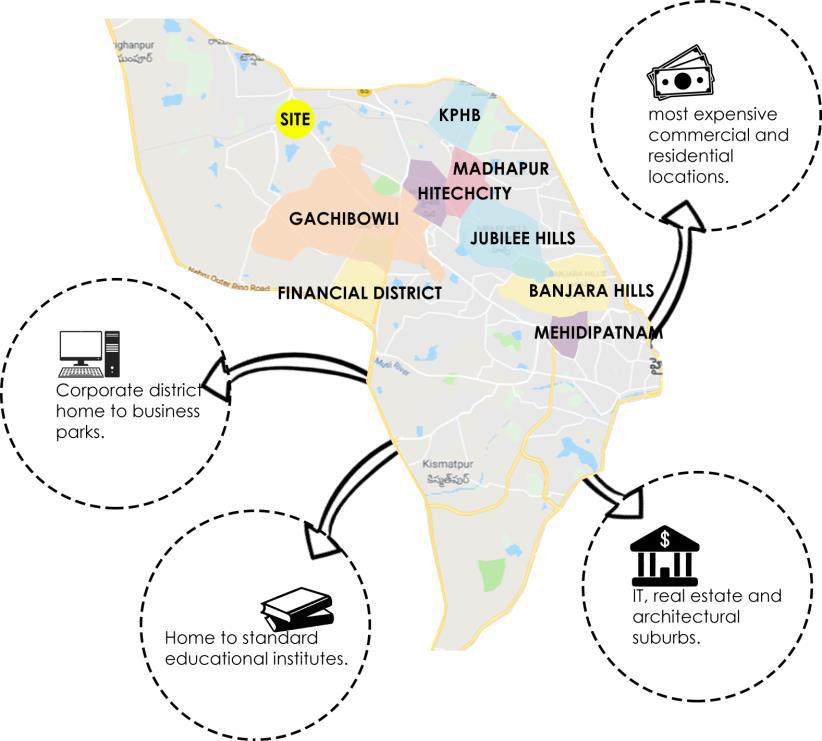
In Site analysis; here site connectivity is analized in three levels: City, Sector and Site level.


City level map gives an idea of where the site is located and the direction in which the city is being developed. Importance of the station can be understood with this level analysis.
Sector level map shows important areas around site that is affecting the user flow. Sector level analysis helps us understand the hierarchy of users of the railway station and hence helps us analyse elements in design.
Site level map shows the landuse of the area surrounding the site. Site level analysis helps us understand the site and its surroundings, roads, various flows and important nodes.
45
Fig. 6.1. Static features of the site.
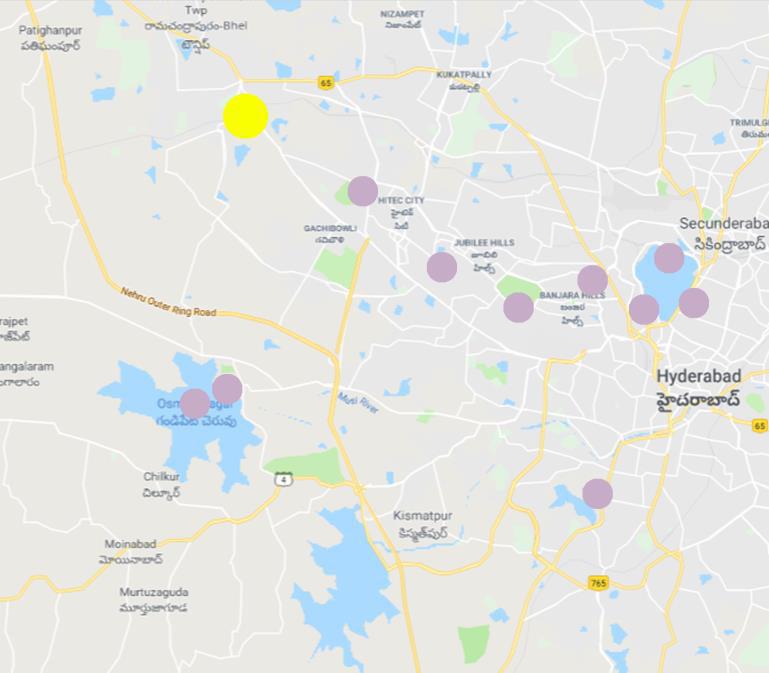
6.1.1. SECTORAL DISTRIBUTION
RELIGIOUS
Some of the famous religious areas like temples, churches and mosques belong to this sector of Hyderabad. Few of the spots are better accessible from nearest stations. Hence; People mostly come to this station from other regions to visit these places.

1. St. Thomas marthoma church 1.4km
2. Shri jagannath temple 13.8km
3. Chilkur balaji temple 14km
4. Dharmapuri temple 2.5km
5. Mallikarjuna temple 13km
6. Balkampet temple 14.5km
7. Calvary temple 6km
8. Holy trinity 10.1km
9. Begumpet mosque 15.6km
NATURE
This sector has few nature spots although visiting them is easier if arrived at the near stations. If visited; users are likely to be tourists.
1.Osman sagar lake 19km
2. Lotus pond 15.6km
3. Gandipet lake 10.5km
4. Botanical gardens 10.7km
5. Indira park 15.8km
6. KBR park 12.2km
7. Manjeera reservoir and dam 1.3km
8. Jalagam vengalrao park 19.5km
9. Durgam cheruvu 9.8km
PUBLIC
Some main tourist attractions of Hyderabad belong to this sector. Many other places like shopping complexes, water parks, convention centres, recreational areas are located making this
46
Fig. 6.1.1. Pilgrim sites near site.
Fig. 6.1.2. Nature tourist spots near site.
station important to access these. It is very likely to access spots in hitech-city, gachibowli, jubilee hills and banjara hills from this area. Then again; its likely that regional users do that.
1. Shilparamam 7.4km
2. Golconda fort 12.8km
3. Hitex 4.6km
4. Forum mall 7.7km
5. Inorbit mall 9.2km
6. Qutub shahi tombs 13.8km
7. GVK one 15.6km
9. Ocean park 10.6km
10. SLN terminus 5.9km
11. IKEA 6km
12. Manjeera mall 10.5km
13. Next galleria 15km
14. Skyzone 10.1km
15. Taramati 17km
OFFICE
Cyberabad plays most crucial part in IT sector operations in the nation. This station being closest makes it equally important. Also; many laboratories and factories are located being city outskirts. Users who access these areas are working class people. People living outside the city can also approach easily through lingampalli station and localites can use MMTS services.


1. BHEL 5.7km
2. Indian oil coorperation ltd. 2.4km
3. HMWSS 2.8km
4. Infosis 7.2km
5. Tata consultancies 11km
6. Cap gemini 9km
7. Mindspace raheja IT park 11km
8. IBM 10.3km
9. Reddy labs 8.9km
47
Fig. 6.1.3. Public and commerc ial areas near site.
Fig. 6.1.4. Offices near site.
EDUCATIONAL
Because of high percentage of working class people in Hyderabad resulting in number of families around; Numerous educational institutions are developed in this sector. Students tend to use this station because of its better access to these institutions.
1. Maulana azad 0.8km
2. ESCI 9.1km
3. HCU 3.5km
4. IIIT 6.1km
5. Ellenki 14.9km
6. St. Xaviers 7.8km
7. Br. Ambedkar 15.8km
8. MNR 13.1km
9. VNR 16.4km
10. BVRIT 13.1km
11. JNTU 13.5km
12. ISB 7.1km
13. G. Narayanamma 12km
6.1.2. RADIAL DISTRIBUTION
This donut represents percentages of each mentioned space in regular distances till 20km. Each concentric donut equals to 5km travel distance from the site.
Religious places are located almost in equal numbers each 10km.

Natural areas are most concentrated between 10 to 20km from the site.
Public hangout spots, offices and educational institutions sumup most of the area till 20km. Hence; users are most likely working class, students and tourists.
And both local/MMTS and regional trains are of equal importance.

48
Fig. 6.1.5. Educatio nal institutes near site.
Fig. 6.1.2.1. Radial distribution of religious, natural, public, educational and office spaces.
6.2. DYNAMIC FEATURES
6.2.1. TRAINS MOVEMENT
Trains from Lingampalli station reach the stations on blue and green line of the network shown. MMTS phase II development extends the line to tellapur and patancheruvu. Around 89 trains pass through Lingampalli railway station of which 5 trains originate and terminate at this station. People from outskirts find it hard to reach the core of Hyderabad and board the train; hence proposals are going on to make more trains stop at this station.

HOURLY ANALYSIS OF TRAIN FREQUENCY
This graph represents trains frequency -both regional and local on hourly basis which helps us understand the user types and accordingly preferences to be considered in the design. With time on x-axis and frequency on y-axis; blue line represents regional trains and red line represents local trains.
DAILY ANALYSIS OF TRAIN FREQUENCY

49
Fig. 6.2.1. Connectivity of the current station with other stations
Fig. 6.2.2. Hourly analysis of train frequency
This graph shows the daily analysis of trains frequency in a week. X-axis shows all the days in a week and Y-axis shows number of trains going through the station. Blue line represents regional trains. Daily around 53 local trains pass through this station.

As daily frequency of trains in a week is almost constant as shown; we can consider that regional trains that are passing through station are same all the days in a week.
Considering that comes the hourly analysis of train frequency graph as shown. This illustration shows both regional and local trains have equal importance although just a platform is generally provided for local trains.
Hence for a better circulation; we have to seperate local and regional passengers which would reduce confusion and avoids unnecessary passenger flow in the design.
6.2.2. PASSENGER FLOW
The above diagrams represents the daily and hourly footfall pattern in the existing station in a week. During weekdays; footfall is found to be more in the mornings and evenings which imply usage of station by working class people and students of the locality. During weekends; footfall is found to be more in the evenings. And similarity of footfall during weekdays and weekends shows that more people using regional trains as well. Peak count of people accessing this station is 2000 and is expected to be doubled in upcoming years.

50
Fig. 6.2.3. Daily analysis of train frequency
Fig. 6.2.4. Passenger flow w.r.t. time in a day
6.2.3. BUS AND AUTO ROUTES

Most of the users are found to be using share-auto rickshaws hence its better that design has auto-stands to avoid clogging traffic on roads. Bus-stops are adjacent to the station; so there is no need to provide one in the design. Users are found to be mostly students, tourists and working class and design should include spaces accordingly. Like providing cyber cafes, take away food counters etc.

51
Fig. 6.2.5. Bus and auto routes from the site
7. EXISTING SITE CONDITIONS
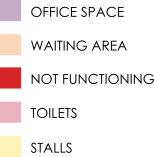
OFFICE SPACE
Station has signalling and telecommunication office, Ticketing offices, Station master and deputy station master office and RPF office on platform-1. Track maintaneance yard has a storage room and SSE office.
ENTRANCE AND PARKING
There are two entrances to the site from platforms 1 and 6. Parking areas are semi shaded.

500 2-wheelers and 30 car parking spaces are provided on platform 6 including rentals. 15 car and 400 bike parkings are given on platform 1.
Drop-off/Pickup on platform 1.
WAITING HALLS
General, AC and Ladies waiting halls are provide that accomodates 48,33 and 21
TICKETING
They have 3 TVMs,1 COVTM and 9 ticket counters
52
Fig. 7.1. Existing site map
7.1. ACQUIRED LANDS AND DEMOLISHED BUILDINGS
Buildings that are being demolished are nearly 30 years old and plots acquired are barren lands under government.

7.2. SWOT ANALYSIS STRENGTHS
Site is well connencted to the important parts of the city like IT corridor, financial district, institutional and other office areas.
Open barren lands around the site leading to more scope for development.
WEAKNESSES
Waiting area provided for ladies and AC waiting halls are not functioning due to security issues. Also people randomly enter the station due to improper surveillance at few entrances.
No proper amenities are provided.Improper placement of foot over bridge and absence of elevators etc makes it hard for people to cross the platforms.
No proper provision to stay for passengers, locopilots and staff.
Station’s main access road is too small and crowded. Also it is not easily recognisable. Office spaces and other platforms are not properly connected.
Overlapped station building and staff quarters circulation.
No designated auto stand leading to crowded entrance.
Improperly shaded platforms. Length of the platforms are less than 650m.
Seating is not sufficient and not properly shaded.
Insufficient parking during peak hours. No taxi-stand.
53
Fig. 7.2. Images of the acquired lands and demolished buildings.
Design is not barrier free.
OPPURTUNITIES
More scope for development due to city direction of development, IT corridor, congestion at main stations and its connectivity.
THREATS
Waste water management.
Non-ticket holders entering the station.
Improper usage of spaces.
54
8. ZONING AND ANALYSIS


8.1. GRID ANALYSIS ACCESSIBILITY AND TRANSIT POINTS
Accessibility depends on transit points and road adjoining it. Huda colony road and Lingampally road are the main roads connecting the site on which exists bus stops and auto stands maing it more accessible.
SUN-SHADE AND SURROUNDING BUILDINGS
Sun and shade is dependent on factors like vegetation and surrounding buildings. As said above; there is no much vegetation in the site. Hence surrounding buildings play the major role. All the surrounding buildings are low rise and a mix of residential and small retail shops, food stalls. NW of the site; buildings are less densely packed and below the site; buildings are more densely packed.
VEGETATION AND MOST FOUND SPECIES
Vegetation is not much found in this site. Few trees here and there; and are of low foliage. Most commonly found species are bouganvillae and teak.
55
Fig. 8.1.1. Accessibility grid wise zoning.
Fig. 8.1.2. Sun-shade grid wise zoning.
NOISE LEVELS AND TRAFFIC INTENSITY
Like in another railway station; station and surroundings are exposed to high noise levels due to trains movement, vehicular traffic and user traffic. Noise levels in and around stations on an average is found to be 63 decibels. Highest is found to be 75


RECOGNISED ZONES
1. A bit far from bus-stop but very much accessible from the main road. Adjacent to it are previously built staff quarters; hence is suitable to place staff quarters

56
Fig. 8.1.3. Vegetation grid wise zoning.
Fig. 8.1.4. Noise levels grid wise zoning.
Fig. 8.1.5. Main grid with recognized zones.
2. Closer to bus-stop and previous entry was from this zone. Its better to give site entance/exit from this zone and station building. Local trains come onto PF6 hence preference is to design Local train building in this zone.

3. This zone is not usable for because of track clearance
4. Can access this zone using secondary road. Currently it is used for trackmaintaenance works.
5. Suitable to place station building to maintain continuity. Suitable to place regional trains building due to its connectivity. As it is shady here and preference is to place regional building; it is better to give stay.
6. Closer to bus-stop hence better zone to give entrance/exit to the site. Can be used for landscaping and make it more visible and grand.
8.2. SITE ZONING
57
Fig. 8.2.1. Ground floor- Horizontal zoning.
Local station and Regional station equally need offices; let it be for security or co-ordination. Also offices are better placed in a place.

Parking for regional station is better to be in closer proximity because people mostly come with huge luggage.
Giving entrance to regional station from first floor solves offices and parking issues. Also gives equal importance to all the platforms.
Providing commercial space along helps in the growth of retail.
Restricting entrances tightens the security.

58
Fig. 8.2.2. First floor- Horizontal zoning
Fig. 8.2.3. Second floor- Horizontal zoning
Stay being seperated from all this is peaceful to be in.
This kind of zoning is also very flexible and avoids unnecessary flows.
8.3. SITE MATH
Total site area = 1,77,750 sq.m/ 44 acres
Area covering platforms and tracks = 65,840 sq.m
Available area = Total area – area covering tracks and platforms = 1,11,910 sq.m
Open space requirement = 5% of available area = 5,595.5 sq.m

Buildable area = 1,06,314.5 sq.m
Minimum setbacks = 3m in the front and 6m on other sides
59
Fig. 8.3. Usable and not usable parts of the site.
8.4. AREA STATEMENT AND COMPARITIVE ANALYSIS

60
Fig. 8.4. Comparitive analysis between live case studies and existing station and derived area statement